Abstract
Carbon dioxide (CO2) and other greenhouse gases (GHGs) are the primary causes behind the current rise in global temperatures and climate change. CO2, which is present in the atmosphere in significant quantities, is contributing more to the warming effect than other gases that are present at smaller levels. The transportation sector is contributing significantly to the total global CO2 emissions (21.7%), with road transport accounting for 74%. Switching from gasoline-powered vehicles to electric vehicles (EVs) is the most practical way to decarbonize land transportation. We have gathered information on EVs from the USA, China, India, and a few EU members for the current review. The collected data regarding government policies, subsidies, and other rules and laws, the present status of EV technology and performance, market scenarios and future projections of EVs, EV regulations in the regions with the highest penetration rates, consumer perspectives and barriers, and the decarbonization of land transportation were analyzed. The adoption of electric vehicles has advanced significantly in some parts of the world, primarily as a result of government policies that include subsidies, other regulations, and laws that globally lower the cost of acquisition and ownership for owners of electric vehicles (EVs) relative to those of internal combustion engines (ICEs). Favorable government policies have been associated with the success of EV adoption in Norway, China, the United States of America (USA), the European Union (EU), and India. With more advantages than any other country, China is currently the world’s largest EV market. In addition, it has the highest number of EVs in use and the highest manufacturing capacity. Norway leads the world in the percentage of newly registered EVs at over 90%. China is competing with the USA for leadership in manufacturing and technology, especially in the areas of artificial intelligence (AI) and batteries. Favorable perceptions of consumers regarding EVs are vital in increasing the EV adoption rate. In order to achieve the goal of decarbonizing road transportation, we proposed that a number of factors—including government energy policies and regulatory standard development, necessary infrastructure investments and developments, AI incorporation in EVs, innovation in EV and battery technologies, and consumer perspectives in particular—play a crucial role.
1. Introduction
The International Energy Agency report stated that global energy-related carbon dioxide (CO2) emissions reached a new record high of 37.4 billion tonnes (Gt) in 2023 [1]. Figure 1 shows the global energy-related CO2 emissions from various sectors in 2022, and over 21.7% of global CO2 emissions are coming from the transport sector [2]. Transportation sector emissions increased by 254 metric tons in 2022, compared to 7.73 Gt in 2021. According to the European Environment Agency, decarbonization of the transportation and mobility sector (automotive, waterborne, and rail transportation) is a top priority as it contributes 25% of total greenhouse gas (GHG) emissions [3,4]. Of these emissions, the heavy-duty truck sector emits 20%, despite representing merely 2% of the total vehicle fleet in the EU. In Indonesia, the transport sector contributed 28% of energy-related GHG emissions in 2018, mostly from road transport [5]. Consequently, electric vehicles (EVs) are a vital solution to decarbonizing road transport [6]. Promoting the transition from traditional fuel vehicles to EVs may significantly reduce greenhouse gas emissions and dependence on oil and deliver a sustainable transport system [7]. EVs tend to have a lower carbon footprint than ICE cars over their lifetimes [8]. Higher EV penetration reduces GHG emissions, while those from fuel production are more sensitive to energy-sector decarbonization and could reach nearly “net zero” by 2040 [9].
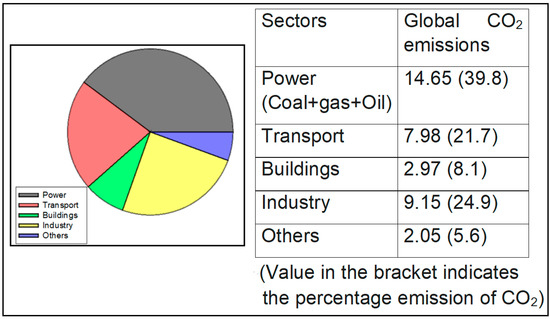
Figure 1.
Global energy-related CO2 emissions in 2022 in Gt. Total CO2 emission over 36.8 Gt.
Several countries around the globe have formulated policies and offered various incentives to attract customers. This review article discusses the policies of some countries, such as the USA, China, India, and EU countries, to enhance the adoption of EVs. Case studies of the current status and future projections of EVs in Norway and India, price wars of EVs, the used EV market, charging infrastructure, issues with electric cars, and barriers to EV adoption are also described. With the current scenario, EVs are unlikely to become the universal mainstream mode of transport for individuals in the near future. General customer concerns such as convenient charging facilities in the countryside, charging time, range of batteries, cost competitiveness of EVs with mainstream vehicles, long-term incentives and policies, and service stations need to be addressed urgently. However, EVs have a high potential for adoption as rapid public transportation options and taxis in urban areas, and they are likely to become the main mode of transport in the coming days. The transition to a cleaner transportation system is crucial for decarbonizing the transportation sector.
2. Decarbonizing Road Transportation
Roughly 99% of the GHG released from the vehicle’s exhaust are carbon dioxide emissions. Burning one gallon of gasoline in a conventional car can produce 8887 g of CO2, while one gallon of diesel produces roughly 10,180 g of CO2. An average passenger car produces 4.6 metric tons of CO2 annually. This figure may change, depending on a vehicle’s fuel type, fuel efficiency, and annual mileage. According to a KPMG (UK) analysis, the transportation sector is the largest emitter in the US and the UK, contributing roughly 25% and 30% of the carbon emissions from transportation worldwide, respectively [10]. Nearly a quarter of the global transportation-related emissions originate from China. In India, 90% of CO2 emissions from transportation come from the road sector. The World Economic Forum estimates that heavy-duty trucks are responsible for 25% of global road emissions, despite making up only 1% of all fleet vehicles [11]. Therefore, setting a precise goal for road transport decarbonization is very imperative. Transitioning to lower-carbon fuels, increasing fuel efficiency, and enhancing system-wide efficiency, including through the deployment of autonomous vehicles and vehicle sharing, are important decarbonization pathways for the transportation sector [12].
Although the development of alternative fuels and the electrification of transportation modes are crucial for the transition, they will not be enough to achieve net zero due to other factors like the energy system and the carbon emissions associated with the production of the infrastructure and vehicles needed to support them. The climate crisis issues and the goal of net-zero GHG emissions economy-wide could be best addressed by eliminating nearly all GHG emissions from the transportation sector by 2050 and implementing an all-inclusive strategy to achieve a future mobility system. Such a mobility system is presumed to be clean, safe, secure, accessible, affordable, and equitable, and it provides sustainable transportation options for people and goods. These days, EVs are viewed as a key player in the fight against global warming.
Since transportation is the largest source of GHG emissions in the United States, any plan to achieve a net-zero GHG economy must reduce transportation GHG emissions to near zero. To achieve the transportation sector emissions targets (19 GtCO2 = 28% of the projected period 2015–2050 light-duty vehicle fleet emissions), EVs must account for 90% (more than 350 million EVs) of new car sales by 2050, or driving must be reduced significantly [13]. As a result, an increasing number of EVs are on the road, with several stakeholders and manufacturing industries investing in technology developments. Moreover, government institutions are promoting EVs as practical climate solutions and encouraging automakers to increase the manufacturing of EVs.
The Canadian government foresees that on-road vehicles are the key to achieving net-zero emissions by 2050. In this context, the government proposed its future action to decarbonize on-road transportation under the Canadian Net Zero Emissions Accountability Act [14]. Under the action plan, the Government of Canada is proposing to make significant investments in purchase incentives and charging stations. These investments will be coupled with a light-duty zero-emission vehicle sales regulation, which sets the goal of achieving 100% new light-duty zero-emission vehicle sales by 2035, as displayed in Figure 2. The government has set mandatory interim targets of at least 20% of all new light-duty vehicle sales by 2026 and at least 60% by 2030. Further, the Government of Canada aims to reach 35% of total new medium- and heavy-duty zero-emission vehicle sales by 2030 and the goal of 100% of new medium- and heavy-duty zero-emission vehicle sales by 2040 (see Figure 2).
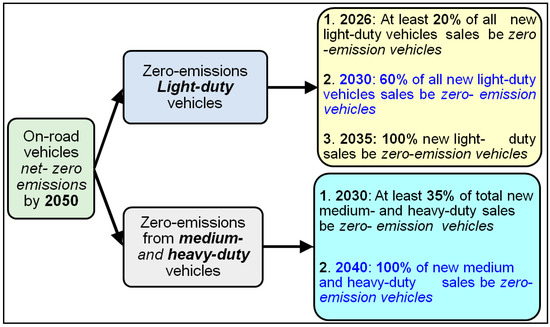
Figure 2.
Net-zero emissions action plan from on-road vehicles of the Government of Canada by 2050.
The transition to a cleaner transportation system also represents a significant economic opportunity for the country. With its critical minerals, skilled workforce, advanced manufacturing, and low-emitting electricity grid, the Government of Canada is taking steps to cultivate a business environment where Canada is a destination of choice for investments in zero-emission vehicle manufacturing and battery value chains. This includes significant investments through the government’s Strategic Innovation Fund and reducing taxes for businesses that manufacture zero-emission technologies.
Several G20 countries set GHG emission reduction objectives for the transport sector. A policy report by Agora Verkehrswende GIZ (2023) was prepared for consideration during the G20 meeting in India [15]. They believe that the G20 nations ought to and can lead the way in transitioning the transportation sector to being carbon neutral. The majority of the emissions from transportation worldwide are caused by these nations. China intends all of its fleet of public transportation to be electric by 2035. In 2022, Quanying Lu et al. in China proposed a low-carbon transition planning model for road transportation to explore the routes toward carbon neutrality by 2060 [16]. The Chinese transportation sector may reach a peak of 1330.98 million tons of carbon emissions around 2030. Consequently, employing a clean power supply is the key to lowering carbon emissions from automotive vehicles. Most notably, they observed that the inertia regarding fuel-powered vehicles in the transportation system made it difficult to attain net zero emissions in the road transportation sector by 2060.
India has targeted a 30% share in passenger light-duty vehicle (LDV) sales as electric vehicles by 2030. Recently, a white paper examining India’s road transportation industry was published by the International Council on Clean Transportation (ICCT), a Washington-based organization [17]. In an Aggressive Policy scenario, recommended by them, India can reduce CO2 emissions by 45–50% cumulative between 2021 and 2050, as compared to Business-As-Usual (BAU). Australia hopes to cut its carbon emissions by 50% from the passenger road transport sector by 2030 relative to 2000 levels [15,18]. Japan plans to increase diesel fuel efficiency by roughly 13.4% for trucks and other heavy vehicles and by around 14.3% for buses by 2025 relative to 2015 fuel efficiency standards [19,20]. South Korea aims to raise gasoline fuel efficiency for passenger vehicles to 35 km/liter by 2035 and to 7.5 km/liter for heavy-duty vehicles by 2040 [15].
In order to decarbonize UK roads, KPMG proposed three key approaches, such as (i) assisting infrastructure authorities, (ii) financing, and (iii) operators in creating transport decarbonization strategies [10]. Moreover, the UK Government has released its Transport Decarbonisation Plan and announced a ban on the sale of new petrol and diesel passenger vehicles from 2030 [21]. Under the plan, all new cars and vans must be fully zero-emission at the tailpipe from 2035. The plan calls for all new cars and vans to have completely zero emissions at the exhaust by 2035. All non-zero emission heavy goods motor vehicles (HGVs) would be phased out of production by 2040, and lighter HGVs would start to be sold in 2035. For the Spanish passenger transport system, David Álvarez-Antelo et al. have recently suggested a model based on behavioral and technological changes that explores the idea of switching to battery-electric power trains for automobiles, buses, and motorbikes [22]. They demonstrated how, by 2035, passenger transportation will emit 60 Mt of CO2 annually as opposed to 66 Mt in 2022. Since fossil fuels are Ecuador’s primary source of pollution, Atiaja et al. proposed a model focusing on developing a dynamic simulation of energy scenarios for the transportation sector of Ecuador for the year 2035 with the aim of shifting to sustainable mobility [23]. This study demonstrates a large reduction in greenhouse gas emissions. According to the estimate, by 2035, total CO2 emissions could be reduced from 50,161,432 kilobarrels of oil equivalent (kBOE) to 20,589,720 kBOE if more people drive electric vehicles.
It is important to note that the decarbonizing transportation system will not come without challenges. However, with coordinated and bold actions across the federal government and with partners, these challenges could be overcome. One should continue to increase ambition, setting bold targets for improving our transportation systems and transitioning to zero-emission vehicles and fuels on a timeline consistent with achieving economy-wide 2030 and 2050 emissions reduction goals. The blueprint is an exciting first step toward realizing the vision of an improved and sustainable transportation future.
In summary, the decarbonization of the transportation sector is projected to reduce GHG emissions significantly. Reducing the cost and making heavy-duty electric trucking sustainable will help reduce the carbon footprint in the transportation sector. In this regard, EVs are often marketed as the future of transportation, offering reduced emissions and a cleaner environment.
Electric Vehicles (EVs) Effect on Decarbonization
The different types of EVs available on the market are illustrated in Figure 3. Recently, Kim et al. showed that the effectiveness of battery electric vehicle (BEV) transition strategies, such as diesel vehicle phase-outs, subsidies, and a sales ban on internal combustion engine vehicles (ICEV), helps in reducing CO2 emissions and enhancing gross domestic product in Korea [24]. They argued that the existing transportation policy mix falls short of achieving carbon neutrality in the transportation sector, which requires additional measures like EV subsidies, a vehicle-kilometers-traveled tax, and a prohibition on ICEV sales.
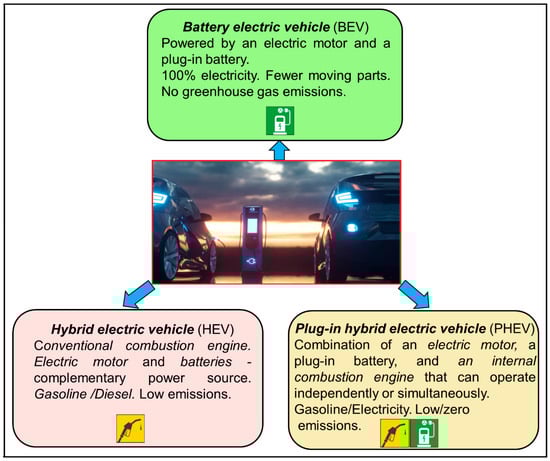
Figure 3.
Different types of electric vehicles available in the market.
Alaa Torkey et al., in their recent review investigation, demonstrated that transportation electrification is a promising emerging technology for minimizing the impacts of climate change [25]. China’s transport sector was the third-largest source of greenhouse gas emissions, producing 1.1 billion tons in 2019 alone, with automobiles accounting for about 80% of emissions [26]. Policymakers are encouraging electric vehicle penetration by transforming public transport and subsidizing EV manufacturing. China accounted for nearly 60% of EV sales worldwide in 2022. Recently, the Hong Kong Polytechnic University (PolyU) established the Research Centre to develop a cutting-edge research platform to address the energy and technical difficulties posed by modern electric vehicles [27]. Over the last decade, the global EV sector has expanded substantially. Various monetary and non-monetary subsidy schemes were designed to promote EVs at both the central and local levels, with the goal of evaluating the performance of these programs and their contribution to lowering carbon emissions. Xing et al. highlighted key aspects that could enhance the efficiency of subsidy programs and further propel the development of the EV industry [28].
3. Methodology and Data Collection
The EU member states (Norway in particular), China, and the USA have developed EV-related technology and infrastructure as well as successfully implemented policies for EV adoption. India, an expanding market, has already created policies to encourage the use of electric vehicles. Consequently, we have gathered information from the USA, China, India, and a few EU nations regarding the acceptance and promotion of EVs, which results in the decarbonization of road transportation. The data on government policies, subsidies, and other laws and regulations, the current state of EV technology and performance, market scenarios and future EV projections, EV regulations in the regions with the highest penetration rates, and consumer perspectives and barriers are all examined in Section 4, Section 5, Section 6 and Section 7. In Section 8, the prospects for EV adoption for road decarbonization are examined and evaluated.
4. EV Policies, Regulations, and Incentives
To date, Norway (1990), the US (2008), and China (2014) have the most favorable policy environments for EV adoption [29]. Since 1990, BEVs in Norway have been exempted from registration tax and from value-added tax since 2001. In order to provide a new tax credit for new eligible plug-in electric drive motor cars, the US Senate passed the bill H.R. 6049—110th Congress (2007–2008) in 2008 [30]. China issued a series of policies on EVs, presenting a rough roadmap with some energy-science-technology planning between 2004 and 2008 [31]. This policy highlighted the appeal of developing hybrid vehicles (HVs) and studying EV policies. Norway was the first country to enter the EV market in 2009, and it promoted EV vehicles in the public domain from 2009 to 2012. Later, the focus of the demonstration project gradually shifted from the public to the private domain (2013–present) by providing policy incentives to address EVs’ shortcomings (such as price, driving range, and charging time) and enhance their competitiveness [32].
The European Automobile Manufacturers’ Association (ACEA) predicts that the adoption of battery electric vehicles will exceed 70% in EU + EFTA + UK member countries, 44.8% in the United States, and 58.5% in China by 2030 [33]. According to Reuters, global EV sales jumped 69% in January 2024 as compared to January 2023 but were down 26% from December 2023 [34]. Subsidy cuts or tighter rules in Germany and France and seasonally weaker sales in China are influencing global EV sales, as per market research firm Rho Motion (London) [35]. Sales of fully electric cars, or battery EVs, and plug-in hybrids hit 1.1 million in January 2024, up from 660,000 in January 2023, despite the end of 11 years of subsidies in China.
The EV policies, laws, and incentives for battery EVs in the USA, China, India, and the EU are dealt with in the following sub-sections. These deliberations are essential to raising the adoption rate.
4.1. EU Member Countries Scenario
In 2019, the European Parliament proposed EU-level measures for the adoption of electric mobility that encourage the use of renewable electricity and smart charging, help develop and standardize charging infrastructure, and support research on batteries [36]. Furthermore, local, regional, and national-level incentives, such as lower taxes or free public parking for electric vehicles, have been proposed to promote electric mobility. In 2020, Sandra Wappelhorst et al. analyzed the market trends and key national and local electric vehicle promotion policies across Europe, concluding that the EU encourages EV deployment [37]. Further, they showed that the important policies of union member countries (incentives, charging infrastructure, availability of electric vehicle models, etc.) are critical to overcoming key barriers to electric vehicle affordability, convenience, and awareness.
Separately, EU member states offer some form of incentive to stimulate the market uptake of EVs, but the tax benefits and purchase incentives vary greatly across the European Union countries [38]. Out of 27 EU member states, twenty-one offer incentives for the purchase of EVs, whereas six countries do not provide any purchase incentives but grant tax reductions or exemptions for electric vehicles. Figure 4 displays the EV purchase incentives in some EU countries. Earlier, the EU Parliament and the Washington Post reported that the European Union countries agreed to ban new non-electric cars from 2035 onwards and to achieve a 100% carbon reduction target for new cars and vans by 2035 [39,40]. This agreement paved the way for a modern and competitive automotive industry in the EU states. The zero-emission target will help slow down climate change, which can cause severe disruptions in many sectors of our society, including the environment, migration, food security, and the economy. To significantly reduce passenger car and truck CO2 emissions, it was proposed to target the need for a significant share of new passenger car (PC) and commercial vehicle (CV) sales to be EVs by 2030. The EU member countries require the buildup of an EV-charging infrastructure throughout Europe. According to a 2020 McKinsey EV Consumer survey, charging infrastructure remains a crucial bottleneck for consumer adoption; faster and earlier uptake of public charging infrastructure is fundamental [41]. As a consequence, the European Automobile Manufacturers’ Association developed the EV Charging Masterplan in 2022 [42].
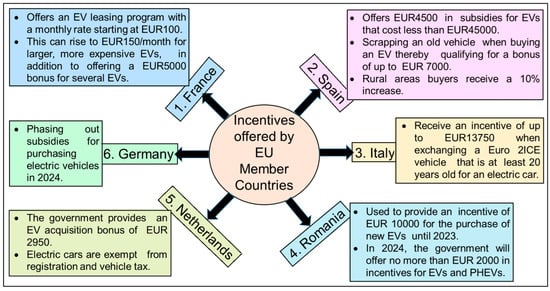
Figure 4.
EV purchasing incentives in some European Union countries [38].
According to the European Automobile Manufacturers’ Association (ACEA), the new electric car market was about 47.5% (battery-electric car 10.9% + hybrid-electric cars 28.8% + plug-in hybrid electric cars 7.8%) of the total car sales in the EU in January 2024 [43]. The share of gasoline and diesel cars totaled almost 50% in January 2024, marking a decline from 54% a year earlier. The European Union has planned to ban all new sales of ICE vehicles by 2035 [44], whereas the UK is acting even more aggressively, with a 2030 ICE ban [45]. EVs are expected to represent 71% of the European market by 2032, partly due to these actions and interventions by the EU [46].
4.2. USA EV Policies
According to the Inflation Reduction Act of 2022 (Public Law 117–169) amended Qualified Plug-in Electric Drive Motor Vehicle Credit (IRC 30D), now known as the Clean Vehicle Credit, taxpayers in the US who purchase an eligible vehicle may qualify for a tax credit of up to USD 7500 for vehicles purchased from 2023 to 2032 [47]. This EV tax credit is a federal incentive designed to encourage consumers to purchase EVs. As per this law, vehicles that meet the critical mineral requirements are eligible for a USD 3750 tax credit, and vehicles that meet the battery component requirements are eligible for a USD 3750 tax credit. Vehicles that meet the key mineral and battery component standards are eligible for a USD 7500 tax credit. In addition to federal incentives, states also provide incentives in various forms, such as a discount offer on a residential charger, allowing users to use the High Occupancy Vehicle (HOV) lane regardless of occupant number, rebates for zero-emission motorcycle purchases, up to USD 12,000 in rebates for new EV purchases, time-of-use rates for charging between midnight and 6 a.m., a special time-of-use rate for residential consumers, etc. Additionally, buyers could save from USD 800 to USD 1000 annually by charging EVs at home rather than filling up on gasoline [48]. As a result, nearly half of US car buyers intend to purchase an electric vehicle, according to the EY research report 2023 [49]. However, the majority (57%) of US car buyers cite the dangers of home charging and safety as key deterrents. According to the La Grada Spanish agency, the EV strategy of the US was flawed from the beginning [50]. It has focused on utilizing EVs as a direct substitute for gasoline cars, which have low fuel efficiency, rather than viewing them as an entity for more sustainable transportation. Consequently, more significant transportation issues and emissions objectives are likely to be missed, while other issues will remain unresolved.
Both dealers and auto buyers agreed that battery range and cost are the most significant barriers to purchasing an EV [51]. Furthermore, installing a charging station at home, especially in rental units, where auto buyers may not stay for a long duration and are unsure whether the rental complex will allow (or can be fitted) for home charging. Recently, Reuters News reported that sales of gas–electric hybrid vehicles surged while sales of electric vehicles decreased in the United States [52]. As a result, automakers and suppliers are gambling on consumer demand for a compromise between all-combustion and all-electric as a durable trend. In summary, only monetary incentives for consumers are insufficient to improve the EV density on the road.
4.3. EV Policies in China
China is the largest EV market in the world and is currently the leader in the EV manufacturing industry. The Chinese market is closer to maturity with the end of government subsidies in 2022 and a trend toward parity between EVs and ICE vehicles. Around 2000, the Chinese auto industry was in disarray and a powerhouse in the production of traditional ICE vehicles, manufacturing only foreign brands. This prompted the Chinese government to abandon traditional internal combustion engine technology in favor of an entirely new territory: battery-powered vehicles. As a consequence, China has aggressively promoted the use of electric vehicles since 2009. In order to accelerate market penetration, the first five pilot cities were chosen in 2010 to offer subsidies for private EVs as well as to establish a charging grid to support fast EV charging. China also implemented several policies and provided incentives such as (i) excluding energy-efficient and alternative energy vehicles from vehicle-license auctions, purchasing vehicles by lottery number, and traffic restrictions; (ii) announcing supporting policies on parking charges, electricity prices, and tolls; (iii) encouraging government, enterprises, institutions, and individuals to purchase energy-efficient and alternative-energy vehicles; (iv) reinforcing infrastructure such as the network of charging stations; and (v) establishing a rapid-charging grid [31,53]. According to the KPMG China Report 2021, China has pledged to become carbon-neutral by 2060, partly via the electrification of transportation [54]. Demand and policy changes prompted auto industry participants to intensify their efforts on electrification.
China has emerged as the leader of the EV industry; credit goes to significant advancements in battery production capabilities, charging infrastructure, and new EV model developments. Its enormous manufacturing capacity allows it to make EVs at a reduced price. At present, China is the world’s largest car market and has become the dominant EV force. According to an International Energy Agency report, more than half of the EVs on roads worldwide were found in China in 2022 [55]. As well, it accounted for 35 percent of global EV exports in 2022. The government has invested billions of dollars to help citizens purchase electric cars. Tax breaks were first introduced in 2014 and renewed multiple times. The country introduced a four-year tax break scheme for EVs and other green cars totaling CNY 520 billion (EUR 68 billion or USD 72.3 billion) in 2023 [56,57]. Furthermore, EVs will not be subject to a purchase tax for 2024 and 2025, up to CNY 30,000 (EUR 3900 or USD 4170) [58]. The exemption will be reduced to half and capped at CNY 15,000 for purchases made in 2026 and 2027, according to a statement from the Ministry of Finance [57].
Indeed, government subsidies have a significant impact on EV adoption in both the public (purchase subsidies and charging station construction had no effect), commercial EVs (a subsidy only plays a critical role in the early period; public charging stations always play a vital role), and private domains [32]. Earlier in 2023, Yiran Liu et al. investigated the impact of several incentives (monetary, privilege, demonstration, and charging incentives) and administrative constraints on electric vehicle adoption and penetration in China [59]. Their results revealed that (i) all policy incentives have a positive long-term relationship with EV sales; (ii) in the short term, the policy combinations of monetary incentives and administrative controls, such as purchase subsidies, purchase tax exemptions, and vehicle purchase restrictions, are more effective; and (iii) in the long term, the policy combinations of privilege incentives, charging incentives, as well as demonstration incentives are more effective in increasing the demand for EVs. However, Yuntong Zhao et al. recently examined the influence of government subsidies on the transition from fuel vehicles to EVs in China from 2010 to 2020 [60]. Results demonstrated that (1) government subsidies have a negative impact on the extent of enterprise transformation towards EVs; (2) this negative effect can be mitigated and even reversed by tightening technical requirements and reducing subsidy intensity.
Moreover, the Chinese government encouraged Chinese EV companies to collaborate with overseas manufacturers on technology development and build supply chains for mutual benefit. Furthermore, to deal with international trade restrictions and create overseas supply chains, China has promised to support its EV manufacturers as part of a significant global expansion drive for the industry, according to a document posted by China’s Commerce Ministry [61].
Recently, Liyin Shen et al. reported technical (driving range, charging time, battery cost, bulk, and weight) and infrastructural (insufficient charging infrastructures, improper distribution of charging stations, and lack of sharing between charging piles) barriers to widespread EV promotion in China [62]. With such intriguing knowledge about the EV sector, the government is now shifting its focus from consumer-based incentives to technology development and innovation-based incentives [63]. It should be mentioned that Chinese automakers realized long before, in 2022, that battery costs would account for 30–40% of the entire manufacturing cost of a complete EV vehicle. Focusing on technology and innovation creates opportunities for newcomers. As a consequence, BYD Auto Company, Shenzhen, China, the world’s largest EV manufacturer, collaborated with Daimler and Toyota to acquire knowledge about EV manufacturing in exchange for sharing its own understanding of battery manufacturing technology. It also collaborates with Foshan Plastics Group on optoelectronics for producing electronic sensors that detect and control lights. Geely Auto, a leading automobile manufacturer based in Hangzhou, China, has established an ecosystem that includes everything from low-orbit satellites to smart hardware for collecting and monitoring data that could potentially improve EV battery performance. Jidu Auto, a joint venture of Geely Auto and Baidu, aims to produce intelligent EVs. Geely Auto also acquired Drivetrain Systems International, an Australian automatic transmission manufacturer.
In summary, autonomous vehicles and new mobility options are now well appreciated by Chinese customers [64]. International expansion is the next step for Chinese EV companies. It is believed that they have all the necessary components, such as strong battery technology, a firm hold over the battery supply chain, and operational advantages, to realize that objective, which may help them to maintain their position as a market leader in EV production. China is keen to exploit the potential of EVs and is aggressively working to address the issue of the limited range of models available. With such a favorable situation, they hope to benefit by showcasing their green credentials to consumers looking for more environmentally friendly cars. Furthermore, they are collaborating with traditional, physical dealerships to create high-performance networks for electric charging.
4.4. EV Policies in India
The Indian government launched a number of regulatory initiatives in an effort to increase the number of EVs and meet India’s goal of net zero emissions by 2070. In order to reduce the usage of gasoline and diesel automobiles, the National Incentive FAME-II (Faster Adoption and Manufacturing of Hybrid and Electric Vehicles) initiative was launched on 1st April 2015. The Department of Heavy Industry introduced PLI SCHEME, the Production-Linked Incentive for Advanced Chemistry Cell Battery Storage, in June 2021 (PLI-ACC Scheme) to encourage investments in the automotive manufacturing value chain and to increase domestic production of advanced automotive technology (AAT) products [65]. The Battery Swapping Policy was introduced by the Finance Minister to provide uniform battery standards for use in EVs throughout India. The import of capital goods and machinery necessary for the production of lithium-ion cells, which are used in the batteries used in electric vehicles, is now exempt from customs duties, according to the Union Budget 2023–2024. The goods and services tax (GST) on EVs has been reduced from 12 to 5%. Similarly, the GST on chargers and charging stations for electric vehicles has been reduced from 18 to 5% [66].
The Ministry of Heavy Industries, Government of India, reported that 1,433,545 electric vehicles (all types) out of a total of 22,717,562 were registered during the year 2023 [67]. The ratio of EVs to total vehicles is just about 0.0631. In addition, the Ministry of Heavy Industries recently unveiled the Electric Mobility Promotion Scheme 2024, which will be operative from 1 April to 31 July 2024, with a total outlay of INR 500 crores, or USD 60.3 million. The scheme provides demand incentives and subsidies to encourage faster adoption of electric two-wheelers (e-2W) and three-wheelers (e-3W) [68]. A significant boost to India’s EV industry is anticipated by some analysts from the recently established e-vehicle policy, which allows companies to set up manufacturing facilities in the country. Also, according to Reuters, the Government of India announced that it would lower import taxes on certain electric vehicles produced by carmakers that commit to investing at least USD 500 million and starting domestic manufacturing within three years [69]. The government offers various types of financial incentives to make electric vehicles more affordable, as illustrated in Figure 5 [70]. Moreover, the state-level EV targets and incentive policies for infrastructure developers and consumers offered by some major state governments in India to boost EV adoption are illustrated in Table 1.
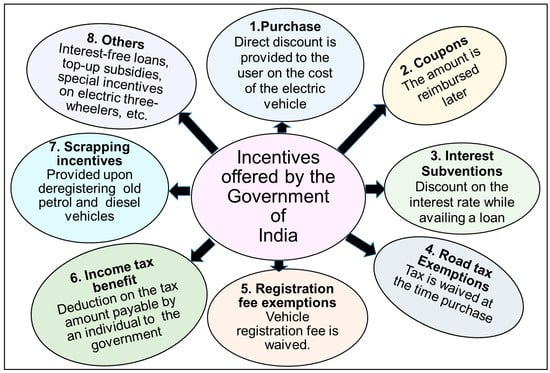
Figure 5.
Different types of monetary incentives offered by the Government of India [70].

Table 1.
(a) State government-level EV targets, and incentive policies in some major states of India [70]. (b) Incentive policies for infrastructure developers in some major states of India [70]. (c) State government-level incentive policies for consumers in some major states of India [70].
In summary, India’s EV policy focuses on infrastructure development and financial incentives for manufacturers and consumers in an effort to accelerate the adoption of EVs and mitigate environmental pollution.
5. Current EV Scenario and Future Projections
The first electric vehicles were developed in the early 19th century, when, in 1832, Scottish inventor Robert Anderson invented the first crude electric carriage [71]. However, it was not until the second half of the 19th century that some of the first practical electric cars were built. In the last 20 years, interest in electric vehicles has again renewed due to environmental concerns, mostly the passage of the 1990 Clean Air Act Amendment and the 1992 Energy Policy Act, USA, plus new transportation emissions regulations by several Western countries [72].
According to the Global EV Outlook Report 2023, a total of 14% of all new cars sold were electric in 2022, up from around 9% in 2021 and less than 5% in 2020 [55]. Electric car markets saw exponential growth as sales exceeded 10 million in 2022. Three markets dominated global sales of EVs. China was the frontrunner once again, accounting for around 60% of global electric car sales. Over 2.3 million EVs were sold in the first quarter of 2023. The share of new cars sold that are electric (fully battery-electric and plug-in hybrids) in Norway in 2022 is 88% and ranks first [8]. The electric car share percentage among the new cars sold in some major economies in 2022 is displayed in Figure 6. A report showed that only 620 EV cars (in the entire African continent) were sold in South Africa in 2022. The worldwide electric car share is increasing gradually.
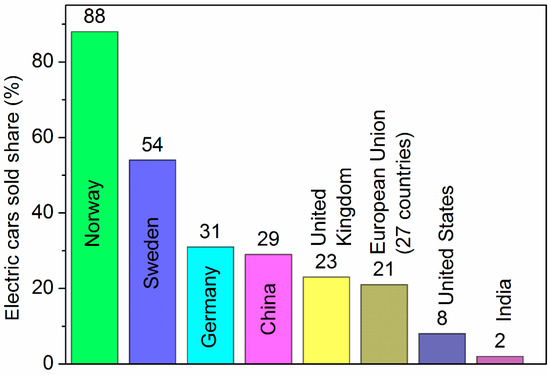
Figure 6.
Electric cars (fully battery-electric and plug-in hybrids) among the new cars sold in some major economies in 2022 (Ref. [8]).
Americans bought more than 250,000 EVs in the first three months of 2023 and are likely to surpass the target of more than a million EVs annually for the first time, as per the Kelly Blue Book report [73]. More than 5% of the new cars sold in 23 countries were electric cars in Q2 of 2023. Researchers at Bloomberg Green say that the 5% mark is a “crucial tipping point”, which may signal the start of mass adoption when technological preferences rapidly flip [74]. A Carscoop report showed that EVs comprised 7.2% of all new cars sold in the U.S. from January to July of 2023 [75]. Urban Science reports that EVs garnered a 7.8% market share across the U.S. in 2023, with some markets, like San Francisco, witnessing explosive growth to 34% [76].
A Statista Inc. Hamburg, Germany, report in 2024 projected that the revenue in the EV market is projected to reach a staggering USD 623.3 billion worldwide, and the unit sales of the EV market are anticipated to reach 17.07 million units by 2028 [77]. Among the global markets for electric vehicles (BEV, HEV, and PHEV), battery-powered EVs have emerged as leaders in guiding the global electric-powered EV market towards a sustainable future. The global electric vehicle market is projected to hit USD 1148.43 billion by 2030, according to the Research and Markets report [78]. According to the Global EV Outlook 2023 report, China is expected to remain the leader in electric two- and three-wheeler sales in both the Stated Policies Scenario (STEPS) and Announced Pledges Scenario (APS), with more than one-third of all two- and three-wheelers being electric [79].
The Markets and Markets report forecasts that the global electric vehicle market size is expected to reach USD 951.9 billion by 2030 at a CAGR of 13.7% during the forecast period 2023–2030 [80]. Allied Market Research estimated that the global electric vehicle market size is projected to reach USD 823.75 billion by 2030, registering a CAGR of 18.2% from 2021 to 2030 [81]. According to Fortune Business Insights, the global electric vehicle market size is projected to grow from USD 500.48 billion in 2023 to USD 1579.10 billion in 2030, exhibiting a CAGR of 17.8% during the forecast period of 2023–2030 [82]. Automotive Dive reported that EV sales continue up the S-curve and will account for from 62% (fast growth scenario) to 86% (Faster growth scenario) of global sales by 2030 [83]. An EV market share in China is expected to be at least 90% by 2030, according to an RMI report [84]. According to Global Industry Reports (US), the global market for EVs will increase at a CAGR of 30.7% between 2022 and 2030, reaching a revised size of 80.7 million units [85]. Moreover, battery EVs are expected to grow at a 34.8% CAGR and reach 74.4 million units by the conclusion of the analysis period, according to Global Industry Reports. Table 2 summarizes the projections of EV sales and revenue by 2030 as estimated by various market research organizations.
Table 2.
Projections of EV sales and revenue by 2030 as forecasted by various market research organizations.
In conclusion, all these market research reports foresee a significant transition in the automobile industry between 2023 and 2030, driven by the increasing adoption of vehicle electrification. The EV market has made remarkable gains. Factors contributing to the growth of the EV sector are said to be an increase in demand for fuel-efficient, high-performance, and low-emission vehicles, stringent government rules and regulations toward vehicle emissions, a reduction in the cost of electric vehicle batteries, sophistication and innovation in the EV industry, and rising fuel costs. The EV market ecosystem is expected to be dominated by some major auto industries such as BYD, Tesla, Volkswagen, SAIC Motors, Stellants (Netherlands), NIO (China), Hyundai, and many others that are developing world-class EV technology.
5.1. EV Evolution in Norway
Norway is a Scandinavian country, with a total land mass of 385,207 square kilometers and a population of 5,550,203 in 2024 (estimated). It has become the world’s electric car capital, with the highest electric vehicle adoption rate in the world. EVs accounted for more than 20% of passenger vehicles in the country and more than 80% of new vehicles sold in 2022 [86]. Further, more than 82% of new car sales in Norway were EVs in 2023, increasing to 90% when plug-in vehicles are included. On the other hand, merely 7.6% of new car sales were reported to be electric in the U.S. in 2022, according to the Kelley Blue Book (information services, e-commerce software, Automotive, Irvine, CA, USA) [87]. Meanwhile, a record number of 24% of total new car sales were reported as EVs in China in 2023.
The Norwegian Public Roads Administration (Opplysningsrådet for veitrafikken, OFV for short) recently reported that 104,590 electric cars and 10,169 plug-in hybrids were newly registered from January to December 2023 [88]. Furthermore, 4717 new electric cars were registered in Norway in January 2024 alone, according to the Norwegian Public Roads Administration.
5.1.1. Incentives and Subsidies
The Norwegian government started promoting the purchase of EVs back in the 1990s, but it was not until Tesla’s Model S (introduced in 2012–2013) and other EV models became available around 2012 that sales truly took off [89]. Øyvind Solberg Thorsen, CEO of the Norwegian Road Federation (OFV), persuaded the Norwegian government to provide subsidies and exclude the electric car from all automotive taxes, including value-added and import taxes. The Think City electric car, produced by Norwegian carmaker Think Global and first put on the road in 2011, was small, reasonably affordable, and had a relatively short range of 160 km and a top speed of around 100 km/h, whereas the Tesla S offered approximately 426 km on a single charge with a top speed of 209 km/h. Monetary and nonmonetary incentives played a crucial role in the popularization and very high adoption rate of EVs in Norway. Table 3 illustrates various types of incentives offered by the government since 1990. Furthermore, Norway intends to electrify its ferries, buses, semi-trucks, and even construction equipment in the future.
Table 3.
Different types of incentives offered by Norwegian Government in the past and present.
The aim of achieving zero carbon emissions from all public transportation by the end of 2024 has been set. It is an electric utopia for the future. In Norway, the charging of EVs may be a third of the price of gasoline with hydropower-generated electricity. In February 2024, almost 100% (more than 98%) of electricity production in Norway came from renewable energy sources (hydropower 87.8%, wind power 10.9%, and thermal power merely 1.3%) [90]. The advantage of hydropower electric charging is that it is inexpensive, renewable, and available. Additionally, the Norwegian government set the goal for 2025 that all new passenger cars should have zero emissions [91]. To realize the stated goal, the government has put in some incentives like a zero-registration tax, free tolls, free parking, a zero value-added tax, access to bus lanes, etc. [92]. This has a huge impact, and 8 out of 10 new cars are zero-emission vehicles. The remaining 20% are plug-in hybrids and some gasoline cars as well. Polluting cars have heavy taxes in Norway, whereas EVs are tax-free. Furthermore, the process of buying EVs is also simplified by reducing the paperwork. As a result, EVs in Norway present the advantage of lower cost of ownership compared to their ICE vehicle counterparts.
5.1.2. Charging Stations Status
The electric car is less expensive to use because the electric bill is lower than the gasoline bill. Charging is subsidized as well. Previously it was heavily subsidized and now some rural areas obtain some additional benefits. Norway has enough EV chargers in the southern part of the country, so it will not be a problem when you visit that region. Whereas, northern Norway has fewer EV chargers; however, they are sufficient, one can charge easily, and the charging anxiety issue does not exist in Norway. The country has both privately owned and publicly owned EV charging stations. The number of electric car charging stations has increased in recent years, reaching just about 23,800 (including 15,400 Level 2 charging stations) for charging around 817,500 electric and plug-in hybrid cars registered as of 2022 in Norway [93]. The number of Tesla Superchargers amounted to 503 that year. There were 5041 publicly accessible rapid chargers (over 50 kW) for light vehicles (passenger cars and vans) in Norway as of the end of September 2022 [94,95]. Data on some charging station service providers in Norway are shown in Table 4.
Table 4.
Charging station service providers in Norway, as well as the number of chargers installed by them.
Three levels of electric car charging stations are available: Level 1, Level 2, and Level 3. Level 1 and Level 2 charging are usually alternating current (AC), commonly known as slow charging. Standard Level 1 and 2 chargers require more time for full charging of EVs, whereas Level 3 charging is classified as a direct current fast charging system. A recent report shows over 24,100 EV operational charging stations in Norway. In 2021, the EV-to-charging-point ratio was 33.6 vehicles per station. Fortum Charge and Drive, a service networking company, provides access to over 40,000 charging points across the Nordics, as well as helping to search for compatibility, obtain real-time pricing, and manage charging history [96]. Mer Norway provides EV charging solutions to housing associations and condominiums, businesses and industries, commercial and heavy transport, and the public sector [97]. As of December 2022, it had installed more than 36,548 chargers in the European Network (UK, Germany, Sweden, Norway, and Austria). Tesla is one of the largest charging companies in Europe. Out of Tesla’s 1724 charging points in Norway, 1642 are now accessible to all vehicles equipped with the CCS2 (Combined Charging System Standard introduced in 2012) DC fast charging connector standard. As of 2024, Tesla is considering opening its Supercharger network to other EVs in Norway.
5.1.3. EV Charging Anxiety
The most important anxiety for users is whether they will be able to reach their destination without recharging or whether they can easily access public charging points. If people want to use EVs on long trips that exceed the range of the car battery, fast charging options along the route are necessary [98]. Furthermore, these findings indicate that customers expressed a willingness to pay NOK 300 per hour for reduced waiting time. This indicates an urgent need for more fast chargers. Customers are also frustrated by difficulties such as system glitches, limited options for direct payment, poorly designed parking spots, insufficient public charging facilities, a lack of road charging infrastructure, short charging cables, intermittently working fast chargers, and faulty hardware. Overall, all these factors can heighten their anxiety over charger availability. Addressing customer concerns is critical to increasing zero-emission car mobility and reducing environmental damage.
5.1.4. Next Phase of Norway’s EV Transition
According to the Institute of Transport Economics, users of EVs have to deal with up to 20 different operators, 20–30 Apps, and 13 payment systems to access all charging infrastructure in Norway [99]. Charging payments are made by creating an account or downloading an App to use their chargers. Most public charging stations accept payments with a credit card, while others only accept RFID (Radio Frequency Identification) cards. Customers find it inconvenient to manage several mobile Apps and payment systems. The Ministry of Culture and Equality provided funds to Standards Norway in 2022 to draft a report on universal design for charging infrastructure. The purpose of this study is to ensure that all motorists, including those with special needs, have the option of driving an EV. Charging a vehicle should be as simple as filling it up with conventional fuel [94]. Additionally, there is a need to open more supercharger networks that can be used to charge all types of EVs in Norway.
5.2. EV Promotion in India
India’s EV sector is still in its early stages. The market penetration of EVs in India is low due to a lack of reliable charging infrastructure and financial incentives for EV manufacturers. Furthermore, high GST rates and the lack of affordable financing for critical EV infrastructure, including battery-as-a-service facilities and charging stations, are impeding the growth of the EV sector. However, the government has requested that the GST council lower the GST tariff on EVs from 12 to 5% recently. Earlier, Inc42, a startup media and intelligence platform in India, reported in 2023 that the goal of having 30% electric private cars, 70% electric commercial vehicles, and 80 percent electric two- and three-wheelers by 2030 is unrealistic on Indian roads, despite the fact that EV registrations are increasing [100]. They attributed the causes to the absence of robust government support (issues with the FAME-II scheme, lack of incentives for setting up charging infrastructure, and so on) in comparison to many other countries. Earlier, Dwarkeshwar Dutt in 2023 investigated the development of the E2W niche in India and observed the significant increase in the E2W market size since its inception [101]. Barman and Dutta, in a recent review article, examined the steps involved in developing policies, organizing projects, and implementing infrastructure for charging EVs across a large country like India, as well as barriers such as electricity access and stable grid connections for the deployment of EV charging stations [102]. Indeed, the government has undertaken a number of initiatives, including FAME and PLI schemes (automotive and ACC batteries), as well as several industrial policies at the state government level, to encourage investment and demand for EVs and achieve 30% EV penetration in India by 2030.
5.2.1. Current Status
India is one of the world’s largest two-wheeler markets, and both the national and local governments are promoting electric two-wheelers. According to the Bureau of Energy Efficiency, Ministry of Power, the transportation sector of India accounts for 18% of overall energy consumption (94 million tonnes of oil equivalent energy, which is expected to expand to 200 million tonnes of energy annually by the year 2030) [103]. Data show that the transport sector also emits an estimated 142 million tons of CO2 emissions per year, with the road transport segment alone accounting for 123 million tons. As the country strives for zero emissions by 2075, resources and attention are being directed toward electric mobility [104]. According to the Global EV Outlook 2023, the EV sales share across all modes (including two and three-wheelers) in India will be about 40% in 2030 in the Stated Policies Scenario (STEPS) [79].
According to the McKinsey & Company, BK complex, Mumbai, India, 2022 report, ICE vehicles will continue to dominate the Indian passenger and heavy commercial vehicle (PV and HCV) sectors. Electric PVs and HCVs are expected to account for from 10 to 15% and from 5 to 10% of new vehicle sales, respectively, by 2030. Sales of new E2Ws (Electric Two-wheelers) and E3Ws (Electric Three-wheelers) could increase by 50% and 70%, respectively, by 2030 [105]. According to EVreporter, India reported a total sale of 140,611 EVs in February 2024 (EV 2Ws 82051; E-rickshaw 36563; EV 3 W 6944; EV 4 W 7118; and other EVs 322) [106]. Earlier, Bain & Company Inc., Bengaluru, India, stated that EVs accounted for about 5% of total vehicle sales between October 2022 and September 2023 and could reach more than 40% penetration by 2030, driven by a strong adoption rate (over 45%) in both two-wheeler (2 W) and three-wheeler (3 W) categories [107]. 2 W EVs currently account for 85–90 percent of all EV units sold in India, followed by 4 W EVs (7–9% of sales) and 3 W EVs (5–7% of sales).
Tata Motors continued to dominate the Indian EV market in 2023. Other major players include MG Motors, Mahindra, Citroen, Hyundai, and Kia. New players like Tesla (Model 3 and Model Y), VinFast (Vin Group’s EV arm), JSW Group (a joint venture with SAIC Motors), etc., may start selling in 2024.
5.2.2. Charging Stations
There are about 12,146 operational EV charging stations as of 2nd February 2024, as per the information provided by the Minister of State for Heavy Industries, Shri Krishan Pal Gurjar, in a written reply in Lok Sabha [108]. Figure 7 shows the state-wise operational EV charging stations across the country. The advancement of fast charging technology will be the most significant development in EV-charging infrastructure, which will drastically cut down on the amount of time required to charge an EV, increase user convenience, and attract new buyers. Maharashtra now has around 3079 charging stations in operation. Previously, Fortune India reported that as many as 10,183 operable public charging stations have been installed in India across 77 charge point operators [109]. About 76% of Indian consumers expect to charge their electric vehicles (EVs) at home, according to the Deloitte global automotive consumer study 2022 [110].

Figure 7.
State-wise operational public EV charging stations map as of 2 February 2024 in India.
5.2.3. Challenges in EV Adoption
Table 5 illustrates the big challenges in the adoption of EVs in India. Poor charging infrastructure and battery range appear to be the biggest concerns for consumers [111]. Other key barriers to purchasing EVs include a lack of a universal payment system, an App for locating charging stations, poor quality of power, frequent power outages, non-operational charging stations, and long charging times [112]. Currently, EVs are more expensive than gasoline or diesel vehicles, and not many credit or suitable financial options are available. Furthermore, the absence of an EV repair and maintenance network, as well as the limited availability of skilled workers, is also hindering the growth of the EV sector [113].
Table 5.
Different challenges in adoption of EVs in India.
In summary, the EV policies of India focus on financial incentives for consumers and manufacturers, as well as infrastructure development, with the aim of accelerating the adoption of electric vehicles and mitigating environmental pollution. India’s EV market is growing due to government targets (30% electric vehicles by 2030), decreasing battery costs (the economic viability of EVs in the future), and growing environmental awareness. With its growing economy, India is poised to become a major player in the global EV industry. The increasing adoption of electric vehicles in India is considered to be a significant step toward sustainable growth in global mobility.
5.3. Cost Depreciation of EVs
Presently, the largest obstacle is still the cost of EVs. The public and business sectors must prioritize making the choice to decarbonize road transportation as much from an environmental standpoint as from an economic one. According to Cox Automotive, the average sale price of a new vehicle in the U.S. in February 2024 was USD 47,244, down 2.2% from February 2023 and 5.4% from the market peak in December 2022 [114]. A surge in new-vehicle inventory in the U.S., downward price pressure, and higher incentives appear to be key drivers of the market’s current momentum. CarEdge reports that the average price of a new electric car in February 2024 decreased by 21% compared to February 2023 [115]. Some analysts believe that EV prices may go down further and stabilize once they become a truly mainstream mode of transport.
We analyzed the cost of certain EV models in the US and China to investigate the price and range variations over the period 2017–2024. According to Department of Transportation statistics, the average driver in the U.S. drives 37–40 miles per day [116]. Most EVs in 2018 had a range of from 100 to 125 miles with a fully charged battery pack. With advancements in battery technology, the range of the latest EV models has improved significantly. Here, we analyzed the cost of some 200-mile range EVs from 2017 to 2024 in the United States without subsidies, and the results are displayed in Figure 8 [117]. The Nissan Leaf Plus EV has become more affordable over the years, although its range has increased thanks to better battery technology. Whereas the Tesla Model 3 standard shows variations in cost, considerably deep in 2020, and again increases and decreases over the years. The range of the battery is considerably improved until 2021 and becomes constant later. A report shows that Tesla cars show a mere 10% average battery degradation after over 160,000 miles [118]. The results reveal that other models (Kia Niro Basic, Hyundai Kona Basic, and Chevrolet Bolt LT) have reduced their costs and improved their range throughout this time period.
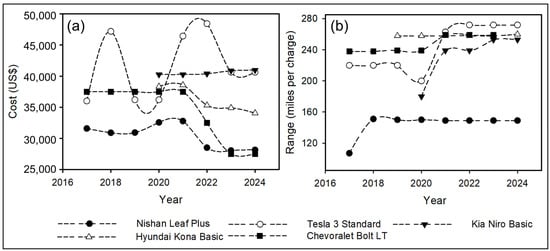
Figure 8.
Cost of some 200 miles EVs models from 2017 to 2024 in USA with no incentives. Variation in (a) cost (USD) of the EVs with years, and (b) battery range (miles) per charge with years.
BYD, Nio, Wuling, Hongqi, Zeekr, Aito, Xpeng, MG Motors, Xiaomi Auto, Tesla, and other bands are among the best-selling battery EVs in China. Here, we analyzed the price and range variations of some of these models from 2017 to 2024. Table 6 displays some of the best-selling battery EVs in China in 2024, as manufactured by these automobile manufacturers [119]. Qin Plus, Seagull, Song Plus, Yuan Plus, and Dolphin are some of BYD’s top-ranked selling models across all new energy vehicles in China for the six months ending in November 2023 [120].
Table 6.
Best-selling battery electric vehicles in China in 2024. (1 US$ = 7.24 Yuan, 16 April 2024).
The Chinese EV auto industry is two decades old, and many stakeholders started investing in this sector after 2008 [121]. Since then, the Chinese EV auto industries have seen considerable transformations and are continuously improving product performance. Every year, many companies introduce new products with an improved range and lower prices. As shown in Table 6, the cost of EVs (MRP at launch time) is primarily determined by the battery range as well as other features. As a representative case, Figure 9 shows the cost variation of the BYD Qin Plus model with battery range. The cost of the BYD Qin Plus changes little as the range increases from 420 to 512 km; thereafter, the cost continues to rise while the range remains relatively constant. This appreciation of cost could be attributed to additional features and performance improvements.
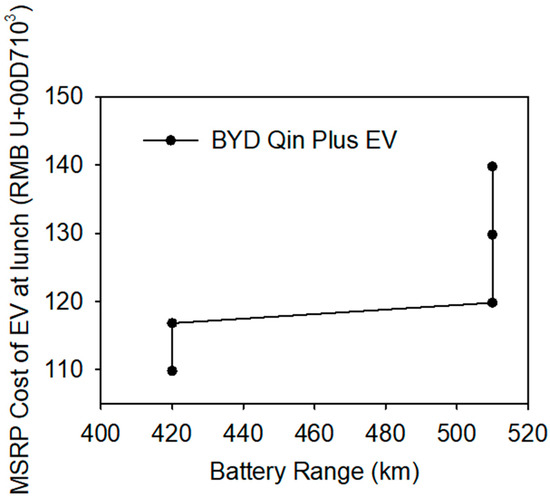
Figure 9.
BYD Qin Plus model cost variation with the battery range.
The price of an EV is primarily determined by its battery performance. Because of the high cost of energy-dense batteries, EVs have historically been more expensive than their fossil fuel counterparts. With rising production and technological advancements, batteries are becoming more and more affordable to produce, bringing parity between EVs and ICE vehicles. CATL and BYD, the two largest power battery makers, had a global share of 37.4 percent and 15.7% from January to November 2023, respectively (according to data released on January 9 by South Korean market researcher SNE Research), while LG Energy Solution had a market share of 13.6% [122]. CATL, China, aims to secure its market position by reducing battery costs by up to 50% by 2024 [123]. Both CATL and BYD are on a path to reduce battery prices by up to 50% this year, which means battery packs at the end of 2024 could cost half what they did at the end of 2023. According to BYD, its blade battery will be a market-leading low-cost lithium-ion battery, costing roughly USD 65/kWh in 2025 [124]. BYD Li-ion Blade batteries are predicted to cost USD 50/kWh by 2027. The volumetric energy density (energy per mass/liter) of the Blade battery is 448 Wh/L, whereas the gravimetric energy density is projected to be 165 Wh/kg. Whereas Tesla’s most recent Model 3 ‘2170’ batteries have a gravimetric energy density of around 260 Wh/kg. Further, Tesla’s new ‘4680’ battery is targeted to enhance energy density by almost 50 percent, reaching 400 Wh/kg.
BloombergNEF (BNEF) predicts a dramatic fall in lithium-ion battery pricing to USD 113/kWh in 2025 and USD 80/kWh in 2030 due to technological innovation and manufacturing improvements [125]. The price trend of lithium-ion battery packs is shown in Figure 10 [126]. As seen in Figure 10, the cost of a battery pack is continuously depreciating, and this trend is expected to continue. According to the Department of Energy’s (DOE’s) Vehicle Technologies Office, improvements in battery chemistries and technologies, along with increased manufacturing volume, contributed to an 89% decrease in the cost of an EV lithium-ion battery pack between 2008 (USD 1355/kWh) and 2022 (USD 153/kWh) (using 2022 constant dollars) [127].
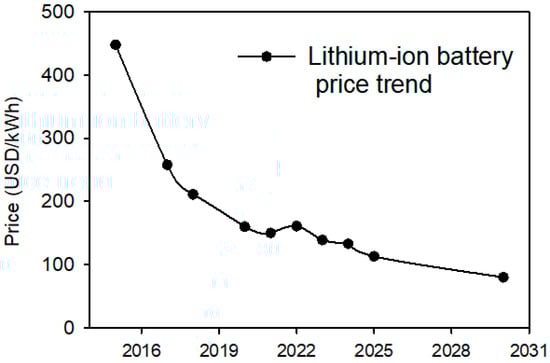
Figure 10.
Price trend of lithium-ion battery pack.
Recently, Toyota, the world’s largest carmaker, developed fireproof solid-state batteries with high energy density, allowing EVs to have a range of more than 1200 km per charge and a charging time of 10 min or less [128,129]. Solid-state EV batteries are lighter and smaller than lithium-ion batteries (currently used in EVs, which are heavy compared to gasoline vehicles) and store more energy (high energy density). These would cost 20% less than the existing battery technologies. Solid-state batteries reduce concerns about charging time, capacity, and fire risk. Toyota Motor Corp. Toyota City, Aichi, Japan and Idemitsu Kosan Co., Tokyo, Japan are developing the technology and manufacturing facilities required to mass-produce solid-state batteries for electric vehicles. These batteries are projected to begin shipping in 2027, followed by mass production.
In conclusion, the price of power batteries is likely to depreciate further as the price war for EVs continues. In the coming years, it is anticipated that the price of EVs will catch up to that of ICE cars. As a result, prices for EVs are anticipated to decrease in the future. GHG emissions will be lower in such a scenario since there would be more EVs on the road.
5.4. Used EV Market and Consumers’ Response
Due to their lower cost of acquisition and lower cost of ownership and operation, as well as increasing popularity, the demand for EVs is constantly growing. The least affluent owners cannot afford a new EV despite subsidies that are supposed to offer a lower cost of acquisition; their only option remains second-hand EVs. According to Recurrent, used EV sales volume in the US in 2024 increased by 100% from 2022 and by 40% from 2023; as a result, the prices of EVs have also come down significantly [130]. The increasing demand for pre-owned EVs hides the reality of the fast depreciation of EVs. Inside EVs reported that the average used EV prices in the U.S. were down 33.7% in October 2023 (USD 34,994), compared to October 2022 (USD 52,821) [131].
Earlier in April 2023, it was reported that the value of three-year-old EVs dropped in the UK by up to 30.7% compared to what they were in March 2023 [132]. The main obstacles to buying used EVs were found to be the rise in the supply of new EVs, the increase in the availability of used EVs, increased incentives for buyers of new EV cars, range anxiety and charging worries of EV consumers, and the rising cost of charging an EV. In October 2022, the average price of used EVs in the United States was USD 52,820, but dropped to USD 34,994 in October 2023, a significant price drop of 33.7% in a year [133]. Figure 11a shows the used battery EV average sale prices of some car models in the US as of April 2024 [134]. According to these results, the average price drop for the Tesla Model 3 standard range seems to be negligible in models manufactured after 2022; nevertheless, a significant price drop is observed for the Nissan Leaf S and Chevrolet Bolt-LT models as of April 2024 in the US. Earlier, Lukas Schloter, in 2022, showed that electric vehicles have a substantially higher depreciation of 13.9% per annum compared to gasoline vehicles with 10.4% per annum [135]. He argued that with a maturing and growing market for EVs in the years to come, the situation might change, and the depreciation might come closer to that of gasoline vehicles.
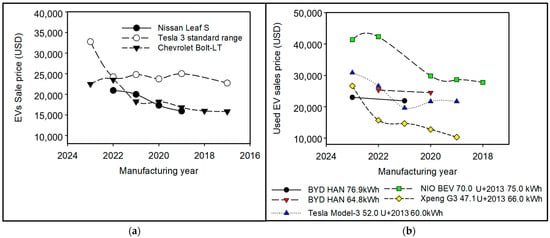
Figure 11.
(a) Used battery EVs average sale prices of some models in US as of April 2024 (mileage < 60,000 miles). (b) Used battery EVs average sale prices of some models in China as of April 2024 (mileage < 100,000 km, battery range 300 km).
Similarly, the average sale prices of some used battery EV models in China as of April 2024 are displayed in Figure 11b [136]. According to the results of Figure 11b, the average sale prices of all used EVs in China decreased significantly as of April 2024. It appears that the Chinese market is oversupplied with new and used EVs.
To summarize, used EV sales prices are dropping dramatically. Customers may be hesitant to purchase used EVs because of the higher maintenance costs when compared to old fossil fuel vehicles, but mostly due to the fast depreciation caused by subsidies on new EVs and performance loss due to battery deterioration with mileage. It may be minor, but tires wear out much faster as EVs are heavier than fossil-fuel cars. Low demand for used EVs is another factor contributing to the price decline. A couple of reasons may be as follows:
- Those who actually want an EV already have one. The market is fairly saturated.
- The battery life of any rechargeable battery-operated device is limited. Therefore, the life left in the battery of a used EV is questionable. The cost of electric vehicle batteries could exceed USD 10,000. So, buying a used car is just another USD 10,000 responsibility, a tough pill to swallow.
- There are not nearly enough chargers available, and no sane person with a life, places to be, and things to do wants to plan their day and week around finding chargers.
In summary, as EV technology and innovation progress, a considerable return on investment is anticipated for used EV vehicles. The number of EVs on the road could increase as a result.
6. EV-Charging Infrastructure Development
The availability of public EV charging stations is critical for the purchase of electric vehicles around the world. EV charging stations involve the manufacturing industry, installation, and operation of charging infrastructure for electric vehicles. The EV-charging infrastructure is classified according to vehicle type (passenger vehicles and commercial vehicles), charger type (AC charging station and DC charging station), and application type (public and private). Figure 12 shows the flow diagram of EV charging stations. These stations are further categorized as home charging, charging at workplaces, charging at the travel destination (shopping centers, hotels, etc.), and publicly available charging (which includes fast charging and super-fast charging routes).
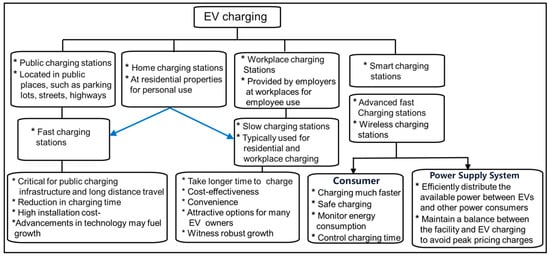
Figure 12.
Flow diagram of EV charging stations.
Smart charging is a technique wherein environmentally beneficial charging methods such as renewable energy are explored [137]. Such smart charging technology optimizes charging efficiency while minimizing energy consumption, resulting in cost savings for consumers. It offers a safe and convenient option to charge EVs when electricity demand is low and/or renewable energy is plentiful on the grid. This also enables the driver to receive power in an efficient and cost-effective way, taking into consideration factors such as electricity cost, availability, and the driver’s needs [138].
Lately, some automakers are experimenting with wireless EV charging systems. Earlier in 2020, the Society of Automotive Engineers (SAE) published an official standard [139,140]. This type of EV charging system eliminates the need for all those inconvenient cords. Wireless EV charging, also known as inductive charging, generates a power-transmitting field through magnetic resonance and a charging pad. When a coil in a receiver under the car aligns with a coil in the charging pad, the receiver absorbs that energy and transfers it to the car’s battery [141]. Wireless EV charging is currently available mostly through pilot programs. Some automakers in China and South Korea are testing the technology on new passenger cars, but many wireless-charging trials are aimed at commercial vehicles, which have predictable routes and the luxury of charging overnight in established parking spaces.
6.1. Charging Installations in China
China is leading the way in EV charger installations, fueled by its ambitious electric vehicle adoption targets [142,143]. There were 8.596 million charging stations by the end of 2023, including 2.726 million public charging stations, with a ratio of 2.4:1 for vehicles to stations [144,145]. EV chargers are much cheaper in China than in the United States, Norway, Germany, and India. This difference is primarily due to national certification standards for charging stations, production volume, and quality. Tgood (Telaidian), Star Charge, YKCCN, and China State Grid are the leading public EV charging companies in China. By 2022, these four businesses had installed a total of about 1.2 million public EV charging stations, accounting for nearly 65% of the market share. Qingdao-based Tgood (Telaidian) led the way in public fast-charging EVSE, with 216,000 DC high-power chargers and a cumulative charging power of 11.6 million kilowatts.
Indeed, the EV charging network in China has developed rapidly. However, public charging stations continue to face challenges such as inconsistent quality and insufficient interconnection, partly due to the large number and dispersion of charging operators, resulting in the formation of “isolated islands” of charging stations. Challenges encountered by electric vehicle owners include difficulties in finding charging stations, poor compatibility, and time-consuming charging processes. These issues involve physical facilities, software systems, and settlement mechanisms.
To address the key problems of battery EVs, such as “driving range anxiety, long battery charging time, and driving safety hazards, researchers in China proposed to improve the operational safety monitoring of batteries [146]. Based on the terminal–network-cloud architecture, these measures include creating a digital twin model of power batteries, enriching diagnosis methods for monitoring the state-of-health of battery EVs, improving safety early warning accuracy, extending the duration of safety early warnings, and implementing active and passive safety protection for the whole life cycle of power batteries. New technological features, such as intelligent and networked autonomous battery electric technology, were developed.
Recently, Huawei released a note on Charging Network with the theme of “High-Quality Charging Anywhere” on 30 January 2024, with the aim of providing high-quality charging anywhere, anytime, to consumers and accelerating the pace toward mobility electrification and carbon neutrality [147]. Recently, Huawei announced on 24 April 2024, the development of its Intelligent Electric and Smart Charging Network Strategy and New Product System [148]. Further, Huawei Digital Energy proposed the integration of an electrification strategy: utilizing new energy vehicles powered by new energy electricity, promoting high-quality charging, and enhancing the driving experience of new energy vehicles. The goal is to accelerate the development of electric vehicles through intelligent coordination. Huawei’s liquid-cooled supercharging system is expected to help charging infrastructure move towards high quality, high efficiency, and intelligence. This is anticipated to have an impact on the growth trajectory and future pattern of China’s new energy vehicle industry.
6.2. EV-Charging Infrastructure in Japan, Korea, and India
In recent years, Japan and Korea have made significant progress in the development of EV-charging infrastructure [149,150]. Both slow and fast charging station installations in Asia are expected to increase in the coming years. In contrast, India’s charging infrastructure is still in its early stages and is poised to expand significantly. As of 2nd February 2024, there were around 12,146 public EV charging stations in service across the country [108]. As more and more consumers adopt environmentally friendly modes of transportation, the demand for reliable and easily accessible EV charging stations is likely to escalate. Due to the increasing number of EV users, the Asia–Pacific region is rapidly installing public charging stations, particularly in China, India, and South Korea [151].
6.3. Installations in Europe and North America
Northern European countries (Denmark, Finland, Sweden, and Norway) have seen a remarkable increase in EV-charging infrastructure [152]. An increasing number of public and private charging stations, including fast-charging stations, are being installed in urban and rural areas. The North American EV charging market is undergoing considerable transformation, driven by the increasing adoption of EVs owing to various incentives and growing environmental awareness [153]. The surge in EVs has resulted in the rapid expansion of charging infrastructure. Supportive government policies and incentives, technological advancements, and the expansion of automotive manufacturers into the EV industry are contributing to this growth. DC fast chargers are projected to gain popularity in the coming years, owing to their ability to provide quick charging and more convenience to users.
In the regions where electric trucks are becoming commercially available, the economics for battery electric trucks in long-distance applications can be substantially improved if charging costs can be reduced by maximizing “off-shift” (e.g., night-time or other longer periods of downtime) slow charging, securing bulk purchase contracts with grid operators for “mid-shift” (e.g., during breaks), fast (up to 350 kW), or ultra-fast (>350 kW) charging, and exploring smart charging and vehicle-to-grid opportunities for extra income [55]. Most commercially available direct current (DC) fast-charging stations currently enable power levels ranging from 250 to 350 kW.
Residential charging systems account for a significant portion of the global EV charging market. The demand for convenient and accessible charging solutions for individual users is expected to increase significantly in the future. Residential EV charging includes both Level 1 and Level 2 charging options. Level 1 charging, the most basic and readily available charging solution for EV owners, provides a charging rate of 4–8 km of range per hour of charging. Whereas level 2 charging, which requires dedicated charging equipment and a higher voltage supply, offers charging rates ranging from 15 to 95 km of range per hour. The National Renewable Energy Laboratory, USA, estimates that Level 1 and Level 2 charging will handle 80% of all EV charging duties by 2030 [154]. By 2030, 33 million EVs will be on the road, and 28 million EV charging ports will be needed to support them. The majority (64%) of EV charging is estimated to take place at single-family homes using Level 1 and Level 2 charging, which is typically the most cost-effective and convenient type of charging. DC fast-charging infrastructure is expected to support 20% of EV charging needs.
7. Consumer Perceptions about Adoption of EVs
EVs are becoming more and more common as people’s awareness of the environment and climate change grows. As EVs are using grid electricity for charging, they may have a smaller or minimal carbon footprint than gasoline vehicles, provided the electricity for charging is generated by renewable sources. Many people and stakeholders believe that switching to EVs will benefit the world greatly. However, there are some genuine issues with EVs that are depicted in Table 7 [155].
Table 7.
Stakeholder’s genuine issues with EVs that are hindering growth.
Consumers Concern
According to the annual car reliability survey by Consumer Reports, EVs from the past three model years (2020–2022) had 79% more problems than conventional cars [156]. Electric cars are mostly new developments, and relatively recently introduced models generally tend to have more issues, as reported by Peter Valdes-Dapena [157]. According to a recent Pew Research Center survey, about four out of ten Americans (about 38%) think they are very or somewhat likely to seriously consider an EV for their next vehicle purchase [158]. More than half of adult Americans say they would never consider or would be very likely to consider purchasing an electric vehicle. Apart from this conflicting scenario, there are a number of more serious and pervasive problems with EVs. Furthermore, it can be challenging to decide if an EV would be the best choice for your next new vehicle due to myths and misinformation about EVs. According to a report, 40% of charging stations in the US have serious faults, including out-of-order signs, payment errors, and connection issues, implying that the US EV infrastructure is still in its infancy [159]. Los Angeles, which holds the title for having the most DC fast chargers in the country, has such serious charging issues, intricately illustrating the dilemma facing the EV infrastructure of America. Customers’ perceptions about EVs are presented in Table 8 [160,161,162,163].
Table 8.
Customer perception about electric cars.
Electric grids are not green, and a large portion of grid electricity is generated from fossil fuel resources, which contributes to global warming. As they contain more advanced technological features, such as more gadgets and safety sensors, EVs are typically more expensive than other vehicles. They also have issues with charging and batteries. Many drivers report reliability issues with EVs as a key disadvantage; nonetheless, the rate of EV problems is lower than the rate of non-EV problems. In-car electronics are also a big problem for some drivers. Electric cars are typically heavier than gasoline cars due to their large battery packs. Table 9 shows the weight of EVs compared to their gasoline counterparts. The battery pack in an electric vehicle is one of the primary reasons, making EVs significantly heavier than their gas-powered counterparts. Figure 13a shows the battery-to-car weight analysis of some EV models. The weight of the battery varies between 25 and 30% of the EV’s curb weight. In recent days, efforts have been made to build lightweight, high-energy-density batteries and lower the curb weight of EVs. Figure 13b shows the curb weight changes with the manufacturing year of some EV models. No change in curb weight is noted for the Hyundai Kona-EV SEL and Chevrolet Bolt-LT Hatchback models. Surprisingly, all EV models of the Nissan Leaf have gained in curb weight with the year of manufacturing. However, the Tesla Model S Long range shows a notable decrease in curb weight every manufacturing year. Results in Figure 13b show that Tesla is working continuously to reduce its curb weight while improving its performance.
Table 9.
Weight of EVs as compared to their gasoline counterparts.
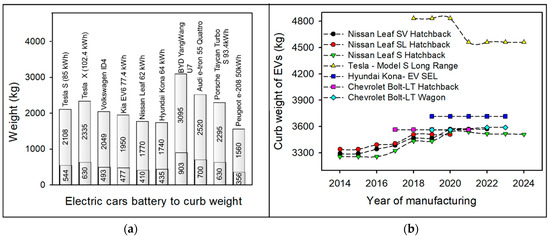
Figure 13.
(a) Battery-to-EV weight analysis of some EV models. The lower column shows the battery weight. (b) Curb weight variation with the manufacturing year of some EV models.
The added weight of EVs can have various effects on the car, including (i) affecting performance and handling; (ii) increasing the risk of collision and affecting safety for other drivers and pedestrians; (iii) generating more particulate pollution from tire wear; (iv) affecting performance, fuel efficiency, and overall driving experience; and (v) increasing the range and torque of the car, which allows electric cars to accelerate faster and have more power than gasoline cars. Blake Shaffer et al. emphasized the need for EVs to be lighter in order to avoid the risk of collision and maximize climate benefits [164]. Infrastructure development experts also feel that EVs are likely to cause more damage to roads and bridges as EVs are equipped with larger and heavier batteries, particularly in EV trucks and semi-trucks. EV tires release more particulate matter into the air than tires on gas-powered cars. Some analysts believe that EVs have little impact on infrastructure but may create more danger due to acceleration. Future EV models are likely to be lighter due to the rapid advancement in battery technology and other innovations.
In general, favorable conceptions about EVs will not only result in increasing demand for EVs but also help to reduce CO2 and other GHG emissions.
8. Prospect of EV Acceptance and Decarbonization
Policymakers and governmental institutions view EVs as game changers. Eventually, the adoption rate of EVs will increase. They anticipate that, sooner or later, EV-charging infrastructure will reach a tipping point, with charging stations to suit everyone’s needs and enough charging stations to ensure that no one is left stranded. Affordability will no longer be a barrier when EV prices start falling. However, both dealers and consumers believe that the most significant barriers to buying an EV are the battery range and cost. The installation of charging stations at home, especially in shared housing units like apartments and rental homes, low demand, poor resale value, technological challenges like EV charging in winter and battery performance in extreme climates, battery capacity and range, battery replacement costs, and service and maintenance are additional obstacles to the adoption of EVs. The main barriers to the adoption of EVs are depicted in Figure 14. Battery range, charging infrastructure, and service infrastructure and network are identified as the most significant barriers to EV adoption by consumers. The other most significant barriers are the costs and benefits, as well as the uncertainty surrounding the continuation of incentive and subsidy policies.
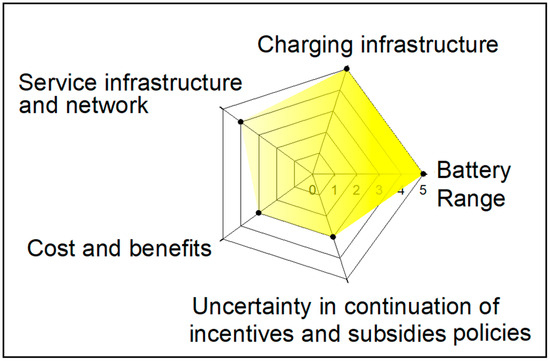
Figure 14.
Leading barriers for the adoption of EVs.
CNN reports that consumers’ decisions to buy EVs will be influenced by the proximity of charging facilities and their affordability. As long as batteries remain expensive, automakers are unlikely to offer models at lower prices [165]. It is imperative that convenient charging infrastructure be prioritized. Encouraging the adoption of EVs without providing convenient charging options may have long-term negative effects on dealer and customer brand loyalty and reputation. According to a recent study by the California Energy Commission for 2022, only 33% of residents of multi-family dwellings may ever have access to home charging. This implies that, even in the best-case scenario, 67% of multi-family residents in California will never have access to home charging [166].
According to Forbes, one of the main issues that will probably affect EVs’ future trajectory is their pricing [167]. Technological limitations are an additional obstacle to the mainstream use of EVs. Further, adoption is hampered in some places by battery performance in extreme weather. All of these challenges, including those unique to the industry, suggest modest growth in EV sales in the upcoming years. Auto Dealer Magazine claims that the current state of the car market makes it difficult to persuade individual purchasers to switch to electric vehicles because the government is not doing much to boost the battery-powered vehicle market in the UK [168].
In fact, according to a recent Lagrada analysis, the high costs, battery charging times, and lack of access to recharging stations have caused automakers in the USA to become frustrated and wish to return to combustion engines. These factors have delayed the adoption of this technology longer than expected [51]. According to a 2023 report, buyers in the USA are becoming more and more interested in gas–electric hybrid vehicles, which switch between gas and battery power to optimize economy [169]. Many people, including those who claim they would ultimately like to own an electric vehicle, are in favor of hybrids. Higher costs, worries about long-distance driving (limited battery range), and a lack of local charging infrastructure are the main causes of the slowdown in EV sales in the US. Those who live in apartments might not have a space at home to charge. Furthermore, sales of used EVs are not very appealing. The report shows that used EV prices decreased significantly between September and October of 2023 compared to the same period in 2022, with some studies indicating a fall of 30% [170]. As a result, several manufacturers are reducing their plans for additional battery production or assembly operation plans for new batteries while simultaneously boosting their output of hybrid vehicles. The high rates of EV adoption in several countries can be attributed to monetary incentives (e.g., tax exemptions, carbon cost to vehicle price); recurring financial incentives (e.g., carbon price as fuel tax, dynamic electricity tariff for EV charging); regulatory incentives (e.g., mandatory fuel economy, exhaust gas standards); and non-financial incentives (e.g., charging infrastructure development, access to special lanes, road toll exemptions, free parking, and access to low-emission zones) as reported by Adiatma and Marciano on the decarbonization of Indonesia’s road transport sector [5]. All these studies suggested that the use of EVs should become a key strategy to reduce GHG emissions from the transportation sector.
Consequently, it is imperative to foster positive consumer attitudes about EVs. This will undoubtedly raise the acceptance rate of EVs. In summary, all these elements described in the preceding sections—including consumer perspectives—play a significant role in the actual growth of the EV industry and the accomplishment of the decarbonization of road transportation.
9. Conclusions
The development of EVs is certainly a great contribution to the decarbonization of road transport. Multiple studies suggested that a key strategy to reduce GHG emissions from the transportation sector is the advancement of EV adoption rates. The decarbonization process of road transportation is dependent on a number of variables, including government energy policies and regulatory standard development, necessary infrastructure investments and developments, research and innovation, advancements in EV and battery technologies, and consumer perspectives. Certainly, a transition towards lower carbon emission levels in transportation modes will influence the economy, infrastructure, regulatory environment, and the incorporation of AI and information technologies in EVs. In particular, such an achievement can be linked to governments’ policies that allow affordability in acquisition and ownership. In actuality, EVs are still more costly than ICE cars, and they are yet to become mainstream modes of transportation. It would have been nearly impossible to launch the sector without subsidies.
One of the key factors driving the current industry and influencing EVs in the future is technological advancements. There is still a lot of room for advancement in EV technical achievements, particularly in areas like battery performance and technology, charging infrastructure, and the energy efficiency and safety of vehicles with improved AI integration. As technology advances, one should anticipate more economical approaches, increased efficiency, and dependable EVs with longer ranges and quicker charging periods. The industry’s major problems, including cost and technology barriers, indicate that EV sales growth may slow down in the upcoming years, especially for used EVs. The market for EVs is at a turning point, as rising adoption rates compete with technological obstacles and economic headwinds. The market for used electric cars is still in its infancy, but, thus far, EVs have witnessed a much faster depreciation than ICE vehicles. The considerable return price of the used EVs, with the advancement of EV technology and innovation, may result in an increasing number of EVs on the road.
In conclusion, our study addressed key areas regarding the adoption of EVs as a modern, environmentally friendly mode of transportation. We suggest that the decarbonization of road transportation and the development of less carbon-intensive transportation technologies will be significantly influenced by consumer attitudes about electric vehicles, among other things. Resolving their issues and points of view positively might undoubtedly help to lower the amount of CO2 and other GHG emissions from the road transportation sector.
Author Contributions
Conceptualization, R.P. and B.D.; methodology, R.P.; formal analysis, G.P. (Gautam Patil) and G.P. (Gayatri Pode); investigation, G.P. (Gautam Patil) and G.P. (Gayatri Pode); resources, G.P. (Gautam Patil) and G.P. (Gayatri Pode); writing—original draft preparation, G.P. (Gautam Patil) and G.P. (Gayatri Pode); writing—review and editing, R.P.; visualization, R.P. and G.P. (Gautam Patil); supervision, R.P.; project administration, R.P. All authors have read and agreed to the published version of the manuscript.
Funding
This research received no external funding.
Conflicts of Interest
The authors declare no conflict of interest.
References
- CO2 Emissions in 2023. International Energy Agency (IEA), France. February 2024. Available online: https://iea.blob.core.windows.net/assets/33e2badc-b839-4c18-84ce-f6387b3c008f/CO2Emissionsin2023.pdf (accessed on 20 April 2024).
- CO2 Emissions in 2022. International Energy Agency (IEA), France. March 2023. Available online: https://www.iea.org/reports/co2-emissions-in-2022 (accessed on 20 April 2024).
- Transport and Mobility. European Environment Agency. 28 August 2024. Available online: https://www.eea.europa.eu/en/topics/in-depth/transport-and-mobility (accessed on 4 September 2024).
- Serrano, J.; Ruiz, P. Decarbonization of the Heavy-Duty Transport Sector: A Necessary Step in the EU’s Energy Transition. RaboBank (The Netherlands). 8 November 2023. Available online: https://www.rabobank.com/knowledge/d011400411-decarbonization-of-the-heavy-duty-transport-sector-a-necessary-step-in-the-eus-energy-transition (accessed on 4 September 2024).
- Adiatma, J.C.; Marciano, I. The Role of Electric Vehicles in Decarbonizing Indonesia’s Road Transport Sector; Institute for Essential Services Reform (IESR): Jakarta, Indonesia, March 2020; Available online: https://www.climate-transparency.org/wp-content/uploads/2020/07/Final_The-Role-of-EV-in-Decarbonizing-Road-Transport-Sector-in-Indonesia_Compressed-Version.pdf (accessed on 15 March 2024).
- Ali, Q.; Di Silvestre, M.L.; Lombardi, P.; Sanseverino, E.R.; Zizzo, G. The Role of Renewable Energy Generation in Electric Vehicles Transition and Decarbonization of Transportation Sector. In Proceedings of the 2023 IEEE International Conference on Environment and Electrical Engineering and 2023 IEEE Industrial and Commercial Power Systems Europe (EEEIC/I&CPS Europe), Madrid, Spain, 6–9 June 2023; pp. 1–6. [Google Scholar] [CrossRef]
- Richter, J.L. A circular economy approach is needed for electric vehicles. Nat. Electron 2022, 5, 5–7. [Google Scholar] [CrossRef]
- Ritchie, H. Tracking Global Data on Electric Vehicles. Published online at OurWorldInData.org. 26 February 2024. Available online: https://ourworldindata.org/electric-car-sales (accessed on 7 March 2024).
- Zhang, C.; Zhao, X.; Sacchi, R.; You, F. Trade-off between critical metal requirement and transportation decarbonization in automotive electrification. Nat. Commun. 2023, 14, 1616. [Google Scholar] [CrossRef] [PubMed]
- Bose, M. Decarbonisation of Transport Andinfrastructure: Translating Strategy to Action. KPMG. 2 August 2023. Available online: https://kpmg.com/uk/en/home/insights/2023/07/decarbonisation-of-transport-and-infrastructure.html (accessed on 1 July 2024).
- How to Decarbonize Heavy-Duty Transport and Make It Affordable. Supply Chain and Transport, World Economic Forum. 16 August 2021. Available online: https://www.weforum.org/agenda/2021/08/how-to-decarbonize-heavy-duty-transport-affordable/ (accessed on 10 July 2024).
- Lawson, A.; Ahmad, F.M. Decarbonizing U.S. Transportation. Center for Climate and Energy Solutions. July 2018. Available online: https://www.c2es.org/wp-content/uploads/2018/07/innovation-transportation-background-brief-07-18.pdf (accessed on 4 August 2024).
- Milovanoff, A.; Posen, I.D.; MacLean, H.L. Electrification of light-duty vehicle fleet alone will not meet mitigation targets. Nat. Clim. Chang. 2020, 10, 1102–1107. [Google Scholar] [CrossRef]
- Canadian Net-Zero Emissions Accountability Act. Modified: 2022-03-29. Available online: https://www.canada.ca/en/services/environment/weather/climatechange/climate-plan/net-zero-emissions-2050/canadian-net-zero-emissions-accountability-act.html (accessed on 3 August 2024).
- Riehle, E.; Le Claire, E.; Rublack, E.; Schmidt, T.; Sinha, S.J.; Teja, J.; Sharma, G. Towards Decarbonising Transport 2023. A Stocktake on Sectoral Ambition in the G20; Report on behalf of Agora Verkehrswende and Deutsche Gesellschaft für Internationale Zusammenarbeit, GIZ 2023; Agora Transport Transformation gGmbH: Berlin, Germany, 2023; Available online: https://www.agora-verkehrswende.de/fileadmin/user_upload/98_Towards_Decarbonising_Transport_2023.pdf (accessed on 24 July 2024).
- Lu, Q.; Duan, H.; Shi, H.; Peng, B.; Liu, Y.; Wu, T.; Du, H.; Wang, S. Decarbonization scenarios and carbon reduction potential for China’s road transportation by 2060. Urban Sustain. 2022, 2, 34. [Google Scholar] [CrossRef]
- Kumar, M.; Shao, Z.; Braun, C.; Bandivadekar, A. ICCT White Paper. Decarbonizing India’s Road Transport: A Meta-Analysis of Road Transport Emissions Models. 5 May 2022. Available online: https://theicct.org/wp-content/uploads/2022/05/Meta-study-India-transport_final.pdf (accessed on 24 July 2024).
- Smit, R.; Khan, T.; Yang, Z. How Australian Light-Duty Vehicle CO2 Emissions Compare with the Rest of the World; International Council on Clean Transportation. February 2024. Available online: https://theicct.org/wp-content/uploads/2024/02/ID-114-%E2%80%93-Australia-CO2_final.pdf (accessed on 5 April 2024).
- Japan: Heavy-Duty: Fuel Economy. Available online: https://www.transportpolicy.net/standard/japan-heavy-duty-fuel-economy/ (accessed on 1 September 2024).
- Second-Phase Fuel Economy Standards for On-Road Heavy-Duty Vehicles in Japan. International Council on Clean Transportation. Policy Update January 2019. Available online: https://theicct.org/sites/default/files/publications/Japan_HDV_FE_Phase_2_20190129.pdf (accessed on 1 September 2024).
- Decarbonising Transport—A Better Greener Britain. Department of Transport. 2021. Available online: https://assets.publishing.service.gov.uk/media/610d63ffe90e0706d92fa282/decarbonising-transport-a-better-greener-britain.pdf (accessed on 4 August 2024).
- Álvarez-Antelo, D.; Lauer, A.; Capellán-Pérez, I. Exploring the potential of a novel passenger transport model to study the decarbonization of the transport sector. Energy 2024, 305, 132313. [Google Scholar] [CrossRef]
- Atiaja, J.; Arroyo, F.; Hidalgo, V.; Erazo, J.; Remache, A.; Bravo, D. Dynamic Simulation of Energy Scenarios in the Transition to Sustainable Mobility in the Ecuadorian Transport Sector. Sustainability 2024, 16, 6640. [Google Scholar] [CrossRef]
- Kim, Y.-G.; Lim, H.-W.; Lee, J. Decarbonizing road transport in Korea: Role of electric vehicle transition policies. Transp. Res. Part D Transp. Environ. 2024, 128, 104084. [Google Scholar] [CrossRef]
- Torkey, A.; Zaki, M.H.; El Damatty, A.A. Transportation Electrification: A Critical Review of EVs Mobility during Disruptive Events. Transp. Res. Part D Transp. Environ. 2024, 128, 104103. [Google Scholar] [CrossRef]
- NIO, Inc. China. The Road to Decarbonization. Nature Research Custom Media. 25 March 2022. Available online: https://www.nature.com/articles/d42473-022-00066-5 (accessed on 7 March 2024).
- PolyU Unveils Research Centre for Electric Vehicles, Spearheading Smart EV Research Towards Carbon Neutrality Goals. The Hong Kong Polytechnic University. 28 February 2024. Available online: https://indiaeducationdiary.in/polyu-unveils-research-centre-for-electric-vehicles-spearheading-smart-ev-research-towards-carbon-neutrality-goals/ (accessed on 7 April 2024).
- Xing, J.; Liu, X.; Zhang, Y. Development of the electric vehicle industry in China. China Econ. J. 2023, 16, 139–184. [Google Scholar] [CrossRef]
- Global EV Outlook 2021, IEA, Paris. Available online: https://www.iea.org/reports/global-ev-outlook-2021 (accessed on 7 April 2024).
- H.R. 6049—110th Congress (2007–2008), US Passed the Bill in 2008. Available online: https://www.congress.gov/bill/110th-congress/house-bill/6049/text#toc-id28E82AC4F03540D4B7192D47AF6C089B (accessed on 8 April 2024).
- Zhang, X.; Liang, Y.; Yu, E.; Rao, R.; Xie, J. Review of electric vehicle policies in China: Content summary and effect analysis. Renew. Sustain. Energy Rev. 2017, 70, 698–714. [Google Scholar] [CrossRef]
- Liu, X.; Sun, X.; Zheng, H.; Huang, D. Do policy incentives drive electric vehicle adoption? Evidence from China. Transp. Res. Part A Policy Pract. 2021, 150, 49–62. [Google Scholar] [CrossRef]
- Electrification Trends Worldwide. European Automobile Manufacturers’ Association (ACEA). 25 November 2022. Available online: https://www.acea.auto/news/electrification-trends-worldwide/ (accessed on 21 March 2024).
- Carey, N. Global EV Sales up 69% y/y in Jan, down 26% vs. Dec—Rho Motion. Reuters. 14 February 2024. Available online: https://www.reuters.com/business/autos-transportation/global-ev-sales-up-69-yy-jan-down-26-vs-dec-rho-motion-2024-02-14/ (accessed on 10 April 2024).
- Q1 2024: Over 3 Million Electric Vehicles Sold Globally. Rho Motion, London. April 2024. Available online: https://rhomotion.com/news/q1-2024-over-3-million-electric-vehicles-sold-globally/ (accessed on 23 April 2024).
- Electric Road Vehicles in the European Union: Trends, Impacts and Policies. 3 April 2019. Available online: https://www.europarl.europa.eu/RegData/etudes/BRIE/2019/637895/EPRS_BRI(2019)637895_EN.pdf (accessed on 10 April 2024).
- Wappelhorst, S.; Hall, D.; Nicholas, M.; Lutsey, N. Analyzing Policies to Grow the Electric Vehicle Market in European Cities. International Council on Clean Transportation 2020. Available online: https://theicct.org/sites/default/files/publications/EV_city_policies_white_paper_fv_20200224.pdf (accessed on 12 March 2024).
- Overview—Electric Vehicles: Tax Benefits & Purchase Incentives in the European Union. 21 September 2022. Available online: https://www.acea.auto/fact/overview-electric-vehicles-tax-benefits-purchase-incentives-in-the-european-union-2022/ (accessed on 5 May 2024).
- First ‘Fit for 55’ Proposal Agreed: The EU Strengthens Targets for CO2 Emissions for New Cars and Vans. Council of the EU. 27 October 2022. Available online: https://www.consilium.europa.eu/en/press/press-releases/2022/10/27/first-fit-for-55-proposal-agreed-the-eu-strengthens-targets-for-co2-emissions-for-new-cars-and-vans/ (accessed on 7 May 2024).
- E.U. Plans for Only Electric New Vehicles by 2035 ‘without Precedent’. Washington Post. 28 October 2022. Available online: https://www.washingtonpost.com/climate-solutions/2022/10/28/eu-electric-cars-2035/ (accessed on 7 May 2024).
- Shaping the Future of Fast-Charging EV Infrastructure. McKinsey and Company. 25 October 2021. Available online: https://www.mckinsey.com/capabilities/operations/our-insights/shaping-the-future-of-fast-charging-ev-infrastructure#/ (accessed on 10 May 2024).
- European Electric Vehicle Charging Infrastructure Masterplan. European Automobile Manufacturers’ Association. 28 March 2022. Available online: https://www.acea.auto/files/Research-Whitepaper-A-European-EV-Charging-Infrastructure-Masterplan.pdf (accessed on 10 May 2024).
- New Car Registrations, European Union. the European Automobile Manufacturers’ Association (ACEA). 20 February 2024. Available online: https://www.acea.auto/files/Press_release_car_registrations-January_2024.pdf (accessed on 12 March 2024).
- EU Formally Bans New ICE Vehicles, Aims to Slash Emissions from Trucks and Buses. Available online: https://electrek.co/2023/02/15/eu-bans-new-ice-vehicles-aims-to-slash-emissions-from-trucks-and-buses/ (accessed on 10 May 2024).
- Everything You Need to Know about the UK’s Switch to Electric. Electric Car Guide. Available online: https://electriccar.guide/transition-to-electric (accessed on 4 March 2024).
- European New-Car Market Could Need Decade to Recover, but Electric Cars Will Dominate. Available online: https://autovista24.autovistagroup.com/news/european-new-car-market-recover-but-electric-cars-will-dominate/ (accessed on 15 March 2024).
- Electric Vehicle (EV) and Fuel Cell Electric Vehicle (FCEV) Tax Credit. Available online: https://afdc.energy.gov/laws/409 (accessed on 15 March 2024).
- Bui, V. The Road to an Electric Vehicle Future. Department of Energy. 23 June 2023. Available online: https://www.energy.gov/articles/road-electric-vehicle-future (accessed on 21 March 2024).
- EY Research: Nearly Half of US Car Buyers Intend to Purchase an EV. Ernst & Young Global Limited, Americas. 27 June 2023. Available online: https://www.ey.com/en_us/news/2023/06/ey-research-nearly-half-of-us-car-buyers-intend-to-purchase-an-ev (accessed on 21 March 2024).
- Goodbye to Electric Cars in the US in 2024. Automakers Are Fed up and Want to Go Back to Combustion. La Grada (Spanish Agency). 13 February 2024. Available online: https://lagradaonline.com/en/electric-cars-usa-automakers-combustion/ (accessed on 23 April 2024).
- The EV Future—Prepare to Meet Growing Demand While You Still Can. Available online: https://www.urbanscience.com/evfuture/#:~:text=Both%20auto%20buyers%20and%20dealers%20recognize (accessed on 21 March 2024).
- US Automakers Race to Build More Hybrids as EV Sales Slow. Reuters. 15 March 2024. Available online: https://www.reuters.com/business/autos-transportation/us-automakers-race-build-more-hybrids-ev-sales-slow-2024-03-15/ (accessed on 20 March 2024).
- Zhou, G.; Ou, X.; Zhang, X. Development of electric vehicles use in China: A study from the perspective of life-cycle energy consumption and greenhouse gas emissions. Energy Policy 2013, 59, 875–884. [Google Scholar] [CrossRef]
- Sinocharged: The Bright Future of China’s Electric Vehicle Market (A special Report on Electrification). 2021 KPMG Huazhen LLP, a People’s Republic of China. Available online: https://assets.kpmg.com/content/dam/kpmg/cn/pdf/en/2021/01/2020-china-leading-autotech-50.pdf (accessed on 21 March 2024).
- IEA (2023), Global EV Outlook 2023, IEA, Paris. Available online: https://www.iea.org/reports/global-ev-outlook-2023 (accessed on 21 March 2024).
- China Unveils $72 Billion Tax Break for EVs, Other Green Cars to Spur Demand. Reuters. 21 June 2023. Available online: https://www.reuters.com/business/autos-transportation/china-announces-extension-purchase-tax-break-nevs-until-2027-2023-06-21/ (accessed on 18 March 2024).
- China Considers Extending Its EV Subsidies to 2023 (Updated). China Briefing. 27 June 2023. Available online: https://www.china-briefing.com/news/china-considers-extending-its-ev-subsidies-to-2023/ (accessed on 18 March 2024).
- EV Incentives in 2024: Europe, the US and China. Carvibz. 9 February 2024. Available online: https://www.carvibz.com/news/ev-incentives-in-2024-europe-the-us-and-china/#google_vignette (accessed on 15 March 2024).
- Liu, Y.; Zhao, X.; Lu, D.; Li, X. Impact of policy incentives on the adoption of electric vehicle in China. Transp. Res. Part A Policy Pract. 2023, 176, 103801. [Google Scholar] [CrossRef]
- Zhao, Y.; Jian, Z.; Du, Y. How can China’s subsidy promote the transition to electric vehicles? Renew. Sustain. Energy Rev. 2024, 189 Pt B, 114010. [Google Scholar] [CrossRef]
- China Vows to Help Its EV Champions Succeed Overseas despite Threats of Sanctions. CNN Business. 7 February 2024. Available online: https://edition.cnn.com/2024/02/07/cars/china-ev-global-push-intl-hnk/index.html (accessed on 17 March 2024).
- Shen, L.; Chen, Z.; Dou, X.; Xu, X.; Cao, Z.; Liao, S. Restricting factors for promoting electric vehicles: Evidence from China. Transp. Policy 2024, 148, 234–245. [Google Scholar] [CrossRef]
- Lin, C. 3 Drivers of China’s Booming Electric Vehicle Market. Harvard Business Review. 3 January 2024. Available online: https://hbr.org/2024/01/3-drivers-of-chinas-booming-electric-vehicle-market (accessed on 23 March 2024).
- The Automotive Market Is Changing. Can China Show Us the Future? World Economic Forum. 2 July 2021. Available online: https://www.weforum.org/agenda/2021/07/future-automative-market-china/ (accessed on 19 March 2024).
- Das, P.K.; Bhat, M.Y. Global electric vehicle adoption: Implementation and policy implications for India. Environ Sci. Pollut. Res. 2022, 29, 40612–40622. [Google Scholar] [CrossRef]
- Government’s EV Policies Driving India’s Green Revolution. In Invest India; 9 September 2023. Available online: https://www.investindia.gov.in/team-india-blogs/governments-ev-policies-driving-indias-green-revolution (accessed on 24 March 2024).
- Total 22717562 Vehicles Registered during 2023 Including Electric, Petrol and Diesel Vehicles. Ministry of Heavy Industries, Government of India. 18 December 2023. Available online: https://pib.gov.in/PressReleaseIframePage.aspx?PRID=1987802 (accessed on 18 March 2024).
- Ministry of Heavy Industries, India. 13 March 2024. Available online: https://pib.gov.in/PressReleaseIframePage.aspx?PRID=2014366 (accessed on 18 March 2024).
- Electric Vehicle Plans of Indian Automakers. Reuters. 16 March 2024. Available online: https://www.reuters.com/business/autos-transportation/electric-vehicle-plans-indian-automakers-2024-03-15/ (accessed on 19 March 2024).
- Electric Vehicle Incentives. NITI AAYOG, Government of India. Available online: https://e-amrit.niti.gov.in/electric-vehicle-incentives (accessed on 18 March 2024).
- The History of the Electric Car. Department of Energy, USA. 15 September 2014. Available online: https://www.energy.gov/articles/history-electric-car (accessed on 20 April 2024).
- H.R.776—Energy Policy Act of 1992, 102nd Congress (1991–1992) (PUBLIC LAW 102-486—OCT. 24, 1992. 106 STAT. 2776). Available online: https://www.congress.gov/bill/102nd-congress/house-bill/776/text (accessed on 20 April 2024).
- Tucker, S. EV Sales Broke Records in First Quarter of 2023. 04/12/2023. Available online: https://www.kbb.com/car-news/ev-sales-broke-records-in-first-quarter-of-2023/ (accessed on 18 April 2024).
- Randall, T. Electric Cars Pass a Crucial Tipping Point in 23 Countries. Bloomberg. 28 August 2023. Available online: https://www.bloomberg.com/news/articles/2023-08-28/electric-cars-pass-a-crucial-tipping-point-in-23-countries (accessed on 21 April 2024).
- Anderson, B. EVs Account for 7.2% of New Car Sales in the U.S. Between January and July. Carcoops. 17 September 2023. Available online: https://www.carscoops.com/2023/09/evs-accounted-for-7-2-of-all-new-car-sales-in-the-u-s-between-january-and-july/ (accessed on 21 April 2024).
- The EV Era: Decoding Trends and Triumphs in America’s Auto Industry. Available online: https://www.urbanscience.com/insightlab/the-ev-era-decoding-trends-and-triumps-in-americas-auto-industry/ (accessed on 18 April 2024).
- Electric Vehicles—Worldwide, Statista Market Insights; Statista Inc.: New York, NY, USA, February 2024; Available online: https://www.statista.com/outlook/mmo/electric-vehicles/worldwide (accessed on 20 April 2024).
- Global Electric Vehicle Market, Size, Forecast 2024–2030, Industry Trends, Share, Growth, Insight, Impact of Inflation, Company Analysis. Research and Markets (Dublin Ireland) Report. January 2024. Available online: https://www.researchandmarkets.com/reports/5923627/global-electric-vehicle-market-size?utm_source=GNE&utm_medium=PressRelease&utm_code=76cgfv&utm_campaign=1941047+-+Global+Electric+Vehicle+Market%2c+Size%2c+Forecast+Report+2024-2030%3a++Industry+Tren (accessed on 20 April 2024).
- Global EV Outlook 2023. International Energy Agency, France. Pages 115–118. Available online: https://iea.blob.core.windows.net/assets/dacf14d2-eabc-498a-8263-9f97fd5dc327/GEVO2023.pdf (accessed on 19 March 2024).
- Electric Vehicle Market by Component, Vehicle Type, Vehicle Class, Propulsion (BEV, PHEV, FCEV), Vehicle Drive Type (FWD, RWD, AWD), Vehicle Top Speed (<125 mph, >125 mph), Charging Point Type, Vehicle Connectivity, End Use, Region—Global Forecast 2030. Markets and Markets Research Private Ltd. July 2023. Available online: https://www.marketsandmarkets.com/Market-Reports/electric-vehicle-market-209371461.html (accessed on 22 April 2024).
- Electric Vehicle Market Size, Share, Competitive Landscape and Trend Analysis Report by Type, Vehicle Type, Vehicle Class, Top Speed and Vehicle Drive Type: Global Opportunity Analysis and Industry Forecast, 2021–2030. Allied Market Research, Delaware, USA. January 2022. Available online: https://www.alliedmarketresearch.com/electric-vehicle-market (accessed on 22 April 2024).
- Electric Vehicle Market, Report ID: FBI101678, Updated 1 April 2024. Fortune Business Insights Pvt. Ltd. Pune-411045, Maharashtra, India. Available online: https://www.fortunebusinessinsights.com/industry-reports/electric-vehicle-market-101678 (accessed on 15 May 2024).
- Walz, E. EVs Could Reach 86% of Global Vehicle Sales by 2030. Automotive Dive, Washington, DC, USA. 2 October 2023. Available online: https://www.automotivedive.com/news/evs-reach-86-percent-global-vehicle-sales-2030/695319/ (accessed on 22 April 2024).
- X-Change: Cars, RMI Colorado USA 2023. Available online: https://rmi.org/insight/x-change-cars/ (accessed on 22 April 2024).
- Global Electric Vehicles (EVs) Market Analysis—Trends, Insights and Forecast (2022–2030). Global Industry Reports (US), Inc. 17 September 2023. Available online: https://globalindustryreports.com/ev/ (accessed on 21 April 2024).
- Kane, M. Norwegians Replaced a Fifth of Their Cars with All-Electric Ones. InsideEVs, New York, USA. 1 January 2023. Available online: https://insideevs.com/news/628846/norway-fifth-car-fleet-electric/ (accessed on 22 April 2024).
- A Record 1.2 Million EVs Were Sold in the U.S. in 2023, According to Estimates from Kelley Blue Book. Cox Automotive Company, USA. 9 January 2024. Available online: https://www.coxautoinc.com/market-insights/q4-2023-ev-sales/#:~:text=More%20specifically%2C%201%2C189%2C051%20new%20electric%20vehicles%20%28EVs%29%20were,estimates.%20That%20is%20up%20from%205.9%25%20in%202022 (accessed on 22 April 2024).
- Randall, C. Norway Saw 4,717 New Electric Cars in January 2024. 2 February 2024. Available online: https://www.electrive.com/2024/02/02/norway-saw-4717-new-electric-cars-in-january-2024/ (accessed on 20 March 2024).
- Bello, C. Europe’s Electric Future: How Norway Came to Lead the Charge in the EV Revolution. Euro News. 31 May 2023. Available online: https://www.euronews.com/next/2023/05/31/europes-electric-future-how-norway-came-to-lead-the-charge-in-the-ev-revolution (accessed on 22 April 2024).
- Electricity, Statistic Norway. 28 February 2024. Available online: https://www.ssb.no/en/energi-og-industri/energi/statistikk/elektrisitet (accessed on 2 March 2024).
- Bu, C. What Norway Can Teach the World about Switching to Electric Vehicles. TIME. 7 January 2022. Available online: https://time.com/6133180/norway-electric-vehicles/ (accessed on 3 March 2024).
- Norway’s Evolving Incentives for Zero-Emission Vehicles. International Programme for Action on Climate. Policies in Practice. OECD 7 November 2022. Available online: https://www.oecd.org/en/publications/2021/09/ipac-policies-in-practice_1a65968e/norway-s-evolving-incentives-for-zero-emission-vehicles_c74c1e9d.html#:~:text=In%202021,%20about%20two-thirds%20of%20new (accessed on 3 March 2024).
- Carlier, M. Number of Electric Car Charging Stations in Norway by Type 2011–2022. Statista. 12 September 2023. Available online: https://www.statista.com/statistics/696548/number-of-electric-car-charging-stations-in-norway-by-type/ (accessed on 3 March 2024).
- National Charging Strategy. Norwegian Ministry of Transport. Available online: https://www.regjeringen.no/contentassets/26d4c472862342b69e8d49803b45c36a/en-gb/pdfs/national-charging-strategy.pdf (accessed on 24 April 2024).
- National Transport Plan 2018–2029. Meld. St. 33 (2016–2017) Report to the Storting (White Paper), Norwegian Ministry of Transport and Communications. Available online: https://www.regjeringen.no/contentassets/7c52fd2938ca42209e4286fe86bb28bd/en-gb/pdfs/stm201620170033000engpdfs.pdf (accessed on 24 April 2024).
- Our Charging Network. Fortum Charge & Drive. Available online: https://chargedrive.com/partners (accessed on 25 April 2024).
- Sustainability Report 2022. Mer, Norway. Available online: https://no.mer.eco/wp-content/uploads/sites/6/2023/11/Sustainability_Report_2022.pdf (accessed on 25 April 2024).
- Hoen, F.S.; Díez-Gutiérrez, M.; Babri, S.; Hess, S.; Tørset, T. Charging electric vehicles on long trips and the willingness to pay to reduce waiting for charging. Stated preference survey in Norway. Transp. Res. Part A Policy Pract. 2023, 175, 103774. [Google Scholar] [CrossRef]
- Wangsness, P.B.; Figenbaum, E. Norwegian Center for Transport Research, Institute of Transport Economics, Oslo 2022. TØI Report 1867/2022. Available online: https://www.toi.no/getfile.php/1373853-1664456499/Publikasjoner/T%C3%98I%20rapporter/2022/1867-2022/1867-Summary.pdf (accessed on 23 April 2024).
- Revving up for A Green Future: Mapping India’s EV Landscape & Progress. Inc42, 22 April 2023. Available online: https://inc42.com/features/revving-up-for-a-green-future-mapping-india-ev-landscape-progress/ (accessed on 24 March 2024).
- Dutt, D. Exploring multi-level interactions in electric vehicle niche evolution in India. Transp. Res. Part D Transp. Environ. 2023, 114, 103538. [Google Scholar] [CrossRef]
- Barman, P.; Dutta, L. Charging infrastructure planning for transportation electrification in India: A review. Renew. Sustain. Energy Rev. 2024, 192, 114265. [Google Scholar] [CrossRef]
- Electric Mobility. Bureau of Energy Efficiency, Ministry of Power. Available online: https://beeindia.gov.in/en/electric-mobility (accessed on 11 May 2024).
- India’s Electric Mobility Transformation: Progress to Date and Future Opportunities. NITI Aayog and Rocky Mountain Institute (RMI). 2019. Available online: https://e-amrit.niti.gov.in/assets/admin/dist/img/new-fronend-img/report-pdf/rmi-niti-ev-report.pdf (accessed on 19 March 2024).
- The Future of Mobility: Transforming to be Ahead of the Opportunity. McKinsey & Company, 2022 Report. Available online: https://www.mckinsey.com/~/media/mckinsey/industries/automotive%20and%20assembly/our%20insights/the%20future%20of%20mobility%20transforming%20to%20be%20ahead%20of%20the%20opportunity/the-future-of-mobility-transforming-to-be-ahead-of-the-opportunity (accessed on 6 March 2024).
- India’s Electric Vehicle Sales Trend, February 2024. EVreporter. 4 March 2024. Available online: https://evreporter.com/indias-electric-vehicle-sales-trend-february-2024/ (accessed on 15 February 2024).
- India Electric Vehicle Report 2023. Bain & Company, Inc. Available online: https://www.bain.com/globalassets/noindex/2023/bain_report_india_electric_vehicle_report_2023.pdf (accessed on 6 March 2024).
- 12146 Public EV Charging Stations Operational across the Country. Ministry of Heavy Industries. Available online: https://pib.gov.in/PressReleaseIframePage.aspx?PRID=2003003 (accessed on 17 April 2024).
- Inoperational, Vandalised & Broken—India’s Raging EV Charging Infra Crisis. Fortune India. 11 September 2023. Available online: https://www.fortuneindia.com/enterprise/inoperational-vandalised-broken-indias-raging-ev-charging-infra-crisis/114070 (accessed on 15 February 2024).
- The Future of Mobility in India Is Electric. Deloitte Global Automotive Consumer Study 2022. Available online: https://www2.deloitte.com/in/en/pages/consumer-business/articles/the-future-of-mobility-in-India-is-electric.htm (accessed on 6 March 2024).
- Bharadwaj, R. The Future of Electric Vehicles in India: Opportunities and Challenges. Bolt. Earth, Bangalore, India. 10 February 2023. Available online: https://bolt.earth/blog/future-electric-vehicles-india (accessed on 20 February 2024).
- Goel, S.; Sharma, R.; Rathore, A.K. A review on barrier and challenges of electric vehicle in India and vehicle to grid optimization. Transp. Eng. 2021, 4, 100057. [Google Scholar] [CrossRef]
- Michael, L.K.; Sriram, K.V.; Hungund, S.S.; Fernandes, M. Factors influencing adoption of electric vehicles—A case in India. Cogent Eng. 2022, 9, 2085375. [Google Scholar] [CrossRef]
- New-Vehicle Average Transaction Prices Retreat for Second Straight Month, According to Latest Kelley Blue Book Estimates. Cox Automotive Inc. 11 March 2024. Available online: https://www.coxautoinc.com/market-insights/kbb-atp-february-2024/ (accessed on 29 April 2024).
- The Average Price of an Electric Car Keeps Dropping (2024 Update). CarEdge. 22 February 2024. Available online: https://caredge.com/guides/average-price-of-an-electric-car-2024 (accessed on 15 February 2024).
- Bureau of Transportation Statistics. Available online: https://www.bts.gov/statistical-products/surveys/national-household-travel-survey-daily-travel-quick-facts (accessed on 15 February 2024).
- Car and Driver, Ann Arbor, MI, USA. Available online: https://www.caranddriver.com/tesla/model-3 (accessed on 20 February 2024).
- Impact Report, Tesla. 2019. Available online: https://www.tesla.com/ns_videos/2019-tesla-impact-report.pdf (accessed on 4 May 2024).
- China EVs DataBase. Available online: https://db.carnewschina.com/ (accessed on 18 April 2024).
- Cheng, E. BYD’s Five Best-Selling Cars, Including One Edging out Tesla’s Model Y in China. 4 January 2024. Available online: https://www.cnbc.com/2024/01/05/byds-best-selling-china-evs-including-one-edging-out-teslas-model-y.html#:~:text=BYD%E2%80%99s%20five%20best-selling%20cars%2C%20including%20one%20edging%20out,4.%20Yuan%20Plus%20...%205%205.%20Dolphin%20 (accessed on 20 March 2024).
- Yang, Z. How Did China Come to Dominate the World of Electric Cars? MIT Technology Review. 21 February 2023. Available online: https://www.technologyreview.com/2023/02/21/1068880/how-did-china-dominate-electric-cars-policy/ (accessed on 1 May 2024).
- Bryant, J. CATL Leads Global EV Battery Market with 36.8% in 2023, BYD Follows with 15.8%: SNE Research. EVMGZ, Jakarta, Indonesia. 8 February 2024. Available online: https://evmagz.com/catl-leads-global-ev-battery-market-with-36-8-in-2023-byd-follows-with-15-8-sne-research/ (accessed on 15 March 2024).
- Battery Price War: CATL, BYD Pushing Battery Costs down Further. CnEVPost 17 January 2024. Available online: https://autotech.news/catl-byd-pushing-battery-costs-down-further/#:~:text=Meanwhile%2C%20BYD%20%E2%80%98s%20%28OTCMKTS%3A%20BYDDF%29%20battery%20unit%20FinDreams,huge%2C%20the%20report%20said%2C%20citing%20the%20internal%20notice (accessed on 20 March 2024).
- An Update on BYD Company and Its Blade Battery. Available online: https://seekingalpha.com/article/4399502-update-on-byd-company-and-blade-battery (accessed on 20 March 2024).
- Maria Guerra. BNEF 2023 Battery Survey: Key Takeaways Unveiled. Battery Technology. Available online: https://www.batterytechonline.com/lithium-ion-batteries/bnef-2023-battery-survey-key-takeaways-unveiled (accessed on 17 April 2024).
- Lithium-Ion Battery Price Worldwide from 2013 to 2023. Statista Research Department. 8 December 2023. Available online: https://www.statista.com/statistics/883118/global-lithium-ion-battery-pack-costs/ (accessed on 15 March 2024).
- U.S. Department of Energy, Vehicle Technologies Office. FOTW #1272, January 9, 2023: Electric Vehicle Battery Pack Costs in 2022 Are Nearly 90% Lower than in 2008, According to DOE Estimates. Department of Energy. Available online: https://www.energy.gov/eere/vehicles/articles/fotw-1272-january-9-2023-electric-vehicle-battery-pack-costs-2022-are-nearly#:~:text=The%20Department%20of%20Energy%E2%80%99s%20%28DOE%E2%80%99s%29%20Vehicle%20Technologies%20Office,per%20year.%20That%20c (accessed on 12 May 2024).
- Toyota Unveils New Technology That Will Change the Future of Cars. Toyota Technical Workshop, Toyota City, Japan. 13 June 2023. Available online: https://global.toyota/en/newsroom/corporate/39288520.html#kato (accessed on 28 March 2024).
- Wittek, R. A Battery Price War Is Kicking off That Could Soon Make Electric Cars Cheaper. Here’s How. The Conversation. 20 March 2024. Available online: https://theconversation.com/a-battery-price-war-is-kicking-off-that-could-soon-make-electric-cars-cheaper-heres-how-225165 (accessed on 30 March 2024).
- Used Electric Car Prices & Market Report—Q2 2024. 2 April 2024. Available online: https://www.recurrentauto.com/research/used-electric-vehicle-buying-report (accessed on 26 April 2024).
- Kothari, S. Used EVs Are Facing 33% Price Drop, Longer Selling Times: Report. InsideEVs. 28 November 2023. Available online: https://insideevs.com/news/698351/used-ev-prices-drop-sales-take-longer/ (accessed on 30 March 2024).
- Hull, R. Electric Car Values Plunge: Falling Demand Sees Used Tesla, Jaguar and Audi EV Prices Crash by up to 30%—These Are the Biggest Fallers (and Risers) in March. This Is Money, Derry Street, London, UK. 5 April 2023. Available online: https://www.thisismoney.co.uk/money/electriccars/article-11933267/Used-electric-car-prices-plunge-March-EVs-30.html (accessed on 29 April 2024).
- EVs Hit Range Limit as Hybrids Spark Demand. ISEECARS, Boston, U.S. 27 November 2023. EVs Hit Range Limit as Hybrids Spark Demand. Available online: https://www.iseecars.com/ (accessed on 29 April 2024).
- Autotrader, Atlanta, GA, USA. Available online: https://www.autotrader.com/cars-for-sale/all-cars (accessed on 27 April 2024).
- Schloter, L. Empirical analysis of the depreciation of electric vehicles compared to gasoline vehicles. Transp. Policy 2022, 126, 268–279. [Google Scholar] [CrossRef]
- AutoCango, Shanghai, China. Available online: https://autocango.com/ (accessed on 27 April 2024).
- Subashini, M.; Vijayan, S. Smart Charging for Zero Emission Vehicles—A Comprehensive Review. Renew. Energy Focus 2023, 46, 57–67. [Google Scholar] [CrossRef]
- Innovation Landscape Brief: Electric-Vehicle Smart Charging, International Renewable Energy Agency, (IRENA) 2019, Abu Dhabi. Available online: https://www.irena.org/-/media/Files/IRENA/Agency/Publication/2019/Sep/IRENA_EV_smart_charging_2019.pdf?la=en&hash=E77FAB7422226D29931E8469698C709EFC13EDB2 (accessed on 20 March 2024).
- Schneider, J.; Carlson, R.; Sirota, J.; Sutton, R.; Taha, E.; Kesler, M.; Kamichi, K.; Teerlinck, I.; Abeta, H.; Minagawa, Y.; et al. Validation of Wireless Power Transfer up to 11 kW Based on SAE J2954 with Bench and Vehicle Testing; Society of Automotive Engineers (SAE) Technical Paper 2019-01-0868; Society of Automotive Engineers: Warrendale, PA, USA, 2019. [Google Scholar] [CrossRef]
- Shuttleworth, J. New SAE Wireless Charging Standard Is EV Game-Changer; Society of Automotive Engineers: Warrendale, PA, USA, 2020; Available online: https://www.sae.org/news/2020/10/new-sae-wireless-charging-standard-is-ev-game-changer (accessed on 30 March 2024).
- Alake, T. Wireless Charging for Electric Cars Is Inching Closer to Reality. Bloomberg. 20 February 2024. Available online: https://www.bloomberg.com/news/articles/2024-02-20/wireless-charging-for-electric-cars-is-inching-closer-to-reality (accessed on 28 March 2024).
- Mainland China Will Continue to Dominate EV Charging Infrastructure Globally. BMI, a Fitch Solutions Company, London, UK. 21 February 2024. Available online: https://www.fitchsolutions.com/bmi/infrastructure/mainland-china-will-continue-dominate-ev-charging-infrastructure-globally-21-02-2024 (accessed on 27 March 2024).
- Cui, H.; Ma, R.; Liu, Y.; Yu, R.; Peng, X.; Zhang, J. Charging up China’s Transition to Electric Vehicles. International Council on Clean Transportation, Washington, DC, USA. January 2024. Available online: https://theicct.org/wp-content/uploads/2024/01/ID-93-%E2%80%93-China-charging-Report-A4-70131-v726.pdf (accessed on 27 March 2024).
- By the End of 2023, My Country Has Built a Total of 8.596 Million Charging Infrastructure Units. Teller Report. 18 March 2024. Available online: https://www.tellerreport.com/business/2024-03-18-by-the-end-of-2023--my-country-has-built-a-total-of-8-596-million-charging-infrastructure-units.rJmuh-mSCT.html (accessed on 30 April 2024).
- Zhang, P. Nio’s Charging Map Now Accesses over 1 Million 3rd-Party Chargers. CNEVPOST, Shanghai, China. 18 February 2024. Available online: https://cnevpost.com/2024/02/18/nio-charging-map-1-million-3rd-party-chargers/ (accessed on 30 March 2024).
- He, H.; Sun, F.; Wang, Z.; Lin, C.; Zhang, C.; Xiong, R.; Deng, J.; Zhu, X.; Xie, P.; Zhang, S.; et al. China’s battery electric vehicles lead the world: Achievements in technology system architecture and technological breakthroughs. Green Energy Intell. Transp. 2022, 1, 100020. [Google Scholar] [CrossRef]
- High-Quality Charging Anywhere|Huawei Releases Top 10 Trends of Charging Network 2024. Huawei, Shenzhen, China. 30 January 2024. Available online: https://digitalpower.huawei.com/en/activity/news/detail/2173.html (accessed on 15 March 2024).
- Yuelong, Y. Huawei’s Smart Electric & Smart Charging Network Strategy and New Product Launch Conference Was Held. Laitimes. 25 April 2024. Available online: https://www.laitimes.com/en/article/6my1n_73ac9.html (accessed on 30 April 2024).
- Fujioka, K. Japan to Relax Rules on Fast EV Chargers, Jump-Starting Rollout. Nikkei Asia. 4 January 2023. Available online: https://asia.nikkei.com/Business/Automobiles/Japan-to-relax-rules-on-fast-EV-chargers-jump-starting-rollout (accessed on 27 March 2024).
- Park, K.; Jang, D.; Kim, S.; Lim, Y.; Lee, J. A Grid-Friendly Electric Vehicle Infrastructure: The Korean Approach. IEEE Power Energy Mag. 2023, 21, 28–37. [Google Scholar] [CrossRef]
- Electric Vehicle Charging Station Market Size & Share Analysis—Growth Trends & Forecasts (2024–2029). Mordor Intelligence, Hyderabad, Telangana—India. Available online: https://www.mordorintelligence.com/industry-reports/electric-vehicles-charging-stations-market (accessed on 28 March 2024).
- Afridi, K. The future of electric vehicle charging infrastructure. Nat. Electron. 2022, 5, 62–64. [Google Scholar] [CrossRef]
- Baldwin, S. The United States’ Electric Vehicle Market Is (Finally) on the Move. Forbes. 12 June 2023. Available online: https://www.forbes.com/sites/energyinnovation/2023/06/12/the-united-states-electric-vehicle-market-is-finally-on-the-move/?sh=545c7e6b3a61 (accessed on 28 March 2024).
- FOTW #1335, March 25, 2024: Level 1 and Level 2 EV Charging Is Expected to Account for 80% of All EV Charging in 2030. 25 March 2024. Available online: https://www.energy.gov/eere/vehicles/articles/fotw-1335-march-25-2024-level-1-and-level-2-ev-charging-expected-account-80 (accessed on 15 May 2024).
- Baumann-Pauly, D. Cobalt Mining in the Democratic Republic of the Congo: Addressing Root Causes of Human Rights Abuses. White Paper, NYU Stern Center for Business and Human. February 2023. Available online: https://gcbhr.org/backoffice/resources/cobalt-mining-drcroot-causes.pdf (accessed on 15 March 2024).
- Doyle, K. Electric Vehicles Are Less Reliable Than Conventional Cars. Annual Car Reliability Survey by Consumer Reports, New York. 29 November 2023. Available online: https://www.consumerreports.org/cars/car-reliability-owner-satisfaction/electric-vehicles-are-less-reliable-than-conventional-cars-a1047214174/ (accessed on 15 March 2024).
- Valdes-Dapena, P. Electric Cars Are Having More Problems, but Not Because They’re Electric. CNN. 4 December 2023. Available online: https://edition.cnn.com/2023/12/04/business/electric-cars-have-more-problems-but-not-because-theyre-electric/index.html (accessed on 2 May 2024).
- Spencer, A.; Ross, S.; Tyson, A. How Americans View Electric Vehicles. Pew Research Center, Washington, DC, USA. 13 July 2023. Available online: https://www.pewresearch.org/short-reads/2023/07/13/how-americans-view-electric-vehicles/ (accessed on 3 May 2024).
- The Biggest Problem with Electric Vehicle Adoption. Available online: https://www.msn.com/en-us/autos/news/the-biggest-problem-with-electric-vehicle-adoption/ar-BB1ho42Q (accessed on 15 March 2024).
- 13 Dirty Truths About Electric Cars Everyone Should Know. 28 January 2024. Available online: https://www.msn.com/en-us/money/other/13-dirty-truths-about-electric-cars-everyone-should-know/ss-BB1iwj1K (accessed on 18 March 2024).
- National Grid Group, UK. Busting the Myths and Misconceptions about Electric Vehicles. Available online: https://www.nationalgrid.com/stories/journey-to-net-zero/electric-vehicles-myths-misconceptions (accessed on 3 May 2024).
- Enyedi, S. Electric cars—Challenges and trends. In Proceedings of the 2018 IEEE International Conference on Automation, Quality and Testing, Robotics (AQTR), Cluj-Napoca, Romania, 26–24 May 2018; pp. 1–8. [Google Scholar] [CrossRef]
- Failures of Electronic Systems and Elements in Electric Vehicles and Guidelines for Reducing Their Intensity. In Proceedings of the 2019 Applications of Electromagnetics in Modern Engineering and Medicine (PTZE), Janow Podlaski, Poland, 9–12 June 2019; pp. 38–41. [CrossRef]
- Shaffer, B.; Auffhammer, M.; Samaras, C. Make electric vehicles lighter to maximize climate and safety benefits. Nature 2021, 598, 254–256. [Google Scholar] [CrossRef]
- Is Electric Vehicle Ownership Partisan? Three Graphics Show What We Know. 21 February 2024. Available online: https://www.msn.com/en-us/news/politics/is-electric-vehicle-ownership-partisan-three-graphics-show-what-we-know/ar-BB1iDIRA (accessed on 15 May 2024).
- Home Charging Access in California. California Energy Commission. Report CEC-600-2022-021. January 2022. Available online: https://www.energy.ca.gov/sites/default/files/2022-01/CEC-600-2022-021.pdf (accessed on 15 May 2024).
- Electric Vehicle Sector Faces Market Headwinds Amid Surge in Adoption. 18 February 2024. Available online: https://www.forbes.com/sites/danirvine/2024/02/18/electric-vehicle-sector-faces-market-headwinds-amid-surge-in-adoption/?sh=626c152051b9 (accessed on 30 March 2024).
- Current Climate Makes It ‘Almost Impossible’ to Get Private Buyers into Electric Cars—Fiat Boss. Car Dealer Magazines. 1 March 2024. Available online: https://cardealermagazine.co.uk/publish/current-climate-makes-it-almost-impossible-to-get-private-buyers-into-electric-cars-fiat-boss/298415 (accessed on 30 March 2024).
- More, U.S. More U.S. Auto Buyers Are Turning to Hybrids as Sales of Electric Vehicles Slow. PBS NewsHour. 21 December 2023. Available online: https://www.pbs.org/newshour/politics/more-u-s-auto-buyers-are-turning-to-hybrids-as-sales-of-electric-vehicles-slow (accessed on 30 March 2024).
- Why EV Sales Are Falling. CNBC Marathon. Recall, Amsterdam, The Netherlands. 3 March 2024. Available online: https://www.getrecall.ai/summary/cnbc/why-ev-sales-are-falling-or-cnbc-marathon (accessed on 19 April 2024).
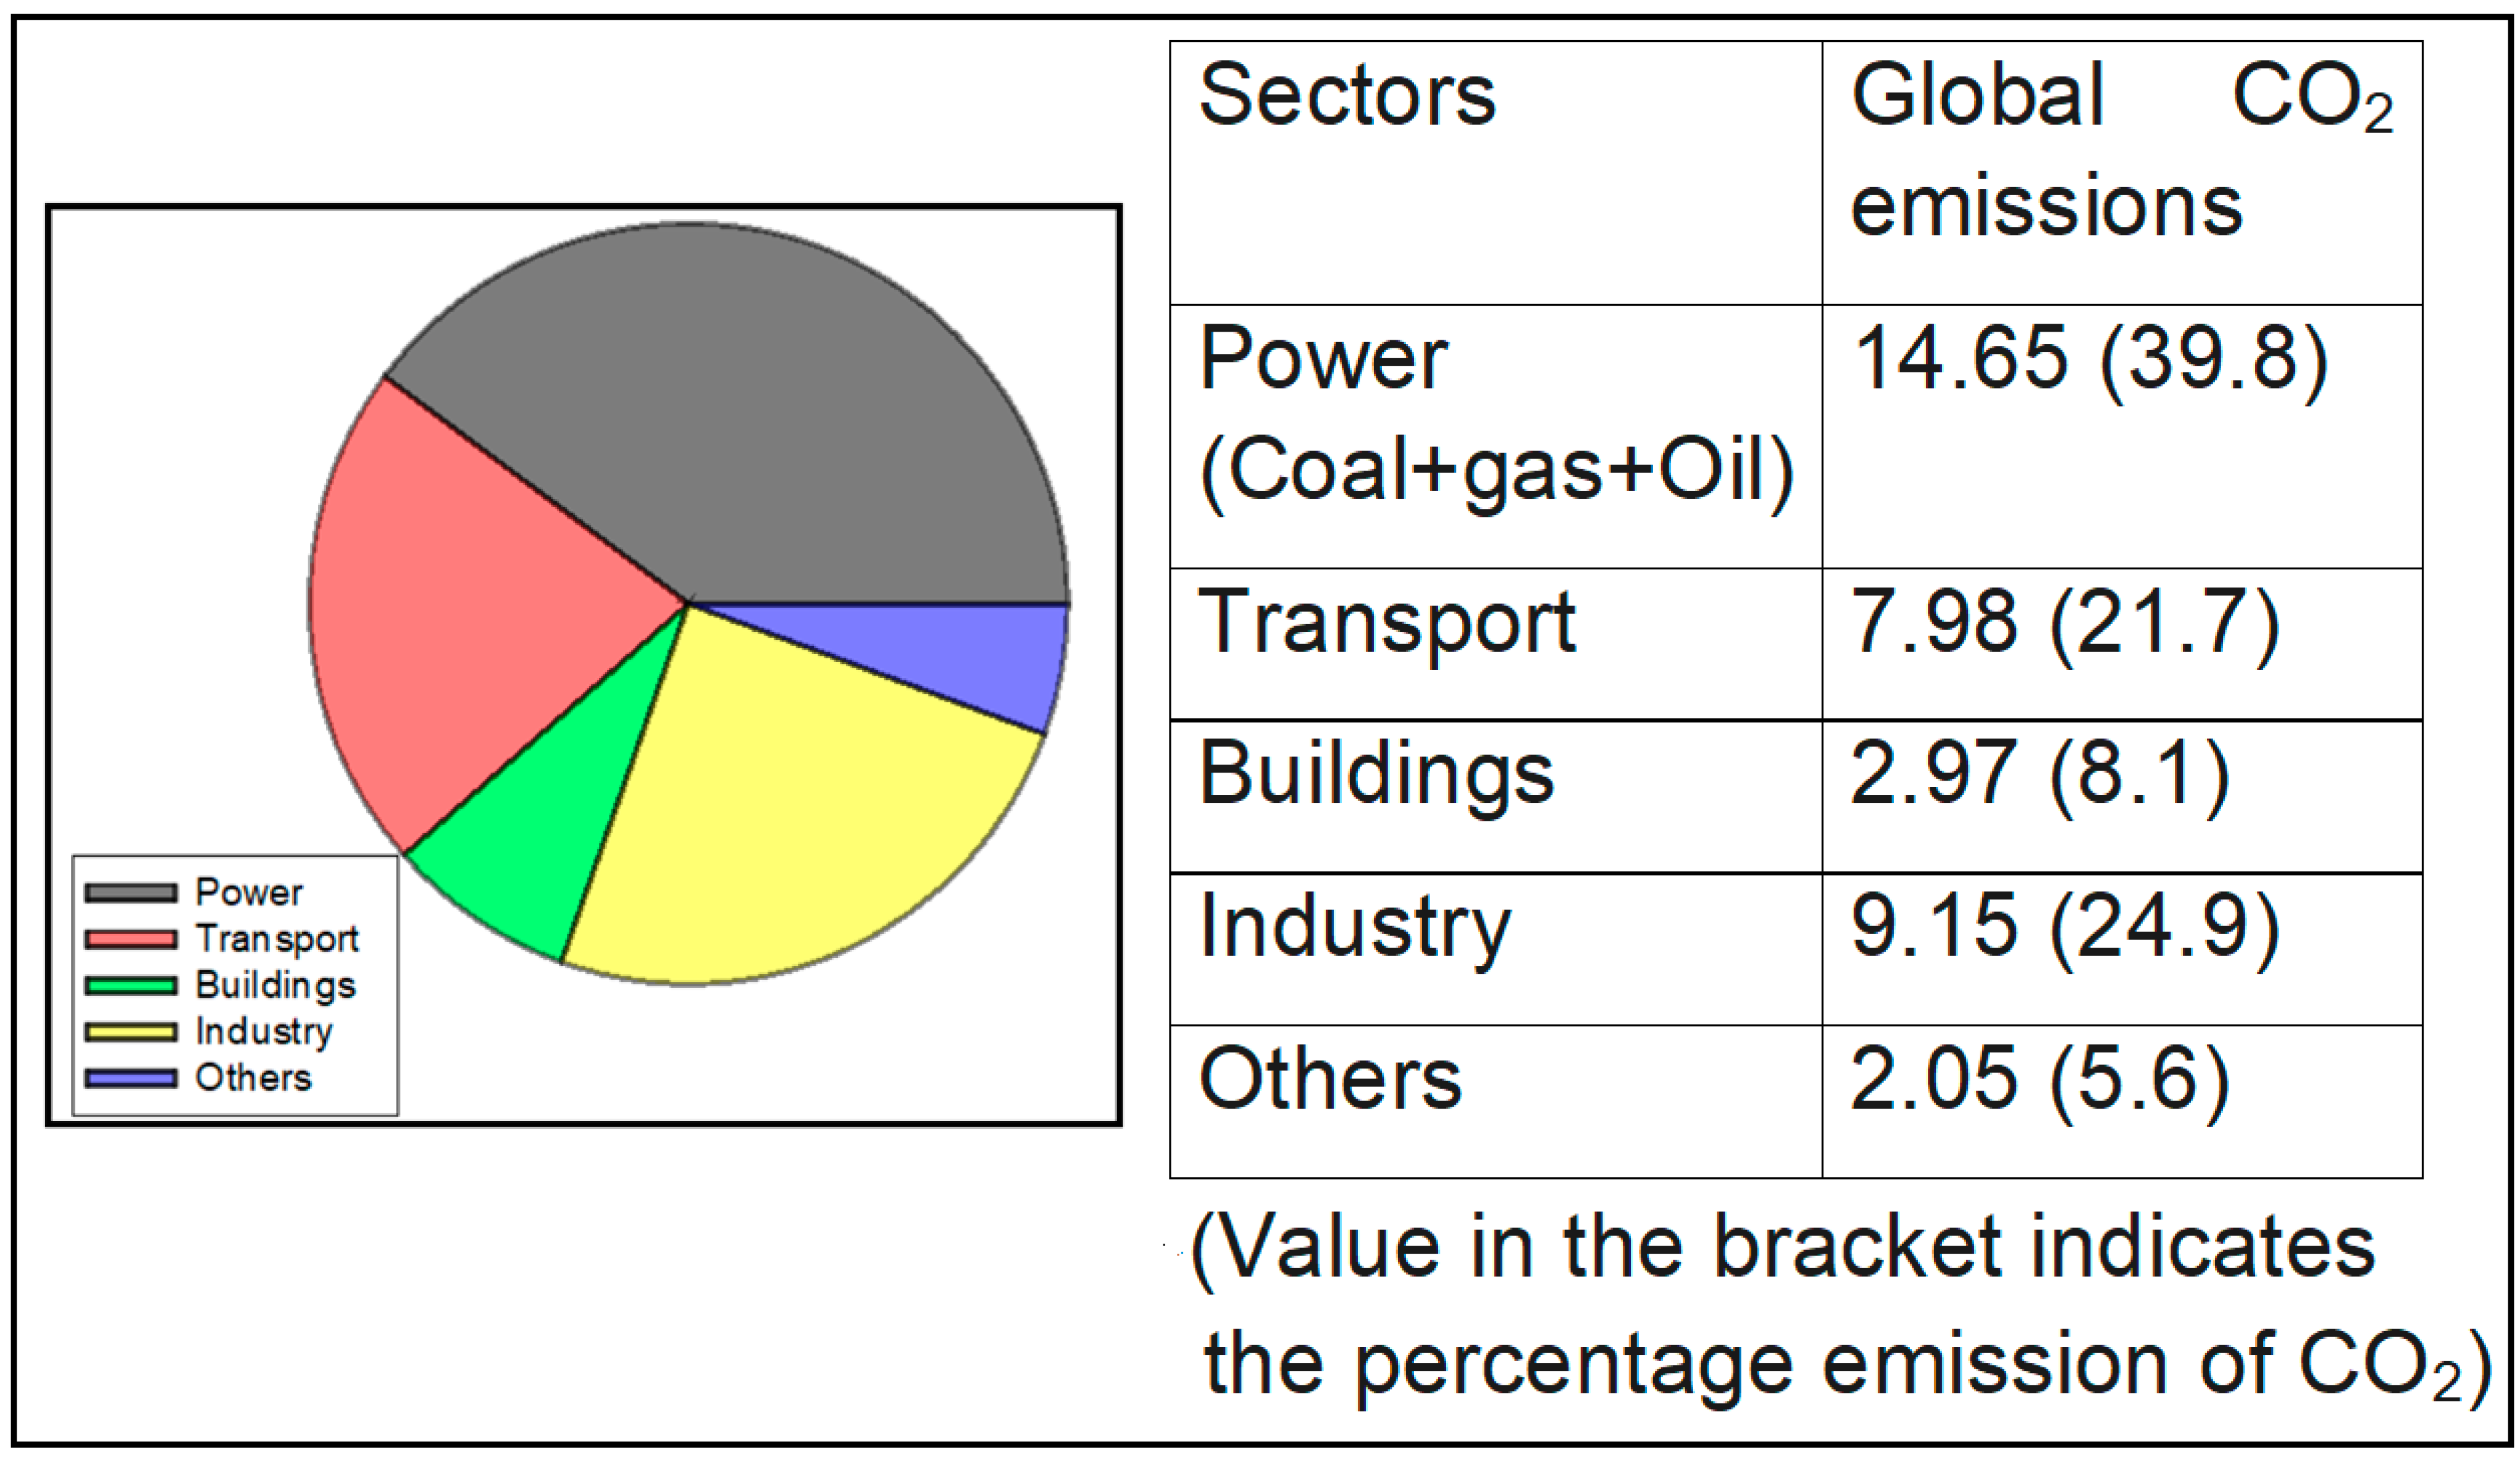

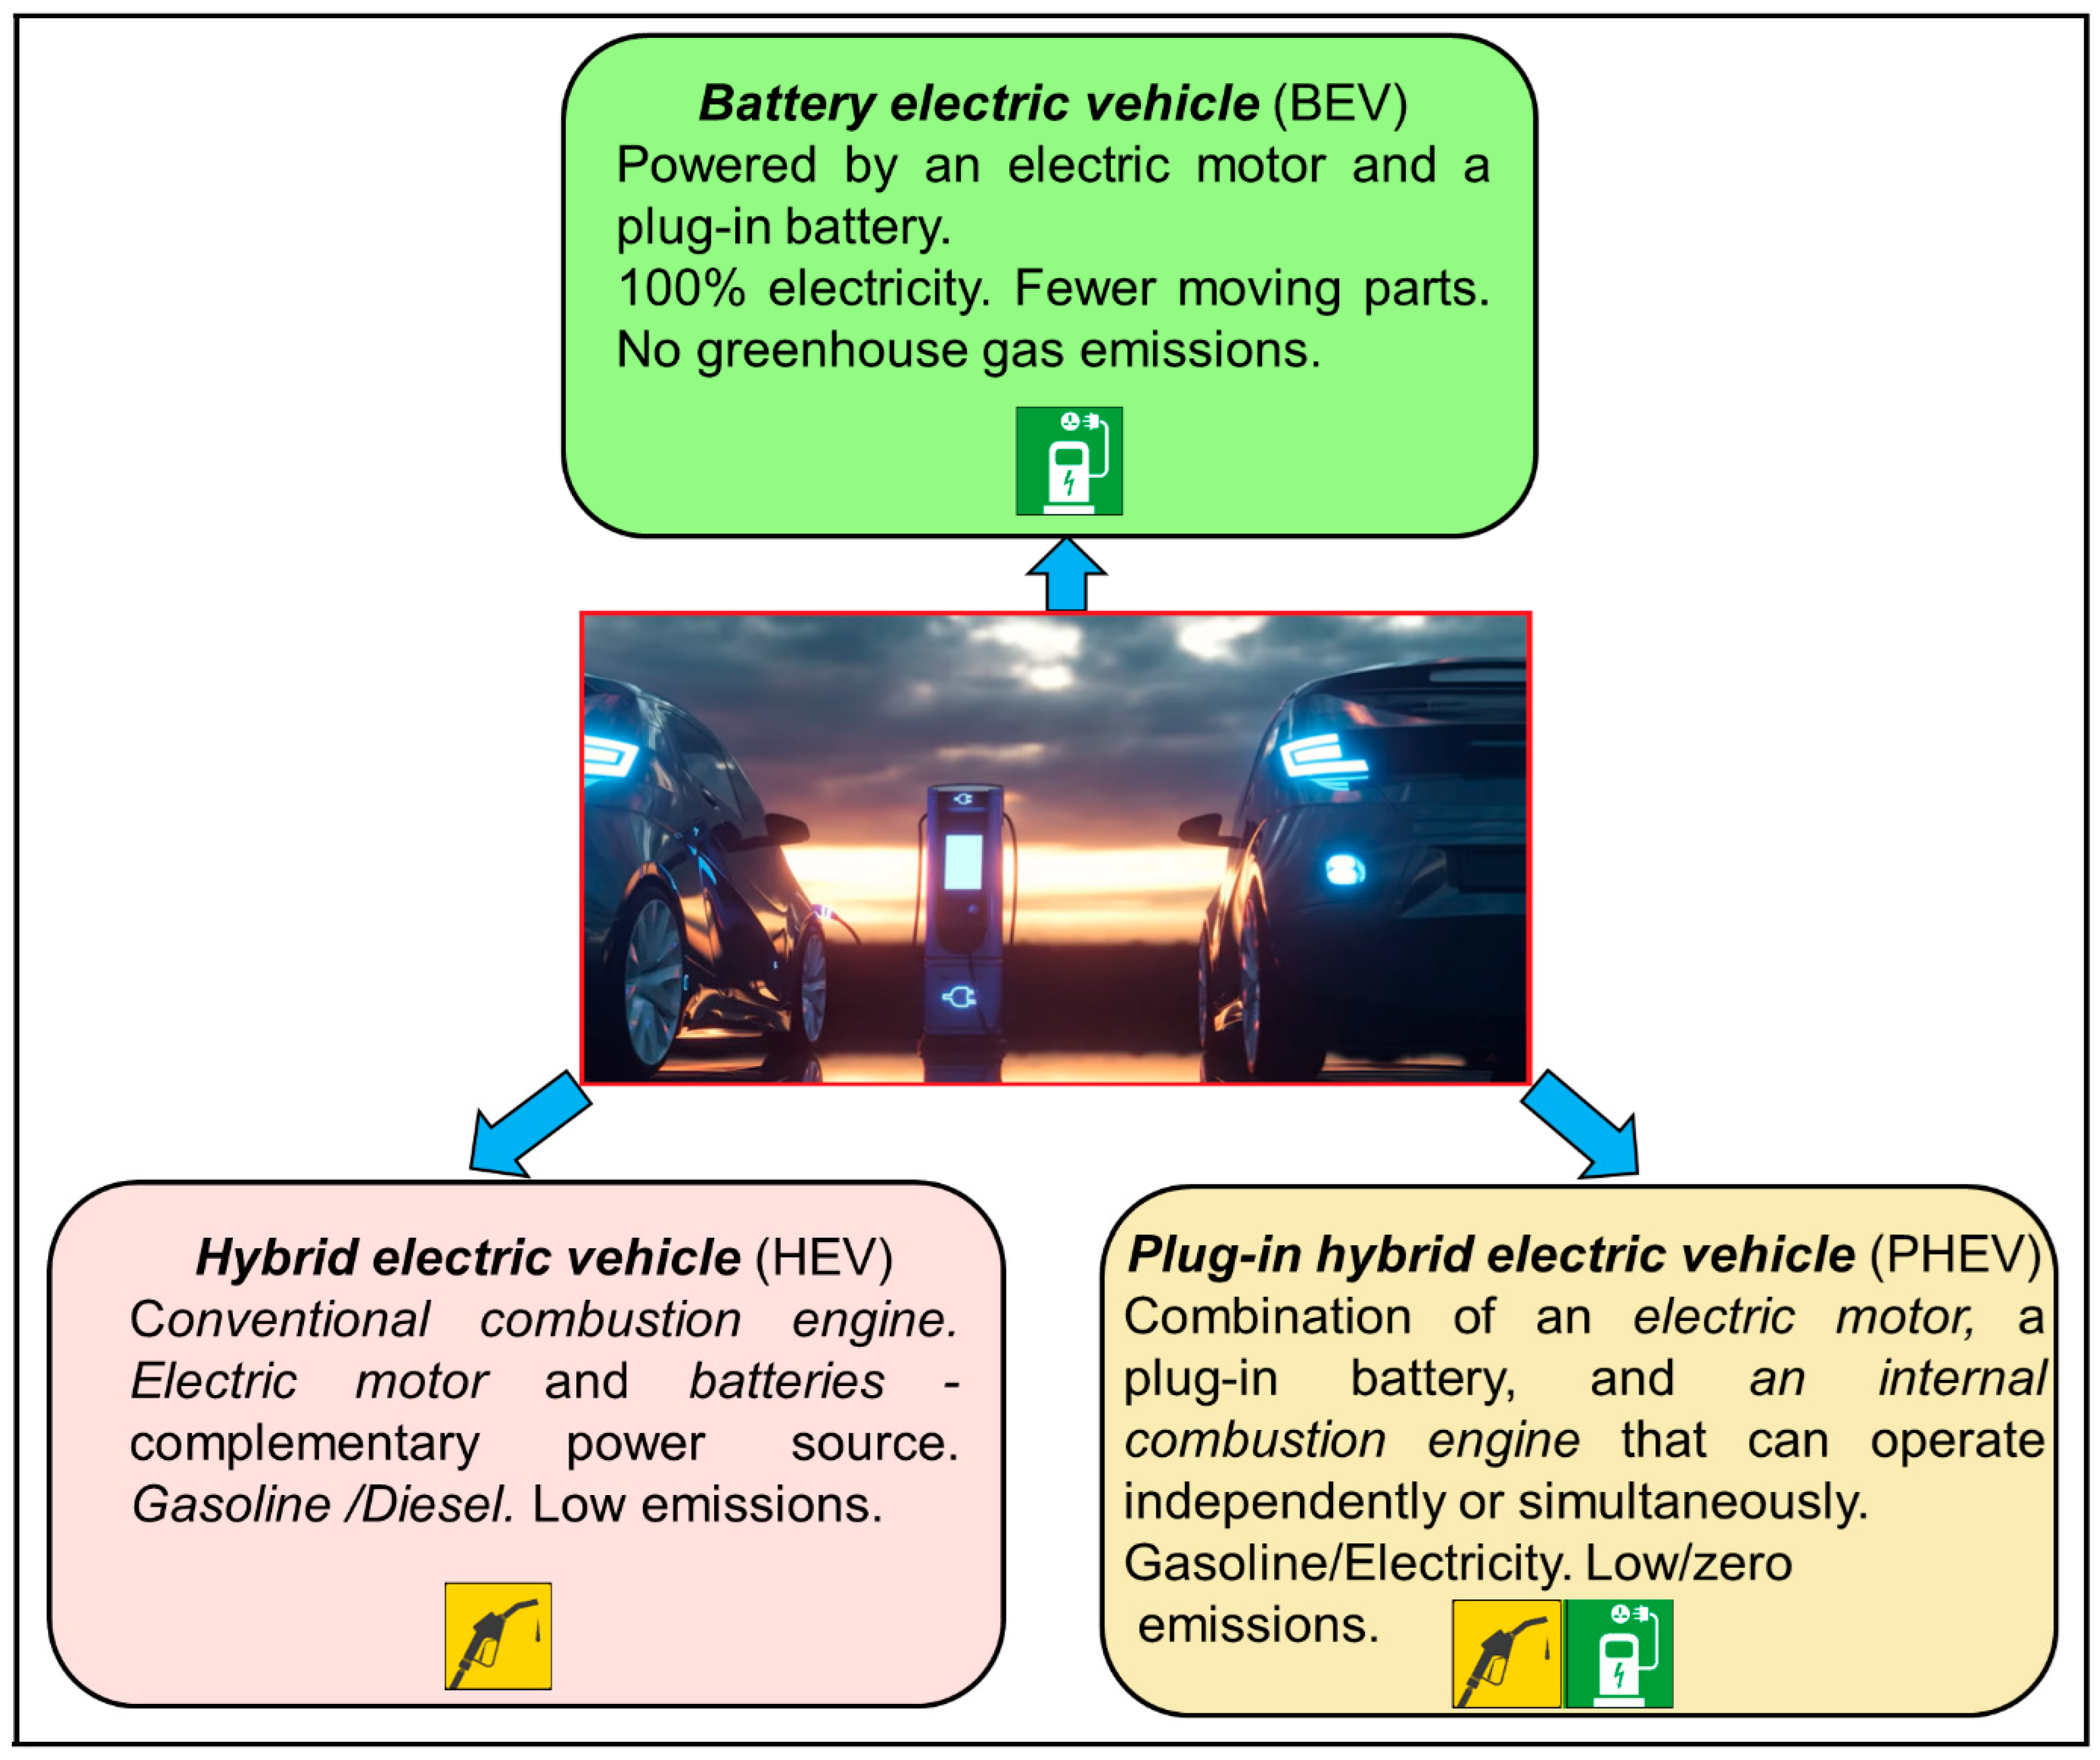
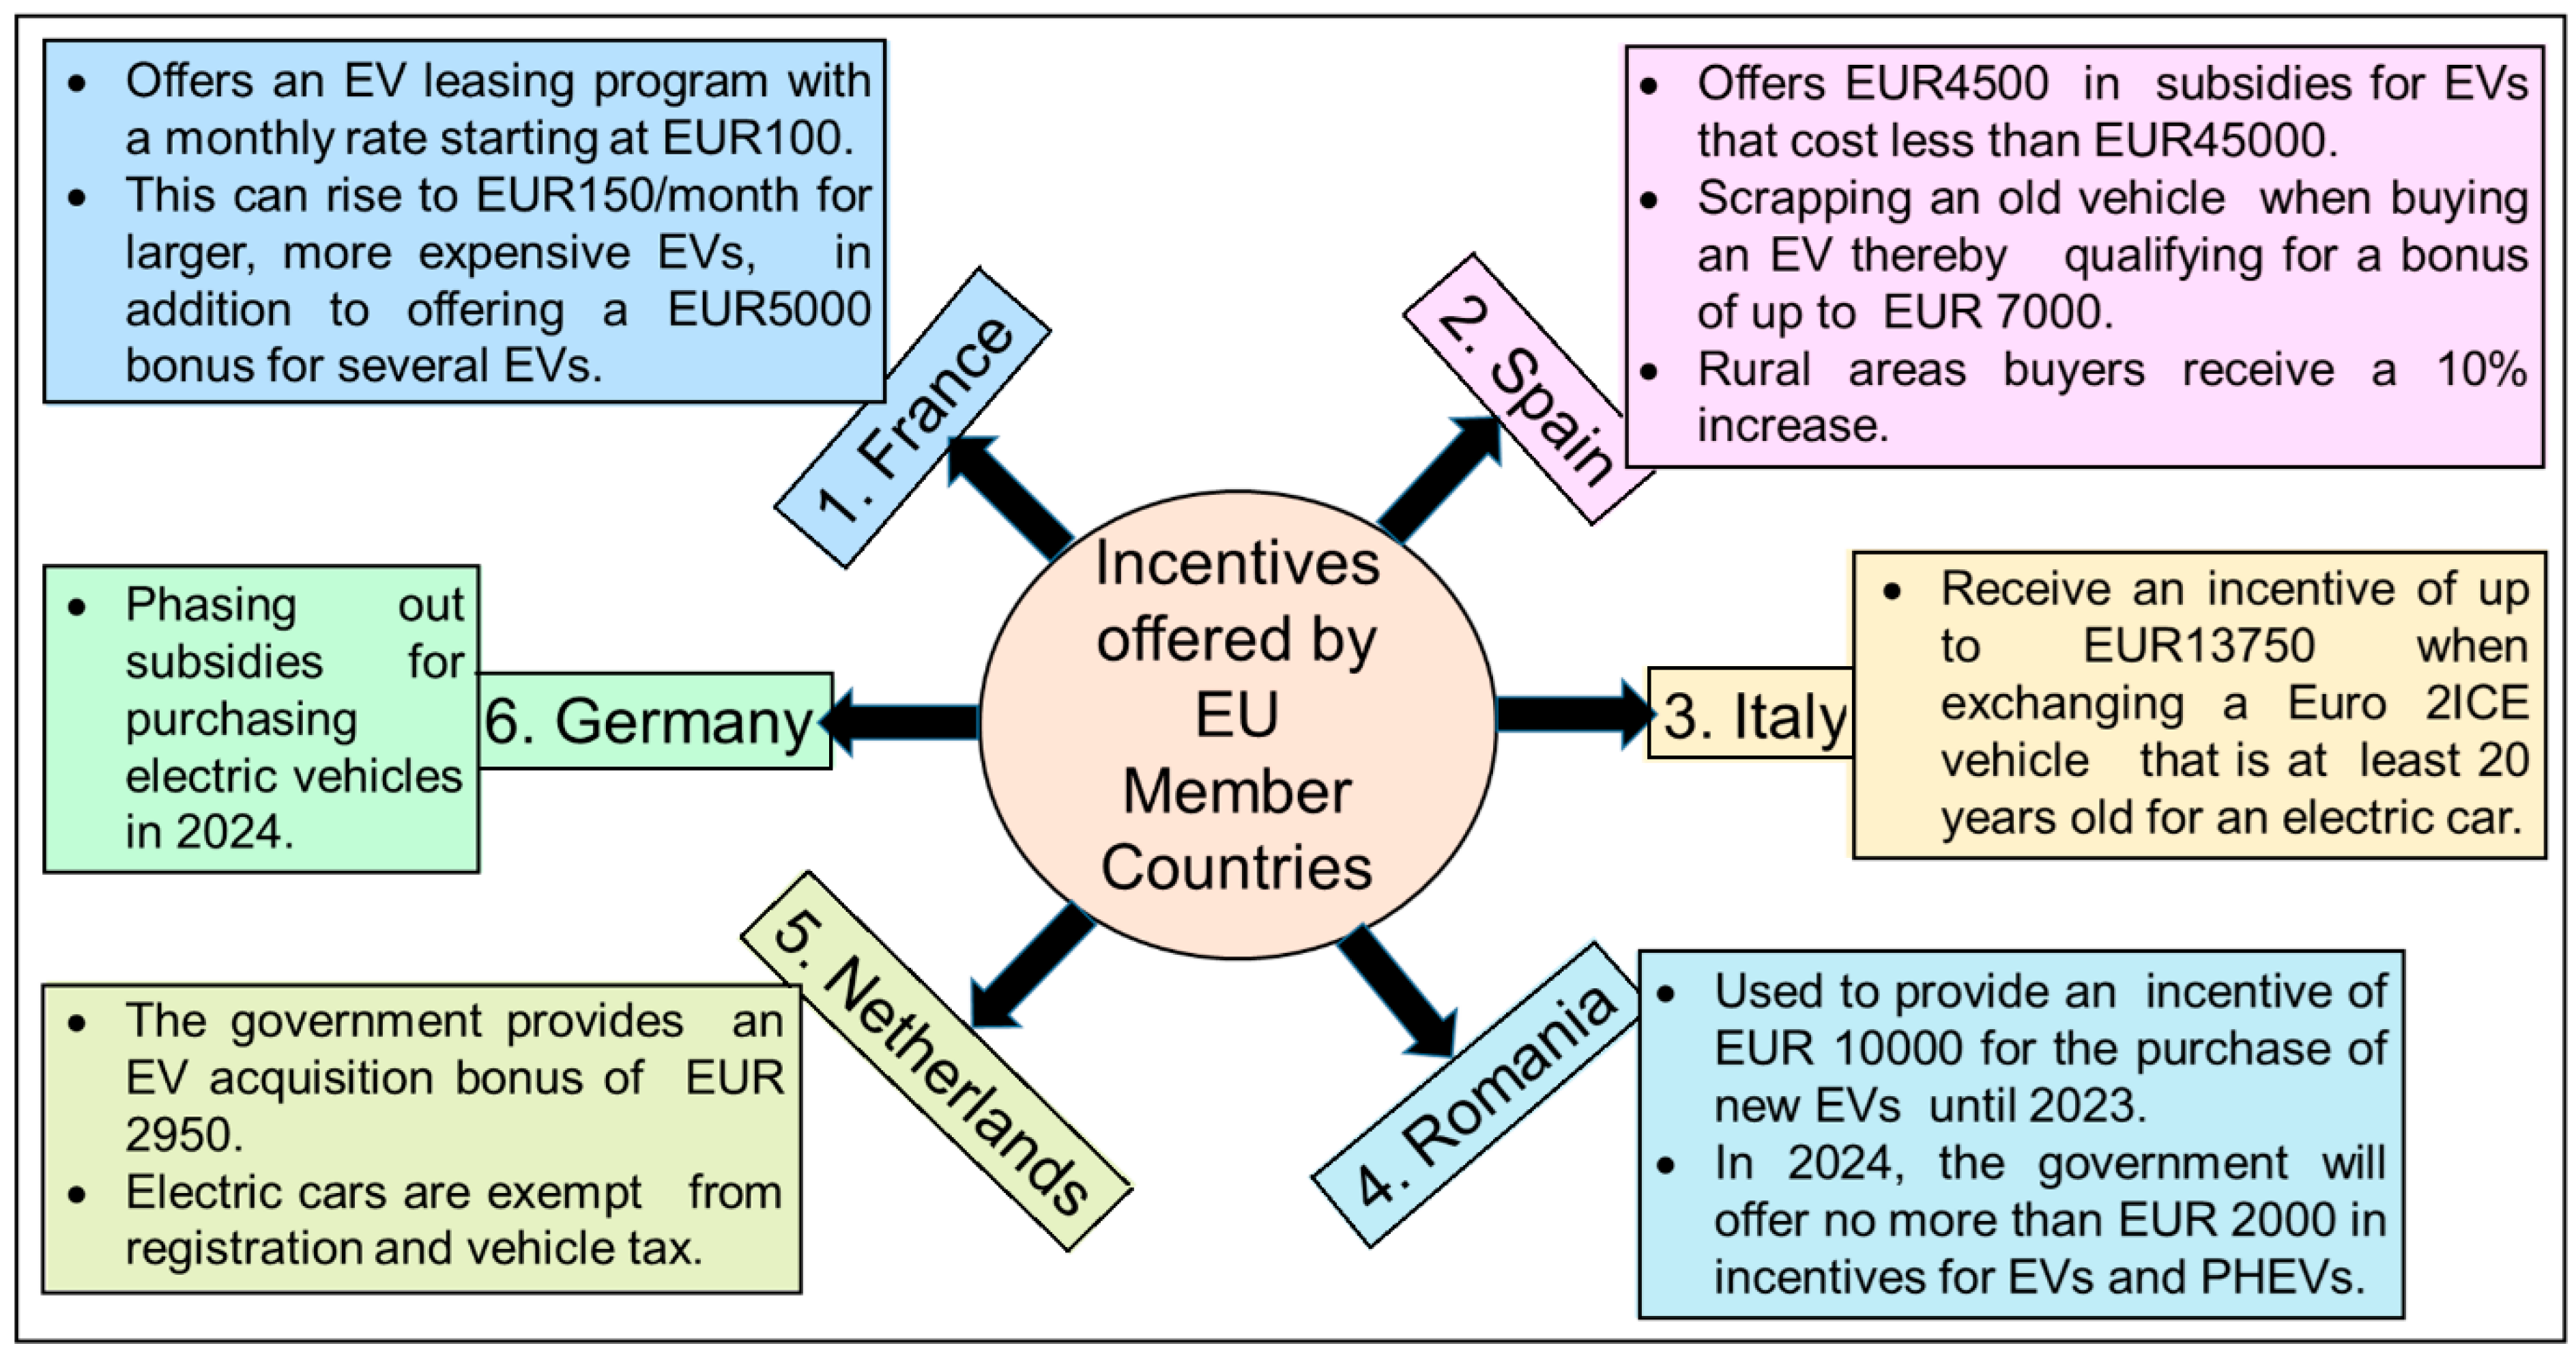
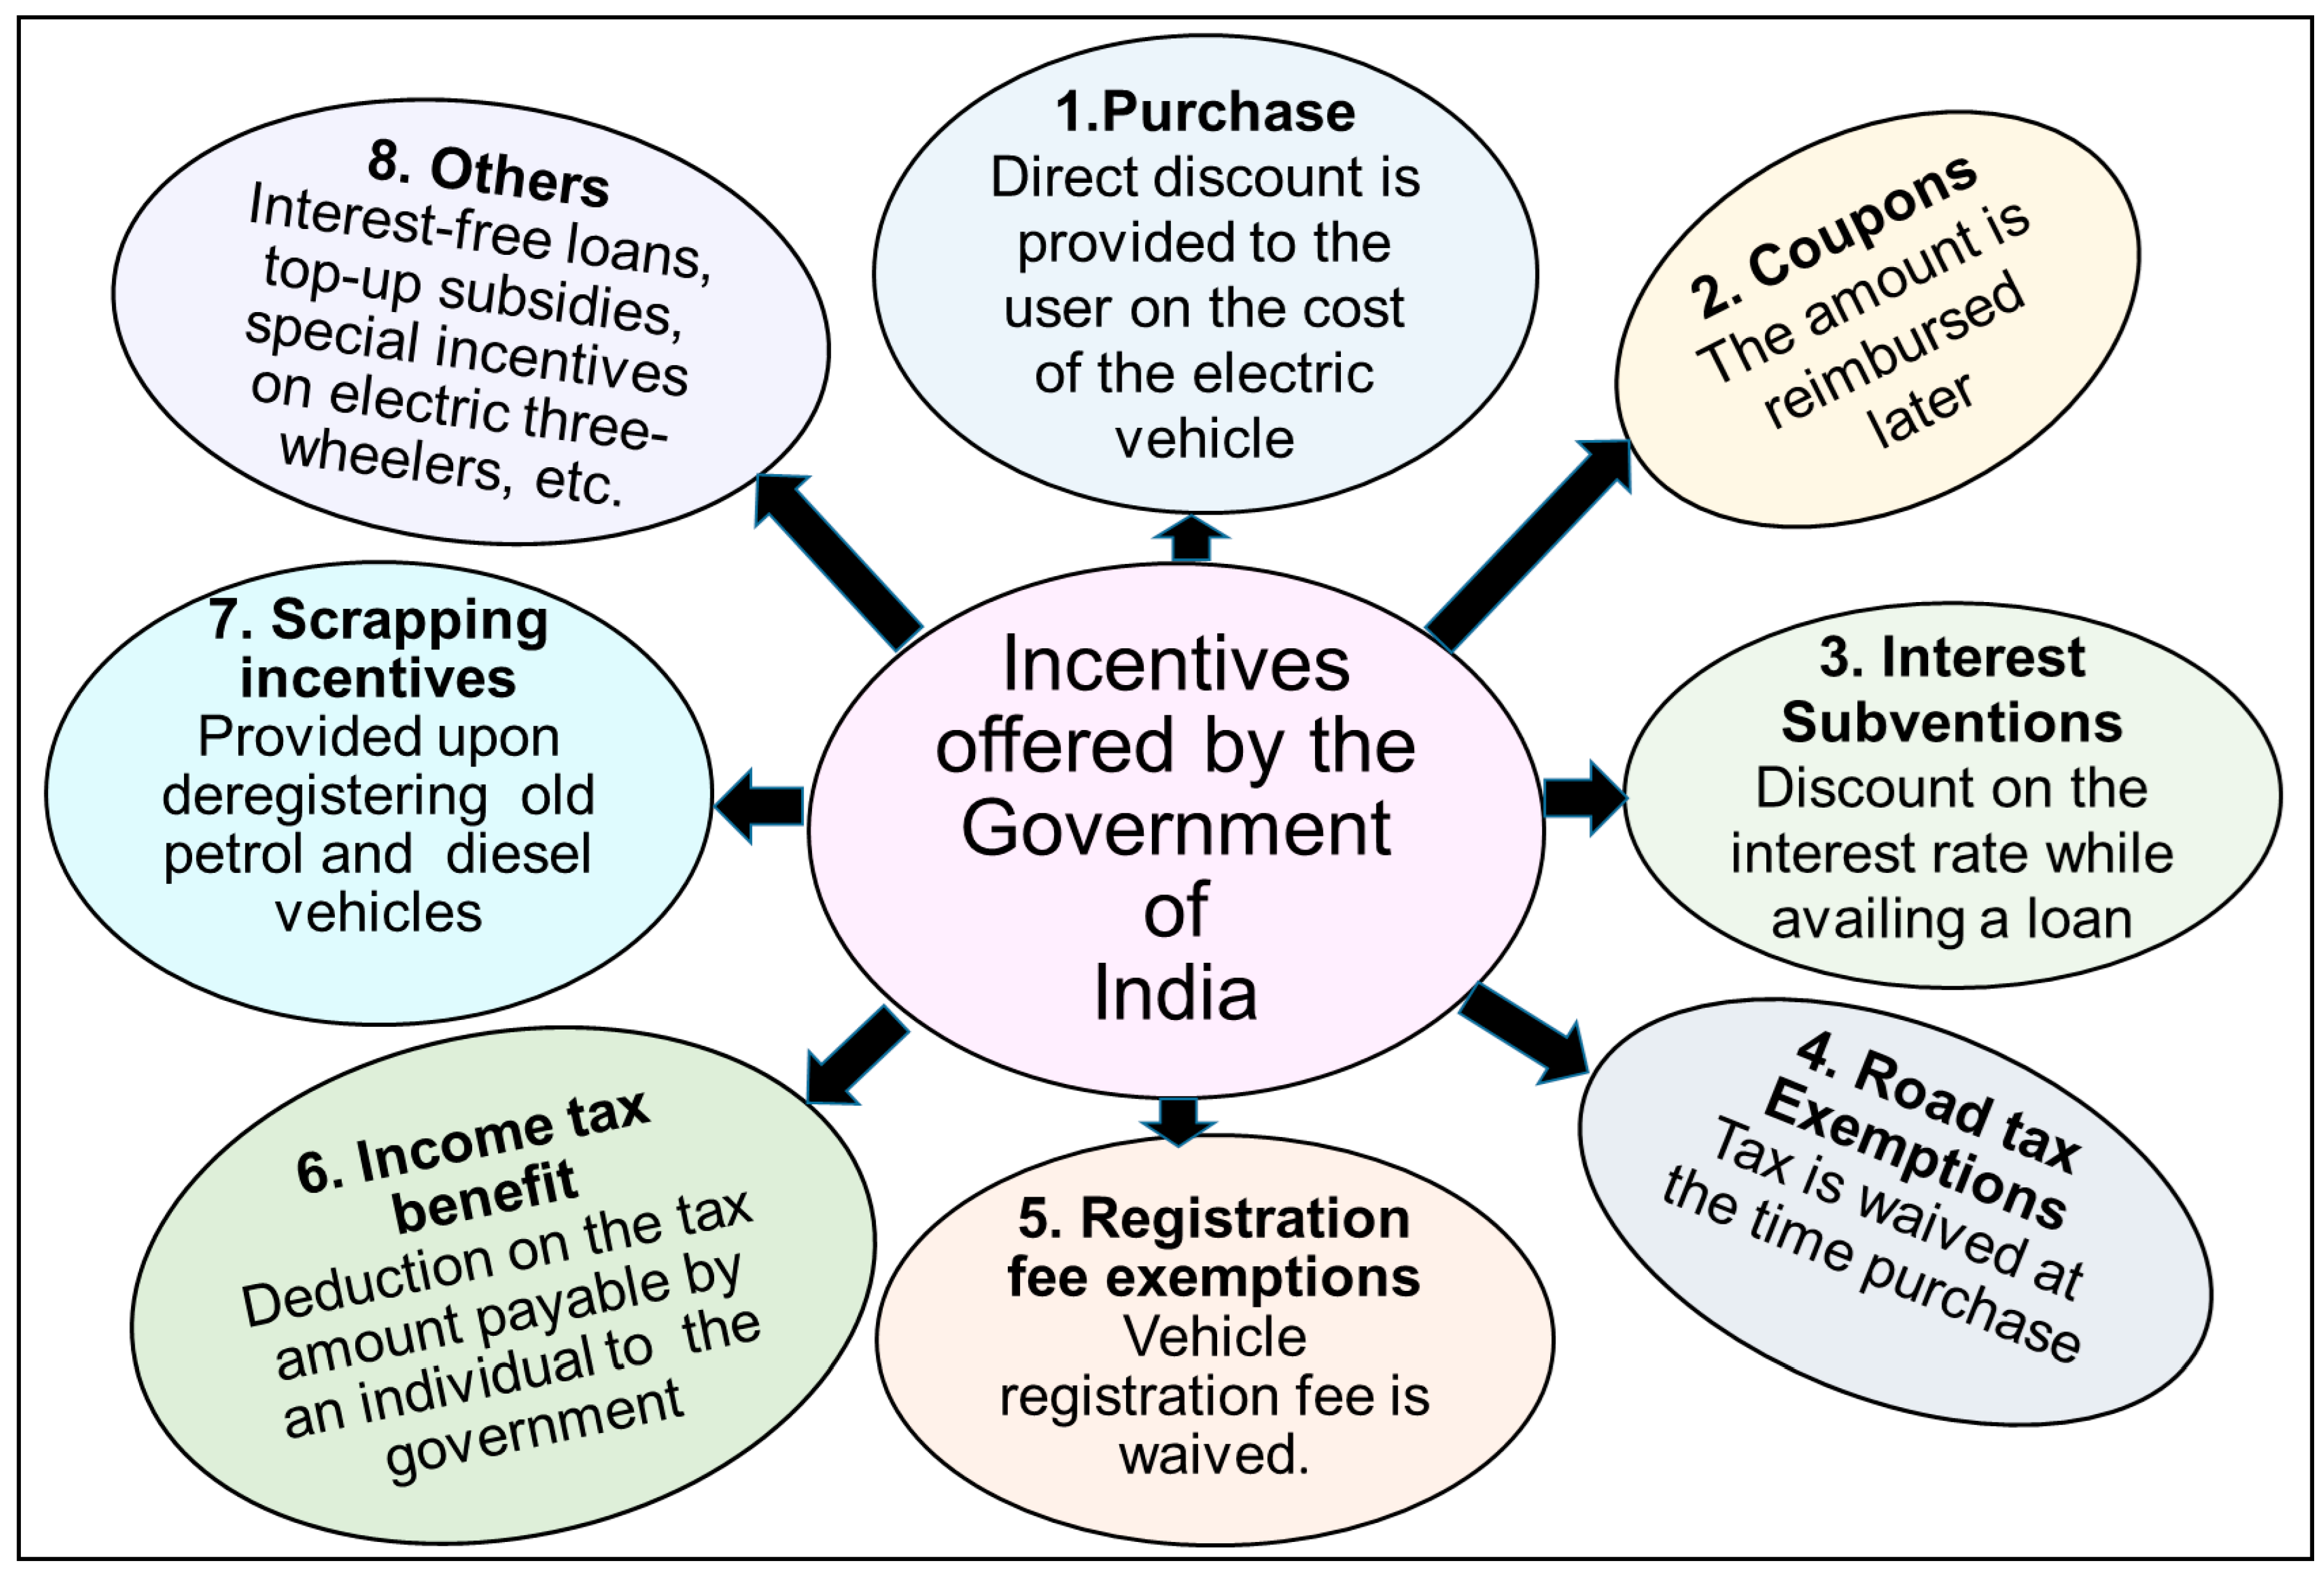


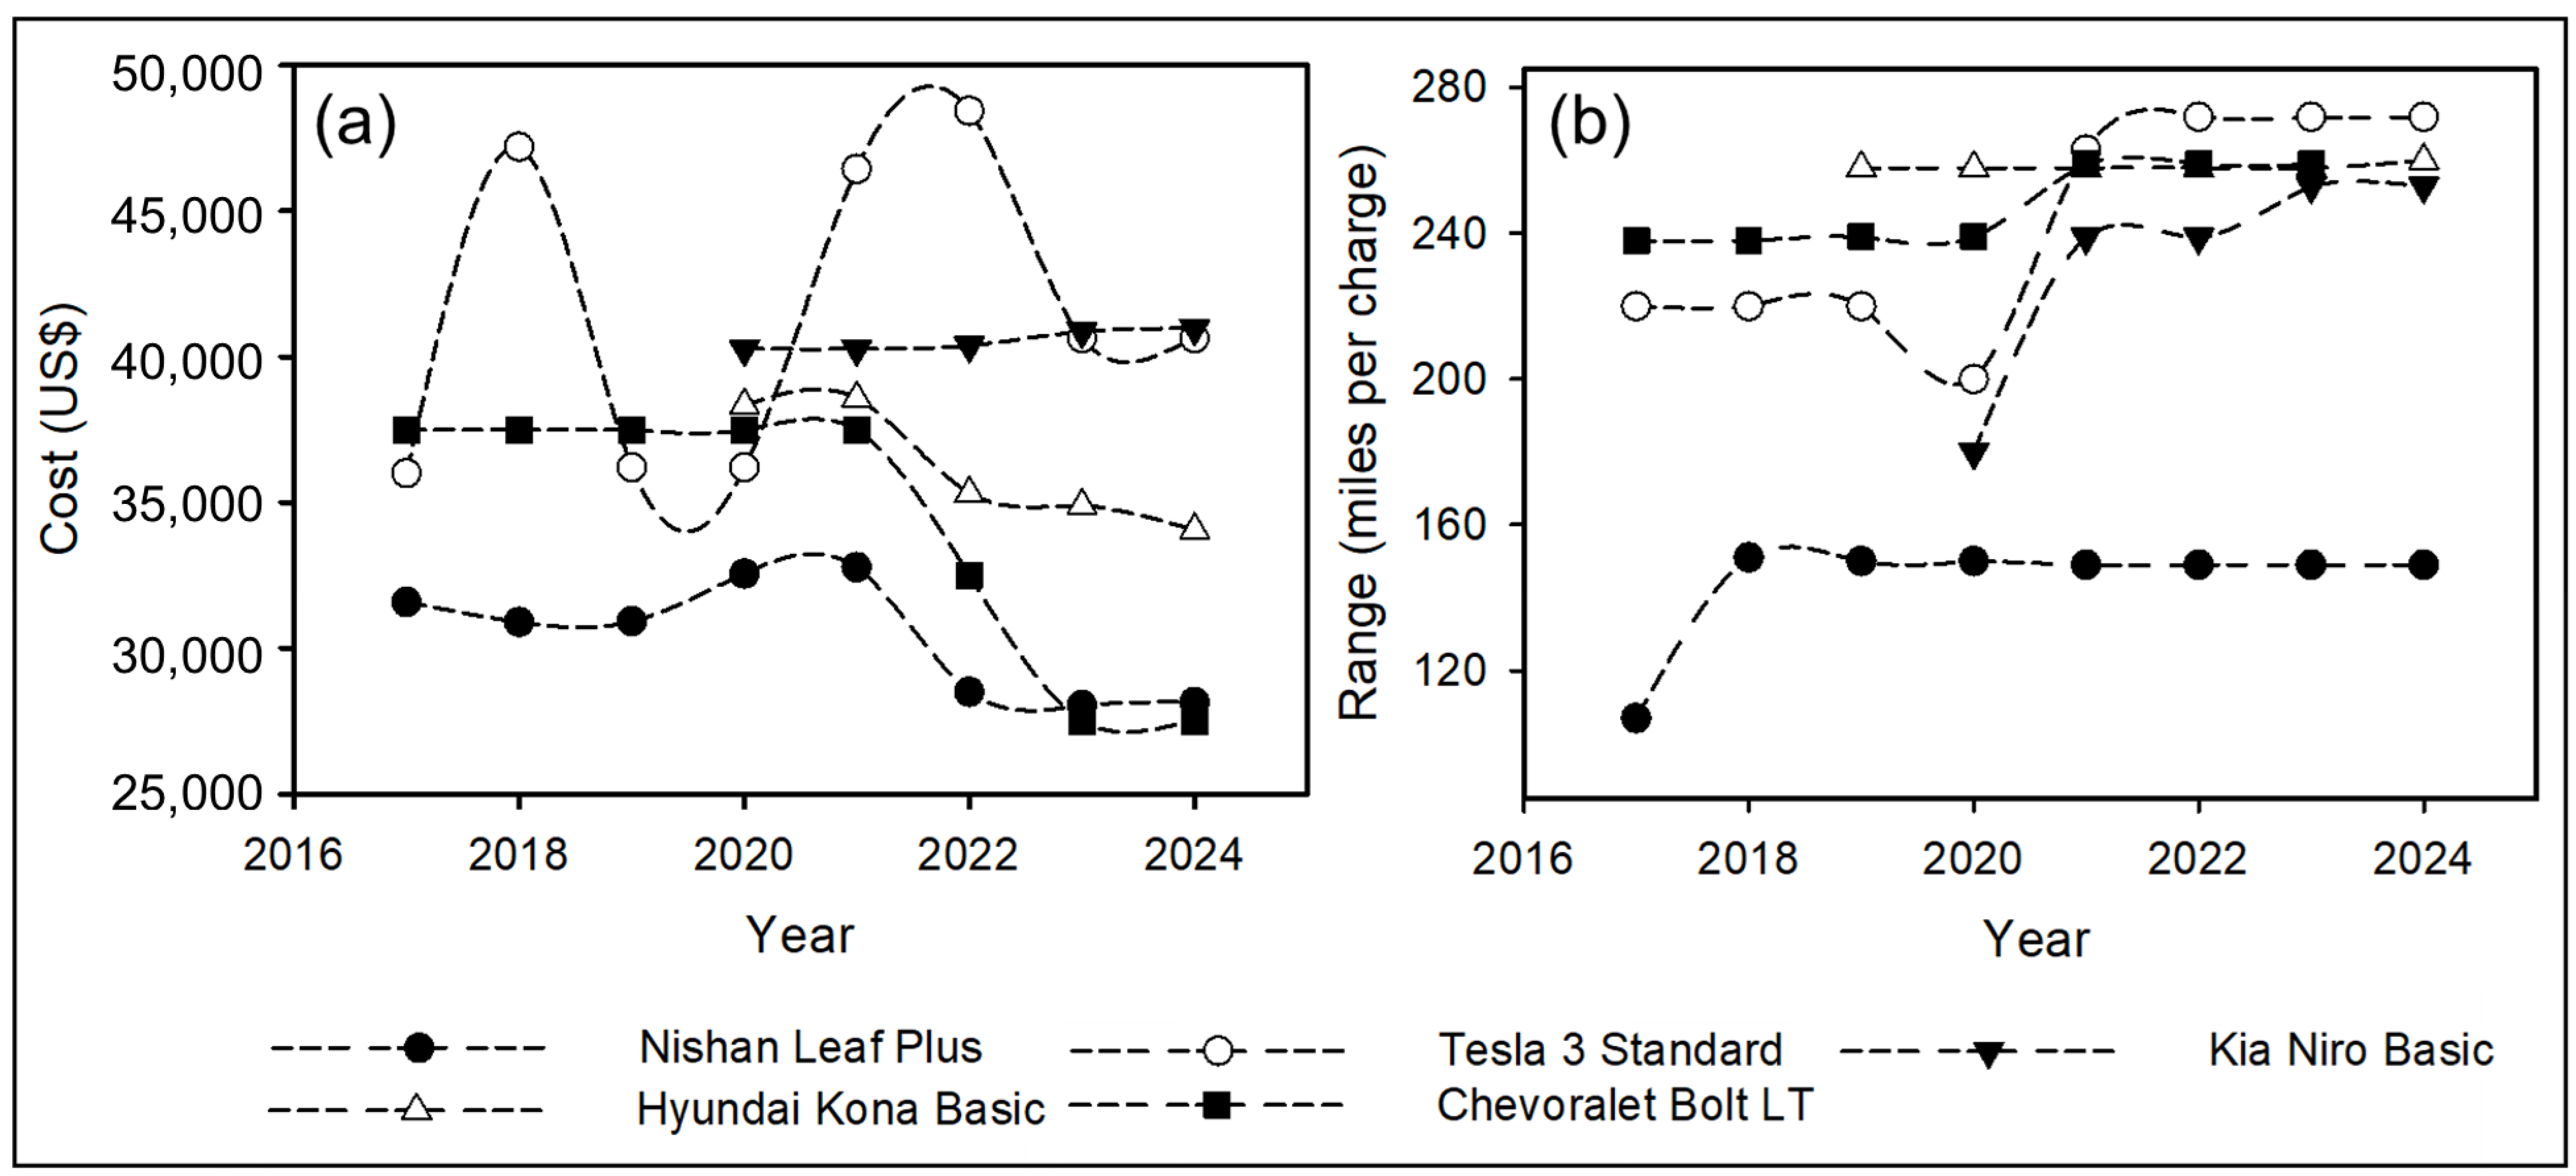
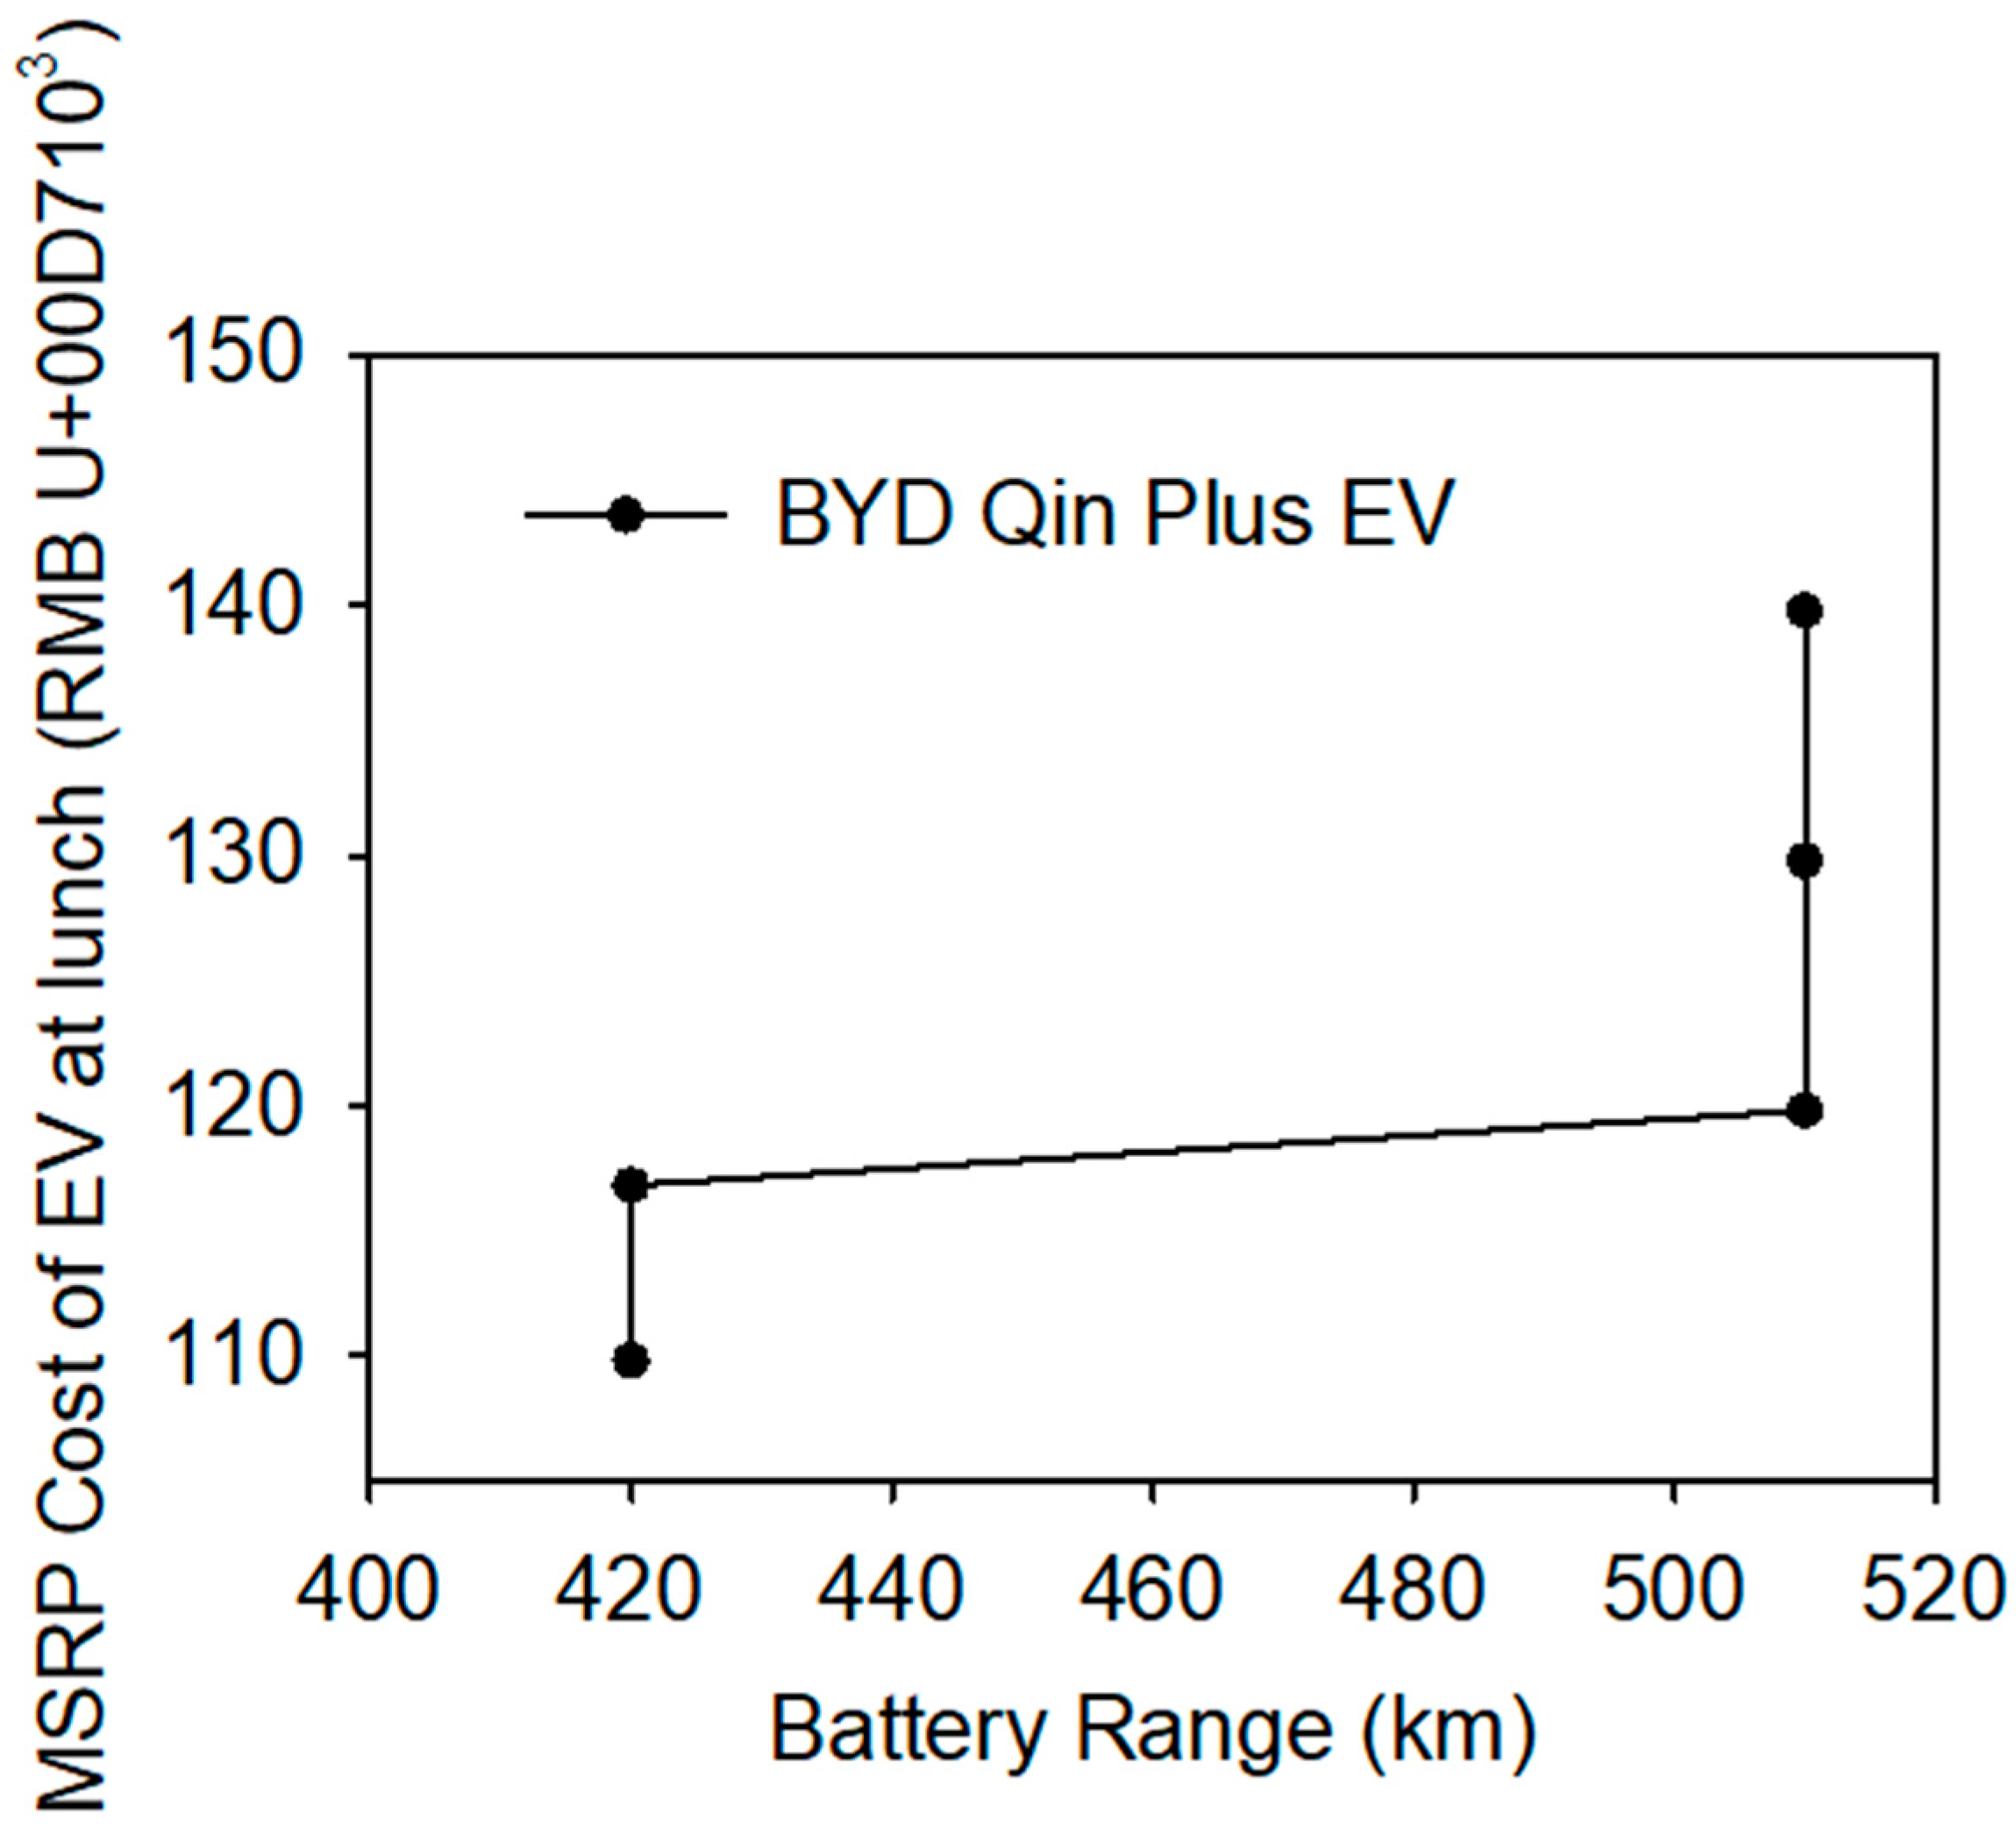
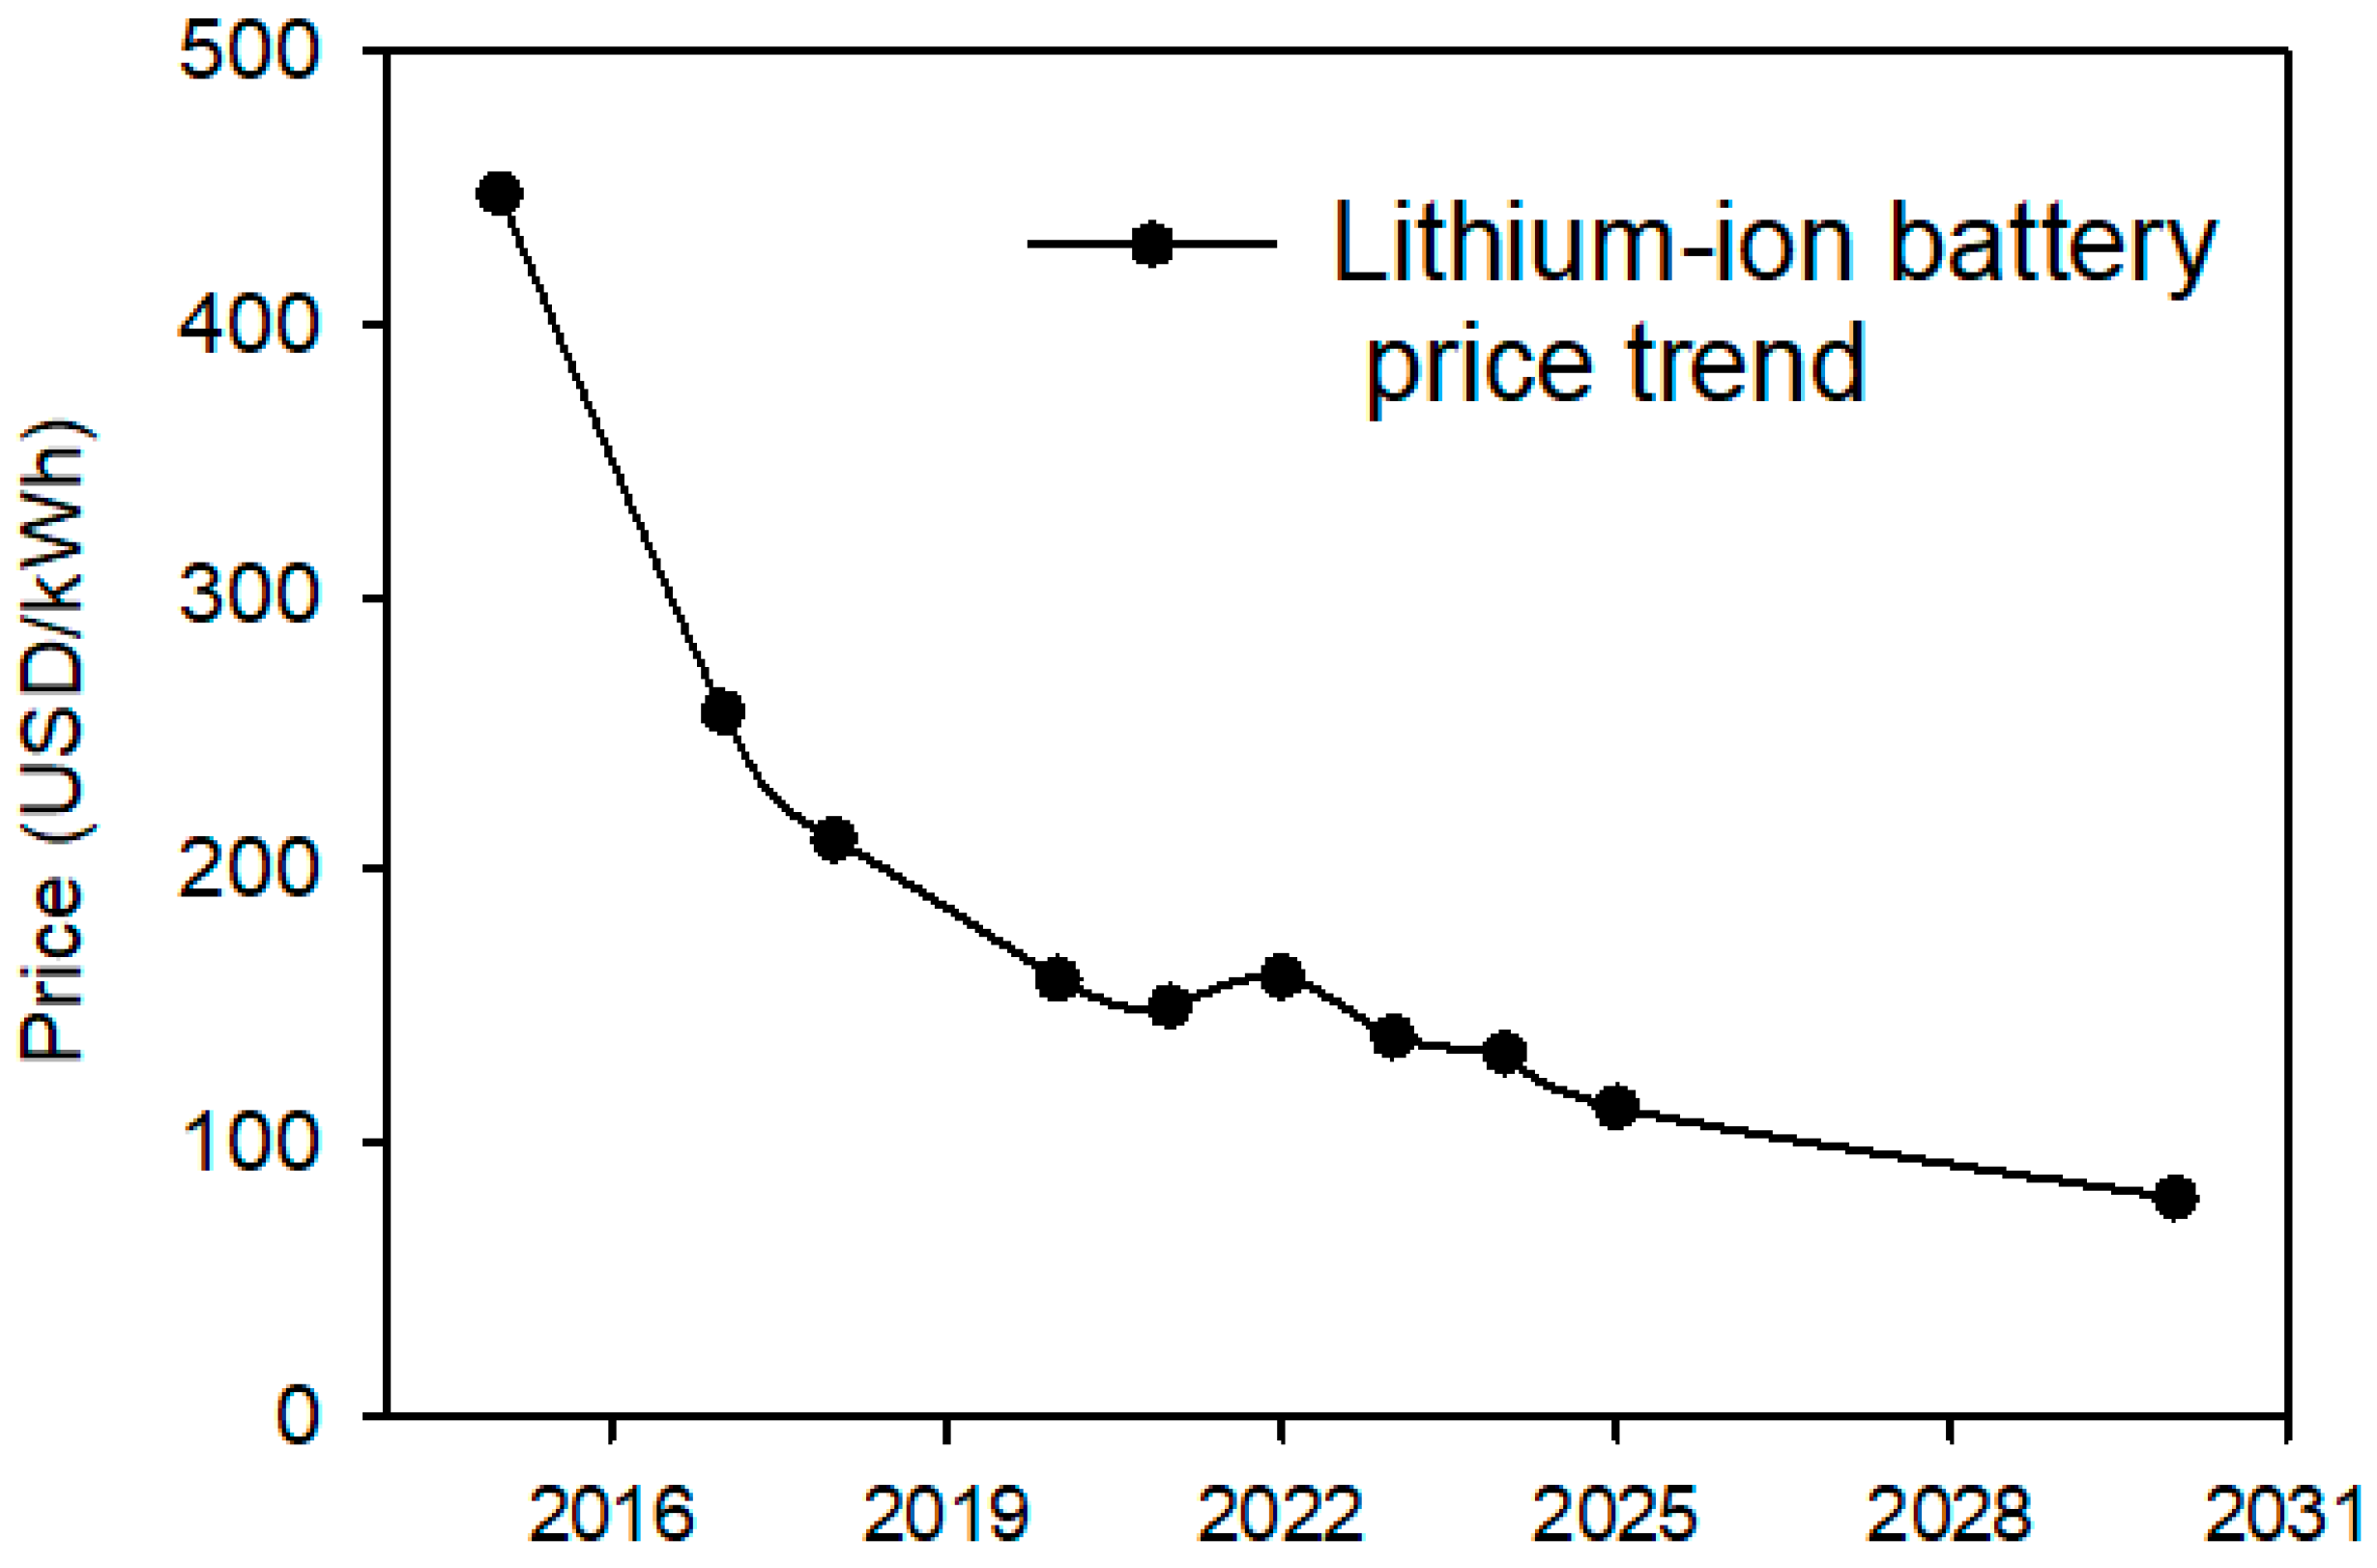
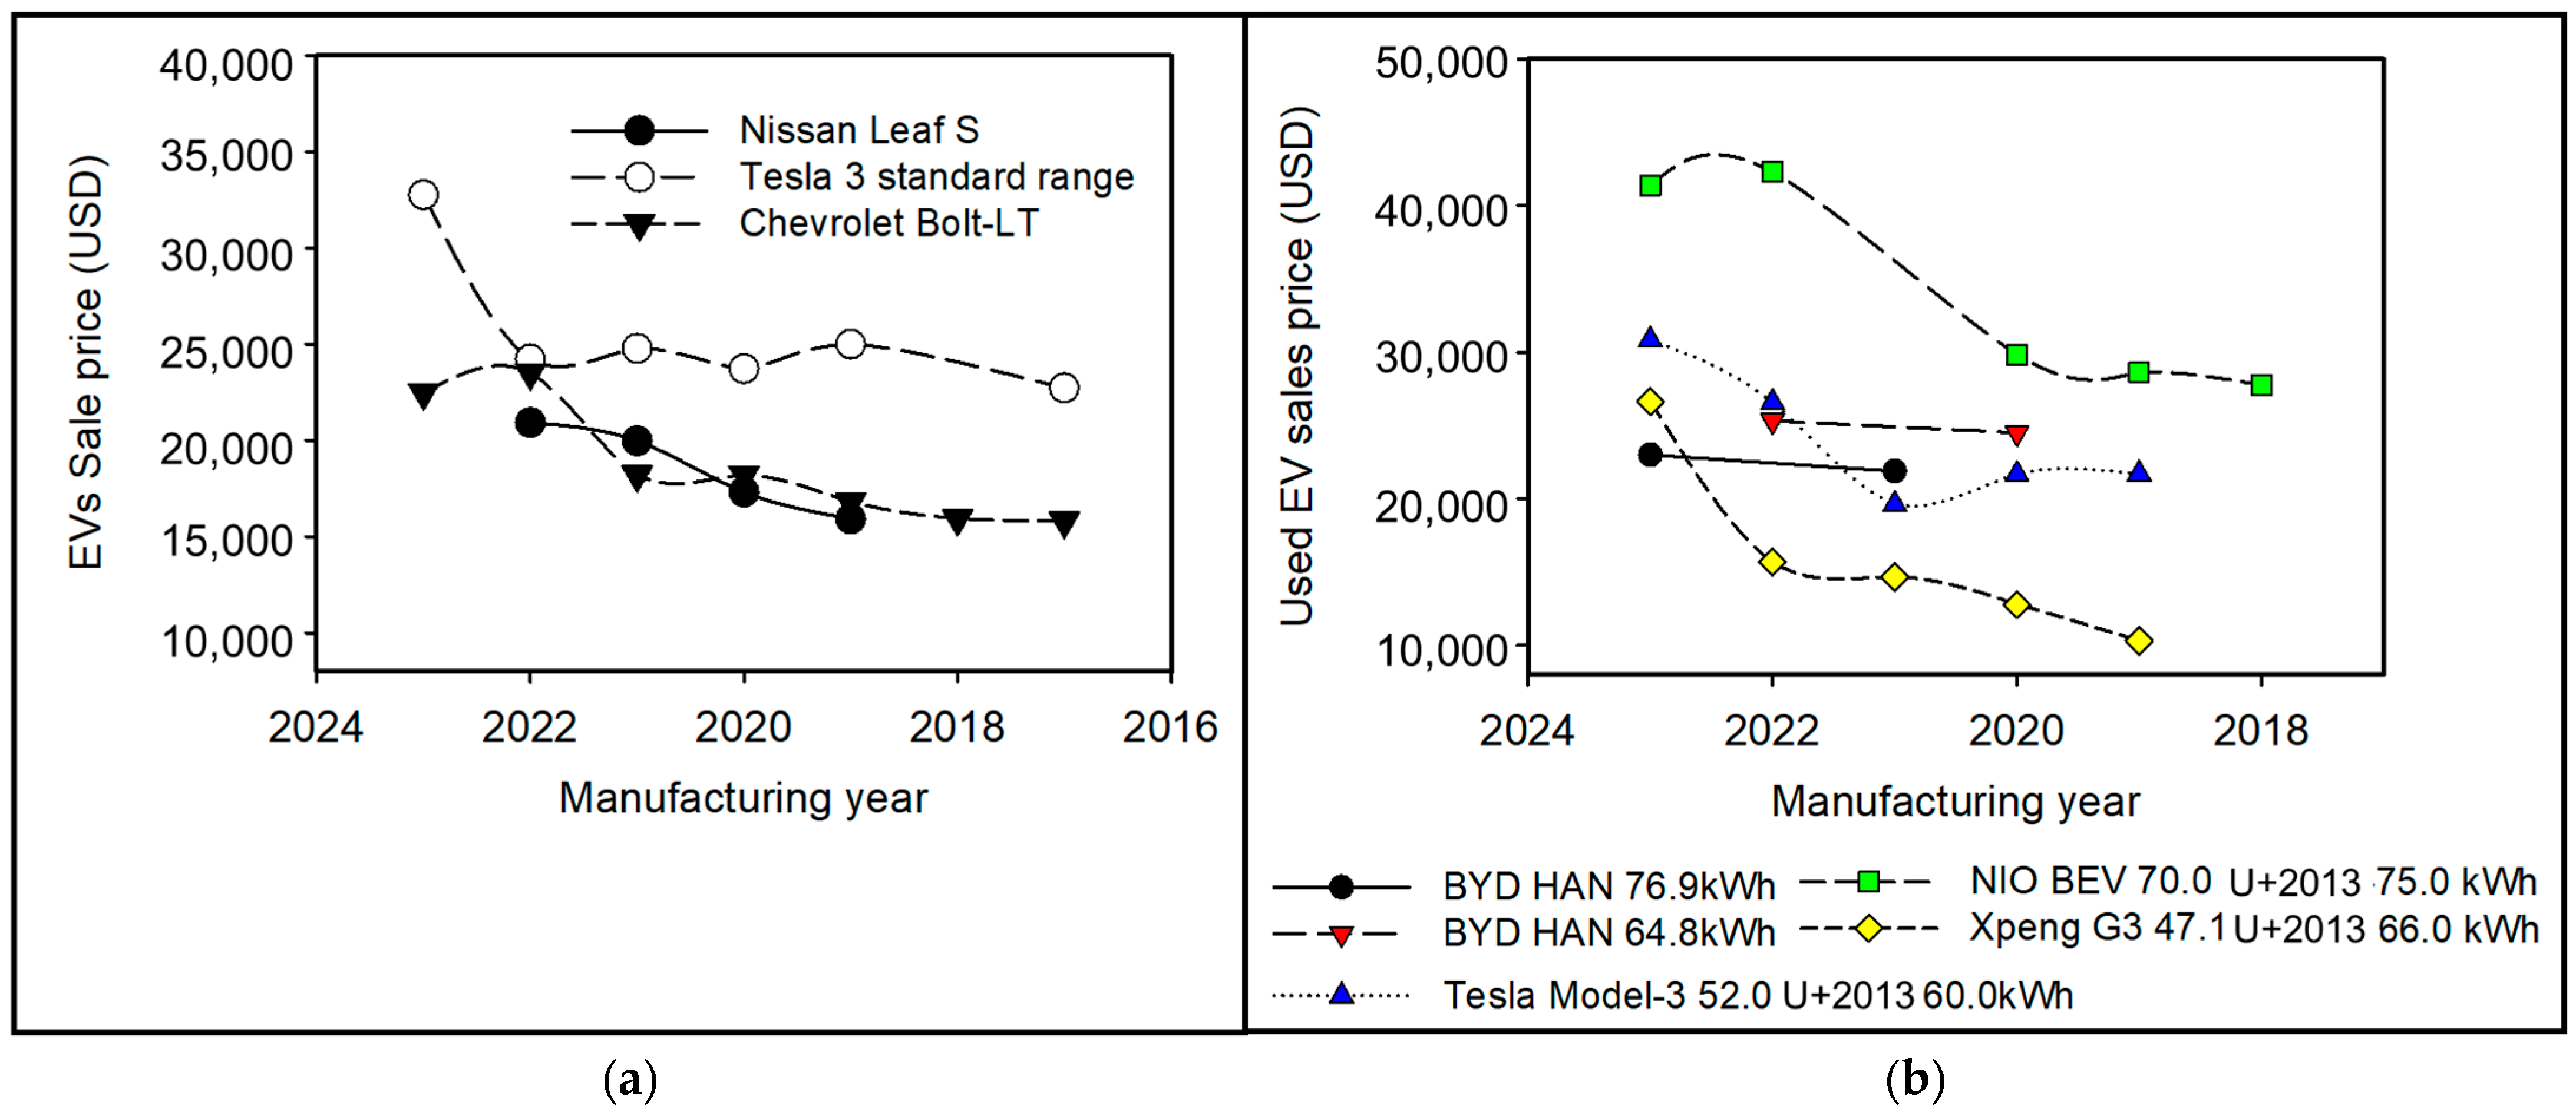
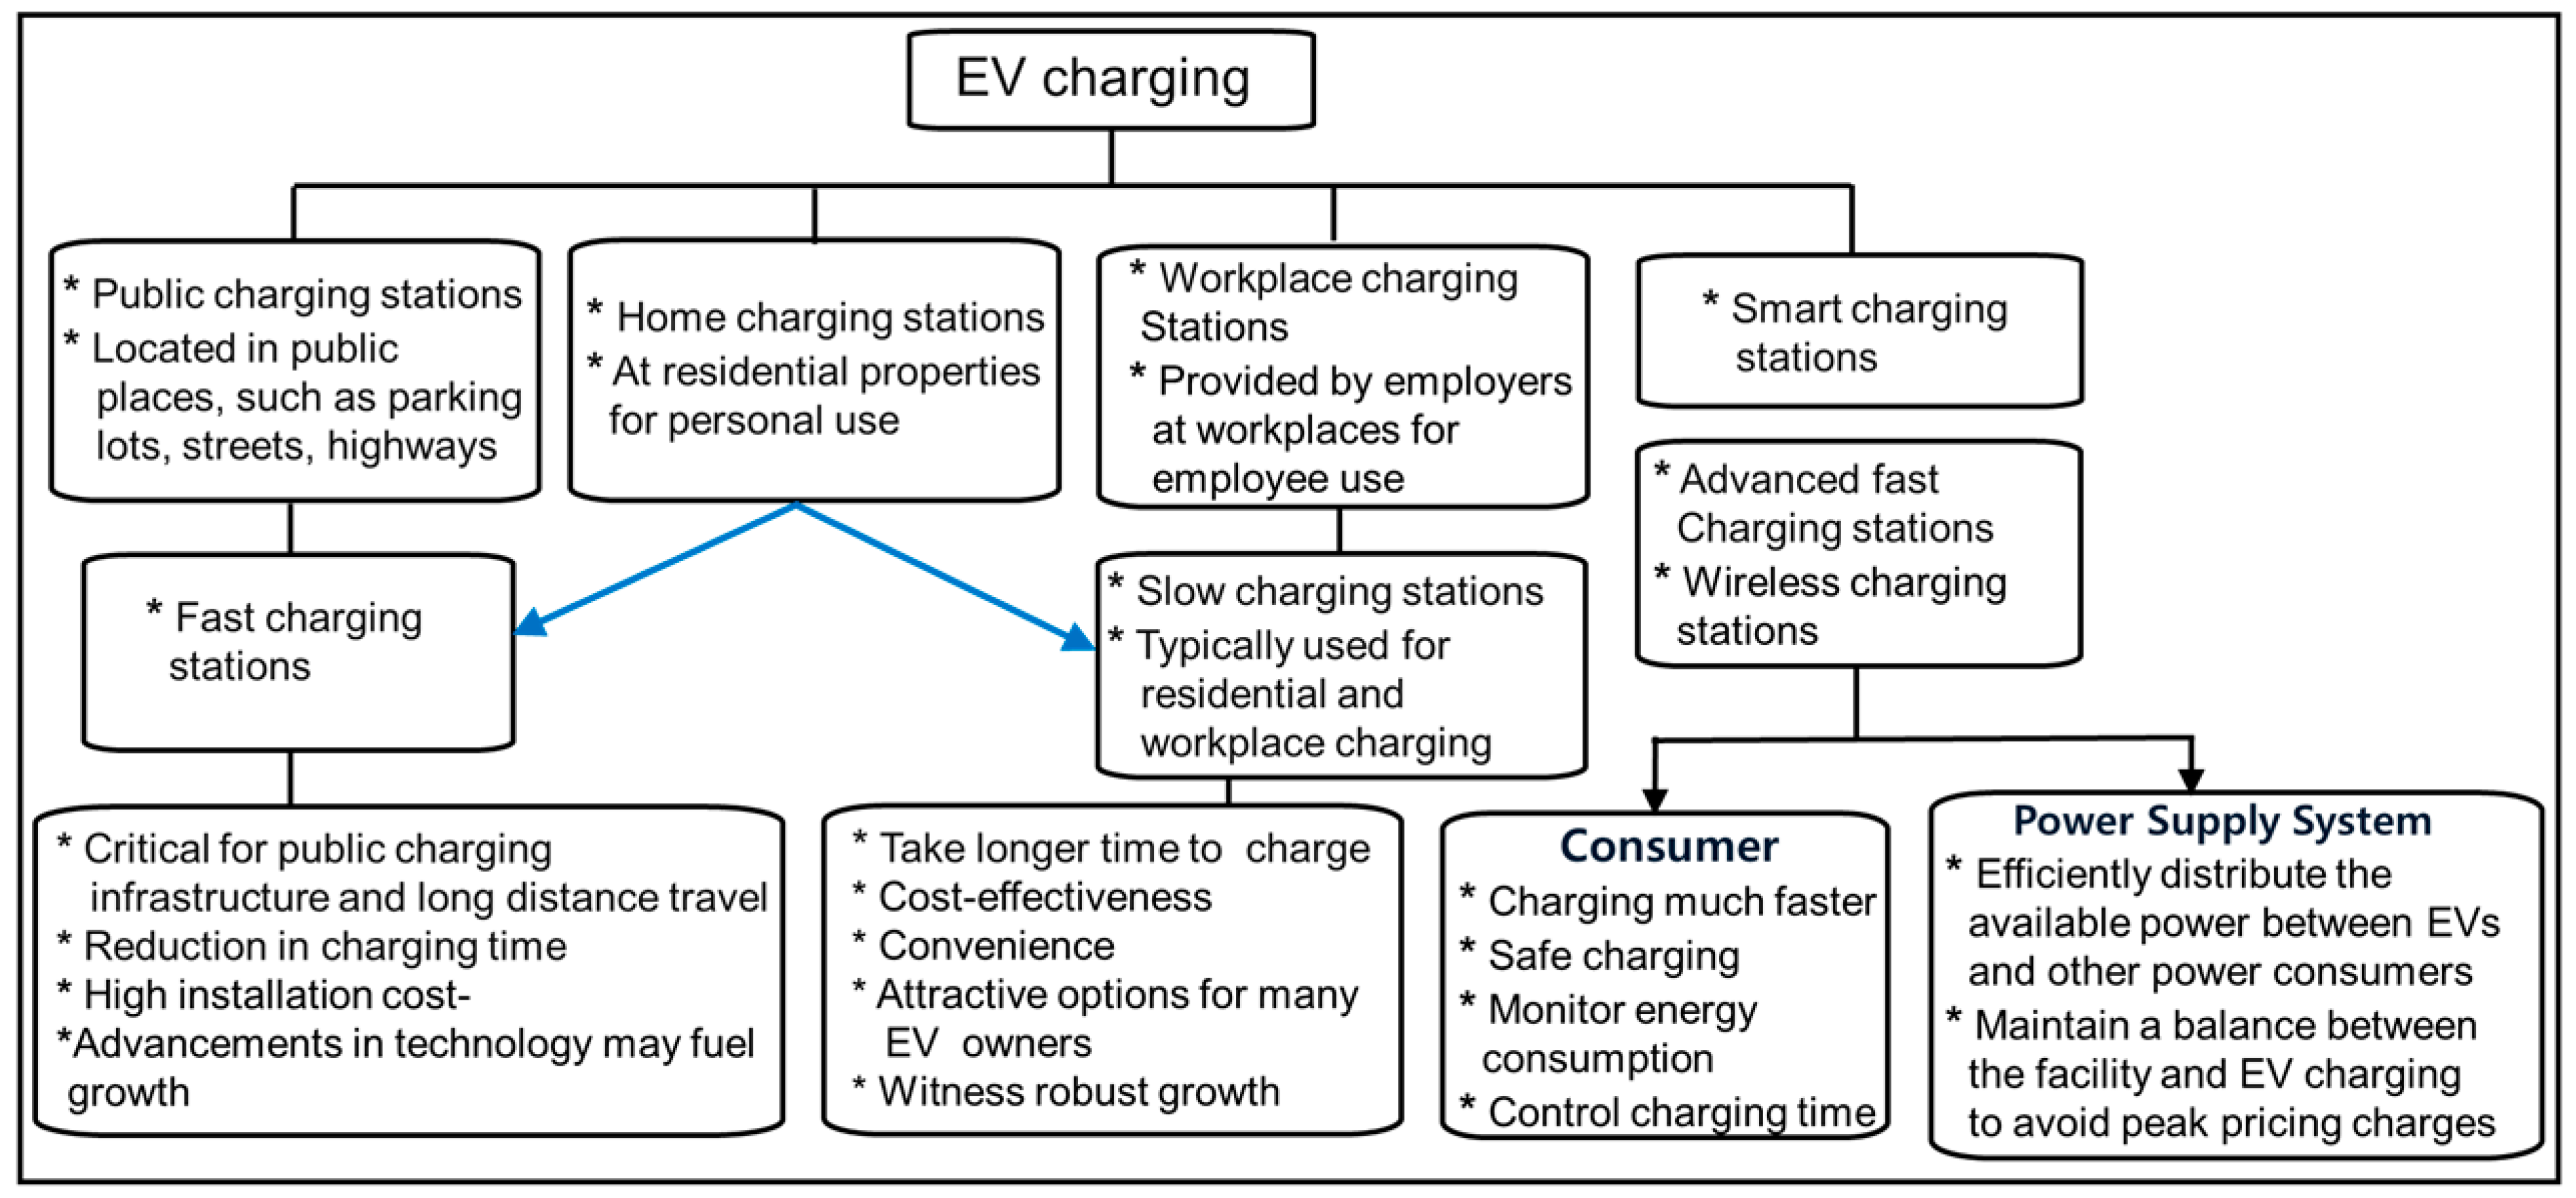
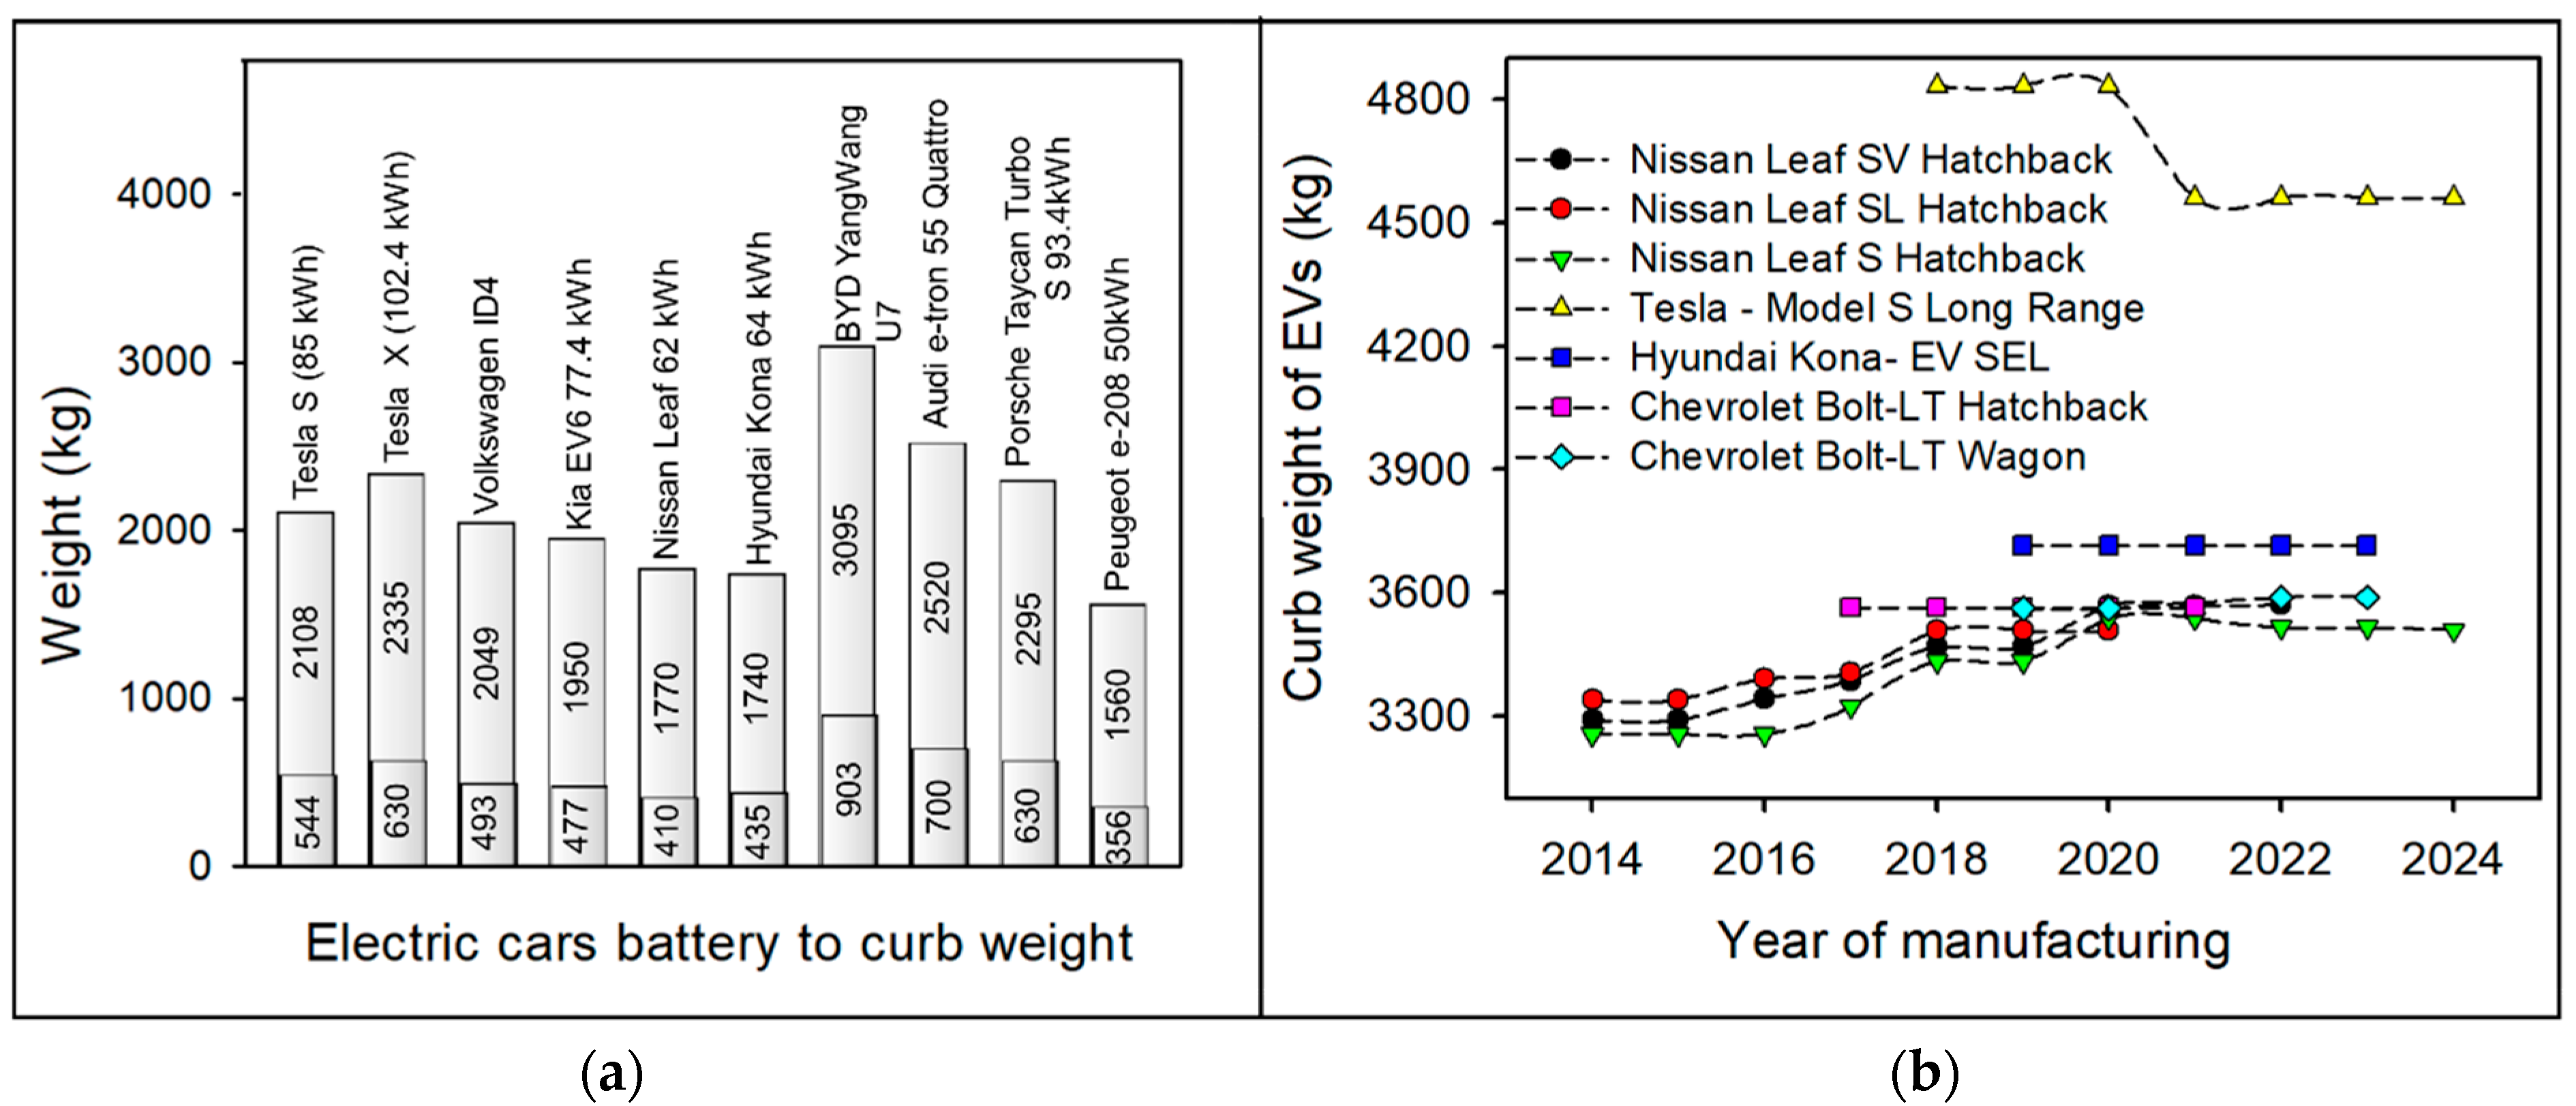
Disclaimer/Publisher’s Note: The statements, opinions and data contained in all publications are solely those of the individual author(s) and contributor(s) and not of MDPI and/or the editor(s). MDPI and/or the editor(s) disclaim responsibility for any injury to people or property resulting from any ideas, methods, instructions or products referred to in the content. |
© 2024 by the authors. Licensee MDPI, Basel, Switzerland. This article is an open access article distributed under the terms and conditions of the Creative Commons Attribution (CC BY) license (https://creativecommons.org/licenses/by/4.0/).