Article

Spatiotemporal Evolution and Driving Forces of Tourism Economic Resilience in Chinese Provinces

College of Geography and Tourism, Jilin Normal University, Siping 136000, China
*
Author to whom correspondence should be addressed.
Sustainability 2024, 16(18), 8091; https://doi.org/10.3390/su16188091 (registering DOI)
Submission received: 28 July 2024 / Revised: 5 September 2024 / Accepted: 13 September 2024 / Published: 16 September 2024

Abstract

:
This study focuses on the resilience of tourism economies in Chinese provinces, exploring their spatiotemporal evolution and driving forces as a crucial prerequisite for promoting the high-quality development of China’s tourism industry. We construct a resilience evaluation index system from four dimensions: resistance resilience, recovery resilience, reshaping resilience, and development resilience, using provincial tourism data from 2012 to 2022. The study employs Moran’s Index, kernel density estimation, and GIS technology to investigate the differentiation characteristics, spatial evolution processes, and spatial agglomeration characteristics of provincial tourism economic resilience in China. Finally, the GeoDetector model is used to analyze the driving factors. The findings are as follows: (1) Over time, most provinces and cities in China have shown varying degrees of improvement in tourism economic resilience, with different changes observed across the four dimensions. (2) Spatially, significant differences exist between provinces, with better resilience in the east than in the west and in the south than in the north. (3) Regionally, while no polarization is observed, there is a distinct differentiation between high and low-value areas. (4) Regional linkages indicate the presence of interregional associations in China’s tourism economic resilience, with non-uniform distribution of cold and hot spots. (5) Key driving factors include per capita railway mileage, domestic tourism revenue, the number of travel agencies, and the number of employees in accommodation and catering. Under the backdrop of rapid tourism economic development, improving infrastructure construction and enhancing the comprehensive strength of the tourism industry is vital for boosting tourism economic resilience.

1. Introduction

Since the start of the Fourteenth Five-Year Plan, China’s tourism industry has transitioned from a phase of rapid growth to high-quality development. Various provinces have successively launched implementation plans for the high-quality development of all-for-one tourism. Therefore, while pursuing high-speed growth, the tourism industry must also strive for a higher quality and sustainable development model. However, the complexity and spatial diversity of tourism activities make the industry sensitive and vulnerable. Enhancing the resilience of the tourism industry is significant for achieving high-quality development of China’s tourism economy. Due to its large industry linkage effect, wide coverage, and complex industrial structure, the tourism industry is easily affected by external factors and environmental changes. Natural disasters, social environment changes, and policy adjustments can impact the high-quality development of tourism. Consequently, major unexpected public safety events cause uneven recovery levels in China’s tourism industry, affecting the resilience levels of regional tourism and, to some extent, constraining the balanced development of China’s tourism economy and regional economy. Therefore, researching the spatiotemporal evolution and driving forces of provincial tourism economic resilience in China helps understand each province’s ability to withstand risks and maintain normal system functions. This research aids developers or managers in identifying weak links in provincial tourism economic systems, formulating and implementing correct strategies, and provides important guidance for promoting the resilience of China’s tourism industry.
Resilience is a concept in physics that refers to the ability of a material to absorb energy during plastic deformation and fracture. The greater the resilience, the less likely the material is to experience brittle fracture [1]. In materials science and metallurgy, resilience is defined as the ability of a material to resist breaking when subjected to deforming forces. It is quantified as the energy absorbed by the material before breaking per unit volume. As the application of resilience expanded, American ecologist Holling, in 1973, explored species behavior changes in natural ecosystems, discovering the ability of ecosystems to maintain their characteristics despite external shocks. This extension of the concept of resilience from physics to ecology demonstrates how traditional theoretical and empirical ecological resilience research has successfully inherited and developed classical physics applications [2]. Masten and colleagues [3] proposed the “evolutionary resilience” theory, which shifts the focus from the system’s ability to recover from a single shock and the magnitude of the shock endured before “deformation” to emphasizing the interaction between the system and external disturbances. The system continually adapts and learns in response to environmental changes, enhancing its ability to withstand shocks and cope with potential risks. This theory broadens the study of resilience, transforming it from a simple recovery process into a more complex adaptive, learning, and transformative capability that continually adjusts itself to reach an “optimal state” [4,5,6]. Consequently, the study of system resilience has evolved beyond the traditional scope. Over time, resilience research has enriched, emphasizing system variability and adaptability, with applications extending to psychology, sociology, disaster science, and other fields. Despite slight differences in applications across these disciplines, the fundamental focus remains on the system’s ability to return to its initial state after changes or disturbances [7,8,9,10].
In the context of tourism economic resilience, it is defined as the capacity of the tourism economic system to resist external disturbances and its ability to undergo structural transformation and development [11,12]. This concept can also be expressed as the ability of the tourism industry to recover to its original or better state in time when faced with economic fluctuations, natural disasters, government decisions, and other factors, which embodies the ability of the tourism economy to maintain stability in an unstable environment. It is a complex process to evaluate the resilience of the regional tourism economy, which helps us to fully understand the development trend and sustainable development ability of the tourism economy industry in this area. Its evaluation indicators cover many aspects, such as resilience, resistance, remodeling, and development. By using a scientific evaluation system and effective promotion methods, we can continuously improve the resilience of the tourism economy and promote the sustainable development of tourism. The research content of tourism economic resilience involves many aspects, including but not limited to the influence of external factors on the tourism economic industry, the regional differences of tourism economic resilience, the spatial changes of tourism economic resilience, and the promotion strategies of tourism economic resilience. Currently, international research on tourism economic resilience is relatively limited, focusing primarily on aspects such as tourism destination resilience, tourism industry resilience, and tourism community resilience. For instance, Cellini et al. [13] used the concept of resilience to explain the Italian tourism industry’s ability to withstand the national economic “Great Recession”. Dogru et al. [4] studied the vulnerability and recovery of the tourism industry under the impact of climate change. Susanne et al. [14] constructed a resilience evaluation system for tourism destinations using the “stable landscape” model and explored climate factors influencing resilience. Edward et al. [15], from an equilibrium theory perspective, examined regional economic resilience to disturbances, focusing on long-term development trends and proposing that crises can alter the internal structure of regional economies, significantly impacting the overall system. Research on coastal tourism destination resilience is a hot topic abroad, such as studies on the Caribbean region [16,17], Southeast Asian coastal regions [18,19], and the Indian Ocean coastal regions [20,21]. Due to their unique geographical locations, these areas often face global climate and environmental changes, natural meteorological disasters, and political crises, attracting considerable attention from international scholars [22,23,24].
In China, the concept of resilience has evolved from engineering resilience to ecological resilience and then to evolutionary resilience [25,26,27,28]. Evolutionary resilience discards the equilibrium theory of traditional ecological resilience, emphasizing the dynamic nature of regional development, aligning more with sustainable development principles, and gaining greater acceptance among scholars. This dynamic evolutionary perspective on resilience has gradually extended to socio-ecological fields and regional economic areas, focusing on urban resilience [29,30,31,32,33,34], regional economic resilience [35,36,37,38], and socio-ecological system resilience [39,40,41,42,43,44]. Domestic research on tourism resilience started relatively late and is mainly conducted on large and medium scales. For example, Guo Yongrui and others reviewed tourism community resilience from the perspectives of research origins, theoretical frameworks, influencing factors, and measurement methods, quantitatively studying the mechanism of key influencing factors on tourism community resilience in Jiuzhaigou and Dujiangyan [45,46]. Wang Qian and others conducted quantitative research on the tourism economic system resilience in China and Shandong Province [47,48]. Liu Xueying et al. [49] conducted an empirical study on the tourism development of ancient villages, using Shitou Village as a case study. Zhu Yuanyuan et al. [50] conducted an empirical measurement of the spatial pattern of red tourism resources in the revolutionary old area of Dabie Mountain. Xu Kaizhou et al. [51] studied the economic resilience of Kunming’s tourism industry under the impact of major epidemics. Research methods include structural equation modeling, spatial autocorrelation index, entropy method, SD method, and ARIMA model. In addition, with the normalization of epidemic prevention and control, qualitative studies on tourism industry resilience under sudden crisis events have emerged, such as Liu Peixue et al. [52] exploring tourism area resilience in the post-epidemic period, Li Xia et al. [53] studying the resilience of tourism enterprises under epidemic shocks and their mechanisms, and Hou Jiajia et al. [54] researching the resilience development of the tourism industry under public health emergencies. Feng Ling et al. [55] provided quantitative research methods for analyzing the spatiotemporal dynamic characteristics of tourism destination resilience post-epidemic. Pang Dongyan et al. [48] measured and analyzed the resilience and obstacle factors of Shandong Province’s tourism economic system. Li Shanshan [56] measured the resilience level of Xinjiang’s tourism economy and proposed countermeasures. Although domestic research on tourism resilience started late, it has achieved a high starting point due to previous research outcomes. Despite being immature, it significantly promotes sustainable development in the tourism industry and extends the research field of tourism resilience.
In summary, existing research has delved deeply into the concepts of resilience, regional resilience, economic resilience, urban resilience, and ecological resilience, both domestically and internationally. Internationally, resilience research started earlier and produced richer results, whereas domestic research began later, especially in tourism resilience, resulting in fewer achievements. However, as research methods mature, there is a trend of moving from qualitative to quantitative research. Current research on tourism economic resilience has the following pros and cons: firstly, the broadening application of resilience theory offers intellectual support for resilience building in urban, tourism, and ecological areas. Secondly, the concept and assessment index system of tourism economic resilience vary greatly, causing significant differences in assessment results. This study aims to establish a generally applicable index framework. Thirdly, current empirical research on tourism economic resilience is limited to specific areas. Therefore, exploring the spatiotemporal evolution and driving forces of tourism economic resilience from the provincial level in China is significant. It helps understand the resilience status of each province and proposes targeted strategies to enhance tourism economic resilience. This study selects the tourism economic resilience of Chinese provinces as the research object, constructs an evaluation index system and model, assesses the resilience, clarifies its distribution characteristics, explores its spatiotemporal evolution features and patterns, and reveals the driving mechanisms behind these changes, proposing targeted development strategies for resilience enhancement.

2. Overview, Research Methods, and Data Sources

2.1. Overview and Graphical Abstract

China, a country with a rich history in the East, boasts a unique combination of natural landscapes, folk customs, and cultural relics, giving it unparalleled advantages in the development of the tourism industry. Over the past 40 years of reform and opening-up, the scale of China’s tourism industry and its international competitiveness have shown significant improvements, increasingly influencing and contributing to the global tourism sector. According to data from the World Economic Forum (WEF), China is gradually closing the gap with developed countries in tourism development, showcasing enormous growth potential and broad development space. In recent years, with the recovery of the tourism market, the willingness of tourists to travel has continuously increased. The market scale of China’s tourism industry has steadily expanded, with significant growth in both the total number of tourists and tourism revenue. It has become one of the fastest-growing sectors with the strongest international competitiveness in the national economy. In 2023, with the optimization and adjustment of pandemic prevention policies, China’s tourism economy experienced a robust recovery. Domestic tourism reached 4.891 billion trips, an increase of 2.361 billion compared to the same period in 2022, a growth of 93.32%. Domestic tourism consumption totaled 4.91 trillion yuan, and total tourism revenue in China reached 5.29 trillion yuan. As the living standards of the people improve and the desire for tourism increases, the government continues to promote high-quality development of the tourism industry through ever-improving policies, providing strong guarantees for the prosperity of the tourism industry. Therefore, conducting research on the resilience of the provincial tourism economy in China is of great significance for the high-quality development of China’s tourism industry.
There is a graphic abstract that shows a graphical summary of the entire article, showing the logic of the article.

2.2. Indicator System

Drawing on existing research on tourism economic resilience and considering scientificity, availability, and representativeness, this study constructs a tourism economic resilience evaluation indicator system across four dimensions: resistance resilience, recovery resilience, reconstruction resilience, and development resilience, incorporating 20 tertiary indicators and using the Analytic Hierarchy Process (AHP) to calculate their weights (Table 1) [27,30,35,39,40,47,48]. By calculating the weight of each index, we can identify its importance, reduce the subjectivity of factors, and make the research results more fair and objective. Tourism resource richness, tourism economic development index, local economic foundation index, and tourism accessibility are used to measure the region’s ability to withstand shocks while maintaining its structure and function. The tourism facilities index and tourism labor force are used to evaluate the region’s ability to quickly recover its tourism economy after a shock. Tourism workforce population and tourism economic reconstruction capacity are used to guarantee the ability to restructure internal and external structures and functions. Tourism professional institutions and related innovative achievements are used to assess the region’s development resilience characteristics.

2.3. Research Methods

(1)
Moran’s I Index
Moran’s I is a statistical measure used to assess spatial autocorrelation, evaluating the degree of clustering or dispersion in geographic data. This study uses Moran’s I index to analyze the spatial evolution process of tourism economic resilience in China’s provinces, clarifying the cold and hot spots during the spatial evolution process and analyzing the “gradient effect” and “siphon effect” of the provincial distribution. The calculation formula for Moran’s I is as follows:
I = i = 1 n j = 1 n W i j X i X ¯ X j X ¯ S 2 i = 1 n j = 1 n W i j   where   S 2 = i = 1 n X i X ¯ 2 ,   X ¯ = 1 n i = 1 n X i
where n is the number of cities, X i   and   X j are the tourism economic resilience indices of regions i and j , respectively, X ¯ is the mean value of tourism economic resilience, W i j is the spatial weight matrix, and S 2 is the variance of tourism economic resilience.
(2)
Kernel Density Estimation (KDE)
Kernel Density Estimation (KDE) is a non-parametric method used in statistics to estimate the probability density function of a random variable. This study uses the Gaussian kernel density function to examine the spatial heterogeneity of provincial tourism economic resilience in horizontal dimensions.
(3)
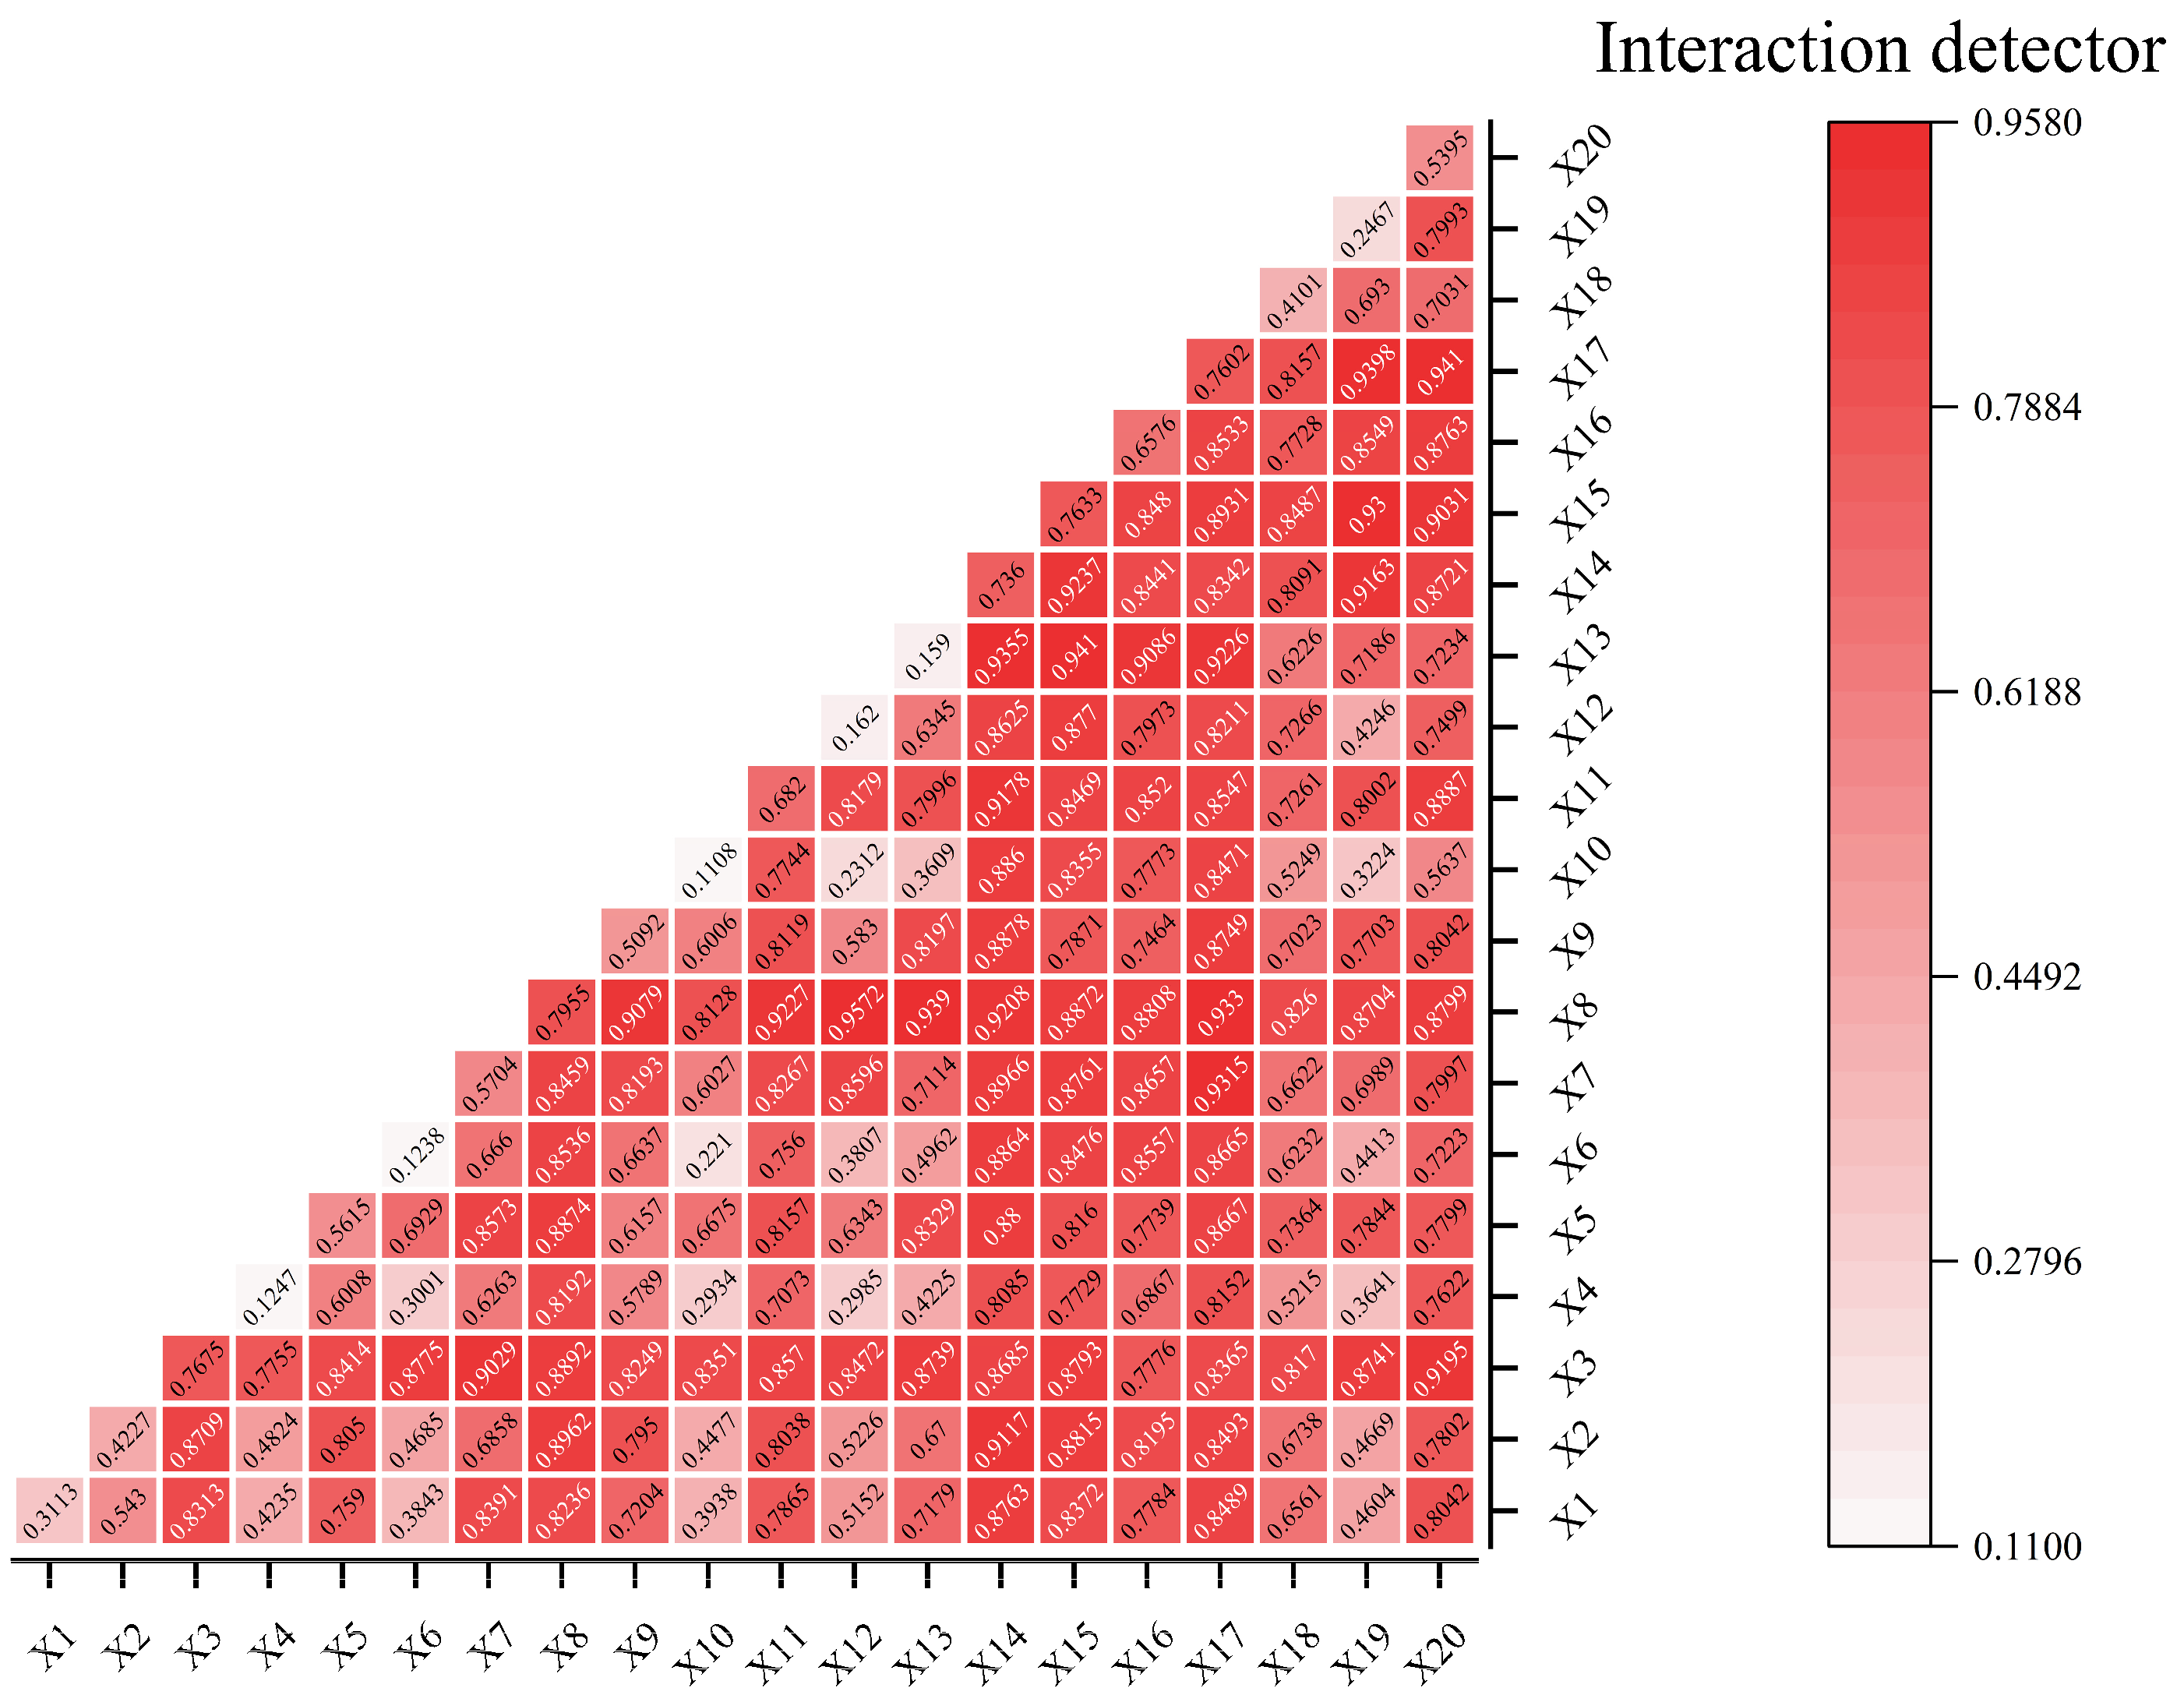
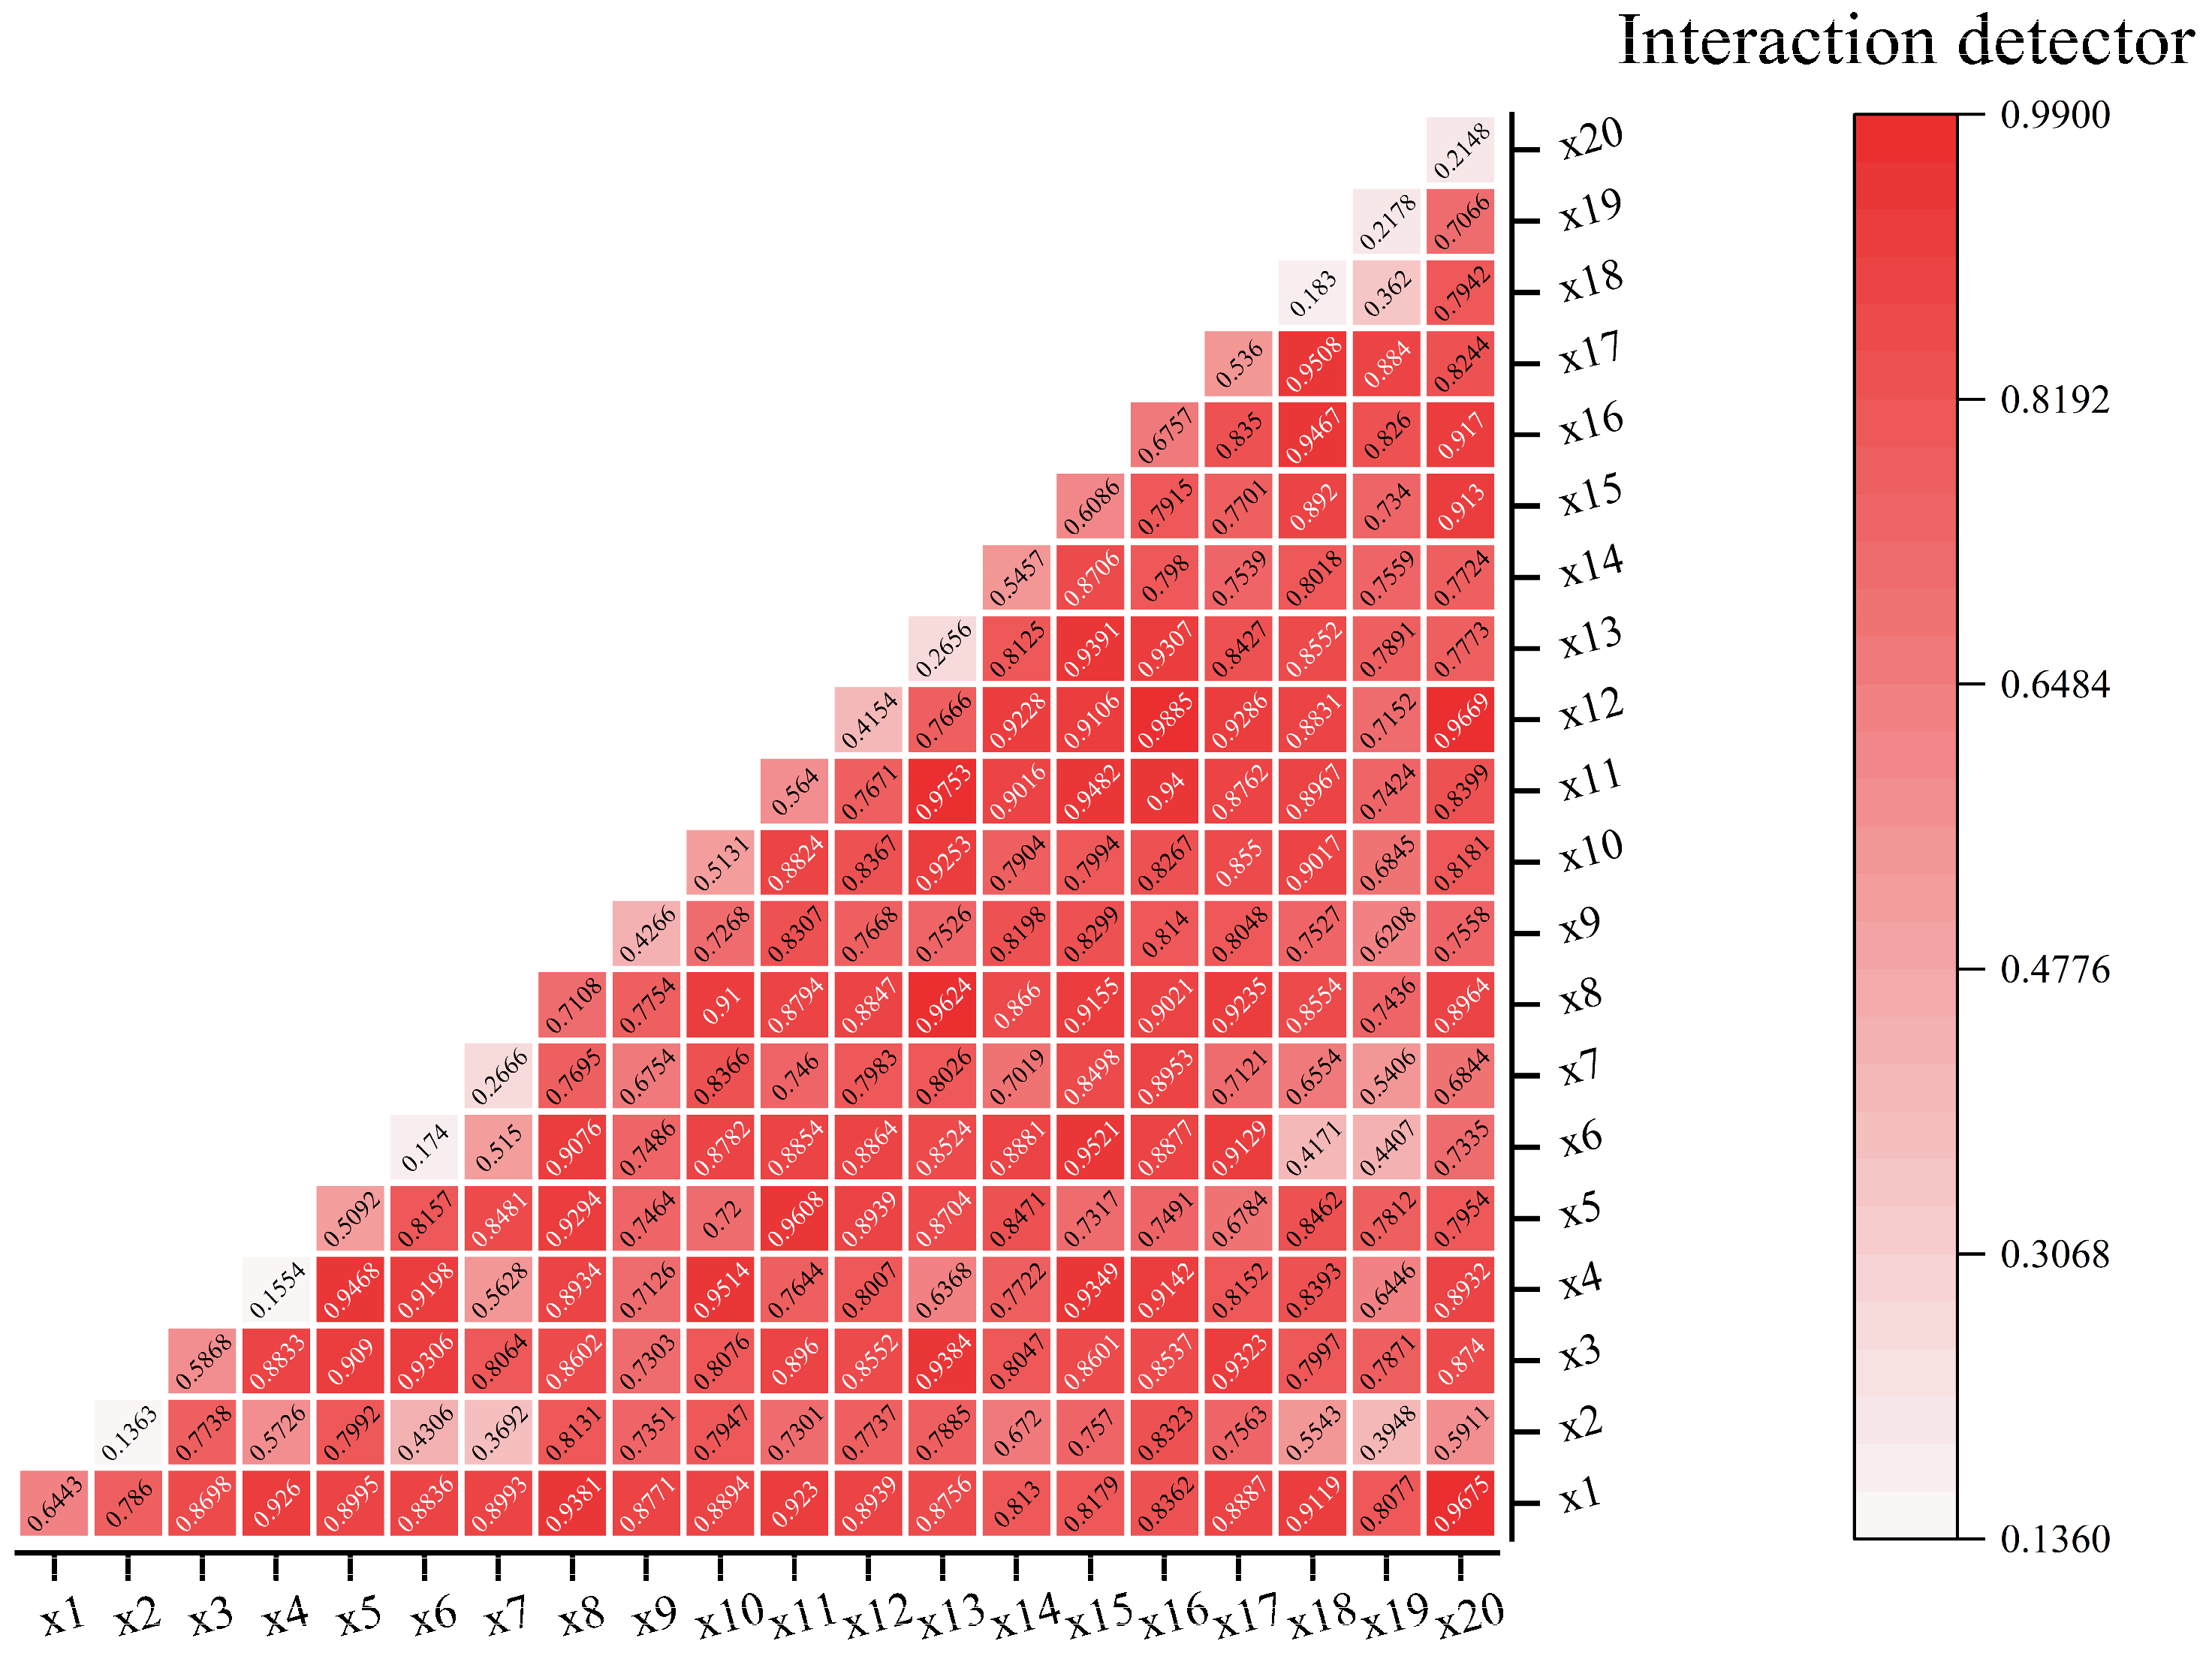
Geographical Detector
Spatial differentiation is a fundamental characteristic of geographical phenomena. The geographical detector is a tool for detecting and utilizing spatial differentiation, consisting of four detectors: differentiation and factor detection, detection of spatial differentiation of Y, and detection of the extent to which factor X explains the spatial differentiation of attribute Y. This study uses the geographical detector model to analyze the driving factors during the spatiotemporal evolution of provincial tourism economic resilience in China, revealing the driving mechanisms behind the spatiotemporal evolution of tourism economic resilience. Factor detection uses the q value as a measurement, with the model formula expressed as follows:
q = 1 1 N σ 2 m = 1 L N m σ 2 m
where q measures the spatial heterogeneity of an indicator, ranging from (0, 1); N is the total sample number in the study area, σ 2 m is the variance of indicator, m = 1, 2, , L, m is the number of categories or zones. A higher q value indicates stronger spatial stratified heterogeneity and vice versa.

2.4. Data Sources

The tourism economic resilience evaluation indicator system includes 4 first-level indicators, 10 second-level indicators, and 20 third-level indicators. Data sources include the “China Tourism Yearbook”, “China Science and Technology Yearbook”, provincial tourism yearbooks, “China Population and Employment Statistical Yearbook”, and national economic and social development statistical bulletins. In the study of spatiotemporal evolution, spatial data are sourced from the National Earth System Science Data Center of China (http://www.geodata.cn/ accessed on 30 June 2024). The image source in the article is the data-sharing center of the China Academy of Sciences, and various thematic maps are made based on this downloaded data.

3. Evaluation of Tourism Economic Resilience

3.1. Model Construction

Based on the aforementioned indicator system, this study uses weighted summation to obtain the indices for each subsystem and the comprehensive resilience evaluation index. The calculation formula is:
D i = j = 1 d w j λ i j ,   H i = j = 1 h w j λ i j , T i = j = 1 t w j λ i j ,   C i = j = 1 c w j λ i j
R i = j = 1 n w j λ i j = D i + H i + T i + C i
where i represents the resistance resilience, recovery resilience, reconstruction resilience, and development resilience indices of province i; D i , H i , T i , C i represent the number of indicators in the four subsystems, respectively; T i is the comprehensive tourism resilience evaluation index. For easier analysis and comparison in subsequent research, this study divides the tourism resilience evaluation index R i into five levels (low, relatively low, medium, relatively high, high) at 0.05 intervals. Higher values indicate higher levels and stronger tourism economic resilience.

3.2. Tourism Economic Resilience Evaluation Results Analysis

The results of the tourism economic resilience evaluation for China’s 31 provinces from 2012 to 2022 were calculated, selecting cross-sectional data for 2012, 2017, and 2022. Using ArcGIS, the spatial patterns of the tourism economic system resilience levels were mapped (Figure 1). The findings are as follows:
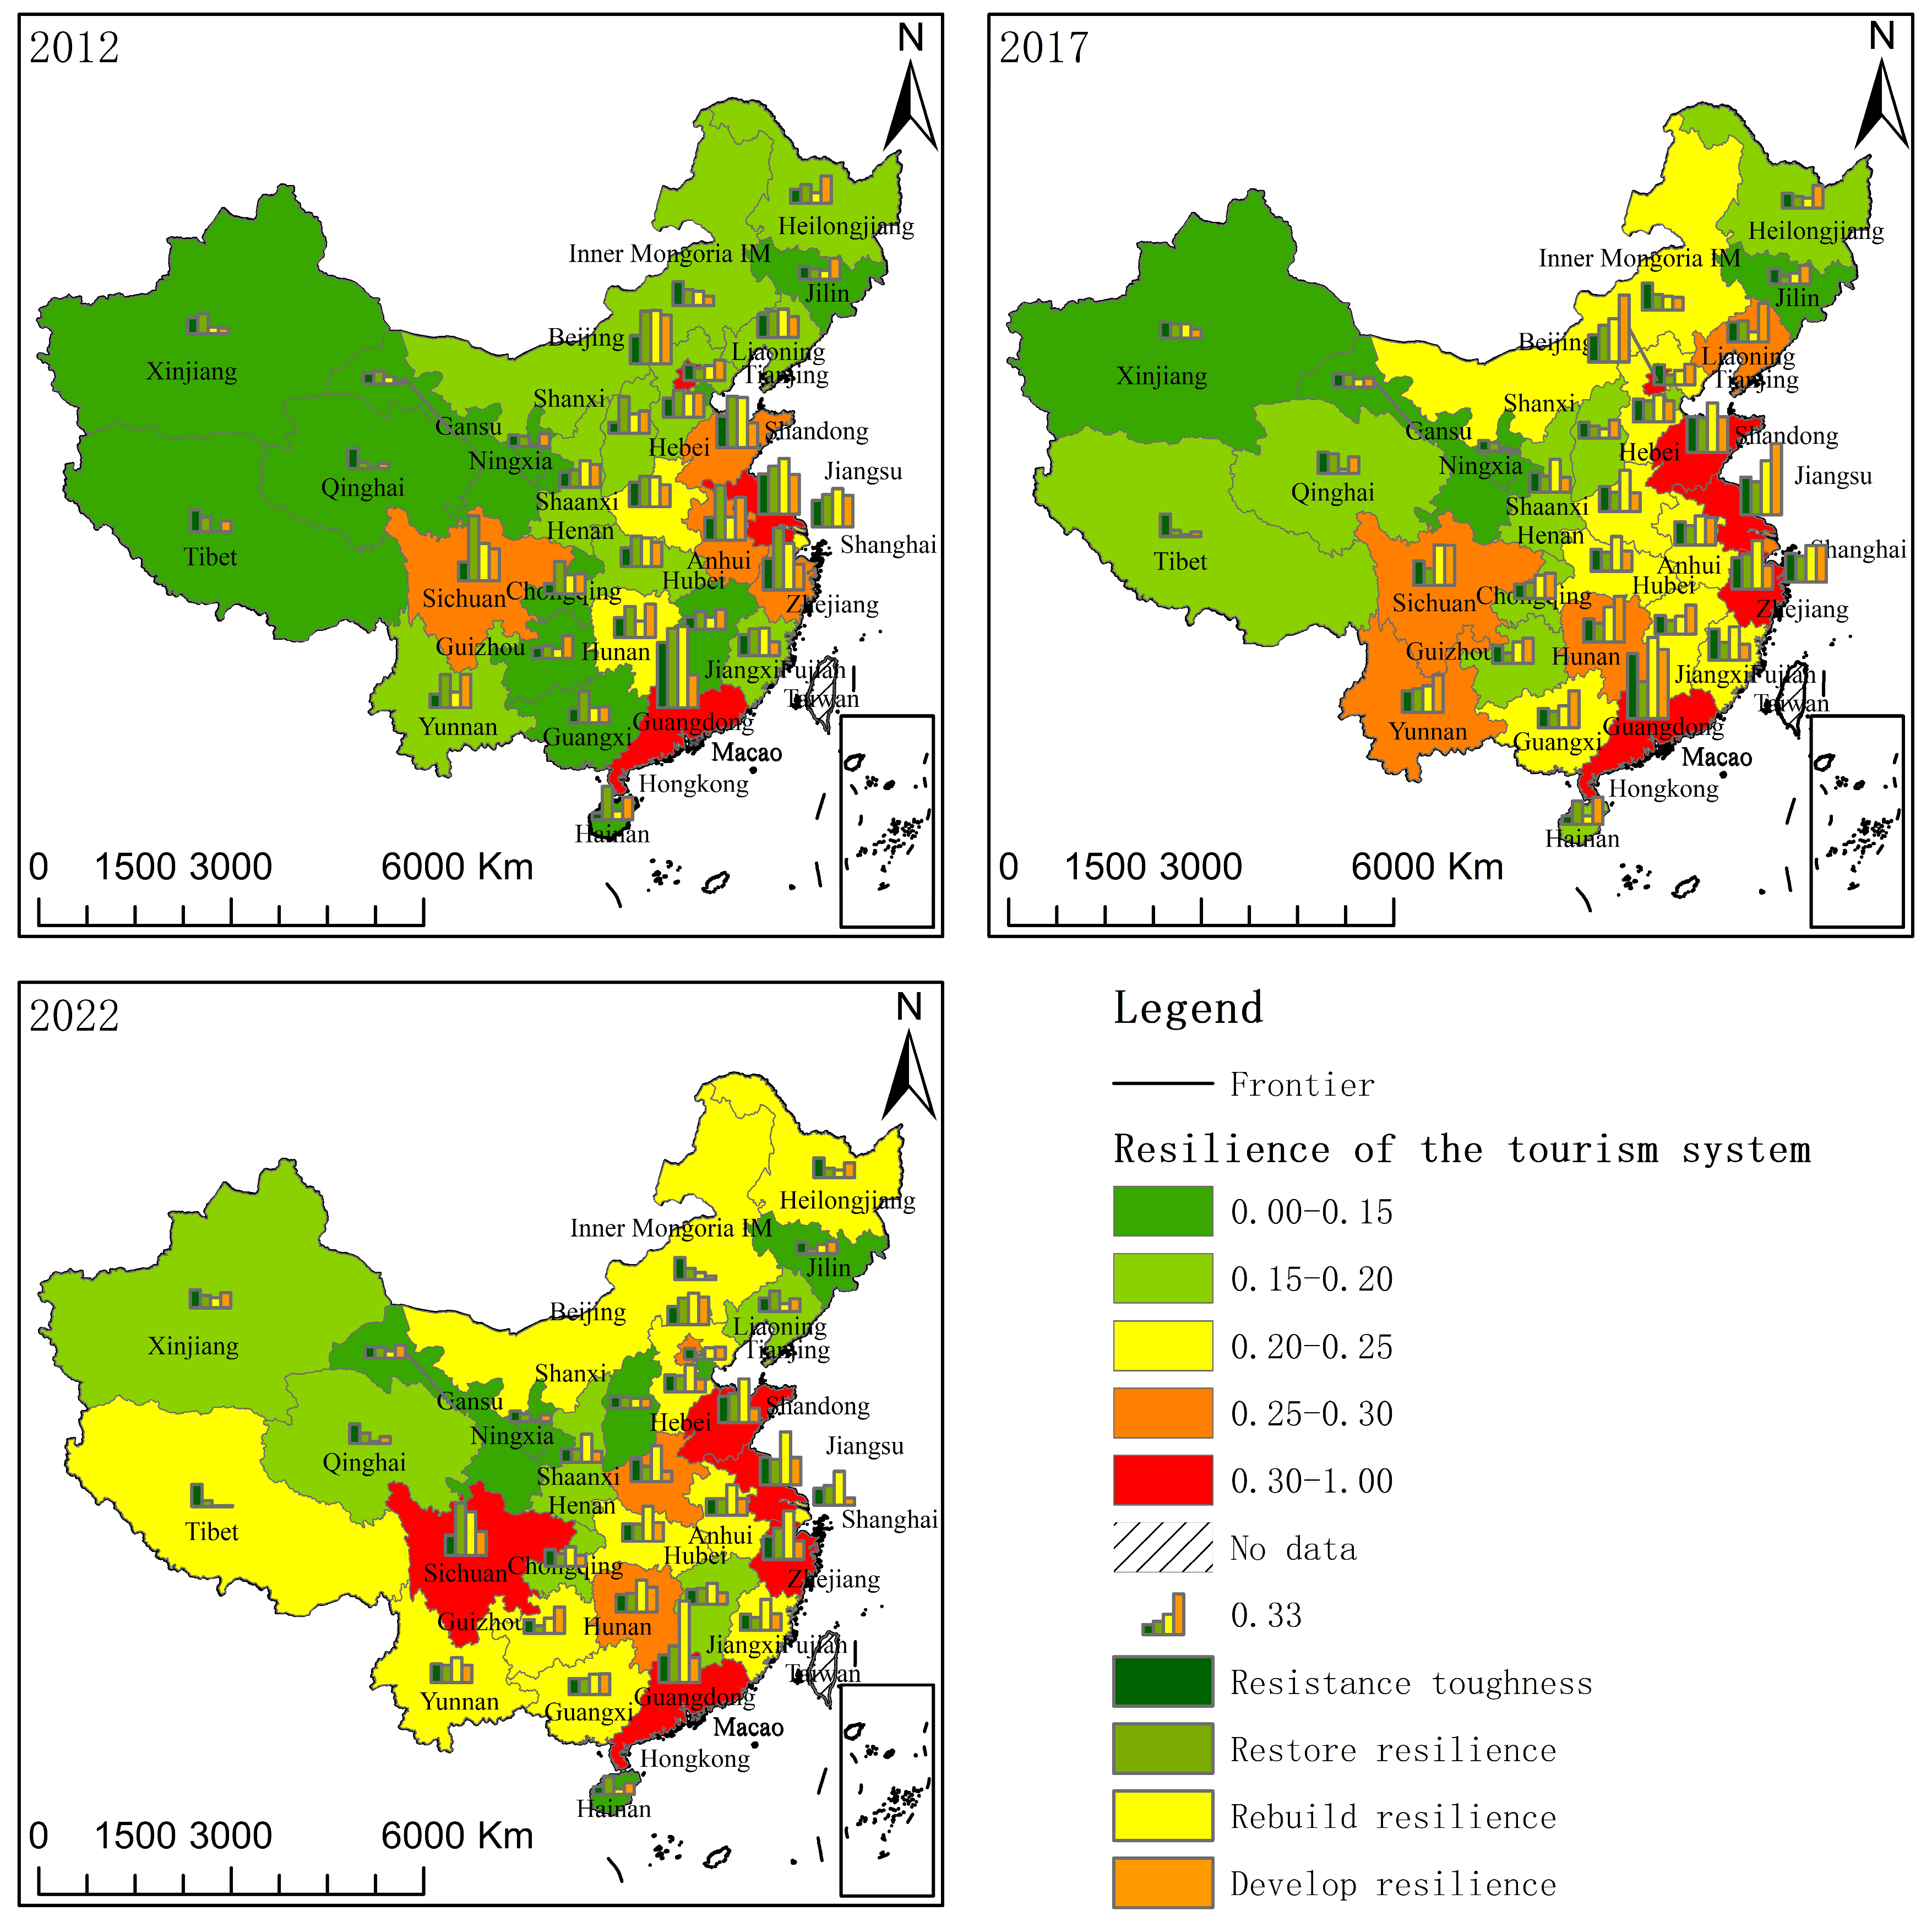
  • In 2021, only Jiangsu and Guangdong provinces reached a high resilience state, with most provinces and cities in relatively low to low resilience states. Relatively low resilience states were mainly distributed in northeast and southern China, while low resilience states were primarily in the Qinghai–Tibet and northwest regions.
  • In 2017, most provinces and cities showed an upward trend in tourism economic resilience. The Yangtze River Delta, one of the regions with economic vitality and development potential, saw positive developments in tourism economic resilience, becoming the most densely populated high-resilience region in China.
  • By the end of the study period, Shandong, Jiangsu, Zhejiang, Guangdong, and Sichuan provinces reached high tourism economic resilience states with strong adaptability and recovery capabilities. Most provinces and cities were above medium tourism economic resilience levels, with significant differences between provinces and cities. Eastern China formed a concentrated area of high tourism economic resilience.
Overall, most provinces and cities in China showed varying degrees of improvement in tourism economic resilience over time. Although there were significant improvements compared to the initial study period, the growth rate in 2022 was smaller than in the previous period, closely related to the impact of the pandemic. By the end of the study period, only a few provinces and cities were at low resilience levels. Additionally, there was a significant disparity in tourism economic resilience between coastal and inland cities, with high resilience regions in China showing a clear “coastal and border” clustering tendency. This indicates that provincial tourism economic resilience is closely related to local economic development levels.

4. Spatiotemporal Evolution of Provincial Tourism Economic Systems in China

4.1. Temporal Evolution Analysis

Using Kernel Density Estimation (KDE), the temporal evolution of China’s tourism economic resilience was further analyzed. Figure 2 and Figure 3 display the dynamic distribution and evolution characteristics of development resilience, reshaping resilience, resistance resilience, recovery resilience, and overall tourism system resilience during the study period. The analysis reveals the following:
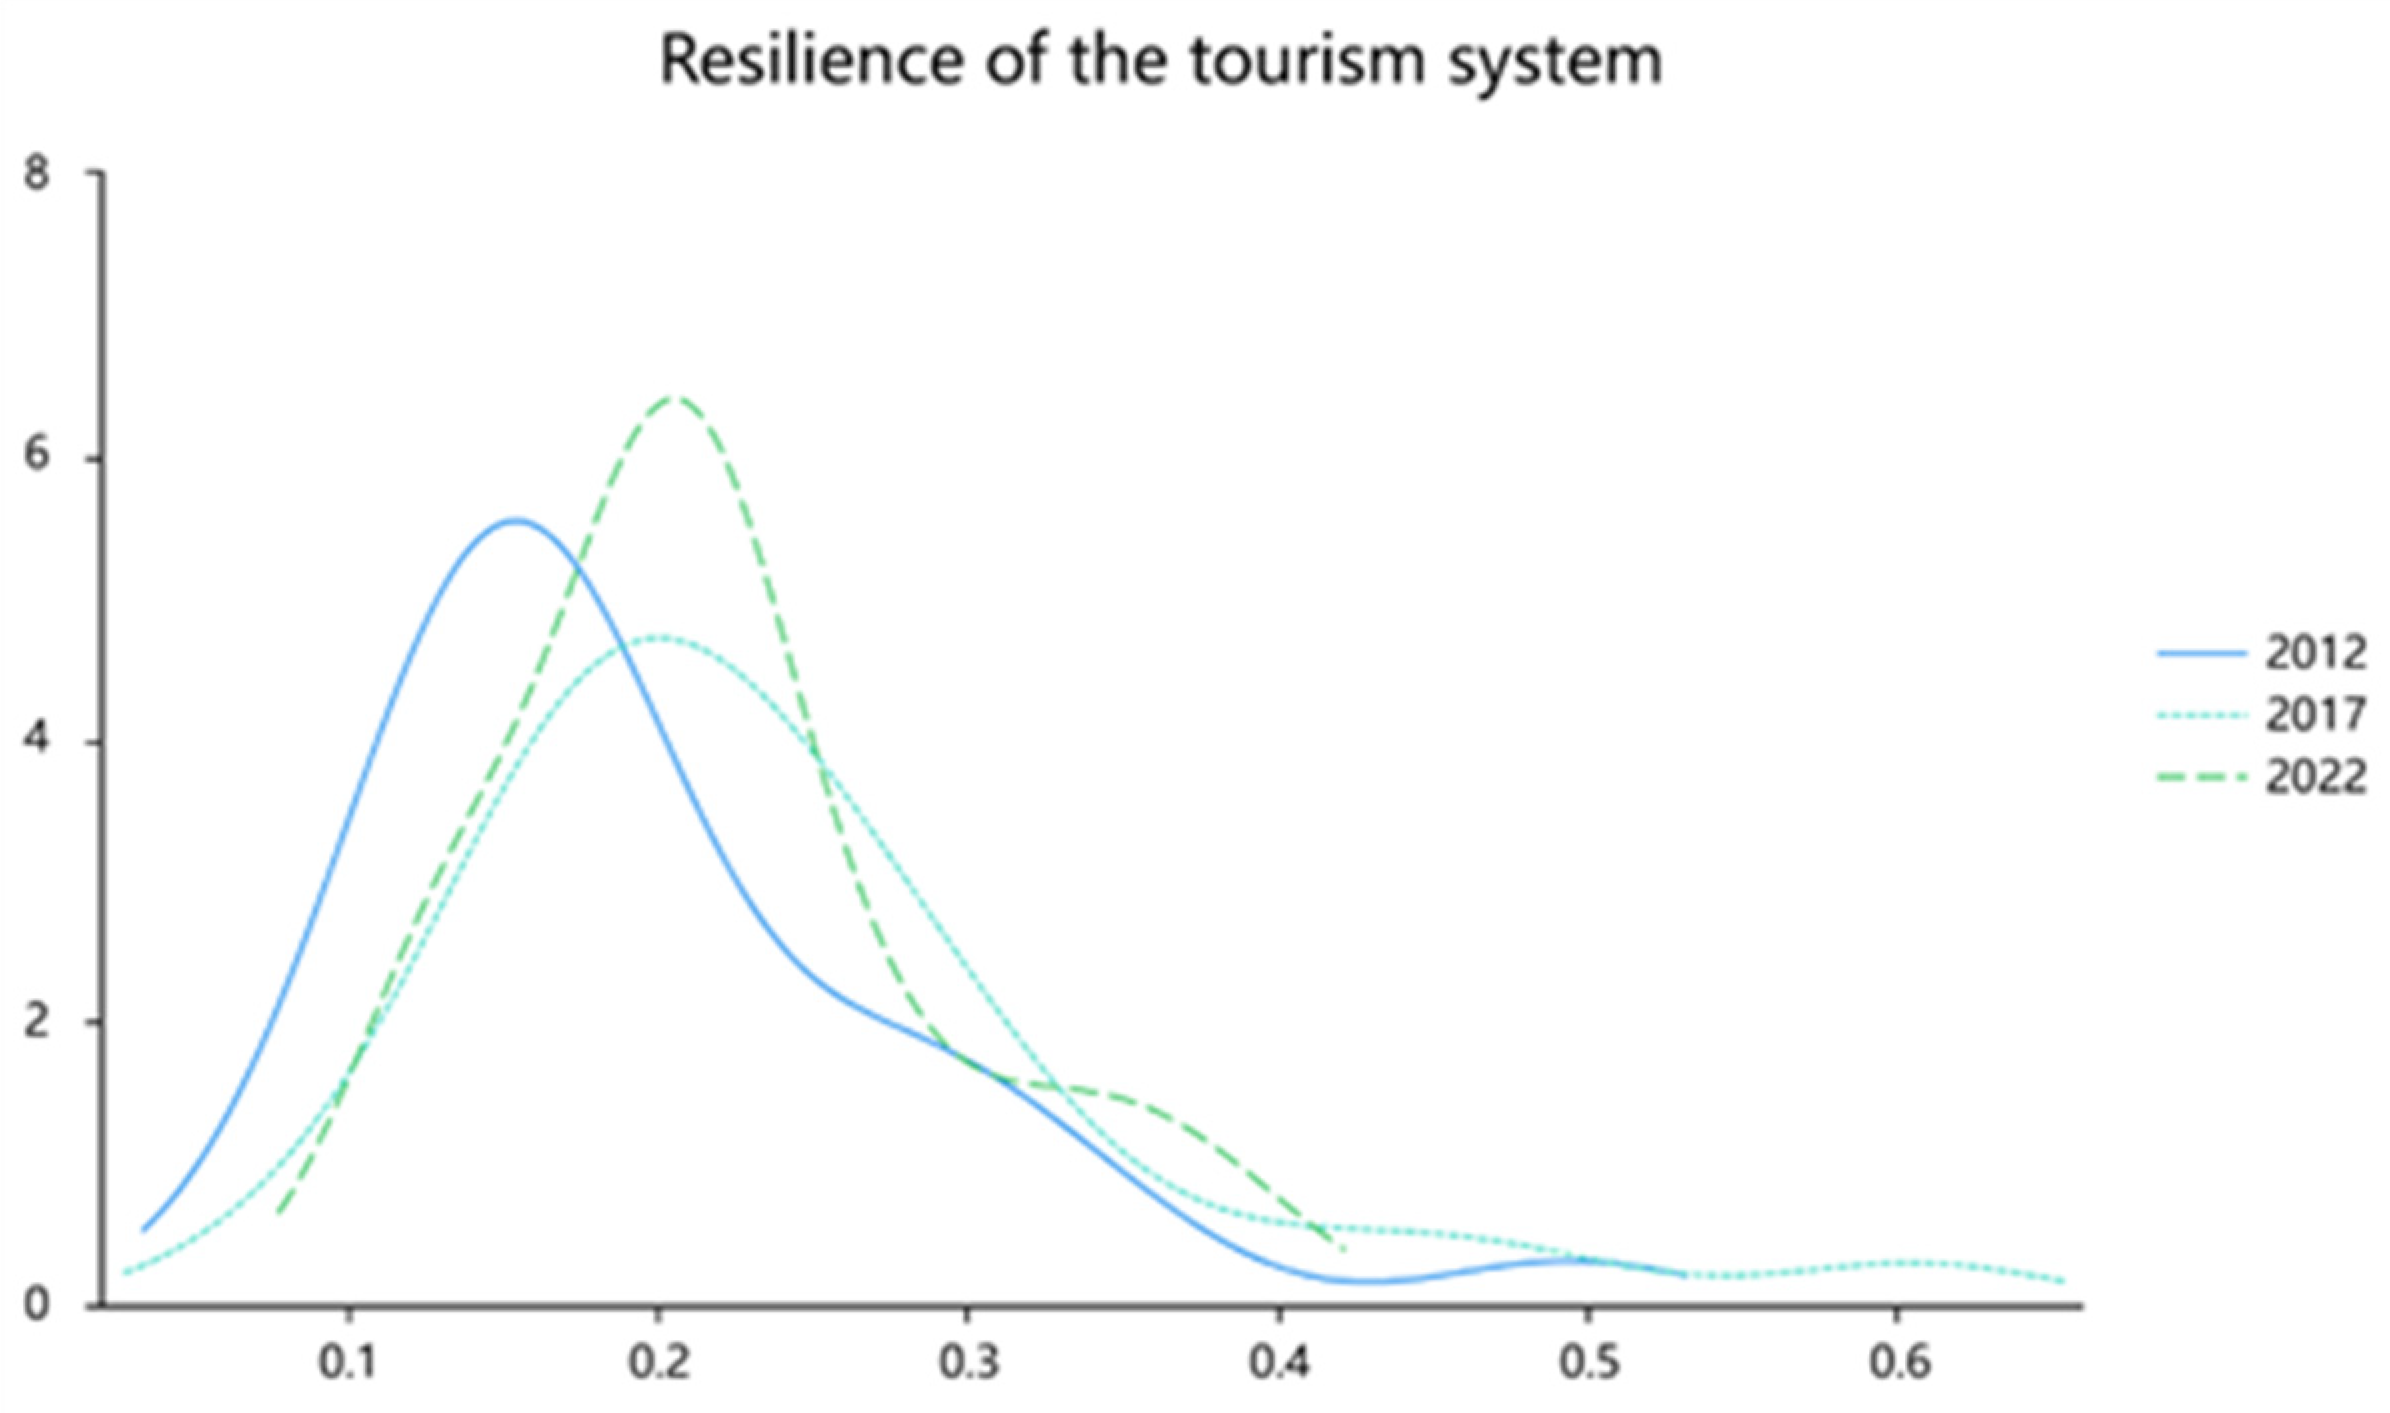
  • Distribution Location: The centers of resistance resilience and overall tourism system resilience have shifted to the right, indicating an upward trend in these areas. In contrast, the center of development resilience has moved to the left, suggesting a slight decline during the study period. Reshaping resilience and recovery resilience remained stable throughout the study period;
  • Distribution Extensibility: The density function curves for reshaping resilience and recovery resilience exhibit a rightward tail, indicating significant regional differences in tourism economic resilience across China;
  • Polarization Phenomenon: Each type of resilience (development, resistance, recovery, and overall tourism system) presents a single peak, indicating the absence of regional polarization. The transformation from broad to sharp peaks, with a decrease in the left-end area, suggests an overall increasing trend in tourism economic resilience across most provinces and cities. Additionally, there is a clear differentiation between high-value and low-value areas, reflecting significant regional economic disparities in China’s tourism economic resilience.

4.2. Spatial Evolution Analysis

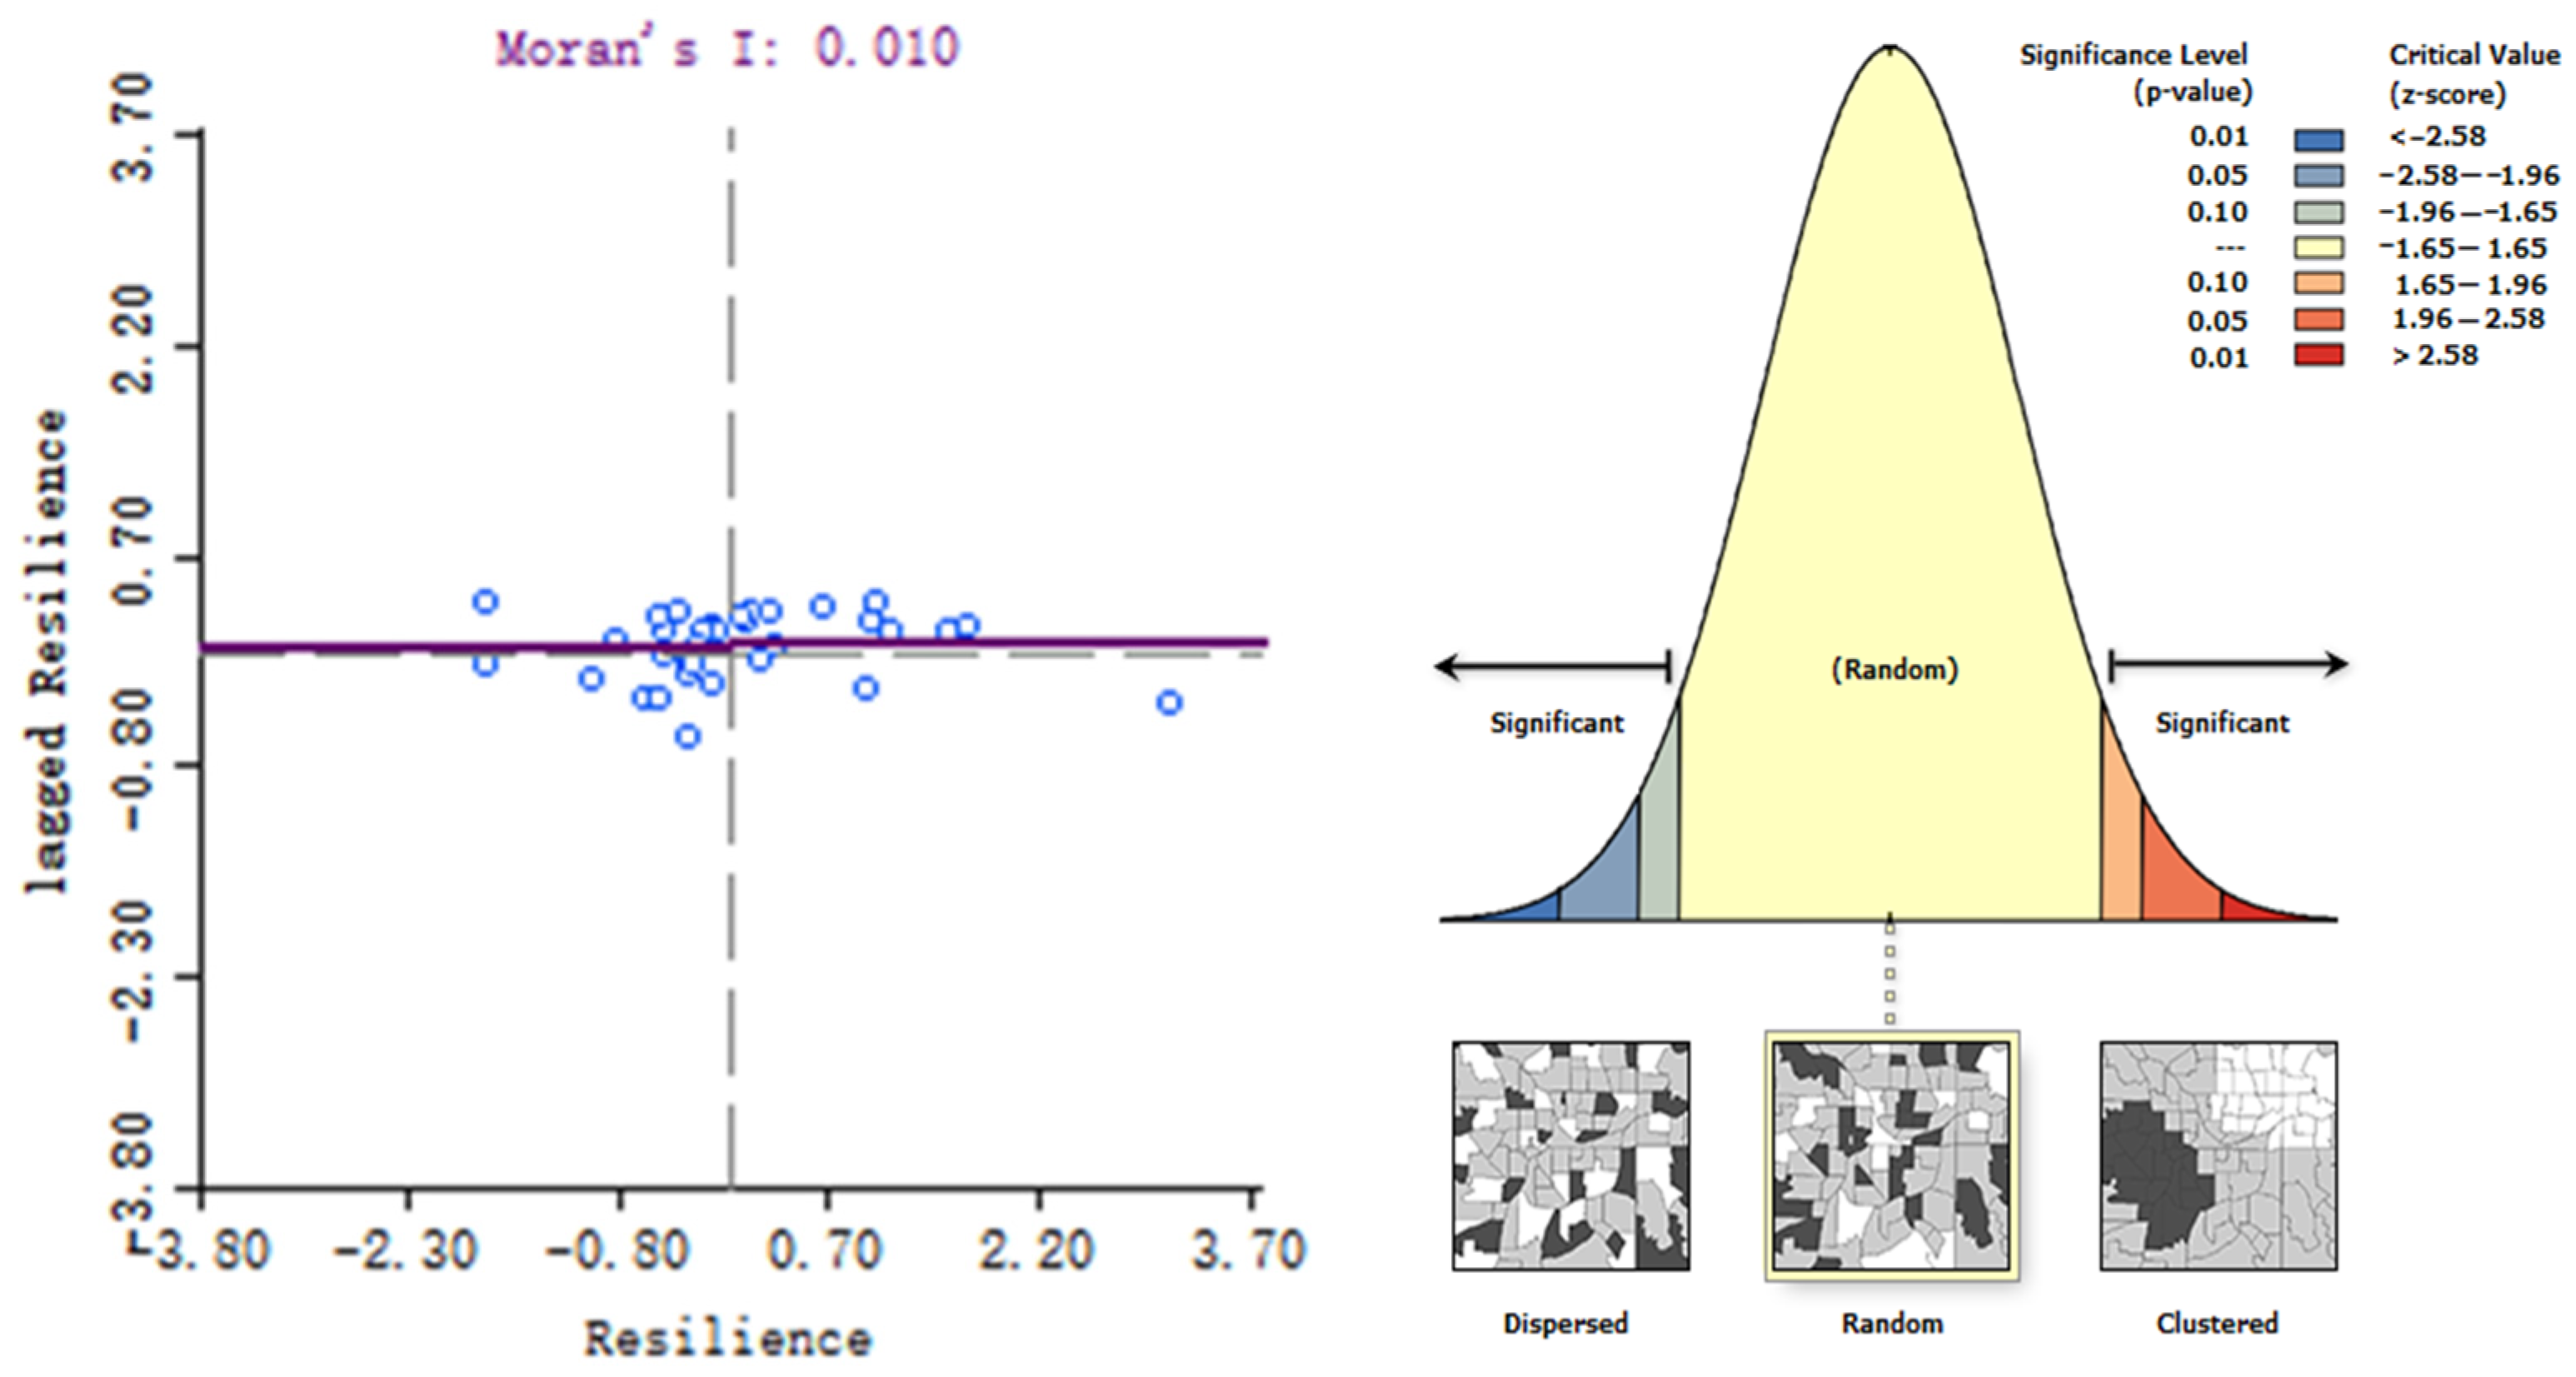
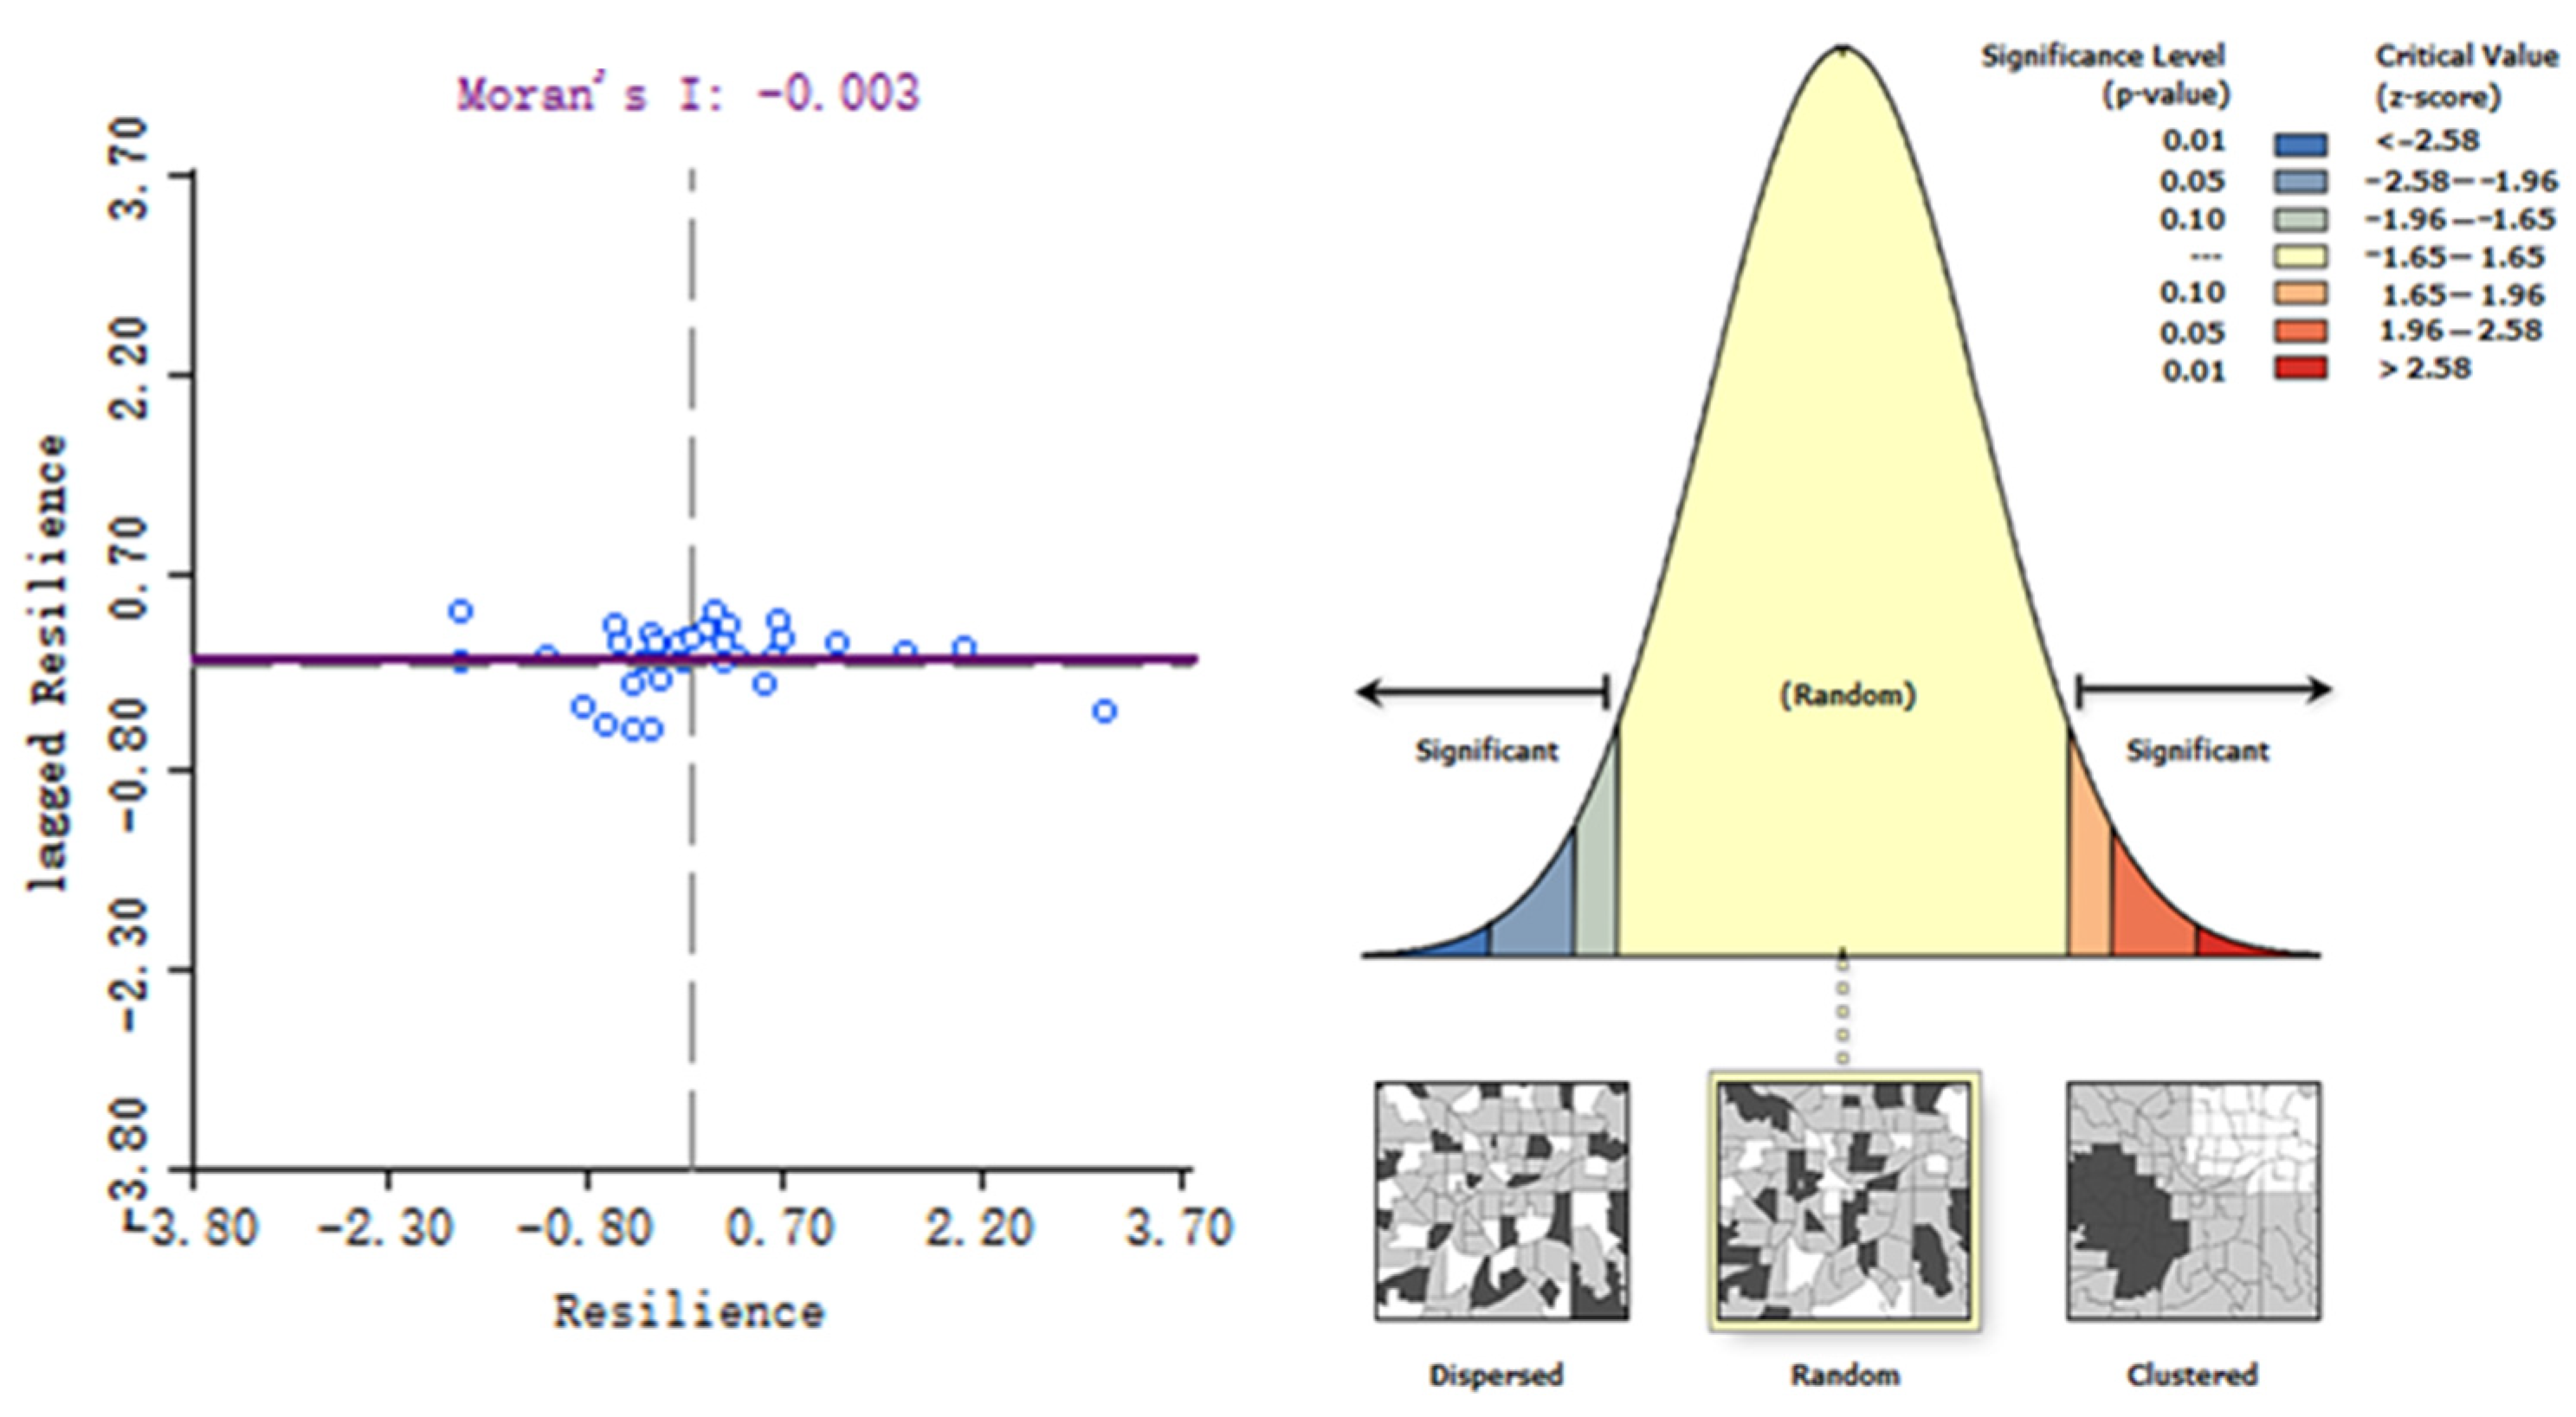
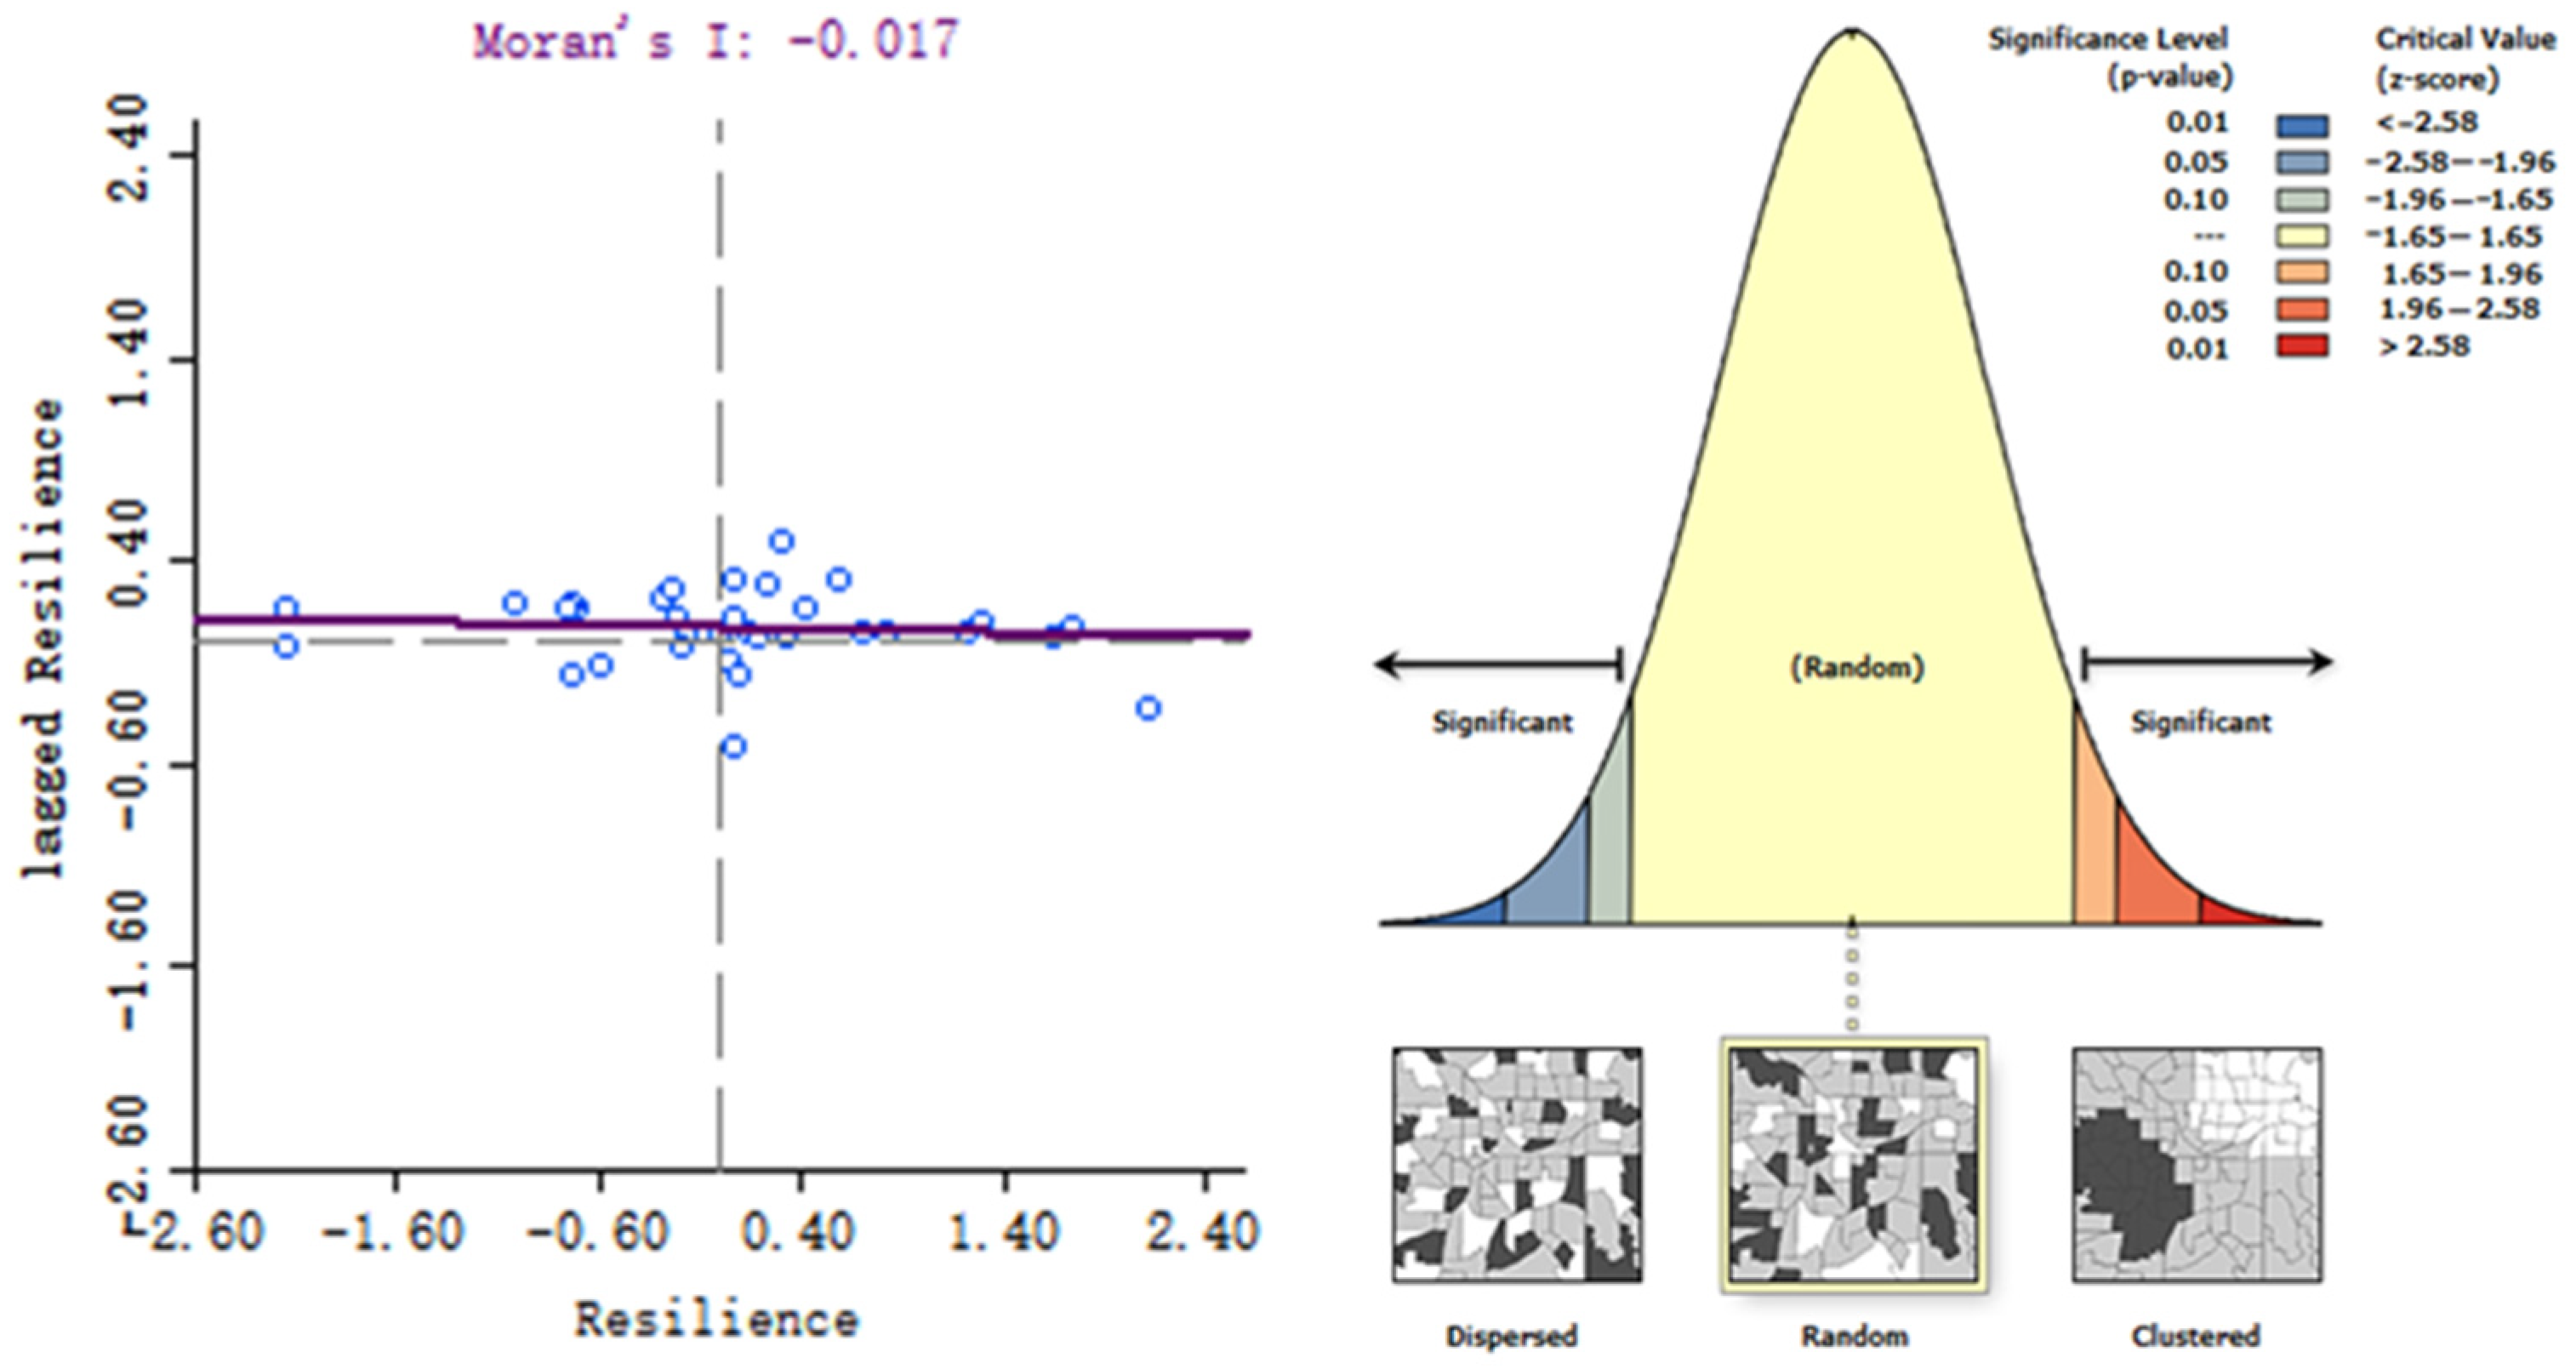
4.2.1. Moran’s I Index

The spatial evolution of China’s provincial tourism economic resilience was analyzed using Moran’s I index (Figure 4, Figure 5 and Figure 6). It is used to judge whether the tourism economic resilience is related in space, whether there is an aggregation or dispersion state, that is, whether the regions with high tourism economic resilience tend to gather together and whether the regions with low tourism economic resilience tend to gather together. The Moran’s I index typically ranges from [−1, 1]. A value less than 0 indicates a negative correlation; a value greater than 0 indicates a positive correlation; a value of 0 indicates no spatial correlation, signifying randomness. The Moran’s I index categorizes provinces into four types of clusters: HH (high–high), LH (low–high), LL (low–low), and HL (high–low). HH regions indicate high tourism economic resilience levels both locally and in surrounding areas (positive correlation); LH regions indicate low local resilience but high surrounding resilience (negative correlation); LL regions indicate low resilience both locally and in surrounding areas (positive correlation); HL regions indicate high local resilience but low surrounding resilience (negative correlation).
During the study period, the Moran’s I index decreased from 0.010 to −0.017, with a reduction in the clustering degree of HH, LH, HL, and LL regions, forming a distribution pattern of diffusion from core to peripheral areas, leading to increasing spatial disparity among provinces.

4.2.2. Cold and Hot Spot Analysis

Using the Hot Spot Analysis tool in ArcGIS 10.6, the results were categorized into seven types: hot spots (99% confidence), secondary hot spots (95% confidence), marginal hot spots (90% confidence), non-significant areas, marginal cold spots (90% confidence), secondary cold spots (95% confidence), and cold spots (99% confidence).
The cold and hot spot analysis indicates spatial heterogeneity in China’s provincial tourism economic resilience, with different factors influencing different provinces (Figure 7). The spatial pattern of cold and hot spots showed only slight changes, with Zhejiang consistently being a hot spot throughout the study period, demonstrating strong and stable tourism economic resilience. Furthermore, the southeastern provinces formed major hot spot regions, exhibiting a spatial clustering pattern, whereas most other cities were non-significant, reflecting a trend where southern regions outperform northern regions in tourism economic resilience. To further explore the driving factors behind these spatial differences, a geographical detector was used for analysis.

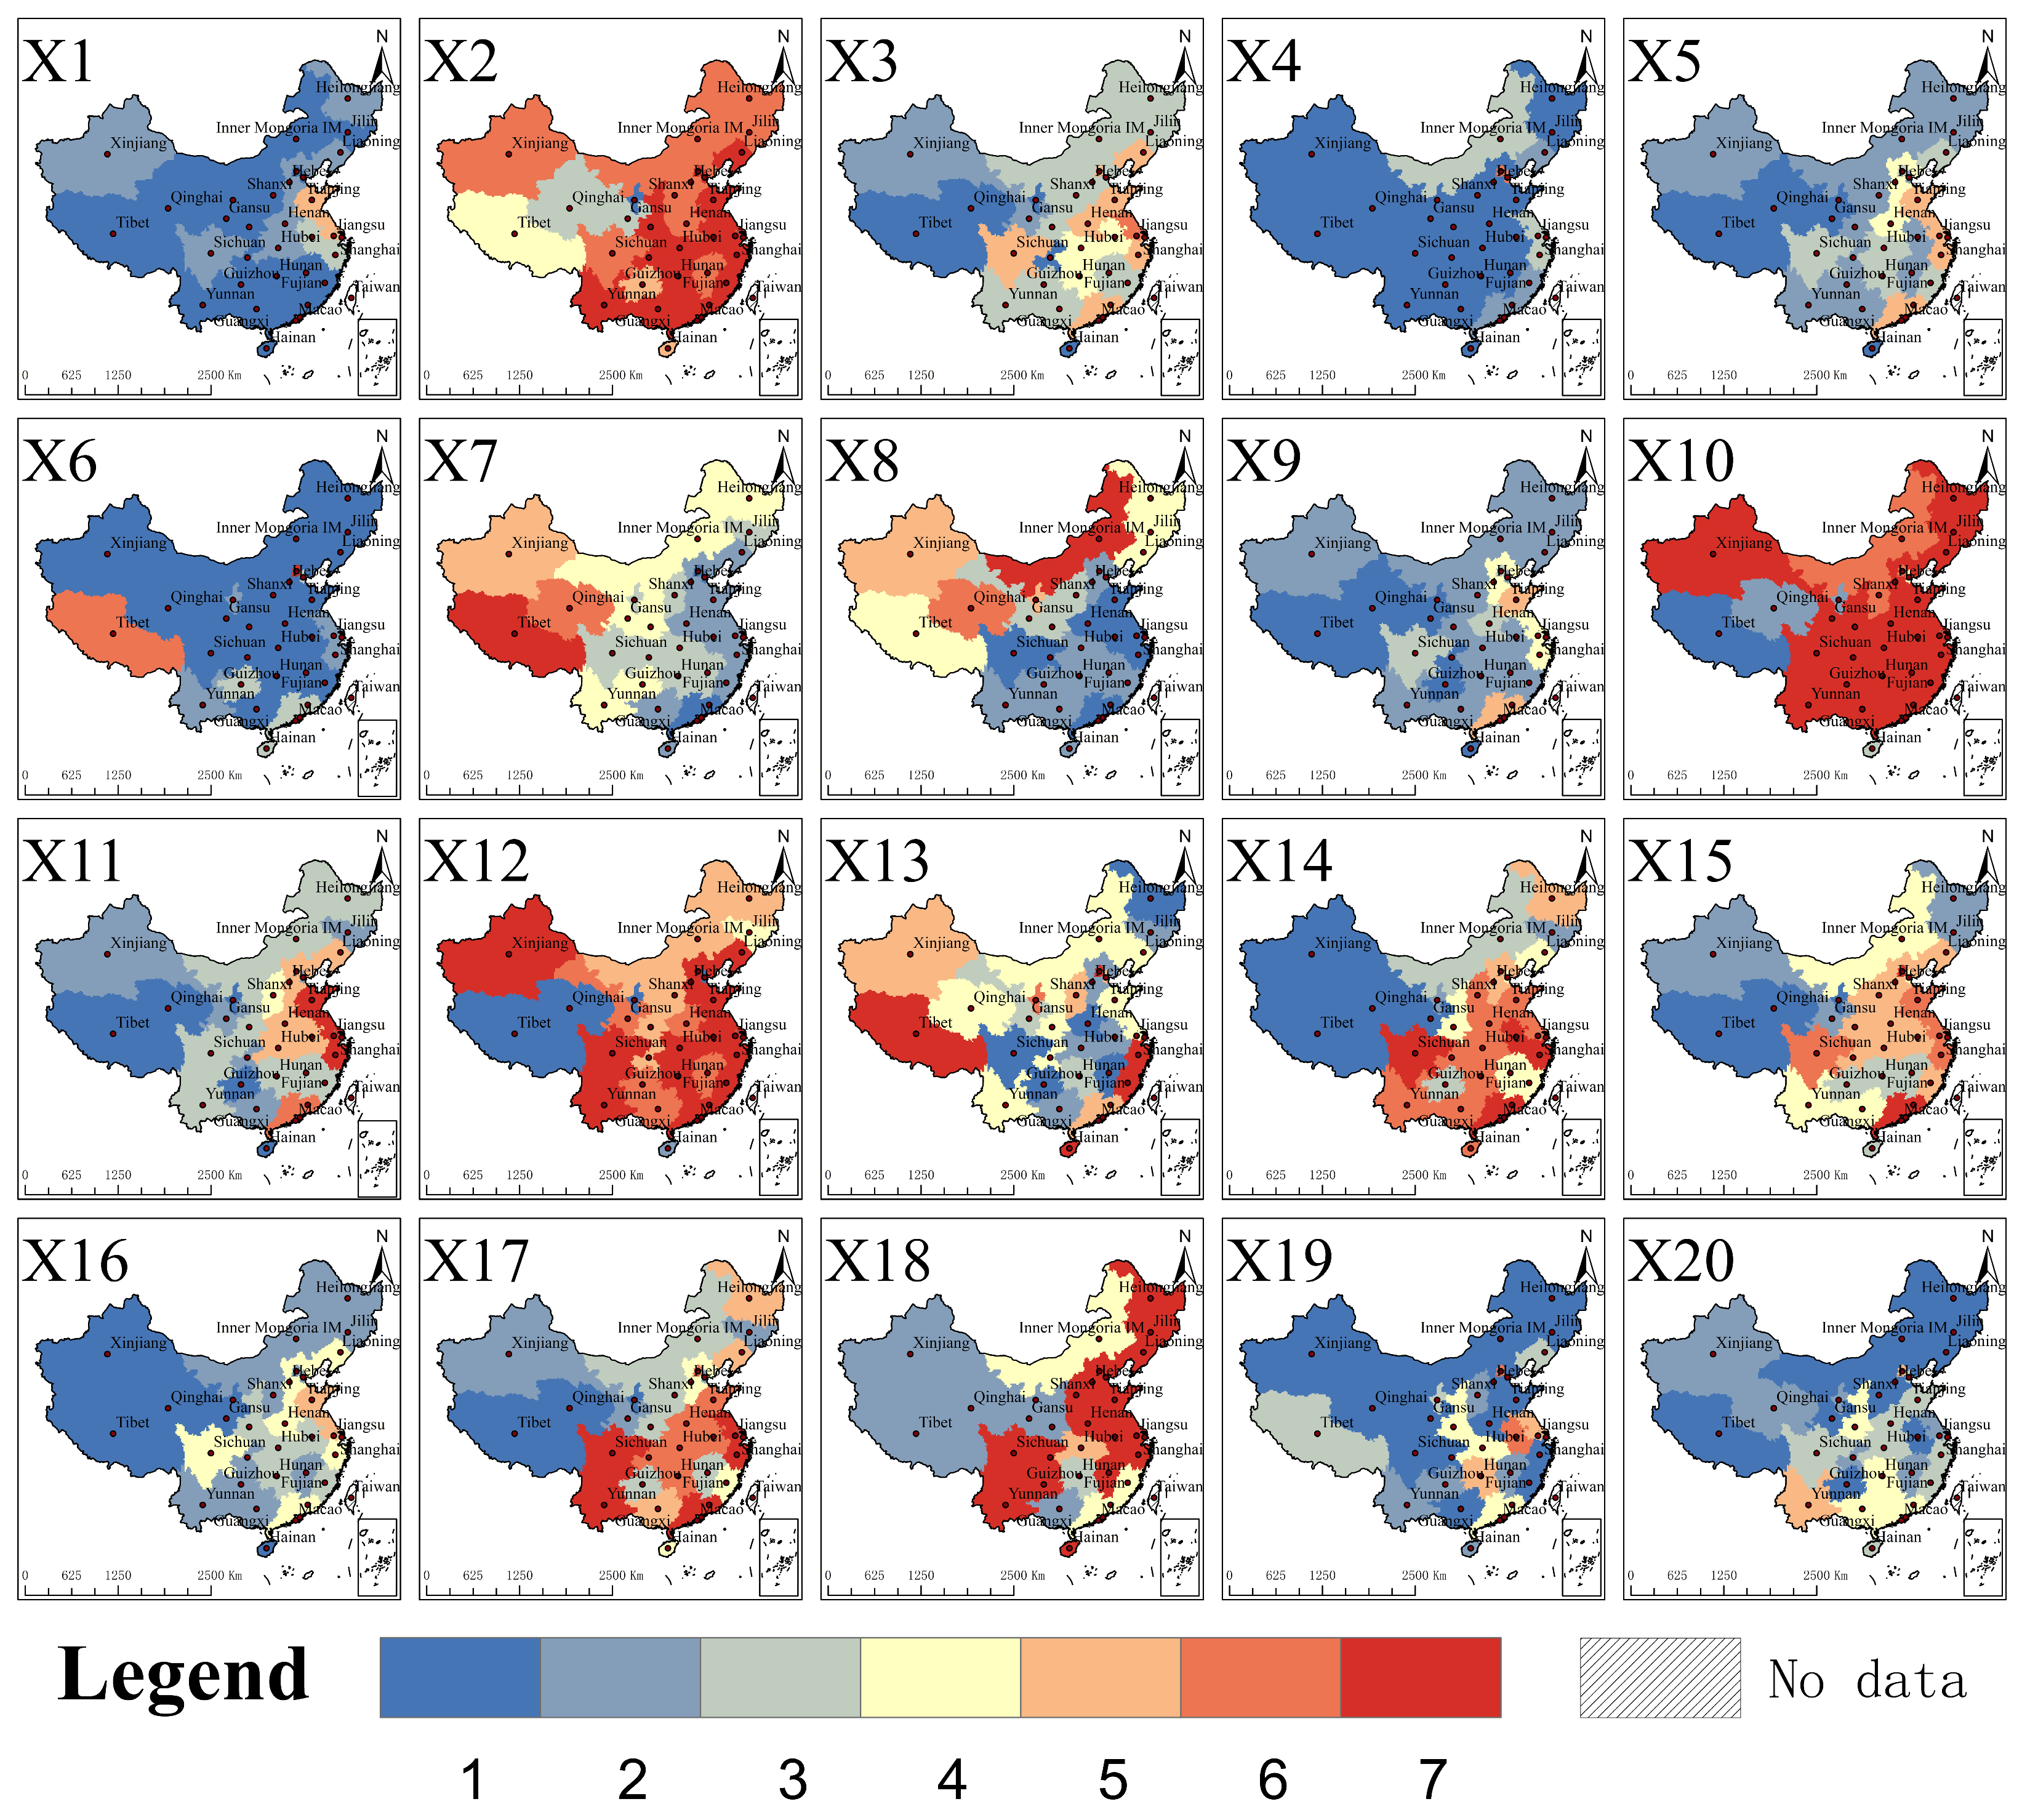
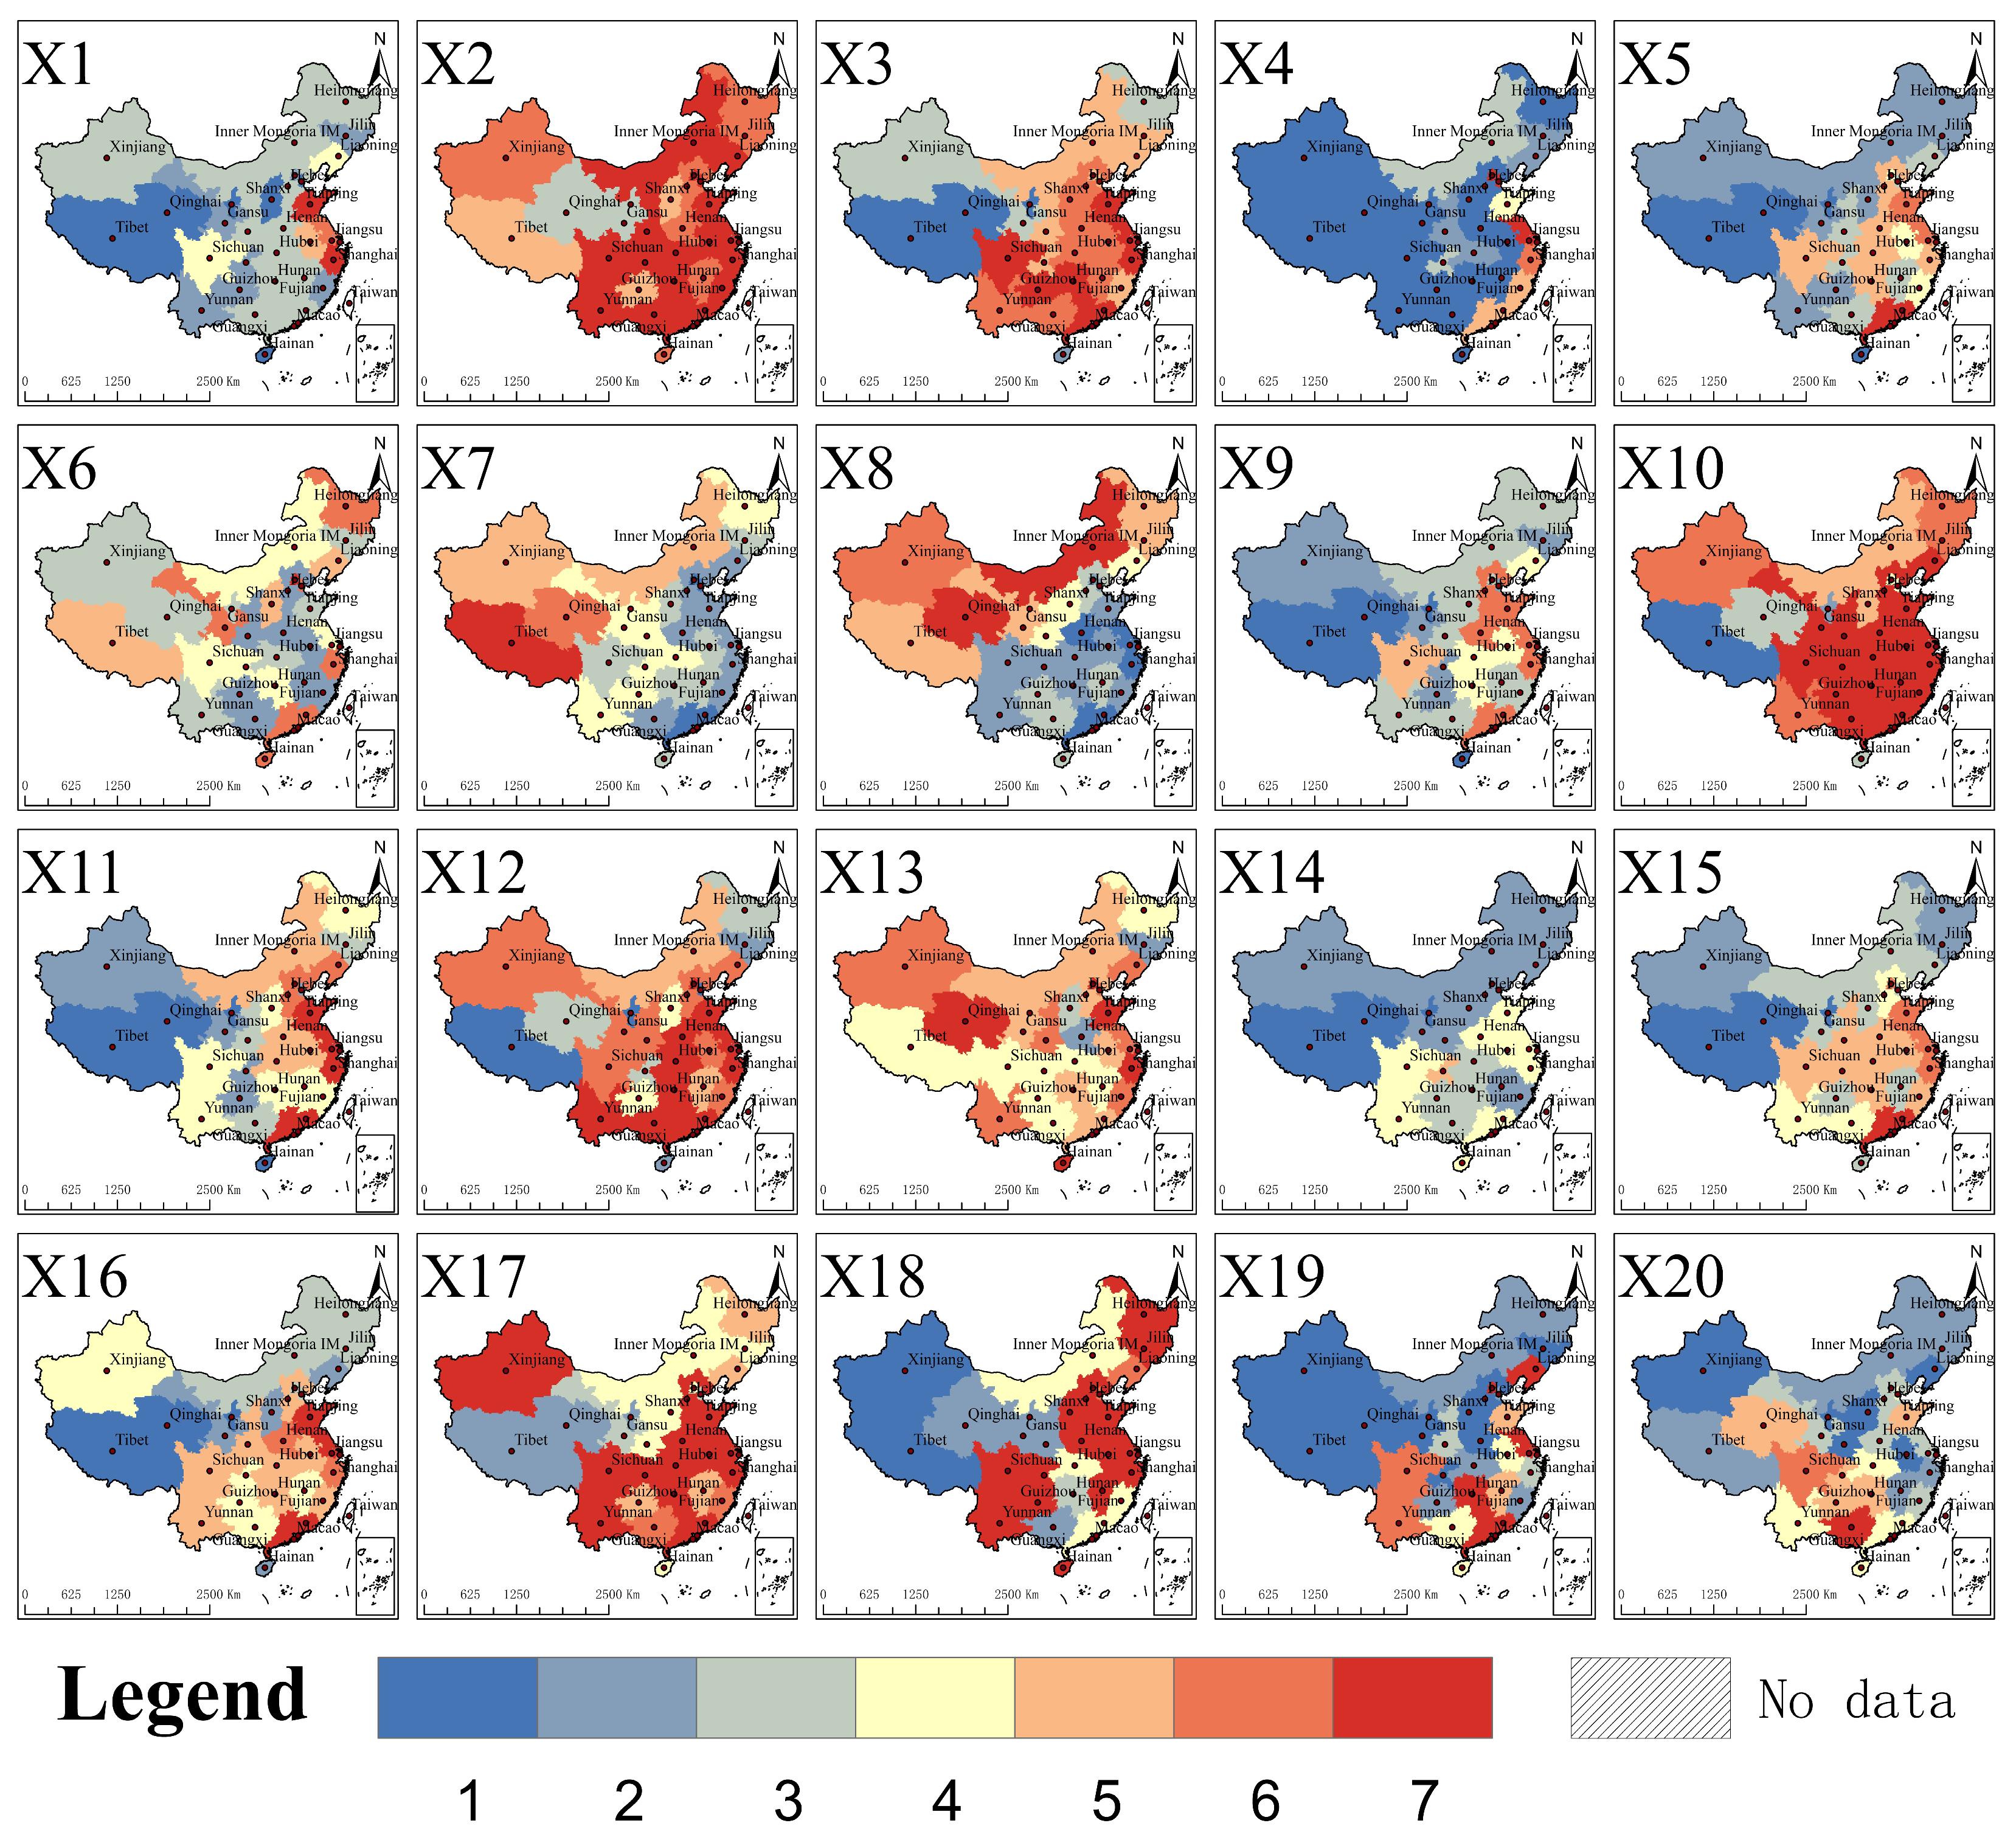
5. Analysis of Driving Factors for the Spatiotemporal Evolution of Provincial Tourism Economic Resilience in China

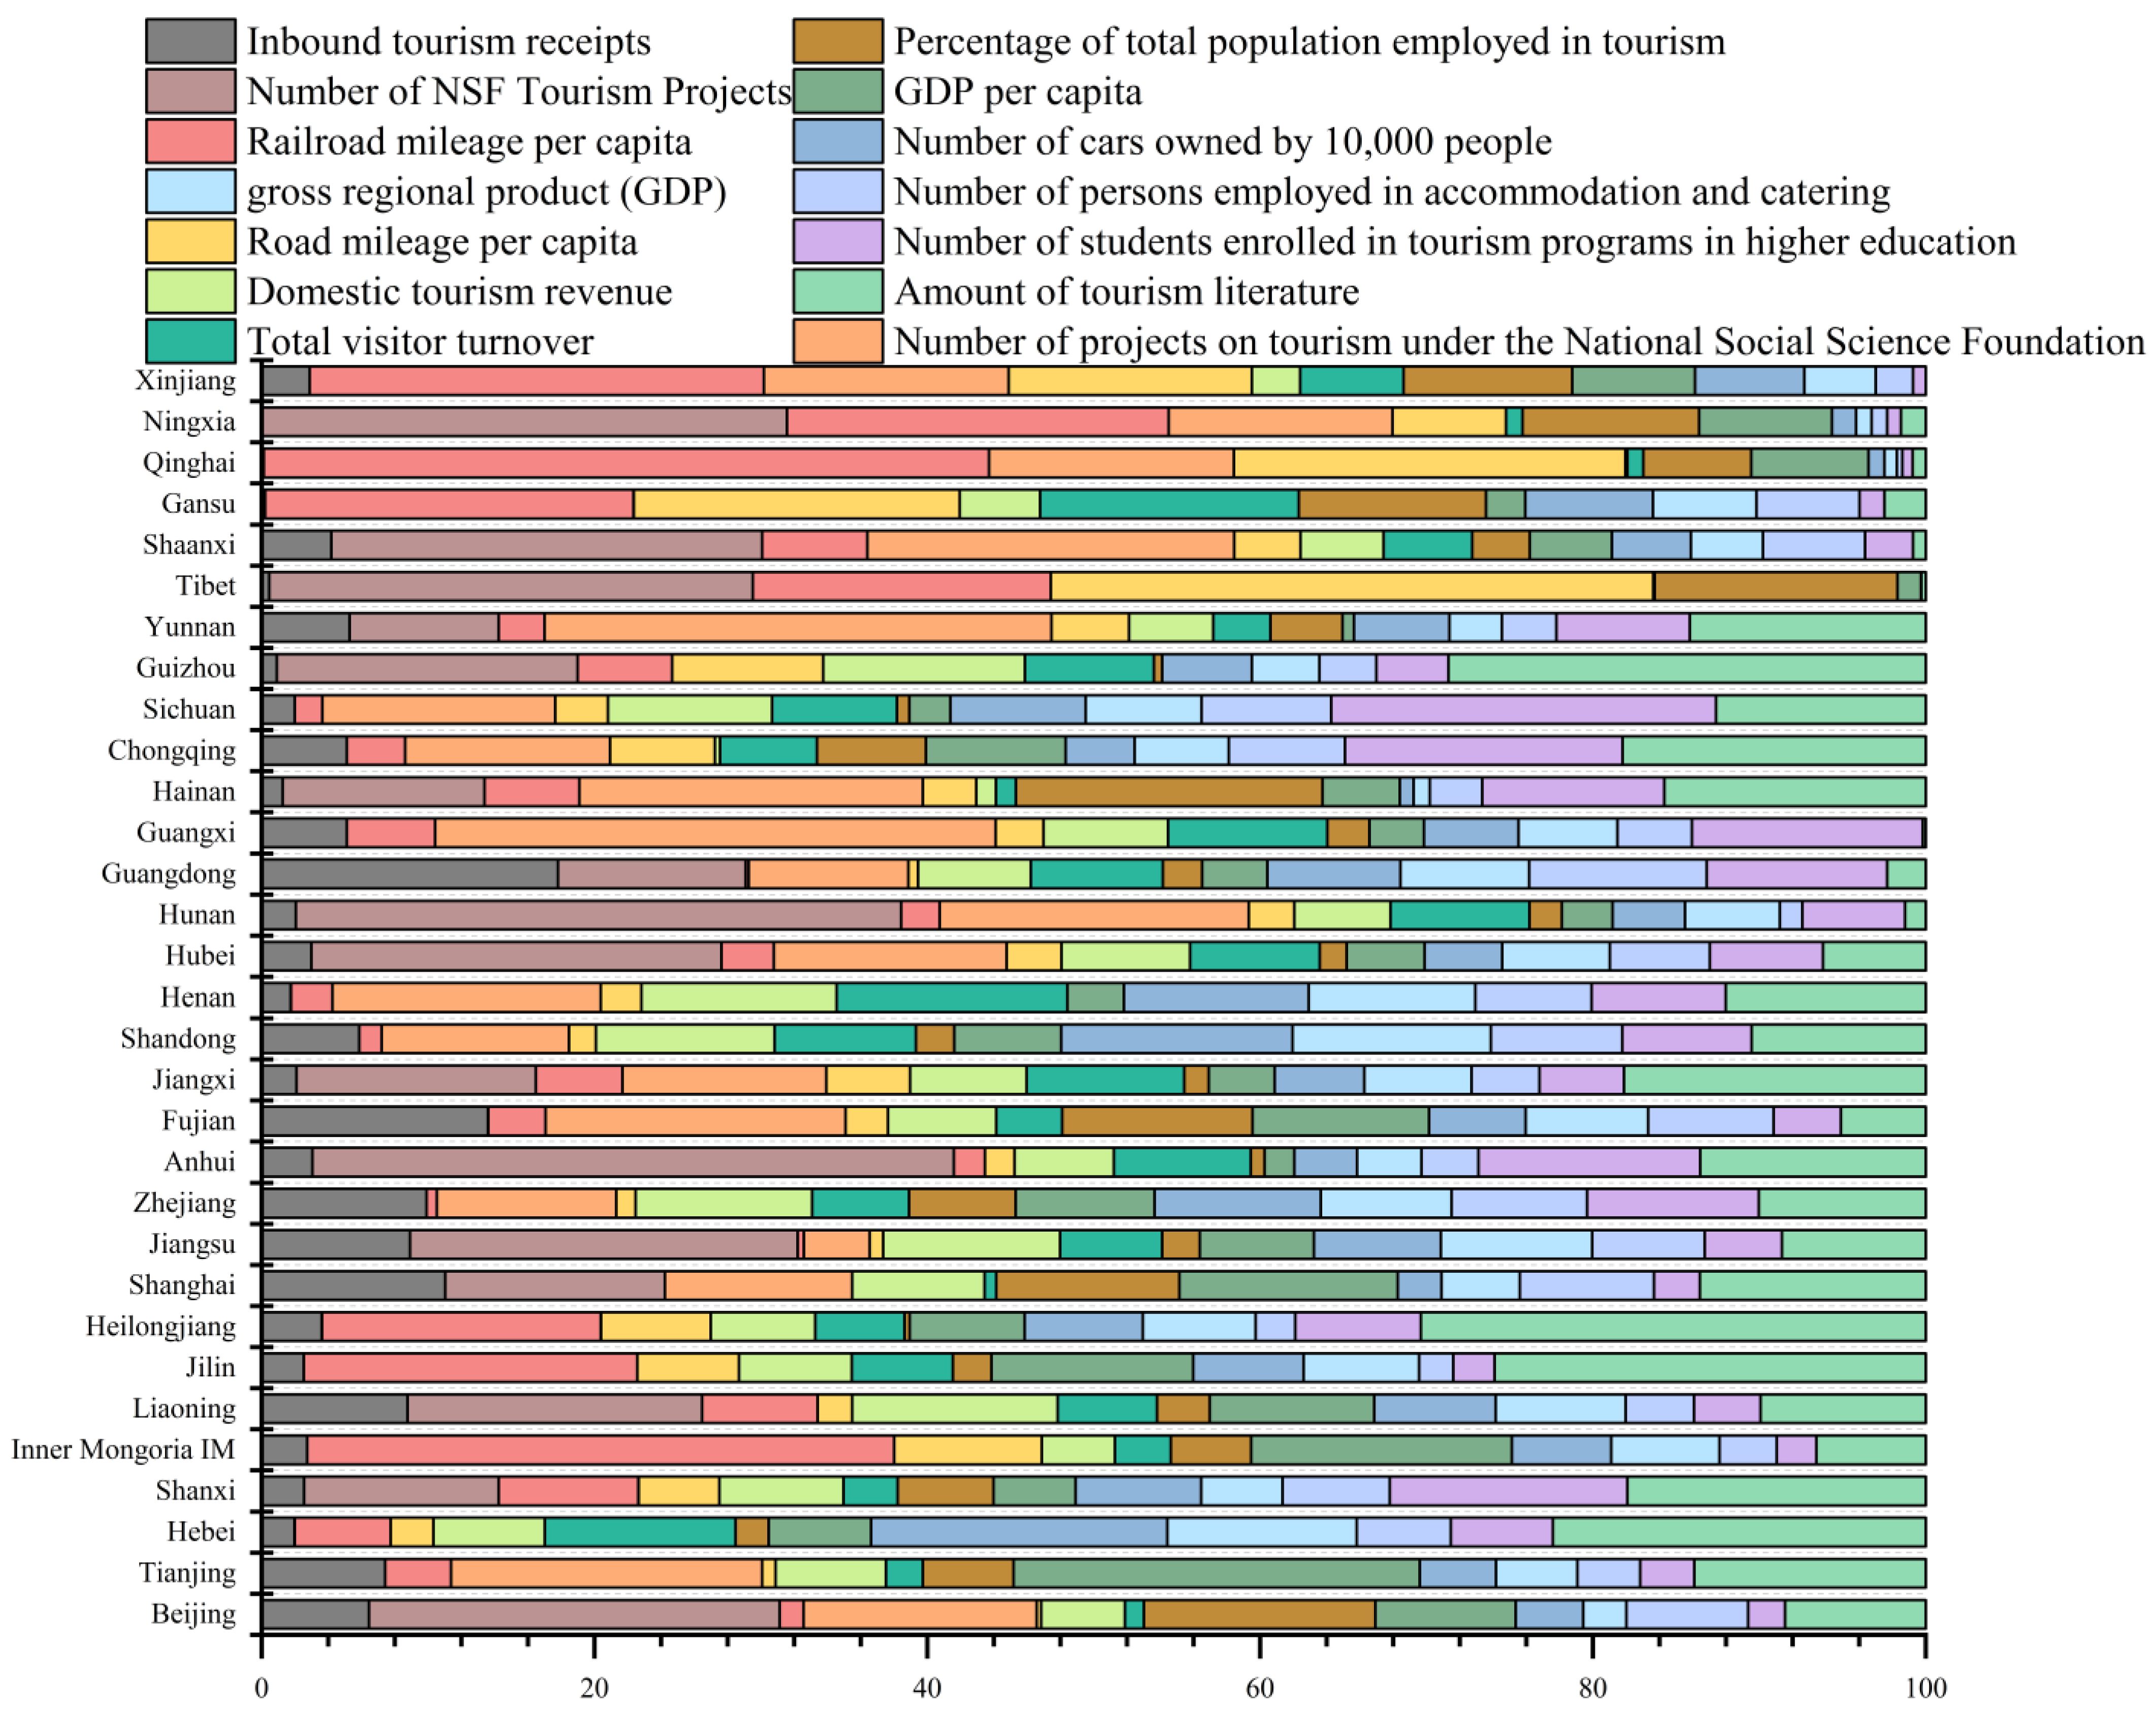
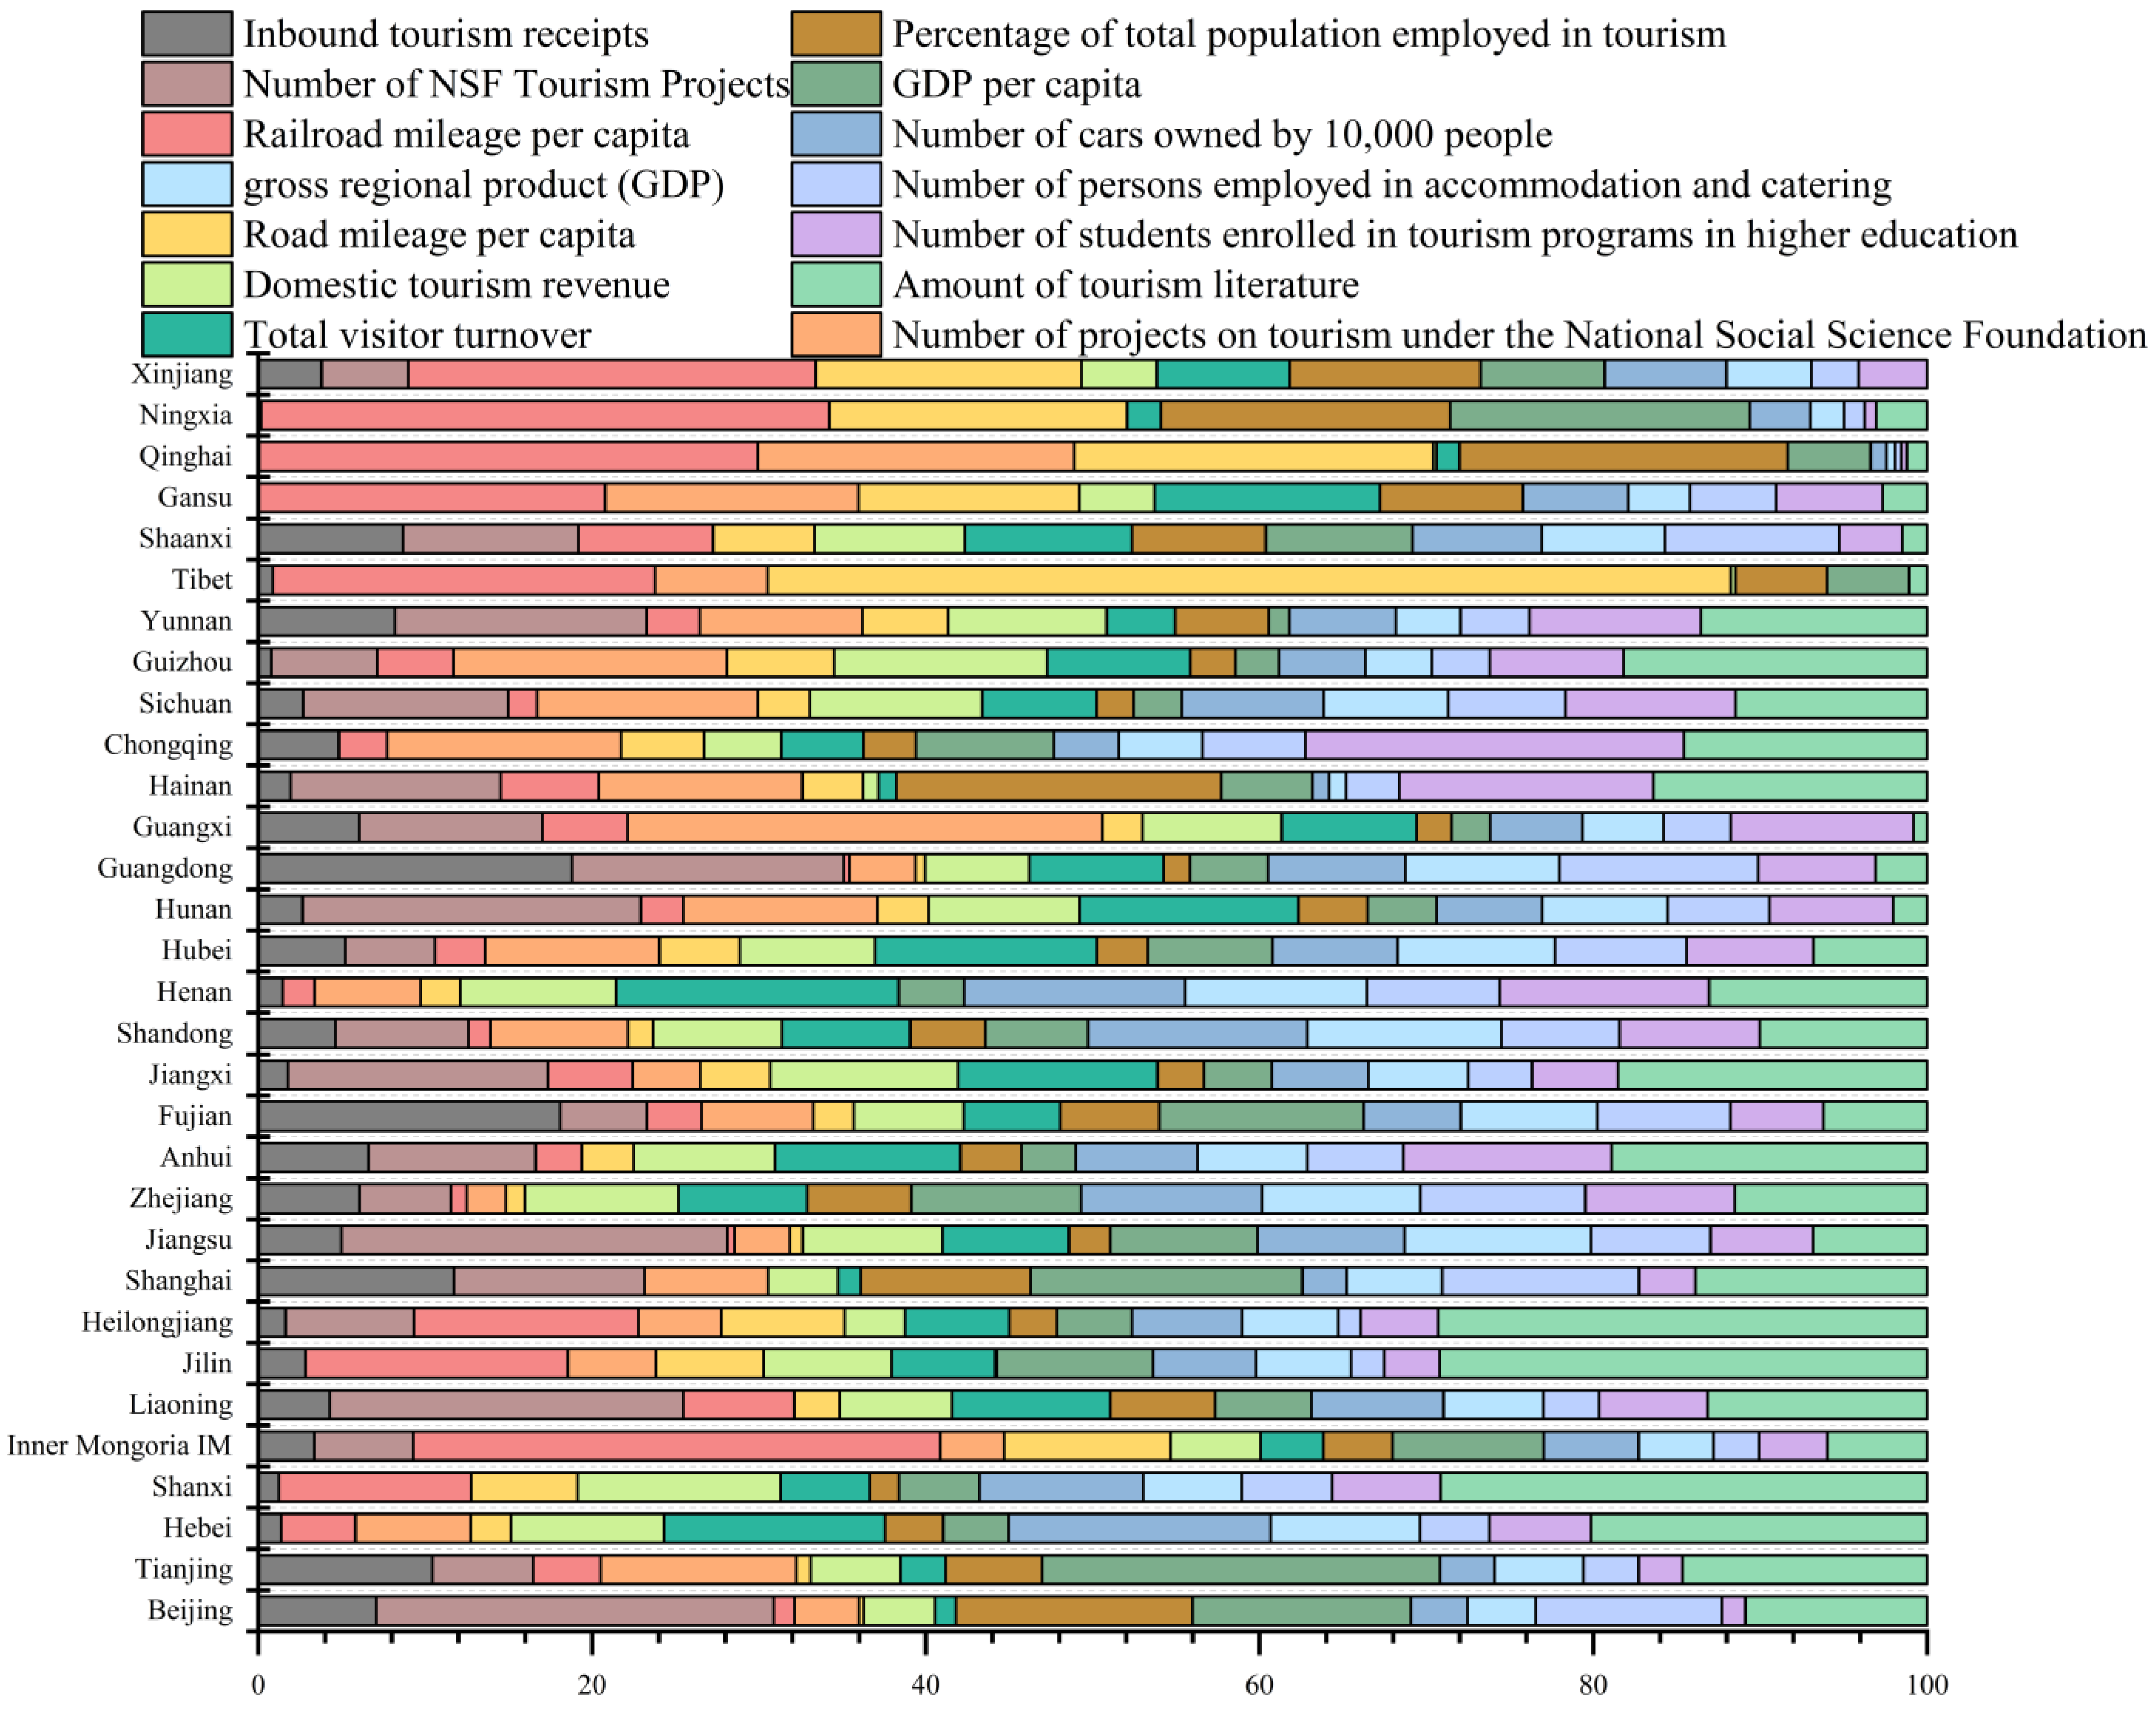
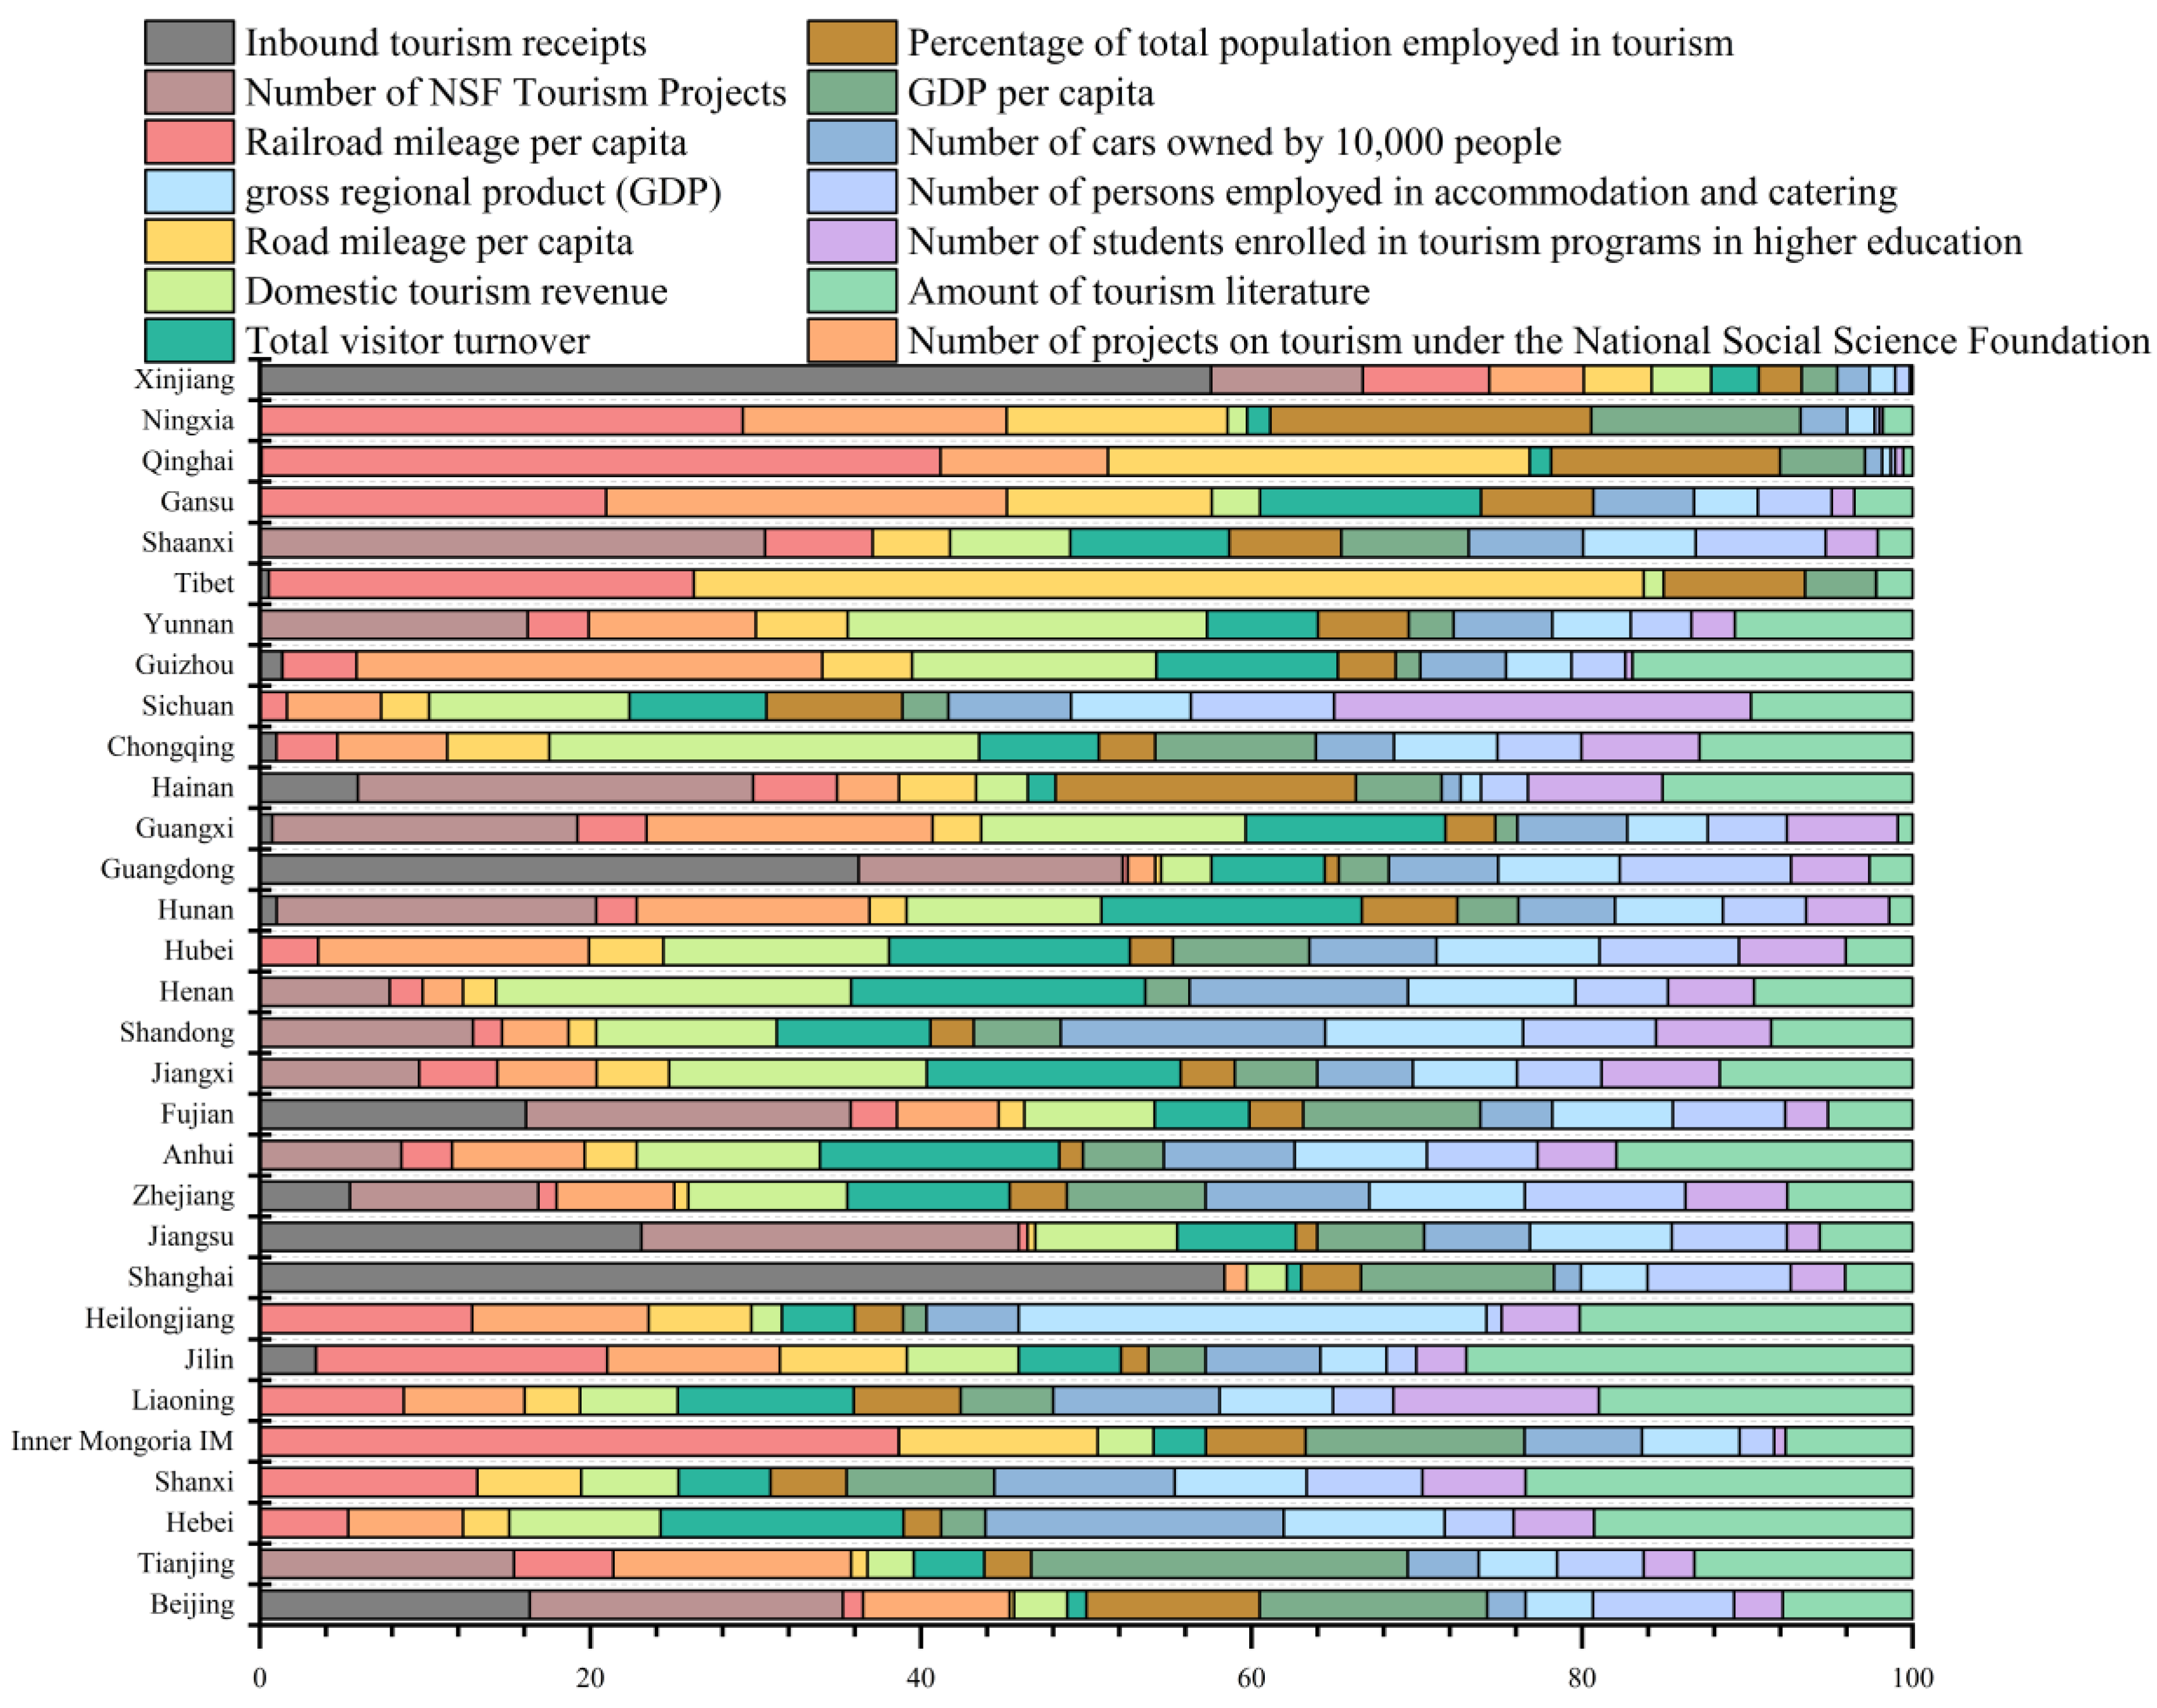
5.1. Analysis of Driving Factors

Using the geographical detector, the driving factors for the spatiotemporal evolution of China’s provincial tourism economic resilience were analyzed (Table 2). The q-value represents the degree of spatial differentiation, with higher q-values indicating stronger spatial stratified heterogeneity. The analysis reveals significant differences in the spatial differentiation effects of different factors on the spatiotemporal evolution of provincial tourism economic resilience.
In 2012, the top three driving factors were per capita railway mileage, domestic tourism income, and the number of employees in accommodation and catering. Additionally, the number of higher education institutions and vocational schools, as well as the number of students in tourism programs, significantly influenced tourism economic resilience, highlighting the unique role of talent cultivation. In 2017, the top three driving factors were domestic tourism income, per capita railway mileage, and the number of National Natural Science Foundation projects in tourism. In 2022, the top three driving factors were per capita railway mileage, the number of A-level scenic spots, and investment in the tertiary industry. The COVID-19 pandemic significantly impacted domestic tourism income during this period.
Throughout the study period, per capita railway mileage consistently had a significant impact on tourism economic resilience, reflecting the rapid development of China’s rail transportation. Other key factors included domestic tourism income, the number of travel agencies, and the number of employees in accommodation and catering. These findings underscore the importance of robust infrastructure for tourism economic development and its critical role in enhancing provincial tourism economic resilience.

5.2. Results Analysis

Figure 8, Figure 9 and Figure 10 present the stacked bar charts showing the contribution levels of various factors, exploring the impact of different driving factors on the 31 provinces in China. Different driving factors are distinguished by color, with larger proportions indicating higher contributions to the respective provinces. Taking Xinjiang as an example, in 2012, the per capita railway mileage had the largest share, making it the primary contributing factor, followed by the number of National Social Science Foundation tourism projects and per capita road mileage. In 2017, the per capita railway mileage remained the largest contributing factor, followed by the per capita road mileage. By 2022, inbound tourism revenue became the primary contributing factor, having the greatest impact on tourism economic resilience. At the end of the study period, the contribution of different factors to Xinjiang’s tourism economic resilience significantly changed. Throughout the study period, the contribution levels of various factors changed to different extents in all 31 provinces. Per capita railway mileage and the number of tourism-related publications had a significant impact on most provinces throughout the study period. The provinces of Xinjiang, Shaanxi, Yunnan, Chongqing, Henan, Fujian, Jiangsu, Shanghai, Heilongjiang, Liaoning, and Beijing exhibited notable changes in the contribution levels of different driving factors to their tourism economic resilience. Therefore, different provinces should formulate corresponding strategies based on the changing influence of driving factors to enhance the strength of tourism economic resilience and promote high-quality development of the tourism industry.
Figure 11, Figure 12 and Figure 13 present the heat map of the spatial and temporal evolution of tourism economic resilience factors in China. The heat map uses color coding to represent the relative values of data, indicating the correlation coefficients between variables based on the shades of the squares. The figure shows that in 2012, domestic tourism revenue, per capita railway mileage, the number of students enrolled in tourism programs at higher education institutions, the number of employees in accommodation and catering, investment in the tertiary industry, and the number of higher education institutions and vocational schools had significant interactions with other driving factors. In 2017, the interactions between various factors significantly increased, with the combined effects of driving factors having an important impact on the spatial and temporal evolution of China’s tourism economic resilience. By 2022, as the tourism industry was one of the sectors most affected by the pandemic, the interactions between inbound tourism revenue, the tertiary industry’s share of GDP, and other driving factors significantly weakened. The interactions between other driving factors did not show significant fluctuations in the spatial and temporal evolution of China’s tourism economic resilience. Throughout the study period, the individual effects of the 20 single factors were weaker than the interactions between pairs of factors, with factor interactions showing nonlinear or pairwise enhancement characteristics. This indicates that changes in China’s tourism economic resilience are driven by a complex process involving multiple factors and their interactions. These findings emphasize the importance of considering factor interactions in the study of tourism economic resilience, providing new perspectives for understanding tourism economic resilience.
Figure 14, Figure 15 and Figure 16 show the distribution of the 20 driving factors in China, with colors corresponding to 1–7 levels, where higher levels indicate a greater influence of the driving factors. The figures show that in 2012, the driving factors of inbound tourism revenue (X2), total tourist turnover (X10), and the number of star-rated hotels (X12) had a significant and wide-ranging impact nationwide, while the driving factors of the number of A-level scenic spots (X1), per capita GDP (X4), the number of automobiles per ten thousand people (X9), investment in the tertiary industry (X16), and the number of National Social Science Foundation tourism projects (X20) had relatively weaker and narrower impacts. By 2017, the overall influence level of each driving factor was on the rise, with only the driving factor of the number of students enrolled in tourism programs at higher education institutions (X14) showing a significant weakening compared to 2012. In 2022, except for the driving factor of the tertiary industry’s share of GDP (X6), all driving factors exhibited key influence areas. The influence of the driving factors of inbound tourism revenue (X2), total tourist turnover (X10), the number of star-rated hotels (X12), and the number of higher education institutions and vocational schools (X17) decreased, and their aggregation phenomena weakened. At the end of the study period, the overall distribution of the driving factors in China became more dispersed, with different provinces being dominated by different driving factors. The analysis results emphasize the role of various factors in shaping the spatial pattern, providing key perspectives for understanding the spatial changes in China’s tourism economic resilience.
Figure 17 shows the distribution of the dominant driving factors for the spatial and temporal evolution of tourism economic resilience in China’s provinces during the study period. The results indicate that in 2012, the provinces dominated by per capita railway mileage as the main driving factor formed a concentrated contiguous area covering Xinjiang, Qinghai, Gansu, and Inner Mongolia. Secondly, the provinces dominated by the number of tourism-related publications were widely distributed, including Heilongjiang, Jilin, Hebei, Shaanxi, Chongqing, Guizhou, and Jiangxi. At the beginning of the study period, the spatial agglomeration effects of the main driving factors in each province were significant, mainly characterized by the northwest region dominated by per capita railway mileage, the northeast and north China regions dominated by the number of tourism-related publications, and the southwest region dominated by the number of National Natural Science Foundation tourism projects. By 2017, the spatial agglomeration phenomenon of the main driving factors in each province became more pronounced, but the southwest region, previously dominated by the number of National Natural Science Foundation tourism projects, shifted to being dominated by per capita GDP and the number of tourism-related publications. In 2022, the dominant factors of tourism economic resilience transitioned from aggregation to dispersion, although a few provinces still exhibited dominant factor aggregation phenomena. Throughout the study period, the dominant driving factors of tourism economic resilience in China’s provinces developed from aggregation to significant aggregation to dispersion. Over time, some provinces experienced changes in dominant driving factors, such as Xinjiang, Heilongjiang, and Zhejiang, indicating the instability of dominant driving factors in multiple provinces.

6. Conclusions and Discussion

In an era of rapid globalization, the tourism industry faces increasing instability factors. The intensity of tourism economic resilience clearly reflects a region’s ability to respond to disturbances and shocks. Enhancing tourism economic resilience not only facilitates short-term development but also ensures sustainable growth in the tourism industry, promoting high-quality development. This study analyzes the spatial and temporal changes and driving forces of tourism economic resilience in China’s provinces from 2012 to 2022. The findings are as follows:
  • Temporal Changes: Most provinces in China exhibited varying degrees of improvement in tourism economic resilience, with different degrees of change in the four dimensions of resilience. Resistance resilience and tourism system resilience showed an upward trend, development resilience exhibited a declining trend, and restructuring resilience and recovery resilience remained stable throughout the study period. Among the four dimensions, priority should be given to enhancing development resilience to ensure the comprehensive development of China’s tourism economic resilience;
  • Spatial Pattern: Significant differences in tourism economic resilience were observed between provinces, with a trend of the east being better than the west and the south being better than the north. Particularly, the tourism economic resilience gap between eastern coastal cities and western inland cities was prominent, indicating diverse spatial patterns and ample room for development;
  • Regional Differences: Although no polarization phenomenon was observed, there was a clear differentiation between high-value and low-value areas, indicating significant regional economic disparities in China’s tourism economic resilience. Efforts are needed to narrow regional differences and promote balanced regional development to enhance the overall resilience of the tourism economic system;
  • Regional Connections: China’s tourism economic resilience exhibited regional connectivity, with uneven distribution of hot and cold spots. Hot spots were concentrated in the six southeastern provinces, emphasizing the need to strengthen regional cooperation and expand high-level resilience areas;
  • Driving Factors: Factors such as per capita railway mileage, domestic tourism revenue, the number of travel agencies, and the number of employees in accommodation and catering had significant impacts on China’s tourism economic resilience. In the context of rapid tourism economic development, improving infrastructure construction and enhancing the comprehensive strength of the tourism industry are key to enhancing tourism economic resilience. Additionally, due to the different dominant driving factors across provinces, decisions should be made based on the dominant factors, the contribution levels of different driving factors, and their interactions to enhance the transformation and innovation capabilities of tourism products and services, meeting the growing tourism demands of the people in the new era.
The research on tourism economic resilience in China is in its infancy. This paper analyzes the tourism economic resilience in China’s provinces from the perspective of time-space evolution and driving force analysis. It summarizes the economic development resilience of the tourism industry in China’s provinces, which has certain theoretical and practical value, provides some reference for the research of relevant scholars, and needs further exploration and research by scholars. Through the analysis of the temporal and spatial evolution of China’s tourism economic resilience, the spatial differences among provinces are obvious. Under the strong global economic fluctuation environment, the government and relevant departments should make overall plans to integrate resources, pay attention to the development to the west and north, narrow the regional gap and promote comprehensive development. Under the existing conditions, the provinces with high tourism economic resilience give full play to their advantages to maintain their steady growth and make timely adjustments to the provinces with low tourism economic resilience. In addition, the paper analyzes the driving factors of China’s tourism economic resilience, which can provide some reference for local governments to improve the tourism economic resilience. The tourism industry significantly impacts a country’s economy, culture, and society. During the COVID-19 pandemic, global population movement was severely restricted, affecting both international and domestic tourism markets. At this new historical starting point, with economic recovery, countries and regions should emphasize the development of the tourism industry, formulate scientific and reasonable tourism planning and management policies, enhance tourism economic resilience, and promote the sustainable and healthy development of the tourism industry. In this study, the data of this article need to be further accurate. For example, in 2022, affected by the COVID-19 epidemic, the tourism industry was greatly affected, which led to an impact on the data. In addition, it is inevitable to ignore some factors or factors that are difficult to measure in the model, such as cultural characteristics, local policies, industrial models, and the structural nature of tourism enterprises. These factors will affect the tourism economic resilience to some extent, which is also the further research direction of this article. In the future, we can also analyze the development of tourism economic resilience through interviews and questionnaires and further complete the relevant research based on the existing conclusions of this article.

Author Contributions

Writing—original draft, Y.S., W.L., M.S. and P.C. All authors have read and agreed to the published version of the manuscript.

Funding

This research received no external funding.

Institutional Review Board Statement

Not applicable.

Informed Consent Statement

Informed consent was obtained from all subjects involved in the study.

Data Availability Statement

Data are available in a publicly accessible repository [National Earth System Science Data of China] [http://www.geodata.cn/ accessed on 30 June 2024].

Conflicts of Interest

The authors declare no conflicts of interest.

References

  1. Holling, C.S. Engineering resilience versus ecological resilience. Eng. Within Ecol. Constraints 1996, 6, 21–75. [Google Scholar]
  2. Holling, C.S. Resilience and stability of ecological systems. Annu. Rev. Ecol. Syst. 1973, 4, 1–23. [Google Scholar] [CrossRef]
  3. Masten, A.S.; Best, K.M.; Garmezy, N. Resilience and development: Contributions From the study of children who overcame adversity. Dev. Psychopathol. 1990, 2, 425–444. [Google Scholar] [CrossRef]
  4. Dogru, T.; Marchio, E.A.; Bulut, U.; Suess, C. Climate change: Vulnerability and resilience of tourism and the entire economy. Tour. Manag. 2019, 72, 292–305. [Google Scholar] [CrossRef]
  5. Meerow, S.; Newell, J.P.; Stults, M. Defining urban resilience: A review. Landsc. Urban Plan. 2016, 147, 38–39. [Google Scholar] [CrossRef]
  6. Timmerman. The concept of resilience revisited. Disasters 1981, 30, 433–450. [Google Scholar]
  7. Yang, E.; Kim, J.; Pennington-Gray, L.; Ash, K. Does tourism matter in measuring community resilience? Ann. Tour. Res. 2021, 89, 103–222. [Google Scholar] [CrossRef]
  8. Bin, T.S. Measuring community resilience: A critical analysis of a policy-oriented indicator tool. Environ. Sustain. Indic. 2021, 12, 100142. [Google Scholar]
  9. Filimonau, V.; Coteau, D.D. Tourism resilience in the context of integrated destination and disaster management (DM2). Int. J. Tour. Res. 2020, 22, 202–222. [Google Scholar] [CrossRef]
  10. Luthar, S.S.; Cicchetti, D.; Becker, B. The construct of resilience: A critical evolution and guidelines for future work. Child Dev. 2000, 7, 543–562. [Google Scholar] [CrossRef]
  11. Zheng, P.; Li, J.; Wang, J.; Cheng, H.; Wang, Q. The coupling coordination of relationships between tourism destination image and product country image. Int. J. Tour. Res. 2021, 23, 858–870. [Google Scholar] [CrossRef]
  12. Sheppard, V.A.; Williams, P.W. Factors that strengthen tourism resort resilience. J. Hosp. Tour. Manag. 2016, 28, 20–30. [Google Scholar] [CrossRef]
  13. Cellini, R.; Cuccia, T. The Economic Resilience of Tourism Industry in Italy: What the ‘Great Recession’ data Show. Tour. Manag. Perspect. 2015, 16, 346–356. [Google Scholar] [CrossRef]
  14. Susanne, B. Developing a Framework for Assessing Resilience of Tourism Sub-systems to Climatic Factors. Ann. Tour. Res. 2013, 43, 506–528. [Google Scholar]
  15. Hill, E. Economic Shocks and Regional Economic Resilience. Urban Reg. Policy Its Eff. 2018, 4, 23–35. [Google Scholar]
  16. Wong, E.P.; de Lacy, T.; Jiang, M. Climate change adaptation in tourism in the South Pacific -Potential contribution of public–private partnerships. Tour. Manag. Perspect. 2012, 4, 136–144. [Google Scholar] [CrossRef]
  17. Sovacool, B.K. Perceptions of climate change risks and resilient island planning in the Maldives. Mitig. Adapt. Strateg. Glob. Change 2012, 17, 731–752. [Google Scholar] [CrossRef]
  18. Calgaro, E.; Dominey-Howes, D.; Lloyd, K. Application of the Destination Sustainability Framework to explore the drivers of vulnerability and resilience in Thailand following the 2004 Indian Ocean Tsunami. J. Sustain. Tour. 2014, 22, 361–383. [Google Scholar] [CrossRef]
  19. Cochrane, J. The Sphere of Tourism Resilience. Tour. Recreat. Res. 2015, 35, 173–185. [Google Scholar] [CrossRef]
  20. Becken, S.; Mahon, R.; Rennie, H.G.; Shakeela, A. The tourism disaster vulnerability framework: An application to tourism in small island destinations. Nat. Hazards 2014, 71, 955–972. [Google Scholar] [CrossRef]
  21. Lew, A.A. Scale, change and resilience in community tourism planning. Tour. Geogr. 2016, 38, 1635–1642. [Google Scholar] [CrossRef]
  22. Holladay, P.J.; Powell, R.B. Resident perceptions of social–ecological resilience and the sustainability of community-based tourism development in the Commonwealth of Dominica. J. Sustain. Tour. 2013, 21, 1188–1211. [Google Scholar] [CrossRef]
  23. Amir, A.F.; Abd Ghapar, A.; Jamal, S.A.; Ahmad, K.N. Sustainable Tourism Development: A Study on Community Resilience for Rural Tourism in Malaysia. Procedia-Soc. Behav. Sci. 2015, 168, 116–122. [Google Scholar] [CrossRef]
  24. Yang, Y.; Fik, T. Spatial effects in regional tourism growth. Ann. Tour. Res. 2014, 46, 144–162. [Google Scholar] [CrossRef]
  25. Li, H.; Wang, M.; Liu, Z. Measurement and Analysis of Regional Economic Resilience in China—Analysis based on shift share decomposition method. Price Theory Pract. 2024, 2, 1–5. [Google Scholar]
  26. Zhang, H.; Zhang, W.; Chen, S.; Yang, D.; Tian, Z. Construction of a resilience evaluation system for near-shore tourism islands and research on the influence mechanism of spatial elements. Mar. Sci. Bull. 2024, 4, 1–12. [Google Scholar]
  27. Wang, C.; Zhang, A.; Hu, M. Spatio-temporal Pattern and Obstacle Factors of Tourism Industry Ecosystem Resilience in the Yangtze River Delta. Areal Res. Dev. 2023, 42, 82–88. [Google Scholar]
  28. Chen, H.; Cai, S. Evaluation and Spatial-temporal Evolution of Regional Digital Innovation Ecosystem Resilience. Stat. Decis. 2023, 39, 51–55. [Google Scholar]
  29. Tian, G.; Miao, C.; Hu, Z.; Yang, D.; Hu, S. Research Progress of Regional Economic Resilience: Conceptualization, Measurement Methods and Influencing Factors. Hum. Geogr. 2023, 38, 1–8. [Google Scholar]
  30. Wu, B.; Chen, A. Framework of the evaluation model resilient cities. Sci. Technol. Rev. 2018, 36, 94–99. [Google Scholar]
  31. Xiu, C.; Wei, Y.; Wang, Q. Evaluation of urban resilience of Dalian city based on the perspective of “Size-Density-Morphology”. Acta Geogr. Sin. 2018, 73, 2315–2328. [Google Scholar]
  32. Zhang, M.; Feng, X. Comprehensive evaluation of urban toughness in China. Urban Probl. 2018, 27–36. [Google Scholar]
  33. Zhang, M.D.; Li, W.L. Spatial Difference and Convergence of Urban Resilience Level in Northeast China. J. Ind. Technol. Econ. 2020, 39, 3–12. [Google Scholar]
  34. Bai, L.; Xiu, C.; Feng, X.; Mei, D.W.; Wei, Z. A comprehensive assessment of urban resilience and its spatial differentiation in China. World Reg. Stud. 2019, 28, 77–87. [Google Scholar]
  35. Ding, J.J.; Wang, Z.; Liu, Y.H.; Yu, F. Measurement of economic resilience of contiguous poverty-stricken areas in China and influencing factor analysis. Prog. Geogr. 2020, 39, 924–937. [Google Scholar] [CrossRef]
  36. Li, X.; Li, L.; Zhu, Y. Study on the Resilience Evaluation of Resilient City. J. Eng. Manag. 2021, 35, 48–52. [Google Scholar]
  37. Xu, Y.Y.; Wang, C. Influencing factors of regional economic resilience in the 2008 financial crisis: A case study of Zhejiang and Jiangsu Provinces. Prog. Geogr. 2017, 36, 986–994. [Google Scholar]
  38. Peng, R.X.; Liu, T.; Cao, G.Z. Spatial pattern of urban economic resilience in eastern coastal China and industrial explanation. Geogr. Res. 2021, 40, 1732–1748. [Google Scholar]
  39. Xu, Q.; Zhao, R.; Zhang, Z. Spatial Pattern of Economic Resilience in Northeast China. Econ. Rev. J. 2023, 52–62. [Google Scholar]
  40. Qi, X.; Zhang, J.S.; Xu, W.X. A Study on the Evaluation of the Development of County Economic Resilience in Zhejiang Province. Zhejiang Soc. Sci. 2019, 5, 40–46+156. [Google Scholar]
  41. Chen, Y.L.; Yang, X.J. Tourism social-ecological systems and resilience research. J. Arid Land Resour. Environ. 2011, 25, 205–211. [Google Scholar]
  42. Chen, Y.L.; Yang, X.J. The resilience of Tibet tourism social-ecological systems. J. Northwest Univ. (Nat. Sci. Ed.) 2012, 42, 827–832. [Google Scholar]
  43. Wang, Q.; Lu, L.; Yang, X.Z. Study on measurement and impact mechanism of socio-ecological system resilience in Qiandao Lake. Acta Geogr. Sin. 2015, 70, 779–795. [Google Scholar]
  44. Wang, Q.; Lu, L.; Yang, X. Comparative Analysis of the Resilience of the Socio-ecological Subsystems of Tourist Destinations: A Case Study of Chun’an County. Tour. Trib. 2016, 31, 116–126. [Google Scholar]
  45. Guo, Y.; Zhang, J.; Zhang, Y. Tourism Community Resilience: Origin, Progress and Prospects. Tour. Trib. 2015, 30, 85–96. [Google Scholar]
  46. Guo, Y.; Zhang, J.; Zhang, Y. Influencing factors and mechanism of community resilience in tourism destinations. Geogr. Res. 2018, 37, 133–144. [Google Scholar]
  47. Wang, Q.; Zhao, L.; Yu, W.; Jia, J.Q. Spatial-Temporal Evolution Characteristics and Influencing Factors of Resilience of Tourism Economic System in China. Geogr. Geo-Inf. Sci. 2020, 36, 113–118. [Google Scholar]
  48. Pang, D.; Zhao, L.; Yu, W. Resilience measurement and obstacle factors of tourism economy in Shandong province. Resour. Ind. 2021, 23, 50–59. [Google Scholar]
  49. Liu, X.; Fang, H. Exploration on Ancient Village Tourism Development Path Based on the Perspective of Resilience. Urban. Archit. 2021, 18, 19–23. [Google Scholar]
  50. Zhu, Y.Y.; Wang, Z.W.; Gu, J.; Yu, R.L. The spatial optimization of red tourism resources utilization based on the resilience of “ruralism-ecology” system: A case study of Dabie Mountains Old Revolutionary Base Area. J. Nat. Resour. 2021, 36, 1700–1717. [Google Scholar] [CrossRef]
  51. Xu, K.; Wu, Y.; Yan, X.; Liu, X. Analysis on Evaluation Index of Tourism Economic Resilience under the Impact of Epidemic Situation. Tour. Today 2021, 19, 62–63+91. [Google Scholar]
  52. Pei, L.X.; Zhi, Z.P.; Zhan, Z.J.; Jian, Z.X. Perspectives on Tourism Regional Resilience Research in the Post-COVID-19 Era. Mod. Urban Res. 2021, 5, 19–26. [Google Scholar]
  53. Li, X. Resilience of Tourism Enterprises and Mechanism under the Impact of COVID-19: A Case Study of CTRIP. Master’s Thesis, Beijing International Studies University, Beijing, China, 2021. [Google Scholar]
  54. Hou, J. A study on resilient development of tourism industry under the influence of public health emergency. J. Wuxi Vocat. Inst. Commer. 2021, 21, 67–75. [Google Scholar]
  55. Feng, L.; Guo, J.; Liu, Y. Research Methodology for Tourism Destination Resilience and Analysis of Its Spatiotemporal Dynamics in the Post-epidemic Period. J. Resour. Ecol. 2021, 12, 682–692. [Google Scholar]
  56. Li, S. Research on the Measure and Countermeasures of Xinjiang Tourism Economy Resilience Level. Master’s Thesis, University of Finance, Xinjiang, China, 2022. [Google Scholar]
Figure 1. Evaluation results of provincial tourism economic resilience in China.
Sustainability 16 08091 g001
Figure 2. Temporal evolution process of provincial tourism economic system resilience.
Sustainability 16 08091 g002
Figure 3. Kernel Density Estimation of provincial tourism economic resilience in China.
Sustainability 16 08091 g003
Figure 4. Moran’s I index of China’s provincial tourism economic resilience in 2012.
Sustainability 16 08091 g004
Figure 5. Moran’s I index of China’s provincial tourism economic resilience in 2017.
Sustainability 16 08091 g005
Figure 6. Moran’s I index of China’s provincial tourism economic resilience in 2022.
Sustainability 16 08091 g006
Figure 7. Cold and hot spot analysis of China’s provincial tourism economic resilience.
Sustainability 16 08091 g007
Figure 8. Contribution levels of tourism economic resilience factors by province in China, 2012.
Sustainability 16 08091 g008
Figure 9. Contribution levels of tourism economic resilience factors by province in China, 2017.
Sustainability 16 08091 g009
Figure 10. Contribution levels of tourism economic resilience factors by province in China, 2022.
Sustainability 16 08091 g010
Figure 11. Heat map of the spatial and temporal evolution of tourism economic resilience factors in China, 2012.
Sustainability 16 08091 g011
Figure 12. Heat map of the spatial and temporal evolution of tourism economic resilience factors in China, 2017.
Sustainability 16 08091 g012
Figure 13. Heat map of the spatial and temporal evolution of tourism economic resilience factors in China, 2022.
Sustainability 16 08091 g013
Figure 14. Distribution of driving factors in China, 2012.
Sustainability 16 08091 g014
Figure 15. Distribution of driving factors in China, 2017.
Sustainability 16 08091 g015
Figure 16. Distribution of driving factors in China, 2022.
Sustainability 16 08091 g016
Figure 17. Distribution of dominant driving factors for the spatial and temporal evolution of tourism economic resilience in China’s provinces, 2012–2022.
Sustainability 16 08091 g017
Table 1. Tourism economic resilience evaluation indicator system.
Primary IndicatorsSecondary IndicatorsThird IndicatorsWeight
Resistance ResilienceTourism Resource AbundanceNumber of A-Level Scenic Spots0.0562
Tourism Economic Development IndexInbound Tourism Revenue0.0337
Domestic Tourism Revenue0.0472
Local Economic Foundation IndexPer Capita GDP0.0443
Gross Regional Product (GRP)0.0475
Tertiary Industry’s Share of GDP0.0375
Tourism AccessibilityPer Capita Road Mileage0.0356
Per Capita Railway Mileage0.0594
Number of Automobiles per Ten Thousand People (Civilian Vehicles)0.0517
Total Tourist Turnover0.038
Recovery ResilienceTourism Facility IndexNumber of Travel Agencies0.0281
Number of Star-Rated Hotels0.0347
Tourism WorkforceProportion of Tourism Employees to Total Population0.0429
Number of Students Enrolled in Tourism Programs at Higher Education Institutions0.0438
Restructuring ResilienceTourism Employment PopulationNumber of Employees in Accommodation and Catering0.0445
Tourism Economic Reconstruction CapabilityInvestment in the Tertiary Industry0.1174
Development ResilienceTourism Vocational Education InstitutionsNumber of Higher Education Institutions and Vocational Schools0.0793
Innovative AchievementsNumber of Tourism-Related Publications0.0715
Number of National Natural Science Foundation Tourism Projects0.0398
Number of National Social Science Foundation Tourism Projects0.0469
Table 2. Driver factor detection table.
CodeIndexQ Statistic
(2012)
Q Statistic
(2017)
Q Statistic
(2022)
X1Number of A-Level Scenic Spots0.3110.3960.644
X2Inbound Tourism Revenue0.4230.6310.136
X3Domestic Tourism Revenue0.7680.8130.587
X4Per Capita GDP0.1250.2510.155
X5Gross Regional Product (GRP)0.5660.6190.509
X6Tertiary Industry’s Share of GDP0.1240.2990.174
X7Per Capita Road Mileage0.570.5420.267
X8Per Capita Railway Mileage0.7960.7970.711
X9Number of Automobiles per Ten Thousand People (Civilian Vehicles)0.5090.7530.427
X10Total Tourist Turnover0.1110.3840.513
X11Number of Travel Agencies0.6820.7000.564
X12Number of Star-Rated Hotels0.1620.4400.415
X13Proportion of Tourism Employees to Total Population0.1590.0600.266
X14Number of Students Enrolled in Tourism Programs at Higher Education Institutions0.7360.6230.546
X15Number of Employees in Accommodation and Catering0.7630.7530.609
X16Investment in the Tertiary Industry0.6580.6440.676
X17Number of Higher Education Institutions and Vocational Schools0.7600.3030.536
X18Number of Tourism-Related Publications0.4100.5100.183
X19Number of National Natural Science Foundation Tourism Projects0.2460.7600.218
X20Number of National Social Science Foundation Tourism Projects0.5390.4490.215
Disclaimer/Publisher’s Note: The statements, opinions and data contained in all publications are solely those of the individual author(s) and contributor(s) and not of MDPI and/or the editor(s). MDPI and/or the editor(s) disclaim responsibility for any injury to people or property resulting from any ideas, methods, instructions or products referred to in the content.

