Abstract
Utilizing panel quantile regression on an unbalanced dataset for 30 European countries from 2008 to 2018, this article seeks to investigate how the age of cabinet members influences e-waste recycling rates in European countries, alongside other relevant factors. Prior research has overlooked the age of cabinet members as a determinant of e-waste recycling. By addressing this gap, this study introduces a novel factor that could impact e-waste recycling rates. Thus, this study provides insights into how the demographic characteristics of parliament members, particularly the age of cabinet members, impact environmental improvement, as indicated by e-waste recycling rates. Estimation results indicate the existence of a nonlinear relationship (i.e., an inverted U-shaped environmental Kuznets curve) between the age of cabinet members and the e-waste recycling rate, rather than a linear relationship. The calculated average turning point age is 49.087, indicating that the e-waste recycling rate increases as the age of cabinet members rises until reaching 49.087, after which the e-waste recycling rate declines. Overall, this study underscores the importance of the demographic characteristics of parliament members, particularly the age of cabinet members, in shaping e-waste recycling policies and environmental sustainability efforts. It emphasizes that the age of cabinet members and generational perspectives can influence their awareness, understanding, and commitment to addressing contemporary challenges such as e-waste.
1. Introduction
The quantity of waste electrical and electronic equipment (referred to as WEEE or e-waste) produced annually in the world is experiencing rapid growth, making it one of the fastest-growing waste streams [1]. This category encompasses a wide array of discarded and secondary electrical and electronic products utilized in daily life, including mobile phones, computers, televisions, refrigerators, household appliances, lamps, as well as medical devices and photovoltaic panels.
E-waste consists of various materials, including hazardous substances like lead, mercury, and cadmium, which can pose significant environmental and health risks if not properly managed. Improper disposal and recycling of these devices can lead to environmental pollution and health hazards. Moreover, modern electronics contain valuable and scarce resources such as critical raw materials that can be recycled and reused if appropriate waste management practices are applied. A safe and suitable waste electrical and electronic equipment management system plays a crucial role in addressing the challenges posed by WEEE. Establishing a robust and effective WEEE management system is paramount to reducing the negative impacts of waste electrical and electronic equipment. Such a system not only mitigates environmental and health risks by reducing the volume of e-waste, recovering valuable materials, and promoting sustainable resource management practices but also contributes to sustainable production, the development of a circular economy, and resource efficiency [2,3,4].
The European Union (EU) has long been aware of the environmental problems caused by electronic waste. In response to this growing concern, the EU has implemented comprehensive legislative standards aimed at managing and recycling e-waste. At the core of this framework is the groundbreaking legislation known as the Waste Electrical and Electronic Equipment (WEEE) Directive, which came into force in 2003 and was later revised in 2012. The WEEE Directive mandates the separate collection and appropriate treatment of WEEE while also establishing targets for their collection, recovery, and recycling. The WEEE Directive introduced a phased approach to collection targets, commencing from the reference years 2016 and 2019. Initially set at 45% in 2016, the collection target progressively rose to 65% from 2019 onward [5]. In 2021, the European Union achieved a WEEE collection rate of 46.2% and collected an average of 11.0 kg of e-waste for each unit of population. In 2021, Bulgaria and Slovakia successfully achieved the goal of collecting 65% of waste electrical and electronic equipment, while Ireland and Latvia also approached this target closely [6].
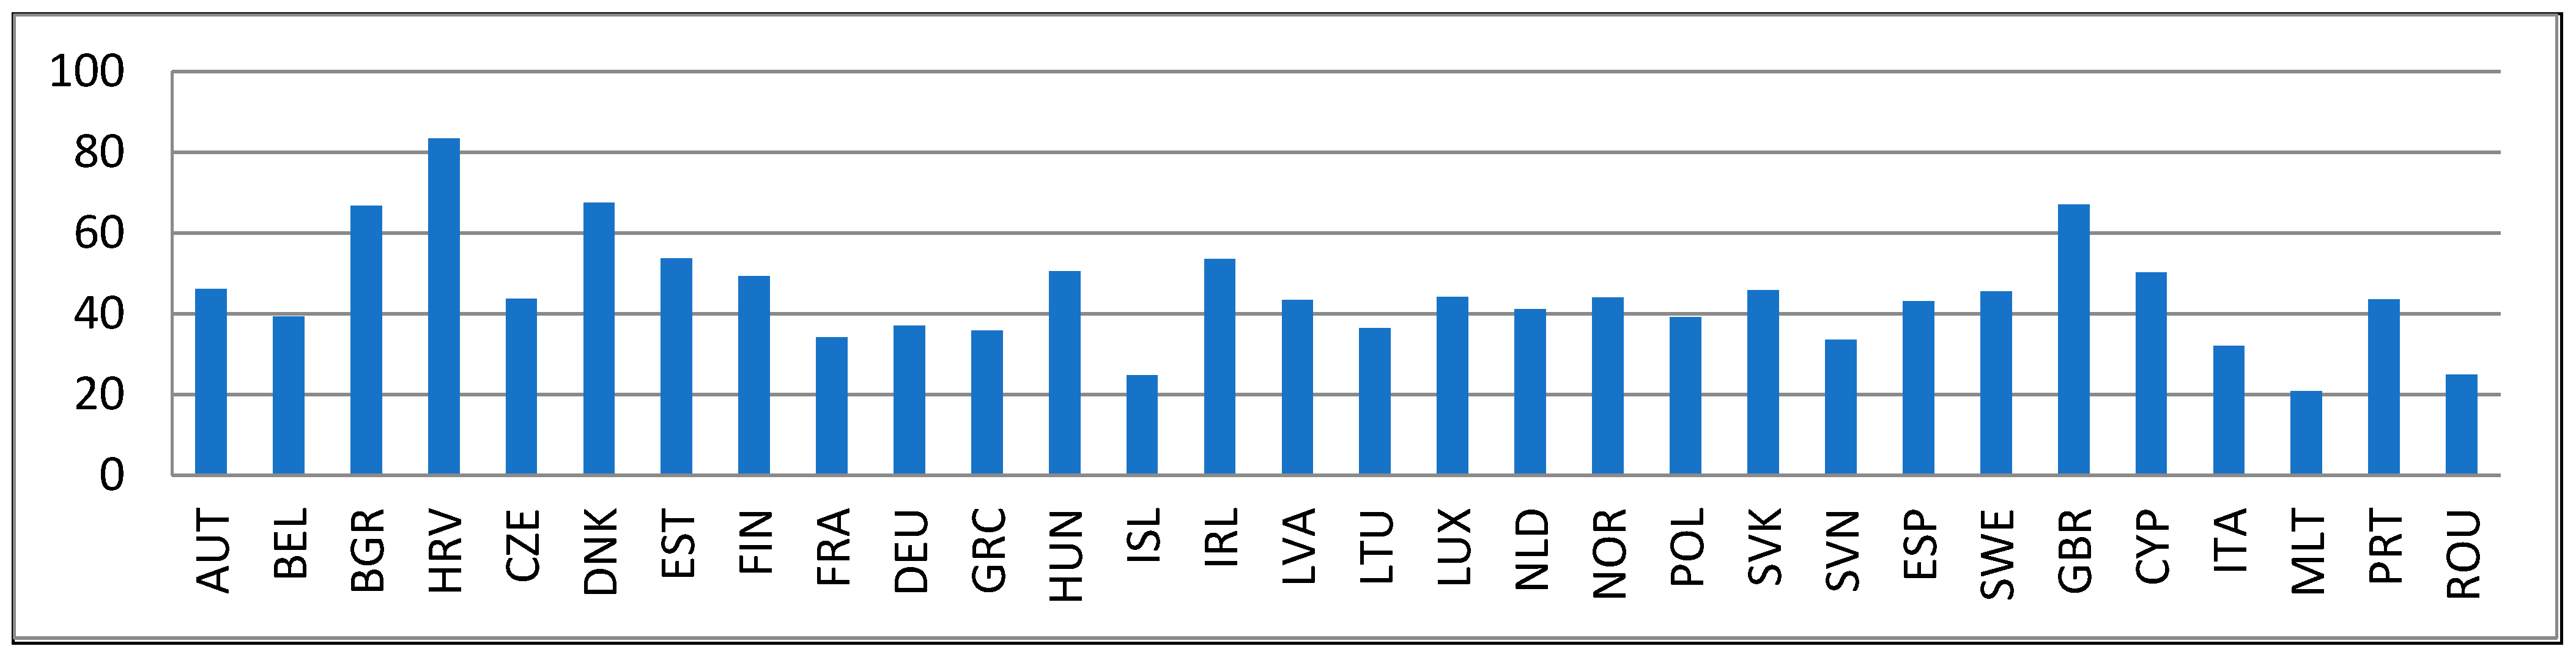
On the other hand, the recycling of electronic waste (e-waste) demonstrates significant discrepancies across European countries, highlighting substantial variations among member states. The average rate of WEEE recycling in the EU was 38.9 percent in 2018. Yet, the rate of e-waste recycling exhibited considerable diversity among the EU countries, as illustrated in Figure 1. In 2018, Croatia recycled 81% of such waste, whereas Malta’s recycling rate stood at 21%. Prominent member states with elevated rates of WWEE recycling include Denmark (67.5%), the UK (67.0%), and Bulgaria (66.7%). Contrariwise, member states with the lowest rates of WEEE recycling encompass Iceland (24.7%), Romania (25.0%), and Italy (32.1%) [6].

Figure 1.
The rate of WEEE recycling in EU countries (2018).
To achieve the stated objectives of the European Union, it is imperative to comprehend the drivers influencing the rate of WEEE recycling. Crafting impactful policies and strategies to mitigate the ecological influence of WEEE hinges upon this understanding. As asserted by Cadoret and Padovano [7], substantial variations in rates of WEEE recycling among intimately linked and predominantly uniform European Union member states raise questions regarding the effectiveness of models reliant merely on socioeconomic and ecological factors. Rates of WEEE recycling in European Union member states may also be significantly influenced by political factors. This article aims to enhance the current comprehension of the factors affecting the rate of WEEE recycling. It achieves this by examining the influence of the age of cabinet members on the rate of WEEE recycling throughout European nations.
This study makes a pioneering contribution to the literature in two significant ways: Firstly, it is the first to explore the impact of the age of cabinet members on WEEE recycling rates, filling a gap left by previous research that has overlooked this factor. By addressing this gap, this study introduces a novel driver of WEEE recycling rates in European nations. Secondly, it offers fresh insights into how the demographic structure of parliamentarians, particularly the age of cabinet members, influences environmental progress.
The empirical exploration of e-waste recycling falls within the broader context of the recycling literature. Within this domain, studies examining the determinants of WEEE recycling may be broadly classified into two primary categories: The first category of research predominantly utilizes household-level data, frequently acquired via questionnaires, to pinpoint individual and micro-level factors influencing WEEE recycling attitudes. These investigations have examined the socioeconomic and demographic determinants, including factors such as age, gender, income, education, ethnicity, family size, and residence type, that influence decisions related to e-waste recycling in diverse countries. Notably, among these variables, age stands out as a focal point of discussion with no consensus reached on its impact.
Utilizing household-level data, various studies on e-waste recycling have produced conflicting findings regarding the association between age and WEEE recycling behavior. While some researchers assert that age plays a role in e-waste recycling behavior [8,9,10], others have failed to identify any such correlation [11,12,13]. Furthermore, among the studies recognizing age as a significant factor in e-waste recycling behavior, discrepancies exist in the type of correlation identified—whether positive or negative. Certain studies suggest that seniors exhibit a higher inclination towards e-waste recycling [8], while others contend that there is a discernible decline in positive attitudes toward e-waste recycling behavior with increasing age [9,14,15]. Additionally, some research [10,16] indicates that middle-aged individuals tend to display a more favorable attitude towards e-waste recycling compared to other age categories.
The second category of studies focuses on macro-level factors influencing rates of WEEE recycling through the examination of aggregate data. Cross-country analyses exploring factors determining WEEE recycling are limited. Boubellouta and Kusch-Brand [17] conducted a study spanning 2008–2018, aiming to identify key drivers of rates of WEEE recycling in 30 European nations. Their findings highlighted economic growth and WEEE collection as primary factors influencing recycling rates, with population, energy intensity, and private sector credit also contributing to the variations. Yilmaz and Koyuncu [18] scrutinized the effect of globalization and its sub-components on rates of WEEE recycling in European countries, revealing a favorable influence across 30 countries. Considering the influence of economic, social, institutional, and behavioral elements, Neves et al. [19] attempted to analyze the determinants and obstacles impacting WEEE recycling. Their research, utilizing yearly data spanning between 2010 and 2018 across 20 EU nations, employed the Arellano–Bond generalized method of moments. Their research results indicated that environmental taxes and education positively influence rates of WEEE recycling, whereas economic growth and research and development investment seem to have a negative impact. Additionally, specific age demographics, namely, individuals aged 65 and above and those under 15, were identified as less inclined to participate in e-waste recycling efforts. Additionally, Constantinescu et al. [20] investigated the impact of eco-investment on WEEE recycling in 24 European Union nations between 2009 and 2018 and identified a positive impact of eco-investment per capita on WEEE recycled per person throughout the studied time frame. As indicated by our literature review above, to the best of our knowledge, none of the prior empirical investigations have explored the association between the age of cabinet members and the rates of WEEE recycling in European nations. Thus, our research addresses a notable void in existing studies by proposing and examining the age of cabinet members as a plausible driver of WEEE recycling rates.
The second major contribution of this study is its provision of fresh insights into the influence of the demographic structure of parliamentarians, particularly the age of cabinet members, on environmental progress. Theories of descriptive and substantive representation offer a framework for comprehending how the sociodemographic characteristics of a parliamentary body (age, gender, race, class background, religious denomination, etc.) influence the decisions made by its members, thereby shaping their legislative actions. Thus, descriptive and substantive representation theories argue that the legislative behavior of members of parliament (MPs) is influenced not only by the demands of their constituents and party affiliations but also by personal attributes such as age, gender, and race [21]. Descriptive representation refers to the idea that elected officials should mirror the demographic characteristics of their constituents. Substantive representation goes beyond demographics and focuses on whether elected officials advocate for and enact policies that address the specific needs and interests of their constituents [22,23].
The theoretical literature of descriptive and substantive representation argues that descriptive representation of marginalized groups leads to substantive representation. In other words, the presence of representatives who closely resemble their constituents leads to a shift in policy outcomes toward the desired direction of their supporters [24]. In the empirical literature, the gender [25,26,27], racial [28,29,30], socioeconomic [31,32], and disability [33] composition of parliament members has been examined as instances of descriptive representation of specific societal groups, influencing policy outcomes.
The age of parliament members could also be an important sociodemographic characteristic of a parliamentary body affecting policy outcomes. Drawing from theoretical insights on descriptive and substantive representation, it is suggested that younger elected officials might prioritize issues more salient to younger demographics. Specifically, younger MPs may place greater emphasis on addressing climate change and its ramifications compared to their older counterparts [21]. This prioritization stems from the recognition that climate change, as a long-term external force, carries profound implications for future generations. Among the myriad of challenges, the rapid escalation in climate-related disasters is anticipated to disproportionately impact the lives of today’s youth relative to older generations [34]. Younger MPs may argue that they, along with their prospective families, directly experience the effects of climate change, compelling them to advocate for policies aimed at mitigating its adverse effects. Thus, younger legislators are more likely to prioritize environmental issues and advocate for policies aimed at protecting the environment.
In contrast to the well-documented underrepresentation of women [24,35,36,37,38,39], the insufficient participation of young parliamentarians has not received adequate attention in the empirical literature concerning the effect of the demographic characteristics of a parliamentary body on environmental factors. There are very few studies examining the influence of parliamentary age demographics on environmental factors. One such study by Debus and Himmelrath [21] delved into parliamentary debates concerning climate change issues within the German Bundestag spanning from 2013 to 2021. Their findings underscore the significance of MPs’ age, revealing a correlation wherein younger parliamentarians are more prolific in delivering speeches on climate policy matters. This suggests that younger MPs are notably active in advocating for climate-related concerns within parliamentary discourse. By focusing on the age of cabinet members and its impact on WEEE recycling rates, our study also contributes to the existing studies on the impact of the demographic characteristics of a parliamentary body on environmental factors by highlighting the pivotal role that the age of parliamentarians, particularly younger MPs, plays in environmental improvement, as indicated by WEEE recycling rates.
The succeeding sections of this research are organized as follows: In the Research Hypothesis Section, we delineate the fundamental theoretical arguments linking the demographic characteristics of parliament members with the rate of WEEE recycling. The Research Methodology and Data Section expounds upon the methodology and data utilized in this investigation. Furthermore, the Estimation Technique Section elaborates on the analytical method employed. The subsequent section, Estimation Results, presents the empirical findings derived from our analysis. Subsequently, in the Discussion Section, we delve into a comprehensive discourse concerning these empirical discoveries. Finally, the concluding section encapsulates the key findings and underscores their policy implications.
2. Research Hypotheses
This study aims to contribute to the relatively understudied subject of the impact of the age of parliament members on the environment in the literature. Drawing from the theoretical literature of descriptive and substantive representation, the research hypothesis of this study posits that a higher representation of young adults in cabinets is associated with increased e-waste recycling rates.
Hypothesis 1:
Higher representation of young adults in cabinets is associated with increased e-waste recycling rates.
Cabinet members are key decision-makers responsible for crafting and passing legislation that shapes a nation’s approach to various issues, including environmental concerns. Their age and generational perspectives can influence their awareness, understanding, and commitment to addressing contemporary challenges such as e-waste. The variation between generations in terms of long-term vision, environmental consciousness, technological literacy, and adaptability to change could elucidate the correlation between a greater representation of young adults in cabinets and increased e-waste recycling rates. First of all, the effect of WEEE is a long-term challenge necessitating a long-term perspective and solutions. It is conceivable that younger cabinet members, as they are likely to have longer political careers, may be more motivated to create and support sustainable and enduring policies that address the underlying causes of WEEE as opposed to proposing short-term solutions [21]. Additionally, younger generations often exhibit a high level of environmental consciousness, which enables them to act with greater sensitivity regarding sustainability and the protection of natural resources [11,16,34]. Younger cabinet members are likely to emphasize sustainable practices for robust WEEE recycling measures. This fosters the potential for effective legislation promoting sustainable e-waste management, which could encompass recycling initiatives, eco-friendly product design, and stricter regulations on electronic manufacturers. Moreover, younger cabinet members, often possessing higher technological literacy and adequate technical, cognitive, and socio-affective skills, may better understand the complex nature of WEEE and the need for advanced recycling technologies [15]. The inquisitive nature of young cabinet members regarding technology can effectively shape WEEE policies tailored to swiftly evolving electronic devices. This involves advocating for advanced recycling technologies and promoting sustainable practices in electronic product design and production. Lastly, the rapid progression of technology necessitates a flexible, integrated, and innovative legislative approach. Younger members of the cabinet might exhibit greater willingness to incorporate cutting-edge solutions and embrace innovative recycling technologies [39,40]. This ability to adapt is essential in developing policies that can effectively match the rapidly evolving electronics environment.
Suggesting that greater representation of young adults in cabinets correlates with increased rates of WEEE recycling, this research examines this previously uninvestigated hypothesis by analyzing unbalanced data from 30 European nations (28 EU member states, Norway, and Iceland) covering the years 2008 to 2018.
3. Research Methodology and Data
In our empirical study, the STIRPAT model (stochastic impacts by regression on population, affluence, and technology) is employed to analyze the impact of the age of cabinet members on WEEE in European nations. The STIRPAT model, developed by Dietz and Rosa [41], is derived from the IPAT (impacts, population, affluence, and technology) model proposed by Ehrlich and Holdren [42] to analyze the relationship between human activities and the environment.
According to the IPAT and STIRPAT models, the effect of human activities on the environment is influenced by three key factors: population size (P, denoted by total population), affluence (A, primarily indicated by GDP per capita), and technology (T, largely characterized by energy intensity). This relationship is often expressed as I = P × A × T. The STIRPAT model is an extended stochastic version of the IPAT model.
Over the years, IPAT and STIRPAT models have become widely used in various research fields, ranging from ecology and environmental science to economics and sociology, due to their flexibility, empirical support, stochastic nature, and versatility. One of the significant advantages of the STIRPAT model is its remarkable flexibility. This model allows for the seamless addition, modification, and decomposition of various influencing factors, making it highly adaptable to different research needs. This flexibility enables researchers to tailor the model to specific contexts, explore a wide range of variables, and gain deeper insights into the complex interactions that drive environmental impact [43,44]. By incorporating demographic, economic, and technological factors, these models offer a comprehensive view of how human activities and behaviors influence environmental sustainability [45,46,47]. Their widespread adoption highlights their importance as essential tools for analyzing and addressing the negative impacts of human activities on the environment.
To rigorously evaluate our research hypothesis as outlined in the relevant section, we include the “age of cabinet members” variable in our analytical model. This addition enables us to deepen our comprehension of the complex components affecting rates of WEEE recycling in the European landscape. By integrating the age of cabinet members into the model, we aim to elucidate how the demographic composition of decision-making bodies influences recycling initiatives, thus providing valuable insights into sustainable policymaking. As such, we constructed and estimated the following empirical model:
In Equation (1) above, i and t subscripts stand for country and time, respectively. Logarithmic forms of all variables were employed in the research.
In this study, the dependent variable investigated was the rate of WEEE recycling (EWRR), expressed as the proportion of recycled or reused e-waste compared to the total WEEE collected within a country. The data for EWRR were obtained from Eurostat, the statistical agency of the EU.
Drawing upon the frameworks of the IPAT and STIRPAT models, we incorporated total population (POPULATION), real per capita gross domestic product (at constant 2010 euro) (REALPCGDP), and the energy intensity of the economy (kilograms of oil equivalent per thousand euros) (ENERGYINT) as control variables. Data for REALPCGDP and ENERGYINT were sourced from Eurostat, whereas POPULATION data were retrieved from the World Development Indicators (WDIs) supplied by the World Bank. Consistent with the expectations outlined in the STIRPAT model, we anticipated negative coefficients for these variables. Thus, a rise in total population, GDP per capita, and energy intensity was expected to lead to a reduction in the rate of WEEE recycling.
The introduction of the GDP per capita square (REALPCGDP^2) variable into the model aimed to examine the potential presence of a nonlinear association between economic development and the rate of WEEE recycling, as proposed by the environmental Kuznets curve (EKC) hypothesis. This hypothesis proposes that there could be an inverted U-shaped relationship between economic progress and environmental degradation, suggesting that environmental deterioration may initially increase with economic advancement but eventually decrease beyond a certain threshold level. The EKC hypothesis has found widespread application in examining the interaction between economic growth and environmental quality across different environmental domains. Research investigating this hypothesis has explored diverse environmental metrics, including air and water pollution [48,49,50,51], deforestation [52,53], ecological footprint [54], and waste generation [55,56,57,58,59,60], across different global regions. Concerning the rate of WEEE recycling, this association could manifest as either a linear progression or a U-shaped curve, given that e-waste recycling signifies environmental amelioration. Confirmation of the U-shaped pattern would be indicated by a negative coefficient for the LREALPCGDP variable and a positive and statistically significant coefficient for REALPCGDP^2.
Incorporating additional factors beyond those proposed by the IPAT and STIRPAT models, we introduced total WEEE collected (measured in kilograms per capita) (TOTEWASTE) as a supplementary control variable, aligning with the pertinent literature [17,61]. The data for TOTEWASTE were sourced from Eurostat. Within our model, we anticipated observing a positive coefficient associated with this variable, given its indication of increased e-waste collection, thereby implying heightened recycling endeavors aimed at environmental preservation.
The main focus of this research centers on the variable CABINETAGE, which represents the average age of cabinet members. We introduced the CABINETAGE variable to investigate our research hypothesis regarding the potential correlation between the age of cabinet members and rates of WEEE recycling across European nations. The research hypothesis posits that a higher representation of young adults in cabinets correlates with increased WEEE recycling rates. Data on CABINETAGE were sourced from Teorell et al. [62]. Meanwhile, the variable CABINETAGE^2 represents the squared value of CABINETAGE. By including CABINETAGE^2 in the model, our aim is to explore the possible presence of a nonlinear correlation between the age of cabinet members and the rate of WEEE recycling. Confirmation of an inverted U-shaped Environmental Kuznets curve for the correlation between the rate of WEEE recycling and the age of cabinet members would occur if the coefficients of LCABINETAGE and LCABINETAGE^2 exhibit positive and negative signs, respectively.
This study investigates the role of age of cabinet members on e-waste recycling rate utilizing unbalanced data from 30 European nations, comprising 28 European Union member countries, Norway, and Iceland, spanning from 2008 to 2018. Table 1 outlines the variables utilized in the analysis along with their definitions and data sources. The constraints on this study’s time frame and the number of countries examined were dictated by the accessibility of data on rates of WEEE recycling, which were solely accessible for the time frame of 2008–2018 and for the 30 European nations with the most extensive sample size available.

Table 1.
Definition and source of the variables.
4. Estimation Technique
In this research, we opted for the panel quantile regression (PQR) technique rather than conventional ordinary least squares (OLS) techniques (such as pooled regression (PR), random effect regression (RER), fixed effect regression (RER), etc.) on several grounds. It is typical to notice unequal variation in the statistical distribution of data, leading to varying associations between relevant variables relying on the locations of the dependent variable’s conditional dispersion. Therefore, as discussed by Cade and Noon [63], estimation techniques depending on mean values (e.g., PR, FER, and RER techniques) could yield misleading findings. In contrast, unlike the conventional OLS technique, the quantile regression (QR) technique analyzes different locations of the conditional dispersion of the dependent variable, providing more robust and comprehensive insights into the relationship between the dependent and independent variables. As highlighted by Hübler [64] and Chen and Lei [65], the conventional OLS estimation technique may produce biased estimators in the presence of outliers, where a single outlier can significantly affect the estimation findings. In contrast, the QR technique is immune to such bias and generates results more robust to outliers. Additionally, as argued by Xu and Lin [66], OLS estimators are inconsistent when data distribution is not normal; however, estimators obtained from the QR technique remain consistent regardless of distributional assumption. When the OLS technique fails to meet its assumptions (such as linearity, homoscedasticity, independence, or normality), the QR technique serves as an alternative. While the conventional OLS technique uses the method of least squares to estimate the conditional mean of the dependent variable, the QR technique applies the method of minimizing median absolute deviation to compute the conditional median or other quantiles of the dependent variable.
Albulescu et al. [67] argued that PQR with fixed effects is not an appropriate and efficient estimation technique when the sample size (T, 11 years in our sample) is small and the number of observations (N, 30 countries in our sample) is large. Therefore, we opted to use PQR with non-additive fixed effects introduced by Powell [68] to circumvent this issue. The adaptive Markov chain Monte Carlo optimization technique was employed in the estimations.
In Table 2, we present the results of the normality tests, specifically the Shapiro–Wilk W (SWW) and Shapiro–Francia W’ (SFW’) tests. The estimation results of both tests indicate statistically significant values for six out of eight variables, suggesting that the majority of our variables are not normally distributed. These results from the normality tests reveal that the conditional mean regression of the OLS technique could produce biased estimation findings. Consequently, we chose the PQR technique, which yields robust estimation results even if variables are non-normally distributed.
Table 2.
SWW and SFW’ test results.
If the variables used in the analysis are not stationary, we could potentially run into the problem of spurious regression, leading to misleading estimation results between the e-waste recycling rate and its explanatory variables. For this reason, we conducted the Levin, Lin, and Chu (LLC) panel unit root test, and the test findings are presented in Table 3. As indicated by Table 3, all variables are stationary at the levels.
Table 3.
Levin, Lin, and Chu panel unit root test.
5. Estimation Results
In Table 4, we present the estimation results for the association between the age of cabinet members and the rate of WEEE recycling, as represented by the model provided in Equation 1. As shown in Table 4, the coefficients of the CABINETAGE and CABINETAGE^2 variables were significant at least at %5 significance level and exhibited positive and negative signs, respectively, throughout all quantiles of the dispersion of the rate of WEEE recycling. These results indicate the existence of a nonlinear relationship (i.e., an inverted U-shaped environmental Kuznets curve) between the age of cabinet members and the e-waste recycling rate, rather than a linear relationship.
Table 4.
Panel quantile regression results.
The CABINETAGE variable has the most significant positive influence on the rate of WEEE recycling in the 10th quantile, while the smallest impact is observed in the 60th quantile. Similarly, the CABINETAGE^2 variable has the greatest negative impact (in absolute terms) on the rate of WEEE recycling in the 10th quantile, with the smallest impact in the 60th quantile.
The calculated turning points suggest a range of ages between 47.288 (50th quantile) and 51.495 (90th quantile). The turning point age rises from the 10th to the 20th quantile, decreases from the 20th to the 30th quantile, increases from the 30th to the 40th quantile, declines from the 40th to the 50th quantile, rises from the 50th to the 60th quantile, and then declines from the 60th to the 70th quantile. After the 70th quantile, it increases in the consecutive two quantiles. The average turning point age is 49.087, indicating that the rate of WEEE recycling increases as the age of cabinet members rises until reaching 49.087, after which the rate of WEEE recycling declines.
The results presented in Table 4 reveal significant coefficients, both negative and positive, for REALPCGDP and REALPCGDP^2 variables throughout all nine quantiles. This suggests a U-shaped association between the rate of WEEE recycling, indicative of environmental progress, and per capita real GDP, a measure of a country’s development level. The observed U-shaped relationship aligns with the well-established environmental Kuznets curve hypothesis, indicating a positive link between development and environmental degradation at lower income levels, and a negative link at higher income levels. Our study corroborates this finding, highlighting a U-shaped connection between the rate of WEEE recycling and real gross domestic product per capita. This pattern aligns with prior studies on solid waste, that has revealed an inverted U-shaped association between gross domestic product per capita and solid waste generation, representing environmental deterioration (see, for example, [40,41] for WEEE).
In all quantiles, the energy intensity coefficient exhibited statistical significance, displaying a negative trend. This suggests that as energy intensity increases, the e-waste recycling rate tends to decrease. This observation corresponds with the viewpoint presented by Morley et al. [55], which posits that with the proliferation of electrical and electronic equipment, energy intensity also tends to escalate. Therefore, this heightened energy intensity could lead to increased e-waste generation, potentially overwhelming the capacity of existing e-waste management systems in respective countries.
Table 4 illustrates that that there is a negative significant relationship between population and the rate of WEEE recycling throughout all quantiles of the dispersion. This indicates that as population grows, rates of WEEE recycling tend to decline. One possible explanation for this phenomenon may be the inadequacy of WEEE recycling capacity to handle the increasing population, leading to diminished recycling rates. This issue has been discussed by Adshead et al. [69], Churchill et al. [70], Hummel and Lux [71], and Neves et al. [19]. It underscores the necessity for sufficient infrastructure, capacity enhancement, and funding in WEEE management [19] to support population growth and encourage sustainable recycling methods.
We obtained a statistically significant positive coefficient on the variable representing the amount of e-waste collected across all nine quantiles. This indicates that the WEEE recycling rate improves with a rise in the amount of collected WEEE. It is expected that more e-waste must be collected to facilitate processing and recycling, hence the positive coefficient. Moreover, this finding is corroborated by the study of Boubellouta and Kusch-Brandt [60], which concluded that the quantity of uncollected WEEE significantly influenced the amount of non-recycled WEEE in European nations.
Finally, Table 4 displays the findings of the Wald test (Koenker and Bassett [72]), which examines if the model estimated as a whole is statistically significant. The null hypothesis of Wald test asserts the equality to zero of entire partial slope coefficients of the estimated model, indicating the insignificance of the estimated model. The test results revealed that none of the estimated models is statistically insignificant.
6. Discussion
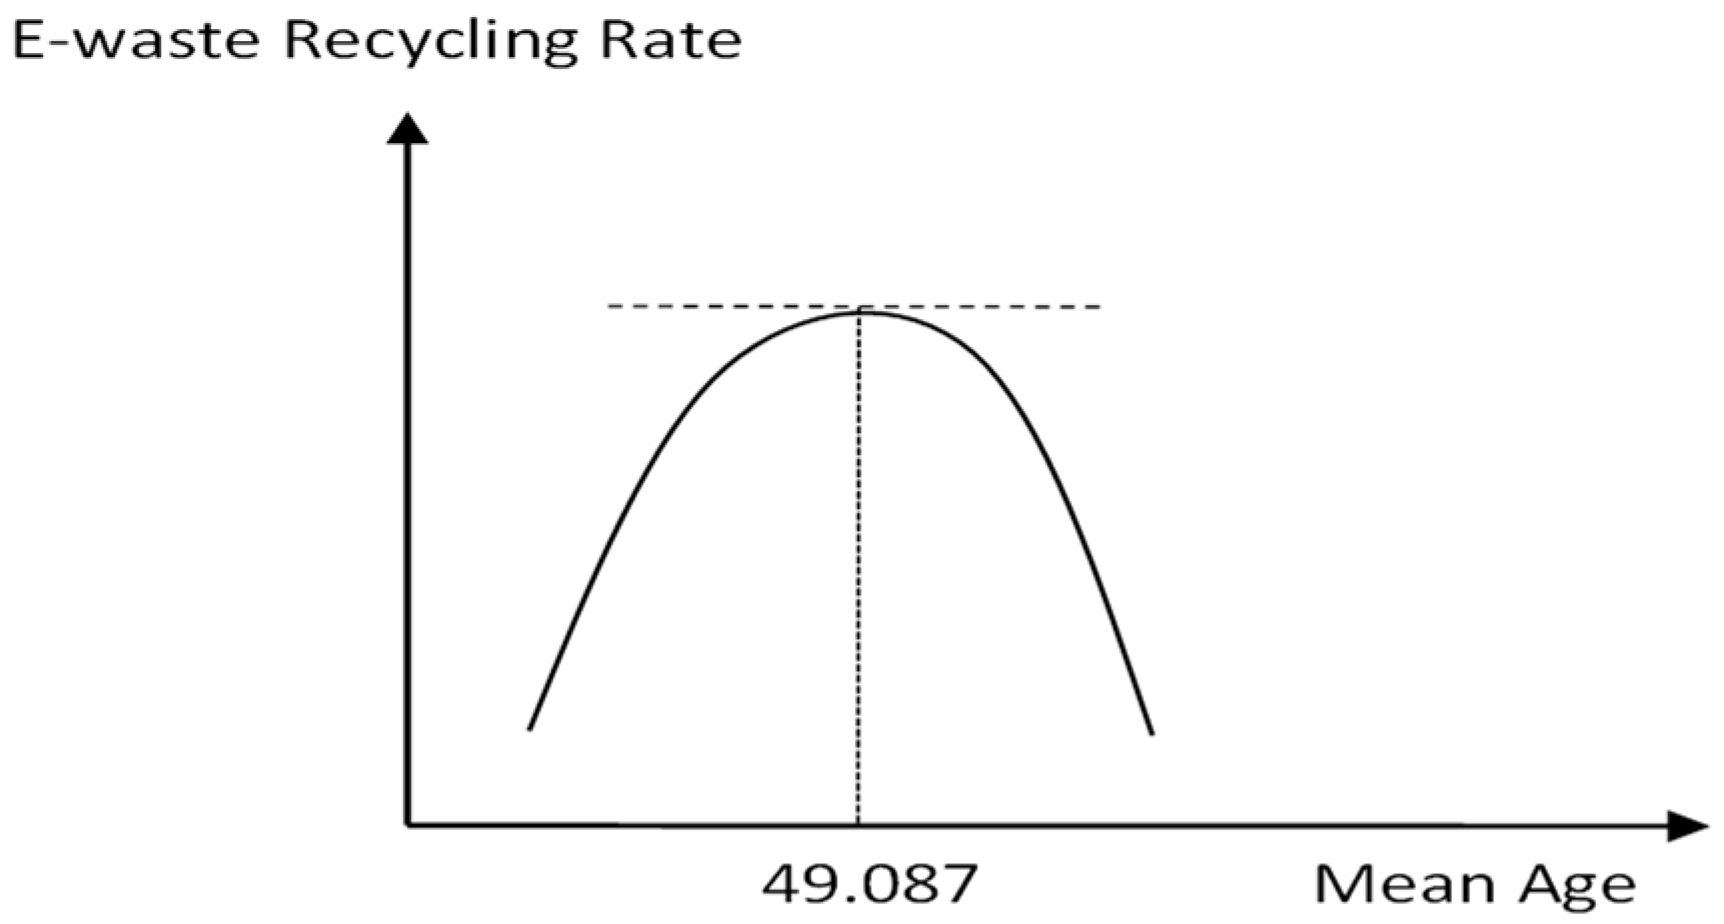
According to our estimation results, we have identified a nonlinear correlation, specifically an inverted U-shaped EKC, between the age of cabinet members and the rate of WEEE recycling, as hypothetically illustrated in Figure 2. This suggests that initially, the rate of WEEE recycling increases with the age of cabinet members, but beyond a certain threshold, it starts to decline. Our calculations reveal that the average turning point age is 49.087, indicating that the e-waste recycling rate shows an upward trend with the age of cabinet members until they reach 49.087 years old, after which it begins to decrease.

Figure 2.
Inverted U-shaped relationship between the age of cabinet members and the rate of WEEE recycling.
To understand how e-waste recycling rates change during different periods of politicians’ tenure, particularly during the youthful years of cabinet members, we analyzed the data by dividing our main sample into two subsamples (See Supplementary Materials) based on the age of cabinet members and the availability of corresponding e-waste recycling rate data. Using an average age turning point of 49, the first subsample included data for cabinet members under 49, and the second subsample included those aged 49 and above, resulting in 77 observations for the younger group and 194 for the older group. We conducted separate covariance and correlation analyses for each subsample. The results revealed positive covariance and correlation coefficients between e-waste recycling rates and cabinet member age for younger politicians, suggesting an increase in recycling rates during their tenure. In contrast, negative covariance and correlation coefficients were observed for the older group, indicating a decline in recycling rates. These findings reinforce our hypothesis and empirical evidence that e-waste recycling rates tend to increase during the youthful years of cabinet politicians but decline as they grow older, thereby enhancing the validity and significance of our conclusions.
These results are consistent with the predictions of both descriptive and substantive representation theories. These theories propose that younger elected officials are likely to prioritize issues that are more pertinent to younger demographics. Consequently, younger members of parliament (MPs) may show a stronger commitment to tackling environmental degradation and its consequences compared to their older counterparts.
This research presents a groundbreaking analysis within the existing literature, being the first to delve into the impact of cabinet members’ age on rates of WEEE recycling. Prior studies by Boubellouta and Kusch-Brand [17], Yilmaz and Koyuncu [18], Neves et al. [19], and Constantinescu et al. [20] have overlooked the demographic profile of parliament members as a factor influencing WEEE recycling. Our research addresses this oversight by proposing a novel determinant that affects rates of WEEE recycling. To the best of our knowledge, no prior empirical investigation has analyzed the correlation between the age of cabinet members and rates of WEEE recycling. Hence, this research makes a significant contribution to the literature by highlighting the demographic characteristics of parliament members, specifically the age of cabinet members, as a potential driver of WEEE recycling rates. By addressing this significant research void, our findings shed new light on the factors influencing e-waste management practices.
This research also contributes to the current body of studies investigating the connection between the demographic characteristics of parliament members and environmental quality. While the existing literature extensively discusses the underrepresentation of women [24,35,36,37,38], insufficient attention has been paid to the limited involvement of young parliamentarians in empirical studies examining the impact of parliamentary demographic characteristics on environmental factors. Previous research has shown a correlation between the presence of women in parliaments and various environmental outcomes, including the adoption of more stringent climate change policies [38], reductions in CO2 emissions [36,37] and deforestation [39], as well as increases in protected land areas [35] and renewable energy consumption [20].
Previous research examining the connection between the demographic attributes of parliament members and environmental quality has overlooked two crucial aspects: the importance of the age of cabinet members as a demographic characteristic and the significance of WEEE recycling rates as a parameter of environmental quality. This research expands upon the existing body of empirical investigation that explores the relationship between parliament members’ demographic characteristics and environmental factors. It introduces novel evidence highlighting the impact of cabinet members’ age on environmental advancement, particularly within the realm of WEEE recycling rates.
Our estimation findings confirm the proposition of Mavisakalyan and Tarverdi [38], who suggested that the age of politicians may influence climate change action, akin to the influence exerted by politicians’ gender identity. Additionally, our estimations align with those of Debus and Himmelrath [21], indicating significant involvement of younger MPs in advocating for climate-related issues within parliamentary discussions in the German Bundestag from 2013 to 2021.
In summary, our study underscores the significant influence of the age of cabinet members on rates of WEEE recycling, underscoring the need for ongoing research into the demographic attributes of parliament members. This emphasis on further investigation will not only enhance our comprehension of the complex interplay between parliament members’ demographic characteristics and recycling behaviors but also offer crucial insights to guide informed policymaking in the field of WEEE management.
7. Conclusions and Recommendations
This research sought to investigate how the age of cabinet members influences rates of WEEE recycling across 30 European nations, comprising 28 EU member states, Norway, and Iceland. The analysis evaluates the validity of descriptive and substantive representation theories, which suggest that younger elected officials may prioritize issues more pertinent to younger demographics. Consequently, younger MPs may focus more on addressing environmental degradation and its consequences compared to their older counterparts, leading to higher advocacy for increased e-waste recycling rates among younger cabinet members. To carry out this study, we utilized an unbalanced panel dataset covering the period between 2008 and 2018 and employed the panel quantile regression technique.
Our analysis reveals a nonlinear relationship, specifically an inverted U-shaped environmental Kuznets curve, between the age of cabinet members and the rate of WEEE recycling. Initially, the rate of WEEE recycling rises with the age of cabinet members, but beyond a certain threshold, it begins to decrease. Our calculations indicate that the average turning point age is 49.087 years, signifying that the rate of WEEE recycling increases with the age of cabinet members until they reach 49.087 years old, after which it starts to decline.
This research makes a pioneering contribution to the literature by being the first to explore the impact of the age of cabinet members on WEEE recycling rates. Moreover, it offers fresh insights into how the demographic structure of parliamentarians influences environmental progress, particularly in relation to WEEE recycling rates.
Although significant progress has been made by the European Union by introducing binding environmental standards, especially in the context of legislation, persistent challenges remain. The results of this research support the view that actively involving young politicians in cabinet positions can improve ecological policies and preservation initiatives. Young politicians play a vital and transformational role in shaping cabinet-level environmental policies and conservation efforts. As key decision-makers responsible for drafting legislation and governing a range of practices, including ecological concerns, their generational perspectives can significantly impact their dedication to addressing contemporary challenges like WEEE.
By advocating for the active inclusion of young politicians in decision-making positions, policymakers can benefit from new perspectives, innovative approaches, and increased commitment to solving pressing environmental problems. Embracing diversity in age within political leadership not only reflects a commitment to inclusive governance but also offers a pathway toward more effective and sustainable environmental policymaking.
One primary constraint of this research pertains to data availability. Obtaining more comprehensive data on the ages of parliament members and the sociodemographic characteristics of parliamentary bodies could potentially enhance the study results. Despite this constraint, our findings provide evidence of the significant role played by the age of cabinet members in promoting WEEE recycling rates in EU nations. These results hold implications for future research in this field and contribute to a deeper understanding of the relationship between the sociodemographic characteristics of parliamentary bodies and sustainability.
Future studies could explore extending time periods, focusing on specific countries or regions, integrating varied political and institutional determinants of WEEE recycling rates as control variables, and employing different econometric methods. Upon data availability, the individual ages of cabinet members can be used instead of the average age of cabinet members. The ages of parliament members can also be utilized, and the age–gender distribution of parliament and cabinet members can be studied. Additionally, the impact of the educational level and professional background of parliament and cabinet members on environmental factors can be examined. Nevertheless, single-country studies can be conducted by researchers who collect the aforementioned data themselves.
All the figures and tables in the manuscript are submitted for publication for the first time and can be used without any copyright constraints.
Supplementary Materials
The following supporting information can be downloaded at: https://www.mdpi.com/article/10.3390/su16188202/s1.
Author Contributions
Conceptualization, E.A., M.Ş., C.K. and R.Y.; methodology, C.K. and R.Y.; software, C.K.; validation, E.A., M.Ş., C.K. and R.Y.; formal analysis, C.K. and R.Y.; investigation, C.K. and R.Y.; resources, C.K.; data curation, E.A and C.K.; writing—original draft preparation, E.A., M.Ş., C.K. and R.Y.; writing—review and editing, E.A., M.Ş., C.K. and R.Y.; visualization, E.A., M.Ş., C.K. and R.Y.; supervision, R.Y.; project administration, E.A., M.Ş., C.K. and R.Y. All authors have read and agreed to the published version of the manuscript.
Funding
This research received no external funding.
Institutional Review Board Statement
Not applicable.
Informed Consent Statement
Not applicable.
Data Availability Statement
The list of variables and their definitions and sources are provided in Table 1. Furthermore, the data presented in this study are available on request from the corresponding author.
Conflicts of Interest
The authors declare no conflicts of interest.
References
- Forti, V.; Baldé, C.P.; Kuehr, R.; Bel, G. The Global E-Waste Monitor 2020: Quantities, Flows and the Circular Economy Potential; United Nations University (UNU)/United Nations Institute for Training and Research (UNITAR)—Co-hosted SCYCLE Programme, International Telecommunication Union (ITU) & International Solid Waste Association (ISWA): Bonn, Germany; Geneva, Switzerland; Rotterdam, The Netherlands, 2020. [Google Scholar]
- Garg, C.P. Modeling the e-waste mitigation strategies using grey-theory and DEMATEL framework. J. Clean. Prod. 2021, 281, 124035. [Google Scholar] [CrossRef]
- Salam, M.; Alam, F.; Dezhi, S.; Nabi, G.; Shahzadi, A.; Ul Hassan, S.; Ali, M.; Saeed, M.A.; Hassan, J.; Ali, N.; et al. Exploring the role of Black Soldier Fly Larva technology for sustainable management of municipal solid waste in developing countries. Environ. Technol. Innov. 2021, 24, 101934. [Google Scholar] [CrossRef]
- Nandan, A.; Suresh, A.C.; Saole, P.; Jeevanasai, S.A.; Chandrasekaran, R.; Meili, L.; Azelee, N.I.W.; Selvasembian, R. An integrated approach for electronic waste management—Overview of sources of generation, toxicological effects, assessment, governance, and mitigation approaches. Sustainability 2023, 15, 16946. [Google Scholar] [CrossRef]
- European Commission. Directive 2012/19/EU of the European Parliament and of the Council of 4 July 2012 on Waste Electrical and Electronic Equipment (WEEE); European Commission: Brussels, Belgium, 2012; Available online: https://eur-lex.europa.eu/legal-content/EN/TXT/?uri=CELEX:02012L0019-20180704 (accessed on 15 March 2024).
- Eurostat. Waste Statistics—Electrical and Electronic Equipment; European Commission, Directorate-General for Communication: Brussels, Belgium, 2023; Available online: https://ec.europa.eu/eurostat/statistics-explained/index.php?title=Waste_statisticselectrical_and_electronic_equipment&oldid=556612 (accessed on 15 March 2024).
- Cadoret, I.; Padovano, F. The political drivers of renewable energies policies. Energy Econ. 2016, 56, 261–269. [Google Scholar] [CrossRef]
- Nnorom, I.C.; Ohakwe, J.; Osibanjo, O. Survey of willingness of residents to participate in electronic waste recycling in Nigeria—A case study of mobile phone recycling. J. Clean. Prod. 2009, 17, 1629–1637. [Google Scholar] [CrossRef]
- Zhang, B.; Du, Z.; Wang, B.; Wang, Z. Motivation and challenges for e-commerce in e-waste recycling under “big data” context: A perspective from household willingness in China. Technol. Forecast. Soc. Change 2019, 144, 436–444. [Google Scholar] [CrossRef]
- Delcea, C.; Crăciun, L.; Ioanăș, C.; Ferruzzi, G.; Cotfas, L.-A. Determinants of individuals’ e-waste recycling decision: A case study from Romania. Sustainability 2020, 12, 2753. [Google Scholar] [CrossRef]
- Wang, Z.; Guo, D.; Wang, X. Determinants of residents’ e-waste recycling behaviour intentions: Evidence from China. J. Clean. Prod. 2016, 137, 850–860. [Google Scholar] [CrossRef]
- Miner, K.J.; Rampedi, I.T.; Ifegbesan, A.P.; Machete, F. Survey on household awareness and willingness to participate in e-waste management in Jos, Plateau State, Nigeria. Sustainability 2020, 12, 1047. [Google Scholar] [CrossRef]
- Dhir, A.; Malodia, S.; Awan, U.; Sakashita, M.; Kaur, P. Extended valence theory perspective on consumers’ e-waste recycling intentions in Japan. J. Clean. Prod. 2021, 312, 127443. [Google Scholar] [CrossRef]
- Saphores, J.D.M.; Ogunseitan, O.A.; Shapiro, A.A. Willingness to engage in a proenvironmental behavior: An analysis of e-waste recycling based on a national survey of US households. Resour. Conserv. Recycl. 2012, 60, 49–63. [Google Scholar] [CrossRef]
- Colesca, S.E.; Ciocoiu, C.N.; Popescu, M.L. Determinants of WEEE recycling behaviour in Romania: A fuzzy approach. Int. J. Environ. Res. 2014, 8, 353–366. [Google Scholar] [CrossRef]
- Echegaray, F.; Hansstein, F.V. Assessing the intention-behavior gap in electronic waste recycling: The case of Brazil. J. Clean. Prod. 2017, 142, 180–190. [Google Scholar] [CrossRef]
- Boubellouta, B.; Kusch-Brandt, S. Driving factors of e-waste recycling rate in 30 European countries: New evidence using a panel quantile regression of the EKC Hypothesis coupled with the STIRPAT Model. Environ. Dev. Sustain. 2023, 25, 7533–7560. [Google Scholar] [CrossRef]
- Yilmaz, R.; Koyuncu, C. The impact of globalization on the rate of e-waste recycling: Evidence from European countries. Amfiteatru Econ. 2023, 25, 180–195. [Google Scholar] [CrossRef]
- Neves, S.A.; Marques, A.C.; Silva, I.P. Promoting the circular economy in the EU: How can the recycling of e-waste be increased? Struct Chang Econ Dyn. 2024, 70, 192–201. [Google Scholar] [CrossRef]
- Constantinescu, A.; Platon, V.; Surugiu, M.; Frone, S.; Antonescu, D.; Mazilescu, R. The influence of eco-investment on e-waste recycling-evidence from EU countries. Front. Environ. Sci. 2022, 10, 928955. [Google Scholar] [CrossRef]
- Debus, M.; Himmelrath, N. Advocates of climate action? The age of members of parliament and their activity in legislative debates on climate change. Clim. Action. 2022, 1, 16. [Google Scholar] [CrossRef]
- Phillips, A. The Politics of Presence; Oxford University Press: Oxford, UK, 1995. [Google Scholar]
- Hero, R.E.; Tolbert, C.J. A racial/ethnic diversity interpretation of politics and policy in the states of the U.S. Am. J. Polit. Sci. 1996, 40, 851–871. [Google Scholar] [CrossRef]
- Salamon, H. The effect of women’s parliamentary participation on renewable energy policy outcomes. Eur. J. Polit. Res. 2023, 62, 174–196. [Google Scholar] [CrossRef]
- Catalano, A. Women acting for women? An analysis of gender and debate participation in the British house of commons 2005–2007. Polit Gend 2009, 5, 45–68. [Google Scholar] [CrossRef]
- Bhalotra, S.; Clots-Figueras, I. Health and the Political Agency of Women. Am. Econ. J: Econ. Policy 2014, 6, 164–197. [Google Scholar] [CrossRef]
- Wäckerle, J.; Castanho Silva, B. Distinctive voices: Political speech, rhetoric, and the substantive representation of women in European Parliaments. Legis. Stud. Q. 2023, 48, 797–831. [Google Scholar] [CrossRef]
- Bird, K.; Saalfeld, T.; Wüst, A.M. The Political Representation of Immigrants and Minorities: Voters, Parties and Parliaments in Liberal Democracies; Routledge: London, UK, 2010. [Google Scholar]
- Saalfeld, T.; Bischof, D. Minority-ethnic MPs and the substantive representation of minority interests in the house of commons. Parliam. Aff. 2013, 66, 305–328. [Google Scholar] [CrossRef]
- Bäck, H.; Debus, M. Personalized versus partisan representation in the speeches of migrant members of parliament in the German Bundestag. Ethn. Racial Stud. 2020, 43, 1673–1691. [Google Scholar] [CrossRef]
- Carnes, N. Does the numerical underrepresentation of the working class in congress matter? Legis. Stud. Q. 2012, 37, 5–34. [Google Scholar] [CrossRef]
- Carnes, N.; Lupu, N. The economic backgrounds of politicians. Annu. Rev. Polit. Sci. 2023, 26, 253–270. [Google Scholar] [CrossRef]
- Reher, S. Do disabled candidates represent disabled citizens? Br. J. Polit. Sci. 2022, 52, 520–534. [Google Scholar] [CrossRef]
- Wallis, H.; Loy, L.S. What drives pro-environmental activism of young people? A survey study on the Fridays for future movement. J. Environ. Psychol. 2021, 74, 101581. [Google Scholar] [CrossRef]
- Nugent, C.; Shandra, J.M. State environmental protection efforts, women’s status, and world polity. Organ. Environ. 2009, 22, 208–229. [Google Scholar] [CrossRef]
- Ergas, C.; York, R. Women’s status and carbon dioxide emissions: A quantitative cross-national analysis. Soc. Sci. Res. 2012, 41, 965–976. [Google Scholar] [CrossRef] [PubMed]
- Lv, Z.; Deng, C. Does women’s political empowerment matter for improving the environment? A heterogeneous dynamic panel analysis. Sustain. Dev. 2018, 27, 603–612. [Google Scholar] [CrossRef]
- Mavisakalyan, A.; Tarverdi, Y. Gender and climate change: Do female parliamentarians make difference? Eur. J. Political Econ. 2019, 56, 151–164. [Google Scholar] [CrossRef]
- Salahodjaev, R.; Jarilkapova, D. Women in parliament and deforestation: Cross-country evidence. J. Nat. Conserv. 2020, 55, 125830. [Google Scholar] [CrossRef]
- Liem, G.A.D.; Martin, A.J. Young people’s responses to environmental issues: Exploring the roles of adaptability and personality. Pers. Individ. Differ. 2015, 79, 91–97. [Google Scholar] [CrossRef]
- Dietz, T.; Rosa, E.A. Effects of population and affluence on CO2 emissions. Proc. Natl. Acad. Sci. USA 1997, 94, 175–179. [Google Scholar] [CrossRef]
- Ehrlich, P.R.; Holdren, J.P. Impact of population growth. Science 1971, 171, 1212–1217. [Google Scholar] [CrossRef]
- Khan, A.N.; En, X.; Raza, M.Y.; Khan, N.A.; Ali, A. Sectorial study of technological progress and CO2 emission: Insights from a developing economy. Technol. Forecast. Soc. Chang. 2020, 151, 119862. [Google Scholar] [CrossRef]
- Yu, S.; Zhang, Q.; Hao, J.L.; Ma, W.; Sun, Y.; Wang, X.; Song, Y. Development of an extended STIRPAT model to assess the driving factors of household carbon dioxide emissions in China. J. Environ. Manag. 2023, 325, 116502. [Google Scholar] [CrossRef]
- York, R.; Rosa, E.A.; Dietz, T. STIRPAT, IPAT, and ImPACT: Analytic tools for unpacking the driving forces of environmental impacts. Ecol. Econ. 2003, 46, 351–365. [Google Scholar] [CrossRef]
- Aluko, O.A.; Opoku, E.E.O.; Ibrahim, M. Investigating the environmental effect of globalization: Insights from selected industrialized countries. J. Environ. Manag. 2021, 281, 111892. [Google Scholar] [CrossRef] [PubMed]
- Thio, E.; Tan, M.; Li, L.; Salman, M.; Long, X.; Sun, H.; Zhu, B. The estimation of influencing factors for carbon emissions based on EKC hypothesis and STIRPAT model: Evidence from top 10 countries. Environ. Dev. Sustain. 2022, 24, 11226–11259. [Google Scholar] [CrossRef]
- Khan, D.; Ullah, A. Testing the relationship between globalization and carbon dioxide emissions in Pakistan: Does environmental Kuznets curve exist? Environ. Sci. Pollut. Res. 2019, 26, 15194–15208. [Google Scholar] [CrossRef]
- Wang, Z.; Rasool, Y.; Zhang, B.; Ahmed, Z.; Wang, B. Dynamic linkage among industrialisation, urbanisation, and CO2 Emissions in APEC realms: Evidence based on DSUR estimation. Struct. Change Econ. Dyn. 2020, 52, 382–389. [Google Scholar] [CrossRef]
- Sebri, M. Testing the EKC Hypothesis for water footprint indicator: A cross-sectional study. J. Environ. Plan. Manag. 2015, 59, 1933–1956. [Google Scholar] [CrossRef]
- Zhang, C.; Wang, Y.; Song, X.; Kubota, J.; He, Y.; Tojo, J.; Zhu, X. An integrated specification for the nexus of water pollution and economic growth in China: Panel cointegration, long-run causality and EKC. Sci. Total Environ. 2017, 609, 319–328. [Google Scholar] [CrossRef]
- Ehrhardt-Martinez, K.; Crenshaw, E.M.; Jenkins, J.C. Deforestation and the environmental Kuznets curve: A cross-national investigation of intervening mechanisms. Soc. Sci. Q. 2002, 83, 226–243. [Google Scholar] [CrossRef]
- Pablo-Romero, M.P.; Sánchez-Braza, A.; Gil-Pérez, J. Is deforestation needed for growth? Testing the EKC hypothesis for Latin America. For. Policy Econ. 2023, 148, 102915. [Google Scholar] [CrossRef]
- Suki, N.M.; Sharif, A.; Afshan, S.; Suki, N.M. Revisiting the environmental Kuznets curve in Malaysia: The role of globalization in sustainable environment. J. Clean. Prod. 2020, 264, 121669. [Google Scholar] [CrossRef]
- Morley, J.; Widdicks, K.; Hazas, M. Digitalisation, energy and data demand: The impact of internet traffic on overall and peak electricity consumption. Energy Res. Soc. Sci. 2018, 38, 128–137. [Google Scholar] [CrossRef]
- Su, E.C.; Chen, Y. Policy or income to affect the generation of medical wastes: An application of EKC by using Taiwan as an example. J. Clean. Prod. 2018, 188, 489–496. [Google Scholar] [CrossRef]
- Ercolano, S.; Gaeta, G.; Ghinoi, S.; Silvestri, F. Kuznets curve in municipal solid waste production: An empirical analysis based on municipal-level panel data from the Lombardy region (Italy). Ecol. Indic. 2018, 93, 397–403. [Google Scholar] [CrossRef]
- Gui, S.; Zhao, L.; Zhang, Z. Does municipal solid waste generation in China support the EKC? New evidence from spatial linkage analysis. Waste Manag. 2019, 84, 310–319. [Google Scholar] [CrossRef] [PubMed]
- Boubellouta, B.; Kusch-Brandt, S. Testing the Environmental Kuznets Curve Hypothesis for e-waste in the EU28+2 countries. J. Clean. Prod. 2020, 277, 123371. [Google Scholar] [CrossRef]
- Boubellouta, B.; Kusch-Brandt, S. Relationship between economic growth and mismanaged e-waste: Panel data evidence from 27 EU countries analyzed under the Kuznets Curve Hypothesis. Waste Manag. 2021, 120, 85–97. [Google Scholar] [CrossRef]
- Cerueira, P.A.; Soukiazis, E. Socio-economic and political factors affecting the rate of recycling in Portuguese municipalities. Econ. Model. 2022, 108, 105779. [Google Scholar] [CrossRef]
- Teorell, J.; Sundström, A.; Holmberg, S.; Rothstein, B.; Pachon, N.A.; Dalli, C.M. The Quality of Government Standard Dataset, Version Jan22; University of Gothenburg, the Quality of Government Institute: Gothenburg, Sweden, 2022. [Google Scholar] [CrossRef]
- Cade, B.S.; Noon, B.R. A gentle introduction to quantile regression for ecologists. Front. Ecol. Environ. 2003, 1, 412–420. [Google Scholar] [CrossRef]
- Hübler, M. The inequality-emissions nexus in the context of trade and development: A quantile regression approach. Ecol. Econ. 2017, 134, 174–185. [Google Scholar] [CrossRef]
- Chen, W.; Lei, Y. The impacts of renewable energy and technological innovation on environment energy- growth nexus: New evidence from a panel quantile regression. Renew. Energy 2018, 123, 1–14. [Google Scholar] [CrossRef]
- Xu, B.; Lin, B. Investigating drivers of CO2 emission in China’s heavy industry: A quantile regression analysis. Energy 2020, 206, 118159. [Google Scholar] [CrossRef]
- Albulescu, C.T.; Tiwari, A.K.; Yoon, S.-M.; Kang, S.H. FDI, income, and environmental pollution in Latin America: Replication and extension using panel quantile regression analysis. Energy Econ. 2019, 84, 104504. [Google Scholar] [CrossRef]
- Powell, D. Quantile regression with non-additive fixed effects. Empir. Econ. 2022, 63, 2675–2691. [Google Scholar] [CrossRef]
- Adshead, D.; Thacker, S.; Fuldauer, L.I.; Hall, J.W. Delivering on the sustainable development goals through long-term infrastructure planning. Global Environ. Chang. 2019, 59, 101975. [Google Scholar] [CrossRef]
- Churchill, S.A.; Inekwe, J.; Ivanovski, K.; Smyth, R. Transport infrastructure and CO2 emissions in the OECD over the long run. Transp. Res. D Transp. Environ. 2021, 95, 102857. [Google Scholar] [CrossRef]
- Hummel, D.; Lux, A. Population decline and infrastructure: The case of the German water supply system. Vienna Yearb. Popul. Res. 2007, 5, 167–191. Available online: https://www.jstor.org/stable/23025603 (accessed on 15 May 2024). [CrossRef]
- Koenker, R.; Bassett, G. Tests of linear hypotheses and l″1 estimation. Econometrica 1982, 50, 1577–1583. [Google Scholar] [CrossRef]
Disclaimer/Publisher’s Note: The statements, opinions and data contained in all publications are solely those of the individual author(s) and contributor(s) and not of MDPI and/or the editor(s). MDPI and/or the editor(s) disclaim responsibility for any injury to people or property resulting from any ideas, methods, instructions or products referred to in the content. |
© 2024 by the authors. Licensee MDPI, Basel, Switzerland. This article is an open access article distributed under the terms and conditions of the Creative Commons Attribution (CC BY) license (https://creativecommons.org/licenses/by/4.0/).