Article

Multi-Technique Approach for the Sustainable Characterisation and the Digital Documentation of Painted Surfaces in the Hypogeum Environment of the Priscilla Catacombs in Rome

by
Paola Calicchia
1,
Sofia Ceccarelli
2,*,
Francesco Colao
3,
Chiara D’Erme
1,
Valeria Di Tullio
4,
Massimiliano Guarneri
3,
Loredana Luvidi
4,
Noemi Proietti
4,
Valeria Spizzichino
3,
Margherita Zampelli
4 and
Rocco Zito
5
1
Institute of Marine Engineering (INM), CNR, Via Fosso del Cavaliere 100, 00133 Roma, Italy
2
Institute of Heritage Science (ISPC), CNR, Via Cardinale Guglielmo Sanfelice 8, 80134 Napoli, Italy
3
ENEA, Frascati Research Center, Via Enrico Fermi 45, 00044 Frascati, Italy
4
Institute of Heritage Science (ISPC), CNR, Area della Ricerca di Roma 1, Via Salaria Km 29.300, 00010 Montelibretti, Italy
5
DIMES Department, University of Calabria, Via P. Bucci, 87036 Rende, Italy
*
Author to whom correspondence should be addressed.
Sustainability 2024, 16(19), 8284; https://doi.org/10.3390/su16198284
Submission received: 8 May 2024 / Revised: 7 August 2024 / Accepted: 10 September 2024 / Published: 24 September 2024

Abstract

:
The purpose of this paper is to identify an efficient, sustainable, and “green” approach to address the challenges of the preservation of hypogeum heritage, focusing on the problem of moisture, a recurring cause of degradation in porous materials, especially in catacombs. Conventional and novel technologies have been used to address this issue with a completely non-destructive approach. The article provides a multidisciplinary investigation making use of advanced technologies and analysis to quantify the extent and distribution of water infiltration in masonry before damage starts to be visible or irreversibly causes damage. Four different technologies, namely Portable Nuclear Magnetic Resonance (NMR), Audio Frequency–Acoustic Imaging (AF–AI), Laser-Induced Fluorescence (LIF), Infrared Thermography (IRT), and 3D Laser Scanning (RGB-ITR), were applied in the Priscilla catacombs in Rome (Italy). These imaging techniques allow the characterisation of the deterioration of painted surfaces within the delicate environment of the Greek chapel in the Priscilla catacombs. The resulting high-detailed 3D coloured model allowed for easily referencing the data collected by the other techniques aimed also at the study of the potential presence of salt efflorescence and/or microorganisms. The results supply an efficient and sustainable tool aimed at cultural heritage conservation but also at the creation of digital documentation obtained with green methodologies for a wider sharing, ensuring its preservation for future generations.

1. Introduction

At this historical moment when cultural, socio-political, and especially climatic and environmental transformations are sadly occurring daily, the importance of characterising and understanding the different typologies of changes and their effects is crucial in many fields, in particular in cultural heritage (CH) conservation. Choosing the proper approaches for studying and preserving artworks is fundamental in the actual scenario, also with the final goal of complying sustainability criteria and achieving conscientious methodologies of analysis, in line with the Sustainable Development Goals of the UN 2030 Agenda [1]. In this important framework, the definition of the effects of the mentioned transformations on CH, occurring also at the local level, could permit long-term predictions of degradation impacts and more appropriate assessments of sustainable conservative plans. Moreover, the fundamental aspect of preserving cultural traditions and identities through the preservation of tangible and intangible heritage should not be neglected, which should also pass through the realisation of national and international policies in a worldwide sense of education and awareness of sustainability. Among heritage sites that documented particular historical and artistic periods and human traditions, catacombs are a peculiar representation of the strong connection between faith and death. Catacombs, as all the hypogenous environments, are a delicate category of CH, characterised by particular and extreme conditions of temperature, humidity, lighting, and air, which favour several degradation phenomena that lead to major, and often irreversible, problems for their conservation, musealization, and fruition. Among the causes of such decay phenomena, thermo-hygrometric variations can produce dimensional changes and defects in the wall structure (cracks, detachments), biological effects (formation of mildew, fungi, and insects on materials, favoured by temperatures above 20 °C and relative humidity greater than 65%), and, at the same time, the activation of chemical phenomena of oxidation and corrosion [2,3]. Another important factor to always keep in mind is the opening of these spaces to visitors′ fruition, which has a crucial impact on microclimatic hypogeum conditions that can cause or accelerate degradation processes due to the passage of visitors that can increase carbon dioxide and/or biological growth. For these reasons, the conservation of hypogeum environments is still an open and delicate issue, which can find in the use of diagnostic techniques an important tool for preventive characterisation of the degradation processes and for long-term documentation. In this context, the most common approach consists in the application of temperature and humidity sensors for monitoring thermo-hygrometric parameters, but this is not always sufficient to characterise issues or prevent new ones. In addition to being influenced by changes in temperature and internal humidity, hypogeum environments are continuously subject to the risk of water infiltration due to the percolation of rainwater and any underground aquifers that may be present. Therefore, a detailed diagnosis of the extent of humidity is a fundamental step to be performed before any conservation work. In this context, nuclear magnetic resonance is a widely used technique as an analytical and non-invasive tool for the in situ quantitative mapping of the moisture distribution in precious and ancient walls deteriorated by water infiltration [4,5,6]. Such infiltrations, as well as inappropriate thermo-hygrometric conditions, can cause structural damage on masonry structures, as described before, which can be effectively characterised and revealed by means of contactless acoustic diagnostic [7] and thermographic [8,9] techniques. Another efficient method for detecting surface damages or biochemical alterations of materials is the measurement of fluorescence [10]. For documentation purposes, 3D modelling is nowadays globally affirmed as a digitalisation method in many contexts and acquisition ranges, providing good results also in critical environments [11,12,13,14].
In this paper, a multidisciplinary work carried out inside the Priscilla catacombs placed in Rome (Italy) is presented, focusing the analyses inside a particular decorated room named the Greek chapel. Here, several conservative problems due to the humidity were visible, requiring moisture mapping and, at the same time, accurate documentation of both structure and colour. A multi-technique approach was performed using different methods in a completely non-invasive way by combining instrumentation developed also for other applications, such as nuclear inspections. Five advanced instrumentations were employed in this work: a portable Nuclear Magnetic Resonance (NMR), an Audio Frequency–Acoustic Imaging (AF–AI) scanner, a fluorescence Light Detection and Ranging (LiDAR), an Infrared Thermographic camera, and a three-dimensional (3D) laser scanner. Such approaches allowed an evaluation of the moisture distribution as well as the presence of water-related effects such as structural damage and biological attacks. The 3D model provided the complete and accurate digitalisation of the decorated room, here obtained for the first time and then used for better contextualising the NMR, AF–AI, LIF, and IRT measurements.
The sustainability of the proposed approach can be found in several aspects: the techniques were adopted within a regional project framework (ReMEDIA [15]) that enabled the Priscilla catacombs free access to advanced and prototype facilities, otherwise not accessible due to costs and expertise necessity; the multidisciplinary nature of this study led to a strong collaboration between the scholars involved, also coming from different institutions and departments, in a spirit of cooperation and sharing that made it possible to overcome the gaps between the protagonists in CH field. Moreover, the presented approach aimed at recording the actual conditions of the site and at obtaining information useful also for the definition of sustainable and reversible conservation procedures by using the correct long-lasting materials in order to ensure its preservation for future generations.

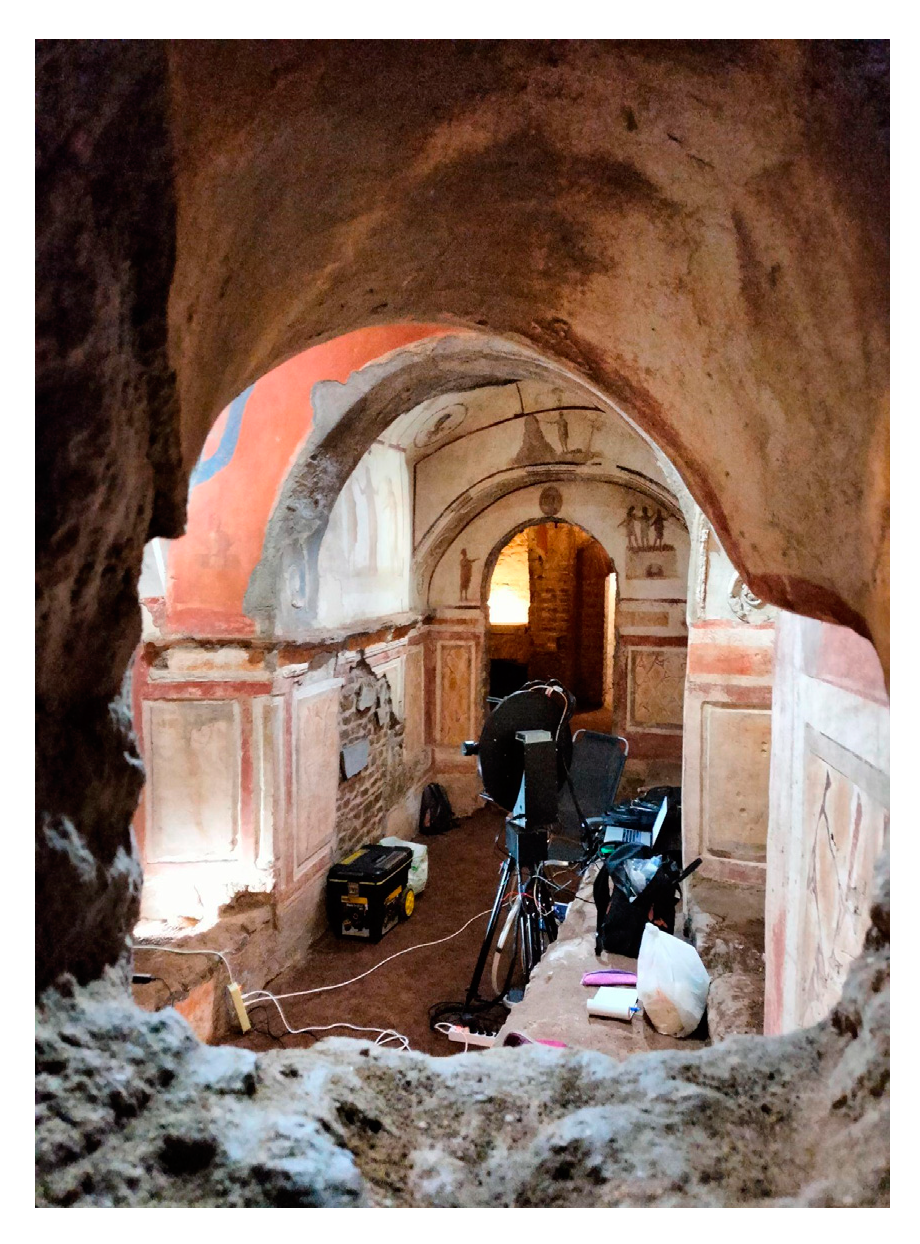
2. Priscilla Catacombs

The Priscilla catacombs were excavated between the 2nd and 5th centuries from pre-existing hypogeum rooms, tombs of a Roman ancient noble family [16]. To this family belongs the donor of the land, the noblewoman Priscilla, who is mentioned by Roman martyrology as a benefactor of the Christian community of Rome. This cemetery was one of the first to be found in the 16th century and therefore abundantly robbed of tombstones, sarcophagi, and bodies of martyrs. The tunnels are excavated in tuff with an extension of about 13 km in length, in various depths and routes. In this work, the scientific analyses were focused on the peculiar room called “Greek chapel” from two Greek inscriptions in the right niche (Figure 1a), first seen by the discoverers. The room is richly decorated with paintings and stuccoes in the Pompeian style (Figure 1b), and it has a distinctive shape being composed of three niches and a counter, which were held at the tombs in honour of the dead. Numerous episodes from the Old Testament are depicted in the chapel′s decorations: Noah coming out of the ark and Moses causing water to spring from the rock; the sacrifice of Isaac; the three stories of miraculous salvation from the book of Daniel (Daniel among the lions, the three young men in the furnace, Susanna accused of adultery by the old Babylonian judges and saved by Daniel). Other painted scenes come from the New Testament, including the depiction of the resurrection of Lazarus, the healing of the paralytic, and the adoration of the Magi.
The entire network of tunnels is located beneath one of the greatest green areas in the north of Rome, known as the Park of Villa Ada Savoia, delimited by a main street (Via Salaria) and a highly urbanised quarter. More specifically, the Greek Chapel is at a first underground level corresponding to the point at the surface of the park near the Basilica of Saint Sylvester (geographic coordinates 41°55′51″ N 12°30′29″ E). The ground is thus exposed to rainwater absorption that may contribute to water infiltrations in the underground levels. Due to the hypogeum environment, the conservative conditions of paintings and structure are very delicate, requiring periodic controls and monitoring procedures.

3. Methods

The multi-technique approach of this work consisted of using five different advanced approaches for measurements and digitalisation of the Greek chapel within the Priscilla catacombs. In this paragraph, each method and apparatus are briefly described, focusing attention on the acquisition parameters.

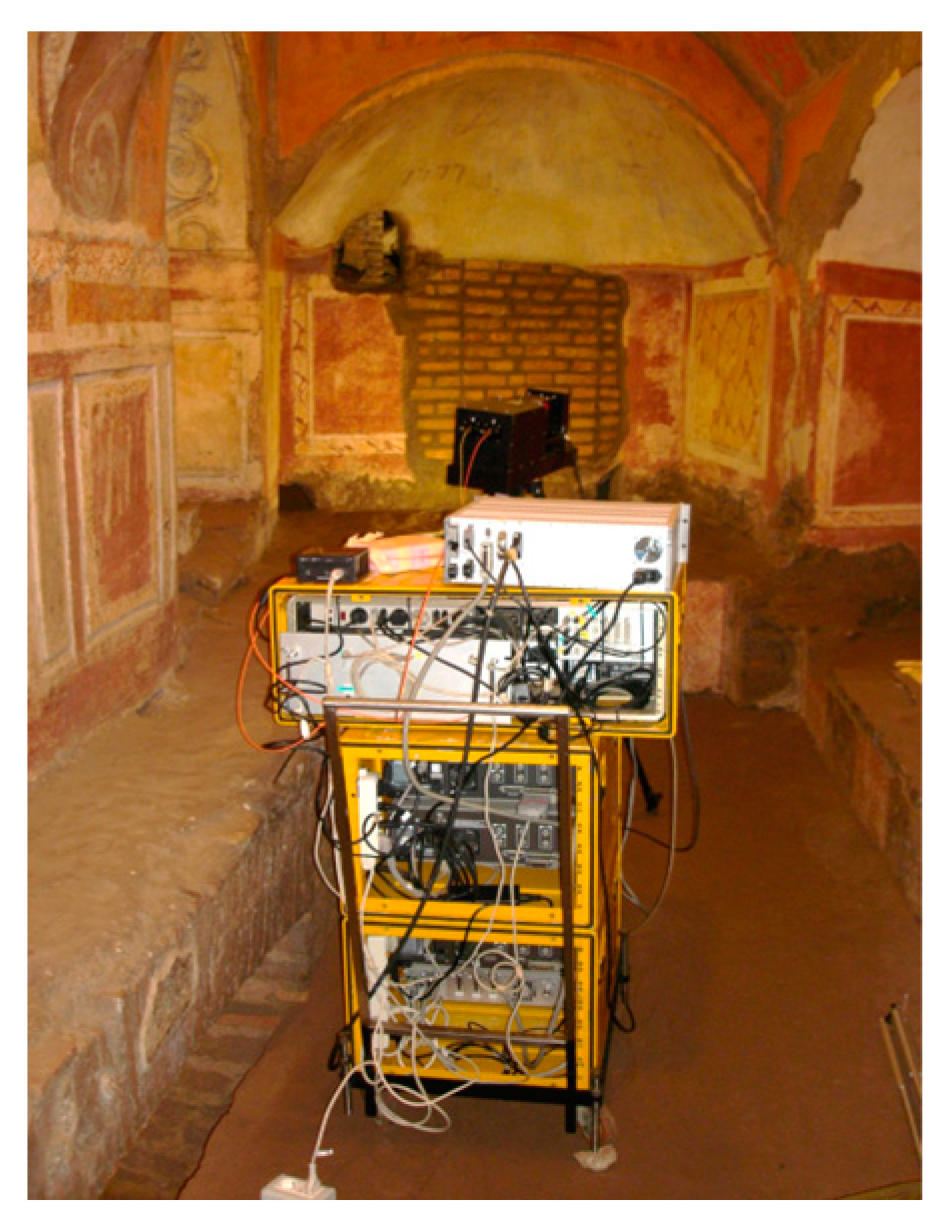
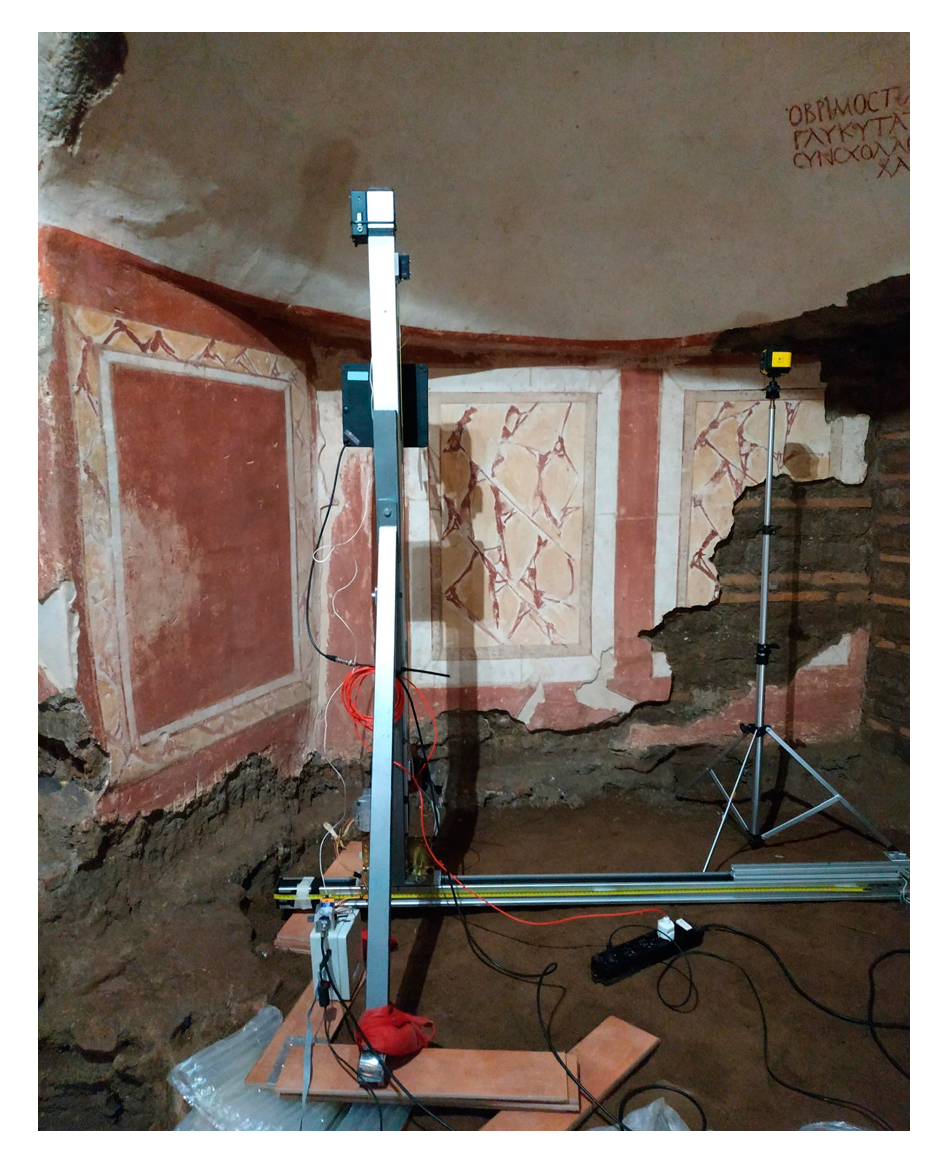
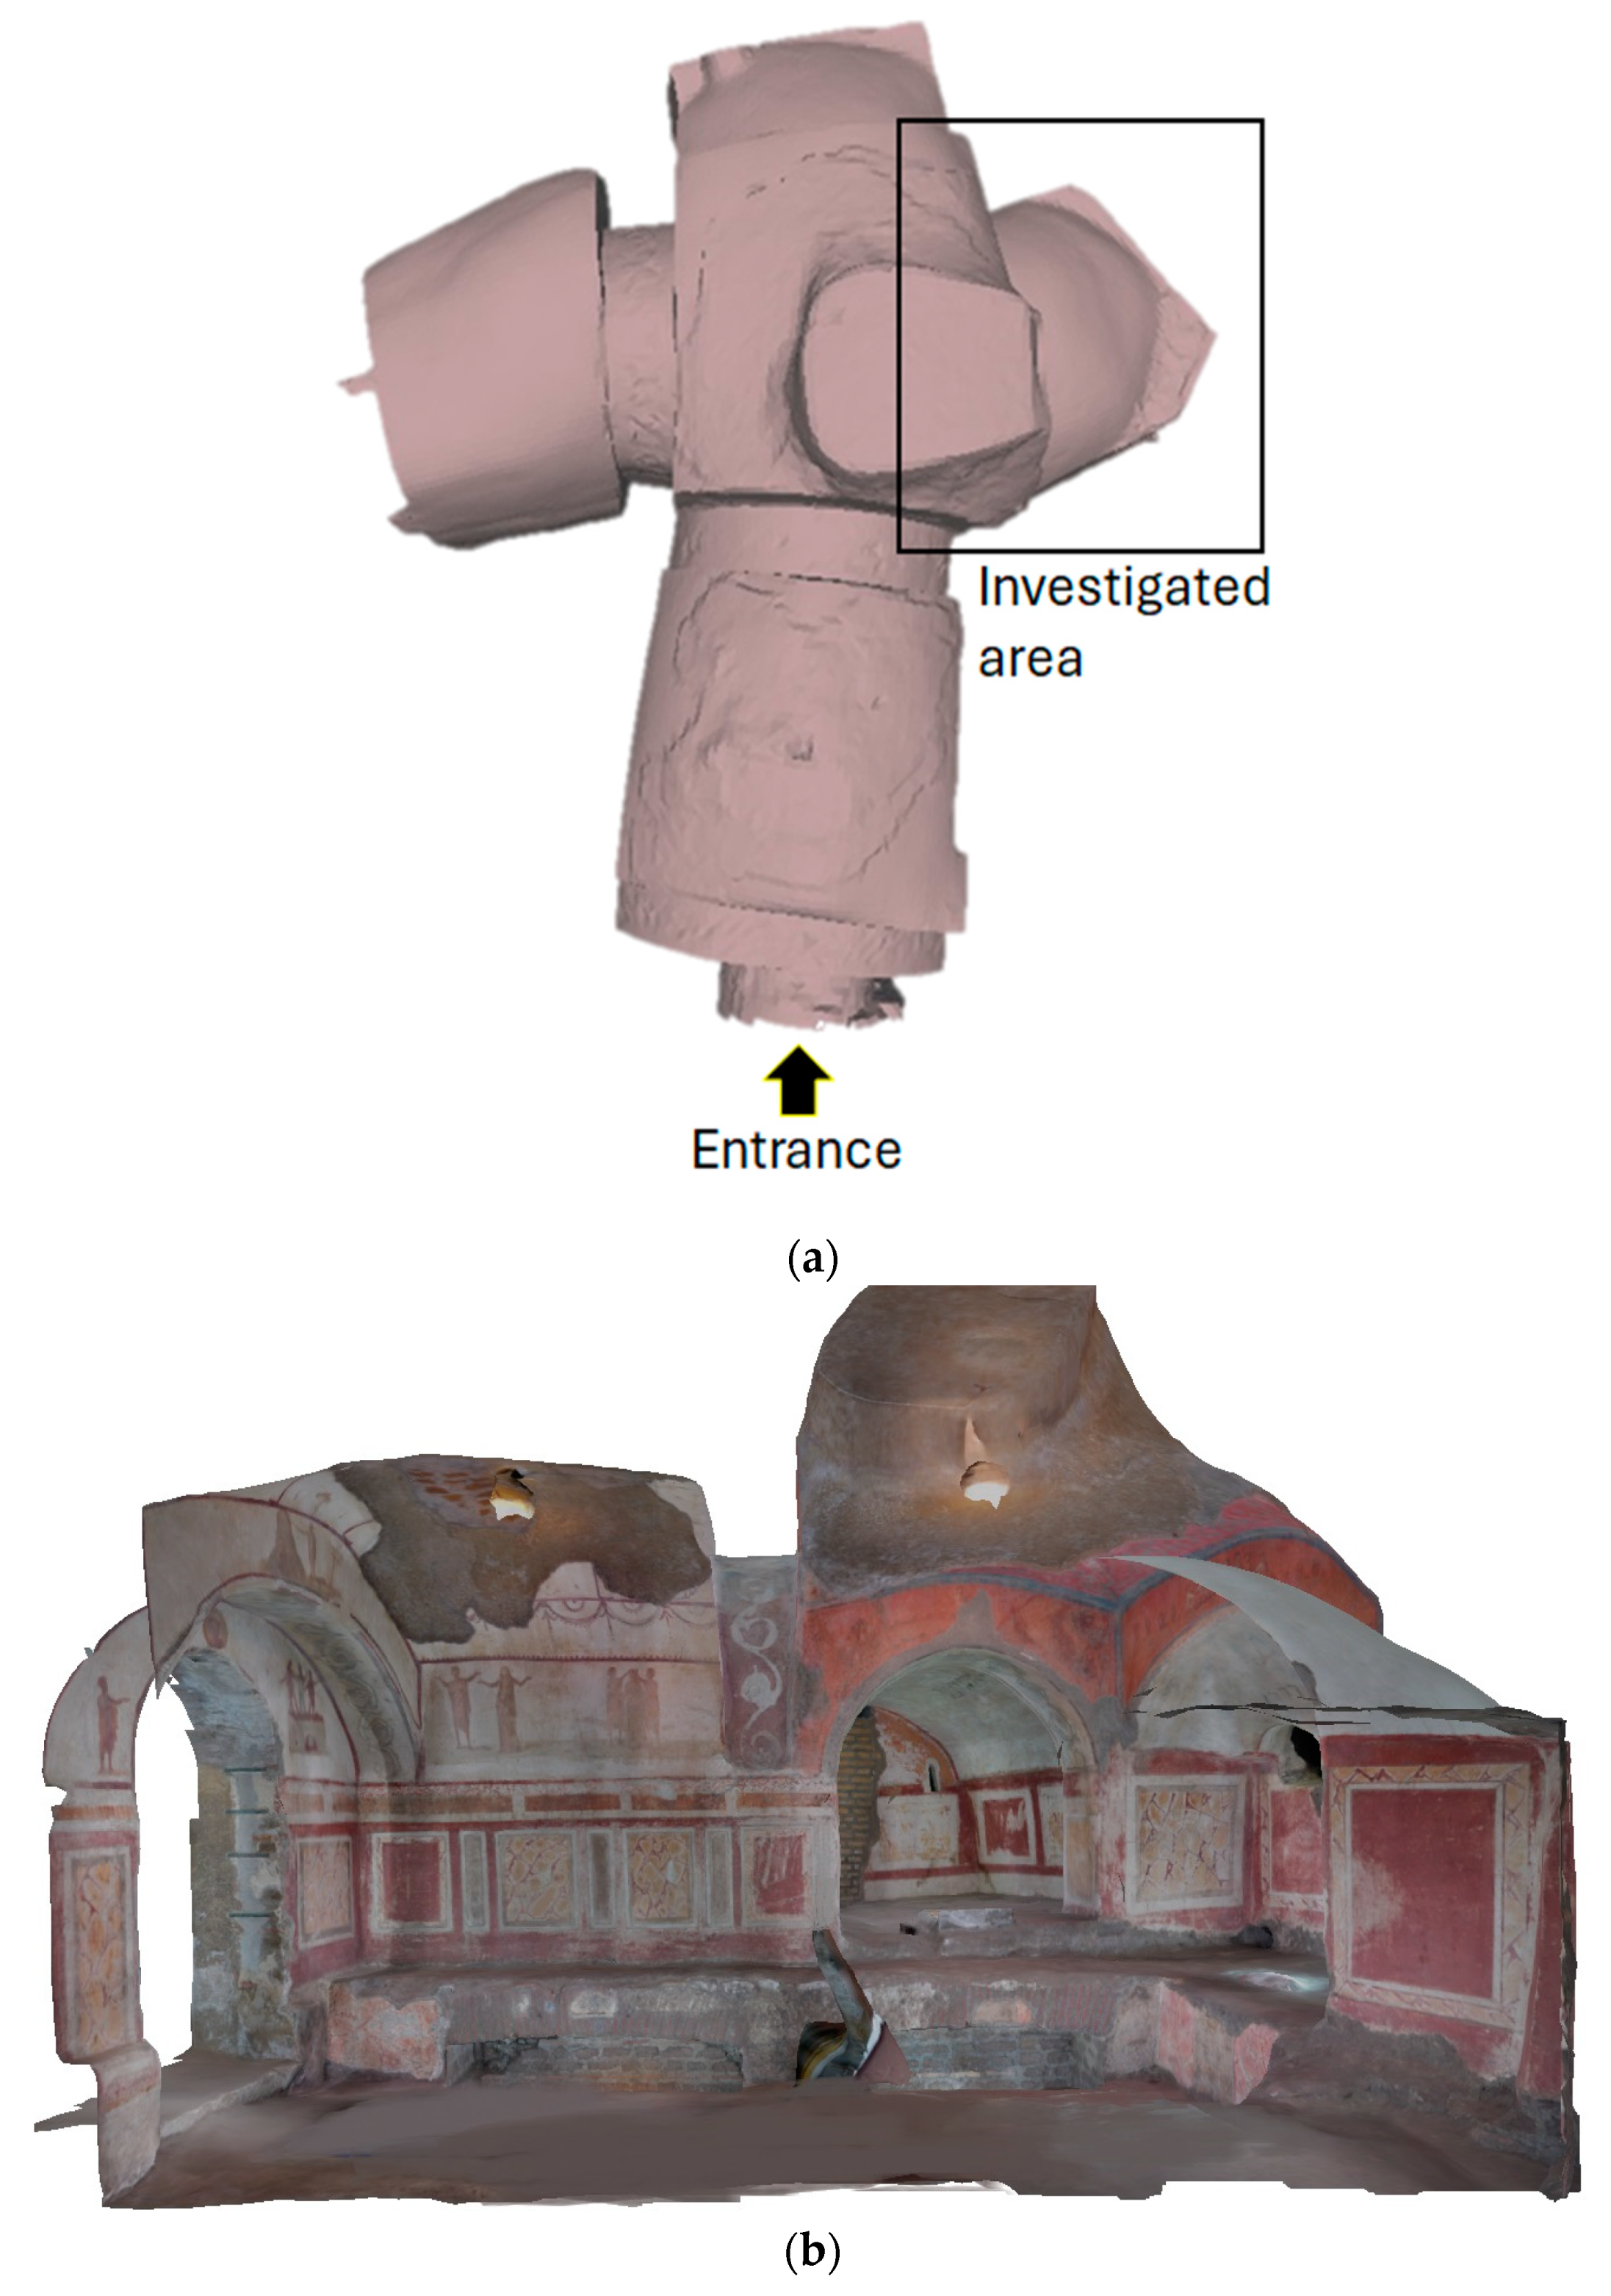
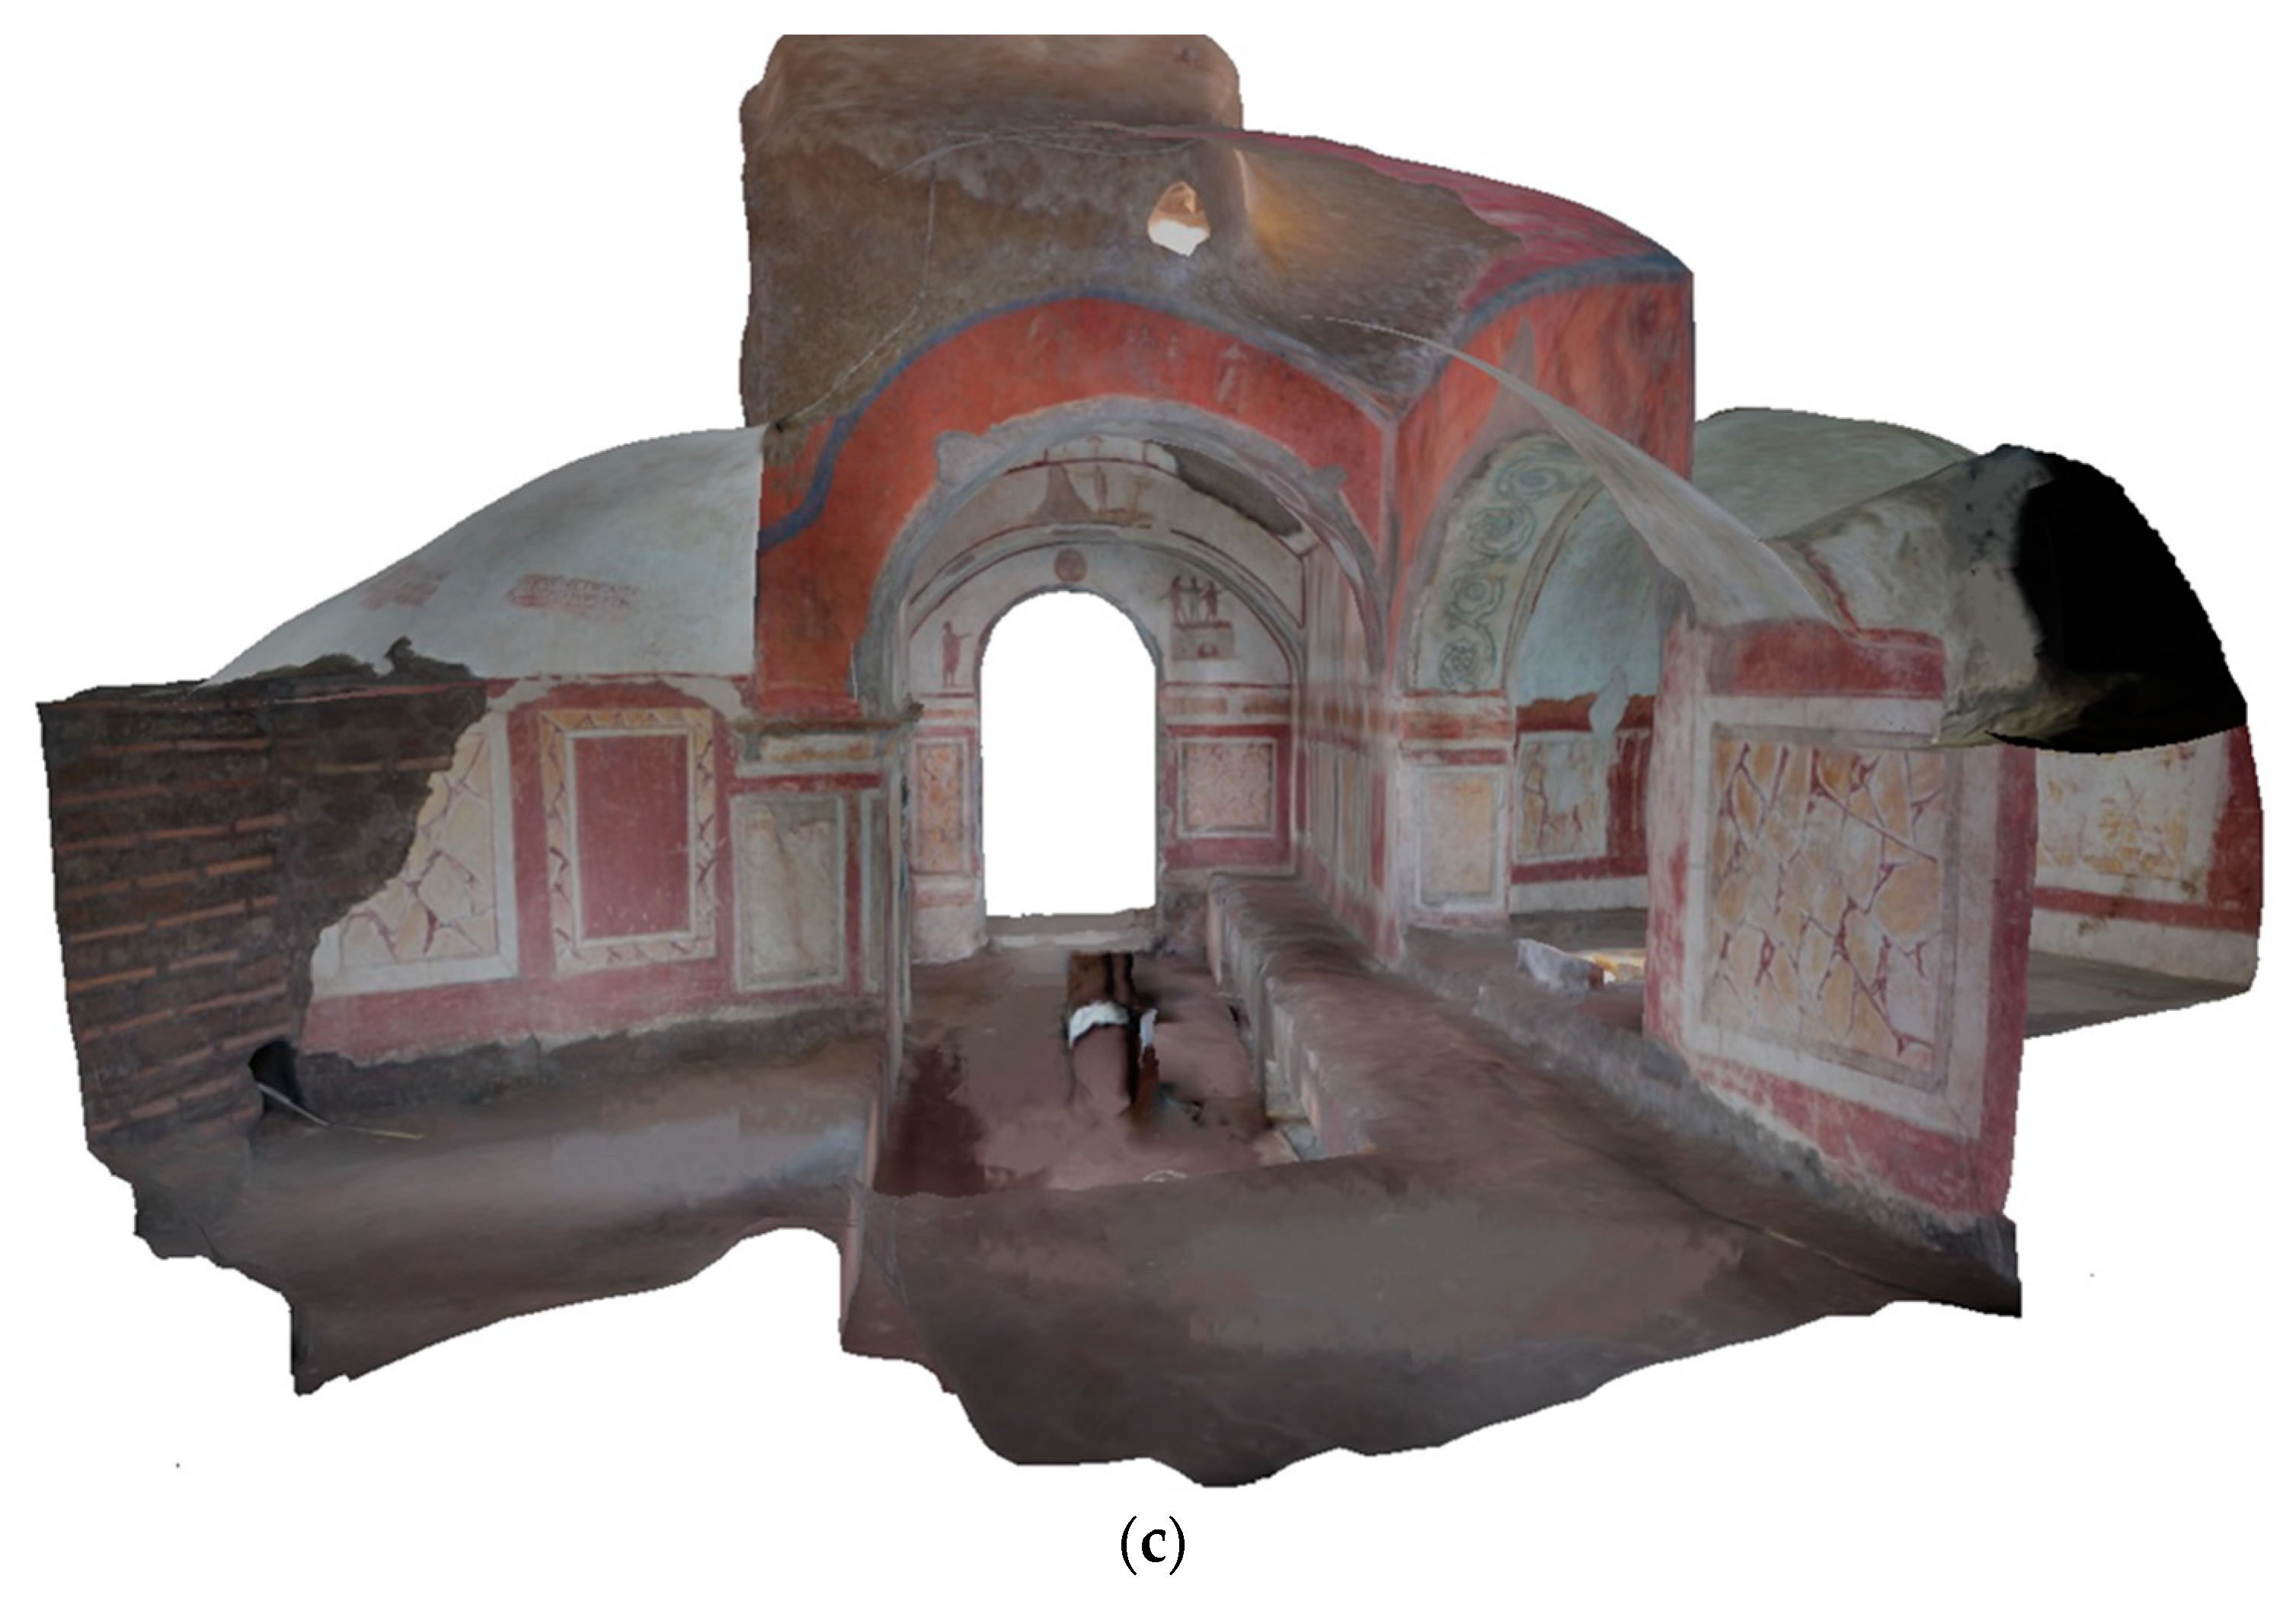
3.1. Three-Dimensional Digital Documentation

The RGB-ITR system is an active method of 3D acquisition based on laser sources for the target digitalisation. This apparatus was developed by ENEA (the Italian National Agency for New Technologies, Energy and Sustainable Economic Development) for inspections and digitisation of long-range targets, also in critical and not easily reachable environments, such as nuclear reactors [17]. Over the last twenty years, the instrument was also used in the CH field for the study and documentation of decorated surfaces, such as paintings, frescoes, and coffins [18,19,20]. In particular, the RGB-ITR scanner allows to obtain 3D colour models of the scanned surfaces, also of large dimensions and/or at great distance. The technology of the system is based on the amplitude modulation (AM) technique of the laser sources [21,22], combined with the Lock-In detection [23], which can acquire signals also in noisy environments, estimating at the same time the amplitude and the phase shift of the signals coming from the target. The system is composed of two units: an optical head, consisting of a system of lenses and mirrors for focusing, steering, and acquiring both the incident laser beam and the back-reflected light; the electronic unit includes the elements for the optoelectronic signal conversion, data acquisition, and storage. The two modules are physically separated but connected by fibres for the emission of the launching beam and the collection of the back-reflected signals from the target. The laser spot is swept onto the target through a motorised mirror with a TV raster-like movement of the beam. The great advantages of using such a system are mainly the capability of remotely analysing either small or large objects, also at great distances, without scaffolding and without any influences of surrounding illumination, allowing to perform the scans also during the night. Indeed, with the use of the active approach provided by the use of laser sources instead of passive ones that use CCD sensors, the RBG-ITR 3D models are not affected by the ambient light, avoiding the most common camera issues such as glare and/or shadow effects [24]. The acquisition and the post-processing procedures are controlled by custom tools developed in the MATLAB 2024 environment, namely ScanSystem and itrAnalyzer, respectively. The first software allows the configuration of the scanning parameters (area, resolutions, timing, and more) and runs the acquisition; the second one consists of image processing algorithms for the elaborations of the images from the reflectance data, improving the mapping quality and post-processing images, which can be exported in the most common file formats. Since the complexity of the Greek Chapel architecture consisted of several niches, the complete colour digitalisation was obtained in eight working days, moving the instrument to four stations within the room. The instrumentation was installed in the tower configuration with the optical head mounted on a tripod (Figure 2). The acquisition resolution was differentiated on the basis of the importance of the scanned element, as indicated by the conservators: higher scanning speed and lower resolution (0.004°) for the low and sparsely decorated parts of the chapel; lower speed and higher resolution (0.002°) for the most important decorations with greater iconographic relevance. Furthermore, the system worked also during the night hours in order to reduce the scans in the visiting time.

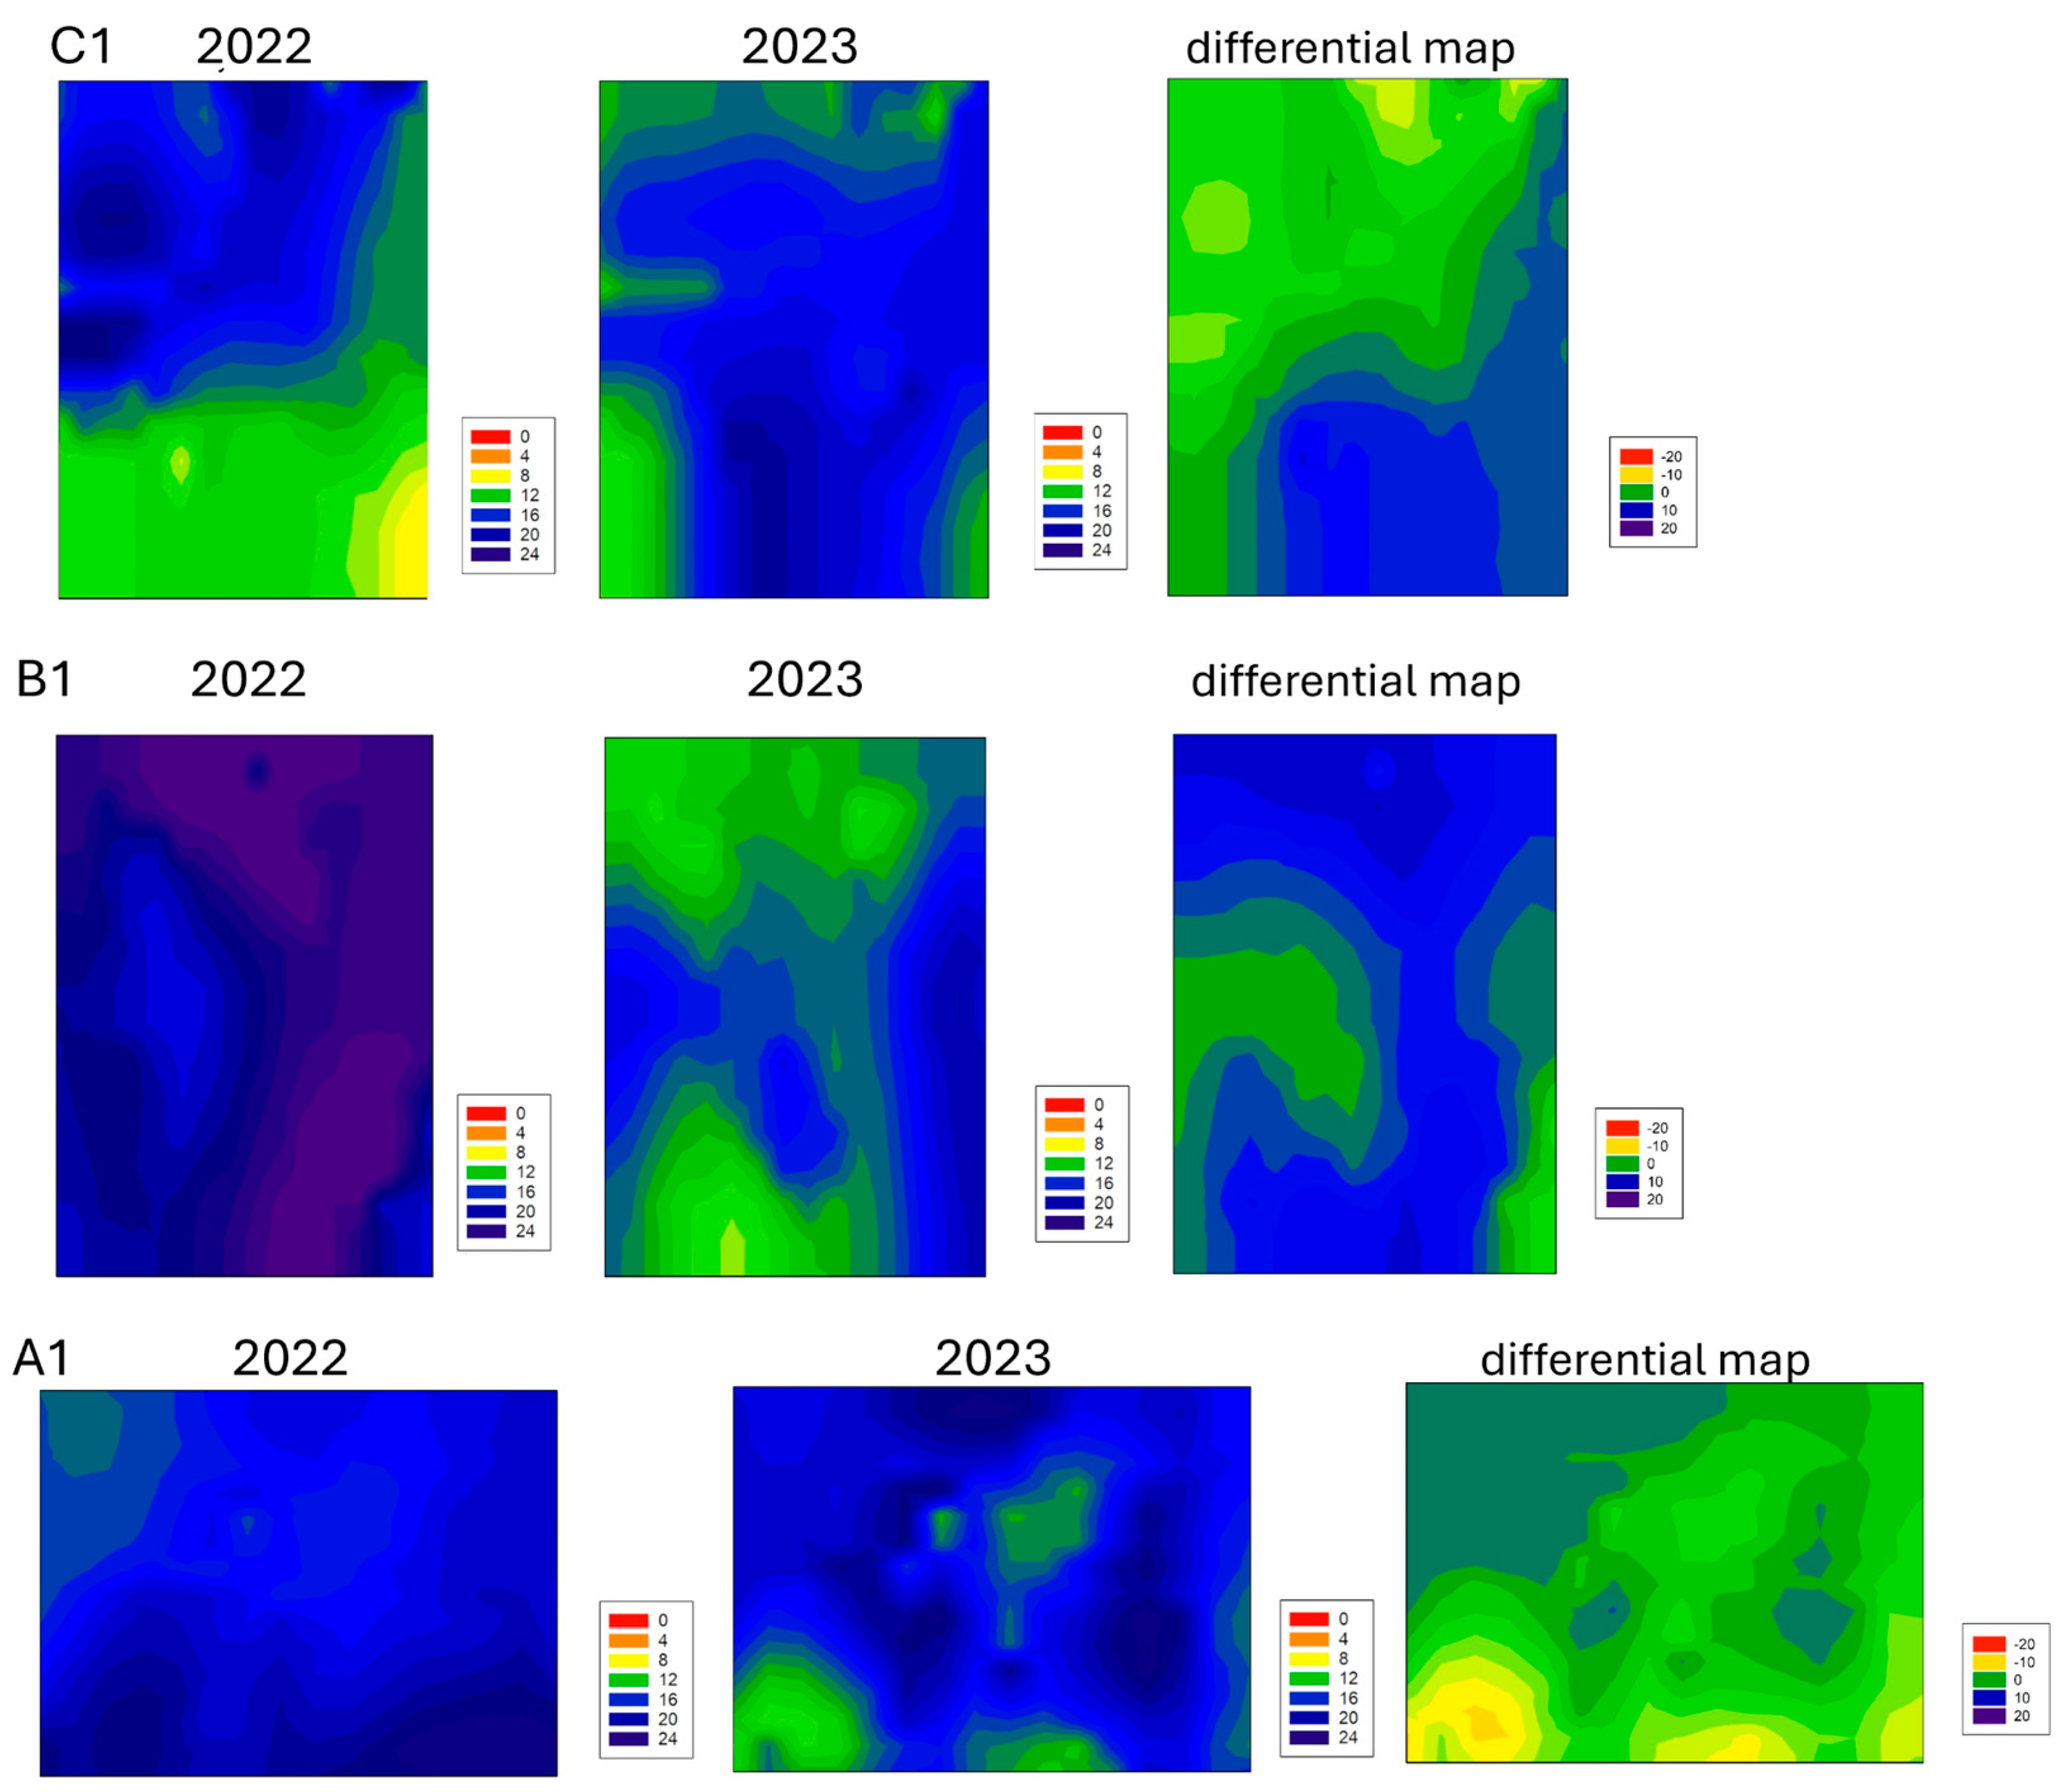
3.2. Portable Nuclear Magnetic Resonance (NMR)

In the study of masonry structure, the NMR technique is mainly adopted for water content evaluations. Indeed, in the NMR methodology, the intensity of the signal is directly proportional to the percentage of H atoms inside the masonry, making it easily linked to the presence of water [25]. In portable NMR sensors, the geometry of the magnet is defined as open geometry. In these sensors, the magnetic field is generated using two anti-parallel permanent magnets mounted on an iron yoke with the radio frequency (RF) coil positioned in the gap. By tuning the RF, the depth or the distance to the sensor surface where the sensitive volume is generated can be shifted. By optimising the magnet and the RF coil geometries, a flat, sensitive volume can be generated at a variable distance from the sensor surface. In this configuration, the magnetic field is external to the device and allows us to non-invasively study large objects by placing the sensor on one side of the object. In the Greek Chapel, NMR measurements were performed with a portable NMR instrument from Bruker Biospin (Figure 3), operating at 16 MHz and at a depth of 0.5 cm from the surface, fully disregarding the signal from the surface. The maximum echo signal corresponding to a π/2 pulse was obtained with a pulse width of 10.4 µs and a deadtime of 15 µs.
Collected data were processed to obtain a contour plot where x and y were the coordinates of the measured area of the masonry and z was the integral of the NMR signal. The contour plot obtained allowed an easy visualisation of the distribution of the moisture in masonries; the difference in the moisture levels is represented as a gradient of colour: dark red indicates the lowest moisture content, whereas dark blue indicates the highest moisture content. Although the maps differentiate masonry regions as a function of moisture content, a further step is necessary to calibrate the NMR signal and to assess the precise amount of moisture in each region. The calibration of the integral of the NMR echo signal was performed using four specimens made by restorers according to the ancient original recipe to reproduce the mortar used in the masonries. The detailed calibration procedure has been reported elsewhere [5]. Briefly, the integral of the NMR signal measured on area “i” of the selected matrix on the masonry has been calibrated by relating the NMR signal obtained on the dry and water-saturated samples to their gravimetric weight. This procedure allows for the calibration of the integral of the recorded signal NMR in order for each area of the map to correspond with an accurate amount of moisture.

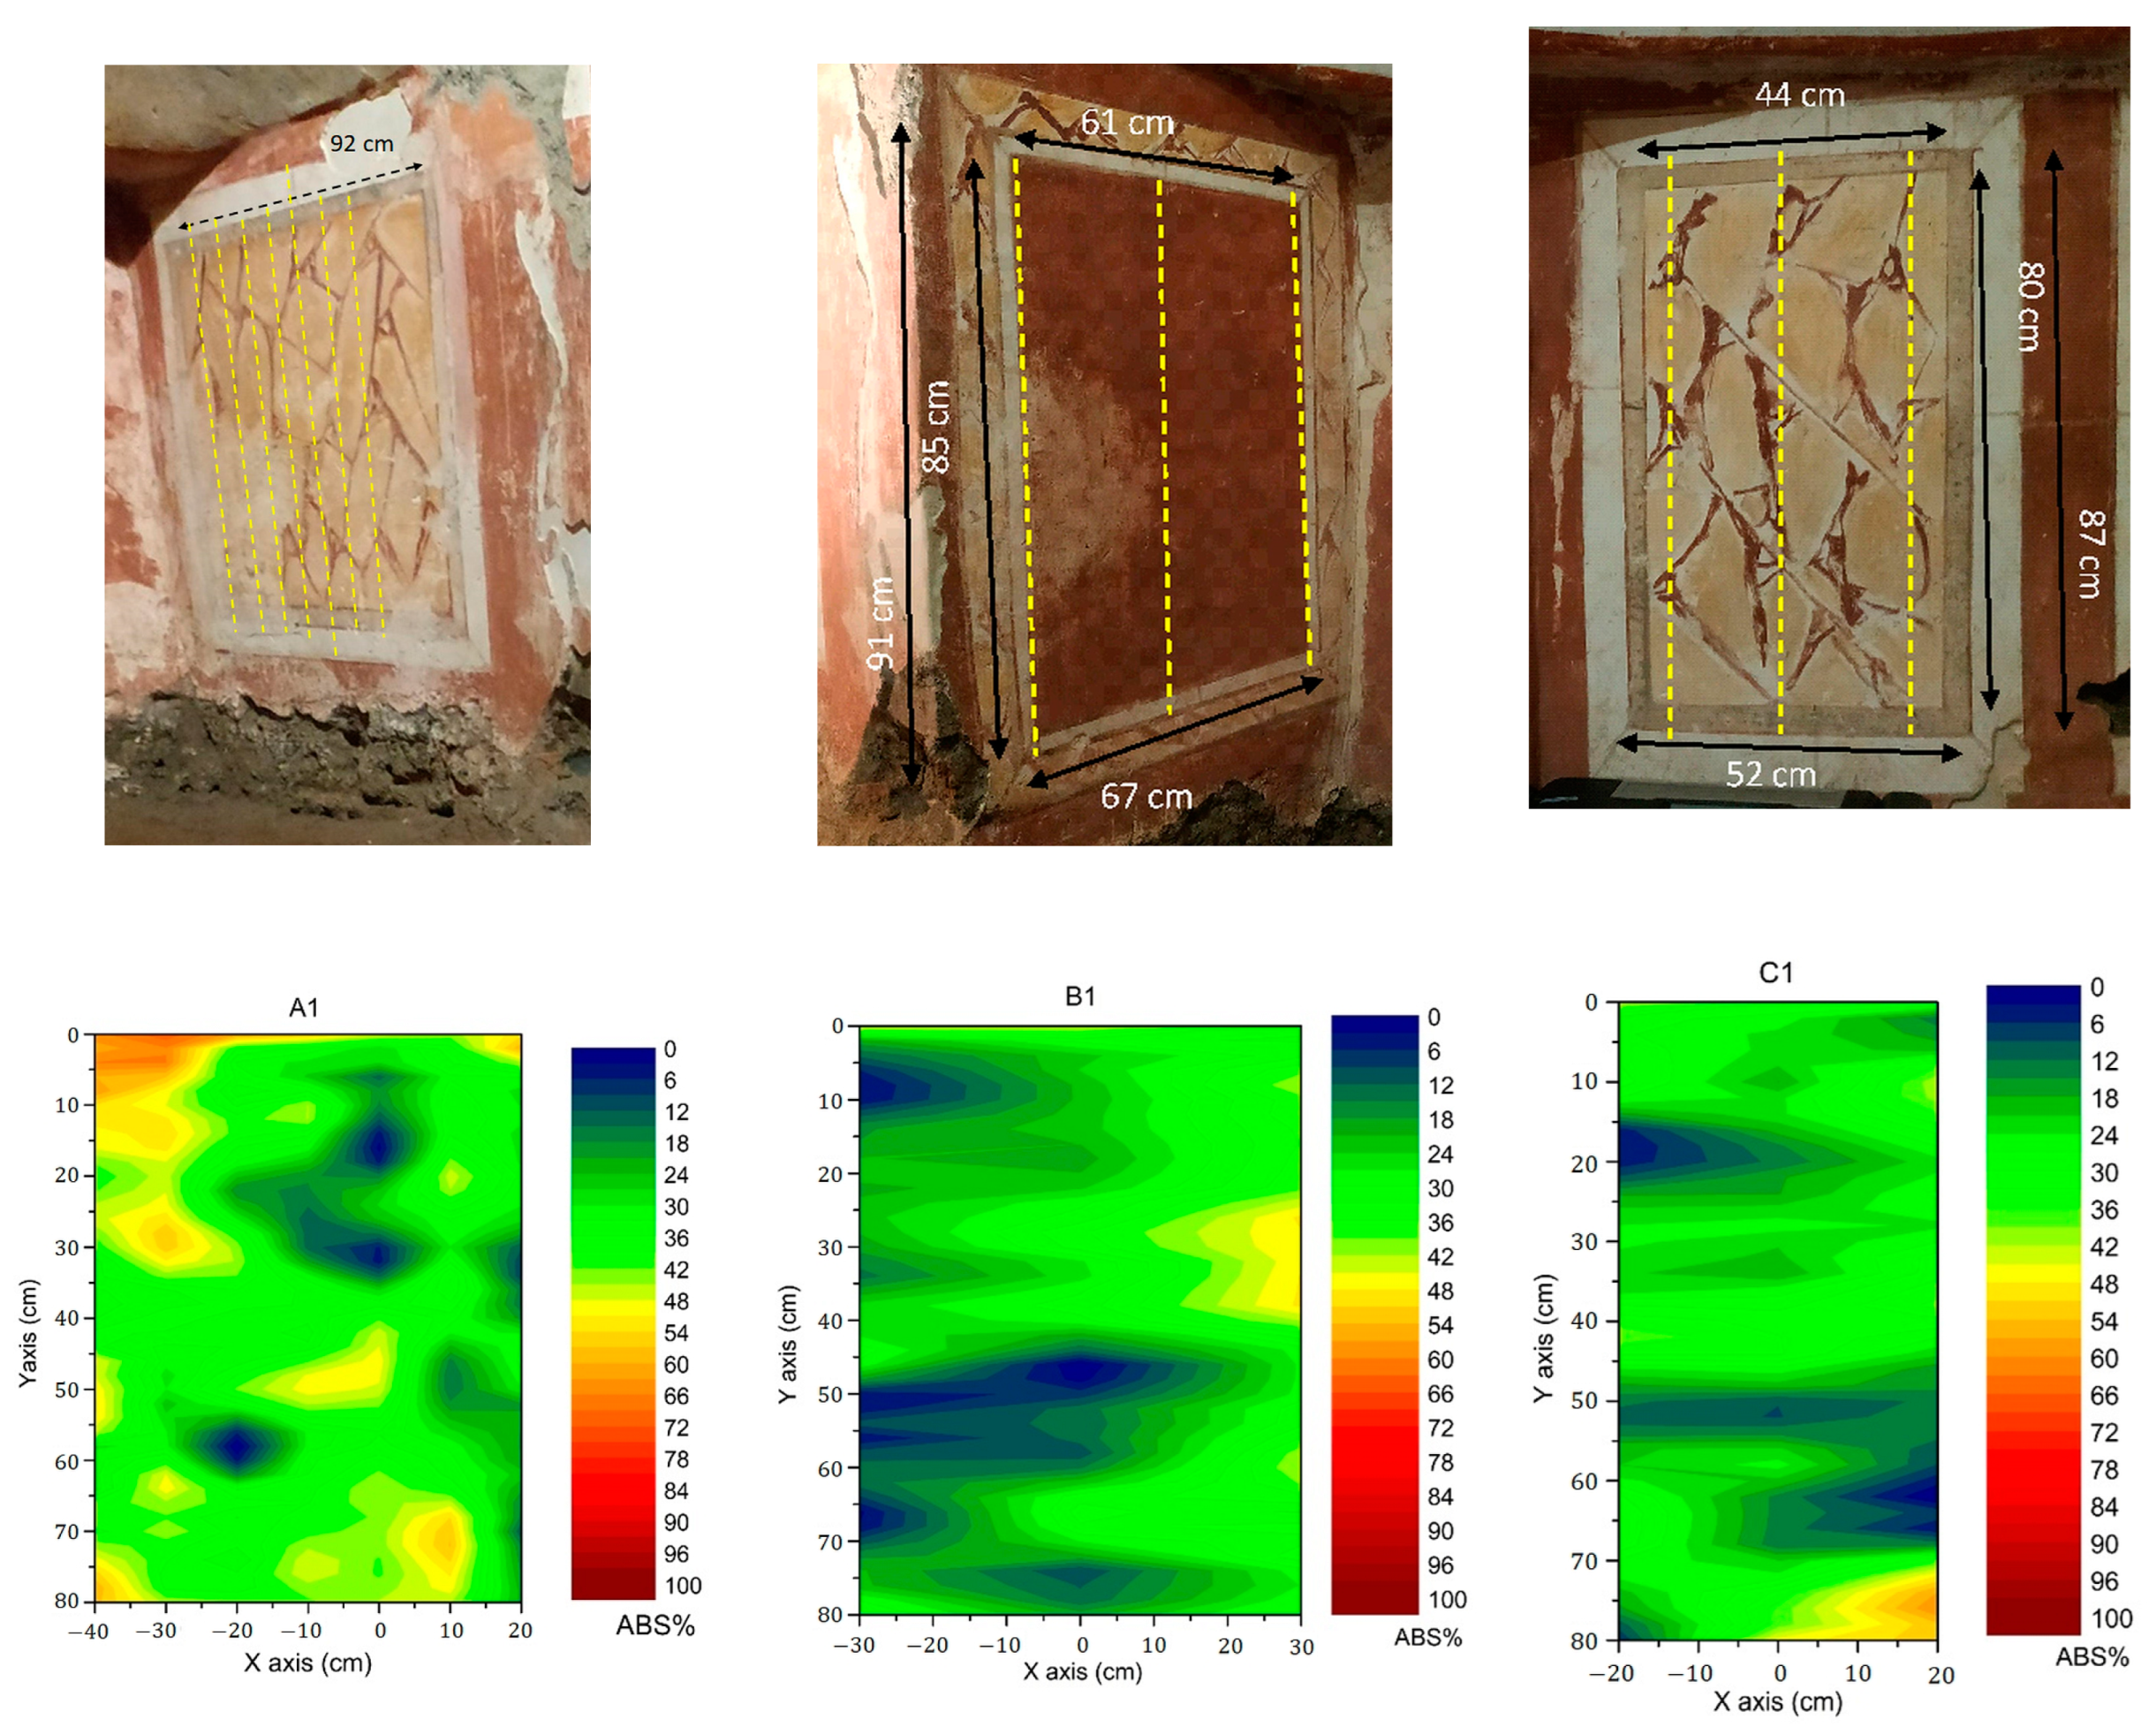
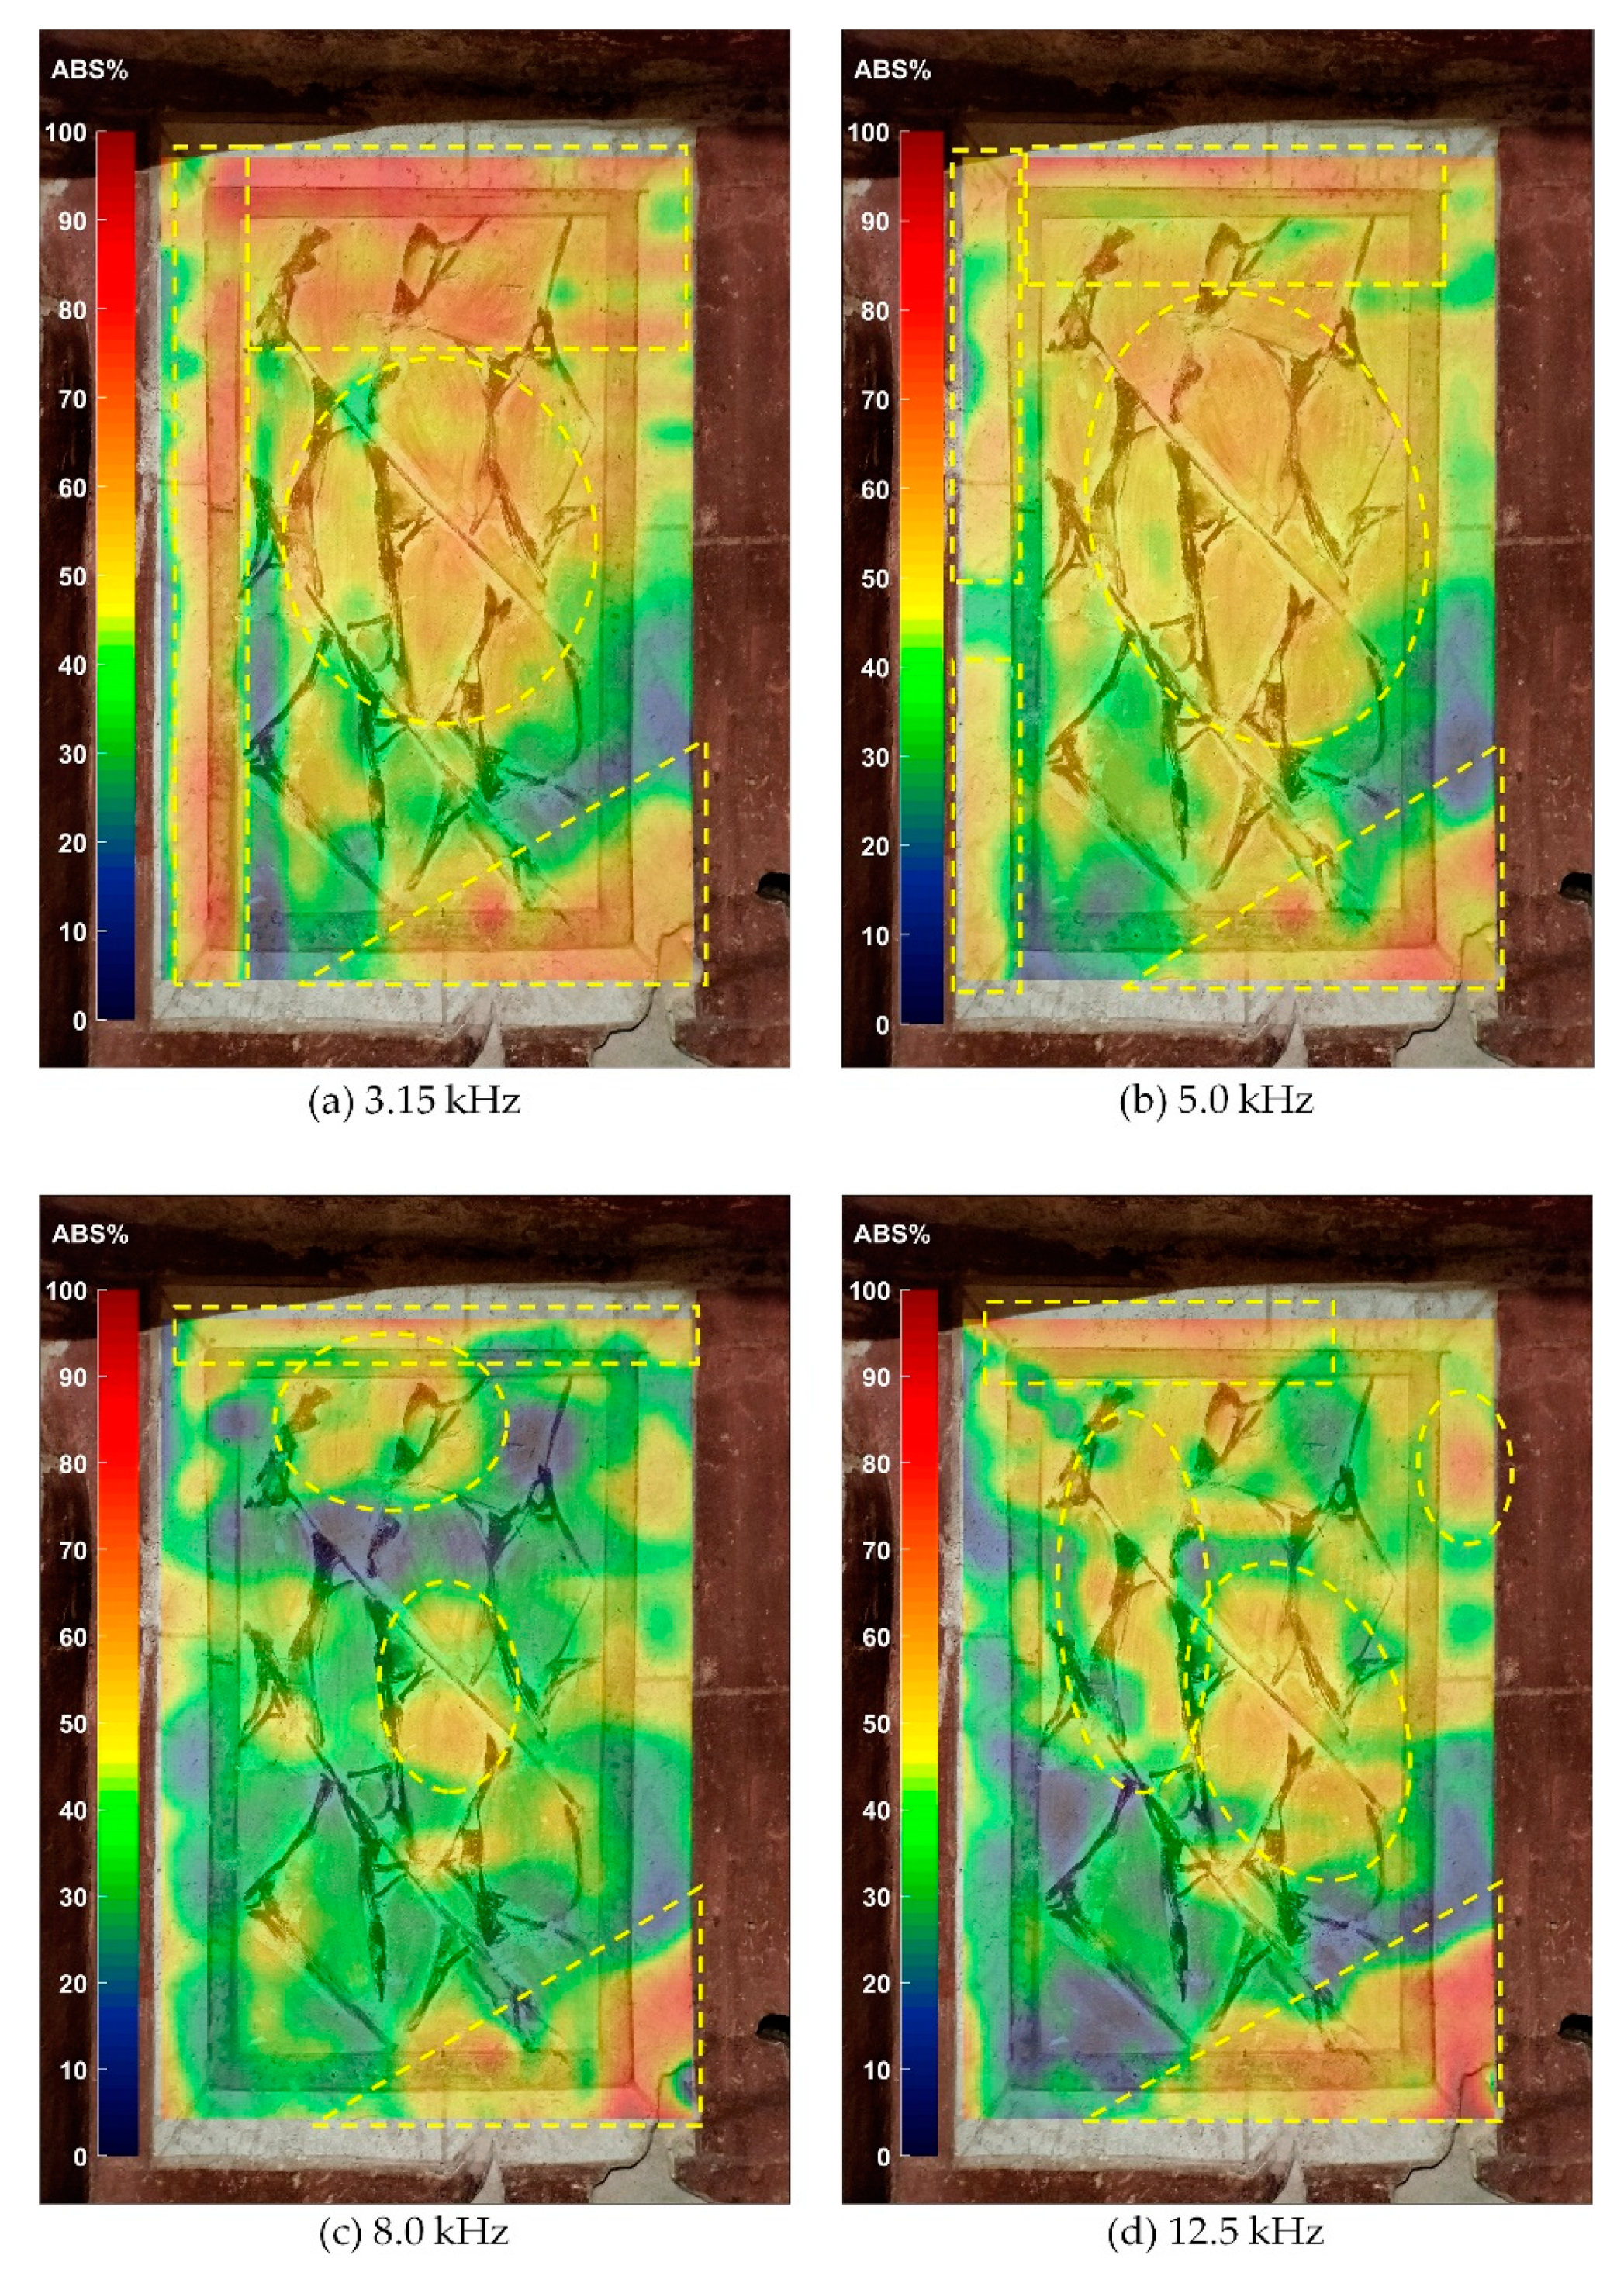
3.3. Audio Frequency–Acoustic Imaging (AF–AI)

More than two decades of research have demonstrated that structural damage in artworks can be effectively revealed by means of contactless acoustic diagnostic techniques. Indeed, the evaluation of the acoustic energy absorption coefficient is a valid indicator to detect detachments, flaws, and weaknesses in different typologies of paintings [7,26,27]. Different physical mechanisms concur to produce acoustic energy absorption, all related to the structural properties of materials and complex structures. In particular, the vibration of elements presenting a non-perfect adherence (like detachments and flaws), when exposed to an external acoustic excitation field, produces acoustic energy absorption. Furthermore, the porosity of the materials and their elastic properties affect their acoustic response. Thus, water-related damage in masonry can be monitored based on the knowledge of the acoustic response of wet and dry walls [4]. The Audio Frequency–Acoustic Imaging methodology (AF–AI) uses a wide-band acoustic audio frequency excitation source to stimulate an acoustic response from the artwork under study and extrapolates images displaying the absorption percentage of acoustic energy. The related device named the Acoustic Energy Absorption Diagnostic Device (ACEADD) automatically scans an area while an acoustic source radiates towards the surface an acoustic wave, and a receiver records the acoustic pressure wave. The receiver, a microphone placed amid the source and the surface under study, records both the incident wave and the reflected wave, from which the impulse response from the analysed area is obtained, after suitable signal processing. For each measuring point (i), the total amount of reflected energy Σi over the entire frequency interval Δf is calculated. Assuming the most reflecting point (R) as the reference, the results are expressed in terms of percentage of acoustic energy absorption ABS%i, calculated as deviation from the value obtained on the reference point. The ABS% matrices are displayed as false colour images, using a colour scale corresponding to the interval of ABS% values 0–100%. A first broadband image, the integrated acoustic image (IAI), sums up the information about many elements concurring to the overall state of conservation of the painting. A suitable frequency analysis extracts the data dividing the wide frequency interval Δf into n narrow frequency intervals Δfn, 1/3 octave bands, expressing the indicators ABS%n with respect to each frequency band. In this case, the results are displayed as a set of n frequency-resolved acoustic images (FRAI), according to the same IAI graphical procedure.
In the Greek Chapel, a highly directive acoustic source (20 cm × 20 cm) Audio Spotlight by Holosonics was employed, delivering a narrow sound beam towards the examined surface. The omnidirectional i436 Class 2 measurement microphone by MicWaudio, with −44 dB (6.3 mV/Pa) sensitivity, measured the amount of reflected acoustic energy using a back reflection geometry. A PC remotely controlled the motion control unit (The motion control unit is assembled by Tecni.com S.r.l. (Frascati, Italy) using UNILINE linear guides by Rollon S.r.l. (Vimercate, Italy)) and the National Instruments USB6221 (USB6221 acquisition board by National Instruments (Austin, TX, USA)) acquisition board through custom software. Figure 4 shows the ACEADD system during the on-site measurement in the Greek Chapel. During a first campaign, three rectangular regions were analysed, collecting vertical profiles 80 cm high along the central axis and a few lateral axes (from 10 cm to 30 cm distant). This procedure indicated a general representation of a significant portion of the chapel. During a second campaign, a more detailed image of one of those regions was obtained, providing an accurate indication of the state of conservation of that portion. In the present investigation, the IAI images were considered for all the investigated areas, and a more detailed insight by means of FRAI images was conducted for one area. The measurements were carried out at a constant temperature of around 16 °C and 100% relative humidity.

3.4. Laser-Induced Fluorescence (LIF)

Fluorescence is a versatile technique that is currently used in the diagnostics of CH [28,29]. It is currently used not only for the identification of selected classes of pigments used in historical painting or organic materials, such as resins, waxes, or paints, used in the production or conservation of CH, which show fluorescence when exposed to UV radiation, but also for a preliminary assessment of the surface state of conservation. In relation to this second point, changes in fluorescence can be associated with damages or chemical alterations of materials over time. In the specific underground site covered by this study, fluorescence was applied for the diagnosis of mould and algae and was integrated with other imaging and analytical techniques to provide a complete assessment of the state of conservation of the wall artefacts. Especially in underground areas, the use of portable and easily manoeuvrable instruments is of great benefit [30]. In the catacombs of Priscilla, a fluorescence LiDAR (Light Detection and Ranging) system called LIFART was used and shown in Figure 5. The system, developed at ENEA laboratories in Frascati, is designed to carry out a series of diagnostic measurements with the aim of obtaining information on the nature of the surface constituting materials, on the effect of previous conservation interventions, including biocides for reduction and prevention of attacks by microorganisms, and finally for the mapping of the areas subject to damages caused by the presence of humidity [31]. The system is able, in fact, to characterise the surface of the target by identifying the substances present on the investigated areas; the penetration depth strictly depends on the nature of the analysed surface and on the wavelength of the used laser (decreasing with decreasing wavelength), but generally is not over tens of microns. In frescoes, this feature allows the study of the layer constituted by plaster, selected classes of pigment, and their alterations, such as those that can be observed in the presence of humidity, which eventually favour a biological attack.

LIFART

The LIFART system (Figure 5) uses a laser source to generate a coherent and collimated light beam; the 266 nm Nd:YAG laser emits pulses lasting 8 ns with a repetition frequency of 20 Hz (ULTRA 30 Quantel). The beam sent onto the surface under study interacts with the surface layers and causes various phenomena. In particular, materials susceptible to fluorescence absorb part of the laser energy and subsequently emit light at a higher wavelength (lower energy). An optical receiver collects the fluorescence light by means of an objective (70 mm f#4) and disperses it by a fixed grating spectrometer (Horiba CP−140) with an entrance slit of 0.1 mm. The optical signal is finally sent to a sensor (model ANDOR ICCD DH734-18) sensitive between 250 and 800 nm with a total spectral resolution of approximately 5 nm. The optical sensor is equipped with an intensifier controlled by a time gate whose function is to measure the fluorescence emitted exclusively during the time interval of the time gate, while light outside this interval is ignored. The gate has a minimum duration of 2 ns and a delay between 0 and 10 μs. For the current experimental measurements, two different gate intervals were used: an integration interval of 100 ns associated with both 0 and 30 ns delay from the pulse laser emission. The ability to temporarily resolve the fluorescence signal allows for better material differentiation, since not only the spectral behaviour of the fluorescence but also its persistence over time are molecular fingerprints. The system is able to perform a scan of the studied surface line by line with a vertical spatial resolution that can be chosen by the operator. In this way, the resulting data contain punctual spectra of the whole surface that can be easily converted into fluorescence images and materials’ maps.
LIFART carried out side-by-side scans of the right lateral portion with approximate dimensions of 8 m wide and 1.5 m high; the number of horizontal lines is 600 and corresponds to the number of scanning points along the vertical direction. The 1024 points in each line have been decimated to 300 to limit the image size and bring the pixel aspect ratio close to unity. A fluorescence spectrum was stored for each scan point.

3.5. Infrared Thermography (IRT)

Infrared Thermography (IRT) is a non-contact and non-destructive technique useful to investigate large surfaces by analysing the temperature distribution, allowing long-term monitoring of the integrity of a wide range of materials [32,33]. IRT is often used to qualitatively map the distribution of humidity in masonry since changes in moisture content can be detected due to variations in surface temperature. It is known that damp areas can have a lower temperature because of the endothermic nature of the water evaporation, but other physical phenomena can also occur, such as lowered thermal resistance and greater heat storage capacity of the damp material. Thus, the combination with other techniques can reduce the uncertainty of assessing the in situ moisture content of surfaces. Furthermore, several parameters, such as environmental conditions and the materials’ properties, can affect the accuracy of the measurements. Moreover, weather conditions varying with the time of day and season, surface emissivity coefficient varying with colour and type of material, the presence of heat sources near the measurement area, and the distance and angle of the infrared camera with respect to the surface target [4] should be considered. Depending on external illumination sources, IRT includes two acquisition modes: passive [34] and active [35,36,37]. The first utilises solar energy by evaluating natural thermal changes in the materials over short to long cycles, less effective in an underground environment due to the lack of temperature gradients between the investigated structures and the environment; the second uses artificial external stimuli inducing heating within the sample for shorter acquisitions. In this work, active thermography was employed, which is able to detect defects (voids or discontinuities) beneath the surface, exploiting the different thermal effusivity with respect to the surrounding areas after an induced heat wave, changing the cooling process at that point. Among the different configurations of active IRT [9,38,39], in this study the Lock-In Thermography (LIT) method was used (Figure 6), which is based on the application to the surface of a periodic energy wave input, provided by a halogen lamp, and the recording of the thermal response from the material by a thermal camera [40,41]. The advantages of LIT are to reach a high Signal-to-Noise Ratio (SNR) and the possibility of in-depth investigations. The drawbacks of this method are the relatively longer measurement times and the smaller amount of information extracted. In order to obtain more information from a single acquisition, a square wave excitation was used in this study [42,43] leading to the extraction of information (amplitude and phase delay) from the fundamental frequency and from the first and second harmonics. The amplitude in LIT represents the intensity of the thermal response, resulting in a contrast between defective and non-defective areas. Amplitude images can be employed to highlight variations in material properties, including differences in thermal conductivity or diffusivity. The amplitude is particularly responsive to surface and near-surface defects. Furthermore, the term ‘phase’ is used to describe the time delay between the thermal excitation and the resulting thermal response, which is detected by the IR camera. The phase shift provides qualitative information about the depth of the defect; particularly deep defects determine a large phase shift. The phase shift is relatively unaffected by surface emissivity variations, making it a reliable indicator of subsurface anomalies. In a phase image, areas with different thermal response times are highlighted. In fact, the localised change in thermal conductivity influences the periodic cooling and heating of the material. It is therefore possible to characterise the masonry and the presence of humidity or any subsurface defects (cavities, restoration interventions, etc.), acting as barriers to the propagation of thermal waves. The camera used for the thermographic measurements was a FLIR X6800 sc with the following features: camera spectral working range is in the mid-wave infrared (1–5 μm); thermal sensitivity is ≤20 mK; temperature measurement range between −20 °C and 350 °C and cooled with an indium antimonide detector (FLIR InSb). The resolution of thermal images (thermograms) is full frame 640 × 512 pixels at 520 Hz, and the image-processing software is the FLIR Research Studio v.3 software. MultiDES Mini KIT (Diagnostic Engineering Solutions s.r.l. Bari, Italy) is the system that drives the two halogen lamps with a power of 1 kW each used for Lock-In Thermography, and IRTA 2 2.4 (2023) is the software used.

4. Results

4.1. Three-Dimensional Digitalisation

The elaborations of the RGB-ITR reflectance data with the custom software itrAnalyzer allowed to obtain the accurate 3D model of the entire Greek chapel. The complex geometry of the room was completely digitalised, as can be seen in the mesh reported in Figure 7a. As mentioned in Part 3.1, neither shadow nor illumination aberration affects the laser scanner data, achieving the colour-calibrated texture of the entire scanned surfaces. Thus, despite the scarce and yellowish illumination of the room at the moment of the scanning procedures, the RGB-ITR 3D model is characterised by accurate colours, enabling the high-quality digitalisation of the geometry of the room and its precious paintings (Figure 7b,c). This important result provides a useful tool for future restoration actions and for documentation purposes, being the recording of the actual conservative status. Furthermore, the high resolution of the model permits contactless analysis of every detail of the painted surfaces, providing a sustainable monitoring method since it does not require expensive software nor continuous acquisitions.
The 3D model was also used for better contextualising within the room structure the focused NMR, AF–AI, LIF, and IRT measurements. The areas investigated with the different techniques are reported in Figure 8: such areas were chosen following the suggestion of the restorers and curators of the catacombs, who indicated the areas as particularly delicate and frequently restored, evidently corresponding to a critical zone of the catacombs (A1, B1, C1).

4.2. Portable Magnetic Resonance

To assess the state of conservation of room structure inside the Greek Chapel from moisture damage, a study was done with the portable Magnetic Resonance (RM) to map the distribution of moisture in the first millimetres of the masonry. The measurements were carried out on three areas of the room: Area C1, Area B1, and Area A1, as evidenced in Figure 8. For each area, a matrix of points was chosen: 12 points in area C1, 11 points in area B1, and 14 points in area A1. Each point covers an area of 2 × 5 cm2, which is the area that the probe head detects. The measurements were performed in two different seasons, such as autumn and spring. In Figure 9, the moisture distribution maps obtained on the three areas by unilateral NMR at a depth of 5 mm from the surface are shown. As explained in Par. 3.2, collected data on the three areas are processed to obtain contour plots. A contour plot is a 2D representation of a 3D surface, and it allows an easy visualisation of the distribution of the moisture in masonries. In these maps, the difference in the moisture level is shown as a gradient colour: red indicates the lowest water content, while dark blue indicates the highest water content. In Figure 9 (C1), the moisture distribution maps obtained on area C1 in July 2022 and in March 2023 are shown. In July 2022, moisture content is confined in the upper part of the wall painting with a percentage of about 20–22%, while the lower part of the map shows lower humidity levels, about 8–10%. In March 2023, the highest levels of humidity, about 20–23%, were localised in a wide central area of the wall painting. Figure 9 (B1) presents the moisture distribution maps obtained on area B1 in July 2022 and in March 2023. In this area the levels of humidity in 2022 are quite high (16–24%), while in March 2023 a decrease in the water content is observed in some areas, in particular at the top and bottom of the area, with levels of humidity between 10–12%.
These differential maps are the documentation of different situations in two months with slight changes of water content in the masonry. For example, in the differential map obtained for area C1, two areas can be identified, one yellow-green and one blue, evidencing two areas where evaporation or wetting processes can take place.

4.3. Acoustic Images
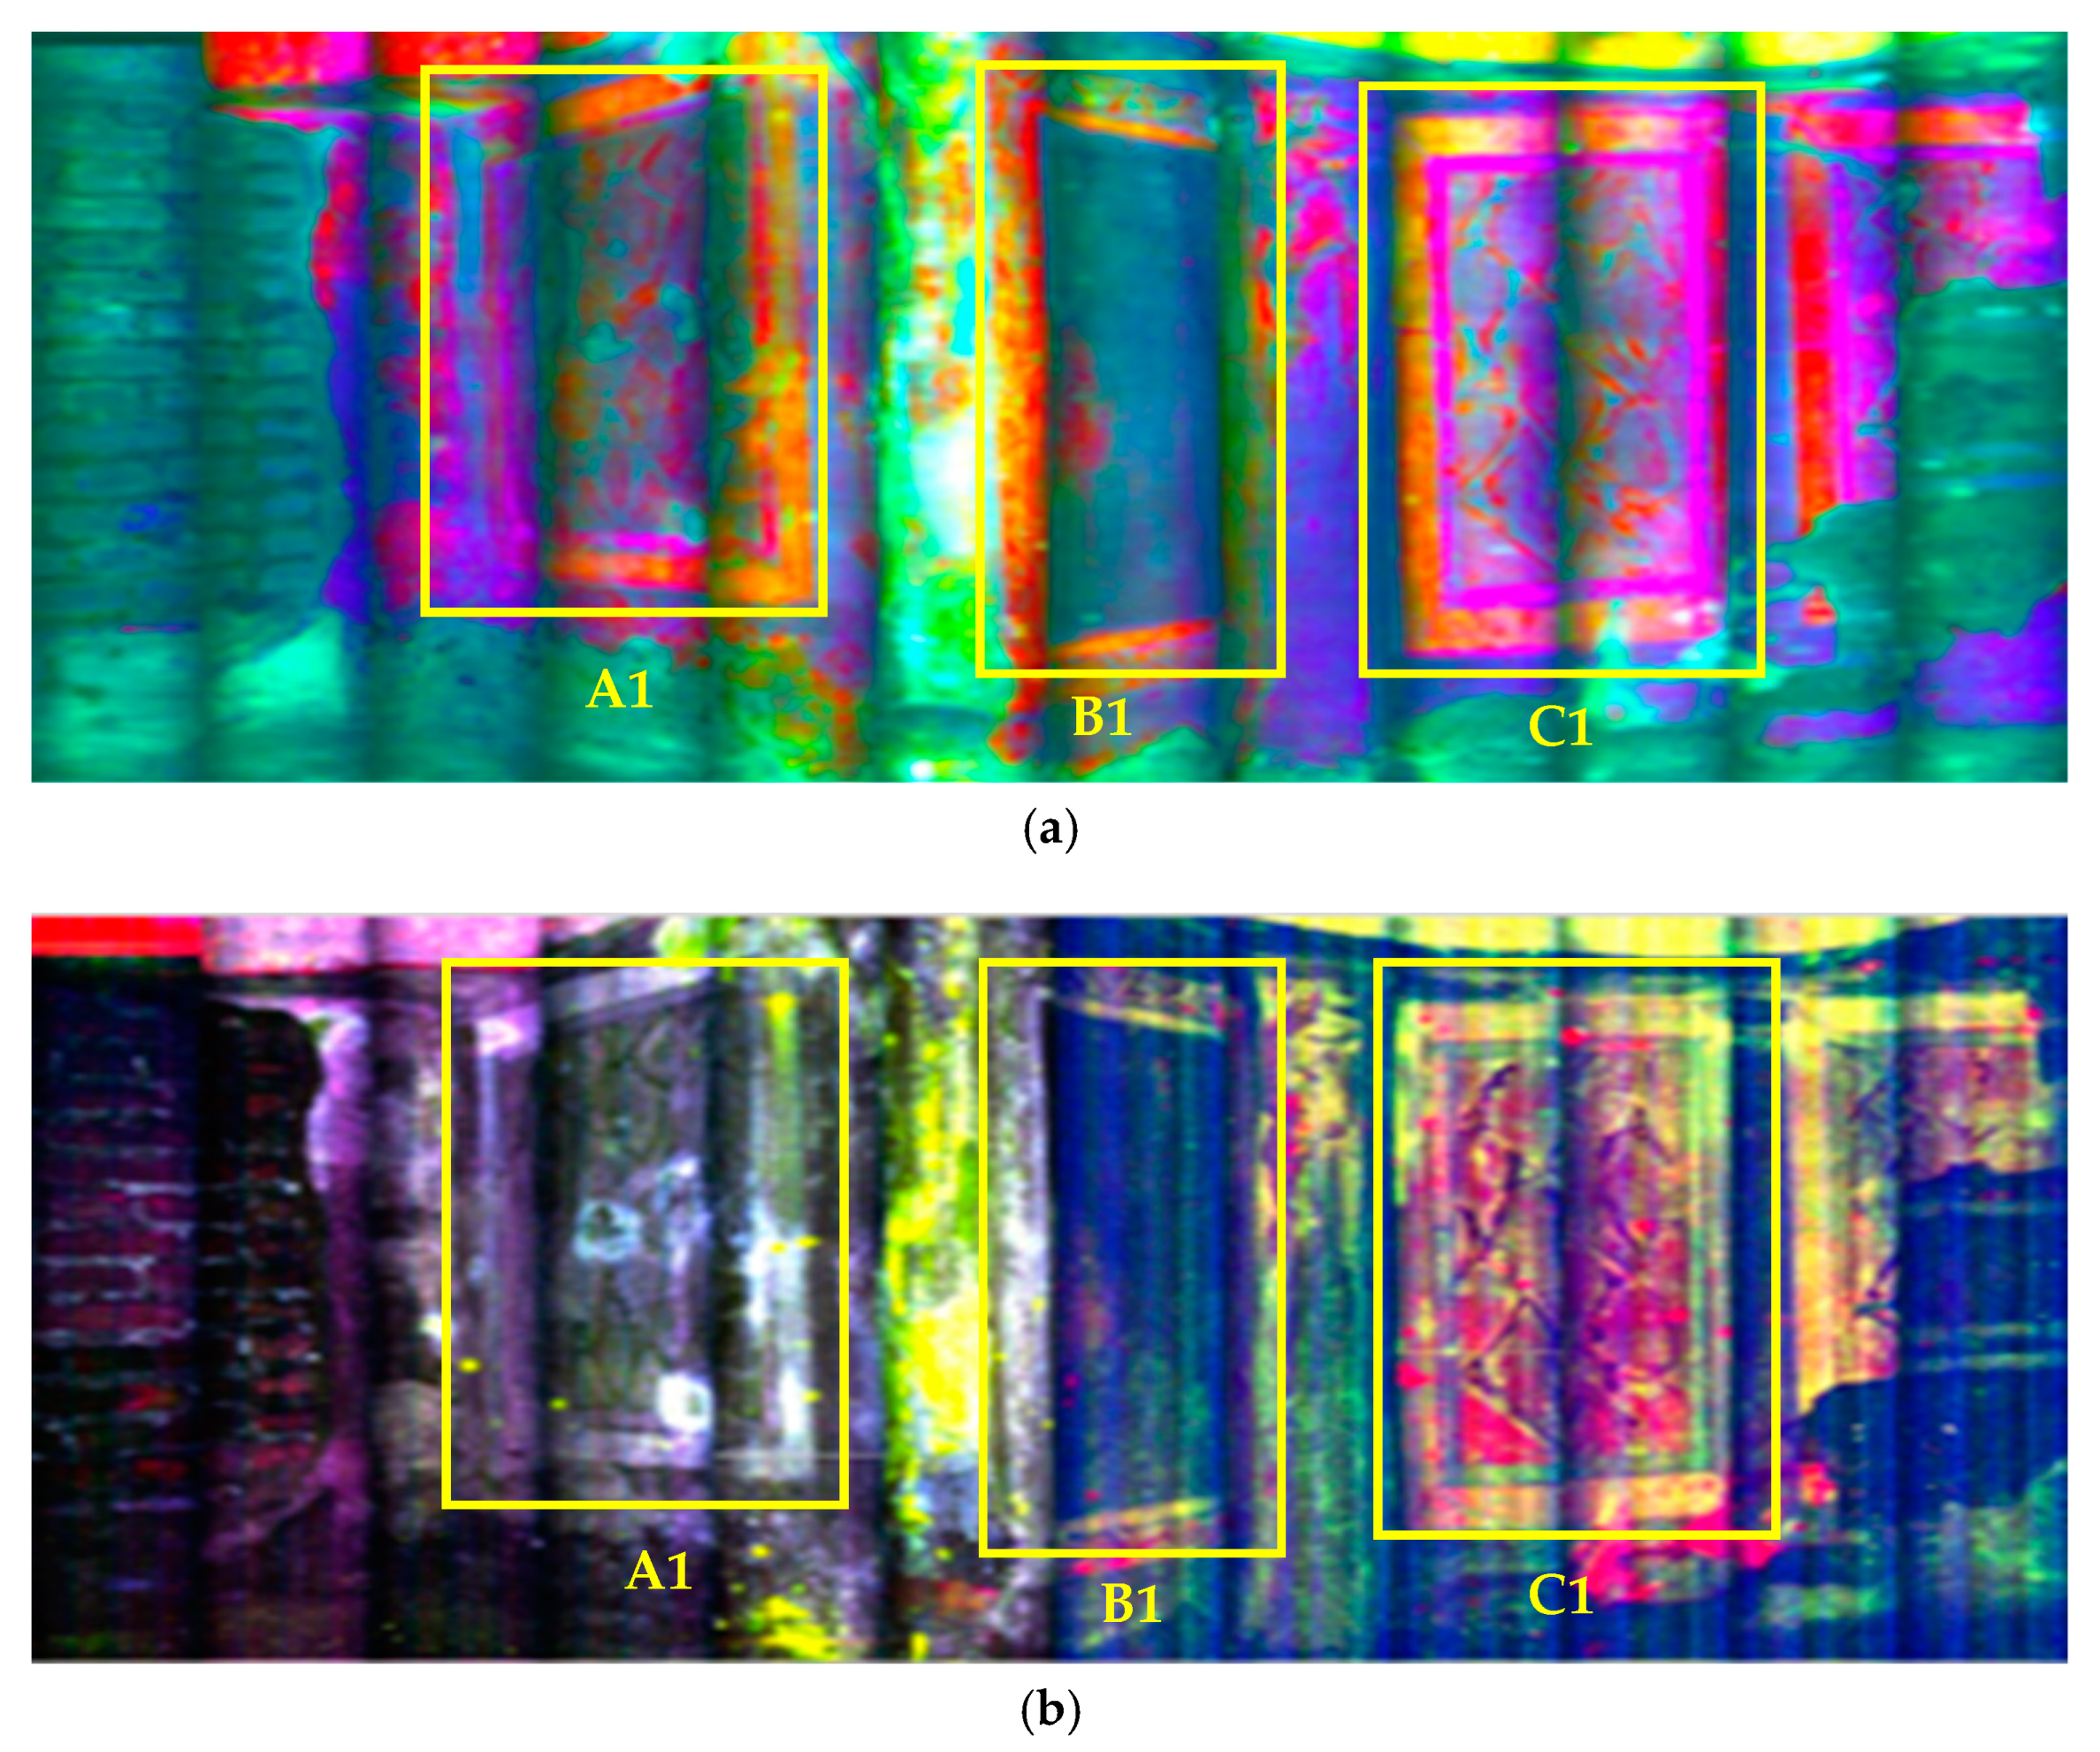
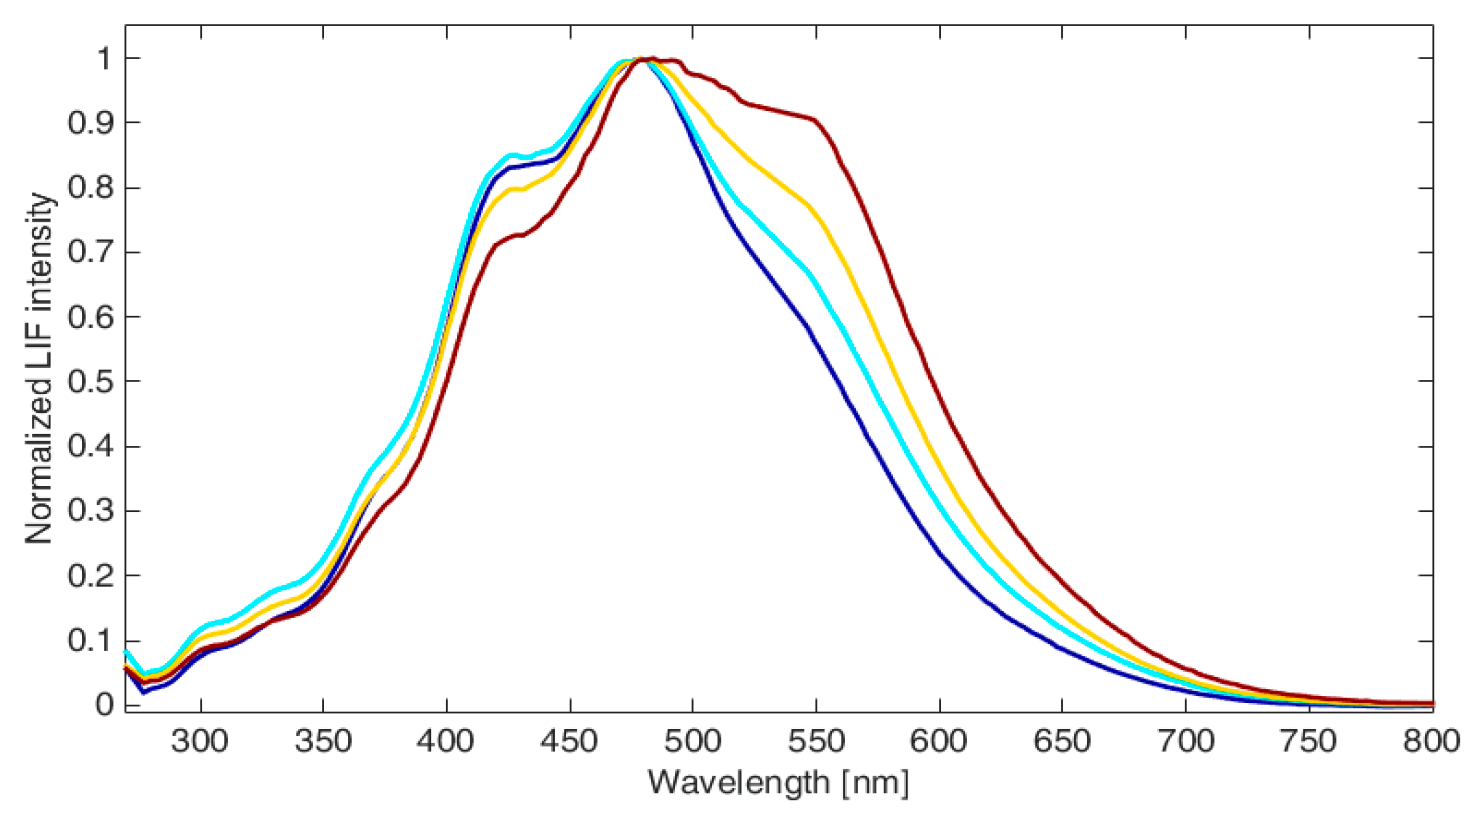
The acoustic images collected in the Greek Chapel relate to a general understanding of the state of conservation of the perimetral walls on the right side of the chapel. As anticipated in Par. 3.3, a first investigation examined the three regions, highlighted in Figure 8 with three rectangles and identified as A1—B1—C1. Vertical profiles (41 points, 80 cm long) were selected along the central axis and a number of lateral axes for each region in order to rapidly obtain an overall idea of the acoustic behaviour of the structures, bypassing finer details. The IAI images, shown in Figure 10, display the acoustic absorption percentage ABS% through a false colour scale ranging from the blue colour (ABS% = 0) to the red colour (ABS% = 100). The most critical areas are evidenced by the colour levels from yellow (moderate damage) to red (severe damage). In the three analysed areas, a heterogeneous status appears, with yellow/red zones encapsulating isolated and highly reflective blue points.
A more accurate analysis, considering finer details, enhanced the comprehension of this behaviour. Indeed, a second examination was conducted on the C1 rectangle, collecting 425 measuring points in a (25 × 17) matrix, covering an area (0.64 m × 0.96 m) with a 0.04 m step. The resulting acoustic image was overlaid and correctly aligned on a painting’s photograph, so that the localisation of the critical areas was easily accomplished. Figure 11 shows the results obtained on the C1 panel. Figure 11a depicts the IAI image in a full colour scale (0%–100%), indicating in red the most critical areas mainly located in the left upper border and in the lower right corner, very near to a significant exposed part where the superficial plaster and painted layer are lost and no longer visible. These parts are likely to suffer a more important modification over time. Other little yellow spots are also visible near the central part, but the colour level indicates a moderate decay process. In terms of structural damage or detachments’ evolution, a rather stable condition can be deduced by qualitatively comparing the two images on the C1 panel, in Figure 10, and the detailed one in Figure 11, acquired almost one year apart. Comparing the results with information related to the last restoration in this area dated back to more than 25 years, it can be inferred that the unusually isolated and highly reflective blue spots are parts that underwent restoration interventions, realistically using materials with different elastic properties with respect to the ancient plaster, such as acrylic resins. Figure 11b evidences the most reflecting areas, also encompassing these isolated spots, by applying an upper threshold to the ABS% map at 30%.
During measurement, a selected profile (25 points) was repeated in order to perform a suitable evaluation of the relative error of the directly measured quantity (total reflected energy Σ) and an estimation of the results’ accuracy. By means of a statistical analysis, a mean relative error of 4% was found in the IAI image and below 10% for all points of the selected profile. This result guarantees that the accuracy of the acoustic investigation is particularly high. Further information was obtained from the FRAI images of the same C1 panel after having evaluated the mean relative error for each octave band. A relative error between 3.4% and 9.1% was found in 8 octave band images, between 2.5 kHz and 12.5 kHz central frequency. A selection of the most representative FRAI images with the highest accuracy is shown in Figure 12, with the corresponding central frequency reported beneath each image.
At low frequencies, 3.15 kHz (Figure 12a), related to deep detachments (about a few mm beneath the surface, depending on material density), the left upper and the right bottom areas clearly emerge together with a vertical area in the left-hand portion of the investigated ROI. The central part shows some problems that evolve into smaller defects as the frequency increases. At these high frequencies (8–12.5) kHz (Figure 12c,d), the red colour zones are related to more superficial detachments and defects (about a few tenths of mm beneath the surface, depending on material density).

4.4. LIF Results

For each scan made by LIFART, fluorescence spectra were acquired and digitised across 128 contiguous spectral bands in the range 250 nm to 890 nm. The data treatment consists of the subtraction of the background and the processing with multivariate methods [44], in particular the principal component analysis (PCA), the k-means analysis, and spectral ratios between specific bands were performed. Figure 13 shows the maps of the zero delay (a) and 30 ns delay (b) scans in RGB false colours obtained from the first three principal components of the scans on the entire right wall, which includes the areas A1, B1, and C1 on which the attention of this study has been mainly focused. It can be observed that the map of the scan acquired with a 30 ns time delay is more defined and with greater contrast than that with zero delay, despite the signal amplitudes being approximately one order of magnitude lower. The different colour areas in Figure 13 are attributed to the fluorescent emission of materials of different natures and compositions that occur on top of the investigated surface. In particular, the yellow areas of the scan, shown in the delayed fluorescence image, are attributed to the emission of materials originally located in deep subsurface layers. These materials appear on the surface due to decoherence phenomena, a process driven by the very high humidity of the hypogeal environment that occurs when the superficial wall structures are subjected to stresses from erosion, abrasion, or chemical reactions, and the surface material begins to lose its structural integrity. Due to this degradation, the materials located in the underlying layers, originally hidden and protected by the surface, become exposed. The deterioration highlighted by the LIF image is indicative of areas where there is significant removal of the surface layer and the presence of microfractures and discontinuities.
Of particular interest are the results obtained with the Laser-Induced Fluorescence (LIF) on the C1 panel. For this case, we present the images in monochromatic rendering, where the intensity corresponds to the first five principal components of the Principal Component Analysis (PCA). This analysis was repeated during both measurement campaigns, and it was specifically focused on the non-delayed fluorescence emission. Since it is not possible to make a point-by-point comparison of the spectra, we preferred to qualitatively compare the monochrome images of the PCA scores, a method that has the advantage of representing and comparing high-variance features. The result shown in Figure 14 did not show significant variations across the different campaigns. This finding is consistent with the interpretation that the dynamic equilibrium established within the catacomb site leads to substantial stability on the surfaces. Consequently, changes in the quantitative presence of humidity in the masonry, which may occur due to seasonal variations, appear to have little or no significant impact. This stability suggests that the microenvironment within the catacombs remains relatively unaffected by external seasonal changes, ensuring the preservation of the surface characteristics over time.
This result is not contradictory with the surface deterioration highlighted by the delayed LIF image shown in the right side of Figure 13, since the observed intraseasonal stability in the hypogeal environment is compatible with local dynamics of moisture movement within the masonry wall, as evidenced by the NMR and comparative NMR-AI analyses.
Also noteworthy is the result of the images obtained from the delayed fluorescence spectra. In this case, single spots with peculiar spectral alterations are characterised by the white coloration shown in Figure 14K,L, indicating respectively extremely low and high values of the first two component scores. These spots identify areas of strong inhomogeneity in the composition of the surface materials, and although it was not possible within the limit of the present study to ascertain the nature of the alteration, they remain a strong qualitative indication that highlights the complexity of the superficial deterioration phenomena and the presence of several not yet identified compounds or degradation products that contribute to the inhomogeneous fluorescence emission in these regions. Spectral identification was performed using the k-means technique, which is a widely used clustering algorithm [44]. The entirety of the C1 scan spectra were divided into distinct groups based on their spectral features, allowing for the effective classification and analysis of the fluorescence spectra.
By applying k-means clustering, we were able to distinguish between different spectral features and identify patterns that may not be immediately apparent. As shown in Figure 15, the most prominent bands identified in the spectra occur at 310 nm, 420 nm, 470 nm, and 550 nm. These bands are key indicators of specific compounds and their interactions within the sample, providing crucial insights into the composition and condition of the surfaces studied. Although the direct attribution to specific compounds is not unequivocal due to the observed large bandwidth and the presence of interferents, it is conceivable to attribute the UV fluorescences around 310 nm to acrylic compounds [45,46]. These compounds may have been used in previous restoration interventions that were not fully documented. This tentative attribution suggests that some of the materials present on the surfaces are residues from restoration efforts, highlighting the importance of detailed documentation in conservation practices.
Recently, the possibility of an early detection of bio-attacks by LIF, when microorganism biofilms are not yet visible by the naked eye, has been proved in the Priscilla Catacombs [10]. In particular, the Greek Chapel in the past resulted in rich spores and filamentous structures of Actinobacteria, characterised by an intense fluorescence emission band centred at 340 nm. High humidity levels, even if local, can promote the development of biofilm on the surface. For this reason, the eventual presence of this kind of bio–patina has been monitored by mapping the 340 nm band on the C1 surface, as reported in Figure 16. As can be seen, no evidence can be noticed.

4.5. Thermographic Survey

The thermographic survey carried out on the C1 area (Figure 8) had the aim of confirming and/or identifying the areas or elements where the degradation phenomena are already in progress. The investigations were carried out in active mode by Lock-In Thermography (LIT) based on the application of periodic thermal waves. In particular, the experimental data were acquired using a square wave with a fundamental frequency of 0.005 Hz, using three repetitions in order to get closer to the steady state. Each thermogram was recorded at a frame rate of 5 Hz. The C1 area was analysed by acquiring data in several framings, then stitched in the final images shown in Figure 17. The C1 area shows different situations at different heights: in the upper part of both amplitude and phase images, the different bluish colour suggests a possible presence of moisture. In the centre of the area, phase and amplitude images confirm the presence of an inhomogeneity, probably structural defects. Indeed, the variations in the signal′s amplitude or phase relative to its surroundings may indicate the presence of anomalies or discontinuities. The possible contribution due to humidity, however, requires a comparison with the quantitative data from the NMR technique.

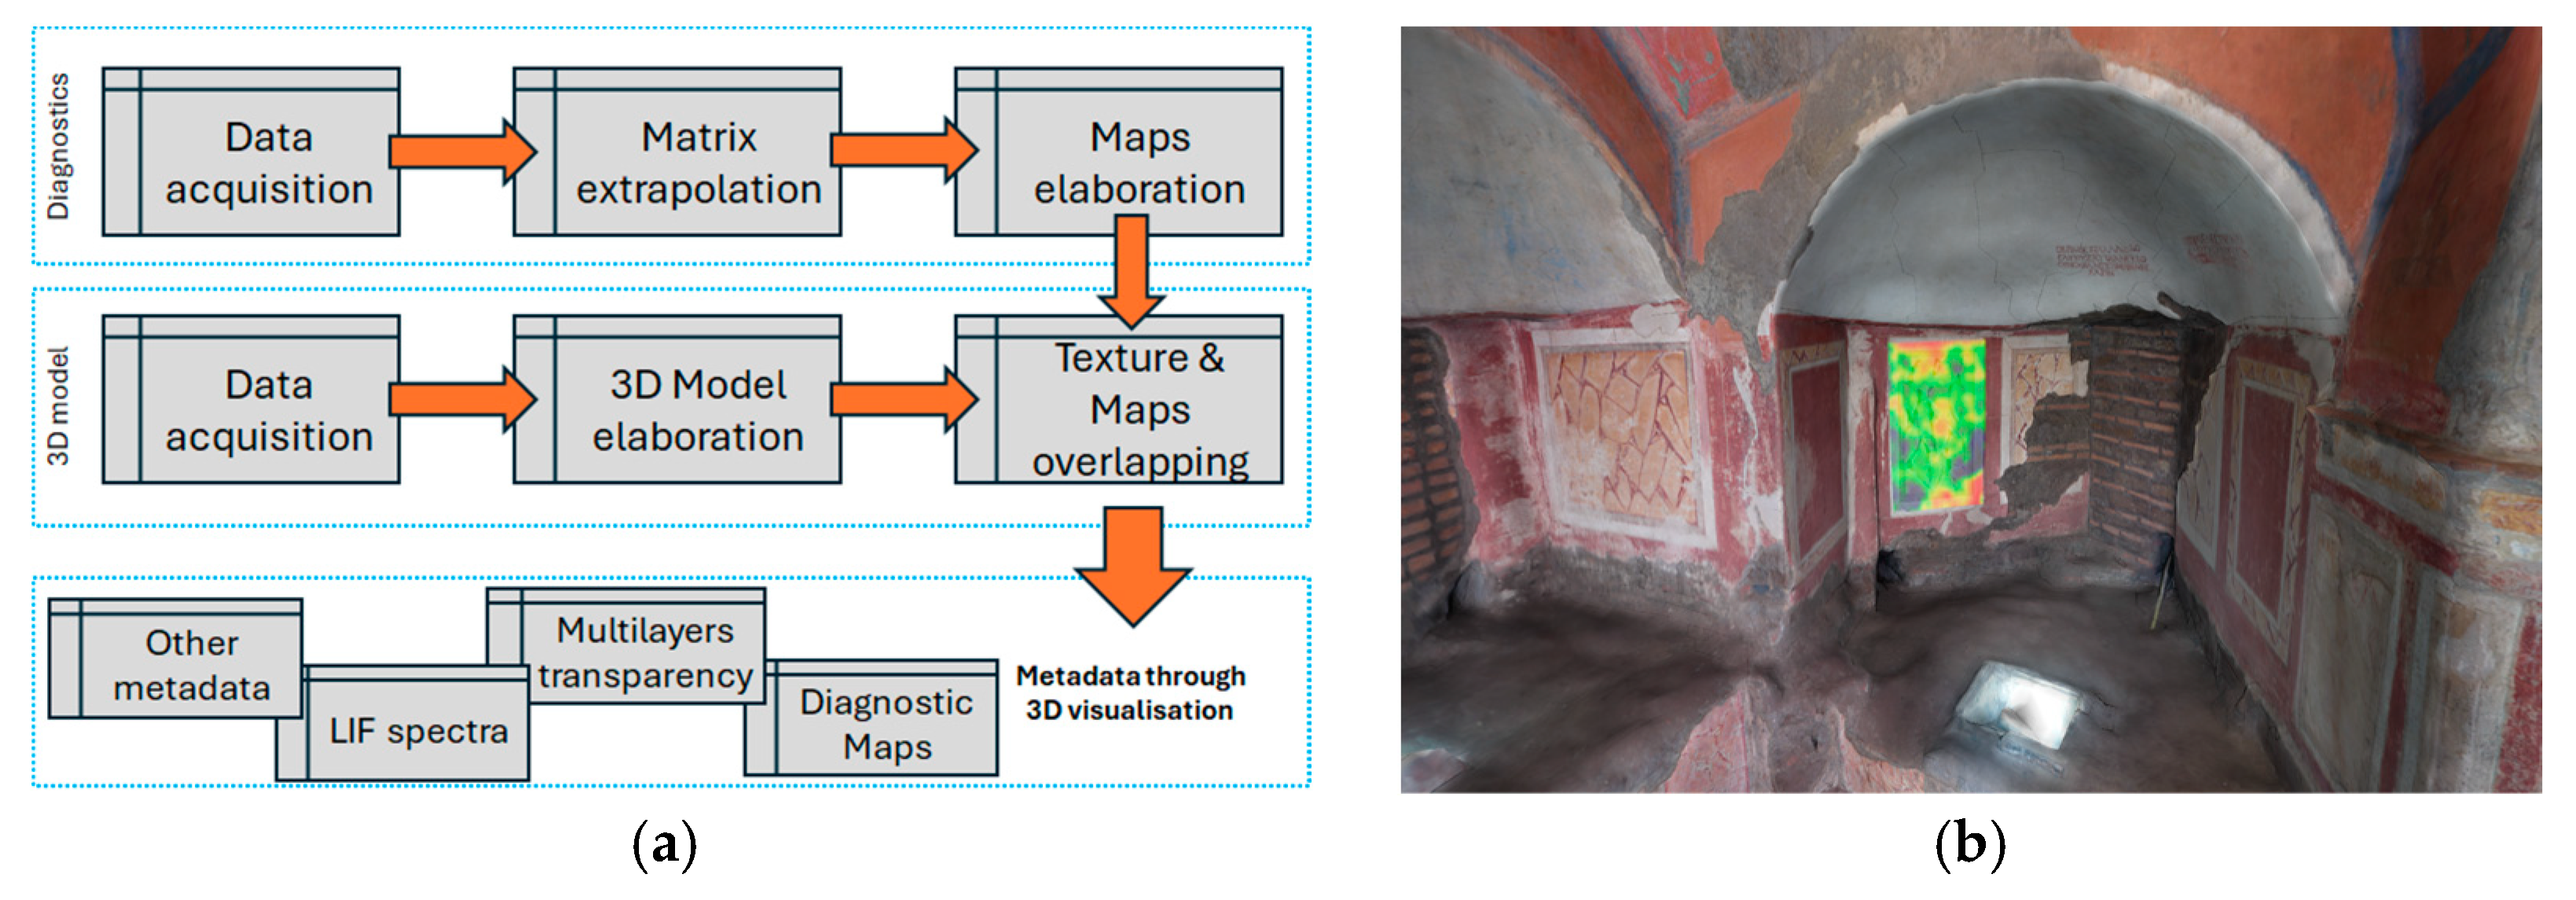
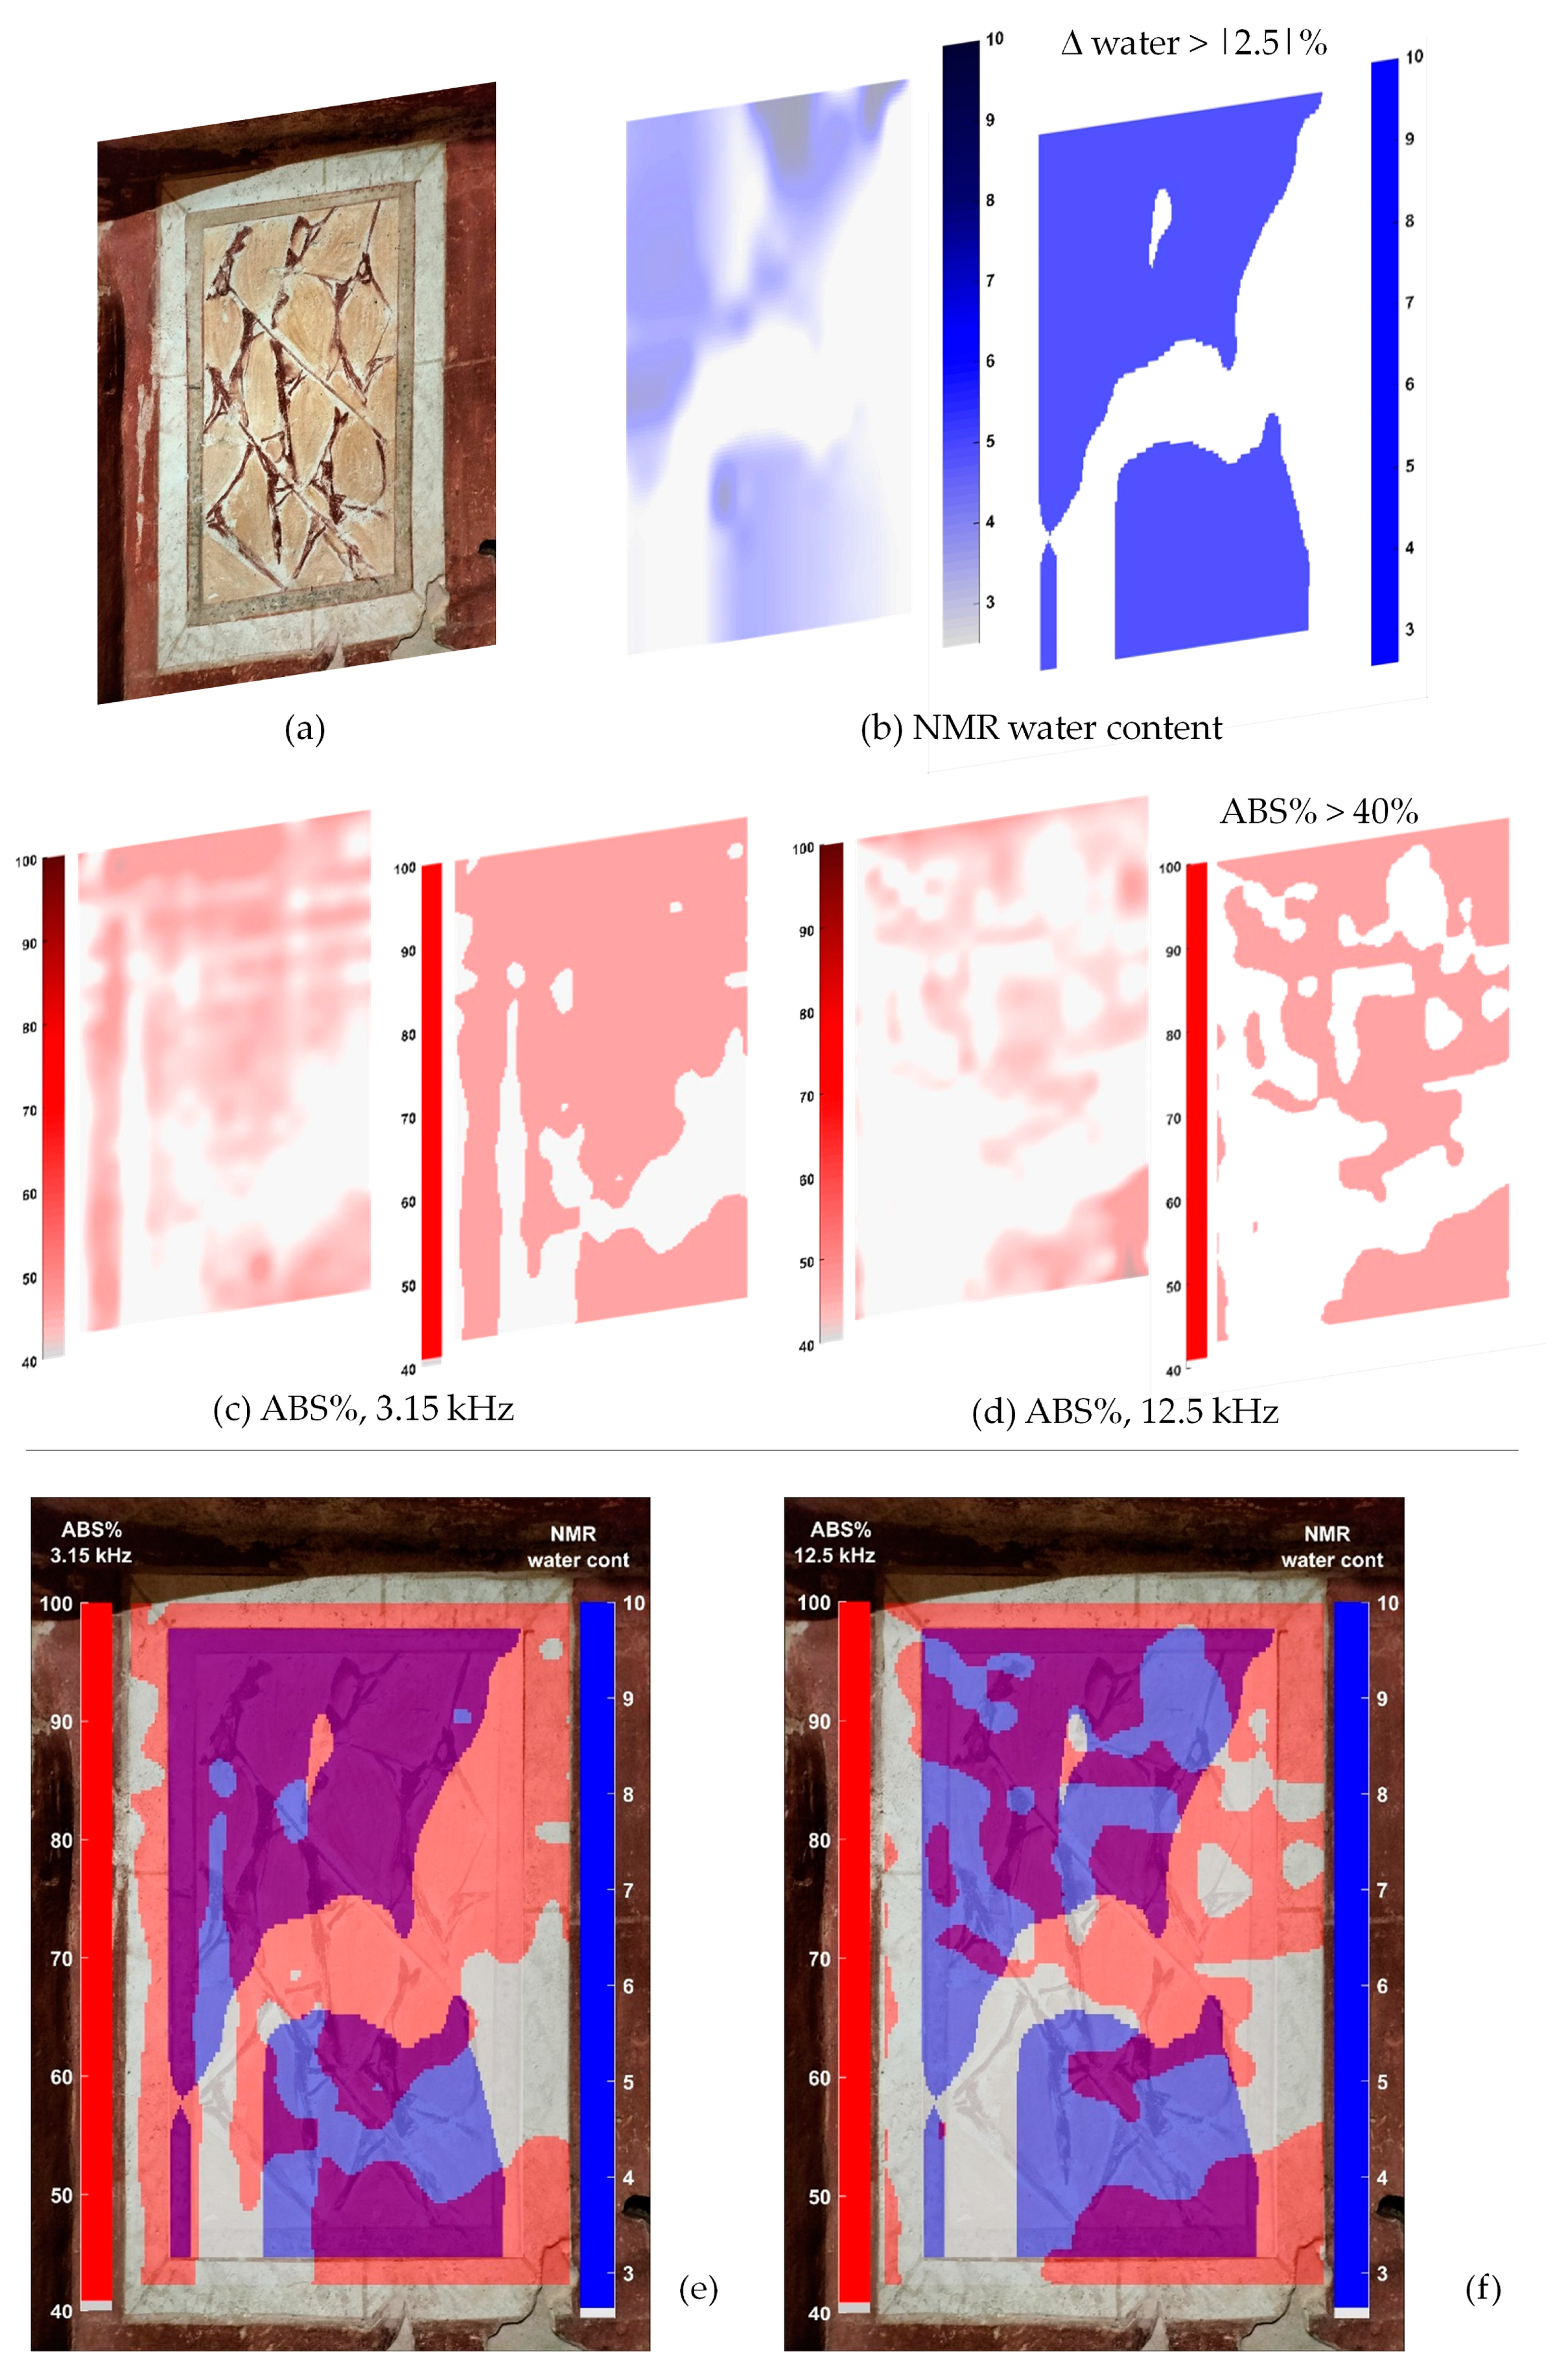
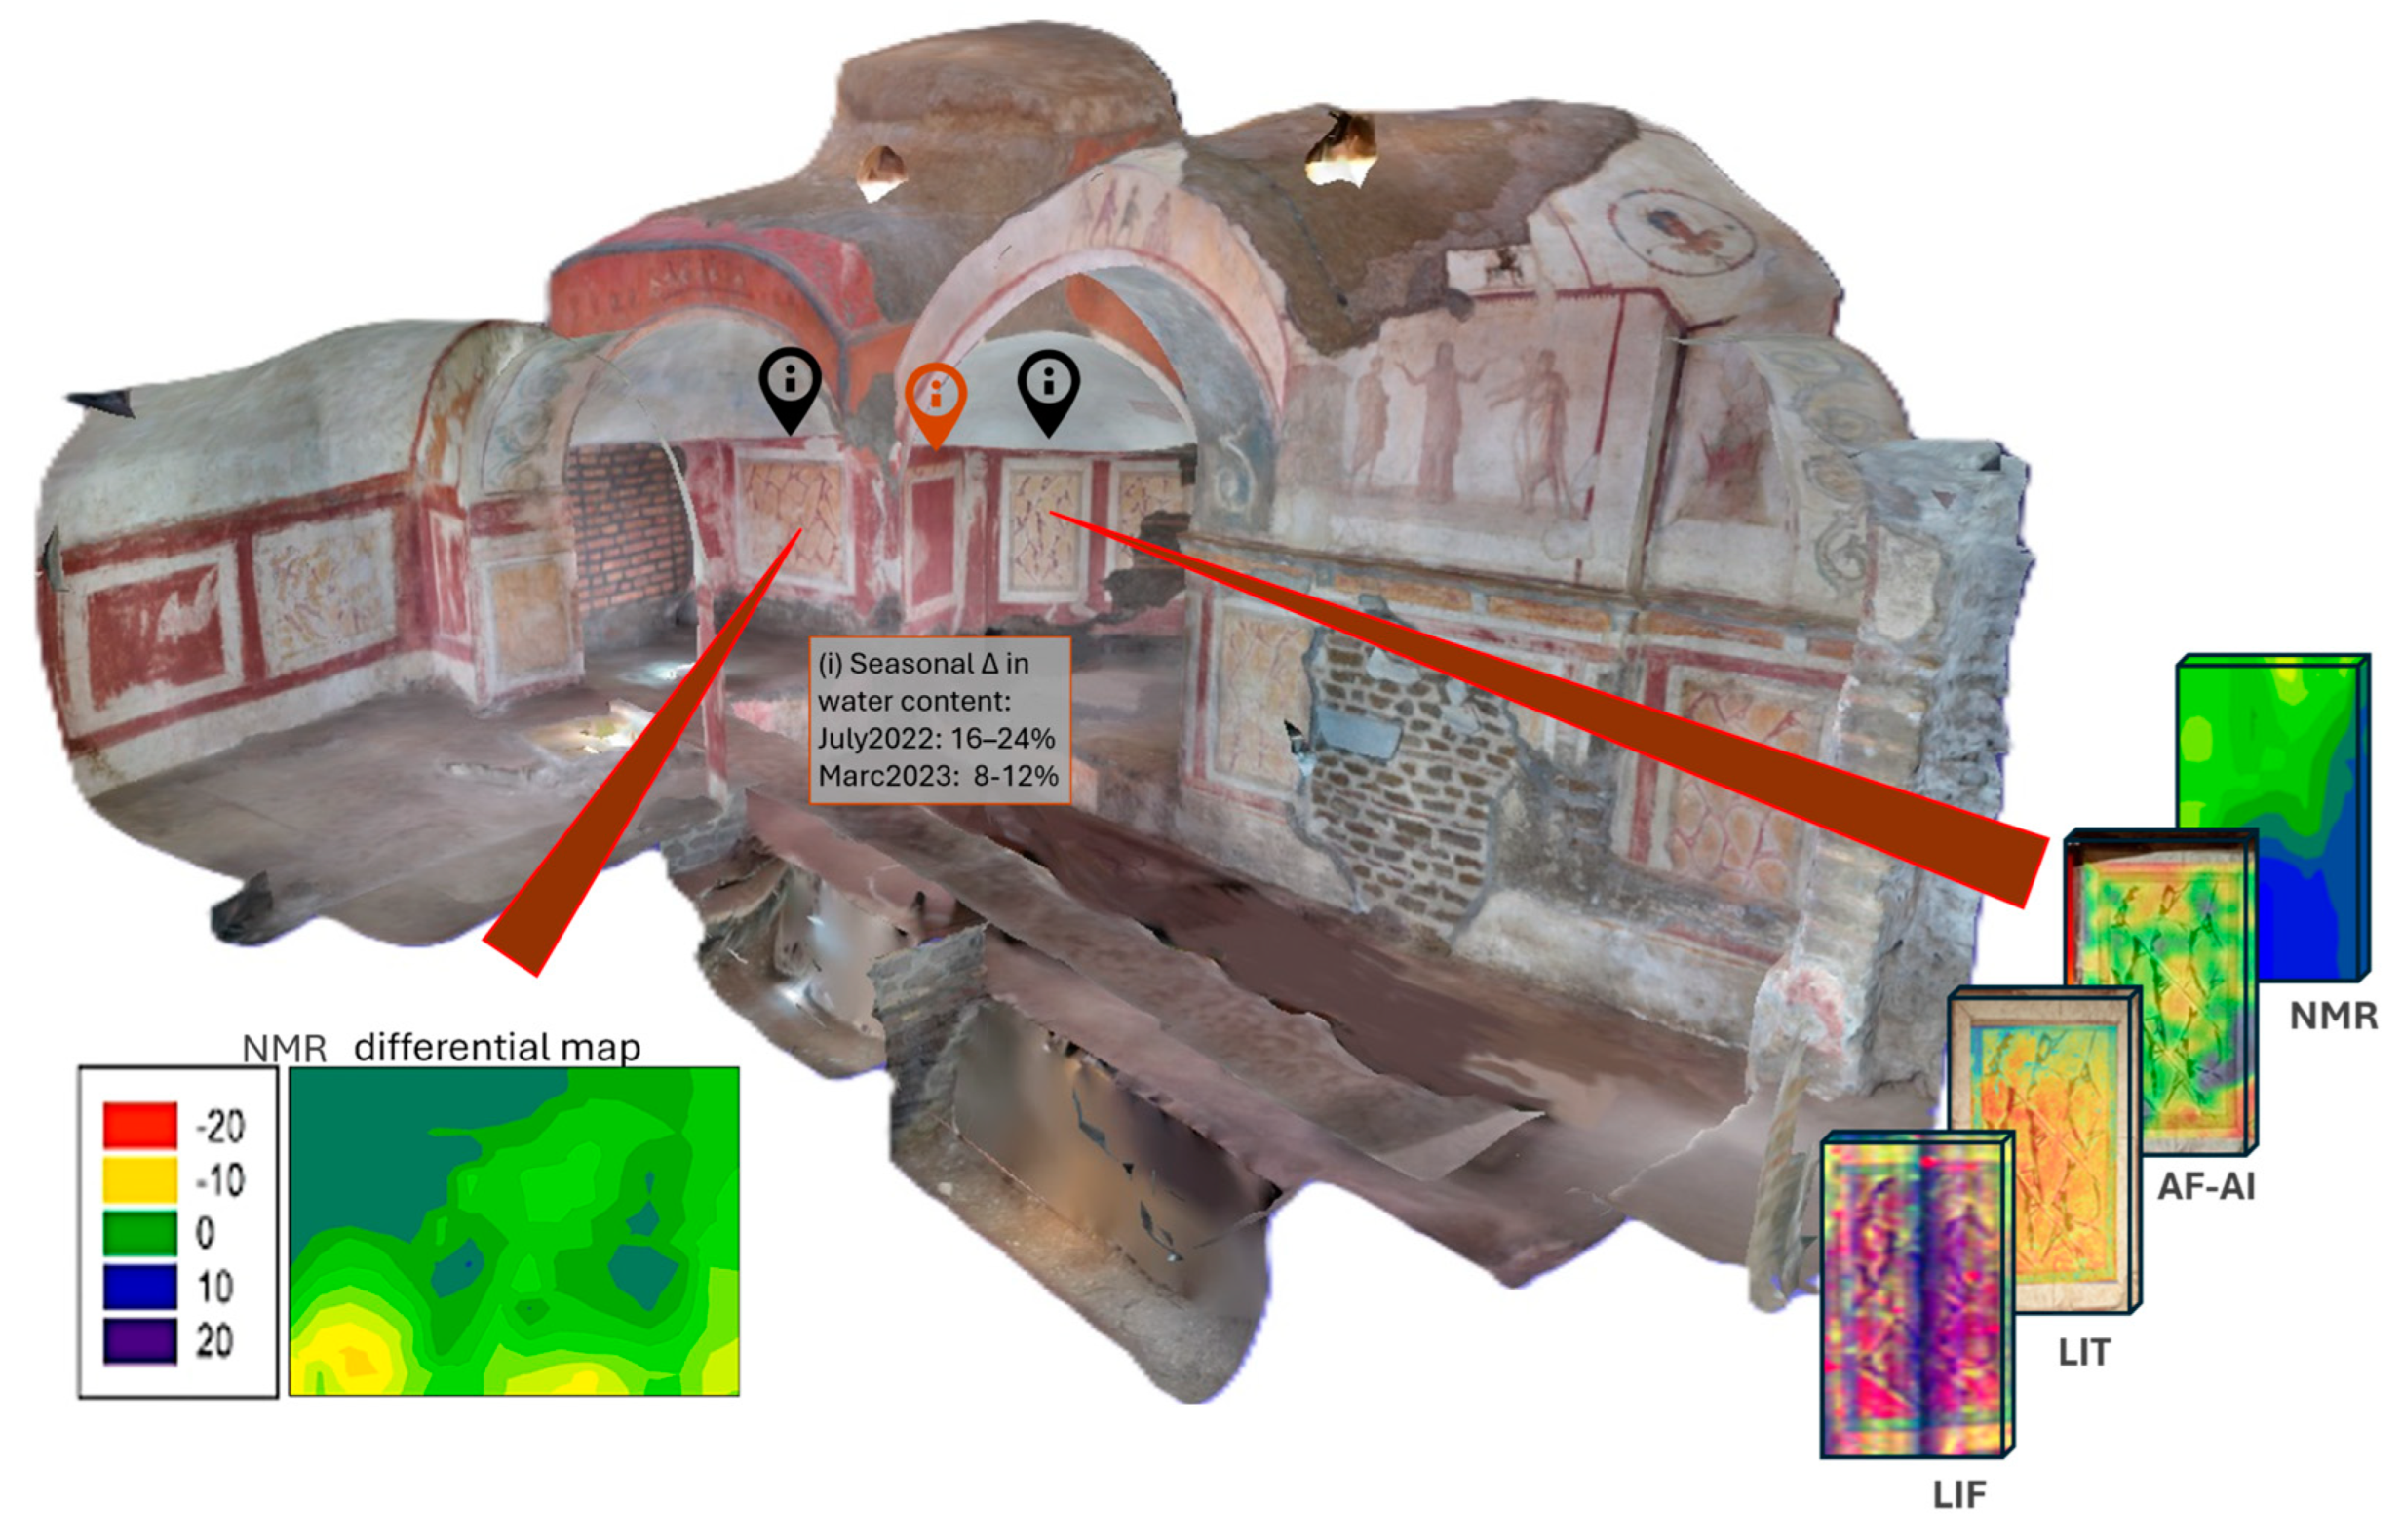
4.6. Preliminary Results on Data Overlapping on the 3D Model

Observing the large number of diagnostic images now available on the Greek chapel, the construction of a database to be integrated on the 3D model could be an interesting data visualisation modality. Moreover, considering a dataset of about 8–10 images for each investigated area, the possibility of browsing the different maps in transparency on the model could provide a challenging tool for conservators and researchers working on such a delicate site. Thus, as further post-processing elaboration, a preliminary study on data overlapping on the 3D model was carried out, following the general scheme reported in Figure 18a. In particular, the AF–AI map was aligned on the 3D model texture by using Meshlab 2024 software [47]. Considering the map as a raster and applying filters that project the maps imported in Meshlab as a raster onto the mesh, the combined visualisation of the results was possible, using 35% of transparency (Figure 18b). Future elaboration could comprehend the association of other layers, such as NMR, LIF, and LIT maps, in correspondence with the same area and other metadata navigable through the 3D model.

5. Discussion

The methods adopted in this study provide non-destructive tools suitable for the assessment of the conservation state of ancient masonry and for the quantification of water distribution in the first layers of the wall and the related defects. Thus, such techniques are particularly effective for long-term monitoring. The results from each methodology discussed above and their respective datasets are intended to be integrated since they constitute a large amount of heterogeneous information that might be potentially correlated. The expected outcome offers a holistic view of the Greek Chapel as a complex system in dynamic equilibrium with the environment. Indeed, the obtained results provide an overall view of those processes taking place in the site also in relation to restorations, thus contributing to enriching the documentation about the site.
The water distribution maps obtained by the portable NMR device and the relative differential maps could give a picture of the superficial variation of the water content that can seasonally occur within the wall volume. Although two measuring campaigns cannot represent a full dynamics of water migration that should require long-term monitoring, the NMR results clearly suggest a non-steady state. The movement of water in the masonry could be responsible for deterioration processes such as detachments of the pictorial layer and/or plaster or deeper material loss and/or inhomogeneities. In order to better understand whether the detachments are the significant effects related to the presence of water in the masonry, a comparison was attempted integrating the AI results with the NMR maps (Figure 19). The integration of the water content variation and the structural deterioration localisation was carried out by a data-fusion approach of 2D NMR and AF–AI images. After the application of suitable image processing, starting from the harmonisation of the two heterogeneous datasets, the acoustic images of C1 were overlaid on the NMR map. The NMR differential map was provided in modulus, accounting for the variation of water content revealed between the two campaigns regardless of the type of process (drying or wetting). Successively, the portions of C1 with the most relevant variation were selected, setting a threshold at 2.5%, up to 10%. Finally, the resulting map was converted into a binary monochrome image, becoming the blue colour layer (Figure 19b). Among the FRAI images, the lower frequency band image (3.15 kHz—Figure 19c) and the higher frequency band image (12.5 kHz—Figure 19d) were respectively selected to differentiate the deeper detachments from the superficial defects. A lower threshold at ABS% = 40% was applied to the acoustic images in order to evidence the most critical areas (from mild to severe damage). The images were then converted into binary monochrome ones, becoming the red colour layer. The resulting image is a multilayer picture where each layer represents the information from one investigation methodology. Figure 19e,f combines the NMR blue layer with the FRAI red layers, highlighting by a darker purple colour the zones where superposition occurs. Considering the wide areas of superposition, particularly visible in the 3.15 kHz image (Figure 19e), the structural damage, evidenced by AF–AI, is likely related to the most relevant water distribution changes found by the NMR method. Although the detachments can also progress independently from water, it can be assessed that water content variation might have triggered these decay processes.
Figure 20 illustrates the practical application of Lock-In analysis by showing the amplitude and phase images (Figure 20a and Figure 20b, respectively) extracted from the fundamental frequency component of the signals acquired and overlapped on the visible image. LIT images seem to indicate some areas with differences in temperature distribution in the upper part of the C1 area, showing coherence with the NMR, indicating water content, and acoustic results (Figure 19e). Furthermore, the comparison of the results in the central area of the C1 seems to confirm the presence of an inhomogeneity masonry structure, ascribable to structural defects.
A further data fusion is presented in Figure 21, where LIF and AF–AI data are combined similarly to the construction of Figure 20. The IAI acoustic image of the C1 area having ABS% values below 30% (Figure 11b, restituted as a monochromatic and binary yellow layer) has been superimposed on the LIF map of the fluorescence intensity representing the 310 nm band, which is tentatively assigned to the emission by acrylic substances probably used in the last consolidation of more than 25 years ago, as previously mentioned. Unfortunately, such consolidation actions were not sufficiently documented in order to retrieve detailed localisations of the interventions. Furthermore, given the impossibility of examining the fluorescent emission intensities quantitatively due to the difficulty of constructing appropriate calibration spectra, the LIF image has been rendered in binary mode, reporting in black the points in which the bandwidth at 310 nm exceeded the threshold of 37% with respect to the maximum observed in the area of Figure 21. It is possible to note large overlapping areas where the unusually high acoustic reflection is coincident with the possible presence of surface consolidants. This finding supports the hypothesis that the superficially treated materials do actually have greater surface stability and structural coherence and therefore are more resistant to surface erosion, damage, or detachment and consequently favour the reflection of acoustic waves. The greater structural consistency, highlighted by AF–AI in very high reflection points and by the LIF in the 310 nm band, could probably be related to the restoration interventions, although other phenomena, such as material ageing, environmental factors, and previous damage, may influence the analysis. Thus, these restoration interventions could have locally altered the physical properties of the painted surface, leading to changes in its acoustic impedance and, consequently, its reflective characteristics.
As final data elaboration, the 3D digital model would host the entire multi-layered corpus of data and metadata collected within the Greek chapel, offering specific functionalities for retrieving single or multiple datasets, as shown in Figure 22. Here, the single or multiple images and data could be explored directly from the high-resolution model as an interactive and virtual database.

6. Conclusions

This paper shows the importance of using a multidisciplinary approach for the study and the digitalisation of a hypogeum environment in critical conservative conditions, requiring non-destructive and sustainable methods. Using advanced methodologies, also coming from the nuclear field, namely Nuclear Magnetic Resonance (NMR), Audio Frequency–Acoustic Imaging (AF–AI), fluorescence Light Detection and Ranging (LiDAR), Infrared Thermography (IRT), and 3D modelling, a comprehensive analysis of the moisture distribution and its effects, both structural and biological, in the Priscilla catacombs complex was obtained. The presence of humidity, observed by NMR and LIT techniques, and its water content variations in some portions of the investigated wall of the Greek chapel indicate that more accurate monitoring over time would be desirable in order to provide full information on the water migration dynamics. The coherence of water content variations with some significant detached zones, highlighted by NMR and AF–AI integration, suggests that some structural decay processes are currently present, constituting risks to the decorative apparatus of the chapel. A wider application of the described approach may offer a more exhaustive view of the conservation state of the chapel, in particular in those areas where the potential loss of the characteristic painted scenes and inscriptions would impair its cultural identity. The current absence of biological attack, revealed by the LIF analyses after a few years from the surface treatment, is very useful information about the effectiveness of the treatments; nevertheless, the periodic monitoring is desirable. Finally, LIF and AF–AI integration paves the way to the combination of complementary information on modern restauration materials, encompassing their structural properties and chemical–physical information. The results achieved inside the Greek chapel demonstrate the considerable potentiality of a multidisciplinary approach for several aspects: (i) evaluating both the causes of degradation and the state of conservation of historic masonries in hypogenous environments; (ii) providing solid scientific indications to guide future monitoring campaigns in the most critical areas, also for assisting preventive conservation management before permanent damage occurs; and (iii) building a comprehensive database for the long-term documentation useful for future conservative plans and for fruition purposes, explorable also directly through the 3D high resolution model. Thus, the multi-techniques approach adopted in this study can be considered a sustainable and time-zero documentation for monitoring the degradation processes and the evolution of moisture presence within the walls along the years, as well as a relevant tool for future consultation that is also useful to choose the most appropriate method or combination of methods to employ in restoration procedures.

Author Contributions

Methodology, P.C., S.C., F.C., C.D., V.D.T., M.G., L.L., N.P., M.Z. and R.Z.; Software, M.G. and R.Z.; Validation, P.C., V.D.T., M.G., L.L., N.P. and V.S.; Formal analysis, P.C., S.C., F.C., C.D., M.G., L.L. and N.P.; Investigation, P.C., S.C., F.C., C.D., V.D.T., M.G., V.S. and R.Z.; Data curation, P.C., S.C., V.D.T., M.G., L.L., V.S., M.Z. and R.Z.; Writing—original draft, P.C., S.C., V.D.T., L.L. and V.S.; Writing—review & editing, P.C., S.C. and N.P.; Visualization, M.Z.; Project administration, F.C. All authors have read and agreed to the published version of the manuscript.

Funding

Part of the presented research was carried out in ReMEDIA Project N. I15F21000280002, funded by Lazio Region, within the call “Progetti di Gruppi di Ricerca 2020” POR FESR 2014–2020.

Institutional Review Board Statement

Not applicable.

Informed Consent Statement

Not applicable.

Data Availability Statement

The data presented in this study are available on request from the corresponding author.

Acknowledgments

The authors are grateful to Barbara Mazzei (Pontifical Commission of Sacred Archaeology). A particular acknowledgement to whom participated at the in situ measurements: Massimo Francucci, Massimiliano Ciaffi, Lucilla Di Marcoberardino.

Conflicts of Interest

The authors declare no conflicts of interest.

References

  1. Walsh, P.P.; Banerjee, A.; Murphy, E. The UN 2030 Agenda for Sustainable Development. In Partnerships and the Sustainable Development Goals Sustain; Springer: Cham, Switzerland, 2022; pp. 1–12. [Google Scholar] [CrossRef]
  2. Sciurpi, F. La Conoscenza del Microclima di Ambienti Storici da Recuperare: Il Caso Della Cappella di Santa Verdiana Nell’omonimo Complesso Universitario di Firenze. October 2017. Available online: https://www.researchgate.net/publication/324057404_LA_CONOSCENZA_DEL_MICROCLIMA_DI_AMBIENTI_STORICI_DA_RECUPERARE_IL_CASO_DELLA_CAPPELLA_DI_SANTA_VERDIANA_NELL’OMONIMO_COMPLESSO_UNIVERSITARIO_DI_FIRENZE (accessed on 7 May 2024).
  3. Camuffo, D. Humidity and Deterioration Mechanisms. In Microclimate for Cultural Heritage, 3rd ed.; Elsevier: Amsterdam, The Netherlands, 2019; Chapter 6; pp. 93–123. ISBN 978-0-444-64106-9. [Google Scholar]
  4. Capitani, D.; Proietti, N.; Gobbino, M.; Soroldoni, L.; Casellato, U.; Valentini, M.; Rosina, E. An integrated study for mapping the moisture distribution in an ancient damaged wall painting. Anal. Bioanal. Chem. 2009, 395, 2245–2253. [Google Scholar] [CrossRef] [PubMed]
  5. Proietti, N.; Calicchia, P.; Colao, F.; De Simone, S.; Di Tullio, V.; Luvidi, L.; Prestileo, F.; Romani, M.; Tatì, A. Moisture damage in ancient masonry: A multidisciplinary approach for in situ diagnostics. Minerals 2021, 11, 406. [Google Scholar] [CrossRef]
  6. Calicchia, P.; De Simone, S.; Di Marcoberardino, L.; Verardi, P. Exploring the potential of a frequency resolved acoustic imaging technique in panel painting diagnostics. Measurement 2018, 118, 320–329. [Google Scholar] [CrossRef]
  7. Calicchia, P.; De Simone, S.; Privitera, S. Validation of Contactless Vibro-Acoustic Imaging for the Detection of Glaze Delamination in Glaze Ceramic Tiles. In Proceedings of the GlazeArt 2018, Lisabon, Portugal, 29–30 October 2018; pp. 208–226. [Google Scholar]
  8. Guarneri, M.; Ceccarelli, S.; Francucci, M.; Ferri De Collibus, M.; Ciaffi, M.; Gusella, V.; Liberotti, R.; La Torre, M. Multi-Sensor Analysis for Experimental Diagnostic and Monitoring Techniques at San Bevignate Templar Church in Perugia. Int. Arch. Photogramm. Remote Sens. Spat. Inf. Sci. 2023, 48, 693–700. [Google Scholar] [CrossRef]
  9. Di Tuccio, M.C.; Ludwig, N.; Gargano, M.; Bernardi, A. Thermographic inspection of cracks in the mixed materials statue: Ratto delle Sabine. Herit. Sci. 2015, 3, 10. [Google Scholar] [CrossRef]
  10. Caneve, L.; Guarneri, M.; Lai, A.; Spizzichino, V.; Ceccarelli, S.; Mazzei, B. Non-Destructive laser based techniques for biodegradation analysis in cultural heritage. NDT E Int. 2019, 104, 108–113. [Google Scholar] [CrossRef]
  11. Guarneri, M.; Ceccarelli, S.; Ciaffi, M. Multi-wavelengths3D laser scanner for investigation and reconstruction of19 th century charcoal inscriptions. In Proceedings of the IMEKO International Conference on Metrology for Archaeology and Cultural Heritage, Lecce, Italy, 23–25 October 2017; pp. 161–165, ISBN 978-92-990084-0-9. [Google Scholar]
  12. Stylianidis, E.; Remondino, F. 3D Recording, Documentation and Management of Cultural Heritage; Whittles Publishing: Dunbeath, UK, 2016; pp. 1–13. ISBN 9781849951685. [Google Scholar]
  13. Ronchi, D.; Limongiello, M.; Demetrescu, E.; Ferdani, D. Multispectral UAV Data and GPR Survey for Archeological Anomaly Detection Supporting 3D Reconstruction. Sensors 2023, 23, 2769. [Google Scholar] [CrossRef]
  14. Farella, E.M. 3D mapping of underground environments with a hand-held laser scanner. Sez. Sci. 2016, 2, 1–10. [Google Scholar]
  15. Remmedia Project. 2023. Available online: https://www.enea.it/it/progetti/progetti-nazionali/progetto-remedia.html (accessed on 7 May 2024).
  16. Priscilla Catacombs. Available online: https://catacombepriscilla.com/ (accessed on 7 May 2024).
  17. Fantoni, R.; Almaviva, S.; Caneve, L.; Colao, F.; De Collibus, M.F.; De Dominicis, L.; Francucci, M.; Guarneri, M.; Lazic, V.; Palucci, A.; et al. In situ and remote laser diagnostics for material characterization from plasma facing components to Cultural Heritage surfaces. J. Instrum. 2019, 14, C07004. [Google Scholar] [CrossRef]
  18. Ceccarelli, S.; Guarneri, M.; Fantoni, R.; Giacopini, L.; Danielis, A.; Ferri De Collibus, M.; Ciaffi, M.; Fornetti, G.; Francucci, M. Colorimetric Study on Optical Data from 3D Laser Scanner Prototype for Cultural Heritage Applications. In New Activities For Cultural Heritage; Ceccarelli, M., Cigola, M., Eds.; Springer International Publishing: Berlin/Heidelberg, Germany, 2017; pp. 190–199. ISBN 978-3-319-67025-6. [Google Scholar]
  19. Ceccarelli, S.; Guarneri, M.; Ferri de Collibus, M.; Francucci, M.; Ciaffi, M.; Danielis, A. Laser Scanners for High-Quality 3D and IR Imaging in Cultural Heritage Monitoring and Documentation. J. Imaging 2018, 4, 130. [Google Scholar] [CrossRef]
  20. Guarneri, M.; De Collibus, M.F.; Francucci, M.; Ciaffi, M. The Importance of Artworks 3D Digitalization at the Time of COVID Epidemy: Case Studies by the Use of a Multi-wavelengths Technique. In Proceedings of the 2020 IEEE 5th International Conference on Image, Vision and Computing (ICIVC), Beijing, China, 10–12 July 2020; pp. 113–117. [Google Scholar]
  21. Ferri De Collibus, M.; Fornetti, G.; Guarneri, M.; Paglia, E.; Poggi, C.; Ricci, R. ITR: An AM Laser Range Finding System for 3D Imaging and Multi-Sensor Data Integration. In Proceedings of the 1st International Conference on Sensing Technology, Palmerston North, New Zealand, 21–23 November 2005; pp. 641–646. [Google Scholar]
  22. Mullen, L.; Laux, A.; Concannon, B.; Zege, E.P.; Katsev, I.L.; Prikhach, A.S. Amplitude-modulated laser imager. Appl. Opt. 2004, 43, 3874–3892. [Google Scholar] [CrossRef] [PubMed]
  23. Systems Standford Research About Lock-In Amplifiers. Appl. Note 2011, 1–9. Available online: https://www.thinksrs.com/downloads/pdfs/applicationnotes/AboutLIAs.pdf (accessed on 7 May 2024).
  24. McCann, J.J.; Vonikakis, V.; Rizzi, A. HDR Scene Capture and Appearance; SPIE: Bellingham, WA, USA, 2017; ISBN 9781510618534. [Google Scholar]
  25. Proietti, N.; Capitani, D.; Cozzolino, S.; Valentini, M.; Pedemonte, E.; Princi, E.; Vicini, S.; Segre, A.L. In Situ and Frontal Polymerization for the Consolidation of Porous Stones:  A Unilateral NMR and Magnetic Resonance Imaging Study. J. Phys. Chem. B 2006, 110, 23719–23728. [Google Scholar] [CrossRef] [PubMed]
  26. Calicchia, P.; De Simone, S.; Verardi, P. Non destructive evaluation of glaze delaminations in glazed ceramic tiles: Laboratory tests. In Proceedings of the GlazeArch 2015 International Conference Glazed Ceramics in Architectural Heritage, Lisabon, Portugal, 2–3 July 2015; pp. 133–152. [Google Scholar]
  27. Calicchia, P.; De Simone, S.; Camassa, A.; Tatì, A.; Petrucci, F. Integration of Non-Destructive Acoustic Imaging Investigation with Photogrammetric and Morphological Analysis to Study the “Graecia Vetus” in the Chigi Palace of Ariccia. Heritage 2022, 5, 3762–3784. [Google Scholar] [CrossRef]
  28. Gómez-Morón, A.; Ortiz, R.; Colao, F.; Fantoni, R.; Becerra, J.; Ortiz, P. Laser-Induced Fluorescence mapping of pigments in a secco painted murals. Ge-Conserv 2020, 17, 233–250. [Google Scholar] [CrossRef]
  29. Romani, M.; Capobianco, G.; Pronti, L.; Colao, F.; Seccaroni, C.; Puiu, A.; Felici, A.C.; Verona-Rinati, G.; Cestelli-Guidi, M.; Tognacci, A.; et al. Analytical chemistry approach in cultural heritage: The case of Vincenzo Pasqualoni’s wall paintings in S. Nicola in Carcere (Rome). Microchem. J. 2020, 156, 104920. [Google Scholar] [CrossRef]
  30. Romani, A.; Miliani, C.; Clementi, C.; Grazia, C.; Colao, F.; Fantoni, R.; Valentini, G.; Detalle, V.; Bai, X. Portable Instrumentation. In Springer Series on Fluorescence; Springer International Publishing: Cham, Switzerland, 2023; pp. 1–34. [Google Scholar]
  31. Gómez-Morón, M.A.; Ortiz, R.; Colao, F.; Fantoni, R.; Gómez-Villa, J.L.; Becerra, J.; Ortiz, P. Monitoring the Restoration of a Seventeenth-Century Wooden Artwork Using Laser-Induced Fluorescence and Digital Image Analysis. Appl. Spectrosc. 2021, 75, 70–80. [Google Scholar] [CrossRef]
  32. Gaussorgues, G. Infrared Thermography; Springer: Dordrecht, The Netherlands, 1994; ISBN 978-94-010-4306-9. [Google Scholar]
  33. Dritsa, V.; Orazi, N.; Yao, Y.; Paoloni, S.; Koui, M.; Sfarra, S. Thermographic Imaging in Cultural Heritage: A Short Review. Sensors 2022, 22, 9076. [Google Scholar] [CrossRef]
  34. Theodorakeas, P.; Cheilakou, E.; Ftikou, E.; Koui, M. Passive and active infrared thermography: An overview of applications for the inspection of mosaic structures. J. Phys. Conf. Ser. 2015, 655, 012061. [Google Scholar]
  35. Pucci, M.; Cicero, C.; Orazi, N.; Mercuri, F.; Zammit, U.; Paoloni, S.; Marinelli, M. Active infrared thermography applied to the study of a painting on paper representing the Chigi’s family tree. Stud. Conserv. 2015, 60, 88–96. [Google Scholar] [CrossRef]
  36. Ambrosini, D.; Daffara, C.; Di Biase, R.; Paoletti, D.; Pezzati, L.; Bellucci, R.; Bettini, F. Integrated reflectography and thermography for wooden paintings diagnostics. J. Cult. Herit. 2010, 11, 196–204. [Google Scholar] [CrossRef]
  37. Mercuri, F.; Ceccarelli, S.; Orazi, N.; Cicero, C.; Paoloni, S.; Felici, A.C.; Matera, F.; Nuzzo, M.; Zammit, U. Combined use of infrared imaging techniques for the study of underlying features in the Santa Maria in Cosmedin altarpiece. Archaeometry 2021, 63, 1009–1023. [Google Scholar] [CrossRef]
  38. Daffara, C.; Parisotto, S.; Ambrosini, D. Multipurpose, dual-mode imaging in the 3–5 µm range (MWIR) for artwork diagnostics: A systematic approach. Opt. Lasers Eng. 2018, 104, 266–273. [Google Scholar] [CrossRef]
  39. Maldague, X.; Galmiche, F.; Ziadi, A. Advances in Pulsed Phase Tomography. Infrared Phys. Technol. 2001, 43, 175–181. [Google Scholar] [CrossRef]
  40. Wu, D.; Busse, G. Lock-in thermography for nondestructive evaluation of materials. Rev. Générale Therm. 1998, 37, 693–703. [Google Scholar] [CrossRef]
  41. Gleiter, A.; Riegert, G.; Zweschper, T.; Busse, G. Ultrasound lock-in thermography for advanced depth resolved defect selective imaging. Insight Non-Destr. Test. Cond. Monit. 2007, 49, 272–274. [Google Scholar] [CrossRef]
  42. D’accardi, E.; Palumbo, D.; Galietti, U. A comparison among different ways to investigate composite materials with lock-in thermography: The multi-frequency approach. Materials 2021, 14, 2525. [Google Scholar] [CrossRef]
  43. Zhu, P.; Wu, D.; Wang, Y.; Miao, Z. Defect detectability based on square wave lock-in thermography. Appl. Opt. 2022, 61, 6134–6143. [Google Scholar] [CrossRef]
  44. Mattana, S.; Fovo, A.D.; Lagarto, J.L.; Bossuto, M.C.; Shcheslavskiy, V.; Fontana, R.; Cicchi, R. Automated Phasor Segmentation of Fluorescence Lifetime Imaging Data for Discriminating Pigments and Binders Used in Artworks. Molecules 2022, 27, 1475. [Google Scholar] [CrossRef]
  45. Marinelli, M.; Pasqualucci, A.; Romani, M.; Verona-Rinati, G. Time resolved laser induced fluorescence for characterization of binders in contemporary artworks. J. Cult. Herit. 2017, 23, 98–105. [Google Scholar] [CrossRef]
  46. Spizzichino, V.; Bertani, L.; Caneve, L.; Caso, M.F. Rapid analysis of marble treatments by laser induced fluorescence. Opt. Quantum Electron. 2020, 52, 117. [Google Scholar] [CrossRef]
  47. Cignoni, P.; Callieri, M.; Corsini, M.; Dellepiane, M.; Ganovelli, F.; Ranzuglia, G. MeshLab: An open-source mesh processing tool. In Eurographics Italian Chapter Conference; The Eurographics Association: Eindhoven, The Netherlands, 2008; pp. 129–136. [Google Scholar]
Figure 1. Priscilla Catacombs, Greek Chapel, details of (a) the Greek inscription that named the room; (b) the banquet scene (source: authors).
Sustainability 16 08284 g001
Figure 2. RGB-ITR scanner at work inside the Greek chapel.
Sustainability 16 08284 g002
Figure 3. NMR system during the acquisition process.
Sustainability 16 08284 g003
Figure 4. AF–AI system working inside a niche of the Greek chapel.
Sustainability 16 08284 g004
Figure 5. LIFART system working inside a niche of the Greek chapel.
Sustainability 16 08284 g005
Figure 6. Thermographic apparatus working in the chapel.
Sustainability 16 08284 g006
Figure 7. Three-dimensional model of the Greek chapel obtained with the RGB-ITR laser scanner: (a) view of the mesh where the room geometry is clearly visible and the investigated area is indicated; (b,c) sections of the model where all the room can be viewed and the accurate colours of the texture allow to better appreciate the paintings.
Sustainability 16 08284 g007aSustainability 16 08284 g007b
Figure 8. Investigated areas with diagnostic techniques indicated on the 3D RGB-ITR model with yellow rectangles (A1, B1, C1).
Sustainability 16 08284 g008
Figure 9. Humidity maps recorded by NMR sensors at a depth of 5 mm from the surface in July 2022 and in March 2023, respectively, in area C1, in area B1, and in area A1. The legend provides the humidity content range (%) obtained by calibrating the NMR signal. For each area, a differential map is also reported.
Sustainability 16 08284 g009
Figure 10. The acoustic images of the three rectangular areas A1, B1, and C1 are presented below the photograph of each portion.
Sustainability 16 08284 g010
Figure 11. The resulting acoustic image of the C1 area (a) and the high reflecting points evidenced in the low ABS% region (b).
Sustainability 16 08284 g011
Figure 12. The most representative FRAI images of the C1 panel where the yellow dash lines indicate the most critical areas on the wall.
Sustainability 16 08284 g012
Figure 13. LIF results in correspondence of areas A1, B1, and C1, acquired (a) at zero delay and (b) at 30 ns delay from the laser pulse.
Sustainability 16 08284 g013
Figure 14. Monochrome images of the scores relating to the first five principal components obtained for the data on C1; from (AE) in the first measurement campaign (July 2022) and from (FJ) in the second (March 2023), (KM) are finally the first three components from the delayed LIF measurement (March 2023).
Sustainability 16 08284 g014
Figure 15. Spectra obtained for the data from the first measurement campaign (July 2022) on C1.
Sustainability 16 08284 g015
Figure 16. Fluorescence map at 340 nm for the data from the first measurement campaign (July 2022) on C1.
Sustainability 16 08284 g016
Figure 17. LIT results normalised between 0 and 1 using square wave heating excitation. From left—the first frequencies represent the fundamental frequency while the second and third frequencies represent the first and second harmonic, respectively.
Sustainability 16 08284 g017
Figure 18. Preliminary results of data overlapping: (a) a schematic representation of the workflow adopted for the preliminary creation of a tool for multilayering visualisation; (b) AF–AI map registered on 3D model texture.
Sustainability 16 08284 g018
Figure 19. Painting image (a) with the integration of NMR (b) and AF–AI images in two frequency bands (c,d). Image processing procedure by threshold application and binary monochrome restitution. The two combined images (e,f) indicate in darker (purple) regions the zones where superposition occurs.
Sustainability 16 08284 g019
Figure 20. Overlay of the results of LIT and visible images for a frequency of 0.005 Hz: (a) overlay of amplitude and visible images; (b) overlay of phase and visible images.
Sustainability 16 08284 g020
Figure 21. Overlapping procedure of fluorescence image of the 310 nm band with the wide-band acoustic image (a). The combined image (b) indicates in darker yellow the zones where superposition occurs.
Sustainability 16 08284 g021
Figure 22. Rendering of the diagnostic metadata on the 3D model.
Sustainability 16 08284 g022
Disclaimer/Publisher’s Note: The statements, opinions and data contained in all publications are solely those of the individual author(s) and contributor(s) and not of MDPI and/or the editor(s). MDPI and/or the editor(s) disclaim responsibility for any injury to people or property resulting from any ideas, methods, instructions or products referred to in the content.

