Sizing a System for Treating Effluents from the Mozambique Sugar Cane Company

 , ,
, ,
Abstract
:1. Introduction
2. Materials and Methods
2.1. Description of Sugar Industry Effluents
2.2. Sample Collection and Analysis
2.3. Effluent Treatment Techniques
2.3.1. Activated Sludge
2.3.2. UASB Reactor
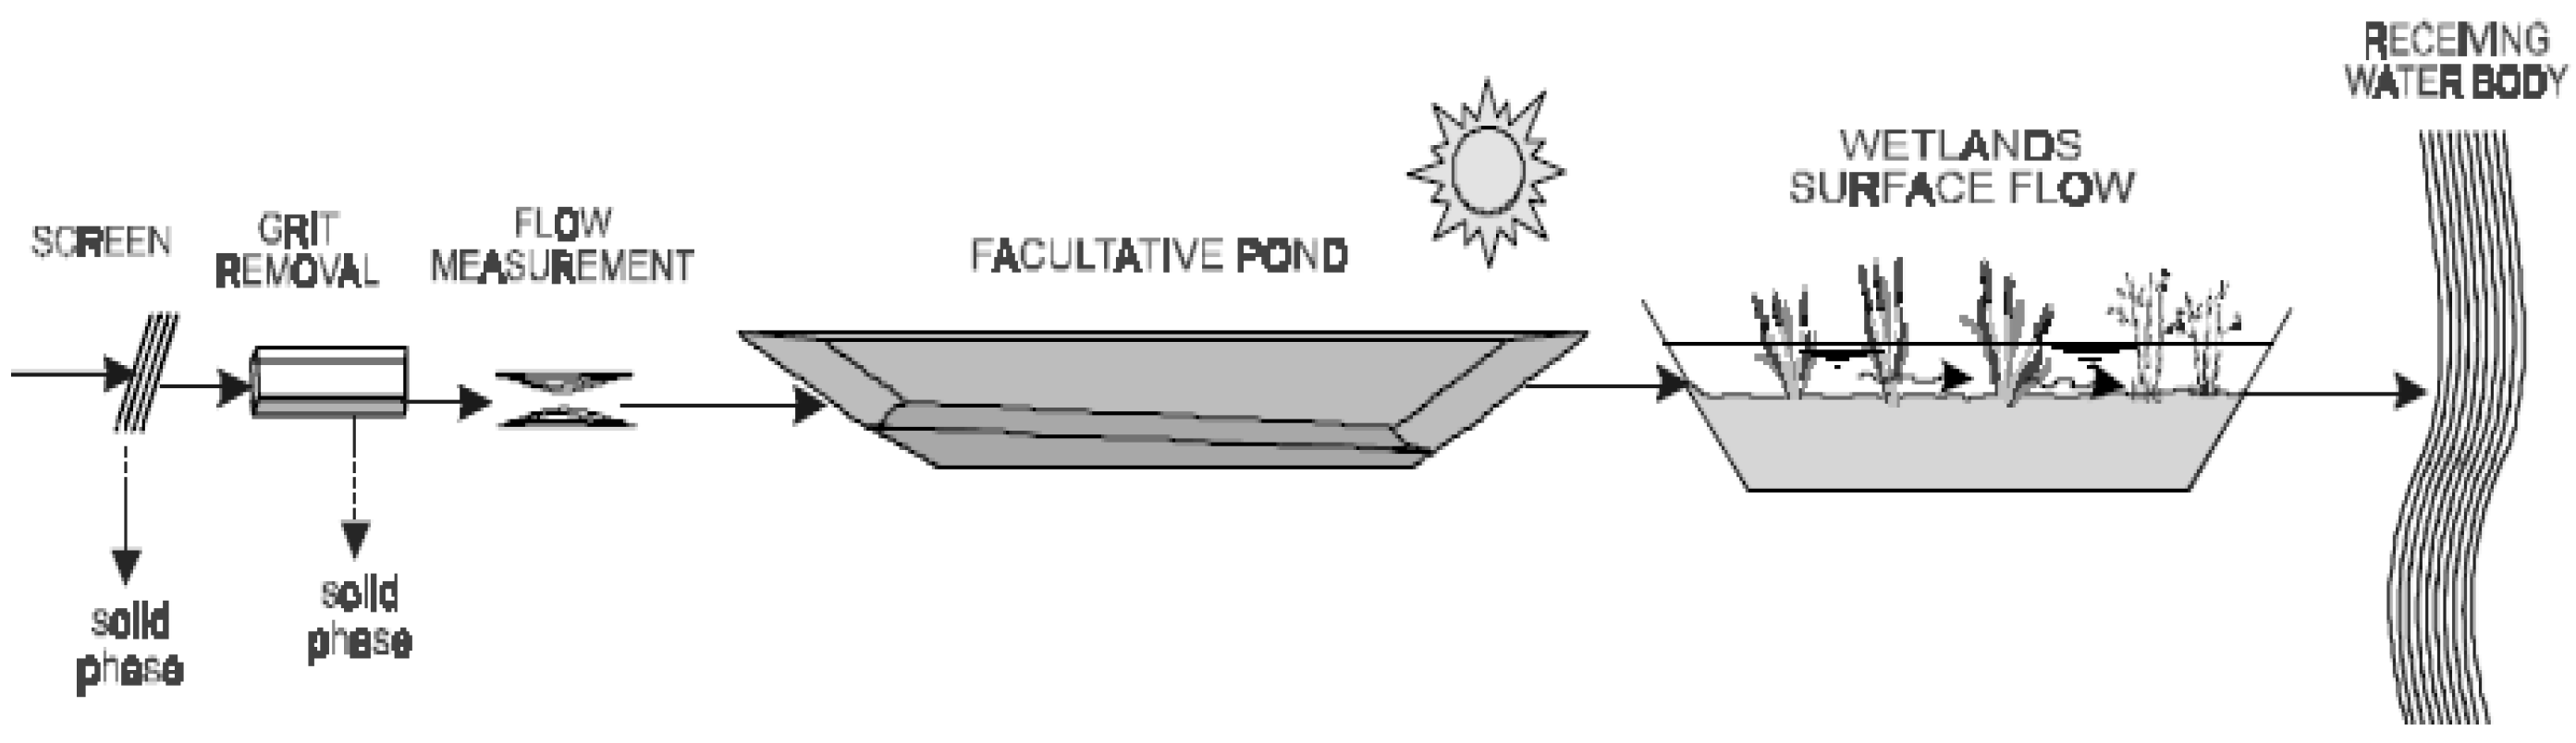
2.3.3. Wetlands
3. Results
- Maximum flow: 24,000 m3/day
- Maximum BOD concentration: 731.67 mg/L
- Maximum COD concentration: 1351 mg/L
3.1. Removal Efficiency by Lagoon Type
3.2. Lagoon Numbers Calculation
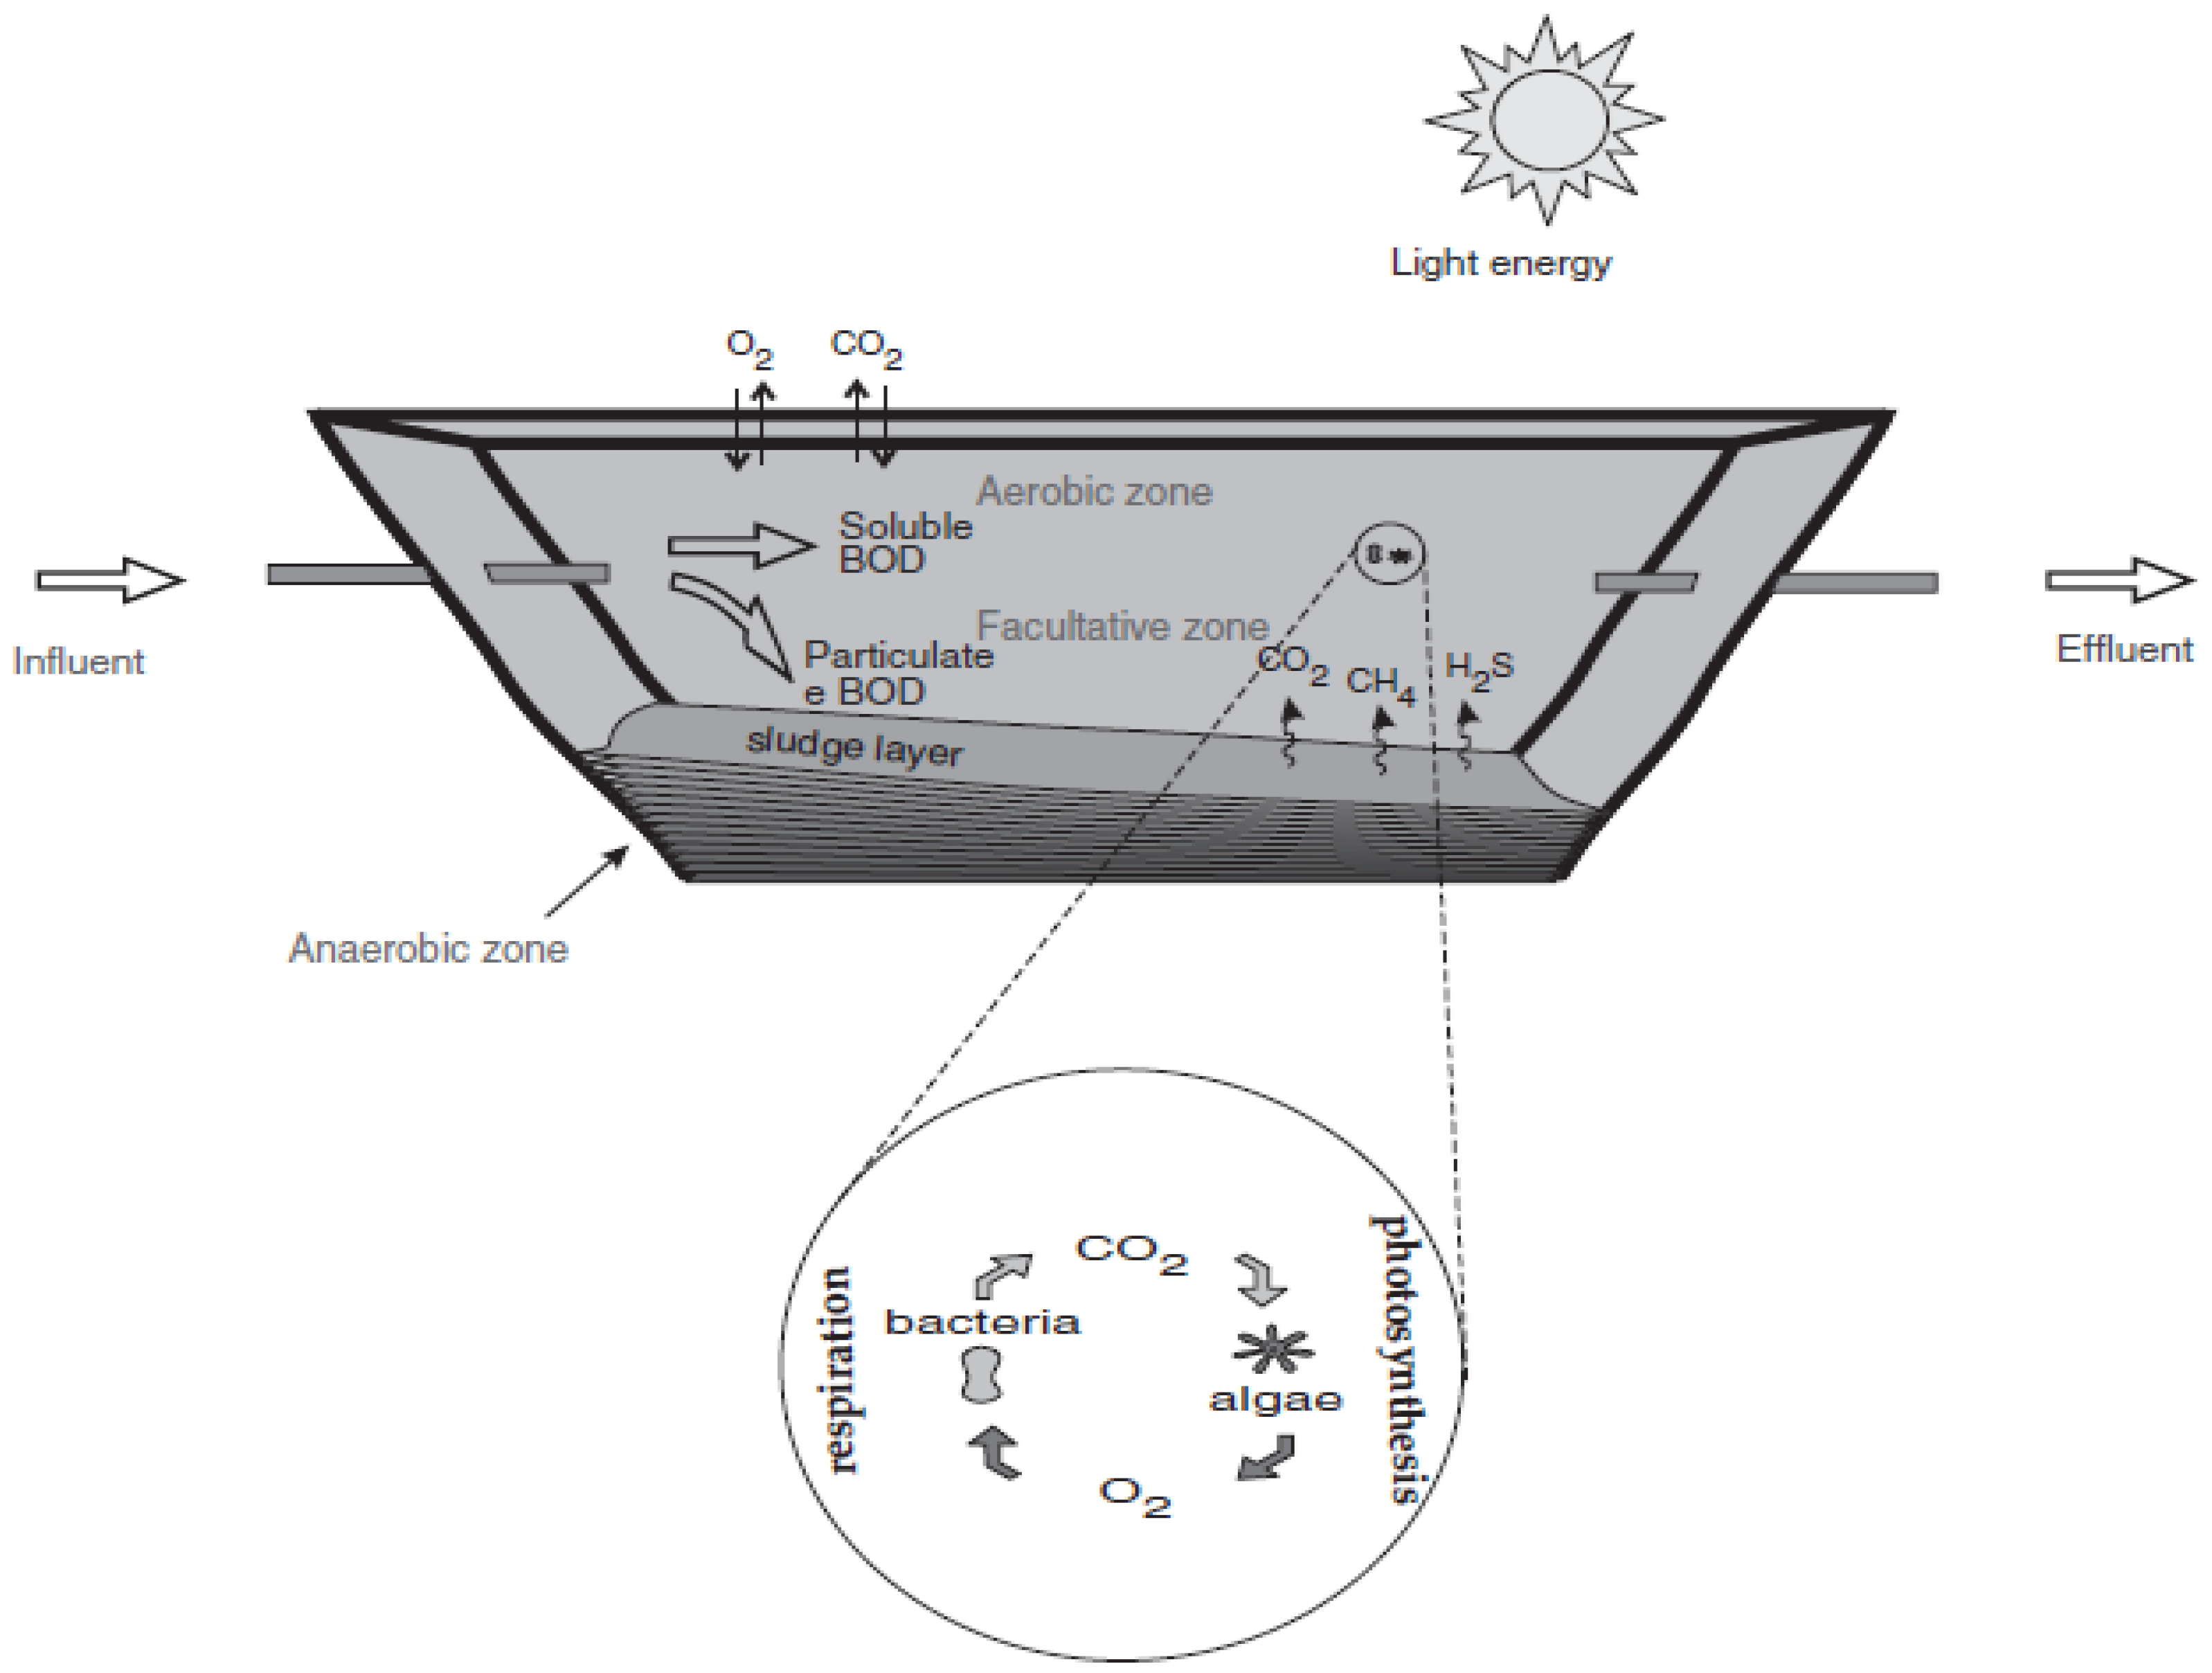
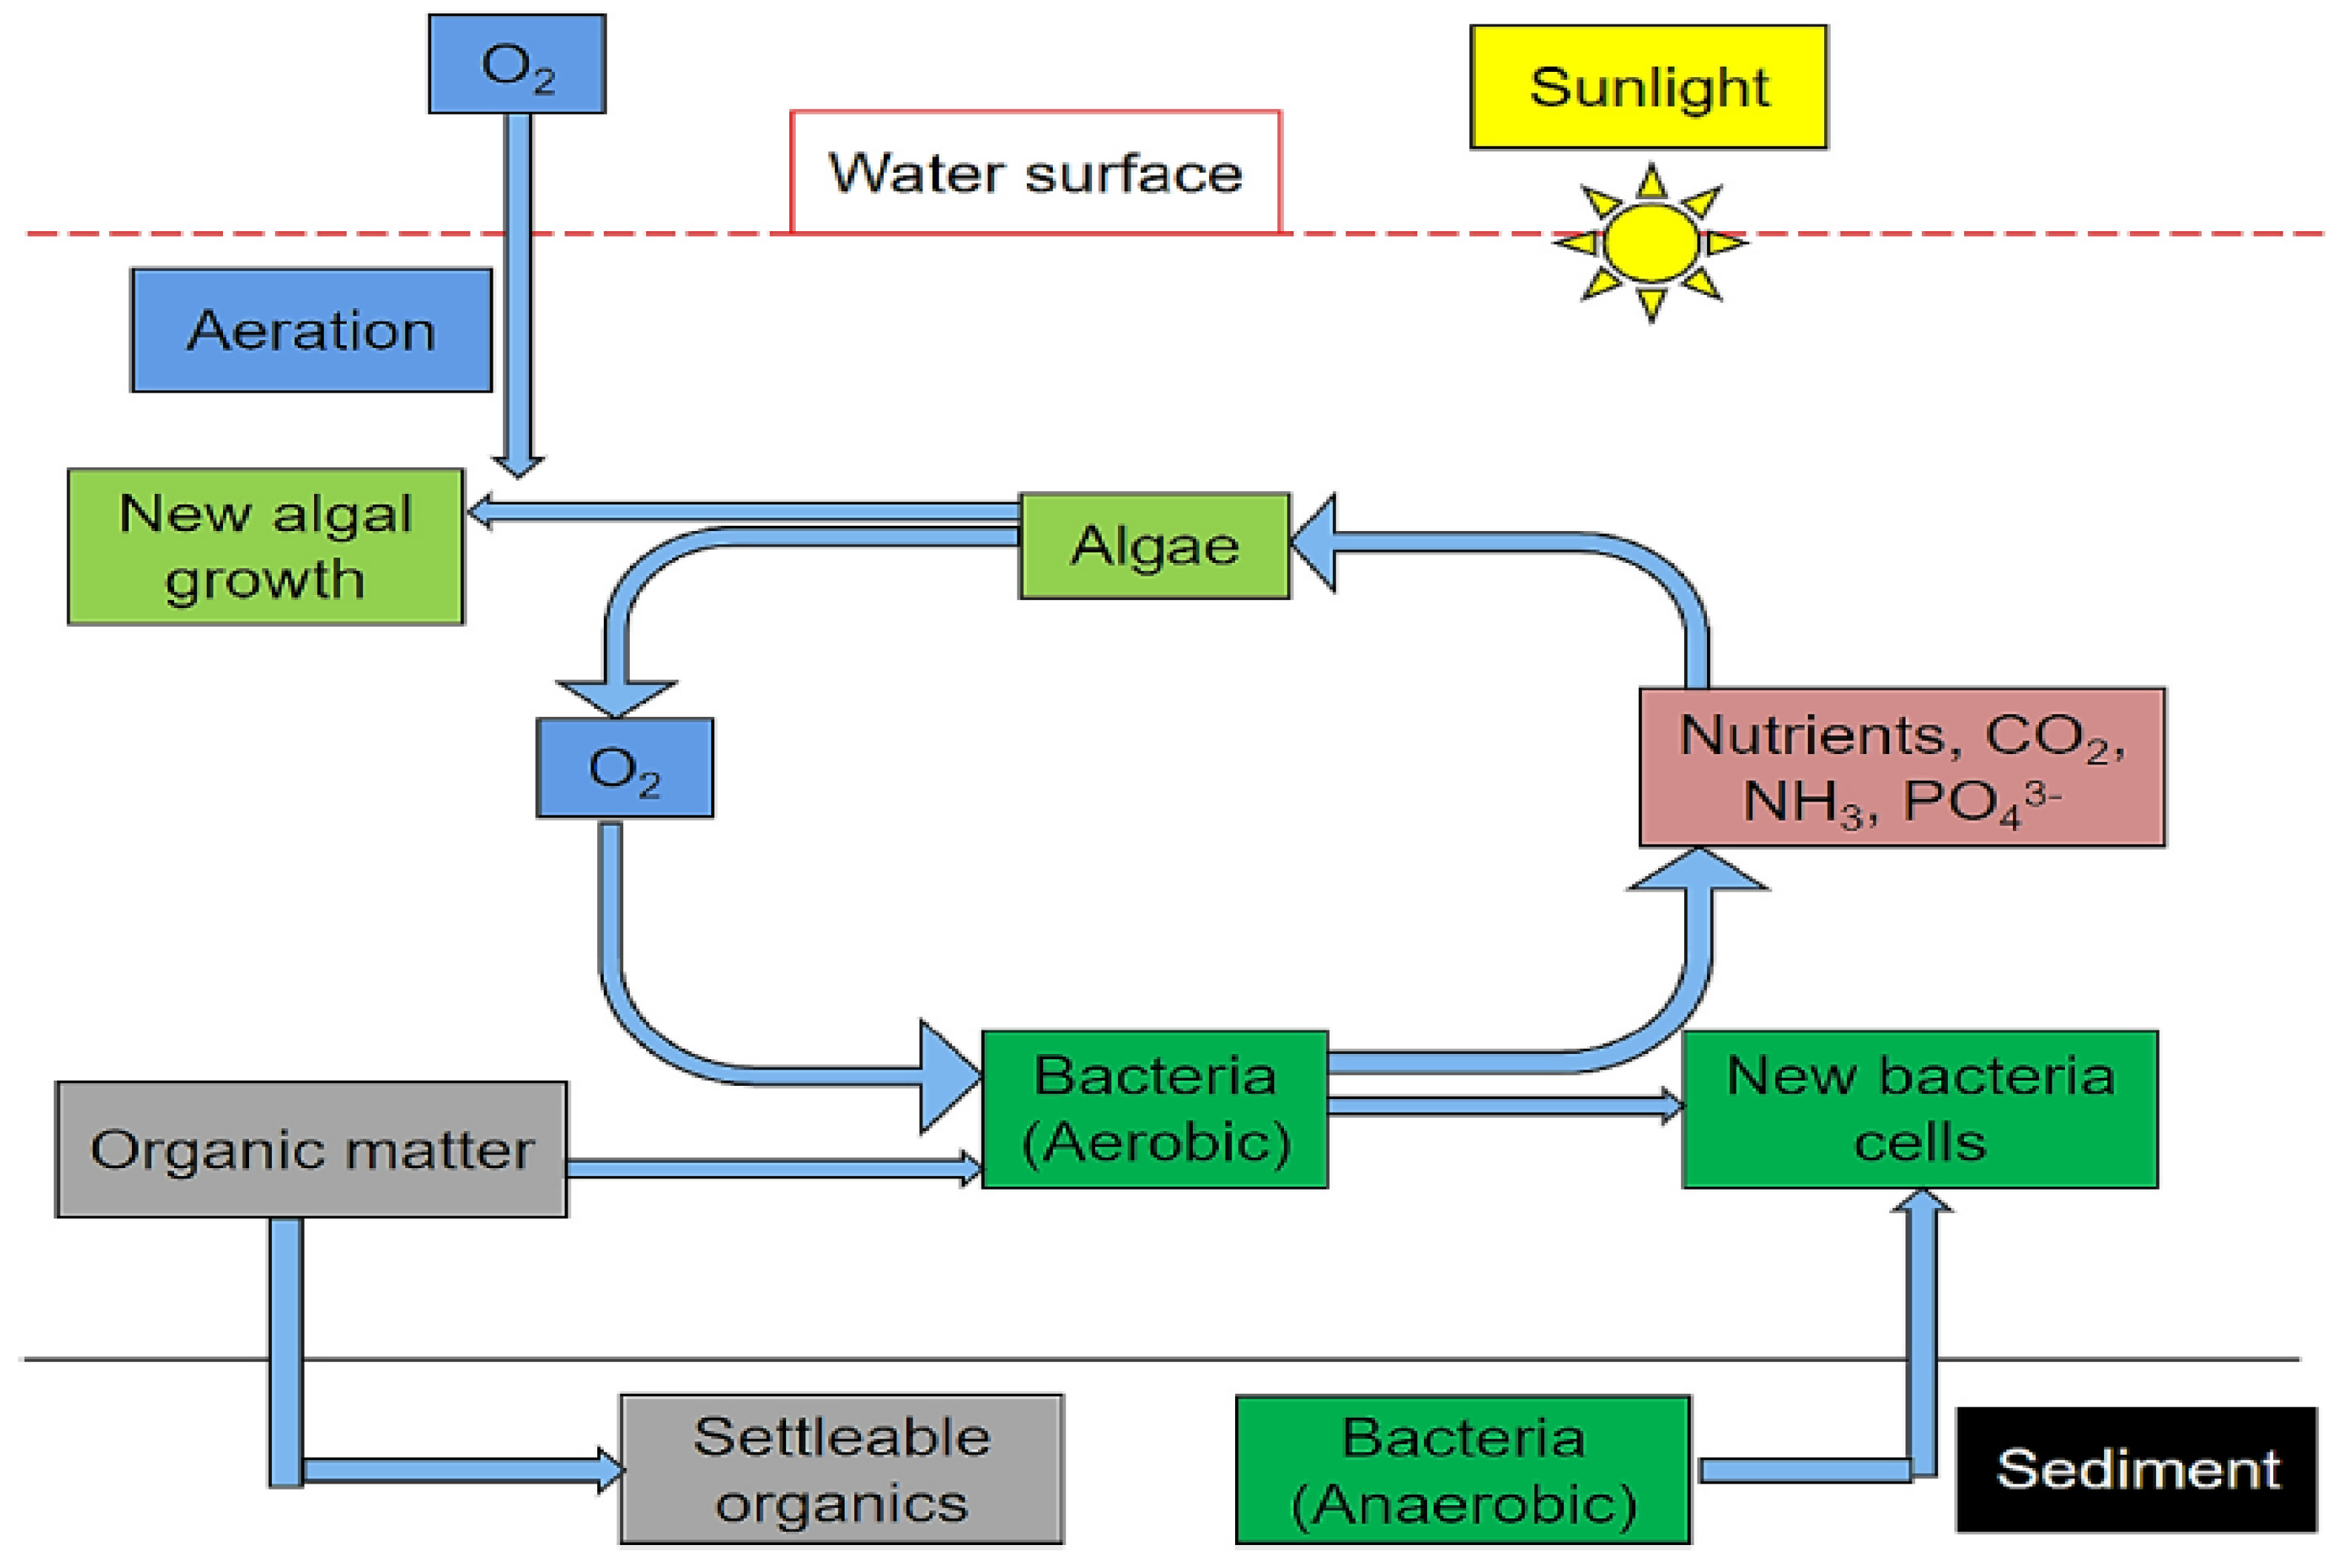
3.3. Biological Treatment in Stabilisation Ponds
3.4. Alternative Technologies Evaluated
3.5. Advantages and Disadvantages
3.5.1. Advantages of Using Stabilization Pond Systems
3.5.2. Disadvantages of Using This Type of Stabilization Pond System
4. Conclusions
Author Contributions
Funding
Institutional Review Board Statement
Informed Consent Statement
Data Availability Statement
Conflicts of Interest
References
- Almeida, J.S.; Sousa, L.V.; Silva, E.P. Sistema de Tratamento de Águas Residuárias de Laticínios. In Anais do 3° Simpósio de TCC; Faculdades FINOM e Tecsoma: Paracatu, Brazil, 2020; pp. 617–630. [Google Scholar]
- Pereira, F.J. A Concepção e Eficiência do Sistema de Esgotamento Sanitário de João Pessoa–PB com ênfase na estação de tratamento do baixo paraíba, outubro de 2018. Universidade Federal Da Paraíba—Ufpb Centro De Tecnologia—Ct Curso De Engenharia Ambiental Trabalho De Conclusão De Curso. 2024. Available online: https://repositorio.ufpb.br/jspui/bitstream/123456789/24457/1/TCC%20Felipe%20Julião%20Pereira.pdf (accessed on 15 August 2024).
- Meghana, M.; Shastri, Y. Sustainable valorization of sugar industry waste: Status, opportunities, and challenges. Bioresour. Technol. 2020, 303, 122. [Google Scholar] [CrossRef] [PubMed]
- Ungureanu, N.; Vladut, V.; Biris, S.-S. Sustainable Valorization of Waste and By-Products from Sugarcane Processing. Sustainability 2022, 14, 11089. [Google Scholar] [CrossRef]
- Pierossi, M.; Bernhardt, H.W. Sugarcane Leaves and Tops: Their Current use For Energy and Hurdles to be Overcome, Particularly in South Africa, for Greater Utilisation. Proc. S. Afr. Sug. Technol. Ass. 2016, 89, 350–360. [Google Scholar]
- Muguirrima Vasco Mariano, P.; Rafael Penicela, N.C.; León Zerpa, F.A.; Mendieta Pino, C.A. Avaliação das Proriedades Fisico-Quimicas dos Efluentes da Companhia Açucareira de Moçambique. 2024. Available online: https://accedacris.ulpgc.es/handle/10553/130860 (accessed on 15 August 2024).
- Matos, M.P. Effect of Binomial Time-Temperature of Sample Incubation on Biochemical Oxygen Demand Diffusion of Wastewater. Master’s Dissertation, Federal University of Viçosa, Minas Gerais, Brazil, 2012. [Google Scholar]
- Matos, M.P. Efeito de Binomio Tempo-Temperatura de Incubação da Amostra na Demanda Bioquimica de Oxigenio Difusão de Águas Residuárias. Disertação de Mestrado, Universidade Fedareal de Viçosa, Minas Gerais, Brazil, 2012. [Google Scholar]
- Batista, N.B.S.; Aguiar, A. Estudo de Parâmetros Fisico-Químicos e suas correlações para efluentes de Laticínios do estado de Minas Gerais. In Proceedings of the XXII Encontro Latino Americano de Iniciação Científica, XVIII Encontro Latino Americano de Pós-Graduação e VIII Encontro de Iniciação à Docência-Universidade do Vale do Paraíba, São José dos Campos, Brazil, 25–26 October 2018. [Google Scholar]
- Muguirrima, P.V.M.; Chirinza, N.P.; Grande, S.C.; Mendieta Pino, C.A.; León Zerpa, F.; Pérez Báez, S.O.; Martín, A.R. Tratamiento de efluentes domésticos mediante métodos bioflitro sostenibles. In Proceedings of the X Jornadas Iberoamericanas de Innovación Educativa en el ámbito de las TIC y las TAC, Las Palmas de Gran Canaria, Spain, 16–17 November 2023. [Google Scholar]
- Alprol, A.E.; Mansour, A.T.; Ibrahim, M.E.E.D.; Ashour, M. Artificial Intelligence Technologies Revolutionising Wastewater Treatment: Current Trends and Future Prospective. Water 2024, 16, 314. [Google Scholar] [CrossRef]
- Apoorva, D.; Chandrashekar, B. Treatment of Sugar Industry Wastewater by Adsorption method. Int. Res. J. Mod. Eng. Technol. Sci. 2022, 4, 1693–1699. [Google Scholar]
- Von Sperling, M. Introdução à qualidade das águas e ao tratamento de esgotos. In Princípios do Tratamento Biológico de Águas Residuárias, 3rd ed.; Departamento de Engenharia Sanitária e Ambiental-DESA, Universidade Federal de Minas Gerais: Belo Horizonte, Brazil, 2005; Volume 1, 452p. [Google Scholar]
- Batista, N.B.S.; Aguiar, A. Study of physicochemical parameters and their correlations for dairy effluents in the state of Minas Gerais. In Proceedings of the XXII Latin American Scientific Initiation Meeting, XVIII Latin American Postgraduate Meeting and VIII Teaching Initiation Meeting-University of Vale do Paraíba, São José dos Campos, Brazil, 12–14 December 2018. [Google Scholar]
- Marzec, M.; Listosz, A.; Malik, A.; Kulik, M.; Jóźwiakowski, K. Organic Pollutants Removal in a Hybrid Constructed Wetland Wastewater Treatment Plant with an Aeration System. Water 2024, 16, 947. [Google Scholar] [CrossRef]
- Naz, I.; Ahmad, I.; Aslam, R.W.; Quddoos, A.; Yaseen, A. Integrated Assessment and Geostatistical Evaluation of Groundwater Quality through Water Quality Indices. Water 2023, 16, 63. [Google Scholar] [CrossRef]
- de Campos, S.X.; Soto, M. The Use of Constructed Wetlands to Treat Effluents for Water Reuse. Environments 2024, 11, 35. [Google Scholar] [CrossRef]
- Younas, F.; Mustafa, A.; Farooqi, Z.U.R.; Wang, X.; Younas, S.; Mohy-Ud-Din, W.; Hameed, M.A.; Abrar, M.M.; Maitlo, A.A.; Noreen, S.; et al. Current and emerging adsorbent technologies for wastewater treatment: Trends, limitations, and environmental implications. Water 2021, 13, 215. [Google Scholar] [CrossRef]
- Von Sperling, M. Lagoas de estabilização. In Princípios do Tratamento Biológico de Águas Residuárias, 2nd ed.; Departamento de Engenharia Sanitária e Ambiental-DESA, Universidade Federal de Minas Gerais: Belo Horizonte, Brazil, 2002; Volume 3, 196p. [Google Scholar]
- Von Sperling, M. Lodos ativados. In Princípios do Tratamento Biológico de Águas Residuárias, 1st ed.; Departamento de Engenharia Sanitária e Ambiental-DESA, Universidade Federal de Minas Gerais: Belo Horizonte, Brazil, 1997; Volume 4, 428p. [Google Scholar]
- Panhwar, A.; Kandhro, A.; Bhutto, S.; Brohi, N.; Naz, S. Chemical Treatment Options of Wastewater from Sugarcane Industry and its Priority Parameters Comparison as Per Smart Rules of Sindh Environmental Protection Agency. Pak. J. Sci. 2021, 73. [Google Scholar] [CrossRef]
- Tolêdo, C.S.S. Tratameto de Efluentes Industriais: Uma Revisão de Fundamentos e Aplicações. In Proceedings of the XVI CNEG_Congresso Nacional de Excelência em Gestão; INOVARSE_Simpósio de Inovação e Responsabilidade Social, Rio de Janeiro, Brasil, 14–16 July 2022. [Google Scholar]
- Chernicharo, C.A.L.; Van Lier, J.B.; Noyola, A.; Bressani Ribeiro, T. Anaerobic sewage treatment: State of the art, constraints and challenges. Rev. Environ. Sci. Biotechnol. 2015, 14, 649–679. [Google Scholar] [CrossRef]
- IMPACTOS na Saúde e no Sistema Único de Saúde Decorrentes de Agravos Relacionados a um Saneamento Ambiental Inadequado; Fundação Nacional de Saúde: Brasília, Brazil, 2010; 246p.
- Zaharia, C.; Musteret, C.-P.; Afrasinei, M.-A. The Use of Coagulation-Flocculation for Industrial Coloured Wastewater Treatment-(I) The Application of Hybrid Materials. Appl. Sci. 2024, 14, 2184. [Google Scholar] [CrossRef]
- Montero, A.A.G.; Arrieta, Y.M.B.; Serrano, E.V.P. Treatment of Slaughterhouse Wastewater through a Series System: Upflow Anaerobic Reactor and Artificial Wetland. Water 2024, 16, 700. [Google Scholar] [CrossRef]
- Maria, M.P.; Torres, N.H.; Nascimento, V.R.S.; Chagas, T.S.A.; Saratale, G.D.; Mulla, S.I.; Bharagava, R.N.; Cavalcanti, E.B.; Ferreira, L.F.R. Current advances in the brewery wastewater treatment from anaerobic digestion for biogas production: A systematic review. Environ. Adv. 2023, 13, 100394. [Google Scholar] [CrossRef]
- Bao, Y.; Koutavarapu, R.; Lee, T.G. Derivation of Optimal Operation Factors of Anaerobic Digesters through Artificial Neural Network Technology. Systems 2023, 11, 375. [Google Scholar] [CrossRef]
- Mendieta-Pino, C.A.; Garcia-Ramirez, T.; Ramos-Martin, A.; Perez-Baez, S.O. Experience of Application of Natural Treatment Systems for Wastewater (NTSW) in Livestock Farms in Canary Islands. Water 2022, 14, 2279. [Google Scholar] [CrossRef]
- das Neves, A.P.N.; Ferreira, D.d.S.; Castro, D.A.; Cavallini, G.S. Avaliação da eficiência de remoção de matéria orgânica em efluente sanitário em função da idade do lodo de reator UASB: Um estudo de caso. J. Biotechnol. Biodivers. 2019, 7, 449–456. Available online: https://sistemas.uft.edu.br/periodicos/index.php/JBB/article/view/7832 (accessed on 26 May 2023). [CrossRef]
- Mendoza-Tinoco, T.P.; Sánchez-Vázquez, V.; del Carmen Fajardo-Ortiz, M.; González, I.; Beristain-Cardoso, R. How does a low-magnitude electric field influence anaerobic digestion in wastewater treatment? A review. Chemosphere 2023, 325, 138402. [Google Scholar] [CrossRef] [PubMed]
- Khumalo, S.M.; Bakare, B.F.; Rathilal, S.; Tetteh, E.K. Characterisation of South African Brewery Wastewater: Oxidation-Reduction Potential Variation. Water 2022, 14, 1604. [Google Scholar] [CrossRef]
- Ribeiro, T.; Janz, F.J.L.; Vizibelli, D.; Borges, J.C.Â.; Borssoi, J.A.; Fukumoto, A.A.F.; Bergamasco, R.; Yamaguchi, N.U.; Pereira, E.R. Magnetic Natural Coagulants for Plastic Recycling Industry Wastewater Treatability. Water 2023, 15, 1276. [Google Scholar] [CrossRef]
- Ramírez, L.E.F.; Zamora-Castro, S.A.; Sandoval-Herazo, L.C.; Herrera-May, A.L.; Salgado-Estrada, R.; De La Cruz-Dessavre, D.A. Technological Innovations in the Application of Constructed Wetlands: A Review. Processes 2023, 11, 3334. [Google Scholar] [CrossRef]
- García-Valero, A.; Acosta, J.A.; Faz, Á.; Gómez-López, M.D.; Carmona, D.M.; Terrero, M.A.; El Bied, O.; Martínez-Martínez, S. Swine Wastewater Treatment System Using Constructed Wetlands Connected in Series. Agronomy 2024, 14, 143. [Google Scholar] [CrossRef]
- Gehling, G. Lagoas de Estabilização; Universidade Federal do Rio Grande do Sul: Farroupilha, Brazil, 2017. [Google Scholar]
- Brasil Ministério do Desenvolvimento Regional; Agência Nacional de Águas E Saneamento Básico. Atlas Esgoto/Ministério do Desenvolvimento Regional, ANA; Ministério do Desenvolvimento Regional: Brasília, Brazil, 2020. [Google Scholar]
- Mara, D.D. Design Manual for Waste Stabilisation Ponds in INDIA; Lagoon Tecnology International Ltd.: Leeds, UK, 1997. [Google Scholar]
- Korniłłowicz-Kowalska, T.; Bohacz, J.; Rybczyńska-Tkaczyk, K.; Jóźwiakowski, K. Evaluation of the Richness, Species Diversity, and Biosafety of Saprotrophic Fungal Communities in Constructed Wetlands and Biological Wastewater Ponds. Water 2023, 15, 31. [Google Scholar] [CrossRef]
- Wilkinson, S.R.; Naeth, M.A.; Dhar, A. Potential of Macrophytes for Wastewater Remediation with Constructed Floating Wetlands in Cold Climates. Water 2023, 15, 2479. [Google Scholar] [CrossRef]
- Bachi, O.E.; Halilat, M.T.; Bissati, S.; Al-Ansari, N.; Saggai, S.; Kouadri, S.; Najm, H.M. Wastewater Treatment Performance of Aerated Lagoons, Activated Sludge and Constructed Wetlands under an Arid Algerian Climate. Sustainability 2022, 14, 6503. [Google Scholar] [CrossRef]
- de Almeida, P.R.C.; da Costa, M.R.; de Souza Coutinho, R.D.; Méndez-Vicente, A.; Castro, J.P.; Monteiro-Neto, C.; de Almeida Tubino, R.; Correia, A.T. Use of otolith microchemistry signatures to assess the habitat use of Centropomus undecimalis in lagoon systems of the southwest Atlantic. Reg. Stud. Mar. Sci. 2024, 73, 103470. [Google Scholar] [CrossRef]
- Jeon, W.H.; Lee, S.H.; Moon, H.S.; Kim, Y.; Chang, S.W.; Hwang, S. Impacts of pumping on the spatiotemporal dynamics of a fresh-saline water mixing zone in a coastal lagoon-aquifer system. J. Hydrol. Reg. Stud. 2024, 51, 101657. [Google Scholar] [CrossRef]
- Gebru, S.B.; Werkneh, A.A. Applications of constructed wetlands in removing emerging micropollutants from wastewater: Occurrence, public health concerns, and removal performances—A review. S. Afr. J. Chem. Eng. 2024, 48, 395–416. [Google Scholar] [CrossRef]
- Filho, F.J.C.M.; de Souza Filho, J.C.M.; Paulo, P.L. Multistage constructed wetland in the treatment of greywater under tropical conditions: Performance, operation, and maintenance. Recycling 2021, 6, 63. [Google Scholar] [CrossRef]
- Su, H.; Wang, K.; Lian, J.; Wang, L.; He, Y.; Li, M.; Han, D.; Hu, Q. Advanced treatment and Resource recovery of brewery wastewater by Co- cultivation of filamentous microalga Tribonema aequale and autochthonous Bacteria. J. Environ. Manag. 2023, 348, 119285. [Google Scholar] [CrossRef]
- Menció, A.; Madaula, E.; Meredith, W.; Casamitjana, X.; Quintana, X.D. Dataset for analysing and modelling the eutrophication processes in groundwater-coastal lagoon systems: The La Pletera lagoons case study (NE Spain). Data Brief 2023, 48, 109197. [Google Scholar] [CrossRef] [PubMed]
- Vymazal, J. Constructed wetlands for wastewater treatment. Water 2010, 2, 530–549. [Google Scholar] [CrossRef]
- Kochi, L.Y.; Freitas, P.L.; Maranho, L.T.; Juneau, P.; Gomes, M.P. Aquatic macrophytes in constructed wetlands: A fight against water pollution. Sustainability 2020, 12, 9202. [Google Scholar] [CrossRef]
- Macário, M.; Saraiva, A.; Ferreira, E.; Ferreira, L.F.; Oliveira, M. O Bambu Como Alternativa aos Sistemas de Tratamento de Águas Residuais Convencionais. Vol. 8 N.º 3. Edição Temática: Ciências Naturais e do Ambiente. 2020. Available online: https://revistas.rcaap.pt/uiips/article/view/21341 (accessed on 15 August 2024).
- Zheng, Y.; Song, Y.; Zhang, R.; Zhang, N.; Salah, M.; Cheng, S.; Li, Y.; Wang, Q.; Li, C.; Li, F. A feasible method for the composition analysis and chemical remediation of clogging matter in subsurface flow constructed wetland. Water Cycle 2024, 5, 131–136. [Google Scholar] [CrossRef]
- Zhu, X.; Qie, R.; Luo, C.; Zhang, W. Assessment and Driving Factors of Wetland Ecosystem Service Function in Northeast China Based on InVEST-PLUS Model. Water 2024, 16, 2153. [Google Scholar] [CrossRef]
- Lemenkova, P. Artificial Intelligence for Computational Remote Sensing: Quantifying Patterns of Land Cover Types Around Cheetham Wetlands, Port Phillip Bay, Australia. J. Mar. Sci. Eng. 2024, 12, 1279. [Google Scholar] [CrossRef]


| Parameters | Pump | Boilers | Workshops | Decree 18/2004 |
|---|---|---|---|---|
| Temperature (°C) | 45 | 50 | 40 | ≤24 |
| PH | 6.34 | 8.13 | 6.96 | 6–9 |
| Hardness (mg/L) | 240.63 | 490.20 | 177.13 | |
| Alkalinity (mg/L) | 187.00 | 215.00 | 138.33 | |
| Chlorides (mL/g) | 105.60 | 172.63 | 81.43 | |
| TDS (mg/L) | 1392.00 | 1174.67 | 1137.00 | |
| TSS (mg/L) | 17.33 | 25.67 | 22.00 | 50 |
| Turbidity (NTU) | 9.15 | 11.16 | 15.03 | |
| BOD (m/L) | 731.67 | 628.00 | 675.00 | 50 |
| COD (m/L) | 1048.67 | 991.33 | 1351.00 | 250 |
| Conductivity (S/cm) | 2.49 | 1.96 | 7.83 | |
| Phosphate (mg/L) | 11.91 | 16.22 | 16.23 | 2 |
| Nitrogen (mg/L) | 14.11 | 10.58 | 11.39 | 10 |
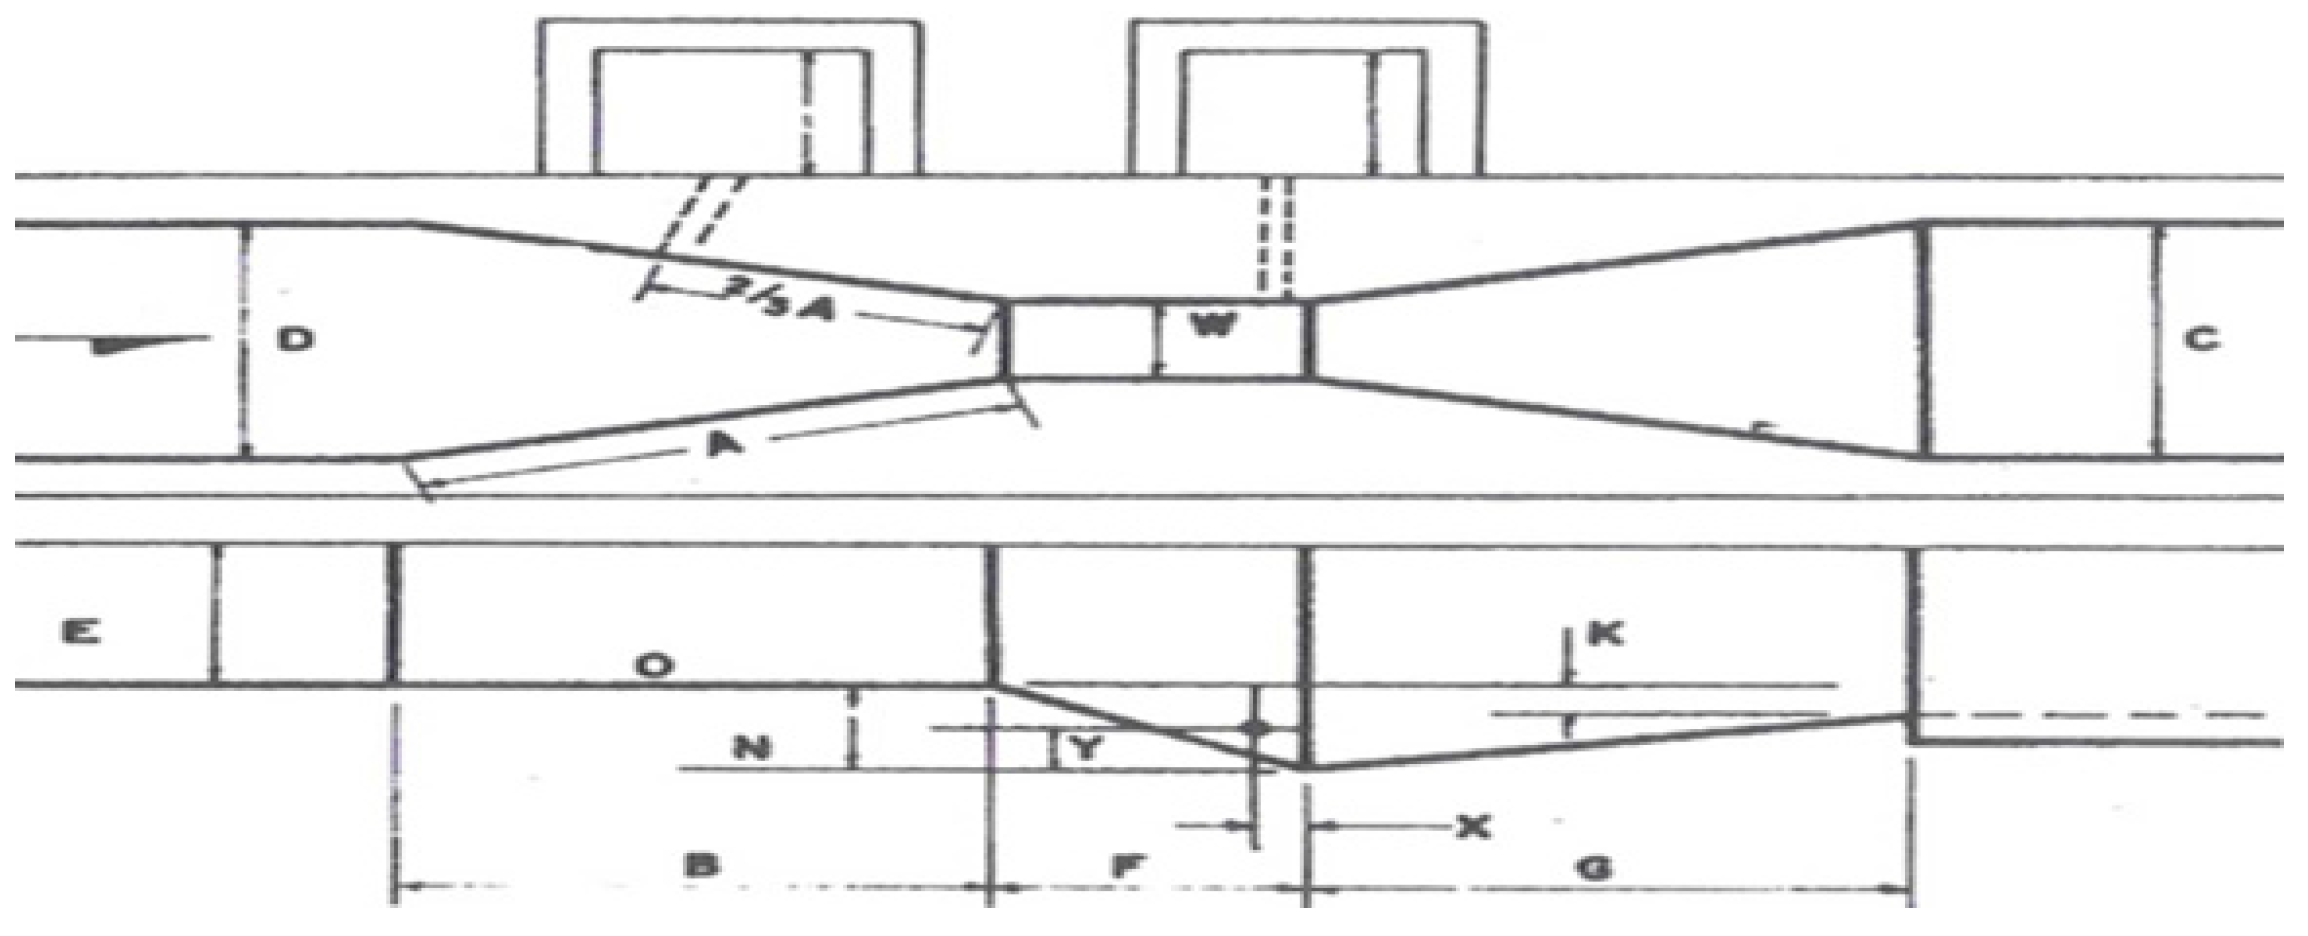
| Throat (W) | W (m) | n | k |
|---|---|---|---|
| 3″ | 0.076 | 1546 | 0.176 |
| 6″ | 0.152 | 1580 | 0.381 |
| 9″ | 0.229 | 1530 | 0.535 |
| 1″ | 0.305 | 1522 | 0.690 |
| 2″ | 0.610 | 1550 | 1.426 |
| 3″ | 0.915 | 1566 | 2.182 |
| 4″ | 1.220 | 1578 | 2.935 |
| 6″ | 1.830 | 1595 | 4.515 |
| 8″ | 2.440 | 1606 | 6.101 |
| Average Temperature of the Lagoon in the Coldest Month (°C) | Detention Time (d) | |
|---|---|---|
| Start of Plan | End of Plan | |
| ≤20 | ≥4 | ≤6 |
| >20 | ≥3 | ≤5 |
| Average Temperature in Lagoon in a Cold Month (°C) | BOD Removal Efficiency % |
|---|---|
| ≤20 | ≤50 |
| >20 | ≤60 |
| Lagoon Number Calculations | |
|---|---|
| Number of Anaerobic lagoons | 2.11 |
| Number of Facultative lagoons | 2.46 |
| Number of Aerobic lagoons | 1.79 |
Disclaimer/Publisher’s Note: The statements, opinions and data contained in all publications are solely those of the individual author(s) and contributor(s) and not of MDPI and/or the editor(s). MDPI and/or the editor(s) disclaim responsibility for any injury to people or property resulting from any ideas, methods, instructions or products referred to in the content. |
© 2024 by the authors. Licensee MDPI, Basel, Switzerland. This article is an open access article distributed under the terms and conditions of the Creative Commons Attribution (CC BY) license (https://creativecommons.org/licenses/by/4.0/).
Share and Cite
Muguirrima, P.; Chirinza, N.; Zerpa, F.A.L.; Perez Baez, S.O.; Pino, C.A.M. Sizing a System for Treating Effluents from the Mozambique Sugar Cane Company. Sustainability 2024, 16, 8334. https://doi.org/10.3390/su16198334
Muguirrima P, Chirinza N, Zerpa FAL, Perez Baez SO, Pino CAM. Sizing a System for Treating Effluents from the Mozambique Sugar Cane Company. Sustainability. 2024; 16(19):8334. https://doi.org/10.3390/su16198334
Chicago/Turabian StyleMuguirrima, Paulino, Nicolau Chirinza, Federico A. Leon Zerpa, Sebastian Ovidio Perez Baez, and Carlos Alberto Mendieta Pino. 2024. "Sizing a System for Treating Effluents from the Mozambique Sugar Cane Company" Sustainability 16, no. 19: 8334. https://doi.org/10.3390/su16198334
APA StyleMuguirrima, P., Chirinza, N., Zerpa, F. A. L., Perez Baez, S. O., & Pino, C. A. M. (2024). Sizing a System for Treating Effluents from the Mozambique Sugar Cane Company. Sustainability, 16(19), 8334. https://doi.org/10.3390/su16198334