Abstract
The effect of digital finance on the income disparity between urban and rural areas has attracted wide attention from scholars, and this paper focuses on the mediating role of employment structural transformation, which can contribute more insights to address regional development imbalances and achieve common prosperity. Taking panel data of China’s province from 2010 to 2020 as a sample, we use the fixed effect model to integrally test the relationship between the three factors. Our findings indicate that (1) the development of digital finance significantly narrows the urban–rural income gap. The digital finance index increased by 1% and the rural–urban income gap decreased by about 0.34%. The results still hold after considering the endogeneity problem and a series of robustness tests; (2) mechanism analysis shows that digital finance could reduce the urban–rural income gap through the employment structural transformation; and (3) the results of regional heterogeneity show that the reduction effect of digital finance on the urban–rural income gap is stronger in areas with high marketization and in northern regions. Such insights can assist the government in strategically developing rural digital finance, thereby expediting the reduction of regional inequalities and achieving sustainable economic growth. Additionally, the government should focus on guiding rural employment structure transformation to better realize the reduction effect of digital finance on the urban–rural income gap.
1. Introduction
Since the initiation of reform and opening-up policies, China has pursued a development strategy focused on urban areas and prioritizing the advancement of heavy industry. This strategy has resulted in a significant influx of capital and labor into urban areas. While China has achieved remarkable economic growth, this approach has also led to pronounced disparities in development between urban and rural areas. (Urban areas encompass both cities and towns. Cities refer to urban areas within municipal districts, cities without district administration, or administrative regions of cities and districts where residents’ committees and other areas directly connected to the actual construction are located. Towns, on the other hand, denote areas outside urban districts, including county seats and other townships where residents’ committees and other regions directly linked to governmental constructions are situated. Villages, as delineated here, refer to areas beyond the designated urban and town zones. The residential income data utilized in this paper are sourced from the National Bureau of Statistics. It categorizes the population into urban and rural populations based on their habitual residence (habitual residence refers to residing continuously for more than one year and serving as the center of their livelihood). Notably, urban residents enjoy considerably higher incomes compared to their rural counterparts. (Since 1978, China has implemented an urban-centered development strategy that prioritizes the development of heavy industry, which has resulted in a massive influx of capital and manpower into the cities. While China’s economic development has made great achievements, the imbalance between urban and rural development still exists. The proportion of poor rural residents is still larger than that of urban residents). The longstanding imbalance in urban–rural income distribution has been a crucial factor influencing social stability and economic development [1]. The substantial urban–rural income gap may potentially trigger severe societal issues and affect China’s sustainable development. Therefore, narrowing the development gap between urban and rural areas is an urgent issue for realizing sustainable development in China.
Digital finance, often referred to as Internet finance, represents an innovative financial model in which traditional financial institutions and internet enterprises use internet and information and communication technology to offer financing, payment, investment, and information intermediary services to individuals in both rural and urban areas. It can overcome the dependence of traditional finance on physical outlets, with greater geographical penetration and low-cost advantages. Expanding business in rural areas has also really become an important strategy for some Internet finance companies, and these companies such as Ant Gold Service and Jingdong Finance have set up special rural finance departments to provide digital finance to the countryside. Rural financial institutions accounted for 82.49 percent of China’s banking and financial institutions in 2021, an increase of 24.35 percent compared with 2016. In 2021, small and micro-enterprise loans from China’s financial institutions totaled CNY 72.11 trillion, of which loans from rural financial institutions accounted for 32.33%, an increase of 14.23% compared with 2016. According to the “Analysis Report on China’s Inclusive Finance Indicators (2020)”, banking and financial institutions processed a total of 14.223 billion mobile payment transactions in rural areas in 2020, marking a 41.41% increase. Additionally, non-bank payment institutions handled 467.042 billion online payment transactions in rural areas, up 5.99% year-on-year. These figures indicate that the coverage of digital financial services in rural areas is gradually expanding.
Many scholars have studied the impact of traditional finance (such as inclusive finance) on urban–rural income gap [2,3,4]. Hindered by basic conditions, traditional finance encounters repeated obstacles in implementation, making it difficult to achieve the original intention of benefiting the entire population [3,4]. Recent studies have examined the impact of the digital economy on the urban–rural income gap [5,6,7]. For example, Tu et al. used the entropy method to measure the development of the digital economy, internet accessibility, and digital integration applications in China, assessing the impact of the digital economy on regional development imbalances. Their findings indicate that the development of the digital economy has significantly reduced the urban–rural income gap [6]. However, there has been limited research specifically focusing on digital finance.
Some scholars have explored how digital finance affects the urban–rural income gap [5,8,9,10,11,12,13,14,15,16,17,18,19], but no consensus has been reached. There are mainly three viewpoints. Some academics find that digital finance is an equalizer that can take into account equity without compromising efficiency, and play a positive effect in improving credit availability, driving domestic demand, reducing the incidence of poverty, and narrowing the urban–rural income gap [20,21,22]. For example, Shankha et al. examined the impact of digital financial development on income inequality using data from Iran and found that financial development has a narrowing effect on urban–rural income disparity [8]. However, some scholars have reached the opposite conclusion. For instance, McKinnon and Shaw argued that financial repression exists in most developing countries, which will lead to a large degree of imbalance in the allocation of credit resources and hinder economic growth [9]. Guvenen et al. put forward the theory that the imperfection of capital markets will exacerbate the gap between the rich and the poor [11]. Achdou et al. (2022) came to a similar conclusion [10]. Levine conducted an empirical analysis of Thailand’s financial development using data from 1976 to 1996, and their findings indicated that financial development resulted in an increased urban–rural income gap [13]. Baiardi and Morana similarly found that financial development widened income inequality [14]. Additionally, some studies have argued a nonlinear relationship between digital financial development and the urban–rural income gap. Khan et al. modified the Galor–Zeira model and found that the impact of rural financial development on the urban–rural income gap exhibits an inverted “U-shaped” relationship, concluding that financial development can significantly widen the disparity before reaching the threshold and the urban–rural income gap will be narrowed after reaching the threshold [12]. Ratnawati built a dynamic model of financial development and income distribution based on the Kuznets hypothesis and their findings also revealed an inverted “U-shaped” relationship between the two [15].
Research on the mechanism of the impact of digital finance on the urban–rural income gap primarily focuses on the perspective of innovation and entrepreneurship. The development of digital finance has improved the access to rural information, met farmers’ credit needs, and strengthened social trust through a certain mechanism. This ultimately stimulates entrepreneurial behavior among farmers, leading to increased entrepreneurial performance and narrowing the urban–rural income gap [16]. Zhang et al. examined the mediating role of entrepreneurship and the results showed that the impact of digital finance development on entrepreneurship varied between urban and rural areas, which significantly promotes entrepreneurial activities in rural areas but has no effect on urban residents. This suggests that the development of digital finance narrows the urban–rural income gap by increasing entrepreneurial income in rural areas [17]. Luo and Zeng investigated the mediating role of enterprise innovation and their findings indicated that digital finance significantly promoted innovation in enterprises [18]. Sub-indices of digital finance development (coverage breadth, depth of use, digital support services) also have significant positive effects on enterprise entrepreneurship. The economic benefits brought by innovation and business expansion in rural enterprises can create more employment opportunities, contributing to a narrowing of the urban–rural income gap. Additionally, some scholars have discussed the mechanisms from other perspectives. For example, Gimet and Lagoarde discovered that digital finance significantly reduces the urban–rural income gap, with labor income distribution as a key moderating factor [19].
The current literature offers a substantial theoretical basis for this study. However, a review of the literature reveals that there are still gaps that need addressing, which can be summarized as follows: First, existing studies on the impact of financial development on the urban–rural income gap have primarily focused on traditional finance [2,3,4]. Only a limited number of studies have investigated the impact of the development of digital finance on the urban–rural income gap [23,24]. Digital finance, incorporating internet technologies such as big data and cloud computing, has outperformed traditional finance in aspects such as financial reach, utilization depth, and cost-efficiency. Literature on the impact of digital finance development on the urban–rural income gap requires further supplementation. Second, current research predominantly explores phenomena such as the widening of the urban–rural income gap and the “inverted U-shape” [25,26,27] or “U-shape” changes (For instance, Zhang et al. (2022) established that the urban–rural income disparity exhibits a positive U-shaped curve with air pollution. Similarly, Zhang et al. (2023) identified a U-shaped relationship between polycentric spatial structures and the urban–rural income gap. Additionally, Li et al. (2023) demonstrated that transport accessibility exerts a U-shaped impact on urban–rural income disparities within Chinese cities, wherein improved transport accessibility initially narrows the income gap before widening it) [28,29,30]. There is a scarcity of scholars studying the recent trend of the ongoing reduction in the urban–rural income gap in China over the past decade. Moreover, there is a dearth of empirical analyses exploring the factors that contribute to this emerging trend. Third, most existing literature investigating the mechanism of digital finance’s impact on the urban–rural income gap only focuses on innovation and entrepreneurship [16,17]. In the context of further breaking down the urban–rural dual system and strong flow of factors, there is limited research investigating the role and mechanisms of employment structure transformation.
This paper aims to provide systematic empirical evidence within a unified framework regarding the relationship among digital finance, employment structural transformation, and urban–rural income gap. It seeks to address the following questions: How does the development of digital finance in China impact the urban–rural income gap through the crucial channel of employment structural transformation? What are the regional differences in this impact? Empirical findings indicate that the development of digital finance has narrowed the urban–rural income gap and employment structural transformation plays an important mediating role of which. Heterogeneous results suggest that the reduction effect of digital finance on the urban–rural income gap is stronger in areas with high marketization and in northern regions.
In comparison to existing literature, this study contributes to three strands of literature: Firstly, different from the literature on traditional finance, this study is based on the latest stage of financial development-digital finance and utilizes data from the recent decade to investigate the impact of digital finance on the urban–rural income gap. Secondly, different from the current literature on the phenomenon of urban and rural income expansion or “inverted U-shaped” and “U-shaped” changes, this paper addresses the trend of the ongoing reduction in the urban–rural income gap over the past decade, and empirically explores the effects of digital finance development and employment structure transformation on the urban–rural income gap and conducts heterogeneous analyses from multiple perspectives. Thirdly, regarding the mechanism, this paper empirically investigates the mediating role of employment structural transformation in the relationship between the development of digital finance and urban–rural income disparity, which helps to enrich the related research.
The structure of the subsequent content in this paper is organized as follows: the Section 2 consists of theoretical analysis and research hypotheses; the Section 3 constructs econometric models, explains the variables, and provides detailed explanations of data sources; the Section 4 provides empirical results and analysis; the Section 5 outlines the key conclusions and policy implications.
2. Theoretical Analysis and Research Hypotheses
2.1. The Impact of Digital Finance Development on the Urban–Rural Income Gap
It is widely acknowledged that the development of finance can affect the urban–rural income disparity through mechanisms of a threshold effect, disequilibrium effect, and poverty alleviation effects [31]. Essentially, threshold and disequilibrium effects reflect financial exclusion, while the poverty alleviation effect is a consequence of reducing this exclusion. Numerous factors contribute to financial exclusion. For instance, low-income households often lack collateral and credit histories, leading financial institutions to deny them credit or charge them high interest rates on loans. This threshold effect prevents rural households from securing necessary financial support, trapping them in a “financial services dilemma” [32]. In addition, artificial barriers further limit access to credit for small businesses and vulnerable households, worsening income inequality [33]. Financial exclusion is especially prevalent in rural regions characterized by weak economic development and remote locations [34]. Numerous studies suggest that mitigating financial exclusion in these areas can significantly narrow the urban–rural income disparity [3,25,26,27,28,29,30,31,32,33,34,35,36].
Sarma methodically classified the different forms of financial exclusion into five specific types: opportunity exclusion, market exclusion, conditional exclusion, price exclusion, and self-exclusion [37]. Digital finance addresses these exclusions in several ways. By delivering financial services via the internet and mobile devices, digital finance eliminates geographical constraints [38]. This approach allows residents in rural and remote areas to access the same financial services available to urban dwellers through mobile payments and online banking, significantly enhancing financial accessibility and alleviating opportunity exclusion [39]. Digital finance extends its services to long-tail users who are typically overlooked by conventional financial markets [40]. Traditional financial institutions typically focus on high-value customers, whereas digital platforms can serve a broader array of small and dispersed clients through internet technology. For example, micro-loans and crowdfunding platforms provide new financing channels for small businesses and individuals who have traditionally struggled to obtain funding, thereby reducing market exclusion [41]. Digital finance employs artificial intelligence and big data to analyze information from users’ online shopping activities and social media. This allows digital platforms to gather valuable information and accurately assess credit risk, addressing the issue of rural users being excluded due to insufficient credit records and mitigating conditional exclusion [17]. Furthermore, digital finance also leverages technology to reduce the cost of financial services [3]. Unlike traditional financial institutions with their physical branches and labor-intensive services, digital platforms operate with lower overhead costs, enabling them to offer services at reduced fees [42]. For instance, platforms like Alipay have much lower transaction costs compared to traditional financial institutions, rendering financial services more budget-friendly and thereby reducing price exclusion [43]. Lastly, digital finance improves user trust and understanding of financial services through user-friendly interfaces and educational outreach. By leveraging e-commerce platforms and social media, digital finance not only offers financial services but also educates users on how to use them, thus addressing self-exclusion [44].
In addition, China’s vast territory encompasses regions with varying economic levels, cultural environments, and degrees of marketization [45]. These factors influence the extent to which digital finance can reduce the urban–rural income gap across different areas. Thus, this paper formulates the following research hypotheses:
H1a.
The development of digital finance can narrow the urban–rural income gap.
H1b.
The effect varies by region.
2.2. The Mediating Mechanism of Employment Structural Transformation
According to structural change theory, economic development involves a shift from agriculture-based sectors to industry and service-oriented sectors [46]. Digital finance accelerates this transition by providing enhanced access to capital for businesses and entrepreneurs in emerging sectors [41]. It plays a crucial role in the digital transformation of traditional industries by offering embedded financial services, often in the form of assets, technology, and information, which are essential production factors [17]. By developing digital platforms, digital finance promotes the upgrading of various segments within the industrial chain, driving the overall digital transformation of businesses and facilitating employment transformation [47]. For example, JD.com’s digital platform not only supports e-commerce but also integrates financial services such as supply chain financing. This integration allows suppliers and small businesses to enhance their operations and become more competitive, leading to job creation in high-value sectors and contributing to higher incomes. Particularly since the COVID-19 pandemic, digital finance has enabled a V-shaped income rebound for 12 million small stores in China, highlighting a significant gap in operational talent [48]. In summary, the development of digital finance has driven a structural transformation in employment by advancing the digital transformation of traditional industries. This, in turn, has contributed to narrowing the income gap between urban and rural areas.
The development of digital finance has diverse effects on the employment structure across different industries in China [49]. From an industry perspective, the traditional primary sector is highly vulnerable to irregular natural disasters, making it challenging to mitigate production risks [50]. Additionally, these traditional agricultural activities often exhibit diminishing marginal returns on investment and decreasing income elasticity, leading to the migration of farmers from rural to urban areas [51]. With the advancement of digital finance, farmers’ access to financial services has significantly improved, resulting in substantial changes to their productive activities [52]. On one hand, the development of digital finance facilitates crop and livestock farmers in obtaining financial support to expand their businesses and upgrade production tools. On the other hand, the growth of digital finance encourages farmers to invest in the value-added processing of primary agricultural products, which increases the demand for employees in the secondary sector [53]. These factors contribute to the shift of the agricultural workforce towards non-agricultural sectors, leading to increased rural household incomes and consequently narrowing the urban–rural income gap. Thus, the following research hypotheses are proposed:
H2.
Digital financial development can narrow the urban–rural income gap by promoting employment structural transformation.
The relationship between digital finance development, employment structural transformation and the urban–rural income gap is shown in Figure 1:
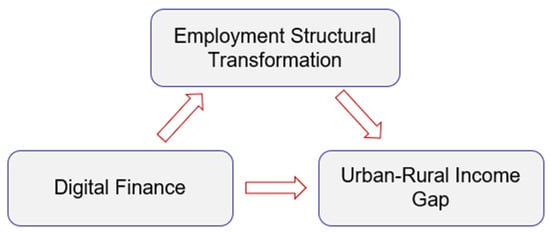
Figure 1.
Relationship frame.
3. Research Design
3.1. Variable Definition
3.1.1. Dependent Variable
The urban–rural income gap (). The existing literature employs various ways to measure the urban–rural income gap, such as the Gini coefficient and the Theil index. Referring to Chen and Lin, this paper quantifies the urban–rural income gap using the ratio of per capita disposable income. (The per capita disposable income of urban residents and the per capita net income of rural residents, both derived from the “China Statistical Yearbook”, serve as comprehensive primary indicators reflecting the actual income levels of households. These indicators encompass various sources of income, including wage income, net operating income, net property income, and net transfer income, and are calculated for all family members, including full-time homemakers and children. Urban and rural residents are defined by their habitual residence, with urban residents referring to those living in urban areas for more than half a year, and rural residents similarly defined. In 2013, the National Bureau of Statistics altered the calibre of “per capita net income of rural residents” to “per capita disposable income of rural residents” in line with “per capita disposable income of urban residents”. Consequently, the indicator of the per capita net income of rural residents essentially corresponds to the per capita disposable income of rural residents [1,30,54]. A larger value indicates a greater urban–rural income gap [6].
3.1.2. Core Explanatory Variable
Digital financial development (). Referring to the practice of Luo and Zeng, this paper utilizes The Peking University Digital Financial Inclusion Index of China for the years 2011 to 2020 to reflect the digital financial development in various provinces. The index is a composite index that takes into account the systematic, balanced, multilevel and diversified services of financial inclusion along with Internet technology. It is composed of three sub-indices: breadth of coverage, depth of use, and degree of digitization [1]. The breadth of coverage measures the extent to which the new model of Internet plus finance breaks through geographical constraints to provide financial services to low-income groups. The depth of use measures how users actually use Internet finance such as payment, money fund, credit, and insurance. The degree of digitization assesses the low cost, convenience, and accessibility of digital finance. The index involves a total of 33 specific indicators, which are compiled using the analytic hierarchy process, and the specific framework is shown in Table 1. In addition, we use three sub-indexes to regress in the robustness test. We take the natural logarithm.

Table 1.
Measurements of digital finance.
3.1.3. Mediating Variable
Employment structural transformation (). The development of digital finance can drive the digital transformation of various industries in China, creating new job opportunities. It will facilitate the transition of agricultural workers to non-agricultural sectors, narrowing the urban–rural income gap. Referring to the practice of Liu et al. [55], this article selects the ratio of employed individuals in the secondary and tertiary industries to the total employed population as a proxy variable for employment structural transformation.
3.1.4. Control Variables
Economic Development Level (). The existing literature has shown that economic development’s spillover effects will narrow the urban–rural income gap [6]. To control the influence of each province’s economic development level in this study, we use gross regional product per capita as a control variable and take its natural logarithm referring to the practice of Liu et al. [55].
Level of Economic Openness (). Studies have shown that the level of economic openness affects the urban–rural income gap through factors such as factor flow and industrial structure [5], and most of the pieces of literature choose foreign direct investment (FDI) as the proxy variable. Referring to the practice of Ben, this study measures it by the ratio of total utilized foreign direct investment (FDI) to GDP of each region, wherein the total utilized foreign direct investment of each region is converted from USD units to RMB units using the average annual exchange rate [54].
Proportion of Financial Support for Agriculture (). Li et al. showed that financial expenditure with a rural bias can have a positive impact on the income of rural areas and mitigate the inequality between urban and rural areas [30]. Referring to the practice of Liu et al., this study uses the proportion of agricultural financial expenditure to total expenditure in each province to represent the proportion of financial support for agriculture [55].
Human Capital (). The existing literature has shown that urban–rural income disparities may arise from differences in the returns on human capital investment due to the unequal distribution of educational resources [5], and most studies use the level of higher education as the indicator of human capital investment. This article measures human capital by taking the ratio of the number of students in various schools to the total population in each province at the end of the year.
Industrial Structure (). Based on the literature of Tu et al. [6], the transformation of the laborers from the agricultural industry to the non-agricultural industry will lead to changes in the income of rural and urban sectors, thereby affecting the urban–rural income gap. This article measures industrial structure by the proportion of non-agricultural industry output value to GDP in each province.
The full variable names and measurements are listed in Table 2.
Table 2.
Variable names and measurements.
3.2. Methodology
3.2.1. Benchmark Model
In order to test the effect of digital finance on the urban–rural income gap of China, we first use the Hausman test to determine whether a fixed effects model or a random effects model should be used. The results show that the p-value is 0.000 less than 0.05, which strongly rejects the original hypothesis, and the fixed-effects model is applied in this paper. The two-way fixed effects model is used as the basic model [56], as shown in Formula (1):
In Equation (1), the subscript denotes province and represents years. is the dependent variable, signifying the urban–rural income gap. is the intercept term, and − are the coefficients of the independent variables; is the core independent variable in this paper, signifying digital finance’s development. The variables represents a series of control variables that reflect important economic and social characteristics of the provinces. The multicollinearity results of the variables are presented in Appendix A, Table A1. The results indicate that the maximum VIF is 2.50, much less than 10, so there is no need to worry about multicollinearity. The results of the pairwise correlations are shown in Appendix A, Table A2. represents province-fixed effects, represents time-fixed effects. is the random error term. If is tested as significantly negative, it supports the conclusion that digital financial development narrows the urban–rural income gap, i.e., is justified. The two-way fixed effects model mitigates the issues arising from omitted variables, measurement error and reverse causality that exist in the model.
3.2.2. Mechanism Test Model
The theoretical analysis above shows that the development of digital finance can drive the digital transformation of various industries in China, optimize and upgrade traditional industries, give rise to new industries, and create new jobs, thus promoting the transformation of people engaged in agricultural production to non-agricultural ones, optimizing the structure of rural employment, and narrowing the income gap between rural and urban areas. Due to the endogeneity of the three-step mediating model, the mechanism test in this paper only investigates the impact of digital finance on the mechanism variables to alleviate endogeneity issues [57]. Therefore, the equation is as follows:
Based on the new mechanism test method, we only need to focus on whether the regression coefficient of the core explanatory variable to the mediating variable is significant and aligns with the expectation.
3.3. Data
This study utilizes panel data from Chinese provinces for the years 2011–2020, consisting of a total of 310 samples from 31 provinces (including autonomous regions and municipalities directly under the central government). The primary data sources for this research are the annual “China Statistical Yearbook”, “China Regional Economic Yearbook”, and the statistical yearbooks of individual provinces (regions, municipalities). Missing data are supplemented by referring to provincial statistical yearbooks and government work reports. The digital finance data are sourced from the Peking University Digital Financial Inclusion Index of China for the years 2011 to 2020. This index is based on transaction account data from Ant Group, specifically Alipay transaction accounts, providing a comprehensive reflection on the development and inclusion of digital finance in China. Descriptive statistics for all variables are presented in Table 3.
Table 3.
Descriptive statistics.
Moreover, we capture the negative correlation between digital finance and the rural–urban income gap in Figure 2 using a fitting line.
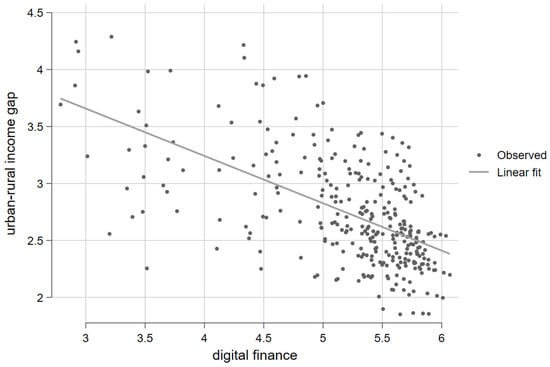
Figure 2.
Fitting line indicating the negative association of digital finance and urban–rural income gap.
4. Empirical Results and Discussion
4.1. Baseline Regression Results
Based on the baseline model, we estimate the overall effects of digital financial development on the urban–rural income gap. A stepwise regression approach is employed to mitigate potential endogeneity bias arising from omitted variables. After controlling for important economic and social characteristics of provinces, the results are shown in Table 4. In column (1), only the digital financial development is included, and the estimation is carried out using a two-way fixed-effects model. The result indicates that the coefficient of digital financial development is significantly positive at the 1% level. In columns (2) to (5), this paper sequentially introduces the control variables mentioned above that influence the urban–rural income gap. The results show that the coefficient of the core independent variable remains significantly negative at the 1% or 5% level, validating Hypothesis H1a.
Table 4.
Baseline regression results.
According to the theoretical analysis presented earlier, this article interprets these empirical results as follows: digital financial development advanced the integration of financial services with the internet, making inclusive finance more accessible and tangible. On the one hand, both enterprises and households will reduce their cash holdings with the improvement of financial accessibility, leading to more savings flowing into the financial system and being channeled into productive investments in rural areas. It ultimately boosts the economic development in rural regions. On the other hand, digital finance development can provide credit and insurance services related to agriculture, forestry, animal husbandry, and fisheries, establishing effective financial risk mitigation mechanisms. This, in turn, contributes to alleviate rural poverty and narrow the urban–rural income gap.
According to the results, the coefficient of the economic development level () is significantly negative at the 1% statistical level. This is because areas with higher economic growth rate experience more economic spillover effects, generating more job opportunities and extending the benefits of economic development to rural populations. It also helps increase the income of low-income groups and narrow urban–rural income gap. The coefficient of the FDI () is significantly negative at the 10% statistical level, indicating that introducing foreign capital helps narrow the urban–rural income gap. This is primarily because the foreign investment currently brought into China is labor-intensive, which increases the demand for low-skilled labor. The coefficient of human capital () is negative but not significant. It is possibly due to the measurement of human capital is based on the number of students in universities, which are mostly concentrated in urban areas, making this variable statistically insignificant for narrowing the urban–rural income gap. However, in the long term, with China’s growing emphasis on rural education and continuous efforts in education support for poverty alleviation, rural areas are expected to have better education opportunities and human capital. The coefficient of financial support for agriculture () is significantly negative at the 5% statistical level. This suggests that government financial support for agriculture can rationally adjust the production structure in rural areas. It can enhance the operational efficiency of agricultural production and reduce the urban–rural income gap by increasing farmers’ agricultural income. The coefficient of industrial structure () is positive but statistically insignificant.
4.2. Endogeneity
In order to overcome the endogeneity problem, it is a common practice to look for variables that satisfy the two conditions of correlation and orthogonality as instrumental variables, so in this paper we propose to choose the lagged one-period and lagged two-period values of the core independent variables as instrumental variables. From the results in Table 5, it can be observed that the instrumental variables chosen in this paper do not suffer from issues such as weak instrument, under-identification, and over-identification. Column (1) in Table 5 shows that, after addressing endogeneity, the significance levels of the independent variables are closely consistent with the baseline regression. Furthermore, as this paper uses panel data, it is necessary to account for issues like autocorrelation and heteroscedasticity introduced by disturbances. The limited information maximum likelihood estimation (LIML) method is employed to obtain the results in column (2). By comparing the results in column (1) and column (2), there is no significant difference between the two methods.
Table 5.
Robustness test—regression results for instrumental variables.
The coefficient for digital financial development () is significantly negative at the 10% level, indicating that digital financial development indeed helps reduce the urban–rural income gap, further confirming Hypothesis H1a. However, the coefficient is notably larger than the baseline regression results, suggesting that the presence of endogeneity issues has underestimated the role of digital financial development in narrowing the urban–rural income gap.
4.3. Robustness Test
4.3.1. Robustness Test: Variable Replacement and Addition
(a) Replacing dependent variable. In addition to the urban–rural income ratio, some scholars have chosen to use the Theil index to measure the urban–rural income gap [55]. The Theil index is an efficient indicator for assessing urban–rural income disparities in China, particularly in terms of income variations at both ends [55]. Therefore, in this paper, the Theil index () (the definition and calculation formula for the Theil index are as follows: , where i = 1, 2, … 31, i represents the 31 provinces, j represents urban or rural areas (with a value of 1 for urban and 2 for rural), represents the income of residents in all urban or rural areas of a given province, represents the total income of all residents in that region, represents the population of urban or rural areas in that region, and represents the total population of that region) will be used as an alternative to the urban–rural income ratio as the dependent variable, and the results are shown in column (1) of Table 6.
Table 6.
Robustness test—regression results for variables replacement and addition.
(b) Replacing core independent variable. Digital finance has emerged from the combination of traditional inclusive finance and internet technology. Therefore, the internet penetration also greatly reflects the level of digital finance. Following the approach of Huang, the internet penetration rate () will be used to replace the inclusive finance index. This variable is calculated by taking the natural logarithm of the count of Internet users [58], and the results are shown in column (2) of Table 6.
(c) Adding control variables. As the level of urbanization increases, on the one hand, it intensifies the competition for urban employment and negatively impact the average level of urban wage. On the other hand, increasing urbanization attracts surplus rural labor and enhances their production skills and efficiency, thereby increasing their wages and narrowing the urban–rural income gap. In addition, the income of retirees is lower than the income of active workers, the income is lower in provinces with a higher rate of retirement. Therefore, the aging of the population should be controlled. In this paper, the urbanization rate () and population aging () will be added as control variables, and the results are shown in column (3) of Table 6. The urbanization rate () is defined as the ratio of urban population to rural population [59], and the population aging () is defined as proportion of population over 60 years of age in total population [60].
From the results in Table 6, it is evident that after substituting the core independent variable, the dependent variable, and adding the control variable, the sign of the regression coefficient for the core explanatory variable has remained unchanged. There are only slight fluctuations in the magnitude and significance level of the coefficient. This demonstrates the reliability of the benchmark regression results.
4.3.2. Robustness Test: Excluding Extreme Values
The baseline regression model includes the analysis of certain exceptional values in specific provinces and years. To eliminate the influence of such outliers on the overall regression, this paper employs both two-tailed truncation and two-tailed trimming methods to deal with outliers. Based on the characteristics of provincial panel data, the values of urban–rural income gap () are first subjected to two-tailed truncation and two-tailed trimming at the 1% quantile level. This process results in a sample that excludes and combines extreme values at the upper and lower 1% quantiles. Subsequently, the regression of the baseline model is performed on this modified sample. The regression results in Table 7 demonstrate that after removing the influence of outliers, the sign of the coefficient for the core explanatory variable remains unchanged. Although the numerical value slightly changes, it still passes the significance test. This further confirms the conclusions of the baseline regression model.
Table 7.
Robustness test—regression results with outlier exclusion.
4.3.3. Robustness Test: Sub-Dimensional Analysis
The explanatory variable used in the benchmark regression is the total digital financial inclusion index, which is calculated from the three sub-dimensions breadth of coverage, depth of usage, and level of digitization through the hierarchical analysis method. In order to alleviate the issue caused by the synthesis of indicators, we use the three sub-dimensions as the core explanatory variables to regress separately, and the results are shown in Table 8. We find that the breadth of coverage, depth of usage, and level of digitization can significantly narrow the income gap between rural and urban areas, which confirms the robustness of the conclusions of this paper.
Table 8.
Robustness test—regression results of sub-dimensions.
4.4. Heterogeneity Analysis
4.4.1. Heterogeneity Analysis: Cultural Environment
With the advancement of the regional economic integration strategy, regional economics are converging on the whole. However, the northern and southern regions have their distinct characteristics due to China’s vast territory and significant north–south cultural differences [45]. Therefore, it is crucial to explore how digital financial development and employment structural transformation effectively narrow the urban–rural income gap within north–south difference context. This paper follows the traditional north–south division standard (with the Qinling–Huaihe Line as the boundary) (the southern region includes 14 provinces: Jiangsu, Anhui, Hunan, Hubei, Sichuan, Yunnan, Guizhou, Guangdong, Guangxi, Fujian, Jiangxi, Zhejiang, Taiwan, and Hainan, as well as the two municipalities of Chongqing and Shanghai. The northern region includes 11 provinces: Shandong, Shanxi, Henan, Hebei, Shaanxi, Gansu, Qinghai, Tibet, Heilongjiang, Jilin, and Liaoning, along with the two municipalities of Tianjin and Beijing. Additionally, there are the Ningxia Hui Autonomous Region, the Inner Mongolia Autonomous Region, and the Xinjiang Uygur Autonomous Region) to classify the provinces of China into northern and southern regions. The regression results are shown in Table 9.
Table 9.
Estimation results of cultural environment heterogeneity.
From Table 9, it can be observed that the digital financial development () significantly reduces the urban–rural income gap in both the northern and southern regions. However, there are differences in the coefficients. Specifically, in both the southern and northern regions, the coefficients for digital financial development are negative, indicating a convergence effect. The degree of convergence varies, with the northern region showing a higher numerical value than the southern region. Several factors contribute to this disparity. First, the economic development is relatively better in the southern region, and rural areas there have better infrastructure, resulting in a smaller initial urban–rural income gap compared to the north. Consequently, digital financial development has a more pronounced impact on narrowing the urban–rural income gap in the northern region. Second, the effectiveness of digital financial services has educational thresholds [61]. The northern region, influenced by Confucian culture, places a strong emphasis on education, making it easier for residents to meet the educational requirements for digital financial services and technology.
4.4.2. Heterogeneity Analysis: Market Environment
China’s market-oriented reforms are extensive, affecting the urban–rural income gap through numerous facets. The degree to which these factors influence the urban–rural income gap varies based on the level of marketization. Given this, this paper utilizes a marketization indicator as a criterion. It calculates the average marketization indicator for each province over time. Provinces with values below or equal to the median marketization index are categorized as low marketization regions, while the remaining areas are designated as high marketization regions.
As shown in Table 10, the coefficient for digital financial development () in low marketization regions is negative but not significant. In high marketization regions, the coefficient is significantly negative, indicating that digital financial development has a noticeable convergence effect on the urban–rural income gap. Generally, regions with high levels of marketization have a multitude of small and micro-enterprises. Previously, these enterprises were excluded from financial services due to resource constraints. They often faced challenges in obtaining financing, which led to their financial distress. With the development of digital finance, these enterprises can now easily access financial services. This not only prevents bankruptcy due to financing difficulties but also contributes to upgrading their industrial structure, improving local employment conditions, and narrowing the urban–rural income gap. In contrast, regions with low levels of marketization typically have a higher proportion of collective and state-owned enterprises, whose industrial and employment structures tend to be more stable. While the benefits of digital financial development are available, the demand for these services is lower, resulting in the urban–rural income gap being less noticeably affected by digital finance in these areas. The two heterogeneity analyses validate research Hypothesis H1b.
Table 10.
Estimation results of market environment heterogeneity.
4.5. Mechanism Test
The above-mentioned benchmark regression results confirm the convergence effect of digital finance on the income gap between rural and urban areas; however, there exists an indirect physical mechanism of this effect. To assess whether digital finance can narrow urban–rural income gap by promoting employment structure transformation in rural areas, this study employed the mediation effect model to verify H2 and the results are shown in Table 11. Column (1) shows that the regression coefficient of the core explanatory variable () to the mediating variable () is significantly positive without control variables; Column (2) presents that the regression coefficient is still significantly positive at the 5% statistical level after adding control variables. Digital finance can drive the digital transformation of various industries in China, optimize and upgrade traditional industries, give rise to new industries, and create new jobs, thus promoting the transformation of people engaged in agricultural production to non-agricultural ones, optimizing the structure of rural employment, and reducing the urban–rural income gap. Moreover, the development of digital finance greatly alleviates the financing challenges of numerous small and micro-enterprises in China’s rural areas, which contributes to the shift of the agricultural workforce towards non-agricultural sectors, resulting in increased rural household incomes and consequently narrowing the urban–rural income gap. Considering the robustness of the mechanism conclusion, column (3) shows that the regression coefficient is still significantly positive based on the instrumental variable method. This validates Hypothesis H2.
Table 11.
Regression results of the mediating effect of employment structural transformation.
4.6. Discussion
This study employs panel data of China’s provinces from 2011 to 2020 and utilizes the two-way fixed effects model to investigate how digital financial development affects the urban–rural income gap, from the perspective of employment structural transformation.
We find that digital finance significantly reduces the urban–rural income gap. Yu and Wang came to a similar conclusion, indicating that digital finance can alleviate urban and rural inequality from the standpoint of income structure [62]. Analogously, Khan et al. studied 54 African countries and argued that digital finance reduced poverty and income inequality [12]. Some prior studies have reached conclusions that align with this research on the relationship between digital finance and the urban–rural income gap. However, this study innovatively delves into the varying effects across different regions, contributing to the promotion of sustainable development in both urban and rural areas. Additionally, earlier research has identified the mechanisms by which digital finance narrows the urban–rural income gap. For instance, Gimet and Lagoarde found that digital finance significantly reduces this gap, with labor income distribution acting as a key moderating factor [19]. Zhang et al. examined the mediating role of entrepreneurship and the results showed that the development of digital finance narrowed the urban–rural income gap by increasing entrepreneurial income in rural areas [17]. Luo and Zeng studied the mediating effect of enterprise innovation and entrepreneurship and found that digital finance significantly promoted innovation and entrepreneurship in enterprises [1]. Different from these findings, this study indicates that the employment structural transformation plays a mediating role in the process of digital finance affecting the urban–rural income gap. This insight contributes to a more nuanced understanding of the mechanisms through which digital finance influences economic development and income distribution.
5. Conclusions and Policy Implications
5.1. Conclusions
In the context of unbalanced regional economic development and the rapid development of digital finance, this article uses provincial panel data from 2011 to 2020 in China, to analyze how employment structural transformation mediates the impact of digital financial development on urban–rural income disparity. The empirical results of this paper show that the digital finance index increased by 1% and the rural–urban income ratio decreased by about 0.34%. Secondly, employment structural transformation acts as a mediating factor in digital financial development’s contribution to reducing urban–rural income gap. Thirdly, the reduction effect of digital finance on the urban–rural income gap is stronger in areas with high marketization and in northern regions.
This paper has two main contributions: First, unlike traditional finance, this paper focuses on the impact of digital finance on the urban–rural income gap, highlighting the unique characteristics of digital finance. Second, focusing on the “continuous narrowing” of the urban–rural income gap in China in recent decades, we added the literature on narrowing the income gap between rural and urban areas from the perspective of digital finance development, observed the different impact varying by regions, and also provided insights for solving the problem of regional development imbalance in the world. Third, we supplemented the intermediary role of employment structural transformation in the relationship between digital finance and urban–rural income gap.
On the theoretical implications, this study contributes to the theoretical framework of digital finance and its impact on socio-economic disparities by elucidating the mechanisms through which digital financial development influences the urban–rural income gap. Unlike traditional finance, this paper highlights the unique role of digital finance in narrowing income disparities through employment structural transformation. Additionally, the research enhances the existing literature by incorporating regional heterogeneity, demonstrating that the effects of digital finance are more pronounced in highly marketized areas and northern regions of China. This nuanced understanding enriches the academic discourse on digital finance and economic equality, providing a solid foundation for future studies exploring the multifaceted impacts of digital financial innovations.
On the practical implications, the findings of this study offer valuable insights for policymakers aiming to leverage digital finance to achieve sustainable economic growth and reduce regional inequalities. The research underscores the importance of tailored regional strategies, advocating for targeted interventions in less developed areas to maximize the benefits of digital finance. These practical implications provide a roadmap for integrating digital financial solutions into broader economic policies, thereby contributing to the overarching goal of balanced and inclusive growth.
5.2. Policy Implications
Based on the research findings, the following policy recommendations are proposed to realize sustainable economic growth in the global region: First, enhance rural digital finance by leveraging internet technology, which offers broad coverage, affordability, and accessibility, reducing barriers to financial access for rural communities. It lowers barriers for rural communities to access financial resources. However, insufficient rural infrastructure can impede internet finance and lead to a “digital divide”. To address this, local governments must invest in rural infrastructure and enhance technological conditions for rural digital finance. Secondly, focus on the development of internet technology to support inclusive finance. Digital finance, such as Yu’EBao, leverages internet technology and big data credit systems, transcending time and space limitations in financial services. This alignment with inclusive finance can boost financial demand. Thirdly, promote digital financial education in rural areas to enable effective usage, while also increasing risk awareness and credit consciousness among residents to narrow the urban–rural income gap with digital finance. Fourthly, enhance government regulation of digital finance, bolster the social credit system, and raise risk awareness among businesses and individuals. Lastly, innovate a variety of financial service products to meet the diverse financial needs of rural communities.
5.3. Limitations
This study still has some limitations. The research period is confined to 2011–2020 because of the unavailability of more data. Future studies may aim to lengthen the sample period if possible. Additionally, expanding the scope of the studies from provincial to prefecture levels and cities could provide a more precise understanding of the impact of digital finance on the urban–rural income gap.
Author Contributions
Conceptualization, W.L. and J.Z.; Methodology, J.Z.; Data curation, W.L. and J.Z.; Writing—original draft, J.Z.; Writing—review and editing, W.L. All authors have read and agreed to the published version of the manuscript.
Funding
This research was funded by the National Social Science Foundation [22AZD048], and the Shandong Provincial Natural Science Foundation [ZR2023QG075].
Institutional Review Board Statement
Not applicable.
Informed Consent Statement
Not applicable.
Data Availability Statement
The data that were used are confidential.
Conflicts of Interest
The authors declare that they have no known competing financial interests or personal relationships that could have appeared to influence the research reported in this study.
Appendix A
Table A1.
VIF values.
Table A1.
VIF values.
| Variable | VIF | 1/VIF |
|---|---|---|
| Lfid | 1.09 | 0.916 |
| Lgdp | 2.50 | 0.400 |
| Insr | 2.11 | 0.474 |
| Lfdi | 1.64 | 0.610 |
| Edu | 1.31 | 0.763 |
| Rerate | 1.26 | 0.792 |
| Mean VIF | 1.65 |
Table A2.
Pairwise correlations.
Table A2.
Pairwise correlations.
| Variables | (incg) | (Lfid) | (Lgdp) | (Lfdi) | (Edu) | (Rerate) | (Insr) |
|---|---|---|---|---|---|---|---|
| incg | 1.000 | ||||||
| Lfid | −0.585 *** | 1.000 | |||||
| Lgdp | −0.448 *** | 0.183 *** | 1.000 | ||||
| Lfdi | −0.392 *** | −0.015 | 0.499 *** | 1.000 | |||
| Edu | −0.251 *** | 0.081 | 0.146 *** | 0.409 *** | 1.000 | ||
| Rerate | 0.216 *** | −0.084 | −0.255 *** | −0.312 *** | −0.325 *** | 1.000 | |
| Insr | −0.294 *** | 0.230 *** | 0.697 *** | 0.332 *** | 0.140 ** | −0.039 | 1.000 |
*** p < 0.01, ** p < 0.05
References
- Luo, C.; Li, S.; Sicular, T. The long-term evolution of national income inequality and rural poverty in China. China Econ. Rev. 2020, 62, 101465. [Google Scholar] [CrossRef]
- Bai, T.; Qi, Y.; Li, Z.; Xu, D. Digital economy, industrial transformation and upgrading, and spatial transfer of carbon emissions: The paths for low-carbon transformation of Chinese cities. J. Environ. Manag. 2023, 344, 118528. [Google Scholar] [CrossRef]
- Omar, M.A.; Inaba, K. Does financial inclusion reduce poverty and income inequality in developing countries? A panel data analysis. J. Econ. Struct. 2020, 9, 37. [Google Scholar] [CrossRef]
- Van, L.T.-H.; Vo, A.T.; Nguyen, N.T.; Vo, D.H. Financial inclusion and economic growth: An international evidence. Emerg. Mark. Financ. Trade 2021, 57, 239–263. [Google Scholar] [CrossRef]
- Jiang, Q.; Li, Y.; Si, H. Digital economy development and the urban–rural income gap: Intensifying or reducing. Land 2022, 11, 1980. [Google Scholar] [CrossRef]
- Tu, Z.; Kong, J.; Sun, L.; Liu, B. Can the Digital Economy Reduce the Rural-Urban Income Gap? Sustainability 2024, 16, 938. [Google Scholar] [CrossRef]
- Xia, H.; Yu, H.; Wang, S.; Yang, H. Digital economy and the urban–rural income gap: Impact, mechanisms, and spatial heterogeneity. J. Innov. Knowl. 2024, 9, 100505. [Google Scholar] [CrossRef]
- Chakraborty, S.; Ray, T. Bank-based versus market-based financial systems: A growth-theoretic analysis. J. Monet. Econ. 2006, 53, 329–350. [Google Scholar] [CrossRef]
- McKinnon, R.I. Money and Capital in Economic Development; Brookings Institution Press: Washington, DC, USA, 2010. [Google Scholar]
- Achdou, Y.; Han, J.; Lasry, J.-M.; Lions, P.-L.; Moll, B. Income and wealth distribution in macroeconomics: A continuous-time approach. Rev. Econ. Stud. 2022, 89, 45–86. [Google Scholar] [CrossRef]
- Guvenen, F.; Kuruscu, B.; Tanaka, S.; Wiczer, D. Multidimensional skill mismatch. Am. Econ. J. Macroecon. 2020, 12, 210–244. [Google Scholar] [CrossRef]
- Khan, I.; Khan, I.; Sayal, A.U.; Khan, M.Z. Does financial inclusion induce poverty, income inequality, and financial stability: Empirical evidence from the 54 African countries? J. Econ. Stud. 2022, 49, 303–314. [Google Scholar] [CrossRef]
- Levine, M.R. Finance, Growth, and Inequality; International Monetary Fund: Washington, DC, USA, 2021. [Google Scholar]
- Baiardi, D.; Morana, C. Financial development and income distribution inequality in the euro area. Econ. Model. 2018, 70, 40–55. [Google Scholar] [CrossRef]
- Ratnawati, K. The impact of financial inclusion on economic growth, poverty, income inequality, and financial stability in Asia. J. Asian Financ. Econ. Bus. 2020, 7, 73–85. [Google Scholar] [CrossRef]
- Chen, B.; Zhao, C. Poverty reduction in rural China: Does the digital finance matter? PLoS ONE 2021, 16, e0261214. [Google Scholar] [CrossRef] [PubMed]
- Xun, Z.; Guanghua, W.; Jiajia, Z.; Zongyue, H. Digital economy, financial inclusion and inclusive growth. China Econ. 2020, 15, 92–105. [Google Scholar]
- Luo, Y.; Zeng, L. Digital financial capabilities and household entrepreneurship. Econ. Political Stud. 2020, 8, 165–202. [Google Scholar] [CrossRef]
- Gimet, C.; Lagoarde-Segot, T. A closer look at financial development and income distribution. J. Bank. Financ. 2011, 35, 1698–1713. [Google Scholar] [CrossRef]
- Kling, G.; Pesqué-Cela, V.; Tian, L.; Luo, D. A theory of financial inclusion and income inequality. Eur. J. Financ. 2022, 28, 137–157. [Google Scholar] [CrossRef]
- Cheng, C.-Y.; Chien, M.-S.; Lee, C.-C. ICT diffusion, financial development, and economic growth: An international cross-country analysis. Econ. Model. 2021, 94, 662–671. [Google Scholar] [CrossRef]
- Kapoor, A. Financial inclusion and the future of the Indian economy. Futures 2024, 56, 35–42. [Google Scholar] [CrossRef]
- Yao, L.; Ma, X. Has digital finance widened the income gap? PLoS ONE 2022, 17, e0263915. [Google Scholar] [CrossRef] [PubMed]
- Jiang, Y.; Shi, M. How digital finance affects income distribution: Evidence from 280 cities in China. PLoS ONE 2022, 17, e0267486. [Google Scholar]
- Su, C.W.; Song, Y.; Ma, Y.T.; Tao, R. Is financial development narrowing the urban–rural income gap? A cross-regional study of China. Pap. Reg. Sci. 2019, 98, 1779–1801. [Google Scholar] [CrossRef]
- Zhong, S.; Wang, M.; Zhu, Y.; Chen, Z.; Huang, X. Urban expansion and the urban–rural income gap: Empirical evidence from China. Cities 2022, 129, 103831. [Google Scholar] [CrossRef]
- Jiang, Y.; Shi, X.; Zhang, S.; Ji, J. The threshold effect of high-level human capital investment on China’s urban-rural income gap. China Agric. Econ. Rev. 2021, 3, 297–320. [Google Scholar] [CrossRef]
- Zhang, M.; Wang, L.; Ma, P.; Wang, W. Urban-rural income gap and air pollution: A stumbling block or stepping stone. Environ. Impact Assess. Rev. 2022, 94, 106758. [Google Scholar] [CrossRef]
- Zhang, D.; Kong, Q.; Shen, M. Does polycentric spatial structure narrow the urban-rural income gap? –Evidence from six urban clusters in China. China Econ. Rev. 2023, 80, 101999. [Google Scholar] [CrossRef]
- Li, L.; Zhou, H.; Chen, Y.; Liu, B.; Shen, Y.; Zheng, M. Investigating the influence of transport accessibility on urban–rural income gaps. Appl. Econ. 2023, 1–16. [Google Scholar] [CrossRef]
- Zulher, Z.; Ratnasih, C. Financial development and poverty reduction in developing countries. Accounting 2021, 7, 667–674. [Google Scholar] [CrossRef]
- Zhang, X.M.; Dong, W.K.; Han, K.F. An Analysis of the Influence of Inclusive Finance on Household Financial Assets Selection and Its Mechanism. J. Contemp. Financ. Econ. 2020, 2, 43. [Google Scholar]
- Cihak, M.M.; Sahay, M.R. Finance and Inequality; International Monetary Fund: Washington, DC, USA, 2020. [Google Scholar]
- Náñez Alonso, S.L.; Jorge-Vazquez, J.; Reier Forradellas, R.F.; Ahijado Dochado, E. Solutions to financial exclusion in rural and depopulated areas: Evidence Based in Castilla y León (Spain). Land 2022, 11, 74. [Google Scholar] [CrossRef]
- Koomson, I.; Villano, R.A.; Hadley, D. Effect of financial inclusion on poverty and vulnerability to poverty: Evidence using a multidimensional measure of financial inclusion. Soc. Indic. Res. 2020, 149, 613–639. [Google Scholar] [CrossRef]
- Huang, Y.; Zhang, Y. Financial inclusion and urban–rural income inequality: Long-run and short-run relationships. Emerg. Mark. Financ. Trade 2020, 56, 457–471. [Google Scholar] [CrossRef]
- Sarma, M. Index of Financial Inclusion; (No. 215) Working Paper; Indian Council for Research on International Economic Relations (ICRIER): New Delhi, India, 2008. [Google Scholar]
- Yang, L.; Geng, Z. Impact of Digital Financial Inclusion on Optimization of Employment Structure: Evidence from China. Appl. Econ. 2022, 54, 6625–6638. [Google Scholar] [CrossRef]
- Lee, C.-C.; Lou, R.; Wang, F. Digital financial inclusion and poverty alleviation: Evidence from the sustainable development of China. Econ. Anal. Policy 2023, 77, 418–434. [Google Scholar] [CrossRef]
- Liao, G.; Yao, D.; Hu, Z. The spatial effect of the efficiency of regional financial resource allocation from the perspective of internet finance: Evidence from Chinese provinces. Emerg. Mark. Financ. Trade 2020, 56, 1211–1223. [Google Scholar] [CrossRef]
- Wu, Y.; Huang, S. The effects of digital finance and financial constraint on financial performance: Firm-level evidence from China’s new energy enterprises. Energy Econ. 2022, 112, 106158. [Google Scholar] [CrossRef]
- Kumar, K.; McKay, C.; Rotman, S. Microfinance and mobile banking: The story so far. Focus Note 2010, 62, 1–16. [Google Scholar]
- Zhang, L.; Liu, J.-K.; Li, Z.-H.; Yu, J.-Y.; Ding, C.J. Inclusive or Fraudulent: Digital Inclusive Finance and Urban–Rural Income Gap. Asia-Pac. Financ. Mark. 2024, 1–34. [Google Scholar] [CrossRef]
- Yu, C.; Jia, N.; Li, W.; Wu, R. Digital inclusive finance and rural consumption structure–evidence from Peking University digital inclusive financial index and China household finance survey. China Agric. Econ. Rev. 2022, 14, 165–183. [Google Scholar] [CrossRef]
- Banerjee, A.; Duflo, E.; Qian, N. On the road: Access to transportation infrastructure and economic growth in China. J. Dev. Econ. 2020, 145, 102442. [Google Scholar] [CrossRef]
- Wang, C.; Lu, Y. Can economic structural change and transition explain cross-country differences in innovative activity? Technol. Forecast. Soc. Chang. 2020, 159, 120194. [Google Scholar] [CrossRef]
- Li, H.; Yang, Z.; Jin, C.; Wang, J. How an industrial internet platform empowers the digital transformation of SMEs: Theoretical mechanism and business model. J. Knowl. Manag. 2023, 27, 105–120. [Google Scholar] [CrossRef]
- Xia, Y.; Qiao, Z.; Xie, G. Corporate resilience to the COVID-19 pandemic: The role of digital finance. Pac.-Basin Financ. J. 2022, 74, 101791. [Google Scholar] [CrossRef]
- Zhanbayev, R.; Bu, W. How does digital finance affect industrial transformation? J. Inf. Econ. 2023, 1, 18–30. [Google Scholar] [CrossRef]
- Marshall, N.A.; Stokes, C.J.; Webb, N.P.; Marshall, P.A.; Lankester, A.J. Social vulnerability to climate change in primary producers: A typology approach. Agric. Ecosyst. Environ. 2014, 186, 86–93. [Google Scholar] [CrossRef]
- Patton, F.L. Diminishing Returns in Agriculture; Columbia University Press: New York, NY, USA, 1968. [Google Scholar]
- Alabi, R.A.; Bakare, A.; Alabi, T.V. Financial inclusion, innovation and agricultural development in Nigeria. Sustain. Dev. Goal Nine Afr. Dev. Chall. Oppor. 2022, 22, 223. [Google Scholar]
- Wang, Y.; Weng, F.; Huo, X. Can digital finance promote professional farmers’ income growth in China?—An examination based on the perspective of income structure. Agriculture 2023, 13, 1103. [Google Scholar] [CrossRef]
- Ben Abdallah, A. The relationship between trade openness, foreign direct investment inflows, and economic growth in middle east and north of Africa region: Autoregressive distributed lag model vs. vector error correction model. J. Knowl. Econ. 2023, 15, 1118–1141. [Google Scholar] [CrossRef]
- Liu, S.; Tang, X.; Zhao, Y. Global Value Chain Participation, Employment Structure, and Urban–Rural Income Gap in the Context of Sustainable Development. Sustainability 2024, 16, 1931. [Google Scholar] [CrossRef]
- Ren, X.; Zeng, G.; Gozgor, G. How does digital finance affect industrial structure upgrading? Evidence from Chinese prefecture-level cities. J. Environ. Manag. 2023, 330, 117125. [Google Scholar] [CrossRef] [PubMed]
- Shen, Y.; Zhang, X. Intelligent manufacturing, green technological innovation and environmental pollution. J. Innov. Knowl. 2023, 8, 100384. [Google Scholar] [CrossRef]
- Zhang, Q.; Churchill, S.A. Income inequality and subjective wellbeing: Panel data evidence from China. China Econ. Rev. 2020, 60, 101392. [Google Scholar] [CrossRef]
- Guo, Y.; Qiao, W. Rural migration and urbanization in China: Historical evolution and coupling pattern. Sustainability 2020, 12, 7307. [Google Scholar] [CrossRef]
- Maestas, N.; Mullen, K.J.; Powell, D. The effect of population aging on economic growth, the labor force, and productivity. Am. Econ. J. Macroecon. 2023, 15, 306–332. [Google Scholar] [CrossRef]
- Fayzullayev, B.Z.; Khalid, S. Navigating The Digital Divide: Analysing The Impact of Technology And Connectivity On Modern Trends In International Labor Migration. Am. J. Interdiscip. Res. Dev. 2023, 20, 80–92. [Google Scholar]
- Yu, N.; Wang, Y. Can digital inclusive finance narrow the Chinese urban–rural income gap? The perspective of the regional urban–rural income structure. Sustainability 2021, 13, 6427. [Google Scholar] [CrossRef]
Disclaimer/Publisher’s Note: The statements, opinions and data contained in all publications are solely those of the individual author(s) and contributor(s) and not of MDPI and/or the editor(s). MDPI and/or the editor(s) disclaim responsibility for any injury to people or property resulting from any ideas, methods, instructions or products referred to in the content. |
© 2024 by the authors. Licensee MDPI, Basel, Switzerland. This article is an open access article distributed under the terms and conditions of the Creative Commons Attribution (CC BY) license (https://creativecommons.org/licenses/by/4.0/).