Abstract
Over the last two decades, scientific studies have increasingly highlighted the vulnerability of cities to global changes, especially in sub-Saharan Africa, where climate phenomena and urbanization are intensifying. These realities necessitate a reassessment of current urban management models in order to reaffirm the central role of cities in promoting sustainability. In this context, establishing a robust scientific foundation for evaluating the transition processes of cities towards sustainability is essential. This article presents a methodology developed to select and validate indicators, taking into account local issues and the needs expressed by stakeholders. The research was conducted using a mixed-methods approach, which included a literature review, consultations with populations from five study districts, analysis of the indicator needs of development stakeholders, adoption of two methods, and validation of the indicators by a group of experts. The outcome of this research is a set of 20 indicators organized into five dimensions: environmental, social, economic, built environment, and cultural. The analysis of the proportional distribution of these indicators across dimensions reveals a notable predominance of the social dimension, which accounts for 35% of the indicators, including key indicators such as access to potable water, electricity, education, and healthcare services, inter alia. The environmental and built environment dimensions each comprise 20% of the indicators, encompassing indicators such as the preservation of natural resources, waste management, land use management, and flood management, among others. The economic and cultural dimensions represent 15% and 10% of the selected indicators, respectively. These data indicate that achieving sustainable urban development within the context of this study requires a focused effort on enhancing the performance of these indicators, with substantial efforts needed in the social domain. It is of paramount importance to incorporate these indicators into the decision-making processes related to urban development planning in Moundou and other cities in the region, as they provide valuable scientific insights crucial to the pursuit of sustainability.
1. Introduction
Cities are currently experiencing an intensification of extreme climatic phenomena [1,2] and increasingly rapid urbanization [3], currently estimated at a global rate of 56% with a projection of 68.4% by 2050 [4]. Although urbanization offers significant potential for economic and social development in cities, it also presents major challenges, including biodiversity loss, air and water pollution, housing crises, and growing inequalities in access to basic social services and employment [5,6]. These emerging urban paradoxes and contradictions necessitate a revision of existing urban management models [7,8], in order to reposition cities as true hubs for promoting sustainability [9,10]. In this context, establishing a robust scientific foundation for evaluating the effectiveness of urban development programs in sub-Saharan African cities, particularly concerning their transition towards sustainability, is essential. This need is even more pressing given the varying urban challenges and development priorities across different regions [11]. In many Northern countries, the focus is on the “sustainable” aspect of the concept of sustainable development, with particular emphasis on environmental sustainability [12]. In contrast, countries in the Global South emphasize the “development” aspect, as in these cities, many basic human needs remain unmet [5,13,14].
In addition to acknowledging that—which we will delve into further in Section 2.3—if the development initiatives undertaken at the neighborhood scale in a city are based on visions and principles that align with sustainable development goals, the resulting city will also be sustainable [12,15,16], many researchers have underscored the significant role of indicators in cities’ transition towards sustainability. Firstly, indicators enable the representation and communication of urban areas’ characteristics in a straightforward and organized manner [17]. In other words, they help to concretize and clarify the concept of urban sustainability. For instance, the idea of a neighborhood’s sustainability becomes more comprehensible when there are indicators that clearly define what the concept entails, along with the attributes that must be addressed to make progress towards sustainability. Secondly, indicators help operationalize the concept of urban sustainability by translating abstract societal phenomena into quantifiable variables, thus enabling precise measurements to be made [18]. By doing so, indicators facilitate the assessment of a city’s sustainability level within a specific context. Thirdly, indicators assist in defining goals and identifying development needs, thereby guiding public actions and monitoring their results. From this perspective, the use of indicators enhances decision-making processes regarding sustainability [19]. For instance, assessments based on indicators enable local authorities and their technical and financial partners to adjust and improve actions or practices aimed at steering urban development towards sustainability. Fourthly, indicators also function as communication and mediation tools, as their development involves the engagement of various stakeholders, fostering collective learning, which is crucial for their adoption [20]. Thus, implementing measurement indicators at the neighborhood level within a city ultimately determines the extent to which the city is progressing towards sustainable development.
However, it is also acknowledged that, to avoid confusion and ambiguities and to accurately assess a city’s sustainability level, it is essential for the measurement indicators to faithfully reflect the specific realities of the local context in which they are used [21,22,23,24]. This means that indicators developed and used in a city in the North, based on its own realities, cannot be automatically transferred and applied in a city in the South, particularly due to differing contextual realities. Furthermore, each country has its own perception of urban sustainability [21], and this individual perception impacts the measurement of sustainability at the local level, highlighting the necessity to align measurement indicators with local realities. This evidence is illustrated by the diversity and specificity of studies conducted at the local level in various regions around the world. For instance, in European Union countries like Germany, Belgium, and Italy, neighborhood sustainability evaluations within cities rely on indicators measuring the efficiency of public transport and non-motorized travel modes, the use of renewable energy in housing, and the reduction of CO2 emissions. In contrast, neighborhood sustainability assessment initiatives in the United States and the United Kingdom tend to focus on indicators assessing aspects of social sustainability, such as equity, happiness, and values [12]. In emerging countries, particularly in China, recent research has shown that local sustainability assessments focus on indicators measuring political aspects such as peace, the performance of justice and institutions, access to clean water, clean and affordable energy, technological and industrial innovation, and the responsible production and consumption of resources [25]. These examples, though not exhaustive, illustrate the diverse perspectives on urban sustainability assessment. According to several researchers working on urban sustainability issues, these differences in indicator usage stem from variations in development priorities, needs, cultural values, pollution responsibilities, and, above all, each city’s capacity to achieve its sustainability goals [5,17,24].
It is therefore evident that the selection of indicators for assessing sustainability at the local level is closely tied to the political development vision of local authorities, in alignment with the national strategies of each country, as suggested by the United Nations Agenda 21 in 1992. This implies that, to effectively assess urban sustainability in a given context, it is crucial to consider the specificity of local issues. However, while existing literature clearly demonstrates significant advancements in urban sustainability assessment in Northern countries, the situation is vastly different in the context of sub-Saharan Africa. This is particularly true, as studies establishing clear indicators to assess the sustainability in a holistic manner of cities in this region are lacking [26]. For instance, Momoh et al. (2022) developed the Sustainable Composite Cities Environmental Evaluation and Design (SUCCEED-ND) tool to assess sustainability within the Nigerian context. However, the study did not specify the scale at which this composite tool can be applied, nor did it identify the measurement variables to be used [27]. Similarly, Kapatsa et al. (2023) identified indicators to evaluate the sustainability of road infrastructure in Tanzania. While this approach is relevant, it is limited in establishing an overall level of urban sustainability [28]. Furthermore, Ihuah and Eaton (2014) identified the principles of functionality and sustainability factors for public housing in Nigeria. Nonetheless, they did not clearly define the performance measurement indicators [29]. This deficiency represents a significant barrier to effectively implementing sustainability initiatives, as it hinders the accurate assessment of progress towards sustainability in sub-Saharan cities, given their unique challenges and issues [28]. Therefore, there is a pressing need to identify indicators that are suitable for sub-Saharan cities, particularly in light of their increasing vulnerability to contemporary challenges. Indeed, the 2023 report from the Intergovernmental Panel on Climate Change underscores Africa’s status as one of the world’s lowest CO2-emitting regions [30], yet it remains exceptionally susceptible to climate change. This vulnerability is marked by two primary consequences: (1) the exacerbation of extreme phenomena such as floods, landslides, and rising temperatures; and (2) the expansion of drought, which severely impacts rural areas surrounding cities. This situation further drives urbanization in these cities, which often lack adequate infrastructure to support all residents, particularly in terms of urban services, employment, and housing [31,32]. According to United Nations projections, Africa’s urban population is expected to reach 824 million by 2030, with a potential increase to 1489 million by 2050, predominantly concentrated in sub-Saharan Africa [4]. This rapid urbanization is poised to present significant challenges in providing essential social services, adapting to climate change, and preserving urban biodiversity. Consequently, promoting urban sustainability has become a paramount concern for local authorities [33]. This underscores the importance of identifying suitable indicators for measuring sustainability in this region. Therefore, the process of selecting indicators to evaluate sustainable urban development programs in these cities must take into account local dynamics and realities, as well as the priority development needs of local stakeholders.
In the aftermath of United Nations Agenda 21, governments of 193 countries, including Chad, unanimously adopted 17 Sustainable Development Goals (SDGs) in 2015, including SDG 11, which aims to “make cities and human settlements inclusive, safe, resilient, and sustainable” [34]. This commitment highlights the significant importance that the Chadian government places on urban development issues, as demonstrated by its active participation in international forums, most recently in New York from 19–20 September 2023, to explore innovative approaches for sustainable management of its territory. In pursuit of these goals, the Chadian government is steadfast in its pledge to achieve all 17 SDGs by 2030. In alignment with both the United Nations SDGs and the African Union’s Agenda 2060, Chad has drawn up its National Development Plan (NDP) for the period 2017–2021, extended until December 2023, with a new version for 2024–2028 currently being adopted by the National Assembly. In the realm of sustainable urban development, the NDP has delineated multi-sectoral objectives to be achieved at the city level. Within this framework, conducting studies to delve into the sustainability of these cities is indispensable. In this respect, recent studies have thus arisen to enhance the understanding of urban sustainability in Chad. However, it is noteworthy that previous studies have predominantly concentrated on studying the impacts of climate change on the health of citizens [2,35], on strategies for integrating climate change into urban development policies [36], on analyzing new means of transport emerging in Chad’s urban mobility system [37], or on studying the state of urban infrastructure [38], to the detriment of indicators assessing the level of sustainability of these cities in a holistic manner. Moreover, the bulk of prior studies have centered on the capital city, N’Djaména, while secondary towns have been spared.
Consequently, this study seeks to address this scientific gap by exploring methods for evaluating sustainability at the local level. It aims to answer the following questions: What are the local issues influencing urban dynamics? What are the primary urban sustainability objectives established in relation to these issues? What are the optimal indicators for assessing the sustainability of Moundou, considering its local specificities? The objectives of this research are as follows:
- ▪
- To identify the priority issues specific to the local context;
- ▪
- To co-define, in collaboration with stakeholders, the priority urban sustainability objectives;
- ▪
- To select and validate the optimal indicators.
The selected indicators will serve as reference tools for assessing the sustainability of Moundou. Moreover, this study also aims to potentially serve as a blueprint for evaluating sustainability in other Chadian cities and, more broadly, across sub-Saharan Africa. Indeed, like cities in Chad, most urban centers in sub-Saharan Africa face similar challenges and issues, including: (i) rapid urbanization, characterized by the world’s highest growth rate [3,31]; (ii) significant challenges in urban spatial management [39]; and (iii) common challenges concerning access to essential urban services [32,40,41].
2. Literature Review
2.1. Urban Sustainability and Its Key Dimensions
The term urban sustainability, also known as sustainable urban development in academic discourse, refers to the urban aspect of the concept of “sustainable development,” initially proposed by the Brundtland Commission in 1987 and later formalized by the United Nations in Rio de Janeiro in 1992 [42,43]. At its core, this concept advocates for the adoption of responsible production and consumption practices within cities. The aim is to meet the needs of urban populations at all levels while preserving environmental parameters. This approach is viewed as crucial, as it not only contributes to securing a sustainable future for present and future generations but also to conserving natural resources in urban areas and, by extension, those of the planet for as long as possible [34,43,44]. According to Ward and Smith (2015), the concept of urban sustainability draws its foundations from the principles and objectives developed in 1990 by the United Nations Development Programme (UNDP) to promote sustainable management of informal human settlements [45]. Recently, with emerging scientific findings attributing a significant portion of global pollution to cities and suggesting that their increasing urbanization is inevitable [1,31], coupled with the findings that cities represent a crucial territorial level for reversing current trends [46,47], the concept of urban sustainability has gained unprecedented prominence across socio-political arenas. It remains, today, a primary concern for governments, international organizations, and scientists alike [9,48], even though, recently, in the literature its scope is sometimes questioned, due primarily to its confusion with other concepts sharing similar ideas such as urban resilience and adaptation [8].
Research on urban sustainability assessment is increasingly capturing scholarly attention. However, while researchers unanimously acknowledge the importance of urban sustainability in ensuring broader global sustainability, there are divergences regarding the essential dimensions to prioritize in sustainability assessment at the local level. While most studies have traditionally focused on the original three dimensions of sustainable development—environmental, economic, and social [26,49,50,51]—some emphasize the significance of political and economic aspects [52,53,54]. Earlier studies have also emphasized the environmental dimension [55], despite critiques questioning the overemphasis on environmental policies in urban sustainability discourse [23,24,56]. This diversity of perspectives has sparked reactions from other researchers, who view these approaches as partial and insufficient in promoting comprehensive urban sustainability. And given ongoing global changes, these reactions advocate for considering additional dimensions. For instance, scholars argue that issues related to social sustainability and technological sustainability are often overlooked in urban sustainability assessment initiatives, yet they are crucial for achieving global sustainability [57,58]. Similarly, other authors contend that urban governance and culture are indispensable dimensions to consider in urban sustainability approaches [59,60].
Although recent critiques and suggestions advocate for additional dimensions in urban sustainability assessment and acknowledge the incompleteness of this literature review, it is apparent that achieving a consensus on the universal dimensions of urban sustainability remains elusive. This observation aligns with Braulio-Gonzalo et al.’s (2015) assertion that the promotion of urban sustainability is closely tied to each country’s political vision for sustainable development, which shapes the evaluation of sustainability initiatives at the local level [21]. Therefore, the dimensions deemed pertinent to urban sustainability often reflect the political development priorities of individual countries. In addition to these insights, the literature underscores another significant issue: the limited exploration of sustainability issues in cities within developing countries [26]. Therefore, research aimed at exploring methods to assess sustainability at the local level, notably in sub-Saharan Africa, is of paramount importance, given that the sustainability of these cities is integral and fundamental to achieving global sustainability [9,26]. Like other aspects of sustainable development, urban sustainability is often perceived as challenging to define due to the intricate nature of urban systems [48,61,62]. Nonetheless, in simple and contextually relevant terms for the Chadian context, we consider urban sustainability as “the process of developing a built environment that meets people’s needs whilst avoiding unacceptable social or environmental impacts” [63]. As depicted in Figure 1, the concept of urban sustainability in this study encompasses five key dimensions: environmental, economic, social, built environment, and cultural.
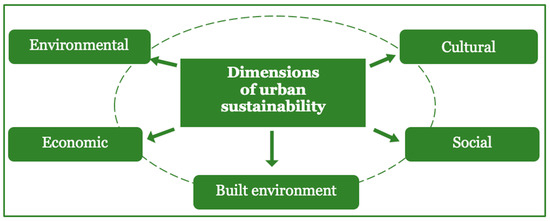
Figure 1.
Dimensions of urban sustainability in the study context. (Source: authors, 2024).
Urban sustainability should be understood as a dynamic, constantly evolving concept rather than the attainment of an idealized and static city [64]. The notion of “process” is at the core of this concept, dispelling doubts about the temptations to consider urban sustainability as a static concept, where goals must be formulated and necessary means implemented in the hope of achieving a certain level of idealism in a city. Some researchers describe urban sustainability as the ability of an urban system to function continuously in all its dimensions without necessarily maintaining a stable or static equilibrium [6,15]. This process is intrinsically linked to the spatial evolution of the city over time, as well as the various elements that constitute urban space [15,16,65]. Thus, urban sustainability can be conceptualized as a long-term planning process based on principles that aim to reconcile urban development, environmental preservation, local identity, and social equity, particularly in terms of income, employment, and access to basic social services for local populations [66]. Achieving these goals necessitates continuous improvements in the built environment [15], infrastructure, and basic social services, which positively impact populations and the environment and lay the foundation for cities’ transition toward sustainability [16,67]. This transition also requires the active participation of local people and businesses [58,68,69], as well as a change in attitudes at all levels, including national, local, and individual [70].
2.2. Sustainability Indicators
The need to identify and quantify the characteristics of urban areas to understand and implement effective actions for their sustainability has been emphasized by numerous researchers. For instance, evaluation experts like Bell and Morse (2008) asserted in their book “Sustainability Indicators: Measuring the Unmeasurable” that initiating bold actions to identify and quantify urban sustainability attributes will facilitate its implementation [71]. Similarly, the imperative to operationalize the concept of urban sustainability has been recognized by other scholars. Leach et al. (2016) proposed a methodology to quantify the implementation of urban sustainability [72], while Meijering et al. (2018) identified key components necessary for operationalizing the concept [73]. Other researchers have developed a multidimensional guiding approach for this purpose [74]. While these efforts, seemingly complementary, underscore the importance of identifying and quantifying urban areas’ characteristics to facilitate their transition to sustainability by highlighting the paths to follow and the attributes to act upon, it is evident that indicators play a significant role in this regard. In this respect, several authors have emphasized the crucial importance of developing and using indicators that accurately reflect the realities and specificities of each local context. These indicators are essential for effectively evaluating urban development programs in line with pre-established objectives and for contributing to informed decision-making at various levels [21,22,24,60,75].
The literature on sustainability presents a variety of definitions for the term “indicator,” reflecting either complementary or competing perspectives depending on the discipline, whether from ecologists, geographers, environmentalists, or others. Despite these differences, there is a relative convergence on the core concept, summarized as follows: An indicator is “a quantity that provides information about a variable that is more difficult to access or a more complex system, in order to help a user in his action (decision-making, construction of an action programme, modelling, etc.)” [76]. An indicator can be either a “quantitative” or “qualitative” variable, providing precise information on the state of a phenomenon [77]. This suggests that, in practice, an indicator does not aim to represent all the factors responsible for the occurrence or modification of a phenomenon. Instead, it selects specific and relevant information to represent a reality [18], facilitating the measurement of the state of a phenomenon or system within a particular context [51]. While indicators simplify the understanding of complex phenomena by translating urban trends through variables, it is well established that their selection process requires a thorough understanding of the phenomena inherent to the city and precise knowledge of the context in which they will be used [24].
Over the last two decades, numerous indicators have been developed and employed in various contexts worldwide to assess sustainability at the local level. Without claiming to be exhaustive, we can mention examples such as those developed by [21,78,79,80,81,82]. Similarly, several composite indices have been developed in this context, as noted by [83]. Critically, however, authors analyzing these indicators have highlighted several key findings: (1) Many indicators are not used due to a lack of consensus on the adopted methodology and the optimal number of indicators to employ [80]; (2) indicators must be flexible enough to adapt to the specific contexts of local communities in developing countries [84]; (3) the indicator development process must align more closely with local realities [85]; and (4) the use of indicators from the literature to assess the sustainability of certain cities often fails to reflect local realities or the diversity of underlying issues [24].
Another evident finding from the literature review on indicators is that the majority of these studies have been conducted in developed countries, with limited attention paid to emerging countries [21,80,86]. Conversely, research focusing on indicators for assessing urban sustainability in developing countries is scarce [26]. This observation underscores the importance of the current research, which aims to select indicators for evaluating the urban sustainability of the city of Moundou and, more broadly, cities in sub-Saharan Africa, while considering local realities. This initiative will contribute to expanding existing knowledge on urban sustainability evaluation in Africa, building on efforts already initiated by African researchers. Beyond the examples mentioned in the introduction, such as [27,28,29], it is pertinent to highlight the work of other African scholars. For instance, Cloete (2015) developed a list of 80 indicators, divided into four dimensions (social, economic, environmental, and institutional), to serve as a reference for assessing progress towards sustainability in the South African context [87]. Sehili et al. (2015) applied the “HQDIL” method (Heritage-Quality-Diversity-Integration-Social link) using the INDI model (Indicators Impacts) and an indicator system to assess the sustainability of the Historic Centre of Mansourah K’bira in Algeria [88]. Hadji (2012) proposed a method for evaluating the quality of public spaces (QUEP) in a development project in Algeria, defining criteria representative of the quality of public spaces [89].
2.3. Indicators Selection Framework
The discourse on cities’ transition processes towards sustainability is taking a new turning point, marked by the recognition of neighborhoods as the most appropriate scale of spatial organization for implementing measures to assess a city’s sustainability in line with pre-established objectives [15,65,90]. According to Kallus and Law-yone, the neighborhood is a component of the city, with precise physical boundaries; it is “a place defined by the identity of the people inhabiting it. This identity stems from the relationships among people in the context of their living environment. In this light, the neighborhood is seen as a step in a continuum of social order, based upon the content and the strength of human bonds. This social order originates with the nuclear family, continues through the neighborhood, and ends with the city and the society as a whole” [91]. Thus, the existence and development of a neighborhood are governed by relationships between people. This relational factor is crucial for easily establishing the responsibilities of different stakeholders, controlling the most appropriate actions, and readily considering the interdependencies between actors and between actors and their environment, particularly in the context of sustainability [92].
The connection between the concept of sustainability and the neighborhood lies in the neighborhood’s capacity to support ongoing social transformations and sustain residents’ lives without degrading itself or harming the environment over time [44,90]. Therefore, the neighborhood must exhibit a certain level of flexibility, allowing different communities to coexist harmoniously and gradually introduce essential amenities and services throughout its lifecycle [16,92]. In terms of measurement, the neighborhood possesses specific characteristics (attributes) from which the most relevant and representative ones should be identified, enabling measurement and providing insights into its developmental trends [88,93]. From this perspective, for a city to progress towards sustainability, it is crucial that its constituent neighborhoods themselves are sustainable [94]. Following this principle, if neighborhood development initiatives align with sustainability goals in terms of visions, principles, and indicators, the resulting city will inherently be sustainable [12,15,16,21]. Figure 2 below depicts the framework of the indicator selection.
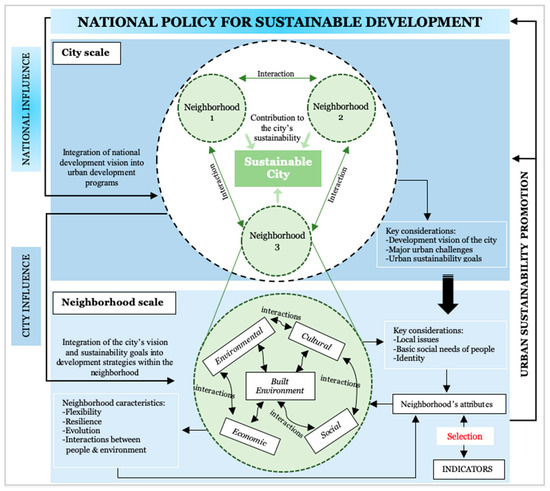
Figure 2.
Indicators selection framework. (Source: authors, 2024).
3. Materials and Methods
3.1. Study Site
To contextualize the data and analysis for selecting indicators that reflect local realities and are likely to resonate across urban areas, we chose the city of Moundou as the most suitable case study approach, as briefly mentioned in the introductory section. To ensure our approach comprehensively captures the multidimensional dynamics of the city and enables accurate measurement of its sustainability level, we initiated a rigorous process of selecting a few neighborhoods for contextualizing the data. The selection criteria for these neighborhoods are as follows: (1) being identified by local authorities as primary pilot neighborhoods for initial sustainability programs, such as the flood control project [95] and the Sanitation Improvement Program [96], ensuring comprehensive consideration of all measurement attributes; (2) being located in areas with varying population densities as defined by the city’s Sanitation Plan, avoiding spatial homogeneity and reflecting different social contexts based on these density variations; (3) having up-to-date demographics, infrastructure, and services data from reliable sources; (4) being located in diverse boroughs, thereby encompassing a range of practices in how residents engage with sustainability initiatives. Following this meticulous filtering process, we selected the following five neighborhoods: Dombao, Djarabé 1, Doumbeur 2, Gueldjem 2, and Guelbé, as depicted in Figure 3. This figure was generated using ArcGIS software version 10.4, by leveraging shapefile data provided by the National Research Center for Development in N’Djamena, Chad.
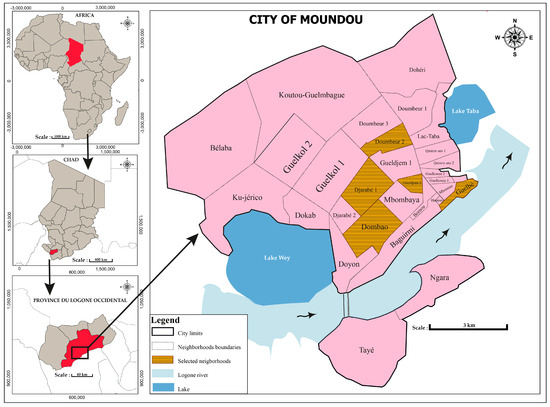
Figure 3.
Geographical location of the city of Moundou. (Source: authors, 2024).
3.2. Data Collection Methods
To select indicators that reflect local issues and prioritize development objectives defined by local authorities, we employed a transparent and rigorous methodological approach structured in two main phases. The first phase (Stage 1) focused on qualitative aspects, emphasizing stakeholder participation and inclusion. This inclusive approach allowed us to gather diverse perspectives and ultimately define sustainability issues and revised objectives grounded in local realities. The second phase concentrated on quantitative aspects, employing three distinct methods: (i) analyzing stakeholders’ needs for indicators (Stage 2); (ii) selecting an initial list of indicators (Stage 3); and (iii) validating the optimal indicators (Stage 4). Figure 4 below provides a schematic representation of the four stages involved in the optimal indicator selection process, followed by a detailed description of each stage.
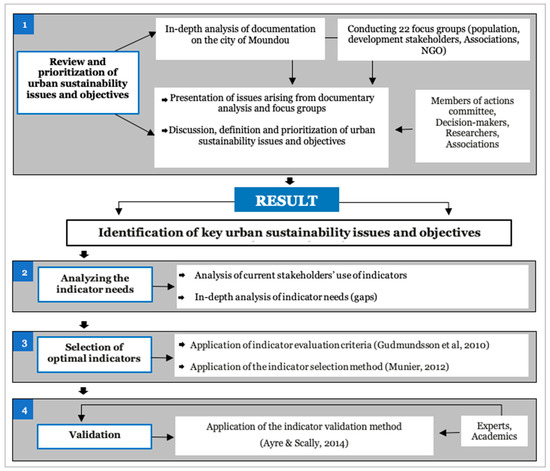
Figure 4.
Research process flow. (Source: authors, 2024).
- Stage 1. Review and prioritization of urban sustainability issues and objectives
The first stage of our work unfolded in two phases: the analysis of existing documentation and the conduct of focus groups with stakeholders in selected neighborhoods. The initial phase involved a thorough analysis of planning documents and strategies developed for the city’s development. This provided insights into the developmental dynamics within the neighborhoods and the broader context of Moundou, particularly given the limited scientific literature on Moundou’s urban sustainability. The second phase encompassed 22 focus groups, involving representatives from neighborhood development associations, youth groups, women’s cooperatives, neighborhood leaders, economic operators, and local NGOs. To ensure the legitimacy of the discussions, we deemed it necessary for the selection of participants to be voluntary from identified organizations and associations. However, we facilitated this participation by structuring the discussion phases and redirecting the debates. The discussions were centered around four key points: (1) challenges and difficulties related to neighborhood development; (2) significant observed changes; (3) expectations and requirements for essential social services; and (4) commitment to sustainability. The aim of this phase was not to confront the views and aspirations of residents with the objectives set by the local authorities but simply to identify emerging issues and needs in light of global trends and usage patterns, with the aim of finding ways of taking them into account. The overarching outcomes from these two phases were presented to the Actions Committee (AC), subsequently reviewed, and deliberated upon with its members. This process facilitated the identification and prioritization of development issues and sustainability objectives that reflect the principles advocated by all stakeholders.
- Stage 2. Analyzing the indicator needs
In the second stage of our research, we implemented a questionnaire structured in two parts to analyze: (1) the current use of indicators, and (2) the indicator needs (gaps) of institutional and non-institutional actors responsible for sustainable urban development in Moundou. We chose to focus our analysis on members of the Actions Committee (AC) of the city of Moundou, a decision that proved crucial. The AC comprises experts, officials from various technical services, policymakers, and representatives from neighborhood development associations and local NGOs engaged in Moundou’s development programs and strategies. This selection was strategic because the AC members are not only well-equipped and informed but also possess a detailed understanding of the ins and outs of this study, and are therefore able to provide precise answers, even to highly technical questions, which is fundamental to the selection of relevant indicators.
- Stage 3. Selection of optimal indicators
In Stage 3, we employed two primary methods to guide the process of selecting indicators based on the needs expressed by the actors in Stage 2. The first method involved the indicator evaluation criteria proposed by Gudmundsson et al. (2010) [97], which are commonly used by scientists to guide the evaluation of urban sustainability indicators. This method involves assessing indicators according to ten criteria, including three representativeness criteria (validity, reproducibility, sensitivity), three operational criteria (measurability, data availability, ethics), and four decision-support criteria (transparency, interpretability, alignment with objectives, and relevance to decision-making). Indeed, the issue of defining evaluation criteria for indicators is often a point of contention among stakeholders, as it necessitates reaching a consensus on each criterion among stakeholders with divergent, or even opposing, perceptions of urban phenomena. Given the time constraints of our study, along with resource and practical limitations, we deemed it necessary to adopt the established evaluation criteria for indicators that are frequently utilized by researchers.
Secondly, we employed the indicator selection method proposed by Munier (2012). At this stage, based on the preliminary data from step 2, we first analyzed the impacts and effects of the indicators and then determined the composite weight of each indicator, considering a cut-off level equal to 4. In other words, only indicators that establish at least four serial links with other indicators were considered. Indeed, according to Munier, “is not enough to consider each indicator isolated, because most certainly one impacts on other/s, which in turn impact on another’s” [17]. Table 1 below presents the list of initial indicators, along with their effects. The figures representing primary, secondary, and tertiary effects denote the numbers of serial links each indicator has with other indicators, while the figures in the final column represent the sum of these effects, indicating their overall weight.

Table 1.
List of initial indicators and their effects.
Next, based on data in Table 1, we constructed the confrontation matrix, taking into account local issues and sustainability objectives defined with stakeholders, the five dimensions of sustainability adapted to the context of this study (Figure 1), and the general criteria for evaluating indicators proposed by Gudmundsson et al. (2010). [97] Subsequently, we used Excel’s Solver software (Simplex Algorithm), version 2304, for the selection of indicators and calculated:
- (1)
- The objective function, allowing for the selection of optimal indicators that adhere to all constraints, by applying the following formula:with Wj: the composite weight for each indicator and Xj: the unknown indicators to be selected.
- (2)
- The coefficients of the indicators using entropy, with the following formula:with xj: probability of occurrence; ln: natural logarithm of the probability of occurrence; and N: number of indicators.
Table 2 below displays the selection constraints, particularly the multicriteria thresholds defined in the selection matrix. This rigorous process not only delineates the parameters of analysis but also optimizes iterative solutions by considering these constraints. The results generated by the Solver (result from computing) illustrate calculated values that strictly adhere to the predefined thresholds, thereby demonstrating the robustness and precision of the outcome. Moreover, the results proposed by the Solver ensure that the selected indicators are not only mathematically optimized but also meet practical and applicable requirements within this study context.
Table 2.
Selection constraints and result from computing.
Table 3 below presents the excerpt from the results derived from the confrontation matrix, detailing the data on the 31 selected indicators. The various components of the matrix are displayed in the top row, with the indicators listed in the first column. The rows, numbered from 1 to 31, correspond to each indicator and its associated data. The figures in the second column represent the links between different indicators, while the third column provides the normalized values of these links, based on data from the second column. The third column also indicates the weight of each indicator, derived from summing their primary, secondary, and tertiary effects, followed by their normalized values in the subsequent column. Column 6 presents the composite weight values of the indicators, which range from a minimum of 4 to a maximum of 11. This composite weight is calculated by adding the normalized value of the links (from column 3) and the normalized value of the weight (from column 5). The last column contains the entropy values. Finally, the values in the last column are determined by multiplying each composite weight by the total sum of the entropy values.
Table 3.
Details of the data on the selected indicators, excerpt from the confrontation matrix.
The data presented in Table 3 clearly illustrate the degree of concordance of the selected indicators with the specified constraints. The data reveal that all selected indicators possess a weight of 4 or greater (column 4), thereby fulfilling the required minimum weight constraint. Additionally, each indicator meets the composite weight constraint, with values equal to or exceeding 0.04 (column 6). These results underscore the rigor and precision of the selection method employed. Moreover, the calculated entropy values, ranging from −16 to −23, indicate a high level of information content within the chosen indicators, as lower entropy values reflect a greater amount of information [98]. This demonstrates robust linkages between the selected indicators and sustainability objectives. In essence, these indicators are not only statistically significant but also pertinent to achieving the established objectives.
- Stage 4. Validation
At Stage 4, the indicators were validated using the content validation method developed by Ayre and Scally (2014) [99]. This method is widely employed in contemporary research to validate new data collection tools such as questionnaires, semi-structured interview guides, or indicators. Its reliability and relevance stem from its coherent and highly rigorous mathematical framework. Regarding the indicators, this method entails submitting a list of previously selected indicators to a critical assessment by a panel of experts, who must evaluate each indicator by categorizing it as “essential,” “useful but not essential,” or “not necessary.” Overall, Ayre and Scally’s (2014) validation method requires the participation of between five (5) and forty (40) experts. In our case, the number of selected evaluators is ten, all of whom are recognized experts in the field of urban development and sustainability in Chad and the sub-region.
Ayre and Scally (2014) established a mathematical formula to define the Content Validity Ratio (CVR), illustrating the relationship between the number of experts and the minimum number of essential ratings required. According to Ayre and Scally’s (2014) criteria, for an indicator to be considered valid within a specific context, at least nine out of ten experts must categorize it as “essential.” Table 4 below provides a detailed profile of the various evaluators involved in the validation of these indicators.
Table 4.
Categories of evaluators.
Figure 5, Figure 6, Figure 7, Figure 8 and Figure 9 below depict the distribution of scores assigned to the 31 indicators submitted for validation. Each figure corresponds to a specific dimension, with its corresponding indicators. A visual analysis of these figures allows for the classification of the indicators into three categories based on the scores obtained by each indicator:
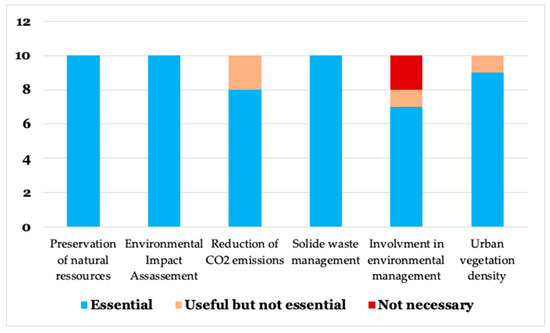
Figure 5.
Scores of the indicators within the Environmental Dimension. (Source: authors, 2024).
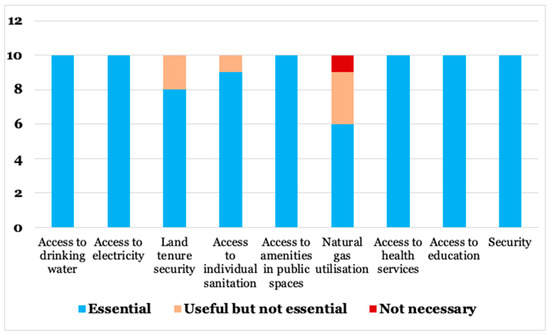
Figure 6.
Scores of the indicators within the social dimension. (Source: authors, 2024).
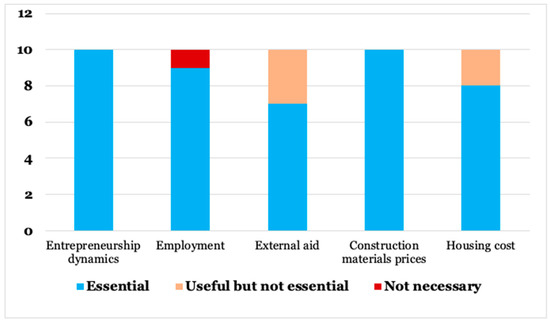
Figure 7.
Scores of the indicators within the economic dimension. (Source: authors, 2024).
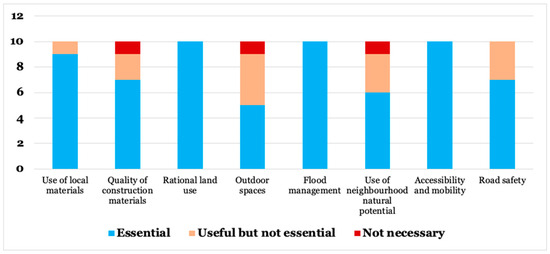
Figure 8.
Scores of the indicators within the built environment dimension. (Source: authors, 2024).
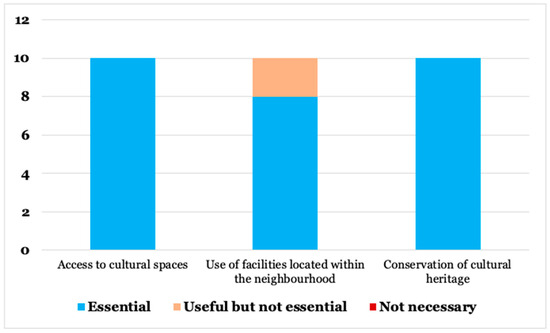
Figure 9.
Scores of the indicators within the cultural dimension. (Source: authors, 2024).
Firstly, sixteen indicators received perfect scores of 10/10 in the “essential” category, underscoring their critical importance in evaluating sustainability. These indicators include, inter alia, the preservation of natural resources, access to healthcare services, and access to potable water and electricity. The unanimous recognition of these indicators by the experts signifies their indispensable nature for a comprehensive evaluation of sustainability. Consequently, they were included in the final list of retained indicators.
Secondly, four indicators received scores of 9/10, which also classifies them among the essential indicators. Although their scores are not perfect, they meet the minimum number of favorable expert opinions required by the validation method employed. These indicators, which include urban vegetation density, access to individual sanitation systems, employment, and the use of local materials, were also incorporated into the final list. Their inclusion is justified by their relevance and alignment with sustainability objectives, despite their slightly lower relative importance compared with the indicators that scored 10/10.
Thirdly, eleven indicators received scores below 9/10 in the “essential” category, with the lowest being 5/10 (Figure 8). This indicates that, according to the experts, they are useful but not indispensable for the evaluation of urban sustainability within the context of this study. Among these indicators are the reduction of CO2 emissions, outdoor spaces, and involvement in environmental management, inter alia. Consequently, these eleven indicators will not be included in the final list.
In the environmental dimension, three indicators obtained perfect scores of 10/10 in the “essential” category (preservation of natural resources, Environmental Impact Assessment, and solid waste management). One indicator received a score of 9/10 in the “essential” category (urban vegetation density), while the remaining two obtained scores of 8/10 (reduction of CO2 emissions) and 7/10 (involvement in environmental management), also in the “essential” category.
Regarding the social dimension, six indicators obtained perfect scores of 10/10 in the “essential” category (access to drinking water, access to electricity, access to amenities in public spaces, access to health services, access to education, and security). One indicator achieved a score of 9/10 (access to individual sanitation), while two others received scores of 8/10 (land tenure security) and 6/10 (natural gas utilization).
Two indicators within the economic dimension achieved perfect scores of 10/10 in the “essential” category (entrepreneurship dynamics and construction materials prices). One indicator received a score of 9/10 (employment), while the remaining two obtained scores of 8/10 (housing cost) and 7/10 (external aid).
In the built environment dimension, three indicators achieved perfect scores of 10/10 in the “essential” category (rational land use, flood management, and accessibility and mobility). One indicator obtained a score of 9/10 (use of local materials), while two others obtained scores of 7/10 (quality of construction materials and road safety). Additionally, two indicators received scores of 5/10 (outdoor spaces) and 6/10 (use of the neighborhood’s natural potential).
Finally, in the cultural dimension, two indicators achieved perfect scores of 10/10 in the “essential” category (access to cultural spaces and conservation of cultural heritage). One indicator received a score of 8/10 (use of facilities located within the neighborhood).
4. Results
The final list comprises 20 indicators, representing 65% of the indicators submitted for validation. Figure 10 illustrates the proportion of these indicators by dimension. The result reveals that 35% of these indicators are associated with the social dimension, underscoring the paramount importance stakeholders place on social issues within the context of urban sustainability. Environmental and built environment issues rank second at 20%, while the economic and cultural dimensions, respectively, occupy the penultimate (15%) and last position (10%). This distribution suggests that the primary obstacles to development in this context must be addressed by focusing on improving the performance of these indicators, with significant efforts directed towards the social domain. Stakeholders have clearly identified social issues as critical for enhancing urban sustainability. Therefore, it is imperative to concentrate efforts and resources on improving the performance of social indicators to overcome these obstacles. Furthermore, the selected indicators are divided into two main categories. Some are distinguished by the uniqueness of their variable and are considered simple indicators. Others consist of two to three variables and are thus classified as composite or aggregated indicators (Table 5).
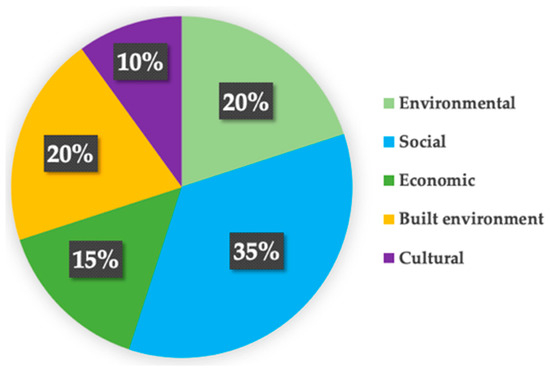
Figure 10.
Proportion of indicators per dimension. (Source: authors, 2024).
Table 5.
The final list of optimal indicators selected.
All the indicators selected for the final list (Table 5) are accompanied by justifications and detailed narrative descriptions, underscoring their importance and alignment with the Sustainable Development Goals (SDGs). As a result, they are considered scientifically valid and appropriate for the users’ needs in the specific context of this study. These indicators address a broad spectrum of local priority issues and are based on data availability, ensuring they are economical to collect and utilize. However, the application and measurement of these indicators’ performance are not within the objectives of this study.
- A.
- Environmental dimension
This dimension focuses on analyzing issues related to biodiversity preservation in urban areas, particularly as the effects of climate change increasingly impact urban systems and populations [2,35], and urbanization places considerable pressure on natural resources. Implementing development actions, including the preservation of natural resources, benefits both the population and the environment, thereby contributing to urban sustainability [34]. The necessity to preserve natural resources in cities is guided by global directives. For instance, SDG 15.1 emphasizes the preservation of forests and wetlands in urban areas, while SDG 11 encourages promoting access to green spaces for all urban residents. The presence of green spaces in cities is essential for various reasons. Besides enhancing air purification and ensuring the mental and psychological well-being of the population, green spaces contribute to water cycle regulation by promoting efficient water infiltration during the rainy season and maintaining groundwater availability during the dry season [100]. Furthermore, urban environmental preservation also entails effective waste management to prevent pollution and reduce its adverse effects on both the population and natural resources [100]. For example, poor plastic waste management can significantly impede rainwater infiltration, potentially disrupting the water cycle. This dimension is composed of four indicators.
- Preservation of natural resources
In this study, natural resources encompass urban forests, wetlands, and riverbanks located within or adjacent to neighborhoods. These natural spaces play a crucial role in regulating urban systems and maintaining ecological balance. This indicator aims to evaluate the level of compliance with the minimum buffer zones between residential areas and natural spaces, as defined by current environmental regulations, including measures taken to prevent their long-term degradation.
- 2.
- Environmental impact assessment (EIA)This indicator aims to ensure that existing or planned commercial facilities, small industrial processing units, and development projects in neighborhoods do not negatively impact the urban environment. It is based on two variables:
- 2.1.
- Pollutant Management: This variable determines the proportion of facilities identified by environmental agencies as producers of toxic pollutants that are equipped with pollutant management systems. Such systems include the recovery of toxic waste, its temporary storage in secure tanks, and its transfer to specialized centers for disposal.
- 2.2.
- EIA compliance report: this variable assesses the consistency of conclusions drawn from environmental impact studies with the actual implementation of urban development projects within neighborhoods.
- 3.
- Solid waste managementPromoting a healthy urban environment, aimed at reducing the risks of disease and mitigating air, surface water, and groundwater pollution, necessitates effective urban waste management, as advocated by SDG 11. This indicator seeks to ensure proper management of solid waste in urban neighborhoods to achieve this objective. It is evaluated through two key variables:
- 3.1
- Waste collection strategy: This variable assesses the presence and quality of infrastructure for managing solid waste within neighborhoods. Key aspects include the availability of waste pre-collection sites meeting environmental standards, the provision of bins for selective sorting, and the frequency of collection and the routes taken by vehicles.
- 3.2
- Access to waste management services: this variable measures the percentage of households subscribed to waste management services, ensuring regular waste collection.
- 4.
- Urban vegetation densityThis indicator evaluates the density of vegetation in urban areas. Trees play a crucial role in enhancing urban quality, improving population well-being, and contributing to urban system regulation. Two variables are utilized to assess vegetation density within this framework:
- 4.1.
- Distribution of public green spaces: This variable evaluates the availability level and accessibility of public green spaces to urban populations. Accessibility is measured by the number of households within a 10 to 20 min walking distance who have utilized these recreational areas at least once in the past year.
- 4.2.
- Proportion of vegetated space per capita: Vegetated space encompasses landscaped green spaces and other wooded areas within the city. Data on the surface areas of these spaces are annually collected and updated by Green Space Observatories in cities. This variable determines the per capita proportion of vegetated space in neighborhoods, which is then compared against the average green space required per capita according to national environmental regulations.
- B.
- Social dimension
This dimension focuses on analyzing the challenges related to access to essential social services in cities across Sub-Saharan Africa, highlighting the dual imperative for urban managers. Firstly, they must meet the increasing demands for basic social services from a growing urban population. Secondly, they need to mitigate the impacts of climate change to foster development while preserving urban biodiversity [46]. In many of these cities, access to fundamental social services such as clean drinking water, electricity, and sanitation remains significantly inadequate compared with the escalating demand [13,14,46,101]. Consequently, the United Nations advocates expediting the implementation of these services, particularly in Sub-Saharan African cities. For instance, SDG 3 promotes universal access to quality healthcare; SDG 4 emphasizes equitable access to quality education for all children, irrespective of gender, to enable them to contribute to their countries’ development. Similarly, SDG 6 targets universal access to clean water and sanitation, essential for sustaining life, while SDG 7 aims for universal access to electricity.
- 5.
- Access to drinking waterThis indicator evaluates the availability and accessibility of drinking water at the neighborhood scale. It consists of two primary variables:
- 5.1.
- Availability of the potable water supply network: This variable assesses the extent to which the water distribution network covers neighborhoods. It distinguishes between areas covered by the network and those that are not.
- 5.2.
- Households connected to the drinking water distribution network: This variable measures the proportion of households that have effective access to potable water. Household access to water implies subscription and connection to the drinking water distribution network.
- 6.
- Access to electricityAccess to a clean and sustainable electricity source empowers communities to achieve their full potential [102]. Electricity enhances educational systems by facilitating knowledge transfer, fostering commercial activities, and improving public health systems, among other benefits [103]. The issue of electricity within the context of sustainable development in Sub-Saharan African cities presents unique challenges. While developed countries focus on reducing household energy consumption [12], Sub-Saharan cities primarily face the task of expanding electrical infrastructure to meet the needs of a substantial portion of the population still lacking access. According to the Tracking SDG 7: The Energy Progress Report of 2023, Sub-Saharan Africa remains the least electrified region globally, with electricity access rates increasing marginally from 46% in 2018 to 48% in 2020 [104]. This indicator is evaluated using two key variables:
- 6.1.
- Presence of the electricity distribution network: this variable assesses the extent to which the electricity distribution network covers neighborhoods, providing insights into areas served and those lacking access.
- 6.2.
- Accessibility to electricity: this variable measures the proportion of households with access to electricity compared with the total number of households in a neighborhood.
- 7.
- Access to individual sanitation systemsThe establishment of effective sanitation systems enhances public health and contributes to environmental protection [34]. In Sub-Saharan cities, there is a notable absence of comprehensive, centralized sewage management systems. As a result, household wastewater is often managed through individual approaches or discharged directly into the environment, posing significant risks of disease transmission and surface and groundwater pollution [101]. The scope of the individual sanitation system in this study includes all domestic wastewater management facilities, encompassing collection, temporary storage in cesspits, and disposal through emptying services provided by either private or public entities. This indicator assesses the proportion of households in neighborhoods equipped with individual sanitation systems.
- 8.
- Access to amenities in public spacesThis indicator evaluates the availability and quality of amenities in public spaces, which significantly contribute to maintaining public cleanliness and reducing the spread of diseases. SDG 6.2 underscores the importance of ensuring universal access to adequate sanitation, including in public spaces, by 2030, thereby facilitating the transition to sustainable cities, especially in the Sub-Saharan region. In this study, amenities refer to sanitary facilities such as toilets and washbasins provided in public spaces. This indicator quantifies the number of installations and public spaces equipped with functional amenities.
- 9.
- Access to health servicesHealth and well-being rank third among the United Nations’ sustainability goals. In sub-Saharan African cities, health systems are characterized by fragility, insufficient qualified personnel, and a significant financial barrier preventing many households from seeking treatment at health centers [103]. Consequently, SDG 3 strongly urges countries in this region to invest substantially in programs aimed at expanding access to health services across all social strata. Universal access to quality health services enables populations to receive proper medical care, thereby enhancing their physical and mental capabilities to contribute effectively to national development and the achievement of sustainability goals. This indicator aims to assess the accessibility of health services to the population and is evaluated through two variables:
- 9.1.
- Access to the health system: This variable measures the proportion of households affiliated with either public or private health services. Affiliation implies that all household members are covered by social security and have access to medical care when needed.
- 9.2.
- Utilization of health services: This variable assesses the utilization trends of health services, indicating the number of households that have sought medical care at least once annually from hospitals, health centers, or clinics.
- 10.
- Access to educationEducation plays a pivotal role in fostering community survival and prosperity. It serves as a crucial lever in combating poverty by breaking its intergenerational cycle and contributes significantly to enhancing socio-economic development [105]. The imperative of ensuring universal access to quality education, regardless of gender or age, is underscored by SDG 4. This goal calls upon countries, particularly those in sub-Saharan Africa facing substantial educational infrastructure needs due to rapid population growth, to increase investment in education. This effort aims to equip communities with the skills necessary to actively and responsibly contribute to their country’s sustainable development through creativity and innovation across all sectors [34]. This indicator comprises two key variables:
- 10.1.
- Education level of the household head: This variable measures the proportion of household heads who have completed at least secondary education. Comparing this variable over specific time intervals enables observation of progress or regression in the educational attainment of populations, thereby assessing the relevance of educational advancements or identifying setbacks.
- 10.2.
- Pupil enrollment: This variable measures the proportion of school-age children actually enrolled in schools compared with the total number eligible for schooling. It assesses the accessibility of education across different socio-economic strata, highlighting disparities and facilitating targeted interventions.
- 11.
- SecuritySecurity is a fundamental component for achieving the SDGs by 2030 [34]. Consequently, SDG 16.a emphasizes the reduction of crime and violence across all levels, particularly in southern countries. This underscores that fostering secure environments at the local level enhances community confidence, thereby promoting their engagement and participation in neighborhood development initiatives. This indicator aims to assess neighborhood safety based on the incidence of violent acts, encompassing crimes, misdemeanors, and other recorded acts of violence within a community over the course of a year.
- C.
- Economic dimension
Achieving the Sustainable Development Goals requires the creation of sustainable wealth opportunities in cities, enabling populations to secure a reliable income for meeting basic needs and fostering societal development [3]. In this regard, UN SDG 8 calls upon countries to intensify efforts in job creation, particularly in southern regions. Therefore, this dimension focuses on analyzing issues concerning the local economy, employment, and the financial capacity of household heads to afford housing construction expenses from a sustainability perspective. This dimension encompasses three key indicators.
- 12.
- Entrepreneurship dynamics
Entrepreneurship, as addressed in this study, encompasses businesses of all types established according to requisite administrative procedures. For instance, in the city of Moundou, the focus of this study, these businesses are formally recognized by both the Chamber of Commerce and Industry and the National Agency for Investments and Exports. Local authorities prioritize promoting entrepreneurship to empower populations, especially youth, in terms of employment, aligning with UN SDG 8’s goal of fostering entrepreneurship to achieve full and productive employment and decent work for all by 2030 [34]. The initial step in fostering entrepreneurship involves creating conducive conditions that facilitate and stimulate entrepreneurial initiatives [3]. To assess entrepreneurship dynamics and its impact on the local economy, this indicator annually determines the number of operational businesses in a given neighborhood. By comparing business numbers year-over-year, trends of growth or decline can be identified.
- 13.
- EmploymentEmployment is pivotal for livelihoods and contributes to improving community standards of living [106]. This indicator aims to evaluate the employability of the working-age population and their economic contribution to the local economy. It comprises two variables:
- 13.1.
- Households with active adults: This component measures the number of households where adults are engaged in paid economic or professional activities.
- 13.2.
- Households with adults in formal employment: This variable quantifies the number of household heads who are employed and contributing to a pension fund.
- 14.
- Construction material pricesThis indicator aims to assess the alignment of construction material prices, as stipulated by regulatory frameworks, with the average purchasing power of the population. This evaluation is critical to ensure the realization of safe and resilient housing projects in the face of contemporary climatic hazards, a pivotal element in advancing urban sustainability as per UN SDG 11. The indicator relies on the Harmonized Index of Industrial Production (HIIP) from INSEED, enabling annual monitoring of construction material prices by comparing regulatory prices with actual market rates [107].
- D.
- Built environment dimension
The built environment in this study encompasses the physical characteristics of neighborhoods, focusing on integrating the local environmental context into housing construction projects, land capital management, flood management, accessibility, and mobility. Considering these factors in development processes is crucial for fostering a secure, resilient, and sustainable urban environment, in line with UN SDG 11.b. This goal urges governments to mobilize efforts in the rational management of natural resources, particularly land, amidst increasing urbanization. It also calls for implementing effective local-level actions to address and mitigate the impacts of climate change shocks. This dimension comprises four key indicators:
- 15.
- Use of local materials
The notable changes currently observed in Sub-Saharan African cities, characterized by rising temperatures, underscore the necessity for enhanced adaptation in construction practices. This entails prioritizing the use of local materials that address contemporary environmental concerns. Utilizing local materials not only preserves architectural heritage and reduces energy consumption but also fosters sustainable job creation. Importantly, it presents a significant opportunity for climate change adaptation by curbing the importation of high-carbon materials. Moreover, buildings constructed with local materials tend to promote health and well-being due to their minimal pollutant emissions [108]. Therefore, the utilization of local materials in this context significantly contributes to achieving UN SDG 3.b, which advocates for strengthening measures to reduce health risks, and SDG 11.c, which emphasizes the use of local materials in cities of the Global South [34]. This indicator aims to assess the density of buildings and other infrastructure constructed with local materials in neighborhoods.
- 16.
- Rational land useEffective urban land management poses a significant challenge in fostering sustainability in Sub-Saharan African cities [46]. Rapid population growth and unfair practices have led to urban sprawl into peripheral areas, raising concerns about the sustainability of land resources [46,109]. Land, being a vital yet finite resource, necessitates its prudent management at the forefront of local initiatives to meet the housing needs of a continually expanding urban population, as well as future generations, as supported by SDG 12.2. This indicator is evaluated through two key variables:
- 16.1.
- Valorization of vacant plots: This variable aims to identify all unoccupied plots in neighborhoods designated for residential or commercial use and enhance their utilization. For example, it involves listing all empty plots in neighborhoods and then compelling owners, based on legal texts, to either build on their plots or, failing that, to sell them. This approach aims to densify urban areas and curtail spatial expansion.
- 16.2.
- Reuse of urban wasteland: this variable entails identifying and repurposing existing urban wastelands for public interest projects or other initiatives deemed beneficial for local communities.
- 17.
- Flood managementFlood management poses a significant challenge for local authorities today. SDG 11.b urges countries to develop integrated policies and plans to mitigate the adverse impacts of flooding, particularly in southern cities where adaptive capacities are constrained [110]. Climate change, characterized today by rainfall that falls over increasingly shorter periods but with very high intensities, raises concerns about the capacity of current rainwater drainage infrastructures to handle these large volumes of precipitation [111]. Therefore, implementing effective flood management measures is crucial for environmental preservation and enhancing the well-being of urban populations. This indicator is assessed through two primary variables:
- 17.1.
- Presence of gutters: This variable evaluates the presence and quality of rainwater drainage gutters in neighborhoods, designed in accordance with current climatic conditions. For instance, dimensions such as width and depth of gutters are determined based on reliable climate projections.
- 17.2.
- Flood Management Strategy: This variable assesses the existence of a neighborhood-level flood management strategy, which includes identifying flood-prone areas, implementing preventive measures, and undertaking actions to mitigate flood impacts (e.g., clearing drainage gutters before rain, constructing or reinforcing protective embankments).
- 18.
- Accessibility and mobilityThis indicator focuses on analyzing issues related to accessibility and mobility in sub-Saharan African cities. Recent transnational studies on urban mobility have highlighted the unique difficulties in terms of people circulation in this region, particularly due to the mismatch between infrastructure and modal realities and the inefficiency or even absence of effective and viable public transport offerings [112,113]. In these cities, the majority of daily journeys are made on foot, although underestimated due to survey types; a small proportion of journeys are made by private cars, and the rest by informal transport modes (shared taxis or motorcycle taxis) [112]. In the absence of effective public transport systems in most of these cities, and even when they exist, they are often inaccessible to the majority of poorer households, who are consequently forced to walk long distances, sometimes up to 10 km [112]. In terms of infrastructure development, studies have shown that road designs in these cities are often misaligned with modal realities [113]. In many ways, there is considerable attention paid to cars, which represent only a small modal share of daily journeys in sub-Saharan African cities. Safe infrastructure for active modes of displacement, such as walking and cycling, even though cycling is rarely practiced, is often nonexistent, and when it does exist, it is either poorly adapted to modal realities or only partially implemented. A striking example is Addis Ababa in Ethiopia, where 65% of the road is built without sidewalks [112]. The consequence of inadequate infrastructure relative to modal realities in these cities leads to regular traffic-related fatalities, with pedestrians paying the highest price [112]. In this context, SDG 9 and SDG 11 encourage the implementation of safe and resilient infrastructure, taking into account modal shares in the road construction, in order to promote and secure the free movement of people [28]. However, to achieve the goal of sustainable mobility in these cities, urban managers must simultaneously address two major challenges. Beyond readjusting road infrastructure to consider modal shares and developing efficient public transportation, or even mass transport, they must also address the issue of poverty among a significant part of the population to guarantee fair access for all and to guarantee the profitability, and thus the viability, of mobility systems in the long term [112,114]. This indicator is assessed by three variables.
- 18.1.
- Development of access roads: This variable assesses the proportion of neighborhood access roads developed with consideration for modal shares that reflect local transportation realities. For instance, roads are designed with allocated sidewalk widths proportional to the share of daily trips made on foot, secure lanes for other active modes, and efficient crossings.
- 18.2.
- Access to public transport: this variable measures the percentage of households utilizing public transportation for various purposes, such as commuting to work, conducting administrative tasks, shopping at local markets, or visiting relatives in hospitals.
- 18.3.
- Travel time to workplaces and facilities: this variable evaluates the number of households located within a 10 to 20 min travel radius from their workplaces, as well as from essential public facilities such as healthcare and educational institutions.
- E.
- Cultural dimension
This dimension focuses on analyzing the identity and cultural aspects at the local scale, particularly by examining the attributes of neighborhoods that contribute to enhancing and perpetuating the sense of recognition and belonging among their populations. This sense of belonging often hinges on social connections, historical narratives, and elements of identity that evoke memories of a territory, such as landmarks, statues, and monuments valued by local communities for their cultural significance [115]. Culture plays a pivotal role not only in transmitting local knowledge and skills across generations but also in fostering community well-being. In this context, UN SDG 11.4 urges states and local communities to promote urban development initiatives aimed at preserving cultural identities and local heritage [34]. This dimension comprises two indicators:
- 19.
- Access to cultural spacesCultural spaces encompass venues like cultural centers, neighborhood squares, and youth centers, serving as public hubs for cultural events and knowledge exchanges. This indicator evaluates the availability and quality of existing cultural spaces through two variables:
- 19.1.
- Presence of cultural facilities: This variable measures the proximity of households within a 10 to 20 min walking distance from cultural spaces and facilities.
- 19.2.
- Accessibility of households to cultural facilities: This variable assesses the extent to which households have access to at least one cultural facility throughout the year.
- 20.
- Conservation of cultural heritage
In this context, cultural heritage encompasses cultural resources such as monuments, historical buildings, statues, and sites of recognized heritage value to communities. Cultural heritage plays a crucial role in transmitting local knowledge across generations, serving as a reference point for future urban development decisions that integrate cultural values [115]. Recognizing this importance, the United Nations’ SDG 11.4 strongly encourages governments and communities to take actions aimed at preserving cultural heritage for future generations [34], given its substantial contribution to promoting urban sustainability and more broadly, the planet. This indicator focuses on promoting the maintenance and conservation of cultural heritage at the local scale. It enables annual evaluation of the strategies implemented by communities and heritage services for conserving cultural resources. For instance, assessments may include reviewing the physical condition of heritage sites and evaluating resources allocated for their maintenance or restoration, particularly for degraded sites.
5. Discussion, Limitations, and Research Perspective
5.1. Selection of Optimal Indicators
This study employed a participatory and inclusive methodological approach to identify local issues and revise the priority sustainability objectives set by local authorities, culminating in the selection of an initial list of indicators. This process ensures that the chosen indicators accurately reflect both the vision of local authorities and the primary concerns of the local population, particularly regarding sustainability. Additionally, the study was conducted across five neighborhoods with diverse characteristics, enabling the contextualization of data and encompassing a broad spectrum of local issues. This approach is vital in the context of this study, where disparities between neighborhoods within the same city are often more pronounced. For instance, among the five neighborhoods used to contextualize the data in this study, some, despite being densely populated, lack fundamental social services such as water, electricity, and sanitation. Conversely, other neighborhoods with moderate population densities possess these essential services. These characteristics specific to sub-Saharan cities can be attributed to urbanization often preceding the establishment of necessary infrastructure and deficiencies in the financing of urban services by public authorities [46]. Therefore, focusing solely on a single neighborhood, particularly a high-end residential area, to conduct this study would have been exceedingly restrictive and would not have allowed for the consideration of all local issues pertinent to the evaluation of urban sustainability in this context.
The selected indicators are organized into five dimensions, each grouping indicators that address similar or related issues and are aligned with the targets of the Sustainable Development Goals (SDGs). These explicit correspondences between the indicators and the SDGs ensure their relevance in the context of sustainable development. Figure 5, Figure 6, Figure 7, Figure 8 and Figure 9 display the distributions of scores obtained by each indicator, based on expert perceptions, which allowed for the establishment of a final list comprising 20 essential indicators. The designation “essential” signifies that these indicators have obtained the requisite thresholds according to the validation methodology employed (step 4) and that they address local priority issues in terms of sustainability. A detailed analysis of the proportionality of these indicators, according to their distribution by dimension, reveals that social issues are paramount among stakeholders’ concerns. The essential indicators include access to health services, drinking water, education, sanitation, inter alia. The preeminence of the social dimension can be explained by significant and enduring disparities in access to basic services in the studied context. Therefore, improving the performance of these indicators can not only substantially contribute to the well-being of populations but also lead to progress in other sectors. For instance, an educated and healthy population is more dynamic and capable of actively contributing to their country’s development, notably by engaging in social life, adopting responsible consumption practices, and participating in environmental protection initiatives. Moreover, this enables public authorities to reduce expenditures on health service subsidies, allowing these resources to be reallocated to other priority sectors, such as climate change adaptation. The findings of this study also underscore the importance of several key indicators in the environmental and built environment dimensions, including the preservation of green spaces, rational land use, flood management, accessibility, and mobility, inter alia. These indicators are pivotal within the context of this research, as enhancing their performance can address both current and emerging climate challenges. For instance, preserving urban green spaces and wetlands can significantly mitigate the impacts of floods by reducing runoff and enhancing water absorption. Similarly, rational land use curtails uncontrolled urban sprawl and fosters economic development by facilitating investment and optimizing the use of available resources.
The results of this study exhibit certain similarities with those obtained by other researchers in different regions. For instance, in Latin America, particularly in Colombia and Brazil, studies indicate that priority sustainability indicators in the social and economic dimensions include access to water, electricity, sanitation, education, and employment [116,117]. Similarly, in China, social indicators such as access to water, electricity, and sanitation are also considered priorities for sustainability [25]. This focus on improving access to essential services highlights that these southern countries share common challenges, notably the pursuit of developing basic social services amidst increasing demand. This contributes to the improvement of living conditions and, consequently, to poverty reduction, although China is currently more advanced in this regard. This suggests that over the decades, these countries have accumulated delays in the provision of urban services, often because urban investments have not kept pace with the demand. Therefore, these specific conditions hinder the effective implementation of sustainability in these cities, requiring substantial efforts from public authorities to simultaneously address the challenges of providing basic services and tackling major issues such as climate change and rapid urbanization. These specific conditions could also impede the achievement of certain Sustainable Development Goals (SDGs), particularly in Sub-Saharan African cities, which already face significant delays and must concurrently confront other major challenges. This situation may compel local authorities to prioritize certain SDGs over others based on urgency and available resources.
Furthermore, the results of this study also display that indicators related to environmental and built environment dimensions exhibit similarities with findings from other countries across both the Global North and South. For example, indicators such as the preservation of natural resources, access to green spaces, rational land use, and the preservation of local heritage are considered benchmarks for sustainability measurement [21,25,78,116,117]. This reflects a global recognition of the necessity to preserve environmental parameters, which are crucial for mitigating the impacts of climate change. This collective awareness arises from the understanding that climate change affects all regions of the world, albeit with significant regional variations. Another highly important indicator in contemporary studies is accessibility and mobility. This is expected, as an efficient urban mobility system can significantly reduce energy consumption and, consequently, limit CO2 emissions. However, strategies to promote sustainable transportation and mobility vary across regions. In Northern countries, where the automobile is the predominant means of transport, the challenge lies in drastically reducing the number of vehicles on the road through public transport policies, such as promoting soft mobility or carpooling. In contrast, in the context of this study, where walking constitutes a significant portion of daily journeys, the primary challenge is to redesign road infrastructure to better cater to pedestrian needs and safety. These regional variations underscore the importance of adapting urban sustainability strategies to local contexts, ensuring that implementations are both effective and relevant to the specific issues and needs of the local population.
5.2. Links between Selected Indicators and Local Issues
Selected based on local issues, the application of these indicators is expected to significantly enhance the well-being of the population while ensuring a sustainable living environment. Indeed, within the environmental dimension, priority issues include improving environmental quality and integrating contextual realities into urban development programs. In this context, stakeholders believe that indicators for environmental impact assessment and waste management should play a prominent role in this process. Similarly, neighborhood development processes should be carried out in harmony with the natural environment and should promote environmental awareness to preserve urban vegetation. For example, the Guelbé neighborhood, one of the most densely populated in Moundou, is constantly evolving. However, stakeholders believe that this transformation should occur while preserving its natural spaces, such as wetlands, and avoiding the reduction of the banks of Lake Taba. This is crucial due to their important ecological role not only in regulating Moundou’s urban system but also in contributing to climate change mitigation. This contributes to global sustainability, as sustainability actions and practices initiated at the local level are more effective in promoting the overall sustainability of our planet [9,26].
In the social dimension, the selected indicators reflect the urgent need to address significant delays in the provision of basic social services, essential for developing human potential and achieving sustainable development goals. Therefore, indicators such as access to water and electricity have been considered extremely important in this context. Special emphasis should also be placed on the development of amenities in public spaces and household access to individual sanitation systems. The approach of an individual sanitation system is viewed by city managers as more realistic and achievable, given the increasing demographic pressure, significant delays in sanitation infrastructure, and limited resources to implement a centralized sanitation approach (sewage system). To promote sustainability, stakeholders believe it is crucial to improve public health policy and support the education system, as access to quality healthcare and education remains a major concern due to high costs, insufficient infrastructure, and a lack of qualified personnel. Additionally, stakeholders believe it is fundamental to establish a climate of total security in neighborhoods to restore residents’ trust and encourage their ongoing engagement in the development of their communities.
On the economic front, employment has been deemed highly important as it constitutes the population’s primary source of livelihood. Extensive discussions during the selection phases highlighted the persistently high unemployment rate within the study’s context. Although the United Nations has reported a global decrease in the unemployment rate, from 6.6% in 2020 to 5.4% in 2022 [118], it remains significantly high in this particular context. For instance, in the city of Moundou, which serves as the study’s focal point, securing employment is extremely challenging for the working-age population due to a drastic reduction in job opportunities linked to the economic downturn in Chad since 2016, leading to the closure of major companies and employment providers [3]. Thus, economic recovery is a pressing issue, necessitating a focus on improving the business climate to attract new investors. In this context, the indicator of entrepreneurship dynamics is considered crucial for tracking trends in job creation. Stakeholders also emphasize the importance of the indicator for construction material costs, arguing that the construction of safe and sustainable housing depends on the financial capacity of builders. Therefore, ensuring a balance between construction material costs and the purchasing power of the population is essential for achieving urban sustainability goals.
In the built environment dimension, major issues include controlling urban sprawl and spatial occupation, particularly in a context marked by an increasingly growing urban population. Therefore, the rational land use indicator has been deemed highly important. People’s movements must be facilitated and optimized, especially in a context where walking plays a significant role in the mobility system. Consequently, the challenge at this point is to improve accessibility and mobility by prioritizing secure pedestrian infrastructure. To promote neighborhood sustainability, stakeholders have also emphasized the importance of integrating housing into its environment. The use of local materials in housing construction is considered a good indicator for assessing the sustainability of Moundou’s neighborhoods. Another critical indicator is the effective management of floods. This indicator is viewed as extremely important by stakeholders due to the intensifying effects of climate change in the city, characterized by shorter but more intense periods of rainfall. Thus, this indicator allows for a progressive evaluation of the relevance of flood management programs and their impacts in mitigating the effects of climate change.
Finally, in the cultural dimension, the issue of preserving local identities has been strongly recognized in this study. This recognition, although largely advocated by cultural and artistic figures, has also resonated with other stakeholders. Discussions have emphasized the importance of preserving cultural sites and spaces in neighborhoods. For example, stakeholders considered that conserving the statues and monuments in the Dombao and Gueldjem 2 neighborhoods is essential. These cultural artifacts serve as references, transmitting local history and knowledge to future generations, preserving neighborhood identity and memory, and documenting their evolution through the valorization of a common heritage. This suggests that, in the context of this study, culture emerges as an important factor in sustainability, notably by promoting the development of a sense of recognition and belonging to the neighborhood, which is the basis for social stability. The indicator of access to cultural spaces is also crucial, as these spaces are considered the foundation of socialization practices essential for neighborhood development.
5.3. Contribution to the Existing Literature
This study makes three major contributions to the literature on urban sustainability. Firstly, it selected 20 indicators to holistically assess sustainability at the local level in the Sub-Saharan context, using the city of Moundou as a case study. This approach is particularly valuable for local authorities as it enhances decision-making by focusing on essential issues, thereby facilitating the efficient allocation of available resources to address real development challenges. Previous research on sustainability indicators in Sub-Saharan Africa is limited, and existing studies do not address all urban issues; see, for, example [27,28,29]. Therefore, this study makes a significant contribution by selecting indicators that cover a wide range of urban issues. Secondly, the proposed methodology enables the selection of indicators that address diverse local issues specific to this study’s context. This methodological framework can serve as a model for selecting local indicators in other geographical and social contexts. Thirdly, the findings of this study underscore the priority accorded to social aspects, particularly in terms of enhancing the well-being of the population, as well as the paradoxes in sustainability assessment across different contexts. This paves the way for discussions on the necessity of contextualizing the use of certain concepts according to the development issues and priorities specific to each study context. For instance, the concept of well-being, frequently employed in the Human Development Index by the UNDP, holds different connotations depending on the context. In developed countries like the United States, it refers to social aspects such as happiness and equity [12]. Conversely, in the context of this study, it relates to the population’s access to fundamental social services such as sanitation, healthcare, and drinking water. Another example concerns the concepts of energy efficiency and energy sobriety, which advocate for a more efficient use of energy in homes and a reduction in car dependency. These concepts are more relevant for assessing urban sustainability in developed countries where household energy demand is high and cars are the primary mode of transport. However, in Sub-Saharan African cities, where access to electricity remains a significant challenge and walking is a predominant mode of daily journeys, these concepts are less applicable. Therefore, in the context of urban sustainability in Sub-Saharan Africa, it is crucial to redefine these notions by considering contextual realities and clearly specifying their characteristics and limitations.
5.4. Indicators and Baseline Data
One of the primary challenges hindering effective utilization of indicators relates to accessing reliable baseline data, as emphasized by several authors. For instance, Kaur and Garg (2018) revealed that measuring urban sustainability is often hindered by the inappropriateness of certain indicators for the specific local realities of cities, whose issues may differ significantly from those where the indicators were originally developed [24]. This discrepancy underscores the importance of selecting indicators methodologically, considering the adaptability to local issues, availability of data, and user comprehension [84]. Similarly, Tanguay et al. (2010) demonstrated that several well-developed indicators have not been effectively utilized due to a lack of consensus on selection methodologies and the optimal number of indicators [80]. Other researchers have indicated that effectively evaluating urban sustainability in developing countries, particularly in Sub-Saharan Africa, remains challenging due to inadequate baseline data at both national and local levels [43,87]. However, this obstacle can persist only if the indicator selection process lacks sufficient grounding in the specific realities of the study context and if the approach of selection does not engage local communities or consider data availability. Moreover, a recent study has shown that the main difficulties in applying strategic tools in urban environments in Sub-Saharan Africa lie in the lack of information sharing, and thus data, as well as in the lack of coordination and knowledge [36]. Therefore, effective coordination in data collection and harmonization, facilitated through a mechanism that integrates all stakeholders, could significantly enhance continuous access to urban data. This approach can be reinforced by the decentralization process initiated in Sub-Saharan cities over the past few decades. For instance, delegating financial management authority to municipalities enables regular data collection on entrepreneurial dynamics, especially since municipalities have detailed maps of the location of all businesses within their jurisdiction, enabling them to collect taxes monthly. Similarly, data related to essential services such as water and electricity can be sourced from utility companies, which possess maps of their networks, including the number of households subscribed by areas. Furthermore, the collection and formalization of specific data within the framework of this research necessitate the use of spatial analysis tools like Geographic Information Systems (GIS) to map and quantify spatial data. For example, GIS can facilitate the collection of data on green spaces, wetlands, and vacant plots within neighborhoods.
5.5. Limitations and Research Perspective
Regarding the limitations of this study, it is crucial to highlight the following points: (1) The determination of indicator weights was based exclusively on stakeholder input and did not incorporate an Analytical Hierarchy Process (AHP) or expert scoring methodologies; (2) the selection of these indicators was solely based on the primary issues of the city to provide an overall perspective on neighborhood sustainability and, consequently, on the city as a whole. However, this approach did not initially consider the complexity of the urban system. The indicators were chosen based on the city’s development issues and categorized by themes or dimensions of urban sustainability, without accounting for the interdependencies that exist among them. This sectoral approach could be restrictive during evaluation, as it does not clearly prioritize indicators that need immediate attention to effectively enhance the living environment toward sustainability. Therefore, an indicator system would be more representative of the complex reality. In the next phase of this ongoing research program, we aim to develop a model that represents urban phenomena to systematically organize the causal relationships among these 20 selected indicators. This approach will facilitate a deeper understanding and representation of the urban system and its trends. For instance, promoting entrepreneurship development necessitates interventions in other factors such as creating a conducive business climate to attract foreign investors, ensuring sustainable access to electricity and the internet, and enhancing accessibility through improved road infrastructure. Similarly, to reduce household healthcare costs, it is crucial to significantly diminish sources of disease transmission by promoting a healthy and pleasant living environment. This includes effective management of urban waste, reducing the discharge of toxic pollutants into nature, and ensuring access to adequate sanitary facilities for the population.
6. Conclusions
This study selected a list of 20 optimal indicators based on an inclusive and participatory methodology to evaluate the sustainability of the city of Moundou and, more broadly, other Sub-Saharan cities. The analysis of the proportionality of these indicators by dimension reveals that 35% of the selected indicators pertain to the social dimension, underscoring a significant interest from stakeholders in social issues within the context of this study. Indicators related to environmental and built environment dimensions come second, each constituting 20%, whereas the economic and cultural dimensions represent 15% and 10% of the selected indicators, respectively. Although this distribution of indicators by dimension is unequal, all the selected indicators are deemed essential as they met the required scores according to the validation method employed. This implies that they encompass a wide range of local issues pertinent to this study’s context. Consequently, their application is expected to significantly enhance decision-making processes from a sustainability perspective, with a particular emphasis on social aspects. Moreover, the methodology proposed in this research can be effectively transferred and replicated in other geographical contexts, provided that the indicator selection process is tailored to the specific realities and needs of each city and actively involves local populations and authorities. Finally, to achieve feasible results and avoid overburdening development actors with data collection processes, it is essential to limit the number of selected indicators, ensuring they are specific and measurable.
Author Contributions
Conceptualization, E.H.; methodology, E.H.; software, E.H.; validation, C.C.A. and O.B.; formal analysis, E.H.; investigation, E.H.; resources, E.H. and C.C.A.; writing—original draft preparation, E.H.; writing—review and editing, E.H. and N.A.; visualization, C.C.A. and O.B.; supervision, C.C.A. and O.B.; project administration, C.C.A.; funding acquisition, E.H. All authors have read and agreed to the published version of the manuscript.
Funding
This research was generously funded by the World Bank Group (IDA), through the Regional Centre of Excellence on Sustainable Cities in Africa (CERViDA-DOUNEDON/UL), with a total amount of 4850.49 USD, (funding number IDA 5360 TG). The financial support provided was instrumental in advancing the scholarly inquiry, enabling a rigorous exploration of critical issues pertaining to sustainable urban development in Africa.
Institutional Review Board Statement
Not applicable.
Informed Consent Statement
Informed consent was obtained from all subjects.
Data Availability Statement
Data will be available on request.
Acknowledgments
The authors extend their profound gratitude to the Regional Centre of Excellence on Sustainable Cities in Africa (CERViDA-DOUNEDON/UL), the Association of African Universities (AAU), and the World Bank Group (IDA) for their generous financial contributions and scientific supervision, which were pivotal in facilitating this research. Their supports have been indispensable in advancing this scholarly work and significantly enriching the investigation into sustainable urban development in Africa.
Conflicts of Interest
The authors declare no conflict of interest.
References
- European Environment Agency. Urban Sustainability Issues-What Is a Ressource-Efficient City? Publications Office. 2015. Available online: https://data.europa.eu/doi/10.2800/389017 (accessed on 14 June 2023).
- Allarané, N.; Atchadé, A.J.; Azagoun, V.V.A.; Hounggnibe, A.I.; Seingue, R.G.; N’Dilbé, T.; Hetcheli, F. Assessment of climate change Risks, Vulnerability of urban health Systems, and Individual Adaptation in the City of N’Djaména (Chad). Climate 2023, 12, 5. [Google Scholar] [CrossRef]
- Haou, E. Urbanisation et Economie Locale au Tchad: Proposition d’un Projet D’aménagement Durable du Quatrième Arrondissement de Moundou; Mémoire pour l’obtention du Diplôme de Master en Urbanisme, École Africaine des Métiers de l’Architecture et de l’Urbanisme (EAMAU): Lomé, Togo, 2021; 191p. [Google Scholar]
- United Nations. Revision of World Urbanization Prospects. 2018. Available online: https://population.un.org/wup/publications/Files/WUP2018-Report.pdf (accessed on 14 June 2023).
- Zhang, P.; Haoming Yuan, H.; Tian, X. Sustainability development in China: Trends, patterns, and determinants of the “Five Modernizations” in Chinese cities. J. Cleaner. Prod. 2019, 214, 685–695. [Google Scholar] [CrossRef]
- Zucaro, A.; Ripa, M.; Mellino, S.; Ascione, M.; Ulgiati, S. Urban resource use and environmental performance indicators. An application of decomposition analysis. Ecol. Indic. 2014, 47, 16–25. [Google Scholar] [CrossRef]
- Sow, P.G.; Baigue, A.; Balagi, M.; Dos Santos, S.; Haou, E.; Léon, J.F.; Mendy, A.; Mhedhbi, Z. Le terrain concerté facilitateur de la transdisciplinarité. In Science de la Durabilité–fiche nº106; IRD: Marseille, France, 2023. Available online: https://www.ird.fr/sites/ird_fr/files/2024-05/FicheSciDur_Sow_106.pdf (accessed on 28 May 2024).
- Meerow, S.; Newell, J.P. Urban resilience for whom, what, when, where, and why? Urban Geogr. 2019, 40, 309–329. [Google Scholar] [CrossRef]
- United Nations. World Urban Forum: Cities Must be “at the Heart” of Sustainable Development, Abu Dhabi, (Émirats arabes unis). 2020. Available online: https://news.un.org/en/story/2020/02/1057021?fbclid=IwAR3lLr_iEPwXO30LHTysMGLwY2h0O9io2NNWp5eT9WWEgBriTsmgEoHHe0 (accessed on 14 June 2023).
- Annan-Aggrey, E.; Arku, G.; Atuoye, K.; Keyremeh, E. Mobilizing ‘communities of practice’ for local development and accleration of the Sustainable Development Goals. Local. Eco. 2022, 37, 219–229. [Google Scholar] [CrossRef]
- Cohen, B. Urbanization in developing countries: Current trends, futures projections, and key challenges for sustainability. Technol. Soc. 2006, 28, 63–80. [Google Scholar] [CrossRef]
- Katibi, M.; Mohamed, K.A.; Mahdzar, S.; Khaidzir, K.A.M. Measuring the sustainability of neighborhoods: A systematic literature review. iScience 2023, 26, 105951. [Google Scholar] [CrossRef]
- Aholou, C.C.; Anoumou, K.R. La quête de l’eau à Legbassito, une revendication de l’appartenance au Grand Lomé. In NOTES SCIENTIFIQUES: Homme et Société; Université de Lomé: Lomé, Togo, 2017; Volume 7, pp. 135–150. ISSN 2409-9791. [Google Scholar]
- Baron, C.; Guigma, L. Urban public water in Burkina Faso in the context of COVID-19: Institutional strategies and local adaptations in an unplanned neighborhood of Ouagadougou. Afr. Contemp. 2019, 269–270, 179–201. [Google Scholar] [CrossRef]
- Maqsood, M.; Zumelzu, A. Assessing sustainable Urban form in social housing Neighborhoods: Two cases in Southern Chile. Rev. Urban. 2022, 44, 149–165. [Google Scholar]
- Yigitcanlar, T.; Kamruzzaman, M.; Teriman, S. Neighborhood sustainability assessment: Evaluating residential development sustainability in a developing country context. Sustainability 2015, 7, 2570–2602. [Google Scholar] [CrossRef]
- Munier, N. Methodology to select a set of urban sustainability indicators to measure the state of the city, and performance assessment. Ecol. Indic. 2012, 11, 1020–1026. [Google Scholar] [CrossRef]
- Joumard, R. Mise au point d’indicateurs de développement durable. In Proceedings of the 20eme Colloque International en Evaluation Environnementale, Antananarivo, Madagascar, 26–28 October 2016; 18p. [Google Scholar]
- Pintér, L.; Hardi, P.; Martinuzzi, A.; Hall, J. Bellagio STAMP: Principles for sustainability assessment and measurement. Ecol. Indic. 2012, 17, 20–28. [Google Scholar] [CrossRef]
- Salles, J.M.; Rey Valette, H.; Mongruel, R. The sea and coastal observatories: From monitoring human-environmental interactions to the coordination of stakeholders. Dev. Durable Territ. 2021, 12, 19685. [Google Scholar] [CrossRef]
- Braulio-Gonzalo, M.; Bovea, M.D.; Ruá, M.J. Sustainability on the urban scale: Proposal of a structure of indicators for Spanish context. Environ. Impact Assess. Rev. 2015, 53, 16–30. [Google Scholar] [CrossRef]
- Cook, D.; Saviolidis, N.M.; Davíðsdóttir, B.; Jóhannsdóttir, L.; Ólafsson, S. Measuring countries’ environmental sustainability performance–The development of a nation–specific indicator set. Ecol. Indic. 2017, 74, 463–478. [Google Scholar] [CrossRef]
- Boyle, L.; Michell, K.; Viruly, F.A. Critique of the Application of Neighborhood Sustainability Assessment tools in Urban Regeneration. Sustainability 2018, 10, 1005. [Google Scholar] [CrossRef]
- Kaur, H.; Garg, P. Urban sustainability assessment tools: A review. J. Clean. Prod. 2019, 210, 146–158. [Google Scholar] [CrossRef]
- Zong, J.; Zhang, Y.; Mu, X.; Wang, L.; Lu, C.; Du, Y.; Ji, X.; Wang, Q. Prioritizing sustainable development goals in China based on a comprehensive assessment accounting for indicator interlinkages. Heliyon 2023, 9, e22751. [Google Scholar] [CrossRef]
- Turok, I.; Borel-Saladin, J. Is urbanization in South Africa on a sustainable trajectory? Dev. S. Afr. 2014, 31, 675–691. [Google Scholar] [CrossRef]
- Momoh, J.; Kangwa, J.C.; Udeaja, C.; Ruoyu, J.; Seidu, R.D. The development of SUCCEED: Urban sustainability assessment tool for developing countries with focus on Nigeria. Int. J. Build. Pathol. Adapt. 2022, 40, 380–404. [Google Scholar] [CrossRef]
- Kapatsa, C.; Kavishe, N.; Maro, G.; Zulu, S. The Identification of Sustainability Assessment Indicators for Road Infrastructure Projects in Tanzania. Sustainability 2023, 15, 14840. [Google Scholar] [CrossRef]
- Ihuah, P.W.; Eaton, D. An Evaluation of the Public Housing Estates Beneficial Sustainability Factors in the Niger Delta of Nigeria. Built. Human Env. Rev. 2014, 7, 1–17. [Google Scholar]
- IPCC. Climate Change 2023: Synthesis Report. Contribution of Working Groups I, II and III to the Sixth Assessment Report of the Intergovernmental Panel on Climate Change; Core Writing Team, Lee, H., Romero, J., Eds.; IPCC: Geneva, Switzerland, 2023; 184p. [Google Scholar] [CrossRef]
- OECD. African’s Urbanisation Dynamic. Africapolis, Mapping a New urban Geography. Editions OECD. 2020. Available online: https://doi.org/10.1787/b6bccb81-en (accessed on 15 June 2023).
- Africa Development Bank. Trends in Infrastructure Financing in Africa 2019–2020. 2020. Available online: https://www.afdb.org/fr/documents/tendances-du-financement-des-infrastructures-en-afrique-2019-2020 (accessed on 18 June 2023).
- Thoms, A.; Köster, S. Potentials for Sponge City Implementation in Sub-Saharan Africa. Sustainability 2022, 14, 11726. [Google Scholar] [CrossRef]
- United Nation. Sustainable Development Goals. 2015. Available online: https://sdgs.un.org/goals (accessed on 26 May 2023).
- Allarané, N.; Azagoun, V.V.A.; Atchadé, A.J.; Hetcheli, F.; Atela, J. Urban vulnaerability and adaptation stratégies against recurrents climate Risks in Central Africa: Evidence fron N’Djaména City (Chad). Urban Sci. 2023, 7, 97. [Google Scholar] [CrossRef]
- Allarané, N.; Atchadé, A.J.; N’Dilbé, T.-R.; Azagoun, V.V.A.; Hetcheli, F. Integrating Climate Change Adaptation Strategies into Urban Policies for Sustainable City Resilience: Barriers and Solutions in the Central African City of N’Djaména. Sustainability 2024, 16, 5309. [Google Scholar] [CrossRef]
- Mugelé, R.; Tob-Ro, N.D. La diffusion des rickshaws au Tchad, une réponse “par le bas” aux besoins de mobilité des populations urbaines? EchoGéo 2022, 62, 24169. [Google Scholar] [CrossRef]
- Tob-Ro, N.D.; Kem-Allahte, J. Degradation et entretien des infrastructures viaires dans la ville de N’Djaména, Tchad. Ann. Univ. N’Djaména 2021, 14, 118–141. [Google Scholar]
- Aholou, C.C. De la production d’une injustice spatiale à la production de la ville: Katanga, le paradoxe d’un quartier informel dans le Grand Lomé. Rev. Fac. Sci. Hom. Societ-UL 2021, 14, 181–202. [Google Scholar]
- Batel, L. The challenge of African cities. Nat. Def. 2016, 7, 145–150. Available online: https://www.cairn.info/revue-defense-nationale-2016-7-page-145.htm (accessed on 18 February 2023).
- Förster, T.; Ammann, C. African Cities and the Development Conundrum. Int. Dev. Pol. 2018. Available online: https://doi.org/10.4000/poldev.3352 (accessed on 12 May 2023). [CrossRef]
- WCED. Our Common Future: Report of the World Commission on Environment and Development. 1987. Available online: https://digitallibrary.un.org/record/139811 (accessed on 15 June 2023).
- Vaguet, A.; Brisset, S.; Eliot, E. The unbearable lightness of the sustainable city: Proof from India? The Sustainable City, from Politics to Science, Editions Quae, Collection Indisciplines. 2010; Chapter 10, pp. 145–163. Available online: https://www.cairn.info/feuilleter.php?ID_ARTICLE=QUAE_GUERM_2011_01_0143 (accessed on 10 March 2023).
- Salomaa, A.; Juhola, S. How to assess sustainability transformations: A review. Glob. Sustain. 2020, 3, 1–12. [Google Scholar] [CrossRef]
- Ward, P.M.; Smith, C.B. Housing rehab for consolidated informal settlements: A new policy agenda for 2016 UN-Habitat III. Habitat Inter. 2015, 50, 73–384. [Google Scholar] [CrossRef]
- UN-Habitat. The State of African Cities: Reinventing the Urban Transitions. 2014. Available online: https://unhabitat.org/state-of-african-cities-2014-re-imagining-sustainable-urban-transitions (accessed on 8 May 2023).
- Mancebo, F. From Rio to Johannesburg: Generalization and loss of meaning. Le Développement Durable 2010, 1, 21–62. Available online: https://www.cairn.info/le-developpement-durable--9782200244118-page-21.htm (accessed on 10 March 2023).
- Puchol-Salort, P.; O’Keeffe, J.; Reeuwijk, M.Y.; Mijic, A. An urban planning sustainability framework: Systems approach to blue green urban design. Sustain. Cities Soc. 2021, 66, 102677. [Google Scholar] [CrossRef]
- Keivani, R. A review of the man challenges to urban sustainability. Int. J. Urb. Sustain. Dev. 2010, 1, 5–16. [Google Scholar] [CrossRef]
- Woodcraft, A. Understanding and measuring social sustainability. J. Urb. Regen. Ren. 2015, 8, 133–144. Available online: https://www.ingentaconnect.com/content/hsp/jurr/2015/00000008/00000002/art00004 (accessed on 17 February 2024). [CrossRef]
- Verma, P.; Raghubanshi, A.S. Urban sustainability indicators: Challenges and opportunities. Ecol. Indic. 2018, 93, 282–291. [Google Scholar] [CrossRef]
- Childers, D.L.; Pickett, S.T.; Grove, J.M.; Ogden, L.; Whitmer, A. Advancing urban sustainability theory and action: Challenges and opportunities. Lands. Urban. Plan. 2014, 125, 320–328. [Google Scholar] [CrossRef]
- Scoones, I. The politics of sustainability and development. Ann. Rev. Env. Ress. 2016, 41, 293–319. [Google Scholar] [CrossRef]
- Ehnert, F.; Kern, F.; Bergström, S.; Gorissen, L.; Maschmeyer, S.; Egermann, M. Urban sustainability transistions in a context of multi-level governance: A comparison of four European states. Env. Inn. Soci. Tran. 2018, 26, 101–116. [Google Scholar] [CrossRef]
- Bugliarello, G. Urban sustainability: Dilemmas, challenges and paradigms. Technol. Soc. 2006, 28, 19–26. [Google Scholar] [CrossRef]
- Sharifi, A. Urban sustainability assessment: An overview and bibliometric analysis. Ecol. Indic. 2021, 121, 107102. [Google Scholar] [CrossRef]
- Joshi, S.; Saxena, S.; Godbole, T.; Shreya. Developing smart cities: An integrated framework. Procedia Comput. Sci. 2016, 93, 902–909. [Google Scholar] [CrossRef]
- Cohen, M.; Wiek, A. Identifying misalignments between public participation process and context in urban development. Chall. Sustain. 2017, 5, 11–22. [Google Scholar] [CrossRef]
- Reyes Nieto, J.E.; Rigueiro, C.; Da Silva, L.S.; Murtinho, V. Urban Integrated Sustainable Assessment Methodology for Existing Neighborhoods (UISA fEN), a New approch for Promoting Sustainable Development. Sustain. Dev. 2018, 26, 564–587. [Google Scholar] [CrossRef]
- Kumar, S.; Santara, A.; Banerji, H. Pentagram sustainability model. Int. Rev. Spat. Plan. Sustain. Dev. 2020, 8, 100–117. [Google Scholar] [CrossRef]
- Jabareen, Y. Planning the resilient city: Concepts and strategies for coping with climate change and environmental risk. Cities 2013, 31, 220–229. [Google Scholar] [CrossRef]
- Kahachi, H.A.H. Future Cities and Reality: Analytical Preview of the Different Theories from Information Cities, Smart Cities, to Liveable Cities. In Geotechnical Engineering and Sustainable Construction; Conference Communication; Springer: Singapore, 2022; pp. 805–816. [Google Scholar] [CrossRef]
- Hamilton, A.; Mitchell, G.; Yli-Karjanmaa, S. The BEQUEST toolkit: A decision support system for urban sustainability Build. Build. Res. Inf. 2002, 30, 109–115. [Google Scholar] [CrossRef]
- Emelianoff, C. The sustainable city: The hypothesis of an urban turning point in Europe. Geo. Infor. 2007, 71, 48–65. Available online: https://www.cairn.info/revue-l-information-geographique-2007-3-page-48.htm (accessed on 10 March 2023).
- Larimian, T.; Freeman, C.; Palaiologou, F.; Sadeghi, N. Urban social sustainability at the neighbourhood scale: Measurement and the impact of physical and personal factors. Local. Env. 2020, 25, 747–764. [Google Scholar] [CrossRef]
- Hiremath, R.B.; Balachandra, P.; Kumar, B.; Bansode, S.S.; Bansode, S.S.; Murali, J. Indicator-based urban sustainability: A review. Energy Sustain. Dev. 2013, 17, 555–563. [Google Scholar] [CrossRef]
- Caird, S.; Hudson, L.; Kortuem, G. A Tale of Evaluation and Reporting in UK Smart Cities; The Open University: Milton Keynes, UK, 2016; 56p. [Google Scholar]
- Li, Y.; Beeton, R.J.S.; Singler, T.; Halog, A. Modelling the transition toward urban sustainability: A case study of the industrial city of Jinchang, China. J. Cleaner. Prod. 2016, 134, 22–30. [Google Scholar] [CrossRef]
- Hegger, D.; Mees, H.; Wamsle, C. The role of citizens in sustainability and climate change governance: Taking stock and looking ahead. Env. Pol. Gover. 2022, 32, 159–276. [Google Scholar] [CrossRef]
- Kalsoom, Q. Attitude change to sustainable development. In Encyclopedia of Sustainable in Higher Education; Filho, W.L., Ed.; Springer: Cham, Switzerland, 2019; pp. 1–7. [Google Scholar]
- Bell, S.; Morse, S. Sustainability Indicators: Measuring the Immeasurable? 2nd ed.; Earthscan: London, UK, 2008; 280p. [Google Scholar]
- Leach, J.M.; Braithwaite, P.A.; Lee, S.E.; Bouch, C.J.; Hunt, D.V.; Rogers, C.D.F. Measuring urban sustainability and liveability performance: The city analysis methodology. Int. J. Complex. Appl. Sci. Technol. 2016, 1, 86–106. [Google Scholar] [CrossRef]
- Meijering, J.V.; Tobi, H.; Kern, K. Defining and measuring urban sustainability in Europe: A Delphi study on identifying its mostrelevant components. Ecol. Indic. 2018, 90, 38–46. [Google Scholar] [CrossRef]
- Shmelev, S.E.; Shmeleva, I.A. Global urban sustainability assessment: A multidimensional approach. Sustain. Dev. 2018, 26, 904–920. [Google Scholar] [CrossRef]
- Feleki, A.; Vlachokostas, C.; Moussiopoulos, N. Characterisation of sustainability in urban areas: An analysis of assessment tools with emphasis on European cities. Sustain. Cities Soc. 2018, 40, 563–577. [Google Scholar] [CrossRef]
- Bockstaller, C.; Cariolle, M.; Galan, M.-B.; Guichard, L.; Leclercq, C.; Morin, A.; Surleau-Chambenoit, C. Evaluation agri-environnementale et choix des indicateurs: Acquis, enjeux et pistes. Innov. Agron. 2013, 31, 1–14. [Google Scholar]
- Science de Politique Environnementale. Rapport Approfondi: Indicateurs Pour les Villes Durables-Bristol: DG Environnement de la Commission Européenne par L’unité de Communication Scientifique; Commission Européenne: Bristol, UK, 2015. [Google Scholar]
- Salati, M.; Bragança, L.; Mateus, R. Sustainability Assessment on an Urban Scale: Context, Challenges, and Most relevant Indicators. Appl. Syst. Innov. 2022, 5, 41. [Google Scholar] [CrossRef]
- Shen, L.; Ochoa, J.; Shah, M.N.; Zhang, X. The application of urban sustainability indicators—A comparison between various practices. Habitat Int. 2011, 35, 17–29. [Google Scholar] [CrossRef]
- Tanguay, G.A.; Rojaoson, J.; Lefebvre, J.F.; Lanoie, P. Measuring the sustainability of cities: An analysis of the use of local indicators. Ecol. Indic. 2010, 10, 407–418. [Google Scholar] [CrossRef]
- Tanguay, G.A. Indicateurs de développement durable en évaluation du patrimoine urbain: Un domaine de recherche en émergence. Téoros 2014, 33, 129–133. [Google Scholar] [CrossRef][Green Version]
- Li, F.; Liub, X.; Hu, D.; Wang, R.; Yang, W.; Liun, D.; Zhao, D. Measurement indicators and evaluation approach for assessing urban sustainable development: A case study for China’s Jining City. Landsc. Urban Plan. 2009, 90, 134–142. [Google Scholar] [CrossRef]
- Shaker, R.B.; Zubalsky, S.L. Examining patterns of sustainability across Europe: A multivariate and spatial assessment of 25 composite indices. Int. J. Sustain. Dev. World Ecol. 2015, 22, 1–13. [Google Scholar] [CrossRef]
- Lin, K.; Shih, C. The comparative analysis of neighborhood sustainability assessment tool. Urban Anal. City Sci. 2016, 45, 90–105. [Google Scholar] [CrossRef]
- Haapio, A. Towards sustainable urban communities. Environ. Imp. Assess. Rev. 2012, 32, 165–169. [Google Scholar] [CrossRef]
- Le Roy, A.; Ottaviani, F. The diversity of local experiences of alternative indicators: A necessary step? Reg. Urben Eco. J. 2015, 533–555. Available online: https://www.cairn.info/revue-d-economie-regionale-et-urbaine-2015-3-page-533.htm (accessed on 6 May 2023).
- Cloete, F. Measuring progress towards sustainable development in Africa. Afr. J. Pub. Aff. 2015, 8, 51–74. [Google Scholar]
- Sehili, F.; Chennaoui, Y.; Madani, S. The HQDIL method to assess the sustainability of an historic center case of mansourah k’bira (algeria). Urban Plan. Arch. Desi. Sustain. Dev. 2015, 216, 570–577. Available online: http://creativecommons.org/licences/by-nc-nd/4.0/ (accessed on 12 June 2023). [CrossRef][Green Version]
- Hadji, L. Méthode d’évaluation de la qualité des espaces publics dans un projet d’aménagement durable à Alger. Rev. Econ. Régionale Urbaine 2012, 5, 857–874. Available online: https://www.cairn.info/revue-d-economie-regionale-et-urbaine-2012-5-page-857.htm (accessed on 12 June 2023). [CrossRef]
- Kamble, T.; Bahadure, S. Investigating application of compact urban form in central Indian cities. Land Use Policy 2021, 109, 105694. [Google Scholar] [CrossRef]
- Kallus, R.; Law-yone, H. What is a neighborhood? The structure and function of an idea. Environ. Plan B Plan. Design 2000, 27, 815–826. [Google Scholar] [CrossRef]
- Opp, S.M.; Saunders, K.L. Pillar talk: Local sustainability initiatives and policies in the United States-Finding evidence of the “three E’s”: Economic development, environmental protection, and social equity. Urban Aff. Rev. 2013, 49, 678–717. [Google Scholar] [CrossRef]
- Rozenblat, C. Extending the concept of city for delineating large urban regions (LUR) for the cities of the world. Cybergeo Euro. J. Geo. 2020, 954. [Google Scholar] [CrossRef]
- Stanislav, A.; Chin, J.K. Evaluating livability and perceived values of sustainable neighborhood design: New Urbanism and original urban suburbs. Sustain. City Soc. 2019, 74, 101517. [Google Scholar] [CrossRef]
- French Development Agency. Flood Control Project in Moundou: Support Mission for Efficient and Sustainable Management of the Storm Sanitation Service in Moundou; French Development Agency: Moundou, Chad, 2019; 40p.
- Initiative Development (ID). Sanitation Services Improvement Program for the city of Moundou, November 2020–April 2020; Initiative Development (ID): Moundou, Chad, 2020; 16p. [Google Scholar]
- Gudmundsson, H.; Joumard, R.; Fischer, T. Criteria and Methods for Indicator Assessment and Validation—A Review of General and Sustainable Transport Related Indicator Criteria and How To Apply Them. Environ. Sci. 2010. Available online: https://www.semanticscholar.org/paper/Criteria–and-methods-for-indicator-assessment-and-a-Gudmundsson-Joumard/fe69912851da99d967ef3d18a590371c50035d47 (accessed on 21 November 2023).
- Lin, J. Meausuring and analyzing the information entropy value of key Audit matters (KAMs) disclosure at the system and reporting scale. Heliyon 2023, 10, e23255. [Google Scholar] [CrossRef]
- Ayre, C.; Scally, A.J. Critical values for Lawshe’s content validity ratio: Revisiting the original methods of calculation. Meas. Eval. Couns. Dev. 2014, 47, 79–86. [Google Scholar] [CrossRef]
- Lessard, G.; Boulfroy, E. Les Rôles de L’arbre en Ville; Centre Collégial de Transfert de Technologie en Foresterie de Sainte-Foy (CERFO): Québec, QC, Canada, 2008; 21p, Available online: https://cerfo.qc.ca/wp-content/uploads/2019/09/Roles_arbre_en_ville_CERFO.pdf (accessed on 11 April 2024).
- Gbekley, E.H.; Houedakor, K.Z.; Komi, K.; Poli, S.; Adjalo, K.; Nyakpo, A.; Ayivigan, A.M.; Ali, A.A.G.V.; Zinsou-Klassou, K.; Adjoussi, P. Urban Governance and Sanitation in the Peri-Urban Commune of Agoè-Nyvé 6 in Togo: Diagnosis of the Sanitation System in Adétikopé. Water 2023, 15, 3306. [Google Scholar] [CrossRef]
- Bondoro, O. Evaluation des Besoins en Technologies Pour l’Adaptation et L’attenuation des GES. Rapport sur la Priorisation des Technologies dans le Cadre du Processus EBT Pour L’atténuation dans les Secteurs de L’ENERGIE et de L’affectation des Terres et de la Foresterie. N’Djaména, Tchad. 2021. Available online: https://tech–action.unepccc.org/wp-content/uploads/sites/2/2022/04/rapport-1-ebt-attenuation-tchad.pdf (accessed on 8 March 2024).
- World Bank. A New Era in Development. Annual Report. 2023. Available online: https://www.worldbank.org/en/about/annual-report (accessed on 18 December 2023).
- IEA; IRENA; UNSD; World Bank; WHO. Tracking SDG 7: The Energy Progress Report; World Bank: Washington, DC, USA, 2023; 292p. Available online: https://trackingsdg7.esmap.org/ (accessed on 18 December 2023).
- Unicef. Transforming Education in Africa: An Evidence-Based Overview and Recommendations for Long-Term Improvements. Report. 2021. Available online: https://www.unicef.org/reports/transforming-education-africa (accessed on 15 January 2024).
- Palvia, P.; Baqir, N.; Nemati, H. ICT for socio-economic development: A citizens’ perspective. Inf. Manag. 2018, 55, 160–176. [Google Scholar] [CrossRef]
- INSEED. Indice Harmonise de la Production Industrielle; Rapport Annuel; INSEED: N’Djamena, Chad, 2022; 6p. [Google Scholar]
- Dejeant, F.; Garnier, P.; Joffroy, T. Matériaux Locaux, Matériaux D’avenir. Ressources Locales pour les Villes et Territoires Durables en Afrique. CRAterre Éditions. 2021. Available online: https://hal.science/hal–03293589v1 (accessed on 11 April 2024).
- All-yom, D.; Madji, M. Gestion du Foncier Dans la Commune de Moundou; Rapport D’étude; Mairie de Moundou: Moundou, Tchad, 2012; 138p. [Google Scholar]
- Attipo, R.V.; Emvoulou, J.I.; Aholou, C.C. Climate change and urban stormwater: Vulnerability analysis of the 2010 floods in Lomé,Togo. Front. Clim. 2023, 5, 1281433. [Google Scholar] [CrossRef]
- Busayo, E.T.; Kalumba, A.M.; Afuye, G.A.; Olusola, A.O.; Olusola Oluwayemisi Ololade, O.O.; Israel Ropo Orimoloye, I.R. Rediscovering South Africa: Flood disaster risk management through ecosystem-based adaptation. Environ. Sustain. Indic. 2022, 2022, 100175. [Google Scholar] [CrossRef]
- Le Programme de Politiques de Transport en Afrique (SSATP). Les Villes Africaines Face à la Crise de la Mobilité Urbaine: Défis des Politiques Nationales de Mobilité en Côte d’Ivoire, en Ethiopie, en Guinée, au Ghana, au Kenya, au Nigeria, au Rwanda et au Sénégal. Rapport Transnational. 2021. Available online: https://www.ssatp.org/sites/ssatp/files/publication/SSATP_TransnationalReport_8Countries_FR_DIGITAL_V5.pdf (accessed on 22 March 2024).
- Diaz Olvera, L.; Guézéré, A.; Plat, D.; Pochet, P. L’intermodalité subie des citadins africains. Exemples à Conakry, Douala et Lomé. In Transports et Intermodalité; Coll. “Sciences, Société et Nouvelles Technologies”; Chapelon, L., Ed.; ISTE: London, UK, 2016; pp. 289–308. Available online: https://shs.hal.science/halshs-01367916/document (accessed on 22 March 2024).
- Diaz Olvera, L.; Plat, D.; Pochet, P. Chapitre 13. Marche à pied, pauvreté et ségrégation dans les villes d’Afrique de l’Ouest. Le cas de Dakar. In Concentration Economique et Ségrégation Spatiale; Buisson, M.-A., Mignot, D., Eds.; coll. Economie Société Région; De Boeck: Bruxelles, Belgium, 2005; pp. 245–261. [Google Scholar] [CrossRef]
- UNESCO. Culture: Futur Urbain. Rapport Mondial sur la Culture Pour le Développement Urbain Durable. 2017. Available online: https://unesdoc.unesco.org/ark:/48223/pf0000249572 (accessed on 15 January 2024).
- Jorge-Ortiz, A.; Bralio-Gonzalo, M.; Bovea, M.D. Assessing urban sustainability: A proposal for indicators, metrics and scoring-a case study in Colombia. Environ. Dev. Sustain. 2022, 25, 11789–11822. Available online: https://link.springer.com/article/10.1007/s10668-022-02554-6 (accessed on 29 January 2024). [CrossRef]
- Martins, S.M.; Fundo, P.; Kalil, R.M.L.; Rosa, D.F. Community participation in the identification of neighborhood sustainability indicators in Brazil. Habitat Int. 2021, 113, 102370. [Google Scholar] [CrossRef]
- United Nations. Goal 8: Promote Inclusive and Sustainable Economic Growth, Employment and Decent Work for All. 2023. Available online: https://www.un.org/sustainabledevelopment/economic-growth/ (accessed on 13 April 2024).


Disclaimer/Publisher’s Note: The statements, opinions and data contained in all publications are solely those of the individual author(s) and contributor(s) and not of MDPI and/or the editor(s). MDPI and/or the editor(s) disclaim responsibility for any injury to people or property resulting from any ideas, methods, instructions or products referred to in the content. |
© 2024 by the authors. Licensee MDPI, Basel, Switzerland. This article is an open access article distributed under the terms and conditions of the Creative Commons Attribution (CC BY) license (https://creativecommons.org/licenses/by/4.0/).