Abstract
The completeness of landslide inventories and the selection of evaluation models significantly impact the accuracy of landslide susceptibility assessments. Conventional field geological survey methods and single remote-sensing technology struggle to reliably identify landslides under complex environmental conditions. Moreover, prevalent landslide susceptibility evaluation models are often plagued by issues such as subjectivity and overfitting. Therefore, we investigated the uncertainty in susceptibility modeling from the aspects of landslide inventory quality and model selection. The study focused on Luquan County in Yunnan Province, China. Leveraging multisource remote-sensing technologies, particularly emphasizing optical remote sensing and InSAR time-series deformation detection, the existing historical landslide inventory was refined and updated. This updated inventory was subsequently used to serve as samples. Nine evaluation indicators, encompassing factors such as distance to faults and tributaries, lithology, distance to roads, elevation, slope, terrain undulation, distance to the main streams, and average annual precipitation, were selected on the basis of the collation and organization of regional geological data. The information value and two coupled machine-learning models were formulated to evaluate landslide susceptibility. The evaluation results indicate that the two coupled models are more appropriate for susceptibility modeling than the single information value (IV) model, with the random forest model optimized by genetic algorithm in Group I2 exhibiting higher predictive accuracy (AUC = 0.796). Furthermore, comparative evaluation results reveal that, under equivalent model conditions, the incorporation of a remote-sensing landslide inventory significantly enhances the accuracy of landslide susceptibility assessment results. This study not only investigates the impact of landslide inventories and models on susceptibility outcomes but also validates the feasibility and scientific validity of employing multisource remote-sensing technologies in landslide susceptibility assessment.
1. Introduction
The evaluation of landslide susceptibility forms the basis for assessing landslide hazard and risks. Currently, there are three types of susceptibility evaluation models: heuristic methods, deterministic methods, and quantitative statistical methods [1,2,3]. Quantitative statistical methods based on GIS consider comprehensive factors of slope instability and use this information as a basis to predict potential landslide areas under similar conditions, which is suitable for landslide susceptibility assessment and mapping in large and complex regions. Quantitative statistical methods include the frequency ratio, weight of evidence, neural networks, and machine learning. In recent years, machine-learning algorithms such as random forest (RF), support vector machine (SVM), logistic regression (LR), and multilayer perceptron (MLP) methods have been widely used in comparative studies of susceptibility modeling because of their outstanding performance and ability to handle complex and variable data [4,5,6]. Bai et al. [3] combined logistic regression with GIS technology to produce detailed susceptibility maps of Youfang Basin landslides. Wang et al. [4] conducted a comparative study of landslide susceptibility via logistic regression, frequency ratios, decision trees, weights of evidence, and artificial neural networks and reported that the logistic regression model was more accurate. Rong et al. [6] compared the susceptibility prediction accuracy of random forest and gradient-boosting decision tree models before and after Bayesian optimization and reported that the Bayesian-optimized gradient-boosting decision tree model had the highest accuracy. However, quantitative evaluation is a data-driven method, and the suitability of models, as well as the quality and completeness of landslide inventories, can affect the accuracy of susceptibility assessment results. Therefore, simultaneously optimizing these two factors is highly important for landslide susceptibility assessment.
The landslide inventory contains information about the location and characteristics of landslides. Early inventory maps relied mainly on conventional field geological surveys, which were limited in scope and time-consuming [7,8]. In recent years, the continuous development of remote-sensing technologies has highlighted their role in the early identification of landslides in large areas [9,10,11], with optical remote sensing and InSAR being widely applied. Optical remote sensing, with its multispectral and high-resolution characteristics, provides rich information on image color, texture, and shape and is suitable for extracting obvious deformation signs and typical landslide features, such as landslide scarps, landslide bodies, and landslide boundaries [12,13]. However, optical images are significantly affected by weather conditions and are often unable to capture effective images due to cloudy weather, and in areas with good vegetation cover, detailed surface changes may not be observed, making it difficult to identify landslides with incomplete morphologies and unclear surface deformation signs. InSAR can obtain large-scale, high-resolution, and high-precision slope deformation information and is sensitive to small deformations. Owing to its all-weather and all-day advantages, many scholars have applied it in early identification studies of potential landslides [14,15]. InSAR has unique identification capabilities for evolving areas, but owing to technical limitations, it cannot capture rapid deformations and has certain limitations when used in mountainous areas with large topographical variations [10,16]. Single remote-sensing sensors are clearly constrained by factors such as climate, topography, and landslide development characteristics, making it challenging to obtain the required data accurately. The comprehensive application of multiple monitoring technologies and coordinated observations is an effective means for landslide identification.
Luquan County is affected by tectonic dissection and surface erosion, a landform dominated by medium–high mountains is formed. Along the Jinsha River and Pudu River, the terrain undulates greatly, and the slope is relatively steep. Moreover, due to the external adverse conditions, such as human engineering activities and river erosion along the Jinsha River and Pudu River, landslides occur frequently in this area. Based on this, this paper uses Luquan as the study area. Considering mainly two factors, namely the quality of landslide inventory and model selection, a study on landslide susceptibility evaluation is conducted, aiming to improve the accuracy of landslide susceptibility prediction results. At the same time, it verifies the feasibility and scientific nature of using multisource remote-sensing technology for landslide susceptibility evaluation. This study combines landslides identified on the basis of multisource remote-sensing technologies with historical landslide inventories to improve landslide information. Using the improved pre- and post-landslide inventories as samples, this study uses the information value (IV) model; the genetic algorithm–weighted information value (GWIV) model, which is an optimization model that uses a genetic algorithm to improve the accuracy and efficiency of random forest models; and the genetic algorithm–information value–logistic regression (GLR) model to obtain susceptibility assessment results and compares and analyzes the results with field survey data and remote-sensing data. Landslide susceptibility assessment is the core topic of this study. It includes determining the locations of possible existing or future landslides. Given that the damage inflicted by landslides on the natural environment is highly irreversible, one of the aims of landslide susceptibility research is to rationally harmonize the relationship between humans and the environment, while effectively preventing and alleviating losses resulting from its irreversible process. Therefore, accurate and reliable landslide susceptibility assessment can make an extremely important contribution to the sustainability of human life, environmental, and economic issues.
2. Research Data and Methods
2.1. Study Area
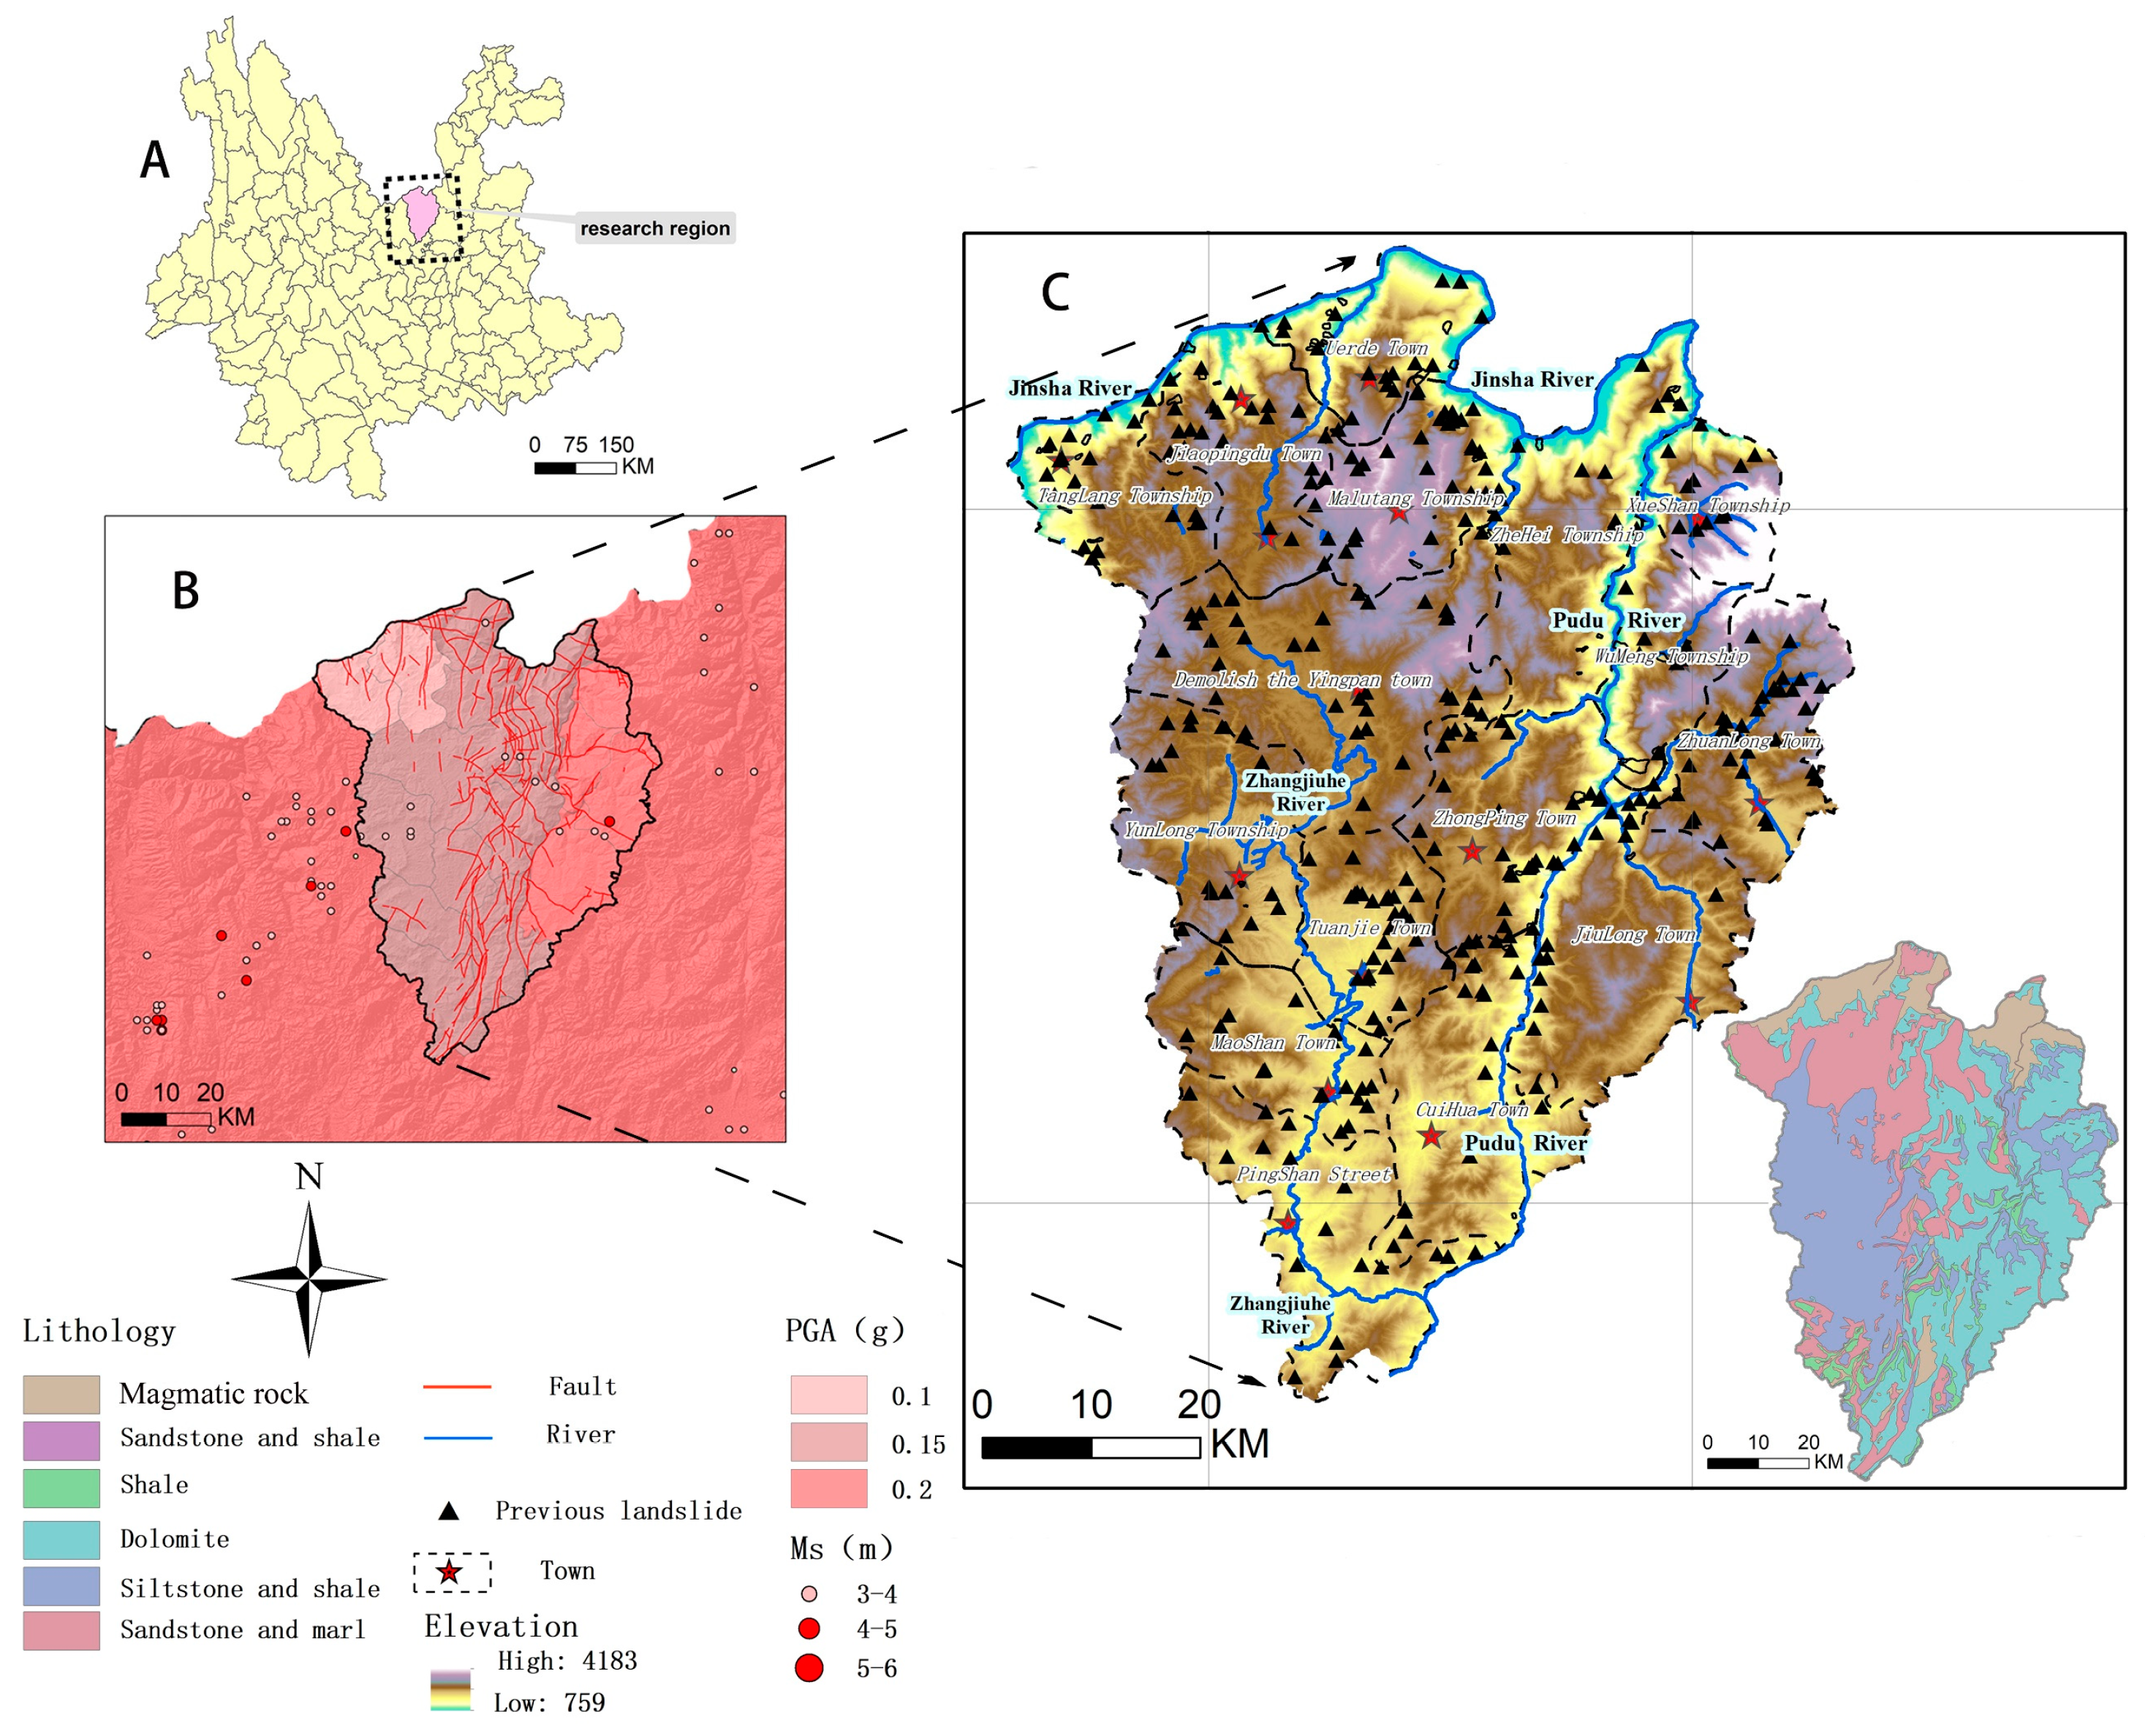
As shown in Figure 1, the study area is located in Luquan County, northern Yunnan Province (102°13′ E–102°57′ E, 25°25′ N–26°22′ N), with an area of approximately 4234 km2. Luquan County is situated on an inland plateau, with higher terrain in the northeast and lower terrain in the southwest, sloping gradually from northeast to southwest. The region has complex geological structures, with predominantly north–south-trending fault lines intersected by nearly east–west faults and northwest-striking transverse faults, resulting in varied and complex terrain features. The study area lies in the middle section of a transverse mountain range and the Dianchi fault depression zone, exhibiting typical high mountain and canyon landscapes, with elevations ranging from 759 m to 4183 m. In the region, there is a predominant distribution of a substantial quantity of magmatic rocks and clastic rocks, with the former being igneous in nature and the latter being the product of weathering and erosion processes of pre-existing rocks. Along river valleys, there are small amounts of band-shaped soft-rock and alternating soft- and hard-rock groups, with significant accumulations of thick clastic rocks and carbonate rocks due to compression, folding, and fault activity.

Figure 1.
Some visual information about the study area. (A) The study area is located in the north-central part of Yunnan Province. (B) A sketch of the regional seismotectonic setting and historical seismicity. (C) The black triangle shows the distribution of landslide samples in the historical inventory, and the lower-right corner shows the distribution of engineered lithologies in the study area.
The region has well-developed water systems, with the Pudu River being the largest river, originating from Dianchi Lake and flowing from south to north through a mountainous canyon, gathering numerous rivers such as the Zhangjiu River, Jiulong River, and Xima River along its course before joining the Jinsha River. The river course within the county stretches for 121 km. Luquan County is located in a subtropical monsoon climate zone, exhibiting distinct vertical vegetation distribution patterns with altitude. The average annual temperature is 15.6 °C, and the annual precipitation is 968.4 mm, which is characterized by abundant rainfall. The area is also seismically active, with 27 recorded earthquakes of magnitude 3 or higher in and around the study area since 1980. According to the China Seismic Ground Motion Parameter Zoning Map, the peak ground acceleration of seismic activity in the study area ranges from 0.1 g to 0.2 g, providing sufficient dynamic conditions for landslides.
The terrain in Luquan County is steep, with well-developed water systems and complex geological structures, providing favorable geological conditions for landslides. On the basis of the results of the onsite survey, historically, the county has been economically underdeveloped, with agriculture as the primary industry. There have been numerous human activities, such as infrastructure development without proper soil and water conservation measures, due to a lack of funding, resulting in extensive damage to the original landforms and surface vegetation, leading to soil erosion. Moreover, construction sites in the county are mostly in mountainous areas with large-scale earthwork excavation, and indiscriminate disposal of excavated soil and waste often triggers landslide disasters. Luquan County has a total of 353 recorded landslide disasters in the geological disaster database of Yunnan Province, as shown in Figure 1.
2.2. Data Sources
The research data mainly consisted of the following two categories:
- (1)
- Remote-Sensing Data
The SAR imagery data were obtained from the Sentinel-1A satellite data available on the European Space Agency (ESA) website (https://scihub.copernicus.eu/dhus/#/home, accessed on 10 June 2023). The main data source was single-look complex (SLC) data in VV polarization mode under the interferometric wide swath (IW) mode of the Sentinel-1A satellite, with a time span from January 2017 to February 2021, totaling 115 periods. Additionally, the Shuttle Radar Topography Mission (SRTM) digital elevation model (30 m) was used to calculate terrain feature parameters and eliminate terrain effects in InSAR processing.
GF-2 optical satellite images and Google Earth images were utilized for regional landslide identification, while data captured by drones served as auxiliary verification tools. The remote sensing data used the R(3)G(2)B(1) band combination for landslide identification and comparative analysis work in the study area. The basic parameters of the GF-2 optical satellite data are listed in Table 1.

Table 1.
Main parameter information of the optical satellite.
- (2)
- Landslide-Influencing Factor Data
The data on landslide evaluation factors were derived mainly from the China Aero Geophysical Survey and Remote Sensing Center (AGRS) and from SRTM 30 m digital elevation model (DEM) data. The landslide evaluation factors considered in the susceptibility assessment included distance to faults (X1), distance to tributaries (X2), lithology (X3), distance to roads (X4), elevation (X5), slope (X6), terrain undulation (X7), distance to main streams (X8), and average annual precipitation (X9), for a total of nine factors. Each factor was extracted and grouped via ArcGIS 10.7 tools, with the data sources shown in Table 2.
Table 2.
Types and sources of the data used.
2.3. Methods
2.3.1. Remote-Sensing Technologies
- (1)
- Stacking InSAR
The Stacking-InSAR algorithm was utilized to obtain surface deformation data. Previous studies have shown that when there are a sufficient number of interferometric pairs of good quality, the results of stacking InSAR do not differ significantly from those of PS InSAR and SBAS InSAR, but the processing time is greatly reduced. Stacking InSAR, which is based on multiple master images, controls the spatiotemporal baseline (Sentinel-1 data interval set at 36 days), effectively addressing phase decorrelation issues caused by long spatiotemporal baselines and achieving high-precision regional measurements. Stacking data processing was mainly completed via D-InSAR. After differential interferograms were generated, the phase was unwrapped and weighted, resulting in annual phase maps and surface deformation rate maps, following the process shown in Figure 2. This method estimates linear phase rates on the basis of multi-look differential interferograms, essentially performing a linear regression via the least squares method on N sets of observed values, with the estimation formula as follows:
where is the baseline of the interferogram, is the unwrapped differential interferometric phase, and is the linear phase rate.
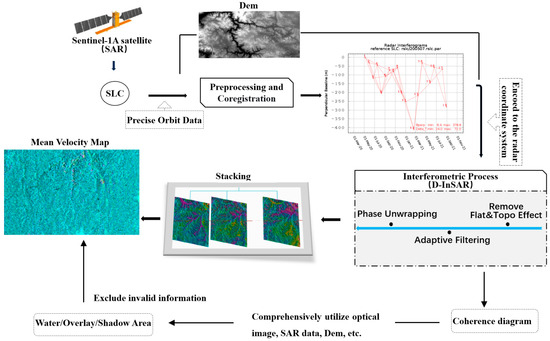
Figure 2.
Stacking-InSAR technological process.
Additionally, to reduce geometric distortion phenomena such as shadowing, overlapping, and perspective shrinkage and improve the extraction effect of the regional deformation rate, the Sentinel-1A satellite data combined with ascending and descending orbits were used to extract the slope deformation information from both sides of the Pudu River and Jinsha River more accurately.
- (2)
- Satellite Remote-Sensing and UAV Technology
InSAR, with its unique advantages, can identify most landslides in an area but can be influenced by the nature of deformation and external factors such as terrain, leading to misidentifications and omissions. Hence, it is vital to supplement optical images for joint identification. Developed landslides generally exhibit obvious characteristics and identifiable landslide elements, making them common objects for optical remote-sensing interpretation. Incipient landslides lack typical landslide shapes and elements, necessitating identification on the basis of microgeomorphic features related to landslide development or signs of deformation, such as localized collapses, collapses, cracks, and abnormal vegetation cover.
This study primarily used multitemporal optical images acquired by the GF-2 satellite and Google Earth for landslide identification. This approach not only avoids issues related to cloud cover in the study area but also provides a wealth of reliable data by understanding the temporal changes in landslides through historical archive images. Aerial images captured by UAVs, including orthophotos and oblique photography, were used to assist in investigating landslides with complex terrains and difficulties in remote sensing identification, aiming to reflect their boundaries and activity characteristics in a more detailed manner.
- (3)
- Multisource Remote-Sensing Technologies for Landslide Identification
Owing to the steep slopes and deep valleys in the study area, which are characterized by complex environmental conditions, landslide identification relied primarily on satellite remote-sensing visual interpretation and InSAR, with UAV data serving as a supplement. The process, as shown in Figure 3, integrates the principles of disaster geology and landslide remote-sensing theory. It combines surface deformation InSAR-monitoring results, optical satellite remote-sensing data, field verification, spatial data establishment, and other means, alongside regional topography, geomorphology, basic geological information, and disaster-prone background information to conduct remote-sensing investigations of landslide disasters and obtain information on the location, extent, and activity of landslides. Moreover, to enhance the detailed identification and analysis of landslides, aerial photography and data processing via UAVs were conducted for some typical landslides, obtaining high-resolution remote-sensing images, high-precision DOMs with a resolution of no less than 0.05 m, and DEMs with a resolution of 2.5 m for supplementary investigations.
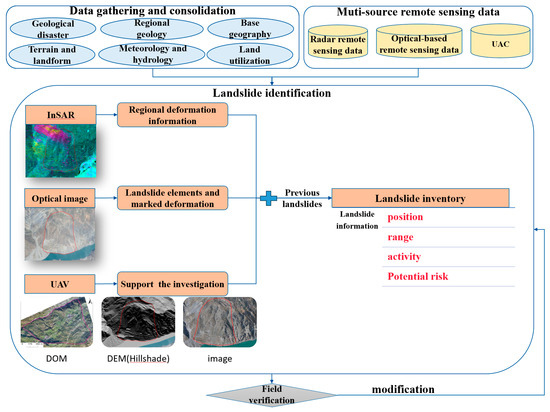
Figure 3.
Acquisition process of landslide inventories via multisource remote-sensing technologies.
2.3.2. Landslide Susceptibility Assessment
The susceptibility assessment was divided into two experimental groups, referred to as Groups I1 and I2, and was conducted as follows:
- Landslides from historical landslide inventories were utilized as disaster-point data for susceptibility assessment, and the IV, GWIV, and GLR models were constructed for susceptibility evaluation (Group I1).
- Landslides identified through multisource remote-sensing technologies in combination with landslides from historical landslide inventories were used as disaster-point data for susceptibility assessment, and the IV, GWIV, and GLR models were constructed for susceptibility evaluation (Group I2).
To ensure the absence of collinearity among the assessment factors, a multicollinearity analysis of the landslide assessment factors for the two experimental groups was conducted via tolerance (TOL) and the variance inflation factor (VIF) (performed via SPSS software, IBM SPSS Statistics 25). The results are presented in Table 3. A TOL greater than 0.1 and a VIF close to 1 indicate the absence of multicollinearity among the factors, indicating that factor selection is reasonable.
Table 3.
Tolerance and variable inflation factor of influencing factors.
- (1)
- Information Value Model (IV)
The IV model uses the frequency or density of landslides to reflect the size of the disaster-causing effects of different influencing factors and their subintervals. The magnitude of the information value represents the relative probability of landslide occurrence under the combined effects of various factors. A higher value indicates a greater likelihood of landslides occurring. The formula for calculating the information value is as follows:
where is the number of landslides in the j interval of the i factor, N is the total number of landslides, is the number of grids in the j interval of the i factor, and S is the total number of grids in the study area. When > 0, landslide occurrence is favorable; when < 0, landslide occurrence is unfavorable.
- (2)
- Logistic regression Model (LR)
LR is commonly used for regression analysis of binary-dependent variables. It is a nonlinear statistical classification method with the following expression:
where is the constant of the logistic regression, represents the sum of linear weights after variables are combined, represents the probability of landslide occurrence, which is the regression prediction value, represents regression coefficients, and represents evaluation factors.
- (3)
- Random forest (RF) model
The RF model integrates two mainstream learning methods: bagging and random subspace. In high-dimensional and large data situations, it has high generalization ability. The two randomness features that it possesses (random sampling with replacement of samples and random selection of feature-variable subspaces) make the algorithm less prone to overfitting [5,18]. One characteristic of the random forest is its ability to provide the importance of factors related to susceptibility. The decrease in the Gini index is used to calculate the importance of each factor in the susceptibility classification result. The formula for calculating the Gini index is as follows:
where is the number of categories, is the decision tree node, and is the relative frequency of .
- (4)
- Genetic Algorithm (GA)
The GA is an algorithm that is independent of the problem domain, with fast random search capabilities used to solve complex optimization problems. This search method significantly reduces the possibility of encountering local minima. In this study, a genetic algorithm is used to optimize the random forest and logistic regression models. It is mainly used to obtain the models’ hyperparameters and selectively integrates random forest decision tree combinations to reduce overfitting, decrease redundancy, and improve the models’ generalization ability.
- (5)
- Coupling Model
While the IV model can reflect the degree of influence of factor levels on landslides, it cannot determine the relative impact of each factor on landslide occurrence [19]. A logistic regression model can effectively reflect the contributions of various factors to landslides, but it cannot explain the impacts of different factor levels. On the other hand, the random forest model can compare the importance of different factors affecting landslide occurrence [5,20]. Therefore, in this study, the information value was chosen as the model input to construct three models (IV, GLR, and GWIV) for landslide susceptibility assessment. Considering the data differences when calculating the information value of each factor, to accelerate model convergence and promote subsequent analysis, the information values were normalized via the following formula:
where is the normalized value of the information value, is the factor’s information value, and and represent the minimum and maximum values of , respectively.
3. Results
3.1. Landslide Inventory
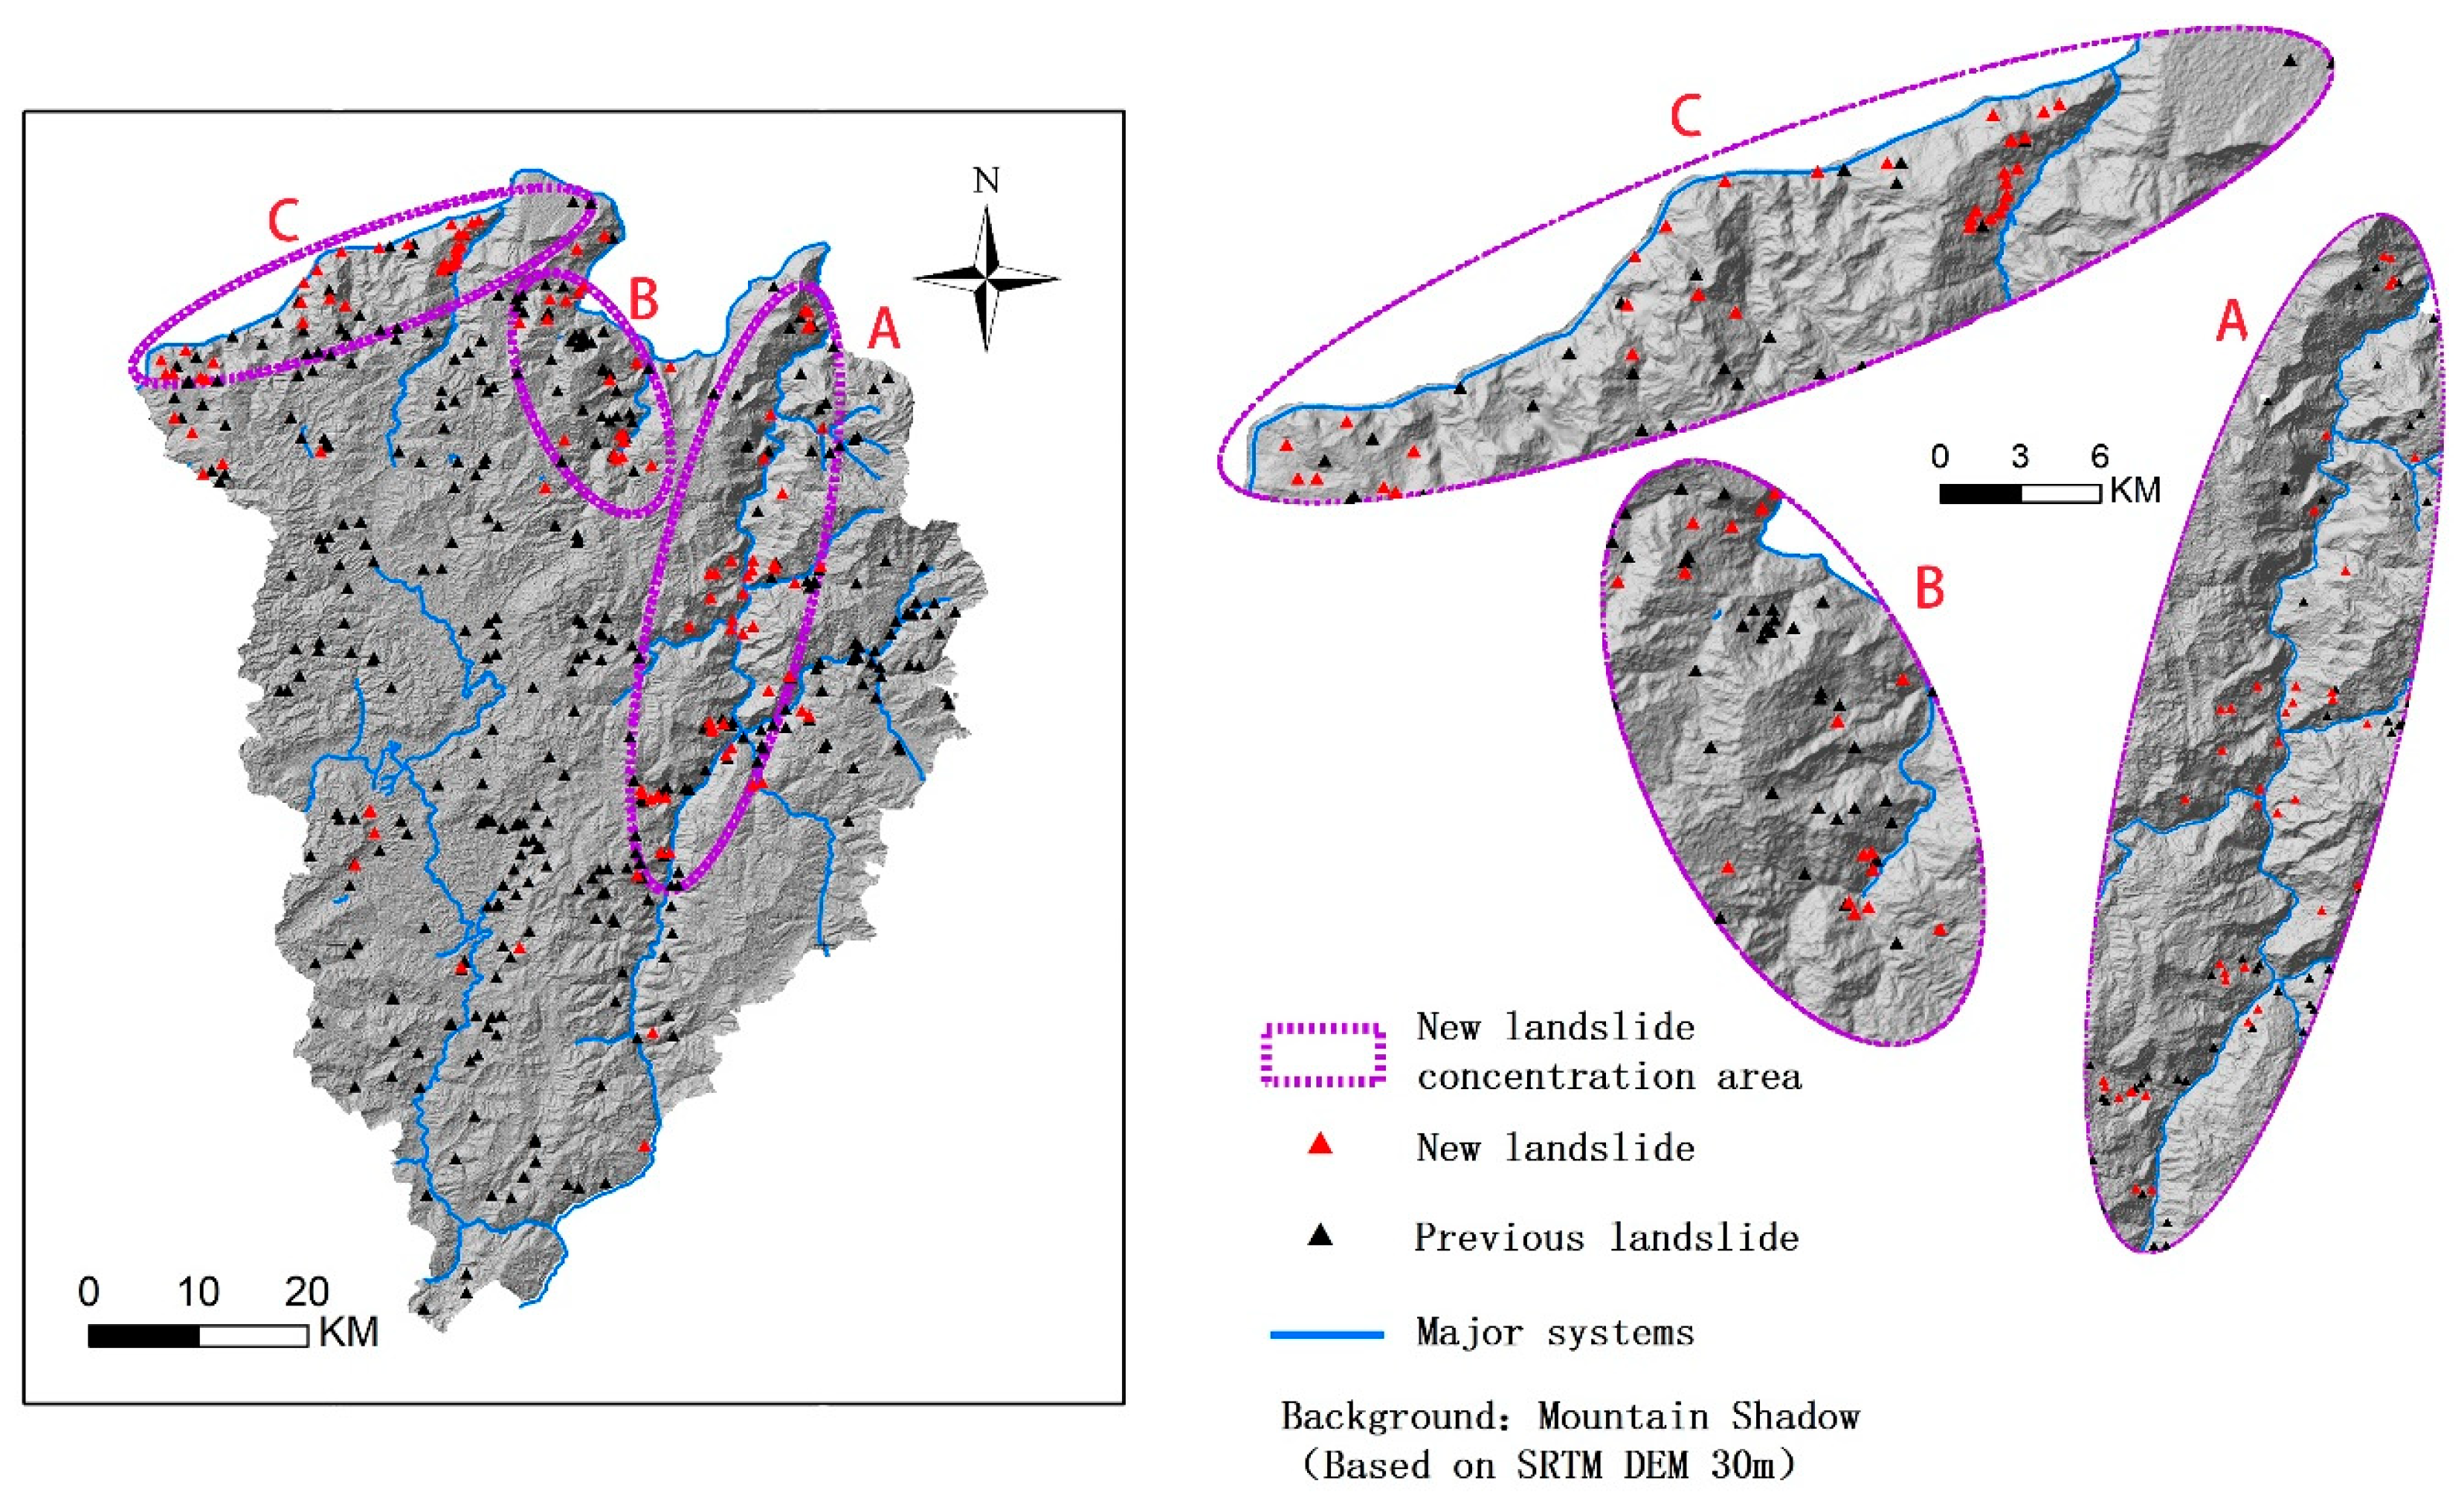
As shown in Figure 4, the updated landslide inventory in the study area includes a total of 463 landslides. The basic information of the landslide inventory was obtained through two main methods:
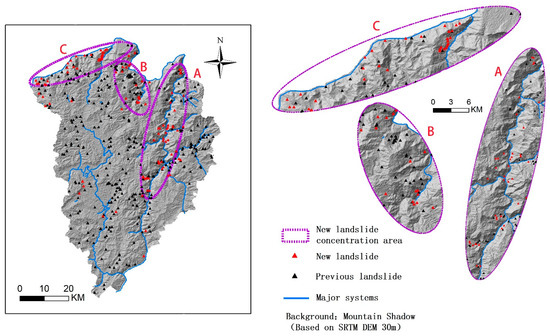
Figure 4.
Updated landslide distribution pattern within the study region (the red triangles represent newly identified landslides via multisource remote-sensing technologies, and black triangles represent previous landslides). (A) New landslide-clustering zone along the Pudu River and (B, C) new landslide-clustering zones along the Jinsha River.
- Historical inventory information, which consists of 353 landslide locations (the data were obtained based on the following project: The Implementation Plan for the Comprehensive Prevention and Control System of Geological Disasters in Yunnan Province (2013–2020)).
- Identification based on multitemporal optical images and InSAR deformation monitoring results: A total of 160 landslides were identified, with 110 being new landslides and 50 being previously known landslides from the historical inventory. In addition, among these 160 landslides, obvious deformation signs can be found in the InSAR results for 115 landslides. The remaining 45 landslides are mainly identified through optical images.
Figure 4 shows the spatial distribution of landslides in the study area, revealing a widespread distribution with localized concentrations. The newly identified landslides identified via remote-sensing technologies exhibit belt-like clustering features in Areas A, B, and C, with new landslide line densities reaching 0.66/km, 1.01/km, and 0.85/km, respectively.
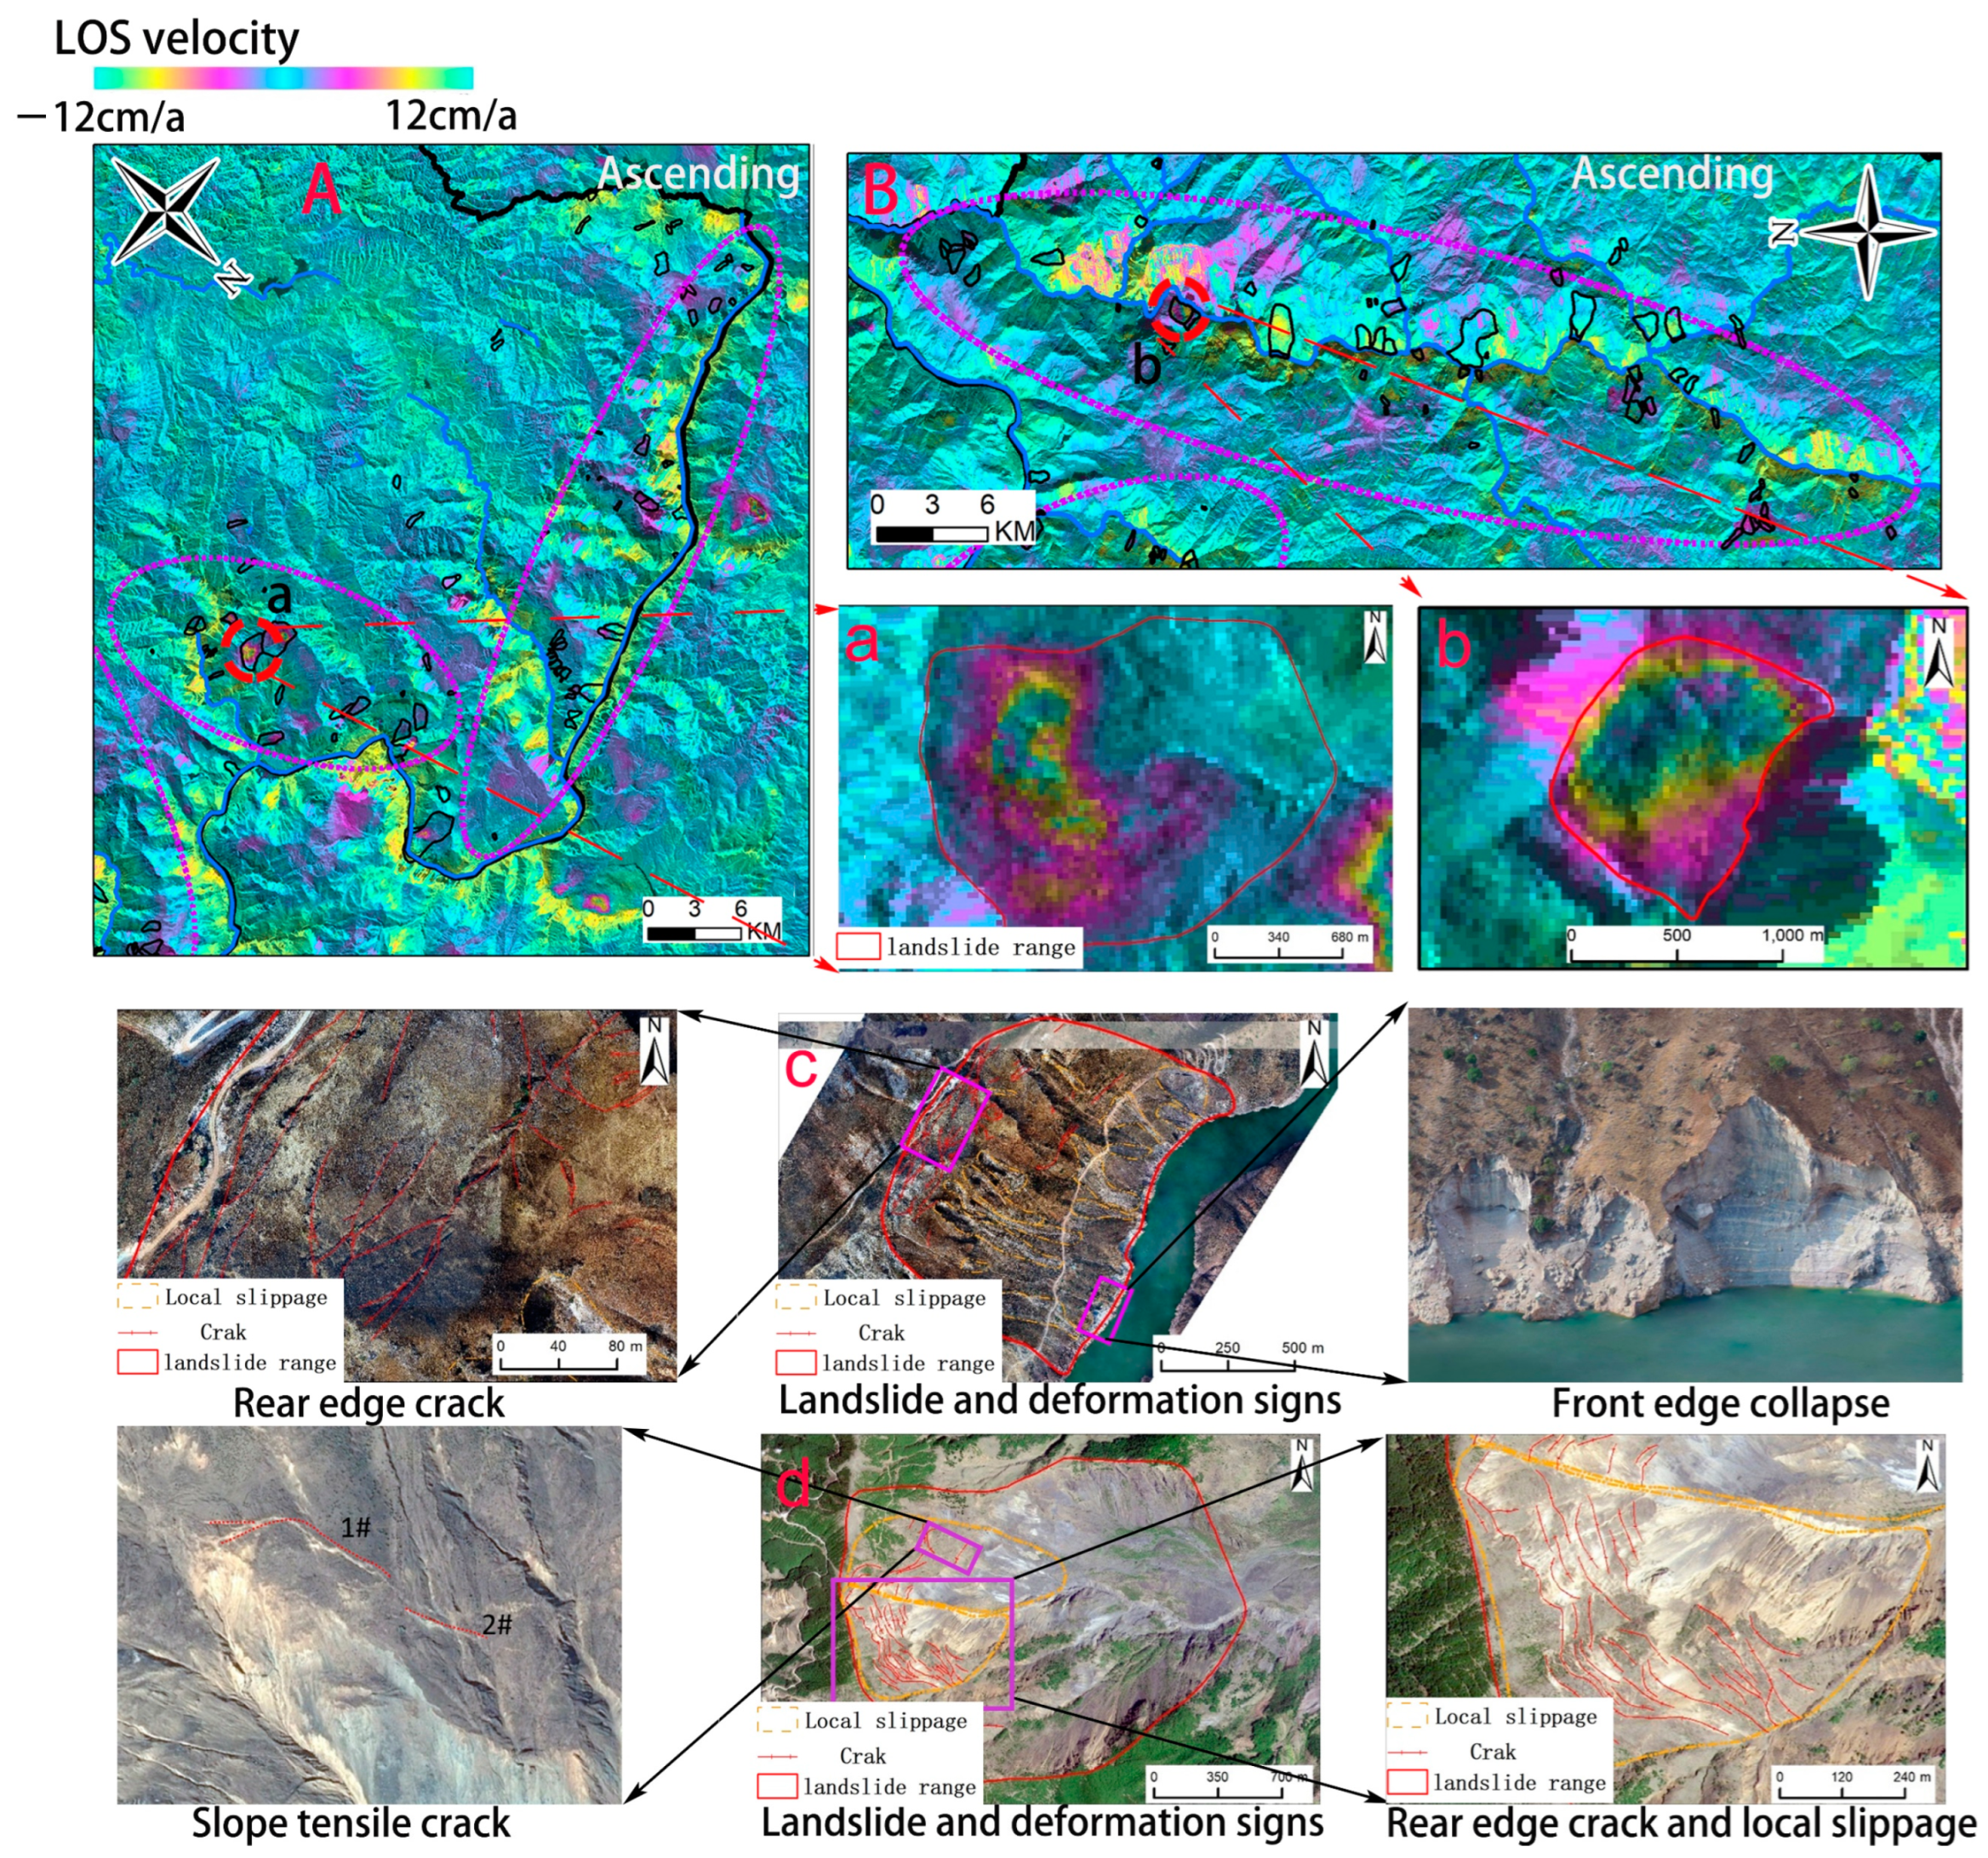
The three subsets, A, B, and C, are located along the Pudu River and Jinsha River. The results of surface deformation monitoring indicate relatively low stability within this region, with numerous areas experiencing deformation anomalies. Landslide activity in the area is generally active, with many landslides exhibiting obvious deformation and damage signatures in optical images or InSAR-monitoring results (Figure 5). Overall, most areas in the study area are experiencing continuous landslide activity, with several landslide hotspots showing particularly frequent activity.
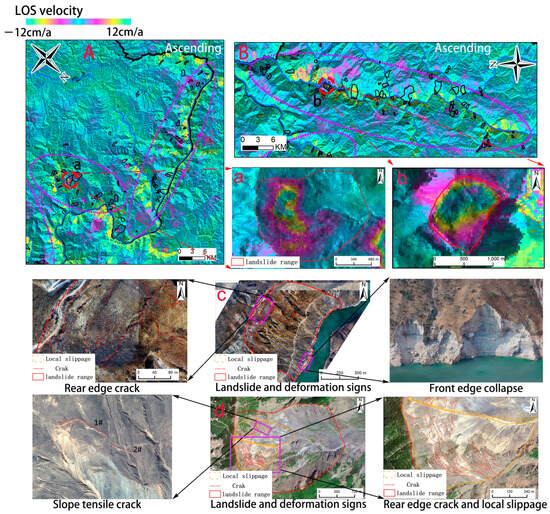
Figure 5.
Typical signs of surface deformation. (A,B) InSAR deformation rate map (ascending) of the new landslide-clustering zone; (a,b) interferometric loop characterization of typical landslide InSAR deformation-monitoring results; and (c,d) signs of deformation damage evident in optical images of landslides.
3.2. Susceptibility Assessment Results
In this study, three models (IV, GLR, and GWIV) were used to assess the susceptibility of two groups of landslide samples. When selecting negative landslide sample points in machine-learning models, maintaining a certain distance from landslides to reflect nonlandslide characteristics and avoid subjective influences is essential. Considering these conditions, a 1.5 km buffer zone was set around landslides. An equal number of negative sample points were randomly generated outside the buffer zone via ArcGIS 10.7. Points from sets I1 and I2 were in a subset relationship to ensure comparability. Subsequently, 75% of each sample set was used as a training set, and 25% was used as a test set for modeling in the Jupyter notebook environment via Python3.10.9.
- (1)
- IV
The normalized information values of the two susceptibility evaluation factors are shown in Table 4. Spatial overlay of factor layers was conducted via ArcGIS spatial analysis tools to generate landslide susceptibility information maps. The natural break method was used to delineate landslide susceptibility zones (Figure 6a(I) and Figure 7a(II)).
Table 4.
Grading of the factors and normalized informativeness values.
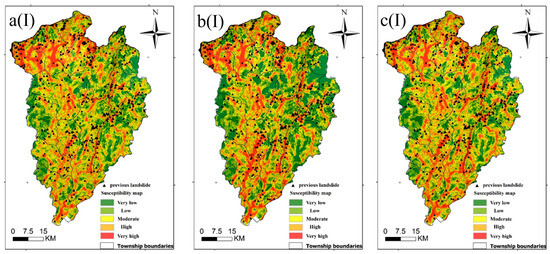
Figure 6.
Landslide susceptibility zoning map of Group I1 (a(I): IV; b(I): GLR; and c(I): GWIV).

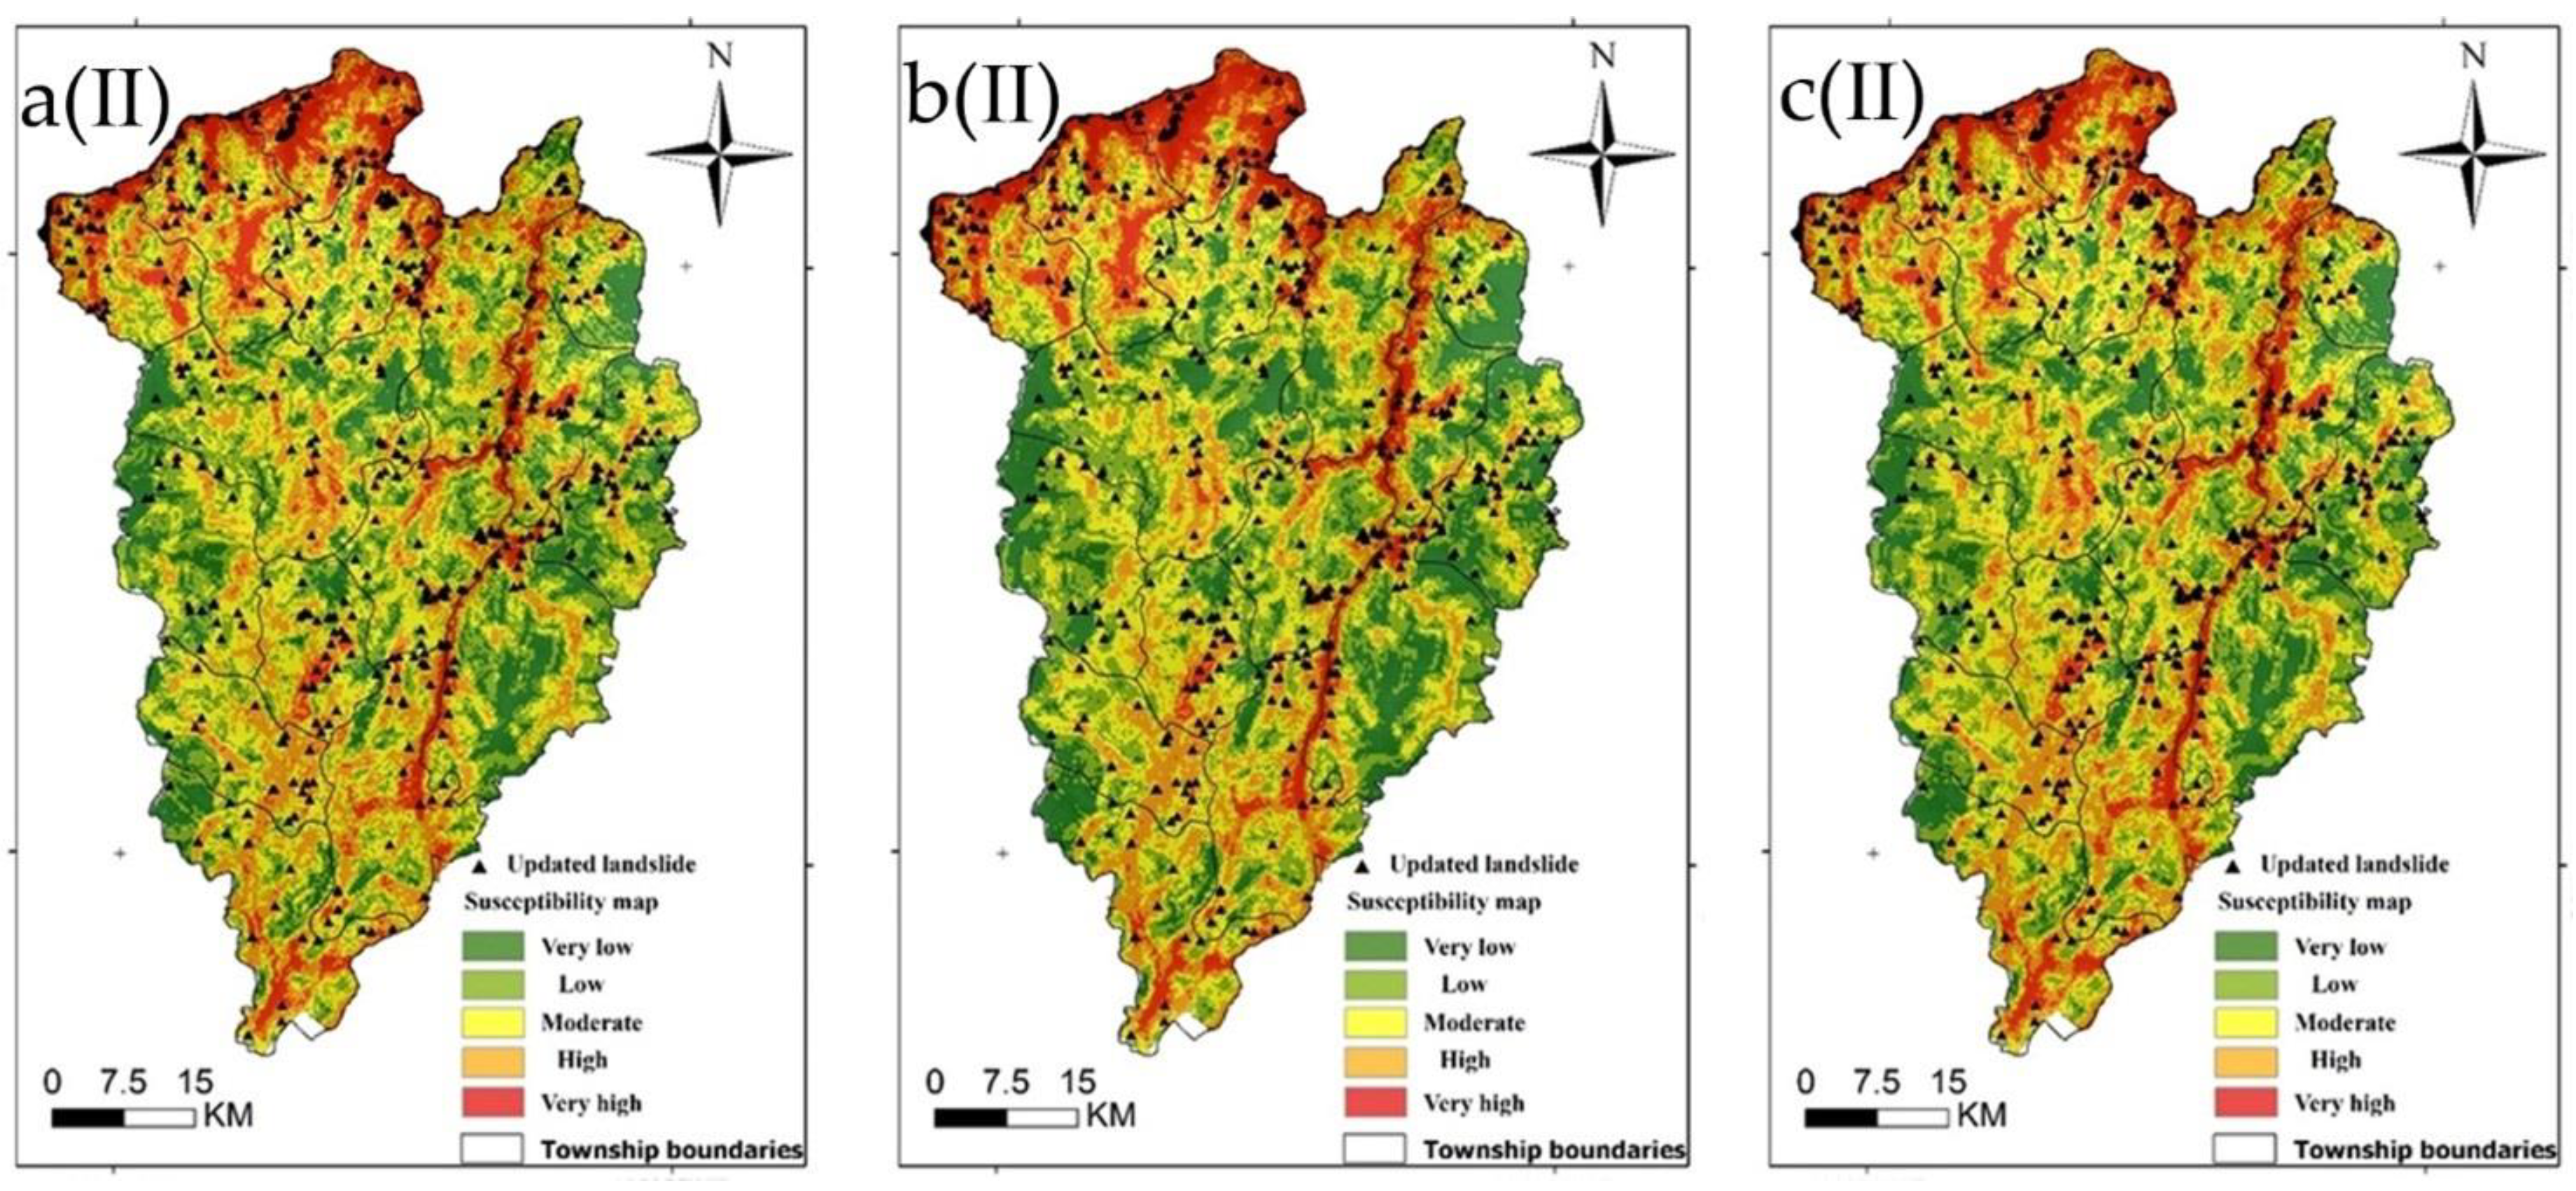
Figure 7.
Landslide susceptibility zoning map of Group I2 (a(II): IV; b(II): GLR; and c(II): GWIV).
- (2)
- GLR
The hyperparameters of the LR model obtained through genetic algorithm optimization are shown in Table 5. The logistic regression equations fitted to the two datasets are as follows:
where P1 and P2 represent the probabilities of landslide occurrence corresponding to I1 and I2, respectively, and to are independent variables. The susceptibility classification maps were generated via overlay analyses of factor grids in GIS via Equations (7) and (8) (Figure 6b(I) and Figure 7b(II)).
Table 5.
Hyperparameters of the LR model obtained via the GA.
- (3)
- GWIV
The hyperparameters obtained through genetic algorithm optimization are shown in Table 6.
Table 6.
Hyperparameters of the RF model obtained via the GA.
The average decrease in the Gini index was used as the objective weight value ωi for each factor (Table 7). The weighted information value model (GWIV) was developed by multiplying the optimized random forest model’s primary indicator factor weights with the information value model’s secondary indicator factors. This model was then applied to landslide susceptibility assessment in the study area, and the resulting susceptibility classification is shown in Figure 6c(I) and Figure 7c(II).
Table 7.
Feature importance (RF).
3.3. Model Validation
A comparison of the susceptibility zoning results with the actual disaster distribution (Table 8) clearly reveals that as the susceptibility level in an area increases, the landslide density also tends to increase. Most landslides are distributed in regions with relatively high susceptibility levels, indicating good agreement between the evaluation results and the actual distribution of disasters within the area.
Table 8.
Vulnerability zones.
The effectiveness of the landslide prediction models was evaluated in terms of precision, recall, and F1 score (Table 9). The formulas are as follows:
where represents true positive samples, represents false-positive samples, and represents false-negative samples.
Table 9.
Statistical results of the different models.
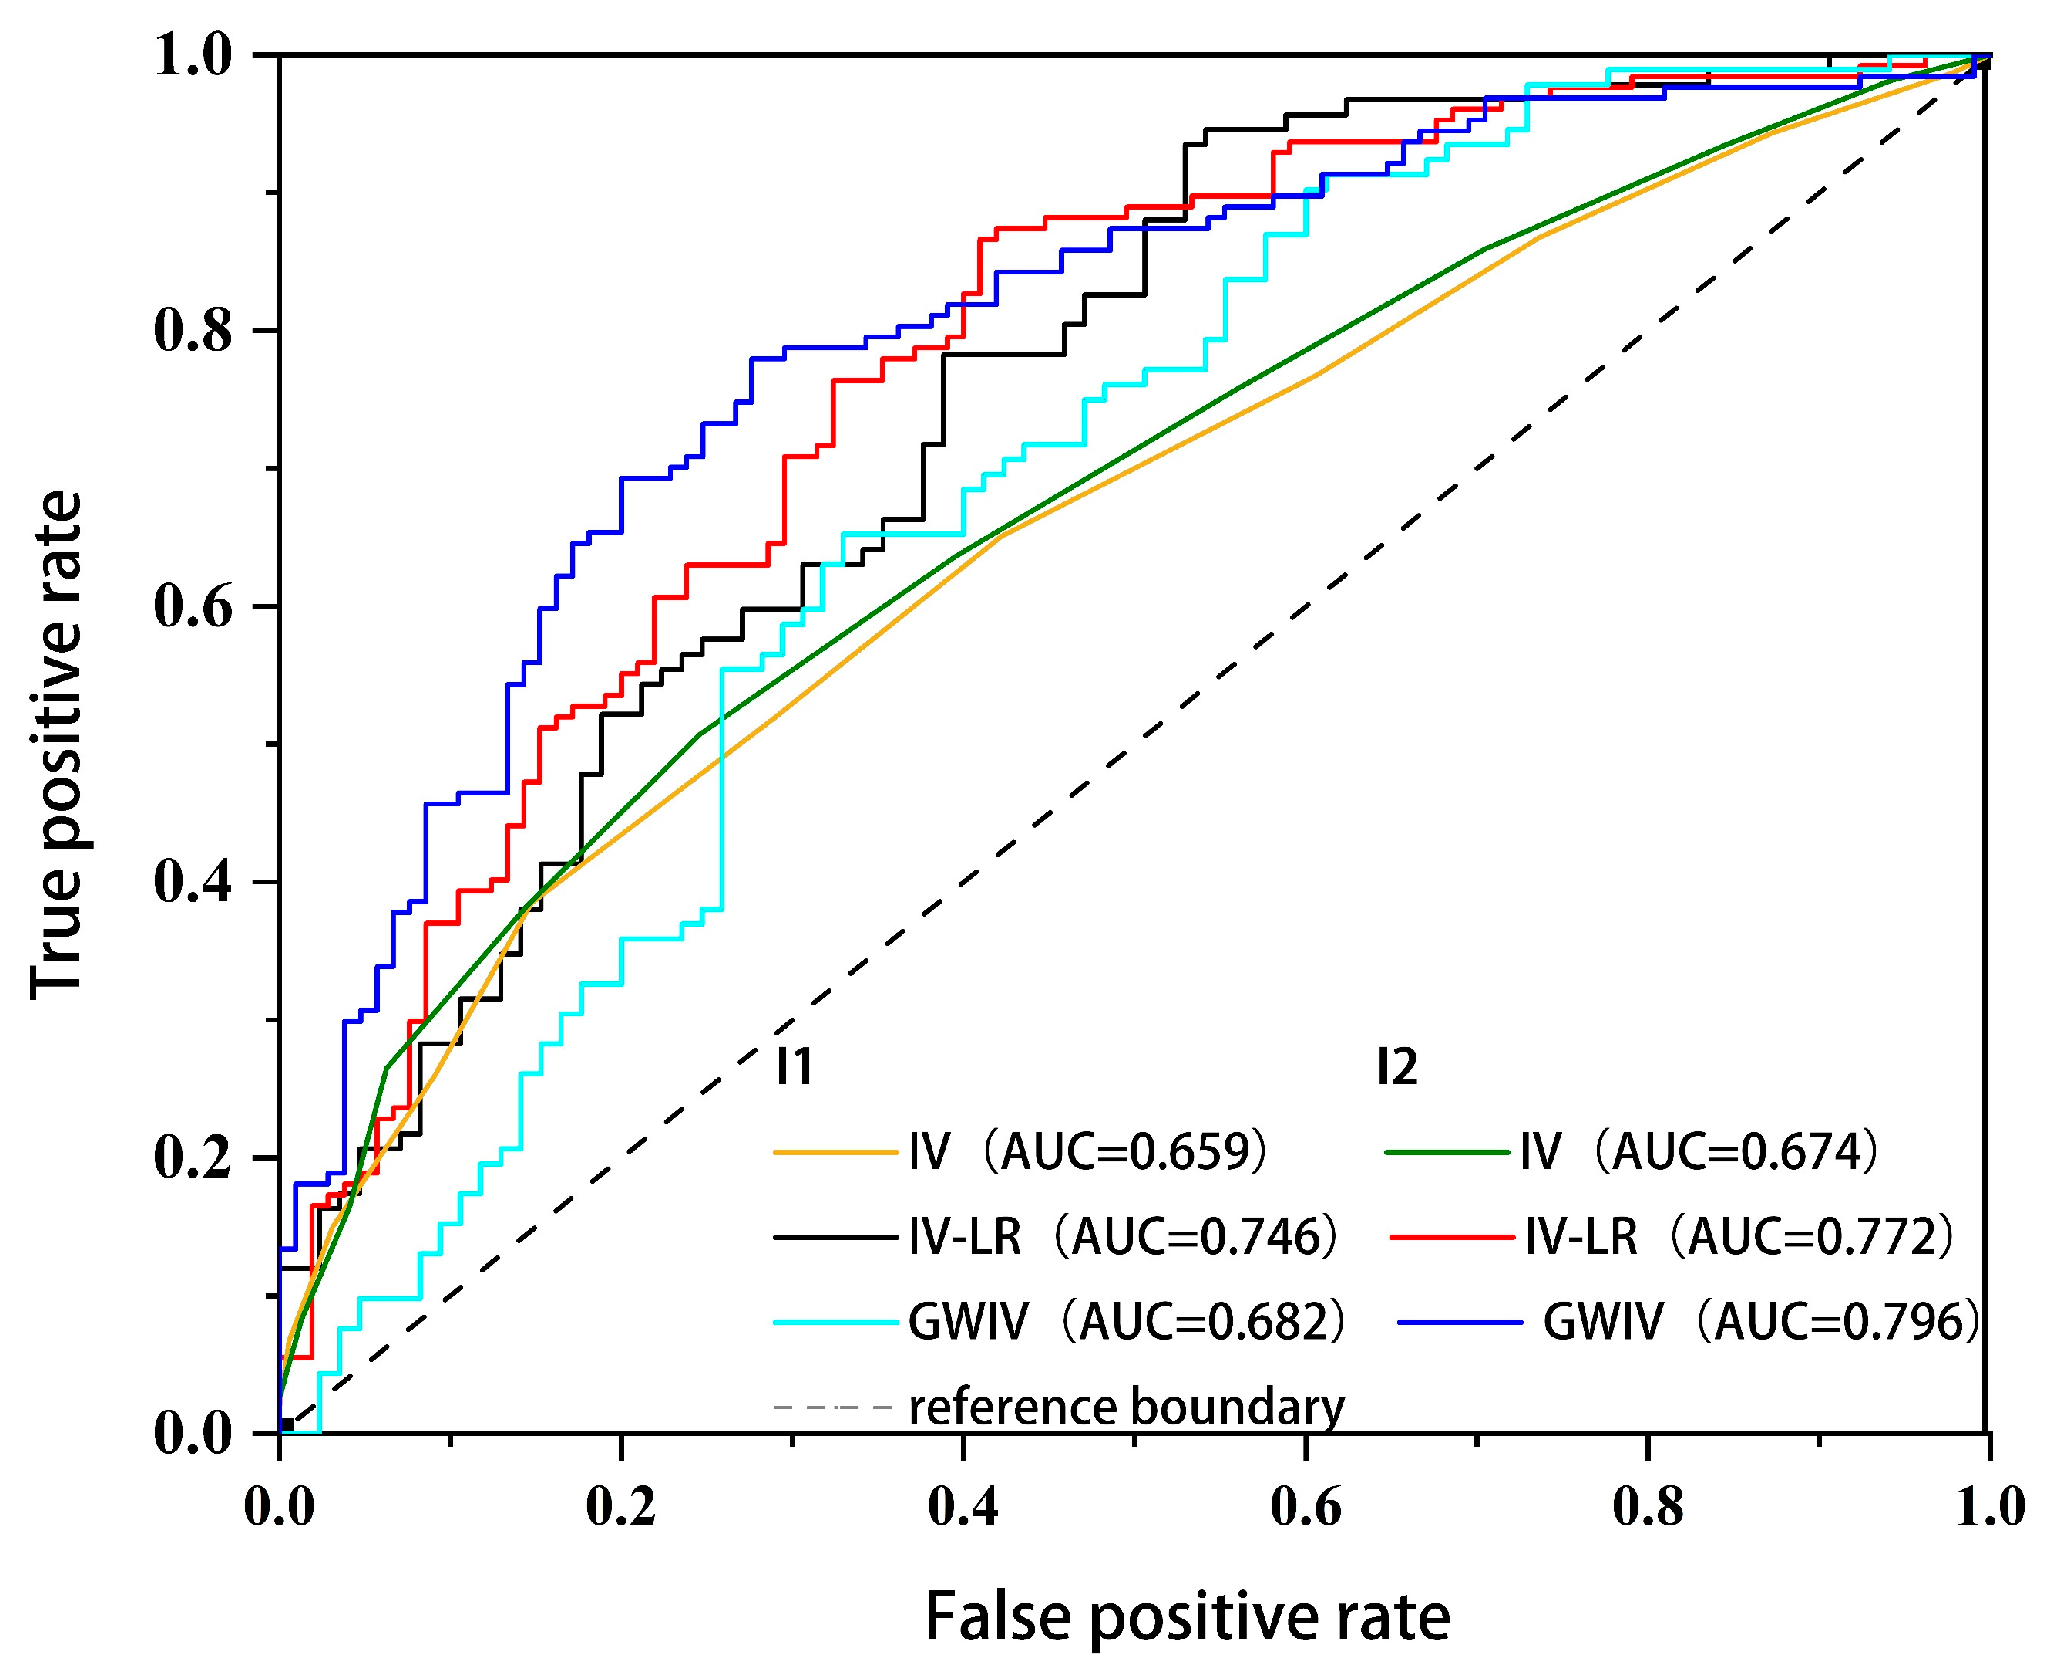
A sensitivity curve (ROC) was used to assess the accuracy of the susceptibility model (Figure 8). This curve depicts the relationship between model sensitivity (correctly classifying known landslide grid units as susceptible) and specificity (correctly classifying nonsusceptible grid units as stable). A higher area under the curve (AUC) value indicates a better model fit (AUC < 0.5 indicates prediction failure).
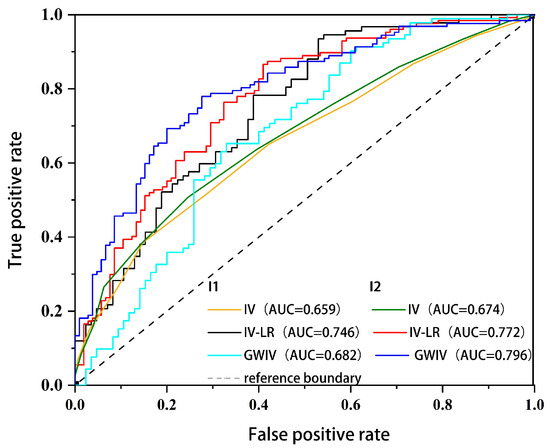
Figure 8.
ROC curve.
The comparative evaluation results indicate that in the two susceptibility assessment experiments, under the same model conditions, all the indicators in the I2 group were greater than those in the I1 group. Furthermore, the GLR and GWIV models achieved significantly improved accuracy in terms of the evaluation results compared with the IV model alone. Among the I2 groups, the GWIV model demonstrated the best results in terms of various indicators (precision = 74%, recall = 74%, F1 score = 74%, and AUC = 0.796).
4. Discussion
4.1. Analysis of Influencing Factors for Landslide Susceptibility
A comparison of the susceptibility assessment results of sets I1 and I2 revealed the following key findings: 1. Compared with individual IV models, machine-learning-coupled models were more suitable for landslide susceptibility assessment. As supported by the findings of Wang and Zhang et al. [21,22], coupling conventional statistical models with machine-learning methods for landslide susceptibility assessment resulted in significantly improved accuracy and comprehensibility of prediction results. 2. The accuracy of susceptibility evaluations significantly improved after the landslide inventory was enhanced with multisource remote-sensing technologies. This is because multisource remote-sensing technologies effectively improves the ability of landslide identification and the quality of cataloging, thereby enhancing the precision of susceptibility assessment results. It follows that improving the quality of landslide inventory can better predict the spatial probability of landslide occurrence in the region. Just as Huang et al. [23] found in their study on the impact of randomly missing landslide inventory samples on susceptibility assessment results, after a certain proportion of landslide samples are missing, the predictive performance of the susceptibility model significantly declines.
4.2. Comparative Analysis of Susceptibility Assessment Results
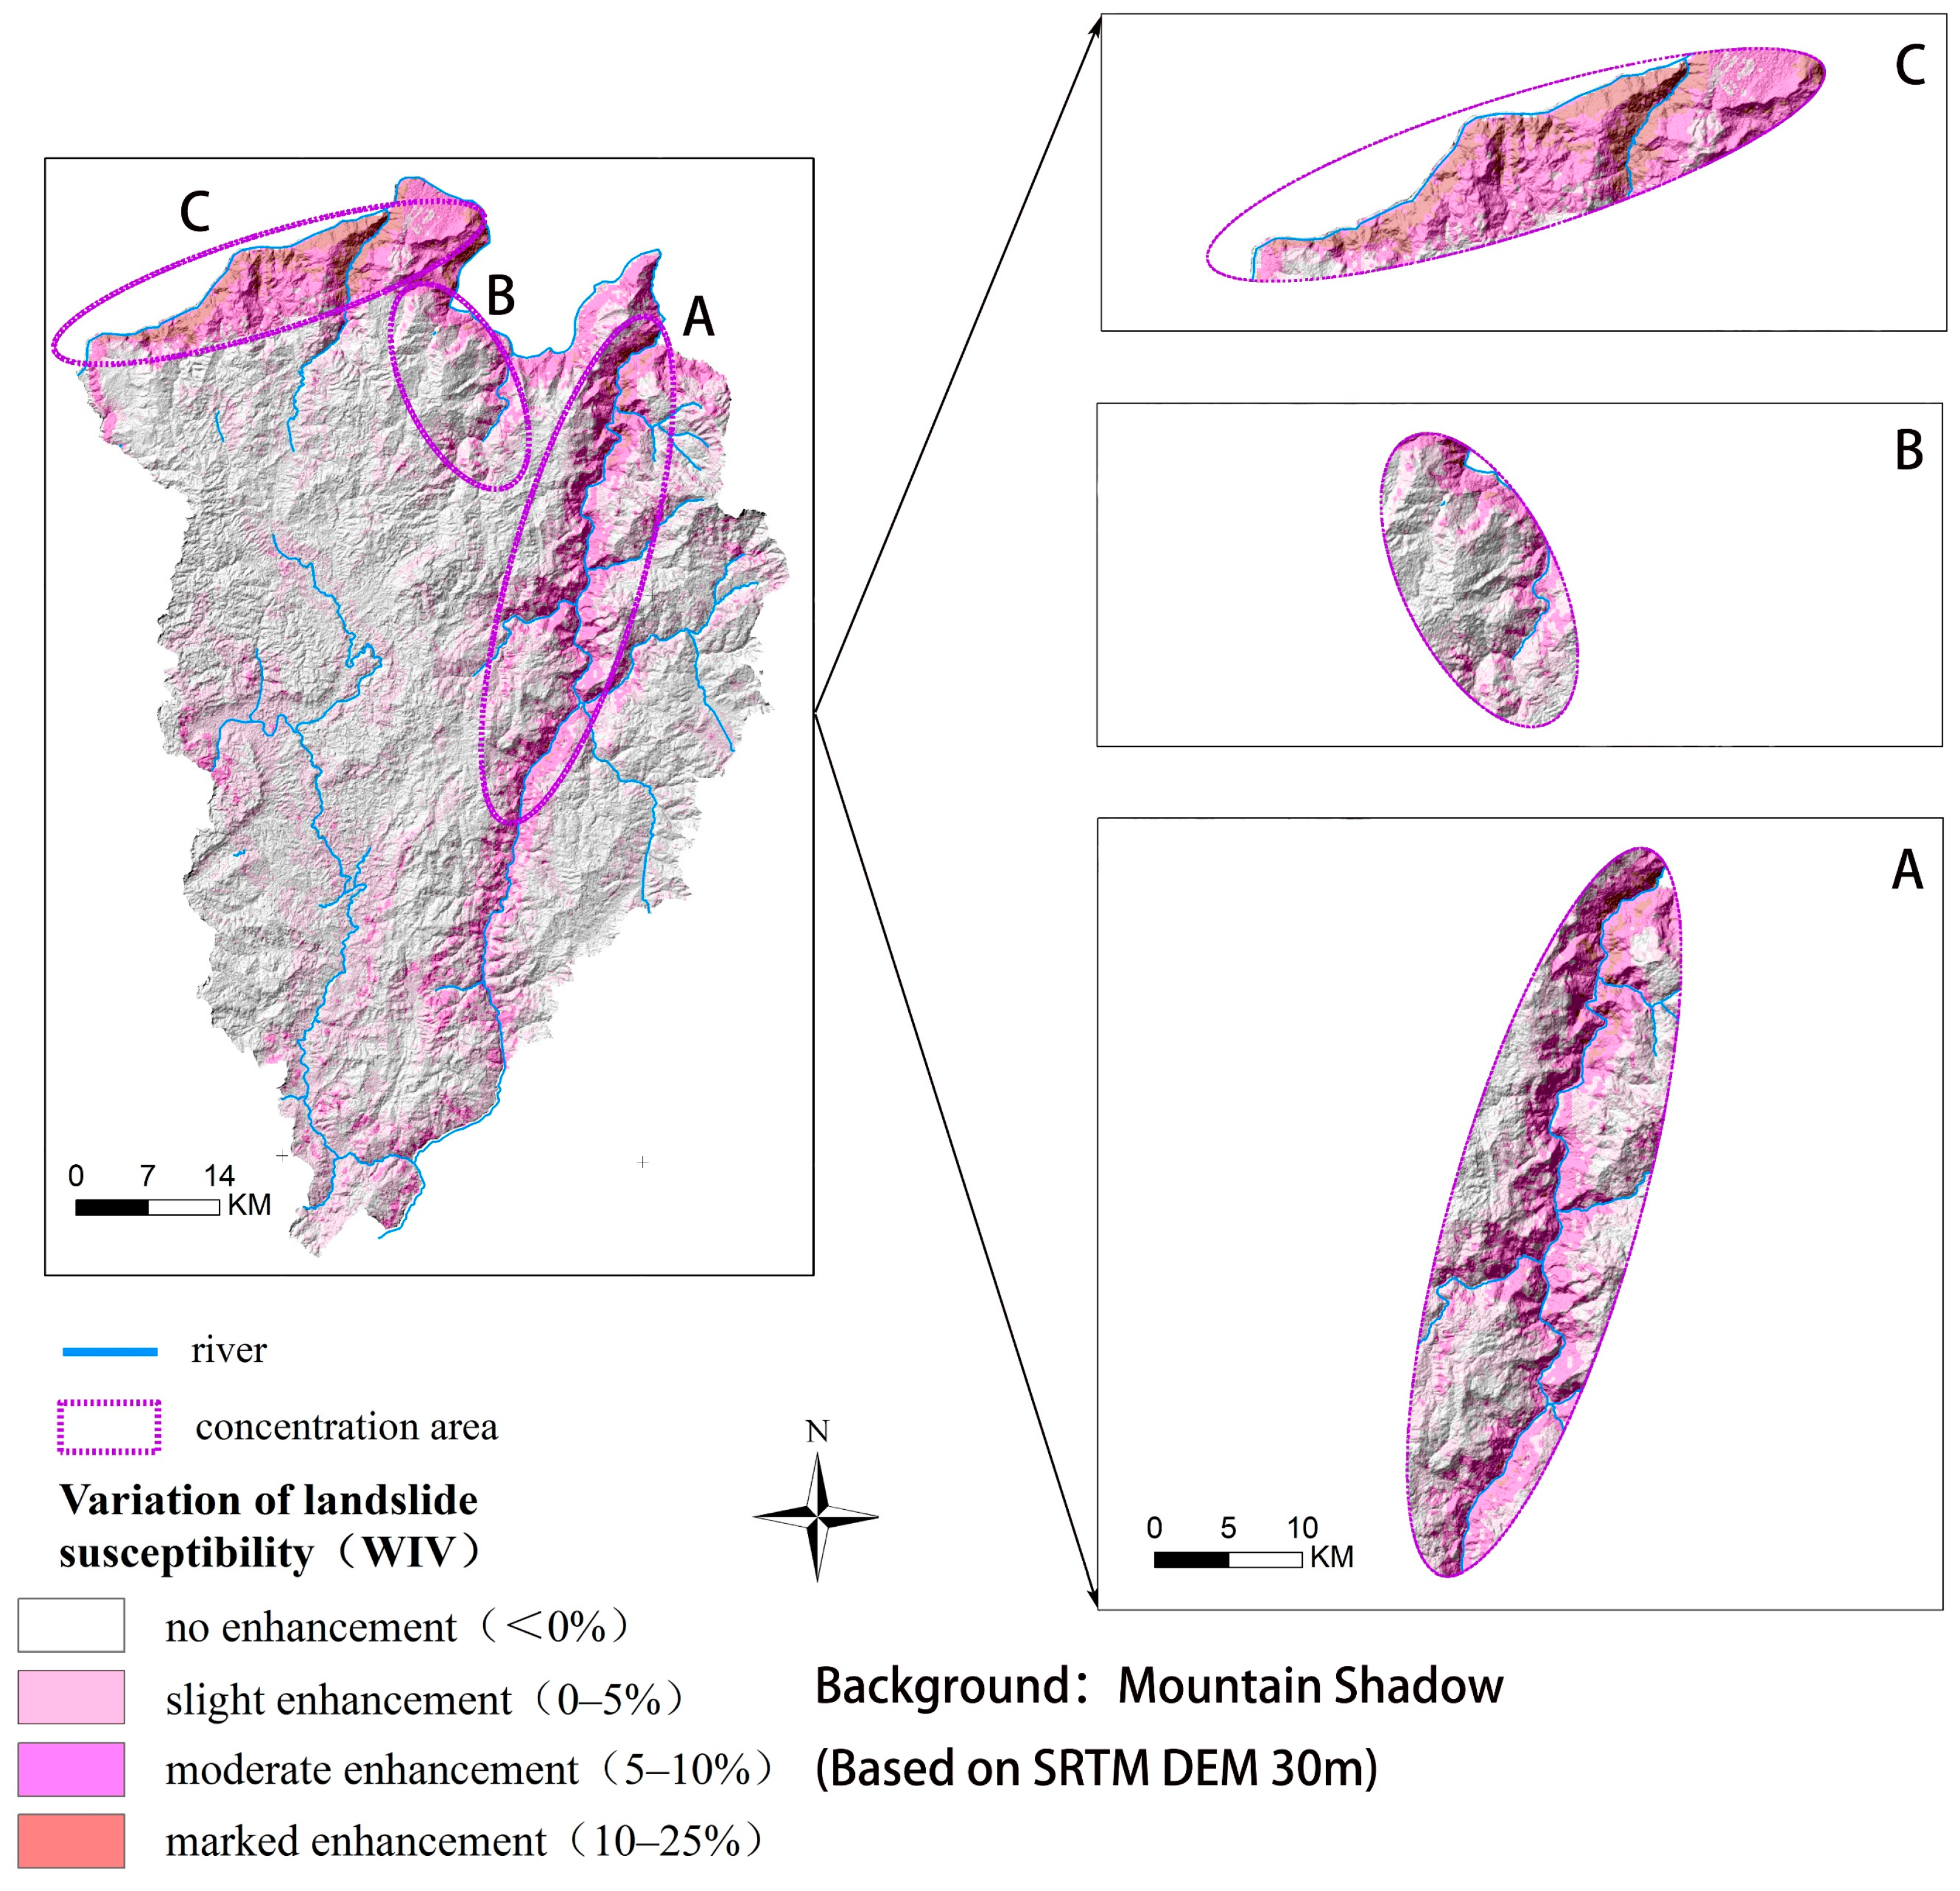
An examination of the changes in susceptibility before and after the landslide inventory was updated (Figure 9) revealed that the susceptibility levels notably increased in Subsets A, B, and C, which were located in the high-mountain canyon regions along the Jinsha River and Pudu River after the landslide inventory was introduced through remote sensing recognition. This corresponds to the presence of deformation anomaly areas in these three subsets, as shown in Figure 5, indicating a certain correlation between the two. Similarly, sun et al. [24], in combining the InSAR technique to study landslide susceptibility, found that areas with high rates of deformation on both sides of the Jinsha River were consistent with the distribution law of landslides along the river in the study area. It can be found that InSAR technology has a relatively good recognition effect on landslides that are undergoing deformation. Moreover, in the InSAR deformation results obtained, the deformation occurring in landslides usually presents the characteristic of aggregated distribution, as shown in Figure 5a,b. This finding is conducive to distinguishing landslide deformation from deformation caused by human activities, thus enabling better identification of landslides.

Figure 9.
Difference in landslide probability after updating the landslide catalog in the study area. (A) Changes in susceptibility along the Pudu River; (B, C) Changes in susceptibility along the Jinsha River.
As shown in Figure 10, analysis of factor importance levels revealed that landslides recorded in the historical inventory in Luquan County were influenced mainly by human engineering activities, followed by fault distribution, which aligns with the findings of onsite investigations. The importance of the evaluation factors exhibited significant changes after the landslide inventory was updated (Figure 10), the importance levels of the main streams, elevation, and average annual precipitation increased significantly.
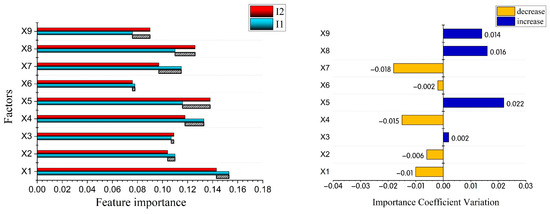
Figure 10.
Feature importance visualization.
The abovementioned variations are attributed to two main aspects: 1. Owing to the influence of tectonic fragmentation and surface erosion in the study area, the topography is characterized by significant relief and steep slopes, with some areas rarely accessed by humans, leading to the failure to identify and record some landslides through traditional survey methods. 2. The newly identified landslides are mainly located along the Jinsha River of the Pudu River, and the landslides in the region are controlled by active faults (such as the Pudu Fault), deeply incised river valleys, and complex rock types. Additionally, the Jinsha River and the Pudu River main streams flow rapidly, with multiple reservoirs distributed along the rivers, resulting in strong erosion of the slopes by the rivers. This not only provides a good back-removing surface for slope instability but also reduces the shear strength of the rock and soil mass within the slope, providing dynamic conditions for the accelerated creep of the rock mass at the slope toe, thereby resulting in new landslide occurrences.
4.3. Use of Susceptibility Assessment Results
It can be found from Figure 9 that the updated landslide inventory has enhanced the identification ability of high susceptibility areas of landslides along the Pudu River and Jinsha River, thus providing a more comprehensive scientific basis for the prevention and treatment of landslide disasters in this region. In addition, the susceptibility assessment results of Group I2 (Figure 7) show that the areas with very high, high, and moderate landslide susceptibility are mainly located along the Jinsha River, Pudu River, and Zhangjiu River. As shown in Figure 11 and the survey results, areas along the rivers, including ZheHei Township, Malutang Township, Cuihua Town, Pingshan street, Cheyinpan Town, and MaoShan Town, are densely populated and have a high building density and cultivated land. Some villages also have important projects such as hydropower stations and expressways. At the same time, these villages are in the high susceptibility area of landslides, and the possibility of landslide occurrence is high. Therefore, the focus should be on disaster reduction and prevention in these villages. The areas with low and very low susceptibility are mainly distributed in the regions far from the Jinsha River, Pudu River, and Zhangjiu River. Human activities in these areas are relatively weak, and in the event of landslides, the losses are relatively small.
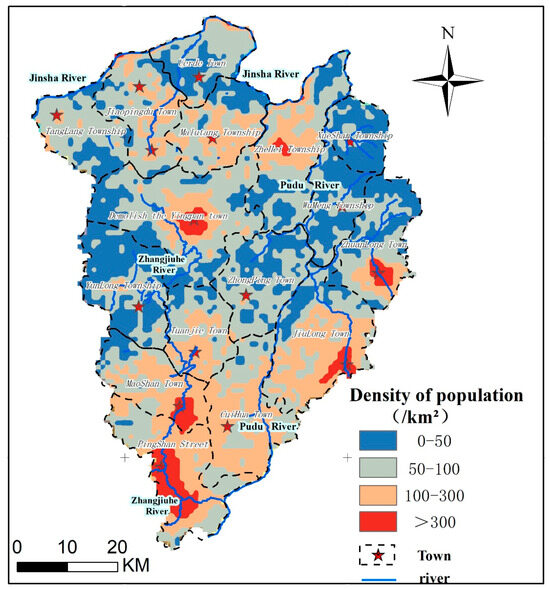
Figure 11.
The spatial distribution of population density in 2020 (Data from WorldPop [25]).
4.4. Limitations
In the susceptibility evaluation results obtained based on the updated landslide inventory, the importance of average annual precipitation has significantly increased. Thus, in the absence of a landslide inventory, it is impossible to effectively reflect the impact of rainfall on landslide occurrence in this area. However, it should be noted that this research has some limitations. Landslides are usually triggered by rainstorms and are random and difficult to predict. The study area has abundant rainfall, which is the main source of surface water and groundwater. Groundwater affects the stability of soil from within. Surface water erodes the surface of the slope body and enhances its shear force. The average annual precipitation can reflect the impact on landslides to a certain extent, but it is difficult to accurately predict landslides caused by extreme rainfall events. Despite this limitation, our study still provides valuable insights and paves the way for further research.
5. Conclusions
This study explores the uncertainties in susceptibility modeling from the perspectives of model suitability and landslide inventory quality. Two sets of samples were created on the basis of the landslide inventory before and after updating with multisource remote-sensing technologies. Three models (IV, GWIV, and GLR) were selected to conduct susceptibility evaluations. We believe that this study is of significant and important value for regional landslide disaster prevention and mitigation. The conclusions are as follows:
- We comprehensively used remote-sensing technologies, such as optical remote sensing, InSAR, and unmanned aerial vehicles, and combined field investigations to achieve the purpose of better improving the completeness of landslide inventory. Among them, 115 landslides show obvious signs of deformation in the InSAR results. The remaining 45 landslides are mainly identified through optical images. In this process, data obtained from UAV and field surveys were used to assist, correct, and validate landslides information.
- Comparing the susceptibility assessment results of groups I1 and I2 found that under the same model conditions, the three models of group I2 achieve better prediction effects. The results indicate that a complete landslide inventory is helpful for susceptibility evaluation. In addition, the evaluation results of the two coupling models GLR and GWIV are more accurate than model IV. Among them, GWIV in group I2 achieves the best effect (precision = 74%, recall = 74%, F1 score = 74%, and AUC = 0.796).
- The update of the landslide inventory has improved the ability to identify high susceptibility areas along the Jinsha River and the Pudu River in the study area. The susceptibility assessment results indicate that areas like ZheHei Township, Malutang Township, Cuihua Town, Pingshan street, Cheyinpan Town, and MaoShan Town in the county are landslide-prone and densely populated, and thus should be given top priority for disaster prevention and mitigation.
- After the landslide inventory is updated, significant changes have occurred in the susceptibility prediction results and the importance of evaluation factors. Faults, elevation, and main streams have relatively high importance. In addition, compared with the results of I1, the importance of main streams, elevation, and average annual precipitation in I2 has significantly increased. These changes were attributed mainly to the combined use of optical remote sensing and InSAR, which compensated for the shortcomings of traditional ground surveys and single remote sensing technologies by effectively identifying highly concealed landslides. Moreover, the investigation also reveals the significant influence of active faults (especially the Puduhe fault) and the erosion effects of the main streams of the Jinsha River and the Puduhe River. Therefore, the newly identified landslides are mostly concentrated along the Puduhe River and the Jinsha River and have characteristics such as large scale, strong activity, and distribution along the river.
Author Contributions
Conceptualization, Z.L.; methodology, Z.L.; software, Z.L.; validation, Z.L., S.W., J.H. and S.Y.; formal analysis, Z.L.; investigation, Z.L., S.W. and J.H.; resources, Z.L., S.W. and J.H.; data curation, Z.L.; writing—original draft preparation, Z.L.; writing—review and editing, Z.L.; visualization, Z.L.; supervision, S.W. and S.Y.; project administration, Z.L., S.W., J.H., S.Y. and G.Z.; funding acquisition, S.W. and G.Z. All authors have read and agreed to the published version of the manuscript.
Funding
This research was supported by grants from the National Key Research and Development Program of China (2021YFC3000400).
Institutional Review Board Statement
Not applicable.
Informed Consent Statement
Not applicable.
Data Availability Statement
The authors do not have permission to share the data.
Conflicts of Interest
All the authors declare that they have no financial interests.
References
- Lan, H.; Zhou, C.; Wang, L.; Zhang, H.; Li, R. Landslide hazard spatial analysis and prediction using GIS in the Xiaojiang watershed, Yunnan, China. Eng. Geol. 2004, 76, 109–128. [Google Scholar] [CrossRef]
- Xu, C.; Dai, F.; Yao, X.; Chen, J.; Tu, X.B.; Sun, Y.; Wang, Z. GIS-based landslide susceptibility assessment using analytical hierarchy process in wenchuan earthquake region. Yanshilixue Yu Gongcheng Xuebao/Chin. J. Rock Mech. Eng. 2009, 28, 3978–3985. [Google Scholar]
- Bai, S.; Lu, P.; Wang, J. Landslide susceptibility assessment of the Youfang catchment using logistic regression. J. Mt. Sci. 2015, 12, 816–827. [Google Scholar] [CrossRef]
- Wang, L.-J.; Guo, M.; Sawada, K.; Lin, J.; Zhang, J. A comparative study of landslide susceptibility maps using logistic regression, frequency ratio, decision tree, weights of evidence and artificial neural network. Geosci. J. 2016, 20, 117–136. [Google Scholar] [CrossRef]
- Zhang, X.Y.; Zhang, C.S.; Meng, H.J. Landslide hazard evaluation in the northern mountainous area of Guide County based on Random Forest and AHP, China. Hydrogeol. Eng. Geol. 2018, 45, 138–142. [Google Scholar]
- Rong, G.; Alu, S.; Li, K.; Su, Y.; Zhang, J.; Zhang, Y.; Li, T. Rainfall induced landslide susceptibility mapping based on Bayesian optimized random forest and gradient boosting decision tree models—A case study of Shuicheng County, China. Water 2020, 12, 3066. [Google Scholar] [CrossRef]
- Malamud, B.D.; Turcotte, D.L.; Guzzetti, F.; Reichenbach, P. Landslide inventories and their statistical properties. Earth Surf. Process. Landf. 2004, 29, 687–711. [Google Scholar] [CrossRef]
- Borgomeo, E.; Hebditch, K.V.; Whittaker, A.C.; Lonergan, L. Characterising the spatial distribution, frequency and geomorphic controls on landslide occurrence, Molise, Italy. Geomorphology 2014, 226, 148–161. [Google Scholar] [CrossRef]
- Shi, X.; Liao, M.; Li, M.; Zhang, L.; Cunningham, C. Wide-area landslide deformation mapping with multi-path ALOS PALSAR data stacks: A case study of three gorges area, China. Remote Sens. 2016, 8, 136. [Google Scholar] [CrossRef]
- Xu, Q.; Dong, X.J.; Li, W.L. Integrated Space-Air-Ground early detection, monitoring and warning system for potential catastrophic geohazards. Geomat. Inf. Sci. Wuhan Univ. 2019, 44, 957–966. [Google Scholar] [CrossRef]
- Xu, Y.; Allen, M.B.; Zhang, W.; Li, W.; He, H. Landslide characteristics in the Loess Plateau, northern China. Geomorphology 2020, 359, 107150. [Google Scholar] [CrossRef]
- Lu, H.; Li, W.; Xu, Q.; Dong, X.; Dai, C.; Wang, D. Early Detection of Landslides in the Upstream and Downstream Areas of the Baige Landslide, the Jinsha River Based on Optical Remote Sensing and InSAR Technologies. Geomat. Inf. Sci. Wuhan Univ. 2019, 44, 1342–1354. [Google Scholar] [CrossRef]
- Qin, Z.; Chaoying, Z.; Xuerong, C. Technical progress and development trend of geological hazards early identification with multi-source remote sensing. Acta Geod. Cartogr. Sin. 2022, 51, 885. [Google Scholar] [CrossRef]
- Lee, C.W.; Lu, Z.; Jung, H.S. Simulation of time-series surface deformation to validate a multi-interferogram InSAR processing technique. Int. J. Remote Sens. 2012, 33, 7075–7087. [Google Scholar] [CrossRef]
- Li, G.; Hu, B.; Li, H.; Lu, F. Early identifying and monitoring landslides in guizhou province with insar and optical remote sensing. J. Sens. 2021, 2021, 6616745. [Google Scholar] [CrossRef]
- Zheng, Z.; Xie, C.; He, Y.; Zhu, M.; Huang, W.; Shao, T. Monitoring potential geological hazards with different InSAR algorithms: The case of western Sichuan. Remote Sens. 2022, 14, 2049. [Google Scholar] [CrossRef]
- Wu, J.; Gao, X.J. A gridded daily observation dataset over China region and comparison with the other datasets. Chin. J. Geophys. 2013, 56, 1102–1111. [Google Scholar] [CrossRef]
- Wu, R.Z.; Hu, X.D.; Mei, H.B.; He, J.Y.; Yang, J.Y. Spatial Susceptibility Assessment of Landslides Based on Random Forest: A Case Study from Hubei Section in the Three Gorges Reservoir Area. Earth Sci. 2021, 46, 321–330. [Google Scholar]
- Zhang, X.; Zhang, C.; Meng, H.; Wang, P.; Li, H. Landslide susceptibility assessment of new Jing-Zhang high-speed railway based on GIS and information value model. J. Geomech. 2018, 24, 96–105. [Google Scholar]
- Du, G.; Yang, Z.; Yuan, Y.; Ren, S.; Ren, T. Landslide susceptibility mapping in the Sichuan-Tibet traffic corridor using logistic regression- information value method. Hydrogeol. Eng. Geol. 2021, 48, 102–111. [Google Scholar] [CrossRef]
- Wang, Y.; Sun, D.; Wen, H.; Zhang, H.; Zhang, F. Comparison of Random Forest Model and Frequency Ratio Model for Landslide Susceptibility Mapping (LSM) in Yunyang County (Chongqing, China). Int. J. Environ. Res. Public Health 2020, 17, 4206. [Google Scholar] [CrossRef] [PubMed]
- Zhang, J.; Qian, J.; Lu, Y.; Li, X.; Song, Z. Study on Landslide Susceptibility Based on Multi-Model Coupling: A Case Study of Sichuan Province, China. Sustainability 2024, 16, 6803. [Google Scholar] [CrossRef]
- Huang, F.; Mao, D.; Jiang, S.-H.; Zhou, C.; Fan, X.; Zeng, Z.; Catani, F.; Yu, C.; Chang, Z.; Huang, J.; et al. Uncertainties in landslide susceptibility prediction modeling: A review on the incompleteness of landslide inventory and its influence rules. Geosci. Front. 2024, 15, 101886. [Google Scholar] [CrossRef]
- Sun, X.; Chen, J.; Li, Y.; Rene, N.N. Landslide Susceptibility mapping along a rapidly uplifting river valley of the Upper Jinsha River, Southeastern Tibetan Plateau, China. Remote Sens. 2022, 14, 1730. [Google Scholar] [CrossRef]
- WorldPop; Center for International Earth Science Information Network (CIESIN), Columbia University. Global High Resolution Population Denominators Project—Funded by The Bill and Melinda Gates Foundation (OPP1134076); WorldPop: Southampton, UK, 2018. [Google Scholar] [CrossRef]


Disclaimer/Publisher’s Note: The statements, opinions and data contained in all publications are solely those of the individual author(s) and contributor(s) and not of MDPI and/or the editor(s). MDPI and/or the editor(s) disclaim responsibility for any injury to people or property resulting from any ideas, methods, instructions or products referred to in the content. |
© 2024 by the authors. Licensee MDPI, Basel, Switzerland. This article is an open access article distributed under the terms and conditions of the Creative Commons Attribution (CC BY) license (https://creativecommons.org/licenses/by/4.0/).