Article

The Coupling Coordination Degree and Its Driving Factors for Water–Energy–Food Resources in the Yellow River Irrigation Area of Shandong Province

1
Yellow River Institute of Hydraulic Research, Zhengzhou 450003, China
2
Key Laboratory of Lower Yellow River Channel and Estuary Regulation, Ministry of Water Resources, Zhengzhou 450003, China
3
College of Harbor, Coastal and Offshore Engineering, Hohai University, Nanjing 210098, China
*
Authors to whom correspondence should be addressed.
Sustainability 2024, 16(19), 8473; https://doi.org/10.3390/su16198473 (registering DOI)
Submission received: 14 August 2024 / Revised: 19 September 2024 / Accepted: 26 September 2024 / Published: 29 September 2024

Abstract

:
Water resources, energy, and food are essential for the development of society, and they are strongly interdependent. The coupling and coordination relationships of the water–energy–food (WEF) system are important for regional resource security and high-quality development. The Yellow River Irrigation Area in Shandong Province, China, is a grain production base and has a substantial impact on national food security. To examine the water, energy, and food subsystem dynamics in this area, an evaluation system for the WEF system was established. A comprehensive weighting method based on game theory was employed to determine index weights. TOPSIS was used to assess the development level of the WEF system. A coupling coordination degree model was used to analyze the evolution of the coupling coordination degree of the WEF system from 2000 to 2020, and a GWR model was constructed to explore the spatial heterogeneity of its driving factors. The findings indicated that the development level of the WEF system in the study area was moderate, with a gradual upward trend. The coupling coordination degree fluctuated between 0.62 and 0.739. The GWR model revealed that temperature had an overall negative effect on the coupling coordination degree, with the greatest impact on the central irrigation area; the slope and NDVI had a negative effect, with increasing intensity from the southwest to the northeast; and rainfall had an overall positive effect, with the greatest impact on the irrigation area near the estuary in the northeast. Overall, the building area ratio had a negative effect on the coupling coordination degree, with exceptions in some areas. These research outcomes provide theoretical support for sustainable agricultural development in the Yellow River irrigation areas of Shandong Province and methodological reference data for studying collaborative resource utilization in irrigation regions.

1. Introduction

Water, energy, and food are essential resources for human survival and social development, and their security is closely related to sustainable human development [1]. With the increase in the global population, intensification of climate change, transformation of the natural environment, and continuous socioeconomic development, the three resource sectors of water, energy, and food are facing increasing demands and challenges. The growing demand for water, energy, and food is a concern for both developed and developing countries [2]. In the coming decades, the global demand for water, energy, and food will further increase. It is expected that by 2030, the demand for water resources, food, and energy will increase by 30%, 50%, and 40%, respectively [3]. As the world’s largest developing country, China faces certain risks and challenges for the future in terms of water, energy, and food in the face of international turbulence and global resource shortages. China’s water resources are scarce and unevenly distributed in time and space. China’s per capita water resources are approximately a quarter of the world average [4]. According to statistics from the Ministry of Water Resources of China, the annual agricultural production water shortage is approximately 26 billion cubic meters on the basis of the current typical water demand. According to the World Energy Statistical Yearbook (2019), China’s energy consumption has grown at an average rate of 3.9% over the past decade, accounting for 24% of global energy consumption. As the world’s largest energy-consuming country, China will still need a large amount of energy in the future, and the energy gap will continue to increase. According to the “China Rural Development Report (2021)” published by the Institute of Rural Development at the Chinese Academy of Social Sciences, by 2025, there will be a shortage of approximately 150 million tons of grain production in China that will need to be addressed. Considering the above problems, the coupling and coordination relationships of the WEF system should be explored from the perspective of WEF correlation to ensure the sustainable development of the region.
The relationships among water, energy, and food are strong and highly complex, and the production, processing, and transportation of food cannot be separated from water resources and energy [5]. This is because the production, storage, and consumption of energy consume water resources [6]; the extraction and scheduling of water resources consume energy [7]; and some grains can also be used as biomass energy [8,9,10]. Since the “Water-Energy-Food Security Linkage Conference” held in Bonn, Germany, in 2011, the water–energy–food nexus has become a popular research topic for politicians and scholars, and scholars worldwide have obtained many related results. Regarding WEF system evaluation, Mannan et al. [11] used the life cycle assessment method to analyze the levels of coordination between water resources, energy, and food; Mohammadour et al. [12] constructed a security evaluation index for the WEF system on the basis of the RAND pardee method and quantitatively evaluated the security of the WEF system; Li et al. [13] analyzed the risk levels of WEF systems on the basis of the copula function; and Li et al. [14] conducted a graded evaluation of the stability, coordination, sustainability, and collaborative security of WEF systems via a variable fuzzy evaluation method. In terms of model construction, Gu et al. [15] evaluated the safety of WEF systems on the basis of the pressure state response (PSR) model. Peng Shaoming et al. [16] proposed a layout plan for integrated optimization of water resource allocation, energy development, and grain production by constructing a collaborative optimization model for the WEF system. Hu et al. [17] used a system dynamics model to study the relationships among water, energy, and food in terms of urban metabolism. Wang Huimin et al. [18] combined the PSR model and system dynamics model to construct a model to explore the green development policy of the WEF system. Deng Peng et al. [19] constructed a coupled coordination degree model to study the evolution characteristics of the coupled coordination degree and promote regional sustainable development. At present, most scholars have evaluated the coupling and coordination of WEF systems in the time dimension; the lack of a hierarchy in research dimensions has made it difficult to thoroughly elucidate the coupling and coordination laws of WEF systems. Moreover, most of the existing research results are limited to regional scales, such as the national level [20], provincial level [21], and urban level [22], and few scholars have used irrigation areas as regional scales for research.
The Yellow River Irrigation Area in Shandong Province holds a crucial position in ensuring grain supply security for Shandong Province and ranks among the regions with the largest amount of water resources and agricultural energy utilization in China. Research on this area has predominantly focused on single-factor studies of water resources, including evaluations of irrigation water-saving techniques [23], water allocation planning and utilization [24], assessments of agricultural water security [25], and analyses of groundwater quality [26]. However, comprehensive analyses of the WEF system in this region are currently lacking. In the cropping systems of the Yellow River Irrigation Area in Shandong, crop rotation of wheat and maize has been widely adopted because of its significantly high yield. Nevertheless, the rapid increase in agricultural crop yields in the irrigation area has been accompanied by declining groundwater levels and substantial energy consumption. The advancing processes of urbanization and industrialization have led to further water, energy, and food security issues in the Yellow River Irrigation Area of Shandong, worsening the mismatch between the coordinated development of WEF subsystems and socioeconomic development. To address this situation, it is crucial to study the coupling coordination development patterns of the WEF system in the Yellow River Irrigation Area of Shandong Province. In this study, the Yellow River Irrigation Area in Shandong Province was selected as the research subject. A coupling coordination degree model and a GWR model were constructed to assess the coordination of water, energy, and food resource development over a period of years and investigate the spatial heterogeneity of their driving factors; the findings can contribute to the protection and sustainable development of agricultural resources in the irrigation area and the formulation of relevant policies. This effort was intended to provide theoretical references and insights for the scientific management and sustainable development of resources in the Yellow River Irrigation Area and Shandong Province as a whole.

2. Research Area and Data Sources
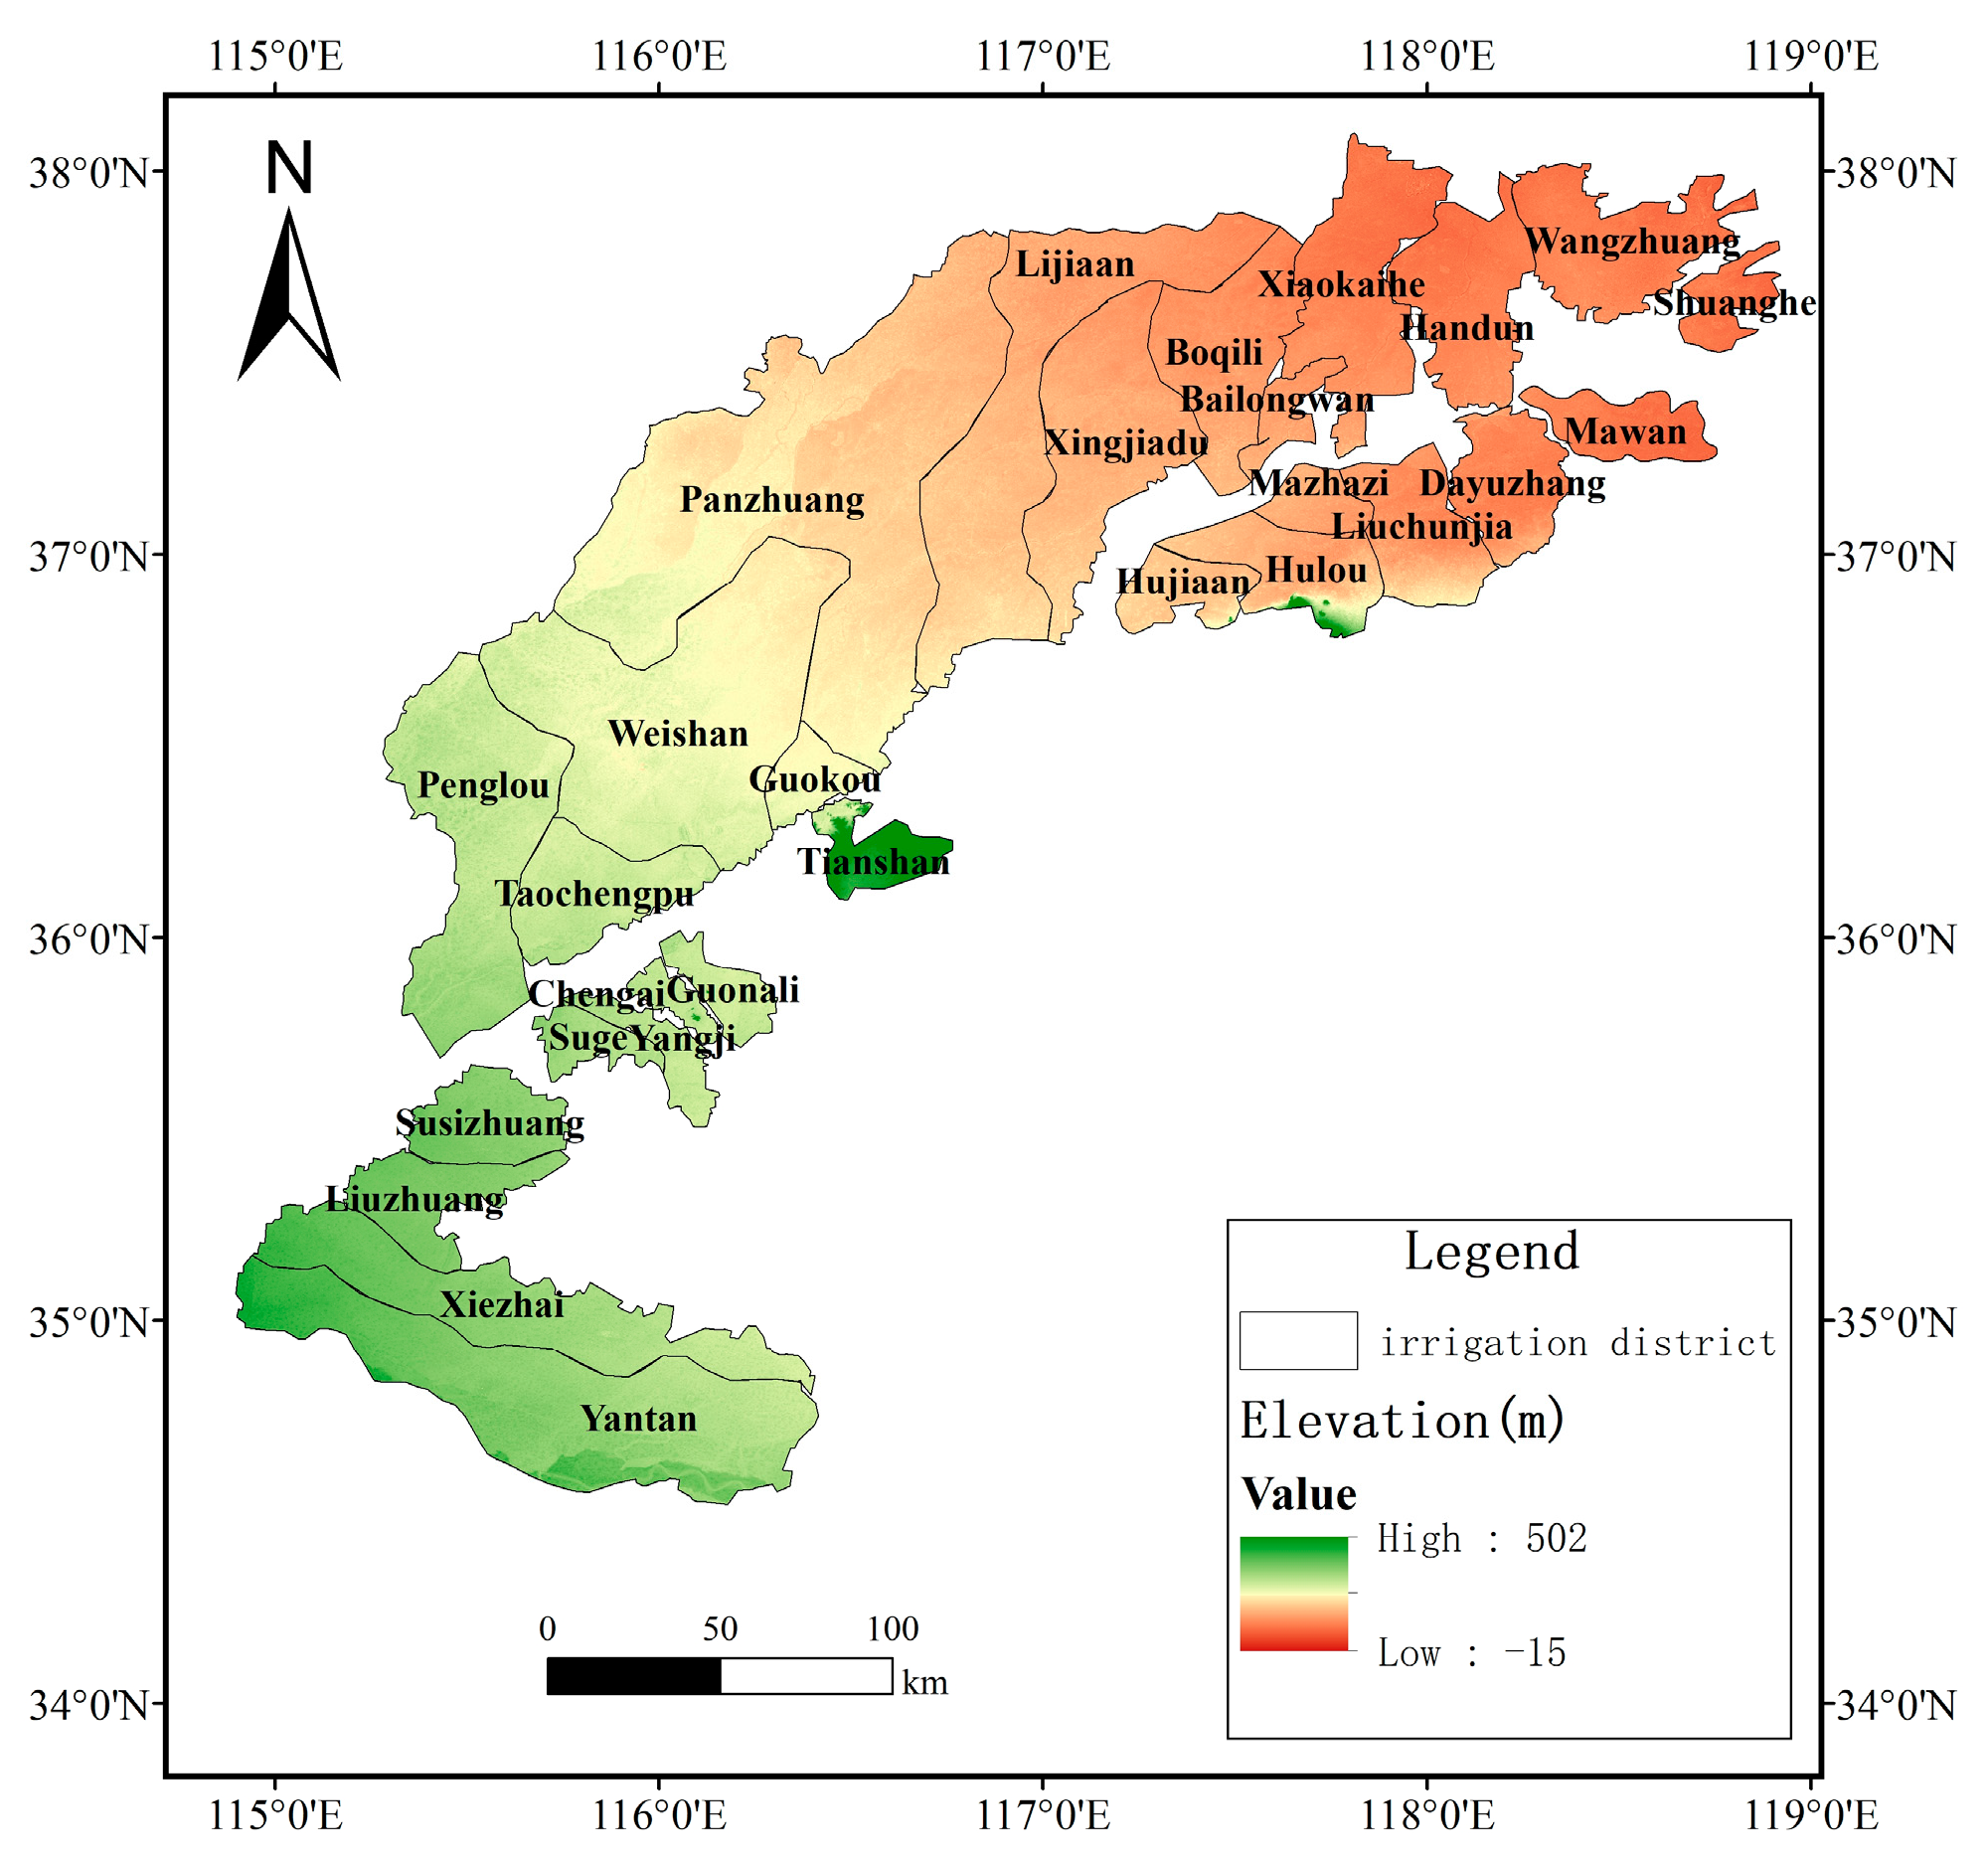
2.1. Research Area

The study area includes 28 Yellow River Irrigation Areas in Shandong Province, located at 34°33′–38°13′ N and 114°49′–119°06′ E (Figure 1). The total area is 388,300 km2, currently including Liaocheng, Dongying, Binzhou, Jinan, Dezhou, Zibo, Tai’an, Jining, and Heze, and covers a total of 54 counties (districts) in 9 cities (prefectures) across Shandong Province.
The primary irrigation water source in the study area is the Yellow River, supplemented by small amounts of surface water from tributaries of the Yellow River, Hai River, and Huai River that serve the Shandong Yellow River Irrigation Area. This region experiences a warm, temperate monsoon climate characterized by mild temperatures and concentrated rainfall, with 60% to 70% of the annual precipitation occurring from June to August [27]. In recent years, the average rainfall in the lower reaches of the Yellow River has decreased due to climate change and human activities, leading to a significant reduction in natural river flow. The overall riverbed of the lower Yellow River shows signs of incision, and under same flow conditions, the water level of the Yellow River is generally decreasing. Additionally, water inflow in the upper reaches of the Yellow River has been insufficient, while the water demand for crop growth in the irrigation area continues to increase. Insufficient natural flow capacity in the irrigation area has worsened the increasingly prominent mismatch between the supply of and demand for agricultural irrigation water resources [25].

2.2. Data Sources

The research data primarily originated from authoritative sources such as the “Statistical Yearbook of Shandong Province”, the “Water Resources Bulletin of Shandong Province”, and statistical data from municipalities (counties, districts) within each irrigation area. In cases where data for specific years were missing, they were supplemented via weighted averaging or interpolation methods to ensure the completeness and accuracy of the study.

3. Method

This study presents a systematic framework for effectively exploring the coupling and coordination relationships among water, energy and food systems; the details are illustrated in Figure 2.

3.1. Comprehensive Evaluation Method

3.1.1. Construction of the Index System

The WEF system is a complex and interconnected mega-system with extensive content. The construction of an evaluation index system for assessing coupling coordination in this system involves consideration of uncertainties and diversity. By drawing on previous research [28,29,30,31,32], while comprehensively considering the interaction mechanisms among the water, energy, and food subsystems and strictly adhering to principles such as scientific rigor, systematicity, comprehensiveness, and data availability, a comprehensive evaluation index system for the WEF system in the Yellow River Irrigation Area of Shandong Province was developed. This index system comprises 18 evaluation indices (Table 1).
Given the significant variations in cultivated land area across different irrigation areas in Shandong Province, average values across units of grain sowing area are considered in constructing the evaluation index system. This approach aims to reduce redundancy among evaluation indices and increase the accuracy of assessments, thereby ensuring the scientific validity and effectiveness of the comprehensive evaluation of the WEF system.
For the water resource subsystem, six indices closely related to water resource inputs were selected: the water resource utilization rate, groundwater supply ratio, agricultural water use ratio, effective irrigation area ratio, blue water use per unit area, and effective rainfall (A1–A6). The water resource utilization rate reflects the extent and potential of water resource development and utilization in the irrigation area. The agricultural water use ratio represents the current level of agricultural water use and the pressure it places on local water resources. The groundwater supply ratio reflects the degree of groundwater development and utilization. The effective irrigation area ratio is a key index for measuring the level of water infrastructure and agricultural production stability in the irrigation area. The blue water use per unit area reflects the utilization level of broad agricultural blue water resources in the irrigation area. The effective rainfall indicates the degree to which rainfall is directly or indirectly utilized during the growing season of cereal crops in the irrigation area, which is crucial for crop production planning and the determination of cultivation methods.
For the energy subsystem, this study focused on both direct (electricity, diesel) and indirect (fertilizers, pesticides, plastic film) inputs related to agricultural energy use in the irrigation area, and five indices were selected: fertilizer use per unit area, electricity use per unit area, plastic film use per unit area, agricultural diesel use per unit area, and pesticide use per unit area (B7–B11). These indices collectively reflect the intensity of different forms of energy inputs in agricultural production within the irrigation area.
For the food subsystem, seven indices closely related to grain production were selected on the basis of the actual grain production conditions in the irrigation area. These were the yields of wheat, corn, rice, beans, potatoes, cotton, and other grains per unit area (C12–C18). These indices collectively reflect the productivity of different types of crops within the irrigation area.

3.1.2. Calculation of the Weights

Subjective Weighting of the G1 Method

The G1 method, also known as the ordinal relationship analysis method [33], is a new subjective weighting method based on an improvement of the analytic hierarchy process (AHP) [34]. The G1 method assigns weights to different indices on the basis of an order relationship established by decision-makers. This method addresses the shortcomings of the AHP and reduces the computational effort of determining the weights of each index. It does not require the construction of a judgment matrix or a consistency check, making it easy to use. The advantages of the G1 method are its clear logic and simple calculation; the resulting weights are also sufficiently effective. This method uses three steps for determining subjective weights:
(1) Determine the order of importance of the evaluation indices:
c 1 c 2 c n
where n is the number of evaluation indices. The index on the left side of the symbol indicates greater importance.
(2) Determine the importance ratios between adjacent attributes in the order relationship:
w i 1 1 w i 1 = r i ( i = 2 , 3 , , n ) ,
The larger the r i value is, the greater the importance of the index w i 1 1 compared with the index w i 1 . The reference values for r i are shown in Table 2.
(3) Calculate the weights of each index:
w i 1 = ( 1 + i = 2 n k = i n r k ) 1 ,
w i 1 1 = w i 1 r i ( i = n , n 1 , , 2 ) ,
where w n 1 , w i 1 1 and w i 1 represent the weights of indices c n , c i 1 , and c i , respectively, obtained via the G1 method.

Objective Weighting via the Entropy Weighting Method

The entropy weighting method is an objective weighting method based on the theory of information entropy, which means that the smaller the information entropy and the greater the degree of dispersion, the more information is carried, and the greater the influence on the comprehensive evaluation [35,36,37].
The specific steps of applying the entropy weight method are as follows:
Assume that there are m evaluation years and n evaluation indices. The original data evaluation index matrix can be expressed as:
X = { x i j } m × n ( j = 1 , 2 , 3 , , m ; i = 1 , 2 , 3 , , n ) ,
(1) Owing to the different dimensions of indices, it is necessary to standardize the data of each index:
Y i j = x i j min ( x i j ) max ( x i j ) min ( x i j ) ,
Y i j = max ( x i j ) x i j max ( x i j ) min ( x i j ) ,
(2) The characteristic proportions of each index are determined:
P i j = Y i j j = 1 m Y i j ,
(3) The information entropy value of the i -th index is solved:
E i = ln m 1 j = 1 m P i j × ln P i j ,
(4) The weights of each index are calculated via the following formula:
w i 2 = 1 E i n i = 1 n E i ,
where w i 2 represents the weight of index x i calculated using the entropy weighting method.

Comprehensive Weighting Based on Game Theory

The comprehensive weighting method based on game theory takes the Nash equilibrium as the coordination objective and aims to minimize the sum of the deviations between the combination weights and the basic weights; this makes the evaluation results more authentic and accurate [38,39,40].
(1) Build a basic weight vector set ω k :
If G weight calculation methods are combined to assign weights to n evaluation indices in the evaluation index system based on game theory, the corresponding weight vectors can be obtained as ω k = { ω k 1 , ω k 2 , ω k n } ( k = 1 , 2 , , G ) , and, furthermore, any linear combination of n weight vectors can be obtained:
W = k = 1 G α k ω k T ( α k > 0 , k = 1 , 2 , , G ) ,
where α k is a weight coefficient.
(2) Build an optimized linear combination:
By optimizing the weight coefficients α k , the deviation between ω and ω k can be reduced:
min k = 1 G α k ω k T ω i T 2 ,
On the basis of the differential properties of the matrices, the first-order derivative conditions of the above optimization equation can be obtained:
k = 1 G α k ω i ω k T = ω i ω k T ,
The linear equation system corresponding to the above equation is as follows:
ω 1 ω 1 T ω 1 ω 2 T ω 1 ω G T ω 2 ω 1 T ω 2 ω 2 T ω 2 ω G T ω G ω 1 T ω G ω 2 T ω G ω G T α 1 α 2 α G = ω 1 ω 1 T ω 2 ω 1 T ω G ω 1 T ,
The optimal linear combination ( α 1 , α 2 , , α G ) obtained from the above equation is normalized to yield:
α = α k k = 1 G α k ,
(3) Obtain the final combined weight value:
ω = k = 1 G α ω k T , k = 1 , 2 , , G ,

3.1.3. TOPSIS Evaluation Method

The TOPSIS method, which is based on the distance between superior and inferior solutions, is a common comprehensive evaluation method. The basic principle is to find the best and worst solutions among limited options and then calculate the distances between each evaluation object and the best and worst solutions separately to obtain the relative closeness between each evaluation object and the optimal solution, which serves as the basis for evaluating the quality of the indices. This study used the TOPSIS method to evaluate the comprehensive development level of the WEF system and its subsystems in the Shandong Yellow River Irrigation Area. On the basis of the weights determined by the comprehensive game-theoretic weighting method, the TOPSIS method was used to rank the evaluation objects in terms of their strengths and weaknesses. The main calculation steps of this ranking method are as follows:
Assume that there are n evaluation objects and m standardized matrices for the evaluation indices:
Z = z 11 z 12 z 1 m z 21 z 22 z 2 m z n 1 z n 2 z n m ,
(1) Define the best and worst solutions for each index:
Z + = ( z 1 + , z 2 + , , z m + ) ,   z j + = max ( z i j ) ,
Z = ( z 1 , z 2 , , z m ) ,   z j = min ( z i j ) ,
(2) Calculate the Euclidean distance from each evaluation object to the best and worst solutions as follows:
D i + = i = 1 n ω j z j + ω j z i j 2 ,
D i = j = 1 m ω j z j ω j z i j 2 ,
(3) Calculate the closeness of each evaluation to the optimal solution:
I i = D i D i + + D i ,
where I i refers to the comprehensive evaluation index, which has a value range of [0, 1]. If the value is closer to 1, the result of the calculation is better, which here indicates a higher comprehensive development level of the WEF system or a subsystem.

3.2. Coupling Coordination Degree Model

System coupling, which means that two or more systems interact and influence each other, is a crucial concept in understanding complex systems. In this context, the coupling coordination degree model is adopted because it can comprehensively and synthetically consider the interaction relationship among the three systems of water resources, energy, and food. Moreover, it can clearly reflect the synergy of various elements within the system at different development stages, thus providing a significant basis for regional sustainable development planning. To explore the coupling coordination relationship between WEF systems, this work refers to existing studies [41,42,43,44], which have made significant contributions in analyzing the coupling relationship of multiple systems. Then, a coupling coordination degree model is established as follows:
(1) Calculate the coupling degree. The coupling degree refers to the degree of interaction and influence among various systems, and the formula is as follows:
C = 3 I ( w ) I ( e ) I ( f ) 3 I ( w ) + I ( e ) + I ( f ) ,
In the above equation, I ( w ) , I ( e ) , and I ( f ) refer to the comprehensive evaluation indices of the water resource system, energy system, and food system, respectively. C is the coupling degree, where 0 C 1 . The larger the value is, the greater the degree of correlation and interaction between the subsystems.
(2) Calculate the coupling coordination degree. This value reflects the degree of coupling coordination among various subsystems, indicating the quality of coordination. The relevant formulas are as follows:
T = α I ( w ) + β I ( e ) + γ I ( f ) ,
D = C × T ,
In the above equation, D is the coupling coordination degree; T is the comprehensive evaluation index of the three subsystems; and α , β and γ are the weights of the water resource subsystem, energy subsystem and food subsystem, respectively. This study assumed that the impacts of the three subsystems on the development of irrigation areas were equally important, so α = β = γ = 1 / 3 was set. Referring to existing research [45,46,47], the specific level classification criteria for coupling coordination degrees are shown in Table 3.

3.3. Geographically Weighted Regression Model

The geographically weighted regression (GWR) model, possessing an extraordinary ability in spatial heterogeneity analysis, can efficiently capture the spatial variation characteristics of the WEF system’s performance in the study area, which are triggered by differences in natural conditions, economic development levels, and social factors. Simultaneously, it can thoroughly analyze the spatial disparities in the impacts of different factors on the WEF system, thereby providing precise information for formulating region-specific development strategies. Moreover, the GWR model incorporates the spatial and geographical location information of the data into the regression model. In contrast to the ordinary least squares (OLS) model, the GWR model provides more accurate local analysis results for the regression coefficients of each spatial unit and is better at explaining the influence of local areas in practical problems [48]. Therefore, this study adopts the GWR model to analyze the spatial heterogeneity of the driving factors of the WEF system.
In this study, the GWR model can be expressed as:
y i = β 0 ( u i , v i ) + k = 1 p β k ( u i , v i ) x k i + ε i   ( i = 1 , 2 , , n ) ,
where ( u i , v i ) represents the coordinate of the i -th basic research unit; β k ( u i , v i ) is the partial regression coefficient of the k -th key driving factor in the i -th basic research unit and is also a function of the geographic location of the sample point; y i is the coupling coordination degree of the WEF system in the i -th subregion of the study area; x k i represents the k -th key driving factor of the coupling coordination degree of the WEF system in the i -th region; ε i is a random error term; and p represents the number of explanatory variables.
According to the First Law of Geography, the observed values are weighted. When the geographic location i changes, the assignment of the observation points also changes. The formula is as follows:
β ( u i , v i ) = X T W ( u i , v i ) X 1 X T W ( u i , v i ) Y ,
where
X = x 11 x 12 x 1 z x 21 x 22 x 2 z x n 1 x n 2 x n z ,   Y = y 1 y 2 y 3 y n ,
W u i , v i = W i = w i 1 0 0 0 w i 2 0 0 0 w i n ,
β = β 0 ( u 1 , ν 1 ) β 1 ( u 1 , ν 1 ) β z ( u 1 , ν 1 ) β 0 ( u 2 , ν 2 ) β 1 ( u 2 , ν 2 ) β z ( u 2 , ν 2 ) β 0 ( u n , ν n ) β 1 ( u n , ν n ) β z ( u n , ν n ) ,
where β is the estimator; n denotes the number of basic spatial units; and w i n is the weight of the n -th basic unit in geographic location i .
In the GWR model, using the Gaussian function as the spatial weight function yields better performance than using other functions. The Gaussian function is expressed as:
w i j = exp ( 0.5 ( d i j / b ) 2 ) ,
where d i j represents the geographic distance between the basic research units i and j ; and b is the bandwidth, which is an important parameter of the spatial weight function. The larger the bandwidth is, the smaller the magnitude of the decrease in the weight as the spatial distance increases.
In this study, the goodness of fit of the GWR model is measured at different bandwidths via the Akaike information criterion (AIC). The fitting effect of a model with a smaller A I C value is better. If the A I C difference between two models is >3, it indicates that there is a significant difference between the two models, and the model with a smaller A I C value has a better fit. Assuming that the random error terms of the regression model follow an independent normal distribution, the A I C expression of the regression model is as follows:
A I C = n ln ( R S S ) + 2 q ,
where q represents the number of unknown parameters and where R S S represents the residual sum of squares.

4. Result Analysis

4.1. Comprehensive Evaluation Index Analysis

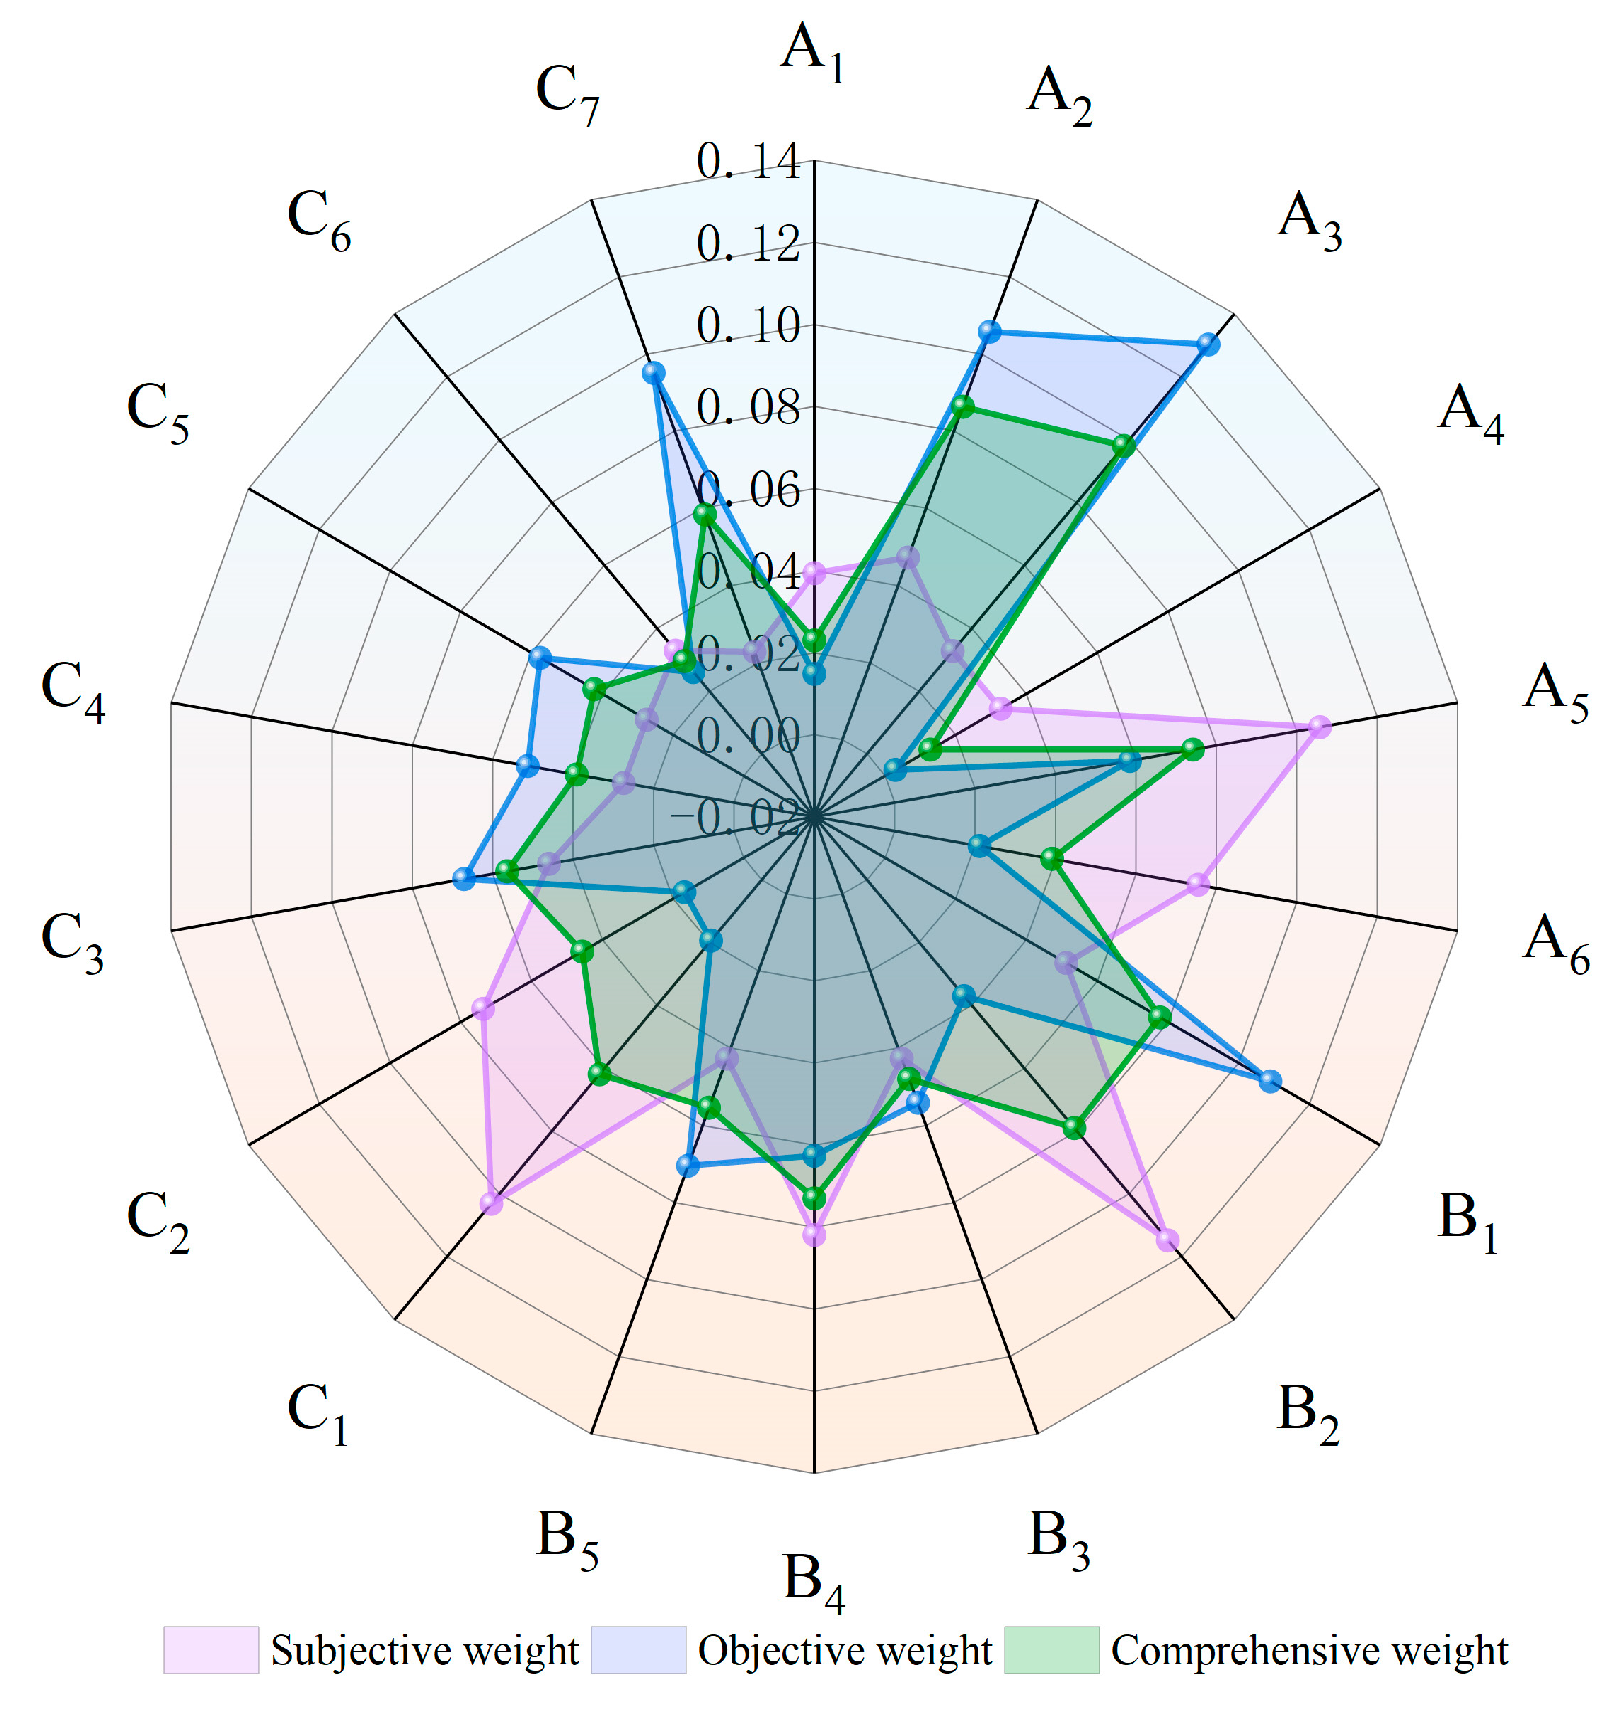
4.1.1. Index Weight Results

On the basis of the methodology described in Section 3.1.2 of this article, the G1 method (sequential relationship analysis method) and entropy weight method were used to subjectively and objectively assign weights to 18 evaluation indices of the water resource system, energy subsystem, and food subsystem. According to Equations (1)–(4) and Equations (5)–(10), the subjective weight and objective weight of the WEF system can be obtained, respectively. A comprehensive weighting method based on game theory was subsequently applied to combine the subjective and objective weights obtained above. This method balances the advantages and disadvantages of different weighting methods to ensure that the combined weights are obtained scientifically and rationally. According to Equations (11)–(16), the comprehensive weight of the WEF system can be obtained. The final obtained combination weights are shown in Figure 3.

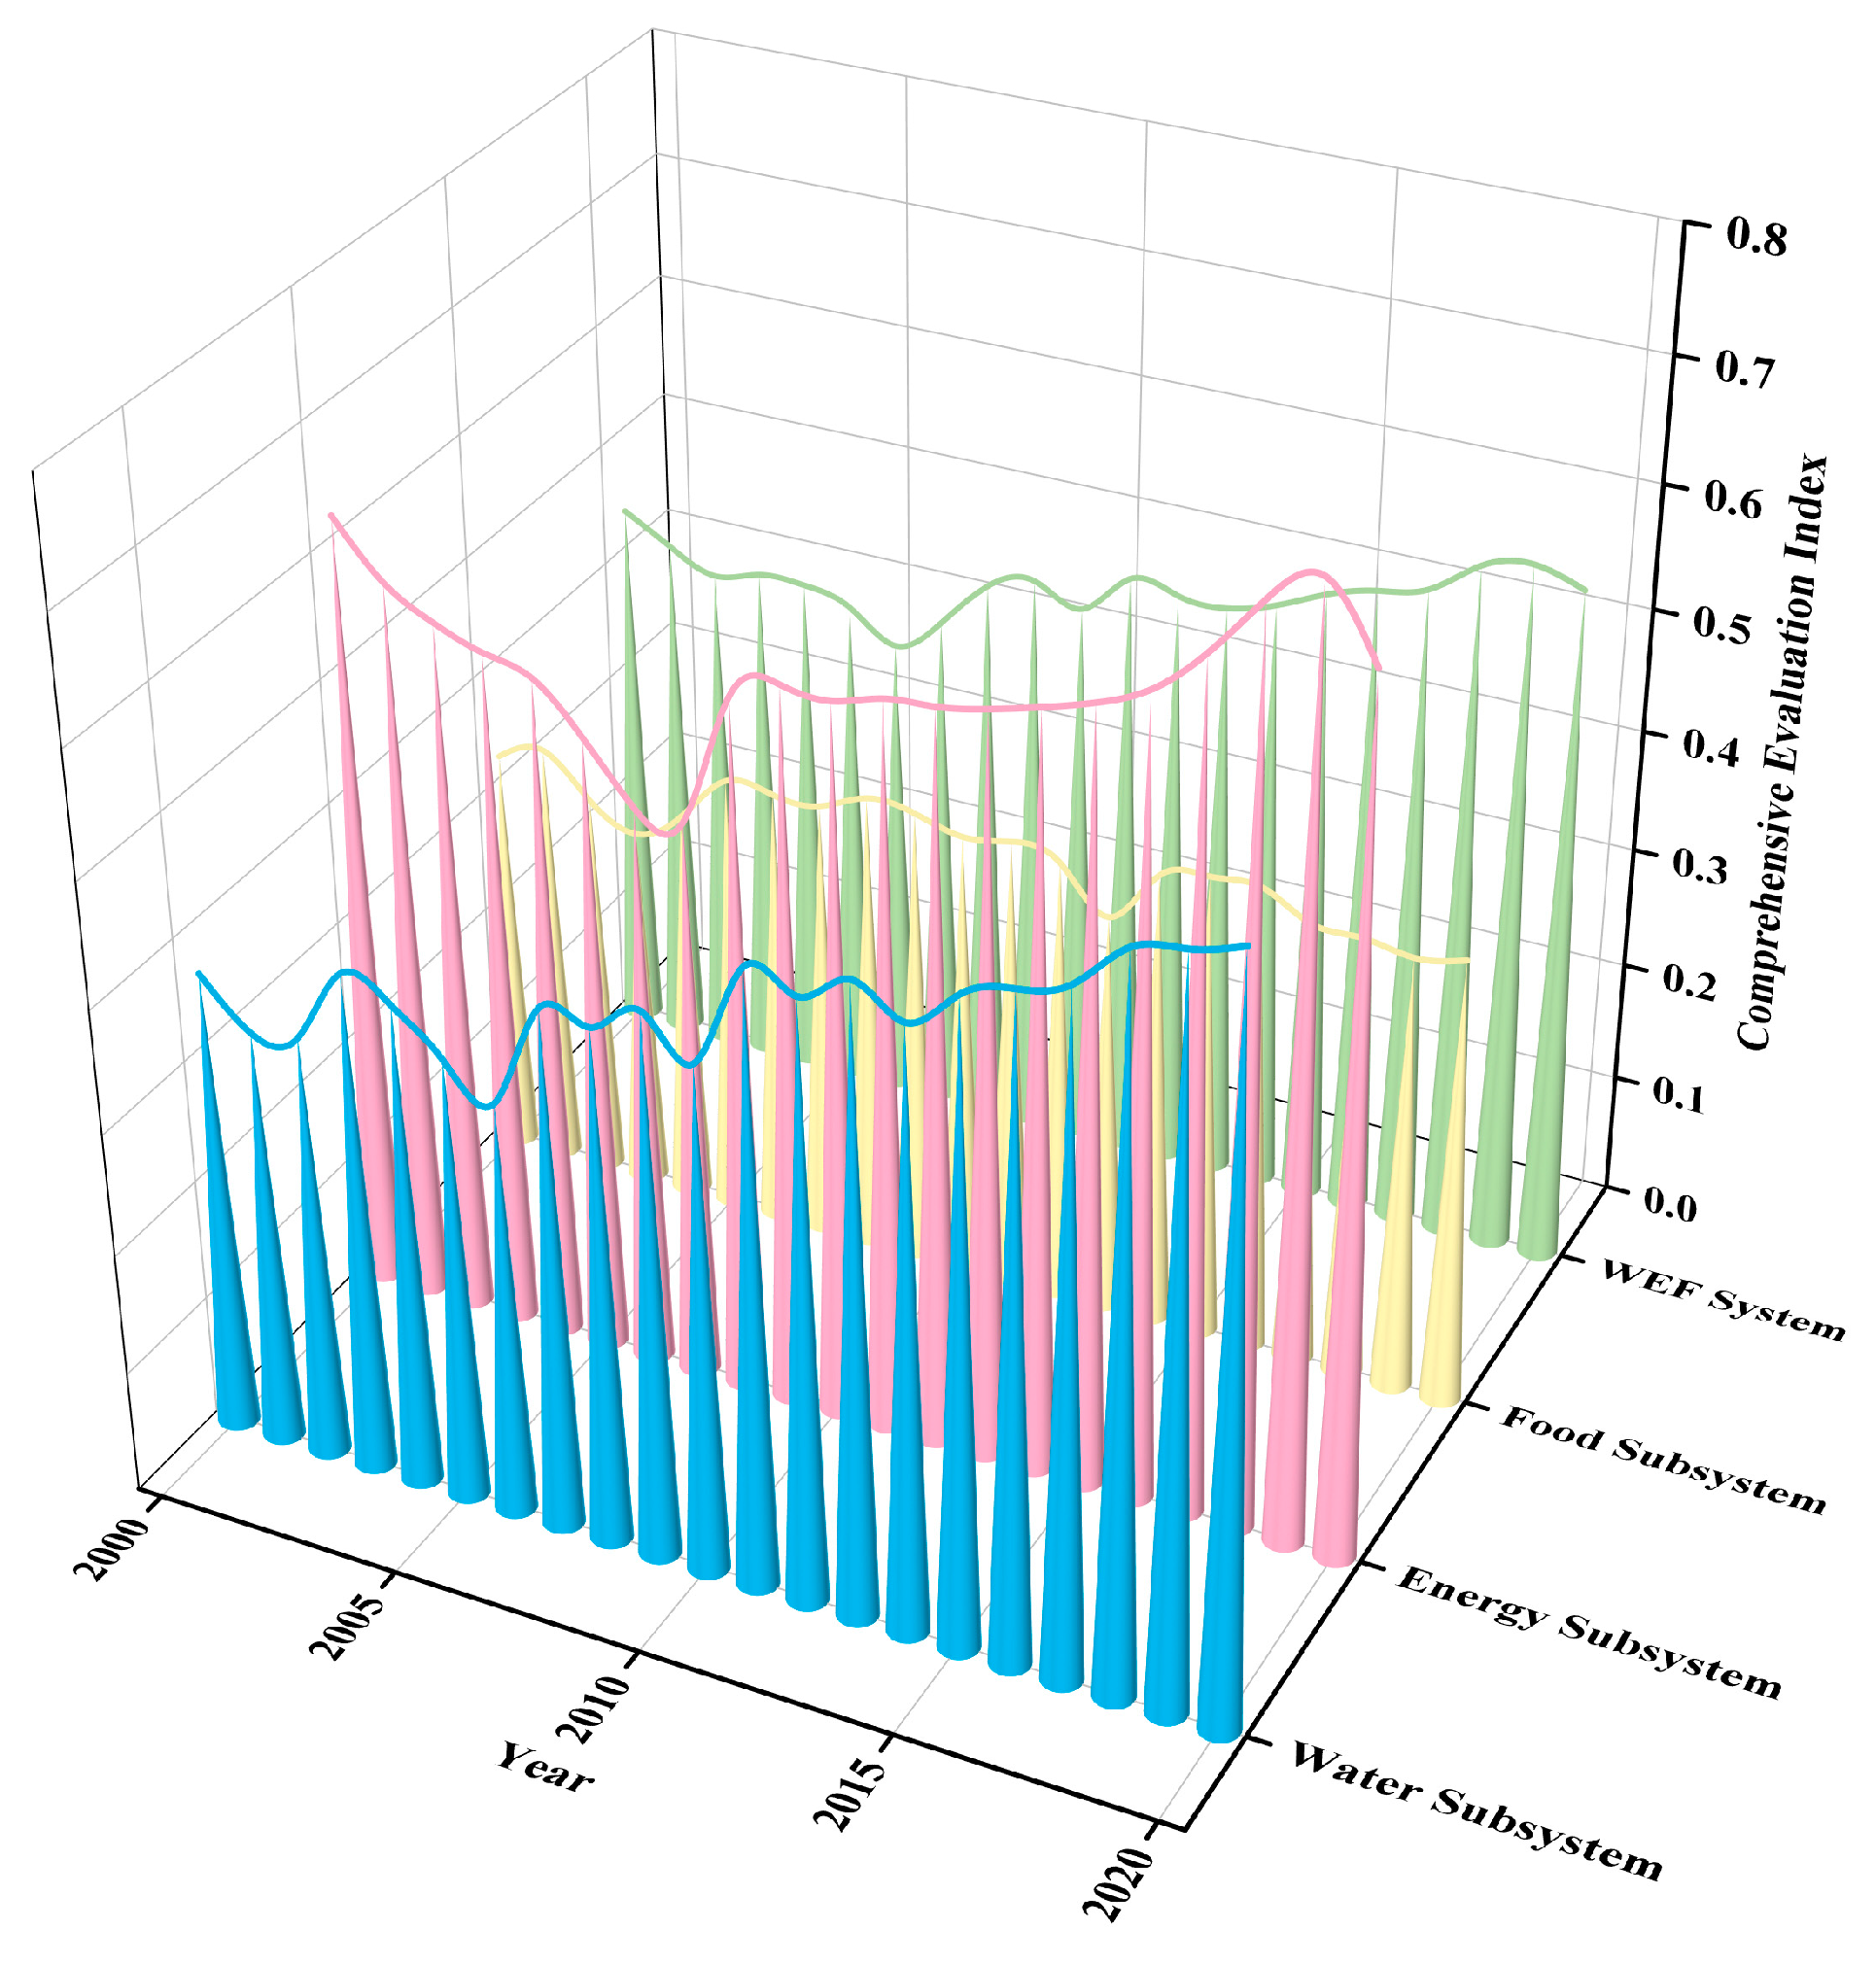
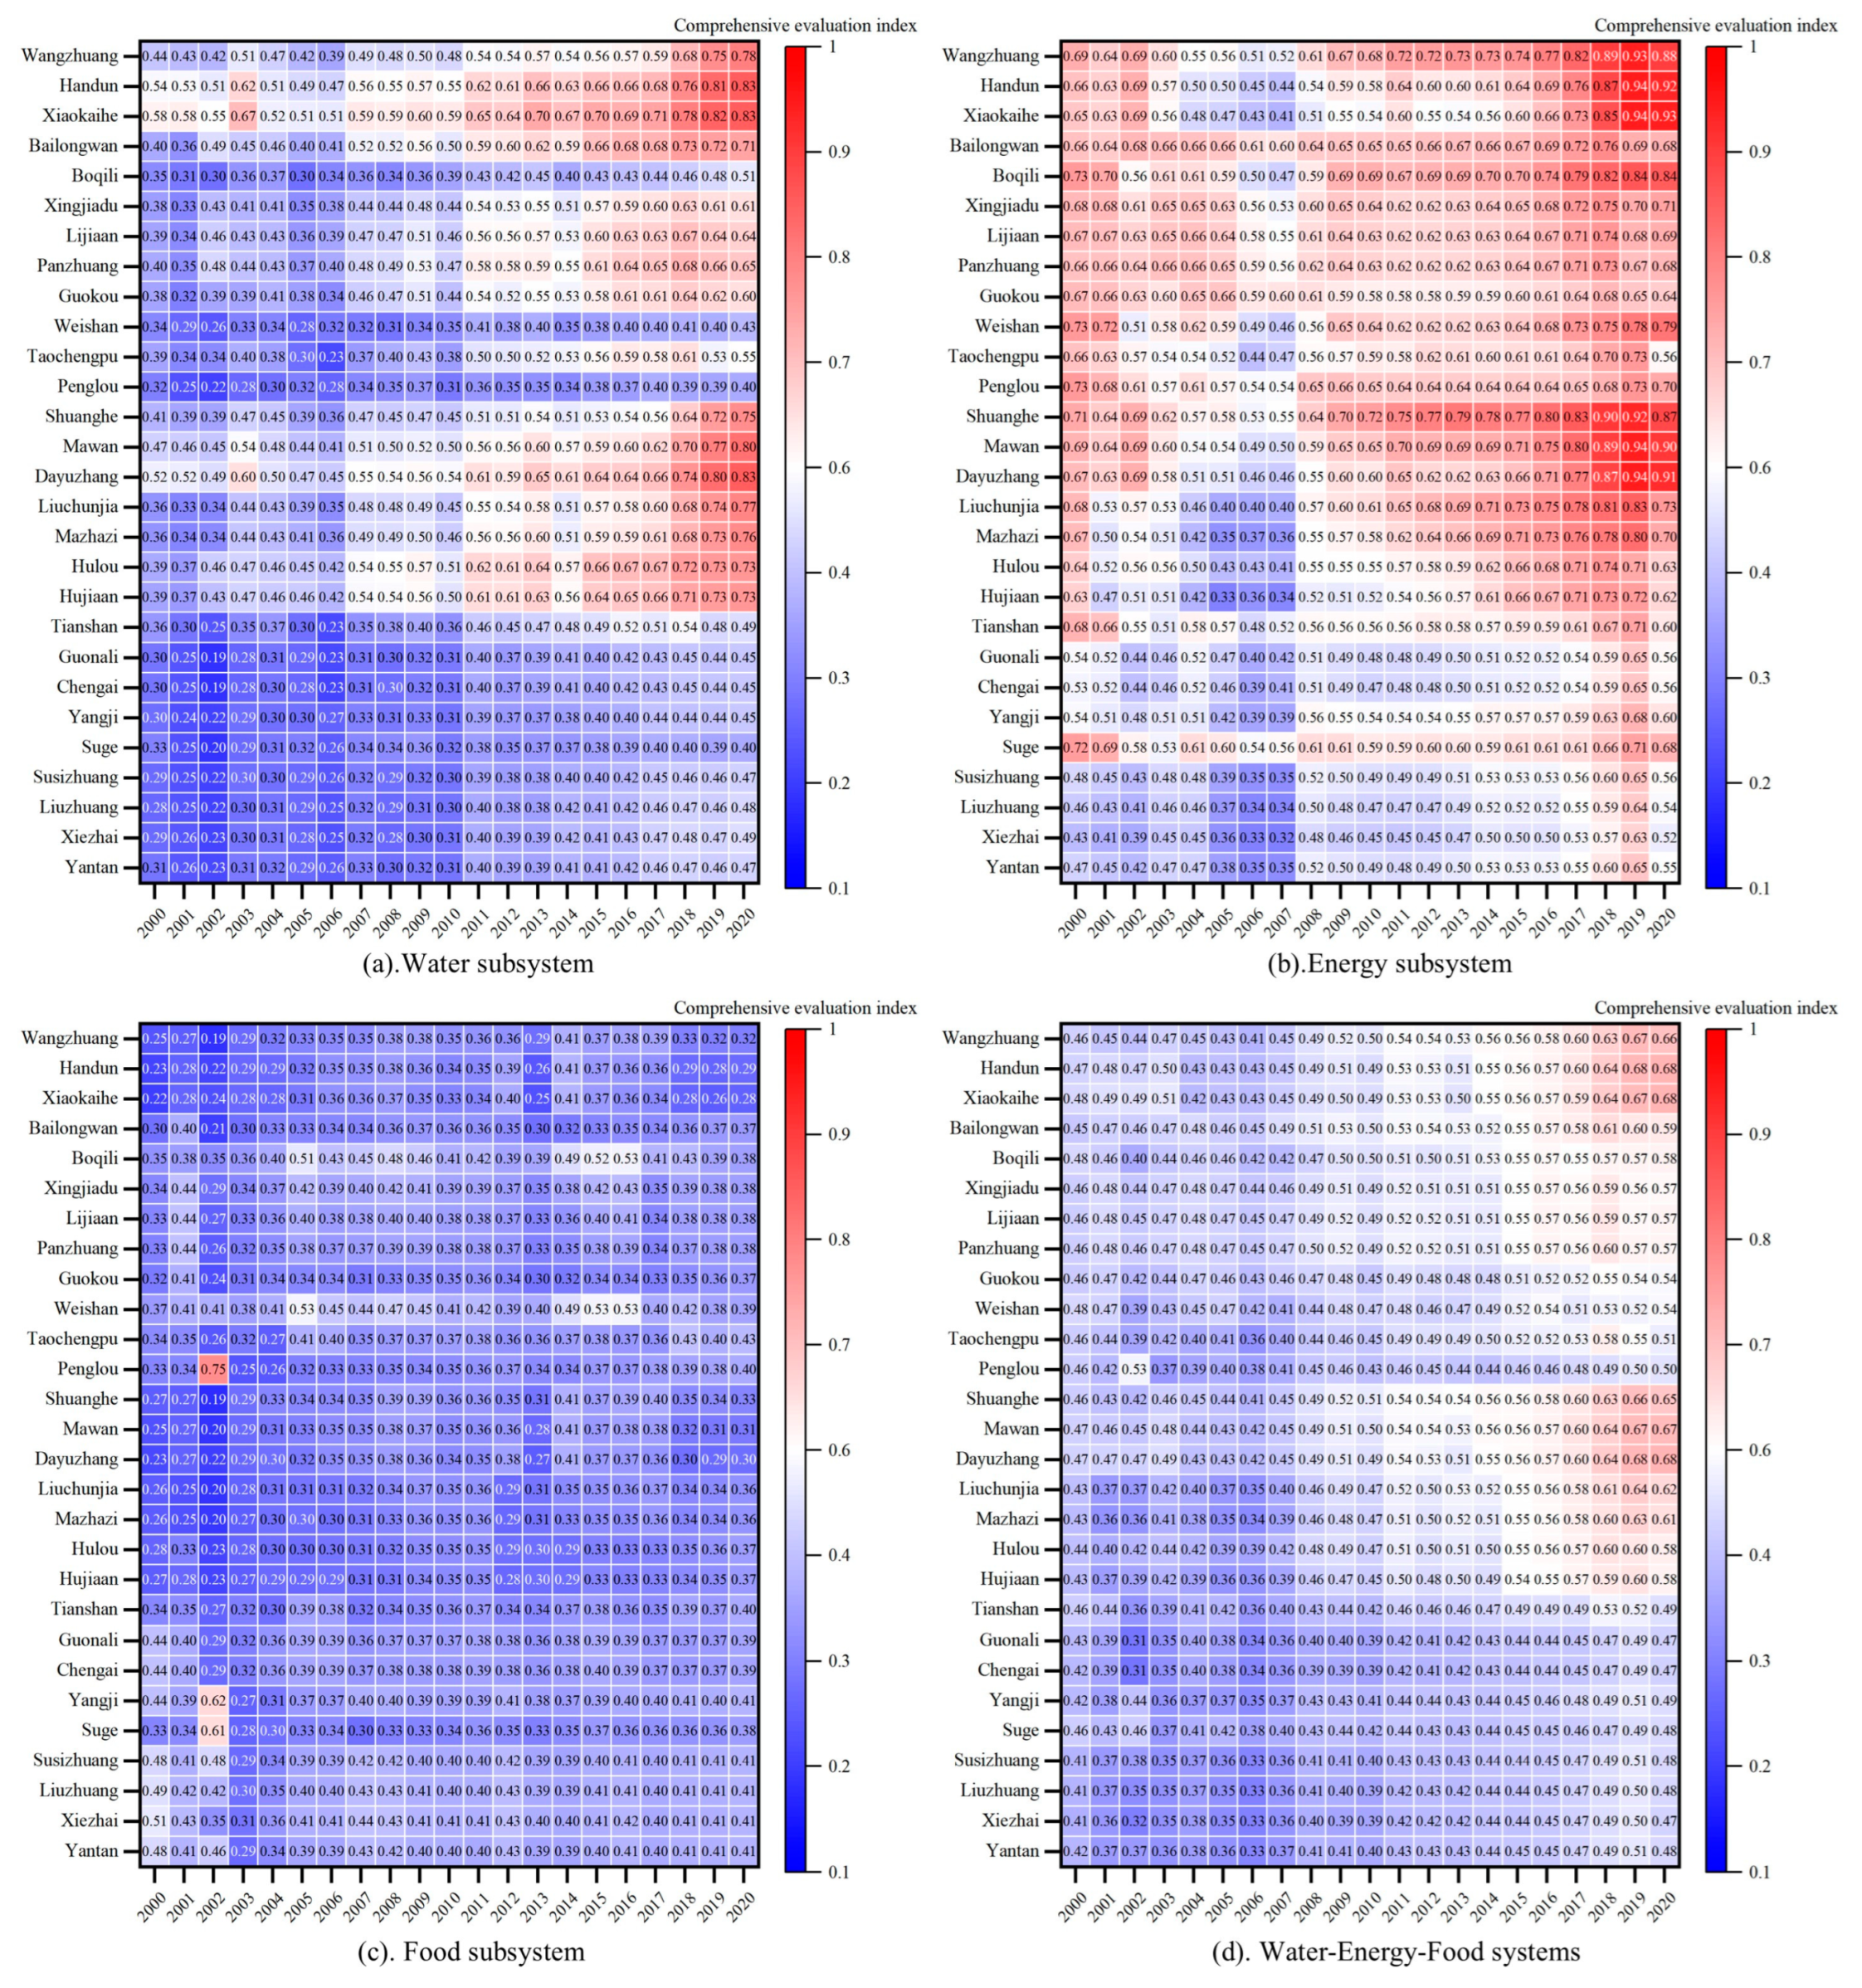
4.1.2. Analysis of the Comprehensive Development Level

According to Equations (17)–(22), the comprehensive development level of the WEF system in the study area can be calculated. Specific results can be seen in Figure 4 and Figure 5. The comprehensive development levels of the water resource subsystem, energy subsystem, grain subsystem, and WEF system in the Yellow River irrigation area of Shandong Province tended to increase to varying degrees and generally developed in a positive direction. Over time, the comprehensive development indices of the water resource subsystem, energy subsystem, and WEF system all exhibited significant and rapidly increasing indices. However, overall, the development levels of the water resource and grain subsystems lagged slightly behind that of the energy subsystem, especially the comprehensive development index of the grain subsystems, which grew relatively slowly. This inhibited the overall development rate of the WEF system to some extent.
Note: On the vertical axis, the areas from the Wangzhuang Irrigation Area to the Penglou Irrigation Area are the left-bank irrigation areas from the lower reaches of the Yellow River to the upper reaches in sequence; the areas from the Shuanghe Irrigation Area to the Yantan Irrigation Area are the right-bank irrigation areas from the lower reaches of the Yellow River to the upper reaches.

4.2. Analysis of Changes in the Coupling Coordination Degree

In this study, the comprehensive evaluation indexes of the three subsystems in the Yellow River diversion irrigation areas of Shandong Province obtained in Section 4.1 were combined with the coupling coordination degree model. Using Equations (17)–(25), the coupling coordination degree of the WEF system in the Yellow River diversion irrigation areas of Shandong Province was calculated. The calculated coupling coordination degrees of each irrigation area from 2000 to 2020 were obtained, and according to the classification standards in Table 3, these degrees were sorted into groups.
According to Figure 6 and the corresponding calculation results, from 2000 to 2020, the coupling coordination degree of the WEF system in the Yellow River Irrigation Area of Shandong Province fluctuated between 0.62 and 0.738, with an average value of 0.678, indicating moderate coordinated development; there was an overall upward trend. Regarding the spatial distribution, the coupling coordination degree of the irrigation areas on both sides of the lower reaches of the Yellow River in Shandong Province was greater than that of the irrigation areas on both sides of the upper reaches, which was consistent with the spatial distribution of the comprehensive evaluation index of the WEF system of the Yellow River diversion irrigation areas in Shandong Province. During the research period, the number of irrigation areas with primary coordination development continued to decrease, whereas the number of irrigation areas with intermediate coordination development continued to increase. In 2000, the coupling coordination degree of all 28 irrigation areas was of the primary coordination development type. However, by 2003, the coordination types of the nine irrigation areas on both upstream sides (the Yantan, Xiezhai, Liuzhuang, Susizhuang, Suge, Yangji, Chengai, Guonali, and Penglou irrigation areas) had decreased to barely coordinated development, whereas the remaining irrigation areas retained primary coordinated development. In 2008, the Bailongwan irrigation district was upgraded to intermediate coordinated development, whereas the other irrigation districts retained primary coordinated development. By 2013, the number of intermediate coordinated development-type irrigation areas on both sides of the downstream area had increased to nine (the Bailongwan, Bojili, Xingjiadu, Lijiaan, Panzhuang, Wangzhuang, Shuanghe, Mazhazi, and Liuchunjia irrigation areas), whereas the remaining irrigation areas retained primary coordinated development. By 2018, except for the nine irrigation areas on both upstream sides (the Yantan, Xiezhai, Liuzhuang, Susizhuang, Suge, Yangji, Chengai, Guonali, and Penglou irrigation areas), which were of a primary coordination development type, all irrigation areas were upgraded to an intermediate coordination development type. In 2019, except for the four irrigation areas of Suge, Chengai, Guo Nali, and Penglou, all irrigation areas exhibited intermediate coordinated development. The coordination type of the WEF system in the irrigation area in 2020 was the same as that in 2018. In summary, the coupling coordination degree of the nine irrigation areas on both upstream sides (the Yantan, Xiezhai, Liuzhuang, Susizhuang, Suge, Yangji, Chengai, Guonali and Penglou irrigation areas) fluctuated relatively strongly during the research period, but overall, it maintained an increasing trend. The coupling coordination degree of the other irrigation areas fluctuated less, and the development trend significantly improved.

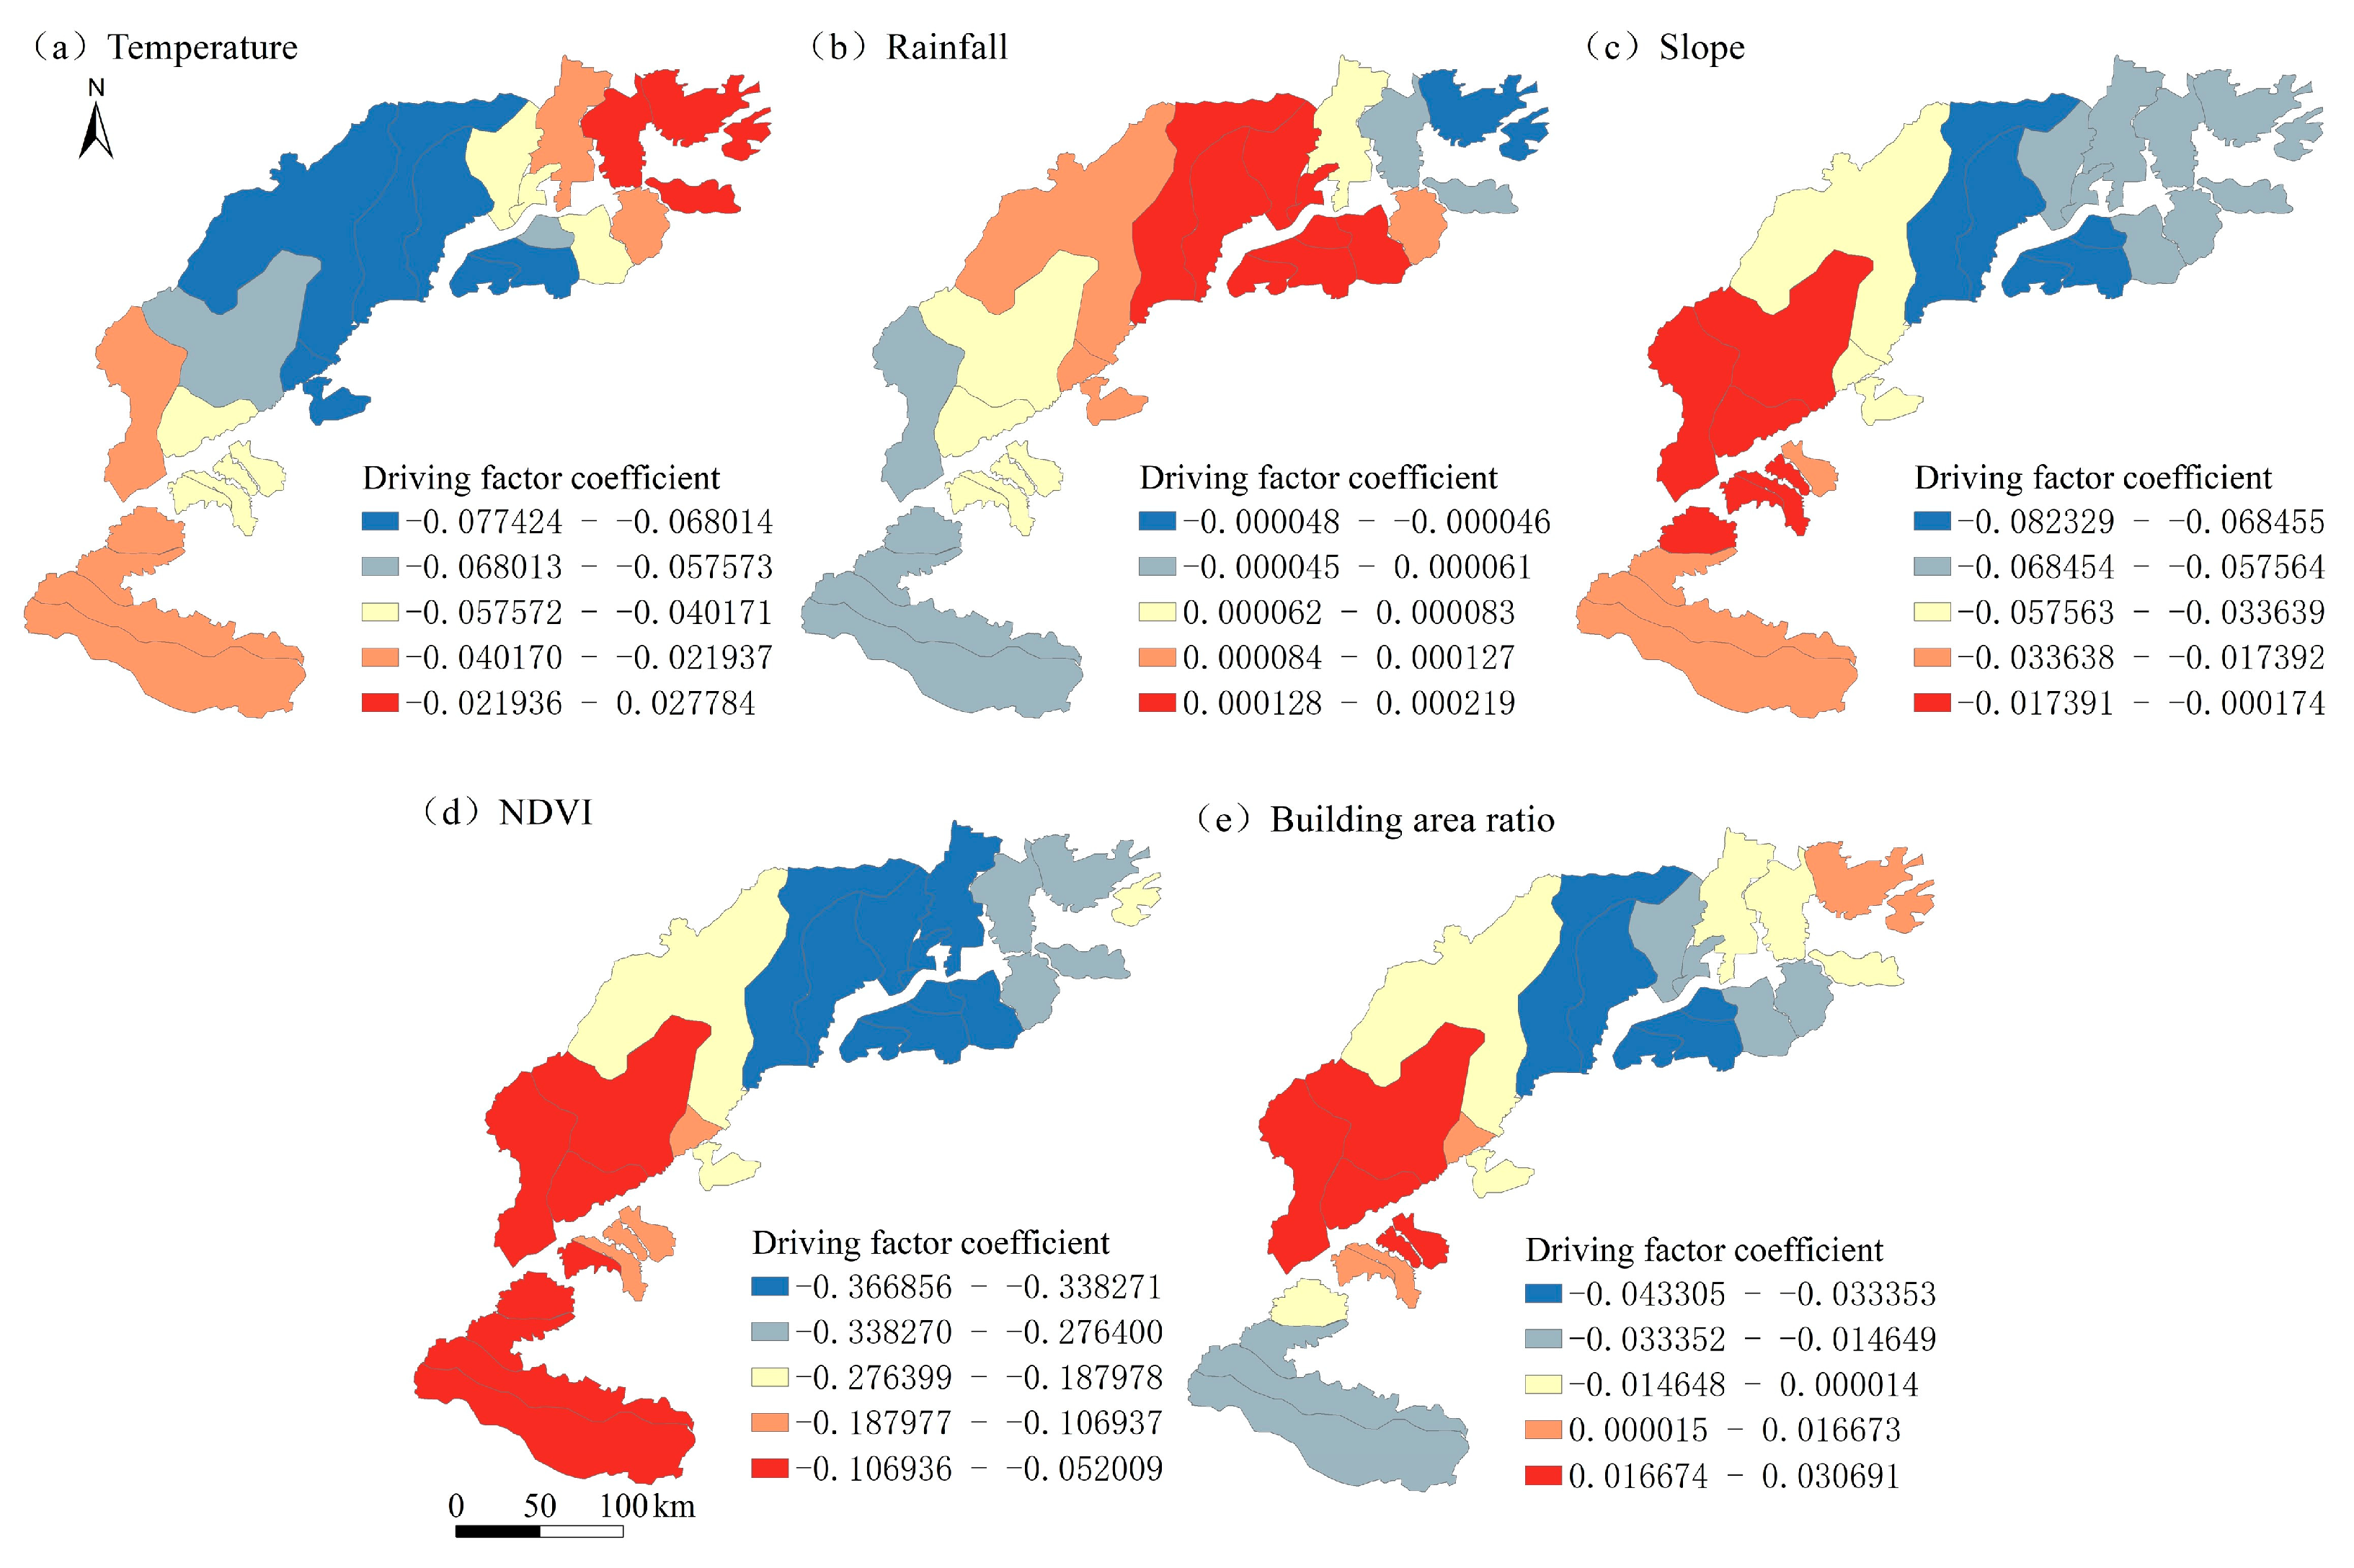
4.3. Analysis of the Driving Factors of the Coupling Coordination Degree

In this work, when choosing the driving factors, 11 factors that posed potential risks to the WEF system proposed by the FAO in 2014 were considered, including population growth, urbanization rate, dietary diversification, cultural and social beliefs, climate change, governance, sectoral decision-making, international trade, industrial development, agricultural upgrading and technological innovation. Accounting for the distinctive geographical location and natural conditions of the Yellow River Diversion Irrigation Area in Shandong Province, by conducting a comprehensive review of multiple relevant materials and ensuring the representativeness of the selected driving factors and data accessibility, this paper selected five natural and social factors, namely, temperature, rainfall, slope, the normalized difference vegetation index (NDVI), and the building area ratio; their impact on the coupling coordination of the WEF system in the Yellow River Diversion Irrigation Area in Shandong Province was then explored. The specific details are shown in Table 4.
Since the GWR model examines the spatial heterogeneity of the driving factors, it is necessary to explore the spatial relationship of the coupling coordination degree of the WEF system before applying the GWR model. The spatial autocorrelation test was conducted via GeoDa (1.22.0.4) software, and the coupling coordination degree of the WEF system in the Yellow River Diversion Irrigation Area of Shandong Province showed clear spatial agglomeration. Considering the deficiencies in the fitting results of the OLS model and the significant spatial autocorrelation relationship of the coupling coordination degree of the WEF system in the Yellow River Diversion Irrigation Area of Shandong Province, the GWR model was employed to explore the spatial heterogeneity of the driving factors.
The comprehensive comparison results in Table 5 indicate that the AICc value of the GWR model is smaller than that of the OLS model, and the difference is 3.9794. When the numerical gap between AICc values is greater than 3, the fitting result of the model with the smaller value is considered better. Moreover, a comparison of the R2 and adjusted R2 values of the two models reveals that the results of the GWR model are superior, which again proves that the GWR model should be used to analyze the driving factors of the coupling coordination degree of the WEF system in the Yellow River Diversion Irrigation Area of Shandong Province.
The parameters of the GWR model were determined according to Equations (26)–(32), and the spatial heterogeneity of the driving factors was visualized via ArcGIS (10.8) analysis software. The final analysis results are shown in Figure 7, which represent the spatial heterogeneity effects of temperature, rainfall, slope, NDVI, and building area ratio on the coupling coordination degree of the WEF system in the Yellow River Diversion Irrigation Area of Shandong Province.
Figure 7a shows that the coefficient of the influence factor of temperature ranges from −0.077424 to 0.027784. In the vast majority of the irrigation districts in the study area, it is negative, indicating a negative correlation with the coupling coordination degree of the WEF system as a whole. Spatially, this coefficient shows a gradually decreasing trend from the southwest and northeast areas to the middle. Only the temperature influence factor coefficients of the Wangzhuang and Shuanghe irrigation districts in the northeast have a positive effect on the coupling coordination degree of the WEF system. The absolute value of the temperature influence factor coefficient of the irrigation district in the middle of the study area is relatively high, suggesting that the temperature has a stronger influence on the coupling coordination degree of the WEF system; that is, for each unit increase in temperature, the decrease in the coupling coordination degree of the WEF system is greater than those in the southwest and northeast irrigation districts.
Figure 7b shows that the coefficient of the driving factor of rainfall ranges from −0.000048 to 0.000219. In the vast majority of the irrigation areas in the study area, this coefficient is positive and has a positive correlation with the coupling coordination degree of the WEF system. That is, when other factors remain unchanged, the greater the rainfall, the higher the coupling coordination degree of the WEF. Only the Wangzhuang and Shuanghe irrigation areas in the northeast show a negative effect on the degree of coupling coordination of the WEF system. The coefficient of the driving factor of rainfall gradually increases from the southwest to the northeast.
Figure 7c shows that the coefficient of the driving factor of the slope ranges from −0.082329 to −0.000174. In all irrigation areas in the study area, this coefficient is negative, indicating a negative correlation with the coupling coordination degree of the WEF system globally. Spatially, this coefficient shows a gradually decreasing trend from the southwest to the northeast. The absolute value of this coefficient in the irrigation area near the estuary of the study area is relatively high, indicating that the influence of slope on the coupling coordination degree of the WEF system is relatively strong. That is, for each additional unit of slope increase, the decrease in the coupling coordination degree of the WEF system will be greater than that in the irrigation areas in the southwest and middle regions.
Figure 7d shows that the coefficient of the driving factor of NDVI ranges from −0.366856 to −0.052009. In all irrigation areas in the study area, this coefficient is negative, indicating a negative correlation with the coupling coordination degree of the WEF system globally. Spatially, it presents a gradually decreasing trend from the southwest to the northeast. The absolute value in the northeastern irrigation area of the study area is relatively high, suggesting that the influence of the NDVI on the coupling coordination degree of the WEF system is relatively strong. That is, for each additional unit of increase in the NDVI, the decrease in the coupling coordination degree of the WEF system will be greater than that in the central and southwestern irrigation areas.
Figure 7e shows that the coefficient of the driving factor of the building area ratio ranges from −0.043305 to 0.030691. In the vast majority of the irrigation areas in the study area, this coefficient is negative and has a negative correlation with the coupling coordination degree of the WEF system. The absolute value in the central irrigation areas is relatively high, indicating that in most of the central irrigation areas, a change in the building area ratio will cause a greater decline in the coupling degree of the WEF system. Only in a few irrigation areas, such as Penglou, Taochengpu, Guonali, Wangzhuang, and Shuanghe in the northeast and southwest, does the building area ratio have a positive effect on the coupling coordination degree of the WEF system.

5. Discussion

On the basis of the research results outlined in Section 4, it can be concluded that from 2000 to 2020, the comprehensive development level and coupling coordination degree of the WEF system in the 28 irrigation areas showed a stable upward trend. It is worth noting that both showed significant characteristics in which the downstream areas were superior to the upstream areas in space. In terms of the correlation between this pattern and the economic development status of the urban areas where the irrigation areas are located, the research results of this study are highly consistent with existing research results. Specifically, the lower reaches of the Shandong section of the Yellow River generally presented a relatively high level of economic development. The overall average economic growth indices of Dongying and Jinan were high, ranking first and second, respectively; Zibo and Binzhou followed closely behind. The economic development level in the upstream region was relatively low, and the overall average economic growth indices of Liaocheng and Heze cities ranked lowest, eighth and ninth, respectively [49]. In general, this result profoundly reveals that as important resources in human society, water, energy, and food have an inseparable relationship between their coupled and coordinated development and high-quality economic development as well as sustainable social development [47,50]. Specifically, the rational allocation and efficient utilization of water resources, energy resources, and food resources can not only promote the high-quality development of social economy but can also provide a solid material foundation for the sustainable development of society [51]. Therefore, in the process of promoting China’s economic and social development in the future, more attention should be paid to the coupled and coordinated development of resources to achieve the harmonious coexistence of economy, society, and environment [52].
The overall correlation between the temperature and the degree of coupling coordination of the WEF system is negative. The research findings of this paper closely align with existing research outcomes [53]. Temperature has a negative influence on water resources and agricultural output in the Yellow River Basin. The absolute value of the central irrigation area is relatively high. This is because the cultivated land area of the central irrigation area itself is relatively large. An increase in temperature will increase evaporation in the irrigation area, resulting in an increase in irrigation water demand. This may make already scarce water resources even scarcer, affecting the normal irrigation of crops and thereby threatening food production. Moreover, to meet the extraction, transportation and distribution requirements for irrigation water in irrigation areas, more energy is needed to drive equipment such as water pumps. Therefore, the temperature has a stronger effect on the coupling coordination degree of the WEF system in the central irrigation areas. Overall, rainfall has a positive correlation with the coupling coordination degree of the WEF system. The research results of this paper are consistent with existing results [54]. As rainfall gradually increases from inland areas to coastal areas, appropriate rainfall can increase surface runoff and groundwater resources in irrigation areas, provide more water for irrigation, promote the growth of crops, and improve the yield and quality of grain. Therefore, the positive impact of rainfall changes on the coupling coordination degree of the WEF is relatively significant. The slope has a globally negative correlation with the coupling coordination degree of the WEF system. The influence of slope on the coupling coordination degree of the WEF system in the northeastern irrigation area is much greater than that in the central and southwestern irrigation areas. This might be because the irrigation areas near the estuary are ecologically sensitive and the ecosystem is relatively fragile [55]. Minor changes in slope may trigger a series of ecological problems, such as wetland degradation and biodiversity reduction, which will indirectly affect agricultural production and water resource utilization. In addition, the soil in the irrigation areas near this area is mostly newly formed sedimentary soil, with fine particles, a loose structure and weak erosion resistance. An increase in slope will accelerate the soil erosion rate, and fertility will rapidly decrease, strongly affecting the growth of crops and leading to a significant decrease in the coupling coordination degree of the WEF system. The NDVI has a globally negative correlation with the coupling coordination degree of the WEF system. The influence of the NDVI on the coupling coordination degree of the WEF system in the northeastern irrigation area is much greater than that in the central and southwestern irrigation areas. This is possibly because in the northeastern irrigation area, an increase in the NDVI may mean a reduction in grassland and cultivated land areas and an increase in shrub and forest areas, resulting in a high demand for irrigation water; local water resources cannot meet this demand, leading to insufficient irrigation, a decline in grain production, and a greater impact on the coupling coordination degree of the WEF system [56]. Overall, the building area ratio has a negative correlation with the coupling coordination degree of the WEF system. This implies that when other factors remain unchanged, the larger the building area ratio is, the lower the coupling coordination degree of the WEF system. The influence of slope on the coupling coordination degree of the WEF system in the central irrigation area is much greater than that in the northeastern and southwestern irrigation areas. This might be because the industrial structure in the middle of the irrigation area of the Yellow River in Shandong Province is relatively simple and more sensitive to changes in the building area ratio. When the building area ratio changes, it may directly affect the layout and development of the core industry. In this case, each increase in the building area ratio has a significant effect on the coupling coordination degree of the WEF system.
In recent years, although the coordinated development of the WEF system in the Shandong Yellow River Irrigation Area has been continuously optimized, the comprehensive development of the water resource system and the grain system still lags behind that of the energy subsystem. Moreover, the coordinated development of WEF systems in various irrigation areas has also shown an uneven trend. Given the complex and interdependent relationship within the WEF system, the development status of any subsystem, whether it is progress or lagging behind, will have a profound impact on the coupled and coordinated development of the entire WEF system [57]. Therefore, to achieve the efficient, coordinated, and sustainable development of the WEF system in the Yellow River diversion irrigation areas of Shandong Province, it is necessary to comprehensively consider the internal connections among the three subsystems [58]. In the future development planning of irrigation districts, in order to ensure the sustainable development of the WEF system in this area, it is advisable that the widespread application of agricultural water-saving technologies in irrigation districts be actively and continuously promoted. Efforts should be dedicated to continuously improving the utilization efficiency of irrigation water in irrigation districts and accelerating the construction process of water-saving irrigation districts. Moreover, the planting structure of grain crops in irrigation districts should be continuously adjusted and optimized. The planting area of high-water-consuming crops should be moderately reduced, while the planting scale of high-yield and low-water-consuming grain crops should be increased. In addition, when formulating relevant policies, emphasis should be placed on considering the stability and safety of the energy system. Energy-saving agricultural machinery and equipment should be actively promoted. At the same time, efforts should be made to reduce energy consumption and energy utilization efficiency in agricultural production processes. Additionally, the application intensity of nitrogen fertilizers and pesticides should be reduced to reduce agricultural non-point source pollution. Communication and cooperation among water resource, energy and food management departments should be strengthened, and a sound cross-departmental consultation mechanism should be established. Finally, through the comprehensive use of various management means and technical strategies, involved parties should strive to consolidate and promote the coordinated, efficient and sustainable development of the WEF system in the Yellow River diversion irrigation districts in Shandong.

6. Conclusions

The coupling coordination degree of the WEF system is mostly concentrated at regional scales such as provinces, river basins, and the whole country. As a semi-artificial and semi-natural agricultural production system, the interaction relationships among water, energy, and food in irrigation districts are more complex and closer. Based on the conceptual framework of the WEF system’s nexus relationship, this study constructs an evaluation index system suitable for evaluating the coupling coordination level of the water–energy–food system in agricultural production in irrigation districts. Taking the Yellow River diversion irrigation districts in Shandong Province as an example, this study analyzes the coupling coordination degree and driving factors of the water–energy–food (WEF) system of 28 Yellow River diversion irrigation districts in the study area, reveals the evolution characteristics of the coupling coordination degree of the WEF system in the study area from 2000 to 2020, and explores the driving mechanism of the driving factors of the coupling coordination degree of the WEF system. The main conclusions are as follows:
(1) The comprehensive evaluation index of the WEF system in the Yellow River Irrigation Area of Shandong Province revealed that this area was at a moderate level of development overall and had a slow and stable upward trend during the research period. Specifically, both the energy subsystem and the water resource subsystem have made significant progress in their development, but compared with the energy subsystem, the development levels of the water resource and food subsystems have slightly lagged behind. In particular, the growth trend for the food subsystem was volatile, and the magnitude of change was relatively small, which, to some extent, indicated restricted overall development of the WEF system. In terms of spatial distribution, the irrigation areas on both downstream sides were generally better than the irrigation areas on both upstream sides in terms of the comprehensive development level of the WEF system, and the left-bank irrigation area also presented advantages over the right-bank irrigation area.
(2) The coupling coordination degree of the WEF system in the Yellow River irrigation area of Shandong Province fluctuated between 0.62 and 0.739, with an average value of 0.678, indicating a moderate coordinated development stage. In the long term, the overall development trend was stable and improving, with most irrigation areas achieving intermediate coordinated development. Regarding the spatial distribution, the coupling coordination degree of the WEF system in the 28 Shandong Yellow River Diversion Irrigation Areas showed clear regional characteristics, specifically, that both downstream-bank irrigation areas were superior to both upstream-bank irrigation areas.
(3) The results of the GWR model indicated that the temperature was generally negatively correlated with the coupling coordination degree of the WEF system, and the intensity of this effect increased from the northeast and southwest to the middle. The slope and NDVI were negatively correlated with the coupling coordination degree of the WEF system, and the intensity of this effect increased from the southwest to the northeast. Rainfall was generally positively correlated with the coupling coordination degree of the WEF system but was negatively correlated in a few irrigation areas in the southwest. Overall, the building area ratio was negatively correlated with the coupling coordination degree of the WEF system but was positively correlated with a few irrigation areas in the northeast and southwest.
These findings reveal the complex evolution characteristics of the coupling coordination degree of the WEF system in the Yellow River diversion irrigation areas of Shandong Province and the spatial heterogeneity of its driving factors, providing a scientific basis for the further optimization of irrigation resource allocation and development planning.

Author Contributions

Conceptualization, C.L. and L.L.; methodology, C.L.; software, W.Z.; validation, W.Z. and L.L.; investigation, W.Z.; resources, E.J. and H.Z.; data curation, W.Z.; writing—original draft preparation, W.Z.; writing—review and editing, C.L. and L.L.; supervision, E.J. and H.Z.; funding acquisition, E.J. and H.Z. All authors have read and agreed to the published version of the manuscript.

Funding

This research was funded by the Special Fund for Scientific and Technological Development of Yellow River Institute of Hydraulic Research (HKF-202315), the National Natural Science Foundation of China (U2243601 and 52309019), the Young Elite Scientist Sponsorship Program of China Association for Science and Technology (YESS20200273), Henan Province Science and Technology Research Project (242102520050), the Science and Technology Program of Yellow River Conservancy Commission for Excellent Young Talents (HQK-202311), and the National Social Science Fund of China (20&ZD185).

Institutional Review Board Statement

Not applicable.

Informed Consent Statement

Not applicable.

Data Availability Statement

The data presented in this study are available on request from the corresponding author.

Conflicts of Interest

The authors declare no conflicts of interest.

Abbreviations

WEFwater–energy–food
TOPSIStechnique for order preference by similarity to ideal solution
GWRgeographically weighted regression
OLSordinary least squares
NDVInormalized difference vegetation index
AHPanalytic hierarchy process
G1ordinal relationship analysis
AICAkaike information criterion
FAOFood and Agriculture Organization of the United Nations
PSRpressure–state–response

References

  1. Liu, Y.; Wang, S.; Chen, B. Regional Water–Energy–Food Nexus in China Based on Multiregional Input–Output Analysis. Energy Procedia 2017, 142, 3108–3114. [Google Scholar] [CrossRef]
  2. Bazilian, M.; Rogner, H.; Howells, M.; Hermann, S.; Arent, D.; Gielen, D.; Steduto, P.; Mueller, A.; Komor, P.; Tol, R.S.J.; et al. Considering the Energy, Water and Food Nexus: Towards an Integrated Modelling Approach. Energy Policy 2011, 39, 7896–7906. [Google Scholar] [CrossRef]
  3. Yang, Y.C.E.; Ringler, C.; Brown, C.; Mondal, M.A.H. Modeling the Agricultural Water–Energy–Food Nexus in the Indus River Basin, Pakistan. J. Water Resour. Plan. Manag. 2016, 142, 04016062. [Google Scholar] [CrossRef]
  4. Jiang, Y. China’s Water Scarcity. J. Environ. Manag. 2009, 90, 3185–3196. [Google Scholar] [CrossRef] [PubMed]
  5. Zhang, X.; Vesselinov, V.V. Integrated Modeling Approach for Optimal Management of Water, Energy and Food Security Nexus. Adv. Water Resour. 2017, 101, 1–10. [Google Scholar] [CrossRef]
  6. Li, M.; Fu, Q.; Singh, V.P.; Ji, Y.; Liu, D.; Zhang, C.; Li, T. An Optimal Modelling Approach for Managing Agricultural Water-Energy-Food Nexus under Uncertainty. Sci. Total Environ. 2019, 651, 1416–1434. [Google Scholar] [CrossRef]
  7. Karabulut, A.; Egoh, B.N.; Lanzanova, D.; Grizzetti, B.; Bidoglio, G.; Pagliero, L.; Bouraoui, F.; Aloe, A.; Reynaud, A.; Maes, J.; et al. Mapping Water Provisioning Services to Support the Ecosystem–Water–Food–Energy Nexus in the Danube River Basin. Ecosyst. Serv. 2016, 17, 278–292. [Google Scholar] [CrossRef]
  8. Zhang, J.; Oosterveer, P.; Li, Y.; Greene, M. Bioenergy versus Soil Improvement: Policy Coherence and Implementation Gaps in Crop Residue-Based Bioenergy Development in China. Water 2022, 14, 3527. [Google Scholar] [CrossRef]
  9. Bellezoni, R.A.; Sharma, D.; Villela, A.A.; Pereira Junior, A.O. Water-Energy-Food Nexus of Sugarcane Ethanol Production in the State of Goiás, Brazil: An Analysis with Regional Input-Output Matrix. Biomass Bioenergy 2018, 115, 108–119. [Google Scholar] [CrossRef]
  10. Cherubini, F.; Ulgiati, S. Crop Residues as Raw Materials for Biorefinery Systems—A LCA Case Study. Appl. Energy 2010, 87, 47–57. [Google Scholar] [CrossRef]
  11. Mannan, M.; Al-Ansari, T.; Mackey, H.R.; Al-Ghamdi, S.G. Quantifying the Energy, Water and Food Nexus: A Review of the Latest Developments Based on Life-Cycle Assessment. J. Clean. Prod. 2018, 193, 300–314. [Google Scholar] [CrossRef]
  12. Mohammadpour, P.; Mahjabin, T.; Fernandez, J.; Grady, C. From National Indices to Regional Action—An Analysis of Food, Energy, Water Security in Ecuador, Bolivia, and Peru. Environ. Sci. Policy 2019, 101, 291–301. [Google Scholar] [CrossRef]
  13. Li, W.; Jiang, S.; Zhao, Y.; Li, H.; Zhu, Y.; He, G.; Xu, Y.; Shang, Y. A Copula-Based Security Risk Evaluation and Probability Calculation for Water-Energy-Food Nexus. Sci. Total Environ. 2023, 856, 159236. [Google Scholar] [CrossRef]
  14. Li, X.; Liu, C.; Wang, G.; Bao, Z.; Diao, Y.; Liu, J. Evaluating the Collaborative Security of Water–Energy–Food in China on the Basis of Symbiotic System Theory. Water 2021, 13, 1112. [Google Scholar] [CrossRef]
  15. Gu, D.; Guo, J.; Fan, Y.; Zuo, Q.; Yu, L. Evaluating Water-Energy-Food System of Yellow River Basin Based on Type-2 Fuzzy Sets and Pressure-State-Response Model. Agric. Water Manag. 2022, 267, 107607. [Google Scholar] [CrossRef]
  16. Peng, S.; Zheng, X.; Wang, Y.; Jiang, G. Study on Water-Energy-Food Collaborative Optimization for Yellow River Basin. Adv. Water Sci. 2017, 28, 681–690. [Google Scholar] [CrossRef]
  17. Hu, M.-C.; Fan, C.; Huang, T.; Wang, C.-F.; Chen, Y.-H. Urban Metabolic Analysis of a Food-Water-Energy System for Sustainable Resources Management. Int. J. Environ. Res. Public Health 2018, 16, 90. [Google Scholar] [CrossRef]
  18. Wang, H.; Hong, J.; Liu, G. Simulation Research on Different Policies of Regional Green Development under the Nexus of Water-Energy-Food. China Popul. Environ. 2019, 29, 74–84. [Google Scholar] [CrossRef]
  19. Deng, P.; Chen, J.; Chen, D.; Shi, H.; Bi, B.; Liu, Z.; Yin, Y.; Cao, X. The Evolutionary Characteristics Analysis of the Coupling and Coordination among Water, Energy and Food: Take Jiangsu Province as an Example. J. Water Resour. Water Eng. 2017, 28, 232–238. [Google Scholar] [CrossRef]
  20. Han, D.; Yu, D.; Cao, Q. Assessment on the Features of Coupling Interaction of the Food-Energy-Water Nexus in China. J. Clean. Prod. 2020, 249, 119379. [Google Scholar] [CrossRef]
  21. Qi, Y.; Farnoosh, A.; Lin, L.; Liu, H. Coupling Coordination Analysis of China’s Provincial Water-Energy-Food Nexus. Environ. Sci. Pollut. Res. 2022, 29, 23303–23313. [Google Scholar] [CrossRef] [PubMed]
  22. Huang, D.; Wen, F.; Li, G.; Wang, Y. Coupled Development of the Urban Water-Energy-Food Nexus: A Systematic Analysis of Two Megacities in China’s Beijing-Tianjin-Hebei Area. J. Clean. Prod. 2023, 419, 138051. [Google Scholar] [CrossRef]
  23. Chen, B.; Ouyang, Z.; Sun, Z.; Wu, L.; Li, F. Evaluation on the Potential of Improving Border Irrigation Performance through Border Dimensions Optimization: A Case Study on the Irrigation Districts along the Lower Yellow River. Irrig. Sci. 2013, 31, 715–728. [Google Scholar] [CrossRef]
  24. Zhang, Z.; Ma, H.; Li, Q.; Wang, X.; Feng, G. Agricultural Planting Structure Optimization and Agricultural Water Resources Optimal Allocation of Yellow River Irrigation Area in Shandong Province. Desalination Water Treat. 2014, 52, 2750–2756. [Google Scholar] [CrossRef]
  25. Liu, L.; Ma, J.; Hao, X.; Li, Q. Limitations of Water Resources to Crop Water Requirement in the Irrigation Districts along the Lower Reach of the Yellow River in China. Sustainability 2019, 11, 4680. [Google Scholar] [CrossRef]
  26. Wang, W.; Song, X.; Ma, Y. Identification of Nitrate Source Using Isotopic and Geochemical Data in the Lower Reaches of the Yellow River Irrigation District (China). Environ. Earth Sci. 2016, 75, 936. [Google Scholar] [CrossRef]
  27. Liu, C.; Jiang, E.; Liu, S.; Qu, B.; Chang, B. Agricultural Water and Land Resources Utilization Efficiency Based on Green Production and Resources Synergy. Trans. Chin. Soc. Agric. Mach. 2022, 53, 369–378. [Google Scholar] [CrossRef]
  28. Liu, C.; Zhang, Z.; Liu, S.; Liu, Q.; Feng, B.; Tanzer, J. Evaluating Agricultural Sustainability Based on the Water–Energy–Food Nexus in the Chenmengquan Irrigation District of China. Sustainability 2019, 11, 5350. [Google Scholar] [CrossRef]
  29. Dong, L.; Lihui, Z.; Heng, L.; Qiang, F.; Mo, L.; Faiz, M.A.; Ali, S.; Tianxiao, L.; Khan, M.I. Optimization of Irrigation Water Use Efficiency Evaluation Indicators Based on DPSIR-ISD Model. Water Supply 2020, 20, 83–94. [Google Scholar] [CrossRef]
  30. Li, M.; Fu, Q.; Singh, V.P.; Liu, D.; Li, T. Stochastic Multi-Objective Modeling for Optimization of Water-Food-Energy Nexus of Irrigated Agriculture. Adv. Water Resour. 2019, 127, 209–224. [Google Scholar] [CrossRef]
  31. Wang, J.; Zhou, H.; Tso, G.K.F.; Po Hsun, C.; Tua, C.; Zheng, T. Integrated Safety Assessment of Water–Energy–Food Systems Based on Improved Substance Element Extensions. J. Water Clim. Change 2023, 14, 4617–4634. [Google Scholar] [CrossRef]
  32. Fan, X.; Qin, J.; Lv, M.; Jiang, M. An Evaluation System of the Modernization Level of Irrigation Districts with an Analysis of Obstacle Factors: A Case Study for North China. Agronomy 2024, 14, 538. [Google Scholar] [CrossRef]
  33. Qian, C.; Zhang, M.; Yinting, Y.; Wang, R. A Quantitative Judgement Method for Safety Admittance of Facilities in Chemical Industrial Parks Based on G1-Variation Coefficient Method. Procedia Eng. 2014, 84, 223–232. [Google Scholar] [CrossRef]
  34. Mansour, F.; Al-Hindi, M.; Yassine, A.; Najjar, E. Multi-Criteria Approach for the Selection of Water, Energy, Food Nexus Assessment Tools and a Case Study Application. J. Environ. Manag. 2022, 322, 116139. [Google Scholar] [CrossRef]
  35. Xia, Q.; Tian, G.; Zhao, D.; Zhao, Q.; Varis, O. Effects of New-Type Urbanization on Resource Pressure: Evidence from a Water-Energy-Food System Perspective in China. Sustain. Cities Soc. 2024, 107, 105411. [Google Scholar] [CrossRef]
  36. Cheng, Y.; Wang, J.; Shu, K. The Coupling and Coordination Assessment of Food-Water-Energy Systems in China Based on Sustainable Development Goals. Sustain. Prod. Consum. 2023, 35, 338–348. [Google Scholar] [CrossRef]
  37. Ju, K.; Wang, J.; Wei, X.; Li, H.; Xu, S. A Comprehensive Evaluation of the Security of the Water-Energy-Food Systems in China. Sustain. Prod. Consum. 2023, 39, 145–161. [Google Scholar] [CrossRef]
  38. Chen, W.; Chen, Y. Two-Step Measurement of Water–Energy–Food Symbiotic Coordination and Identification of Key Influencing Factors in the Yangtze River Basin. Entropy 2021, 23, 798. [Google Scholar] [CrossRef] [PubMed]
  39. Guo, L.; Wu, Y.; Huang, F.; Jing, P.; Huang, Y. An Approach to Complex Transboundary Water Management in Central Asia: Evolutionary Cooperation in Transboundary Basins under the Water-Energy-Food-Ecosystem Nexus. J. Environ. Manag. 2024, 351, 119940. [Google Scholar] [CrossRef]
  40. Zhu, Y.; Zhang, C.; Huang, D. Assessing Urban Water–Energy–Food Security: A Case of Yangtze River Delta Urban Agglomeration. Soc. Indic. Res. 2024, 24, 1–30. [Google Scholar] [CrossRef]
  41. Wang, S.; Yang, J.; Wang, A.; Liu, T.; Du, S.; Liang, S. Coordinated Analysis and Evaluation of Water–Energy–Food Coupling: A Case Study of the Yellow River Basin in Shandong Province, China. Ecol. Indic. 2023, 148, 110138. [Google Scholar] [CrossRef]
  42. Jing, P.; Hu, T.; Sheng, J.; Mahmoud, A.; Liu, Y.; Yang, D.; Guo, L.; Li, M.; Wu, Y. Coupling Coordination and Spatiotemporal Dynamic Evolution of the Water-Energy-Food-Land (WEFL) Nexus in the Yangtze River Economic Belt, China. Environ. Sci. Pollut. Res. 2022, 30, 34978–34995. [Google Scholar] [CrossRef] [PubMed]
  43. Wang, Y.; Song, J.; Sun, H. Coupling Interactions and Spatial Equilibrium Analysis of Water-Energy-Food in the Yellow River Basin, China. Sustain. Cities Soc. 2023, 88, 104293. [Google Scholar] [CrossRef]
  44. Wang, S.; Yang, R.; Shi, S.; Wang, A.; Liu, T.; Yang, J. Characteristics and Influencing Factors of the Spatial and Temporal Variability of the Coupled Water–Energy–Food Nexus in the Yellow River Basin in Henan Province. Sustainability 2023, 15, 13977. [Google Scholar] [CrossRef]
  45. Li, H.; Wang, H.; Yang, Y.; Zhao, R. Regional Coordination and Security of Water–Energy–Food Symbiosis in Northeastern China. Sustainability 2021, 13, 1326. [Google Scholar] [CrossRef]
  46. Sun, L.; Niu, D.; Yu, M.; Li, M.; Yang, X.; Ji, Z. Integrated Assessment of the Sustainable Water-Energy-Food Nexus in China: Case Studies on Multi-Regional Sustainability and Multi-Sectoral Synergy. J. Clean. Prod. 2022, 334, 130235. [Google Scholar] [CrossRef]
  47. Mondal, K.; Chatterjee, C.; Singh, R. Examining the Coupling and Coordination of Water-Energy-Food Nexus at a Sub-National Scale in India—Insights from the Perspective of Sustainable Development Goals. Sustain. Prod. Consum. 2023, 43, 140–154. [Google Scholar] [CrossRef]
  48. Koh, E.-H.; Lee, E.; Lee, K.-K. Application of Geographically Weighted Regression Models to Predict Spatial Characteristics of Nitrate Contamination: Implications for an Effective Groundwater Management Strategy. J. Environ. Manag. 2020, 268, 110646. [Google Scholar] [CrossRef]
  49. Wang, Y.; Wei, L.; Hou, Y. Study on the Coordination of Ecological Environmental Protection and High-Quality Economic Development in the Shandong Section of the Yellow River Basin. Rural. Sci. Technol. 2023, 14, 51–55. [Google Scholar] [CrossRef]
  50. Mostefaoui, L.; Sušnik, J.; Masia, S.; Jewitt, G. A Water–Energy–Food Nexus Analysis of the Impact of Desalination and Irrigated Agriculture Expansion in the Ain Temouchent Region, Algeria. Environ. Dev. Sustain. 2024, 10, 1–27. [Google Scholar] [CrossRef]
  51. Putra, M.P.I.F.; Pradhan, P.; Kropp, J.P. A Systematic Analysis of Water-Energy-Food Security Nexus: A South Asian Case Study. Sci. Total Environ. 2020, 728, 138451. [Google Scholar] [CrossRef] [PubMed]
  52. Botai, C.M.; Botai, J.O.; Tazvinga, H.; Murambadoro, M.; Nhamo, L.; Ncongwane, K.P.; Mengistu, M.G.; Zwane, N.; Wamiti, E.; Mpandeli, S.; et al. Assessment of Rural Livelihoods, Health and Wellbeing in Vhembe District Municipality, South Africa and Narok County, Kenya: A Water-Energy-Food Nexus Perspective. Environ. Sci. Policy 2024, 159, 103817. [Google Scholar] [CrossRef]
  53. Wang, H.; Huang, S.; Di, D.; Wang, Y.; Zhang, F. Study on the Spatial Distribution of Water Resource Value in the Agricultural System of the Yellow River Basin. Water Policy 2021, 23, 1044–1058. [Google Scholar] [CrossRef]
  54. Sun, Y.; Chen, X.; Luo, Y.; Cao, D.; Feng, H.; Zhang, X.; Yao, R. Agricultural Water Quality Assessment and Application in the Yellow River Delta. Agronomy 2023, 13, 1495. [Google Scholar] [CrossRef]
  55. Li, Y.; Huang, S.; Han, M. An Assessment of the Factors That Drive Changes in the Distribution and Area of Cultivated Land in the Yellow River Delta, China. Environ. Earth Sci. 2022, 81, 227. [Google Scholar] [CrossRef]
  56. Wang, L.; Zhu, Q.; Zhang, J.; Liu, J.; Zhu, C.; Qu, L. Vegetation Dynamics Alter the Hydrological Interconnections between Upper and Mid-Lower Reaches of the Yellow River Basin, China. Ecol. Indic. 2023, 148, 110083. [Google Scholar] [CrossRef]
  57. Madani, Z.; Natcher, D. Water, Energy and Food (WEF) Nexus in the Changing Arctic: An International Law Review and Analysis. Water 2024, 16, 835. [Google Scholar] [CrossRef]
  58. Oulu, M.; Darko, D.; Osaliya, R.; Aziz, F.; Wekesa, D. Governing the Nexus: Water-Energy-Food Nexus Governance Strategies in Ghana and Uganda. Environ. Dev. 2023, 48, 100933. [Google Scholar] [CrossRef]
Figure 1. Yellow River irrigation areas in Shandong Province.
Sustainability 16 08473 g001
Figure 2. Flowchart of the method for exploring the coupling and coordination relationships of the WEF system.
Sustainability 16 08473 g002
Figure 3. Comparison of the combined weights of the evaluation indices of the WEF system.
Sustainability 16 08473 g003
Figure 4. Trends in the comprehensive evaluation index for the WEF system.
Sustainability 16 08473 g004
Figure 5. Comprehensive evaluation indices of 28 Yellow River irrigation areas in Shandong Province.
Sustainability 16 08473 g005
Figure 6. Spatial distribution map of the coupling coordination degrees of the WEF system.
Sustainability 16 08473 g006
Figure 7. Spatial heterogeneity of the driving factors.
Sustainability 16 08473 g007
Table 1. Comprehensive evaluation index system for the WEF system.
Target LayerSubsystemIndex LayerIndex AttributeNumber
Comprehensive evaluation
index
system for the WEF system
Water resource systemWater resource utilization rateNegative A1
Groundwater supply ratioNegative A2
Agricultural water use ratioNegative A3
Effective irrigation area ratioPositiveA4
Blue water use per unit areaNegativeA5
Effective rainfallPositiveA6
Energy systemFertilizer use per unit areaNegative B7
Electricity use per unit areaNegative B8
Plastic film use per unit areaNegative B9
Agricultural diesel use per unit areaNegative B10
Pesticide use per unit areaNegative B11
Food systemWheat yield per unit areaPositiveC12
Corn yield per unit areaPositiveC13
Rice yield per unit areaPositiveC14
Bean yield per unit areaPositiveC15
Potato yield per unit areaPositiveC16
Cotton yield per unit areaPositiveC17
Yield of other grains per unit areaPositiveC18
Table 2. Assignment of the relative importance between two neighboring indices.
riMeaning
1.0Indices ci−1 and ci are equally important
1.2Index ci−1 is slightly more important than index ci
1.4Index ci−1 is clearly more important than index ci
1.6Index ci−1 is much more important than index ci
2.0Index ci−1 is extremely important compared with index ci
Table 3. Criteria for classifying the degree of coupling coordination.
Development StageCoupling Coordination DegreeGrade Standards
Extreme disorder[0, 0.1)Extreme dysregulation and decline
[0.1, 0.2)Severe dysregulation and decline
Basic disorder[0.2, 0.3)Moderate dysregulation and decline
[0.3, 0.4]Mild dysregulation and decline
Transition coordination[0.4, 0.5)On the brink of dysregulation and decline
[0.5, 0.6)Barely coordinated development
Moderate coordination[0.6, 0.7)Primary coordinated development
[0.7, 0.8)Intermediate coordinated development
High coordination[0.8, 0.9)Well-coordinated development
[0.9, 1.0]Highly coordinated development
Table 4. Driving factors of coupling coordination degree of the WEF system.
VariableDimensionDriving FactorNumber
Independent variableNatural factorTemperatureX1
RainfallX2
SlopeX3
NDVIX4
Social factorBuilding area ratioX5
Dependent variableCoupling coordination degreeY
Table 5. Comparison of model results.
ModelAICcR2Adjusted R2
OLS−137.47270.82980.7912
GWR−141.45210.95620.9462
Disclaimer/Publisher’s Note: The statements, opinions and data contained in all publications are solely those of the individual author(s) and contributor(s) and not of MDPI and/or the editor(s). MDPI and/or the editor(s) disclaim responsibility for any injury to people or property resulting from any ideas, methods, instructions or products referred to in the content.

