Article

Impact of the COVID-19 Pandemic on the Financial Situation of Rural and Urban Households in Poland

by
Romana Głowicka-Wołoszyn
1,*,
Andrzej Wołoszyn
1,
Joanna Stanisławska
1,
Amílcar Oliveira
2,3 and
Teresa Oliveira
2,3
1
Department of Finance and Accounting, Faculty of Economics, Poznań University of Life Sciences, ul. Wojska Polskiego 28, 60-637 Poznań, Poland
2
Department of Sciences and Technology, Universidade Aberta, Rua da Escola Politécnica 147, 1269-001 Lisboa, Portugal
3
Center of Statistics and Applications, University of Lisbon, Campo Grande, 1749-016 Lisboa, Portugal
*
Author to whom correspondence should be addressed.
Sustainability 2024, 16(19), 8516; https://doi.org/10.3390/su16198516 (registering DOI)
Submission received: 31 August 2024 / Revised: 27 September 2024 / Accepted: 28 September 2024 / Published: 30 September 2024
(This article belongs to the Special Issue Economic and Social Consequences of the COVID-19 Pandemic)

Abstract

:
The COVID-19 pandemic not only caused a global health crisis but also had a huge impact on household finances. This research aimed to examine the financial situation of rural and urban households in Poland between 2018 and 2022 from a multidimensional perspective. In a unidimensional approach, the financial situation of households was analyzed separately for their income, expenditures, savings rate, and shares of fixed expenses. In a multidimensional approach, the analysis used a synthetic index constructed for all these variables combined, employing the TOPSIS method and drawing on microdata from the Polish Central Statistical Office that totaled approximately 150,000 households. It was found that despite the pandemic outbreak, which led to major changes in the labor market, government-introduced organizational and legal measures protected the income of Polish households from decline. Indeed, income was increasing up until 2021, with a modest fall in 2022, which was less severe in rural households (by about 2%) than in urban ones (by 6%). A more immediate response to the outbreak was observed in consumer spending, which fell sharply, while the food share in consumption increased at similar levels in rural and urban areas. Regression analysis showed that compared to 2019, the pandemic worsened the financial situation of Polish households, but only in 2020 and 2022 were these changes statistically significant. In 2021, the financial situation improved slightly, but the change was not statistically significant. Before the pandemic, the synthetic assessment of the financial situation in rural areas was lower than in urban ones, and the pandemic period did not reduce these differences, showing no convergence between poorer rural areas and richer urban ones. Diagnosing and monitoring the household financial situation are crucial steps for achieving the social dimension goals of sustainable development. Research on the pandemic’s effects on household finances provides valuable information that can help develop effective strategies to counter future crises while supporting the social dimension of the sustainable development strategy.

1. Introduction

The COVID-19 pandemic appeared in Europe in February 2020, with the first case in Poland reported in early March. Later that month, a state of epidemic was introduced [1], which remained in force until May 2022. The state of epidemic was downgraded to a state of epidemic emergency in May 2022 [2], which was finally revoked in July 2023 [3]. Unprecedented in the modern world, the dynamic spread of the virus SARS-CoV-2, high mortality rate, and lack of vaccines in the early stages of the pandemic caused a global health crisis. Governments worldwide introduced strategies to limit the spread of the virus [4], which in most European countries, including Poland, consisted of strict restrictions on population movement and the need to maintain social distance (Sweden did not replicate the solutions introduced in other European countries; there were no restrictions on movement, only recommendations to maintain social distance and, if possible, move to remote work. As Hologa and Winiarski [5] highlighted in their study, Sweden’s unique way of combating the pandemic was based on specific social, organizational, and legal resources, as well as society’s pragmatic approach to the pandemic’s social reality. The implemented strategy proved successful, but as the authors pointed out, its implementation in another country would likely have been a failure.). The restrictions and lockdowns put in place to limit the spread of the disease had the side effect of halting service-providing activities in several industries: hospitality, tourism, entertainment, leisure, hairdressing, and private health care [6,7,8]. In other industries, including transportation and catering, activities were severely curtailed. Schools, universities, and government offices closed and began to operate remotely. The abrupt changes in the operation of industries, public institutions, and businesses contributed to creating a socio-economic crisis on top of the medical one [9,10,11,12,13,14,15,16,17].
In Poland, as in other European countries, the pandemic caused major changes in the labor market. On the one hand, the temporary closure of some industries (which not infrequently led to bankruptcies), restrictions on the activities of others (take-out rather than on-premises catering), and border closures (which limited trade and consequently production and service value) may have contributed to a diminished demand for labor and reduced household income. On the other hand, the new reality created conditions for the dynamic development of some industries (delivery services), transformations of others (AI revolution), and a different (remote) form of work. As indicated by Korzeniowska et al. [18], the pandemic accelerated the transformation of Poland’s economy from traditional to digital, increasing the popularity of online shopping, e-commerce, e-banking, digital administration, and remote medical services, among others. These changes, along with government support programs for businesses and households, potentially protected the income and financial situation of Polish households. The pandemic not only altered households’ ability and means of generating income but also contributed to changes in the type and level of expenditures and savings [19,20], although the pace and nature of these changes depended on several household characteristics.
In Poland, place of residence is an important factor that differentiates income opportunities and household spending patterns. Rural areas are still characterized by lower income levels and higher income inequality than urban ones [21,22].
However, the last eight years have seen a public policy context characterized by an aversion to economic inequality, with generous redistributive programs and public investment strategies targeting less developed rural areas. Combined with a long period of economic growth and a low unemployment rate, this context helped less affluent households, including rural ones, bridge the gap with the better-off. However, the outbreak of the pandemic and the legal and organizational solutions introduced in 2020 must have changed the reality in which Polish households operated and maintained their financial situation.
Poland implemented several anti-crisis measures, much like other EU nations. The Anti-Crisis Shields—a set of business policies and employee help programs—were among the most effective in Central and Eastern Europe, evidenced by Poland experiencing one of the shallowest recessions in the EU and maintaining a low unemployment rate during the pandemic. Therefore, studying the effects of this support on household finances and comparing them across countries are crucial steps to developing effective anti-crisis strategies for the future.
The primary objective of the research was to conduct a multidimensional (composite) evaluation of the financial situation of rural and urban households in Poland and to diagnose its changes from 2018 to 2022. The study emphasized the pandemic years of 2020–2022 and compared them to the pre-pandemic period of 2018–2019. The evaluation was preceded by unidimensional assessments of selected financial indicators. This approach aimed to address the following research questions:
RQ1: was the household financial situation, as quantified by the synthetic index, rated lower in 2020 through 2022 than in the pre-pandemic period?
RQ2: was the pre-pandemic difference in the synthetic index between urban and rural households reduced during the pandemic years?
Assessing the financial situation of households is an important research concern from both macroeconomic and microeconomic perspectives. Macroeconomically, a poorer average financial situation poses threats to the banking sector, aggregate demand, capital accumulation, and the overall health of the economy [23]. Microeconomically, a worsening financial situation translates into lower living standards with all attendant social implications. The research addresses the gap created by the scarcity of studies on the relationship between COVID-19 and household financial situations. Despite numerous papers on the pandemic’s effects on national economies, there is a lack of detailed, multidimensional, microeconomic-level analysis of the financial situation of rural households in Poland, particularly in the context of their adapting income levels and consumption patterns.
Poland, like other European Union countries, pursues sustainable development, one of the modern world’s most significant challenges. This concept integrates economic development, environmental protection, and social justice. The UN Resolution, “Transforming our World: the 2030 Agenda for Sustainable Development”, defines these goals. All countries, regardless of socio-economic development level, must implement actions to improve residents’ quality of life and increase prosperity while caring for the environment.
In Poland, socio-economic development goals are outlined in three dimensions of sustainable development and included in the 2017 “Strategy for Responsible Development” (SOR). The social dimension prioritizes reducing social exclusion, poverty, and inequalities, including territorial disparities, ultimately improving citizens’ quality of life.
From a household perspective, income plays a crucial role in enhancing quality of life by satisfying various needs. As Leszczyńska [24] notes, “household income is not only an economic category but also a social one” because it influences social status. During economic crises, such as the COVID-19 pandemic, household savings gain significant importance, improving economic security and resilience to financial shocks.
These financial and economic variables contribute to the overall financial situation of households. Diagnosing and monitoring this situation are essential steps for achieving the social dimension goals of sustainable development. Research on the pandemic’s effects on households provides valuable information for developing effective strategies to counter future crises while supporting the social dimension of the sustainable development strategy.

2. Financial Situation of Households—Literature Review

The concept of household financial situation has not been clearly defined in the literature and is not easy to define [25]. Thus, the concept is often presented intuitively without a formal definition. However, two approaches prevail in socio-economic research: broad and narrow. The broad definition includes not only the household’s current financial streams, such as income, savings, and debt, but also the net worth of financial assets, at least to the extent that a household needs to survive economic shocks like job loss, health issues, or other events involving unexpected expenses. This approach is used in studies of both financial stability and the resilience of household finances [26,27,28].
In narrow terms, a household’s financial situation is identified with the level of disposable income or the amount of consumer spending. However, neither of these financial categories alone fully captures the concept of financial situation, despite the fact that consumption expenditures reflect the main purpose of households, which is to meet the needs of their members. At the same level of income, a higher share of consumer spending may imply a worse financial situation due to a lower savings rate [29]. However, a lower share of expenditures in income may also be associated with the need to service debt obligations. Additionally, assessing the financial situation requires accounting for the broader environment, since the same level of income and spending may reflect different financial situations for households in a large metropolis versus a peripherally located village [25]. Thus, in the opinion of the authors of this study, it seems reasonable to include the burden of fixed expenses, such as food and housing (including energy), in the assessment. The rationale is that at the same income level, a higher share of fixed expenditures reduces a household’s fund for discretionary spending, which is a clear indicator of a worse financial situation.
Another problem with using income as the sole indicator of financial situation is the stability of its sources. Hired casual labor, self-employment, and farm work generate less stable income streams than other sources [21,30,31]. For example, farmer households, which cannot be as certain of their income as full-time worker households, tend to accumulate much greater savings in a financial reserve to offset anticipated income shocks.
The income or consumption level alone does not reveal how much a household saves (and even less how much it invests), leaving the long-term picture of the financial situation incomplete. The particular importance of savings in assessing household financial situations is highlighted in the research of Szustak et al. [19], which describes savings as the cornerstone of a household’s financial development. Consequently, Wereda and Prokopowicz [32] consider savings an integral part of the financial situation as a complex concept. Moreover, a survey by Paździor and Majek [28] reveals that, in the prevailing opinion of Polish respondents, savings accumulation is the surest way to hedge against crises, shocks, and adverse events that could potentially ruin household finances.
When a household exceeds its financial capacity, it can turn to external sources of financing for current consumption, investment, or recovery from external shocks. However, households already burdened with loans may find it difficult to cover various expenditures [33]. Thus, the financial situation of a household budget burdened with debt should be considered worse than that of a household without any liabilities. However, this relationship is not necessarily linear: the literature points to the existence of a tipping point in household liabilities, beyond which debt ceases to build wealth (through investment) and begins to destroy it [34].
When assessing the financial situation, it is necessary to analyze the sources and levels of income, consumer spending, savings, and debt, as well as accumulated financial or physical assets that serve as a financial cushion against income and expense shocks [35]. A similar definition of financial situation is provided by other researchers [18,25,29,36], as well as the National Bank of Poland [37], which, until 2017, published assessments of household financial situations in separate sections devoted to income generation, private consumption, savings and investment, and assets and liabilities.
Different lifestyles of rural and urban residents have long translated into different income generation, spending, and saving habits. Ongoing modernization of rural areas has bridged the gap to some extent, but some differences remain. These changes have resulted from the decline in the importance of agriculture in the rural economy. Consequently, there has been a shift away from multi-generational family farms and agriculture in general, along with an evolution in residents’ demographics and patterns of economic activity [31]. Accelerating suburbanization also means that the countryside within the sphere of influence of larger urban centers is losing its agricultural functions, taking on a residential and service character [38]. Whether these changes impacted the financial situation of rural households in the short span of the study period seems doubtful, but they provide important background for understanding the impact of the pandemic on the financial situation dynamics of rural and urban households.

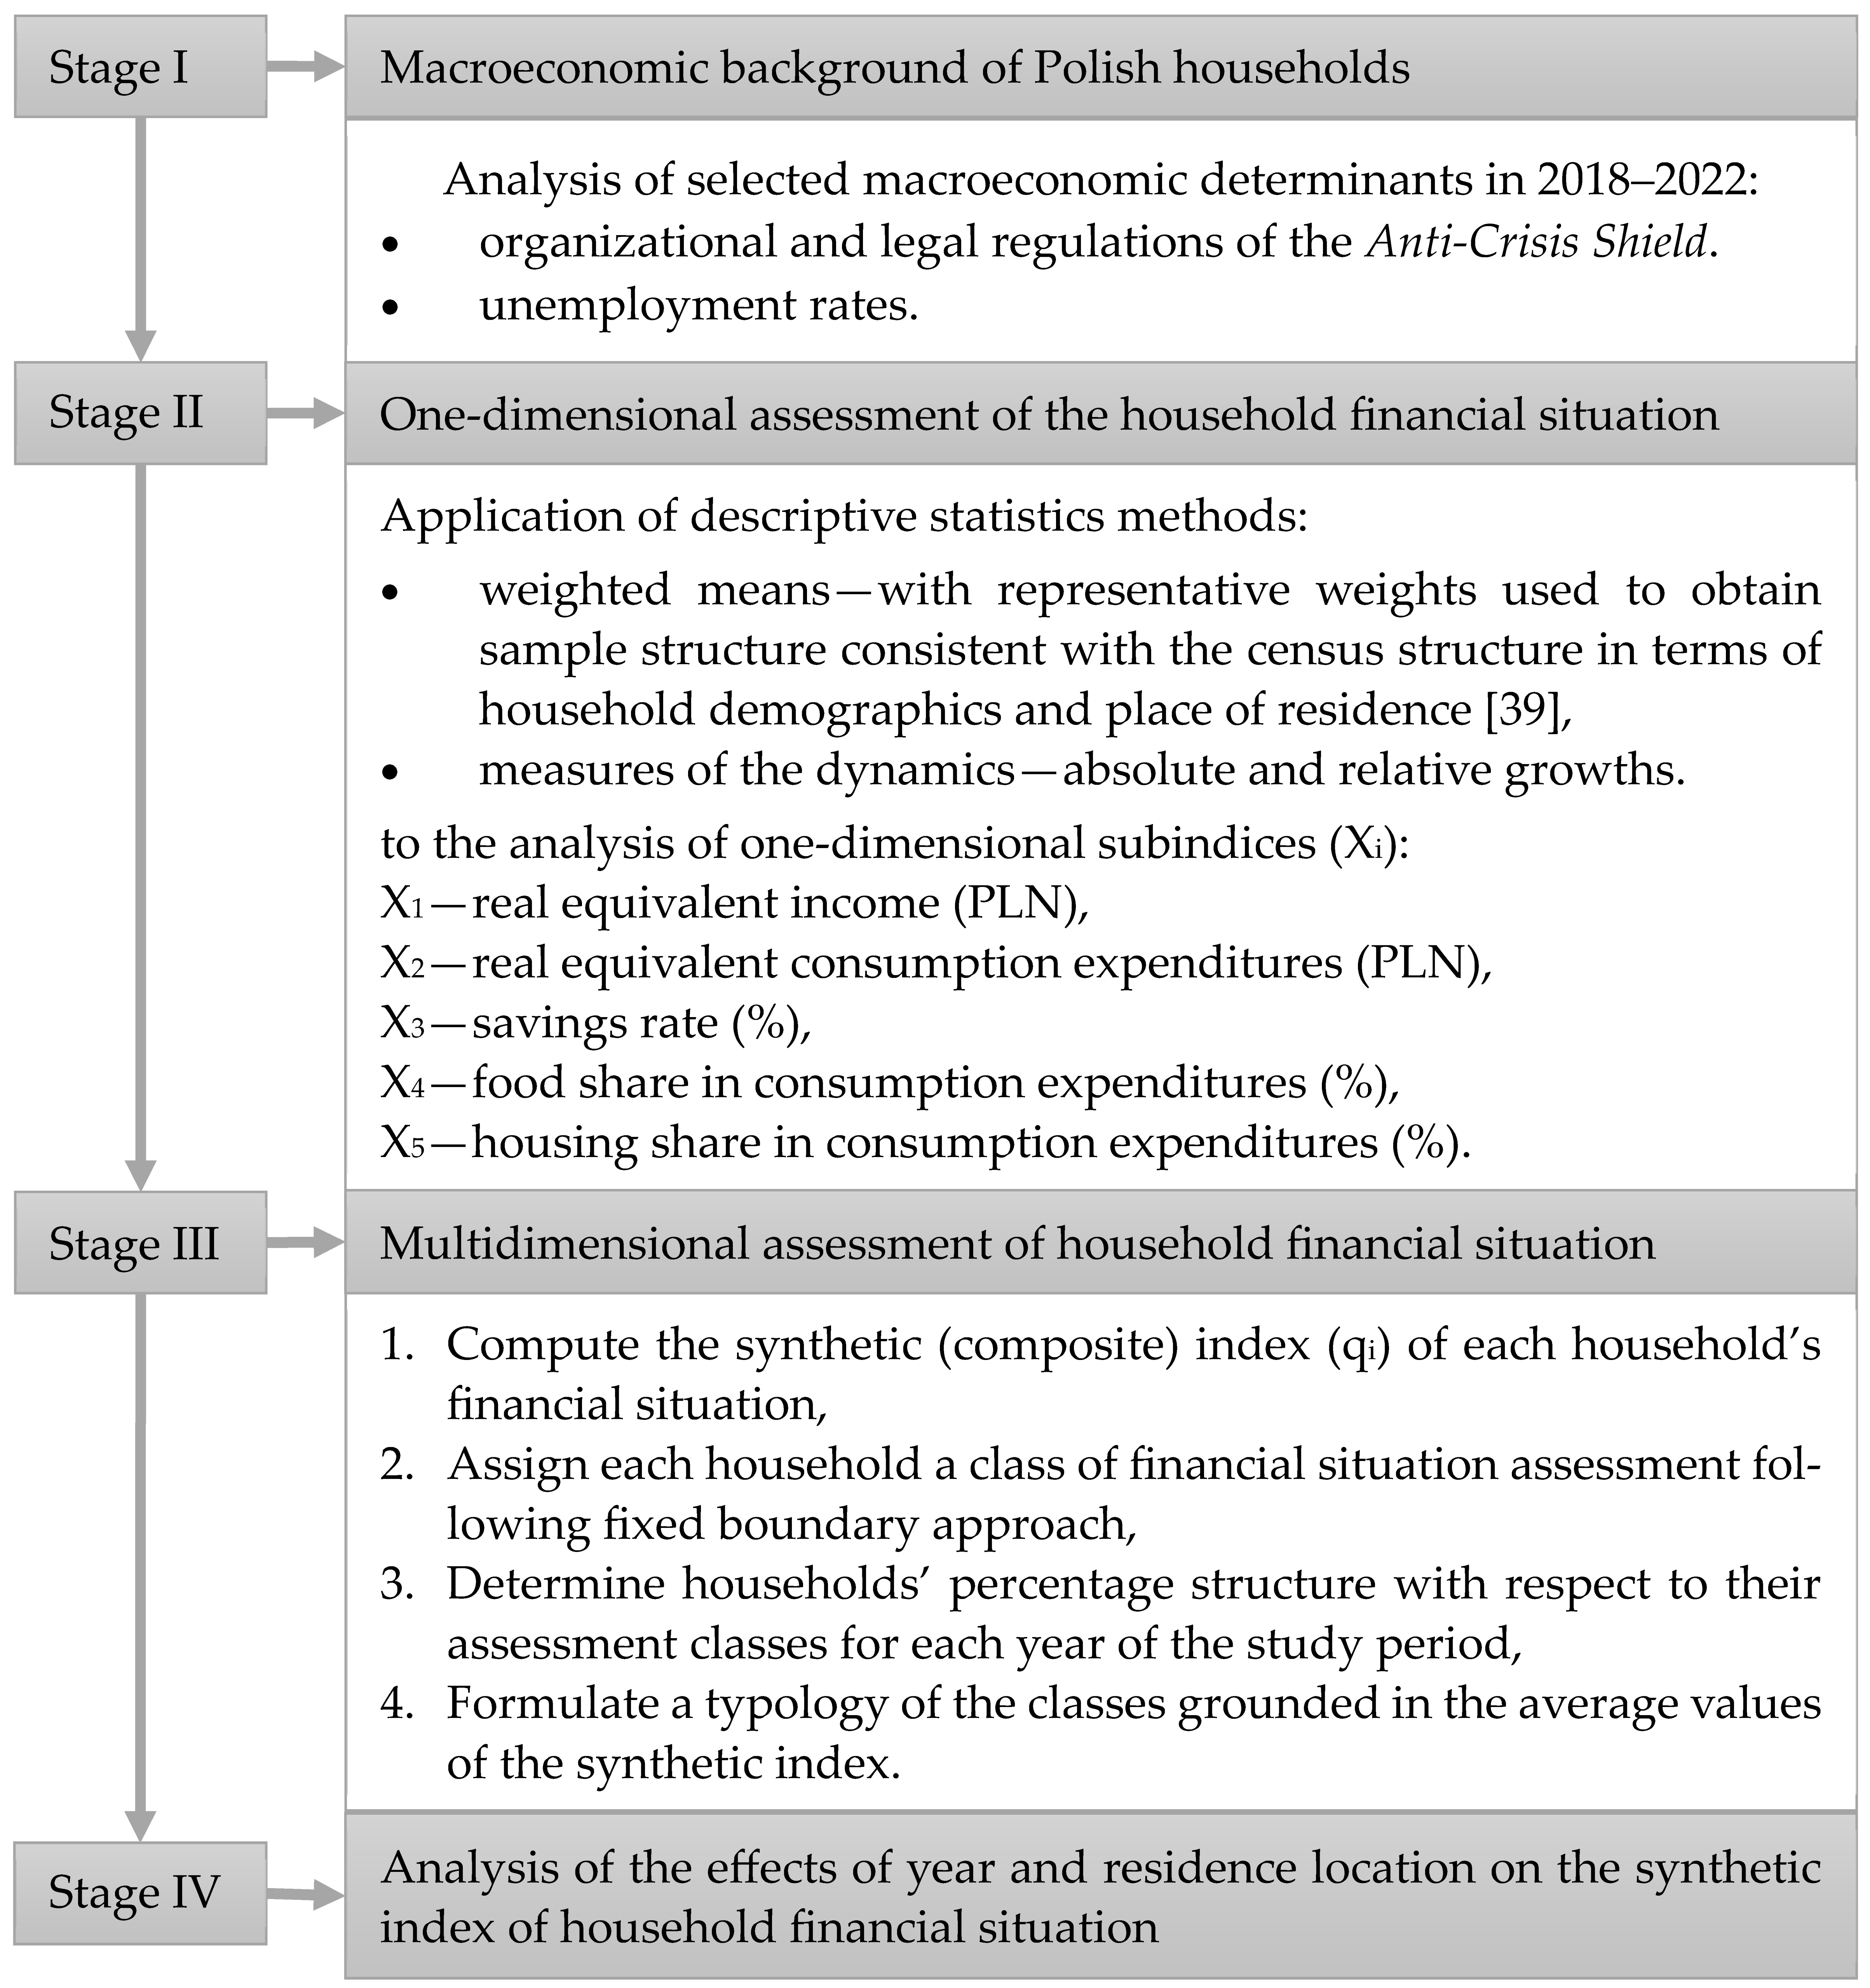
3. Materials and Methods

The primary source of information on the financial situation of Polish households is the Household Budget Surveys (BBGD in Polish) conducted by the Central Statistical Office, which also cover the living conditions of the population. BBGD surveys are using a representative method, which allows the results to be generalized to all households in Poland [39].These surveys focus on household budgets, including the monetary and non-monetary amounts of income and expenses of all household members. Unfortunately, the BBGDs do not report objective measures of household assets or liabilities, but only respondents’ opinions on financial reserves in case of income and expense shocks, and subjective assessments of debt severity. The reluctance to answer questions about these aspects of their financial situation leads to a lack of reliable measures. Consequently, the study adopted a simplified, narrow definition of financial situation. The literature explores a concept broader than the objective financial situation studied in this paper—a concept that includes subjective assessments; it is covered under the term of financial satisfaction or financial well-being [40,41].
The study drew mainly on unidentifiable microdata from the Household Budget Survey conducted by the Central Statistical Office [42]. The survey reported on more than 30,000 households each year in two groups of urban and rural place of residence over five years between 2018 and 2022. Thus, a total of more than 150 thousand households were the study objects.
The research was conducted in three stages (Figure 1). Stage I provides a background for subsequent analysis, showing changes in the macro-environment of Polish households, which could have possible bearing on their financial situation.
Stage II evaluates selected one-dimensional indicators of the financial situation—an approach often used in the literature [see [11,19]]. The indicators include real (adjusted for inflation) per capita income, real per capita consumption expenditures, savings rate, share of food (with non-alcoholic beverages), and of housing (including energy) in total consumption expenditures. The household savings rate was defined as the ratio of the difference between disposable income and expenditures to disposable income [43].
Stage III combines partial indices from the previous stage (with income and consumption expenditures deflated by equivalence scales instead of household size) to compute the synthetic (composite) index for each household (Figure 1) using the TOPSIS method (Technique for Order Preference by Similarity to an Ideal Solution). Equivalence scales that account for scale effects are necessary when comparing incomes of households with different size and demographic composition [44]. A modified OECD scale recommended by EUROSTAT assigns the first adult in the household a weight of 1, other adults 0.5, and children 0.3.
Socio-economic research often examines complex phenomena characterized by several simple features. Examples include material deprivation [45], socio-economic development [46], and quality of life [47]. Applying synthetic (composite or multidimensional) indicators for their assessment aids in interpretation and simplifies the complexity of simultaneously analyzing many simple features. Naive non-ideal methods or, in recent years, ideal methods such as the Hellwig [48] or TOPSIS method [49,50] are employed in constructing synthetic indicators. Obtained values of the index are then used to assess the level and changes in the financial situation for the 2018–2022 period.
Construction of a synthetic index with TOPSIS [45,46,47,49,50, Appendix A]:
  • normalizing partial indices (Xj) with min-max method:
for   stimulants :   z i j = x i j min i x i j max i x ij min i x i j
for   destimulants :   z i j = max i x i j x i j max i x ij min i x i j
where: x i j —is the value of the j-th partial index in the i-th household;
2.
finding ideal and anti-ideal values for every partial index in the set of households across the years [51,52].
ideal:
A + = max i z i 1 , max i z i 2 , , max i z i K = z 1 + , z 2 + , , z K + = ( 1 , 1 , , 1 )
anti-ideal:
A = min i z i 1 , min i z i 2 , , min i z i K = z 1 , z 2 , , z K = ( 0 , 0 , , 0 )
Reference (ideal) values for partial indices were determined from a restricted set of households–omitting those outside the range:
Q 1 1.5 · I Q R ; Q 3 + 1.5 · I Q R
where Q1, Q3—are the first and third quartiles and IQR—is the interquartile range.
3.
calculating Euclidean distance from the ideal ( d i + ) and anti-ideal ( d i ):
d i + = k = 1 K z i k z k + 2 ,
d i = k = 1 K z i k z k 2
4.
computing the synthetic index q i :
q i = d i d i + d i + ,   where   i   is   the   household   number .
The multidimensional assessment was based on a set of partial indices analyzed in a unidimensional analysis. Only two indices—the share of food and the share of housing expenses in household consumption expenditures (%)—were considered as destimulants of the financial situation; the rest were stimulants. The fixed boundary approach distinguished five classes of household financial situation (Table 1) based on the values of the synthetic index (qi).
Stage IV: The analysis of the effects of year and residence location on the synthetic index of household financial situation employed regression with binary predictors, a method often used in socio-economic research (cf. [53,54]).
Regression formula for binary regressors:
q = β 0 + β 1 Y 2020 + β 2 Y 2021 + β 3 Y 2022 + β 4 C L r + β 5 Y 2020 C L r + β 6 Y 2021 C L r + β 7 Y 2022 C L r + ε
where
q —synthetic index of a household’s financial situation,
Y j —indicator variable of the j-th year; these variables assign 0 to 2019 (the year before the outbreak), which serves as the reference year,
C L r —indicator variable of a rural household; assigns 0 to urban households,
ε —error term.

4. Results

4.1. Macroeconomic Determinants of the Financial Situation of Polish Households During the COVID-19 Pandemic

The macroeconomic factors that affect a household’s environment and consequently its functioning and financial situation can be classified in various ways [35,55], but the general consensus distinguishes the following factors:
  • environmental conditions (geographic and climatic)—the presence of fertile soil, mineral deposits, or environmental hazards (natural and anthropogenic);
  • demographic, social and cultural background—the age structure, migrations, social norms, traditions and values; this category includes place of residence—urban or rural studied in this paper;
  • economic fundamentals—country’s economic situation, unemployment, wage levels, inflation;
  • political, legal and administrative framework—fiscal and redistributive policy, degree of economic freedom.
Following the outbreak of the pandemic, governments in many countries focused on protecting public health and limiting the spread of the disease. However, curtailing population mobility inevitably led to upheavals in the labor market. Many companies were forced to reduce their operations, halt them temporarily, or even declare bankruptcy. In many countries, the pandemic contributed to rising unemployment, although the impact varied across different industries. Job losses and forced shutdowns caused financial problems for many households and contributed to the deterioration of their financial situation.
An analysis of the unemployment rate in Poland (Table 2) shows that the outbreak did not cause an immediate increase; in fact, a slight drop to 3.2% was recorded in 2020. In 2021, the rate rose to 3.4%, but a year later, it dropped again by 0.5 percentage points. As Adamowicz’s [20] research indicated, in most European countries, the rate exceeded 5% in 2020, reaching 15.5% in Spain [56].
In Polish cities, the unemployment rate was lower than in rural areas (Table 2). The difference was 0.7 percentage points in 2018, but in the following years, until 2021, it narrowed to only 0.1 percentage points. In 2022, the urban rate fell more than the rural rate, and the urban–rural gap widened again.
To mitigate the effects of the economic crisis caused by the pandemic, the Polish government introduced various legal and organizational solutions, starting with a package of shielding measures to support job retention and provide economic security for workers. These solutions, collectively known as the Anti-Crisis Shield [58], included subsidies for employees’ salaries, coverage of social security premiums (previously paid by employers), and additional childcare benefits to compensate for the closure of nurseries, kindergartens, and schools. [18,59].
Further solutions introduced by the government aimed to help entrepreneurs and ensure the financial continuity of companies. These were followed by measures in health care, financial system, and public investment. By the end of 2020, six Anti-Crisis Shields had been introduced, followed by others implemented the next year. Selected solutions that may have directly contributed to improving the financial situation of households are summarized in Table 3.
Kańduła and Przybylska’s research [65] also highlights anti-crisis measures taken by local authorities to support residents and small entrepreneurs. These measures, which included tax exemptions, installment plans for tax payments, and reductions in selected local fees, could have impacted the financial situation of households. Dvorak’s research [66] on the Baltic countries also emphasizes the importance of a decentralized approach to crisis management, due to the fact that municipalities “can respond to the needs of residents and entrepreneurs more quickly and flexibly”.
Adamowicz’s [20] research shows that the anti-crisis measures introduced in Poland effectively mitigated the negative effects of the economic shock caused by the pandemic. However, these measures were more appreciated by entrepreneurs than by employees.

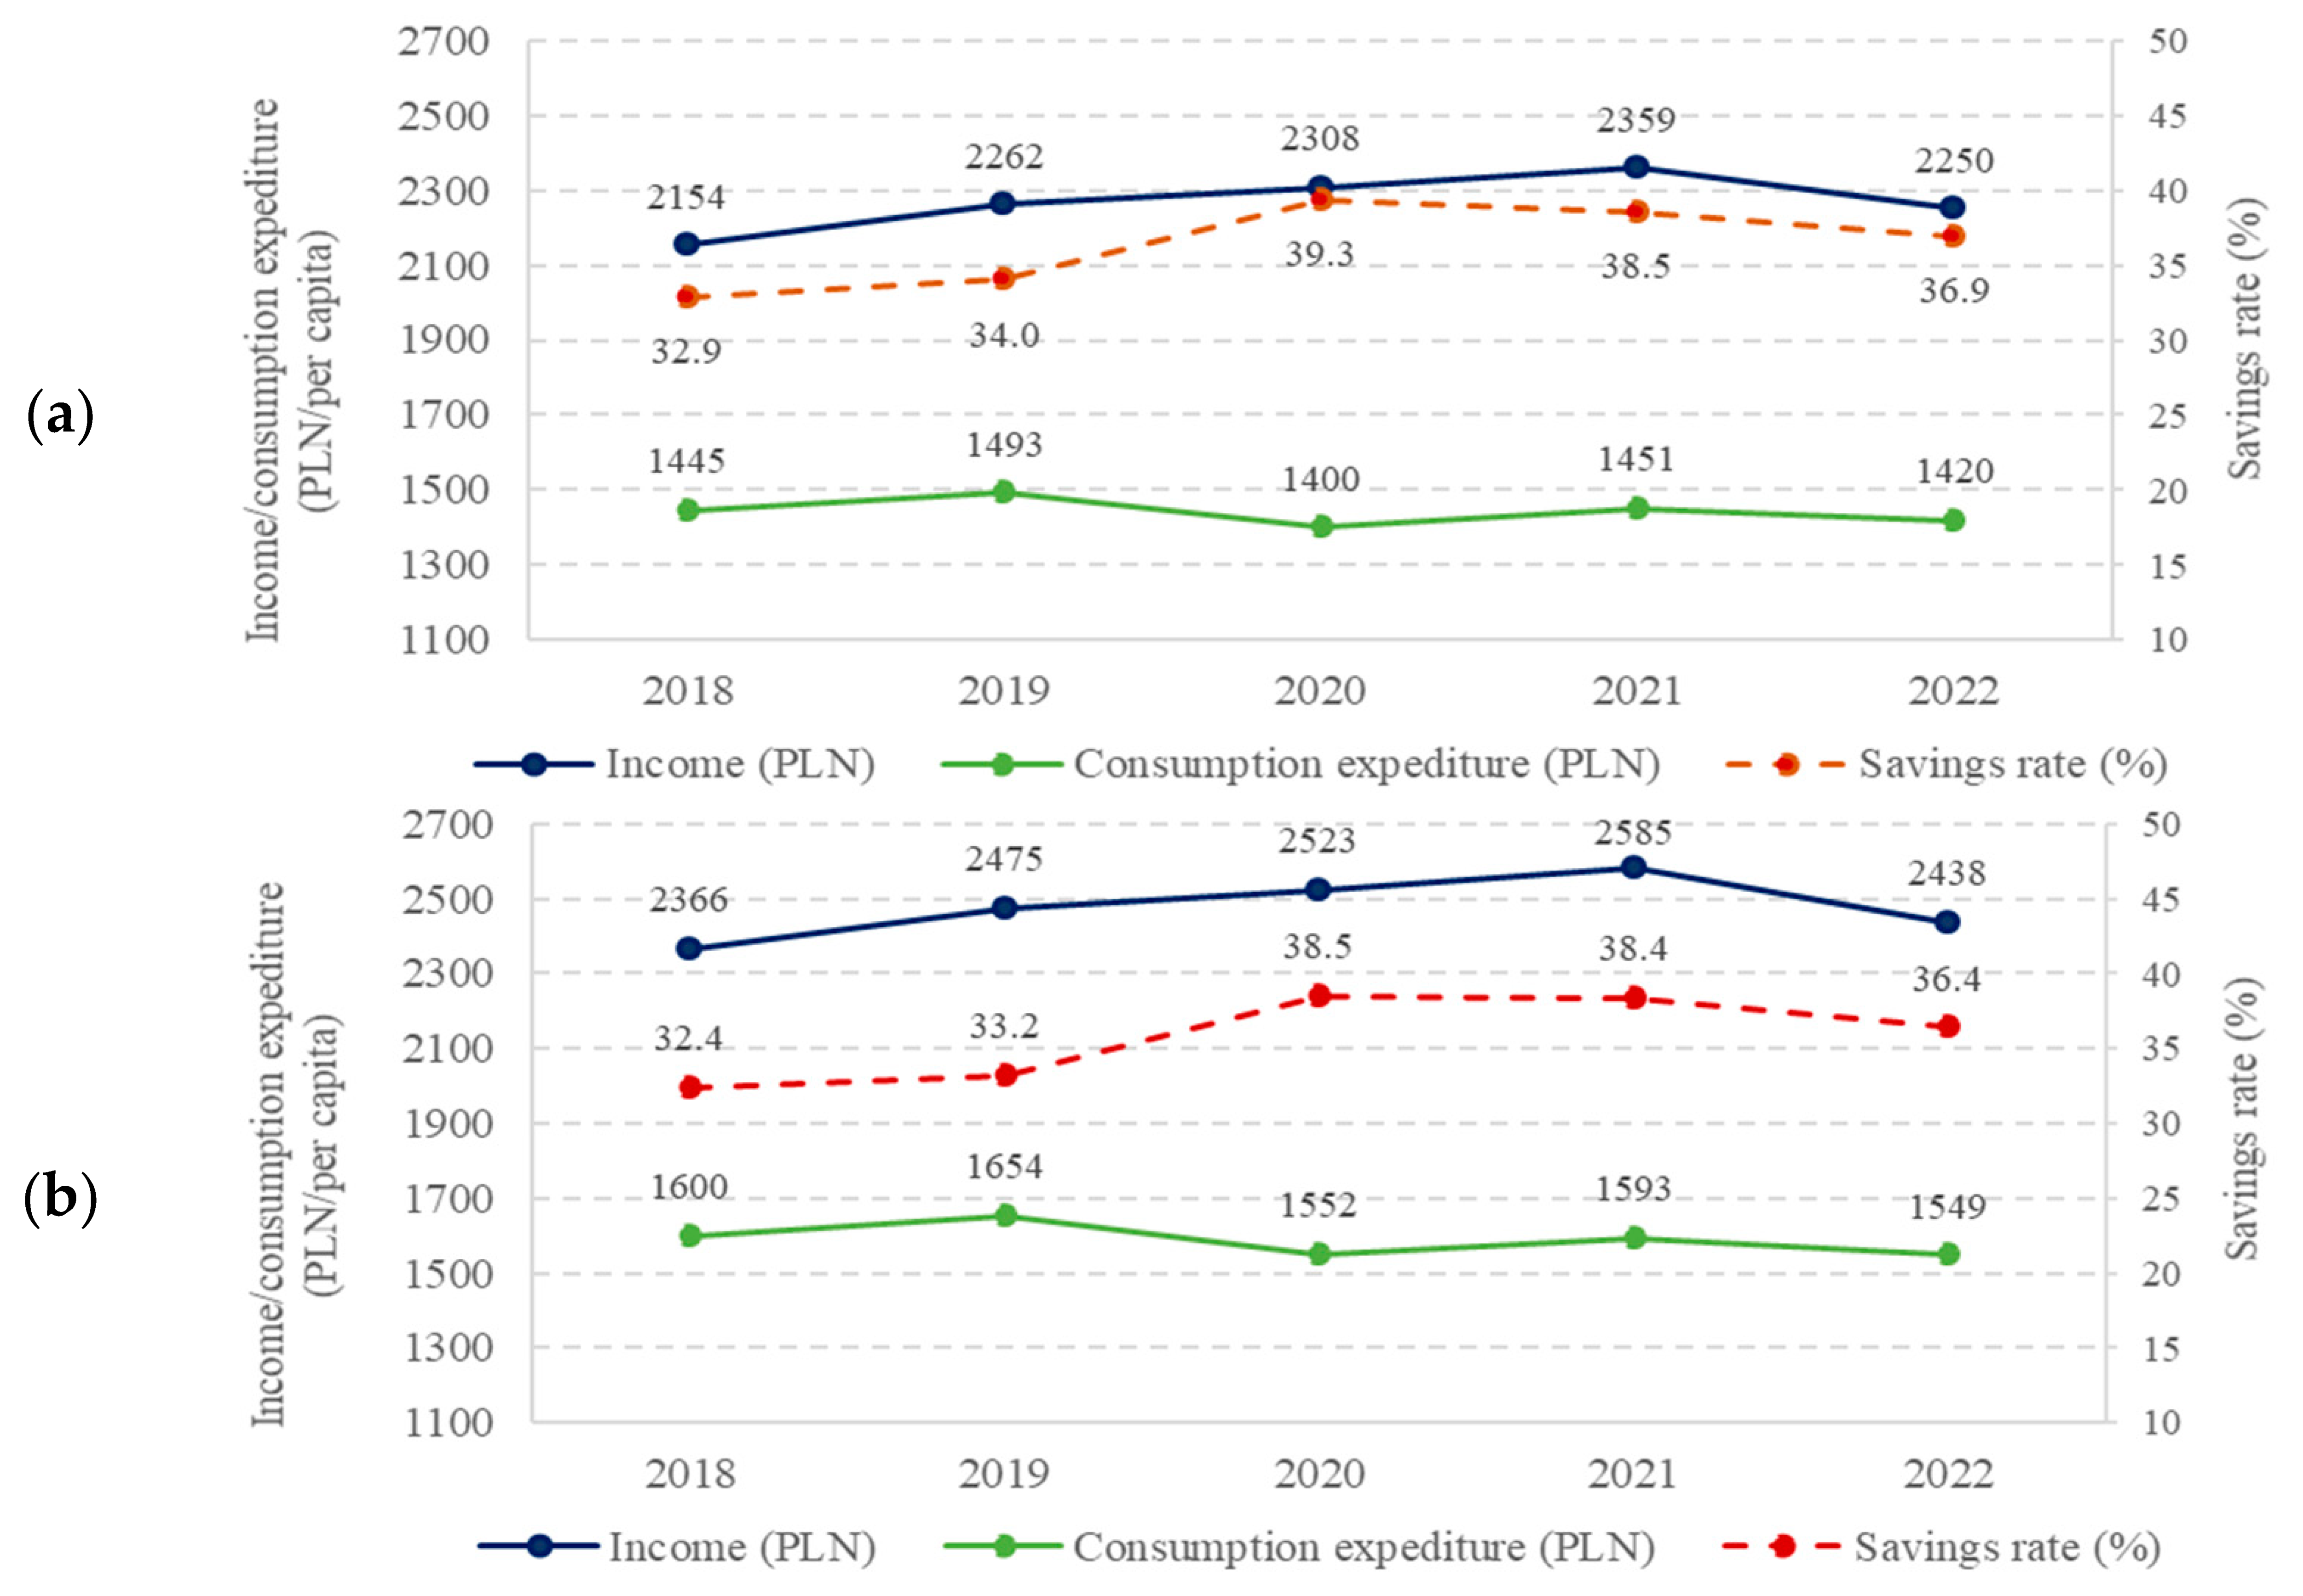
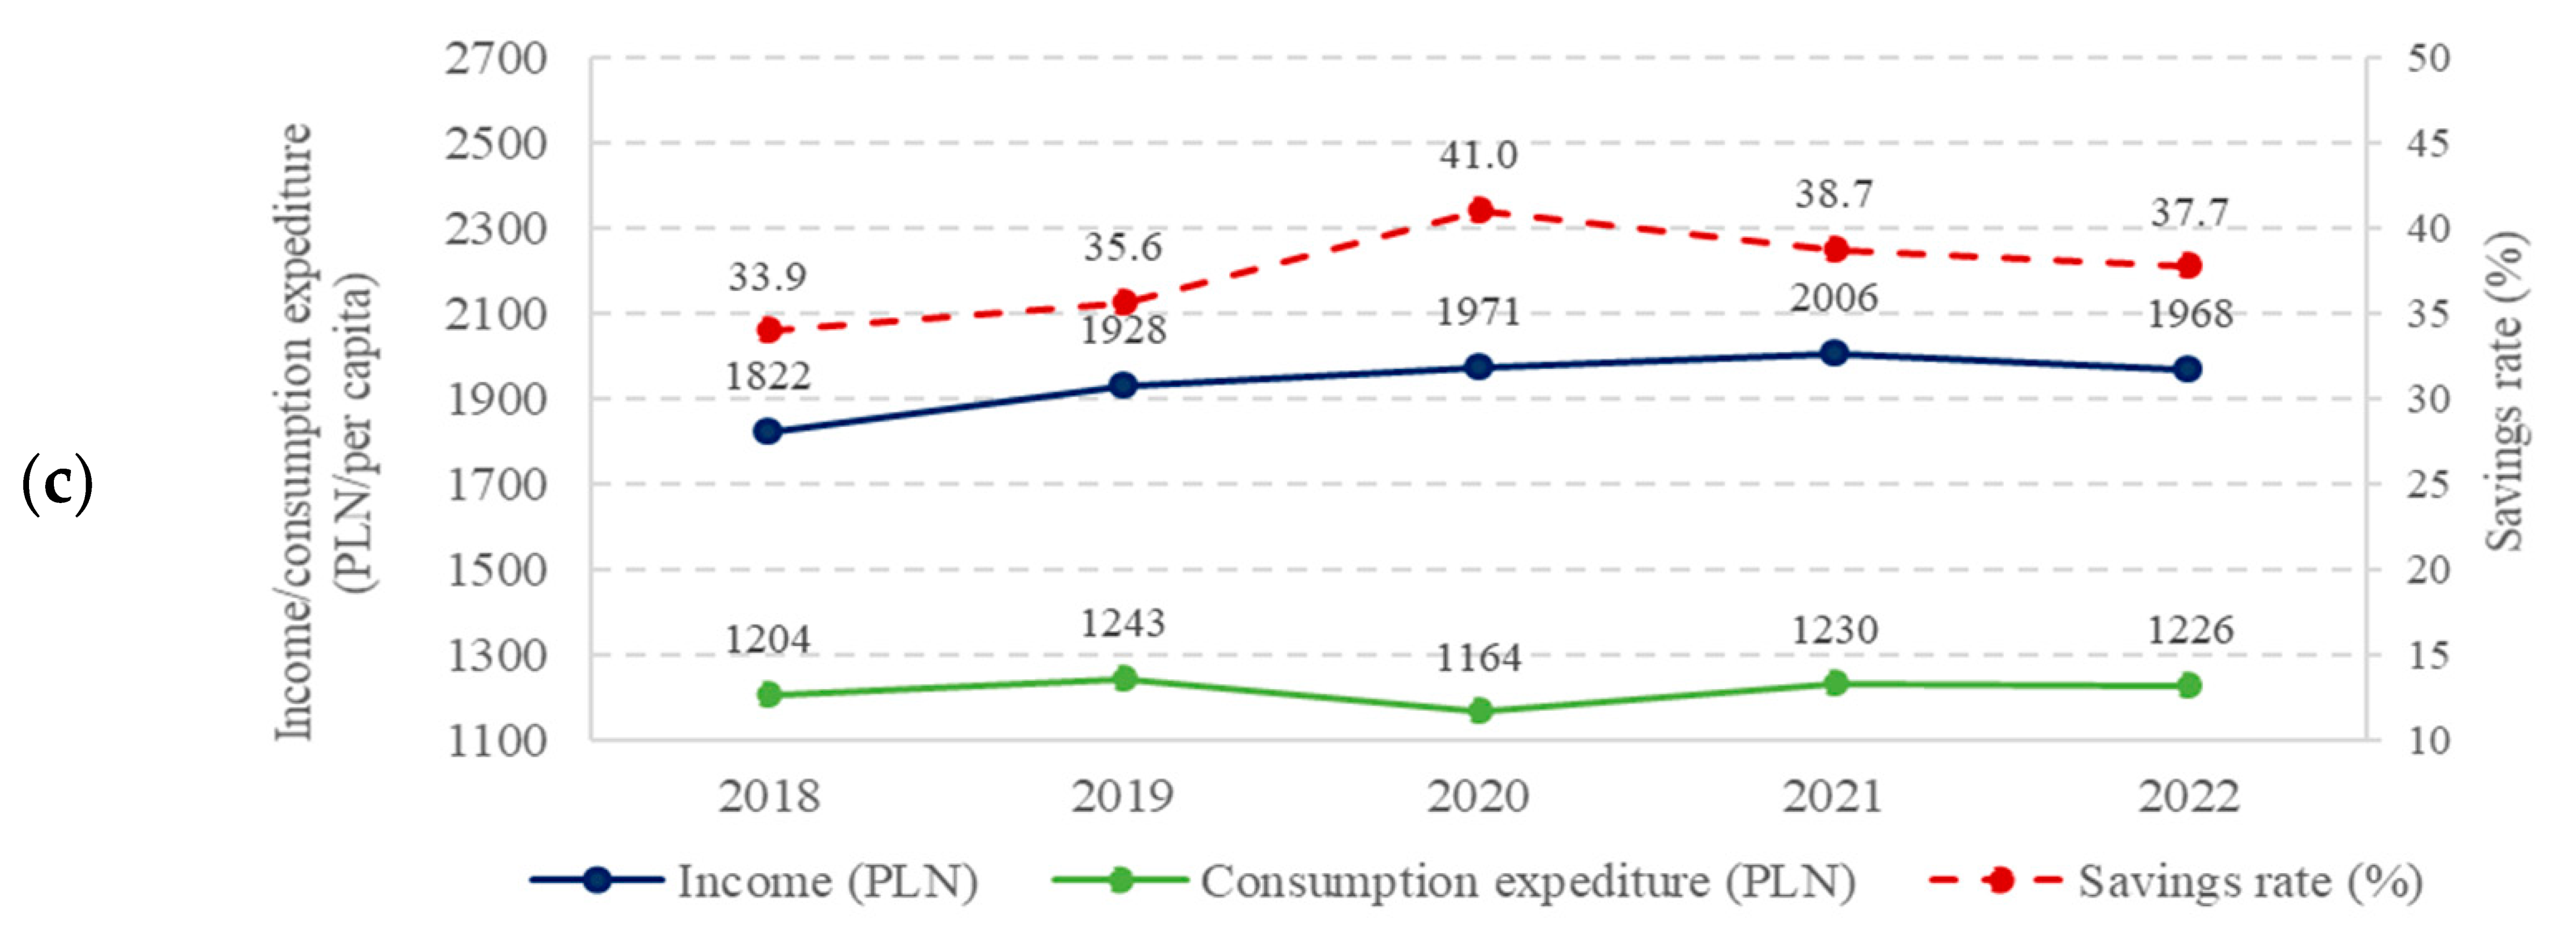
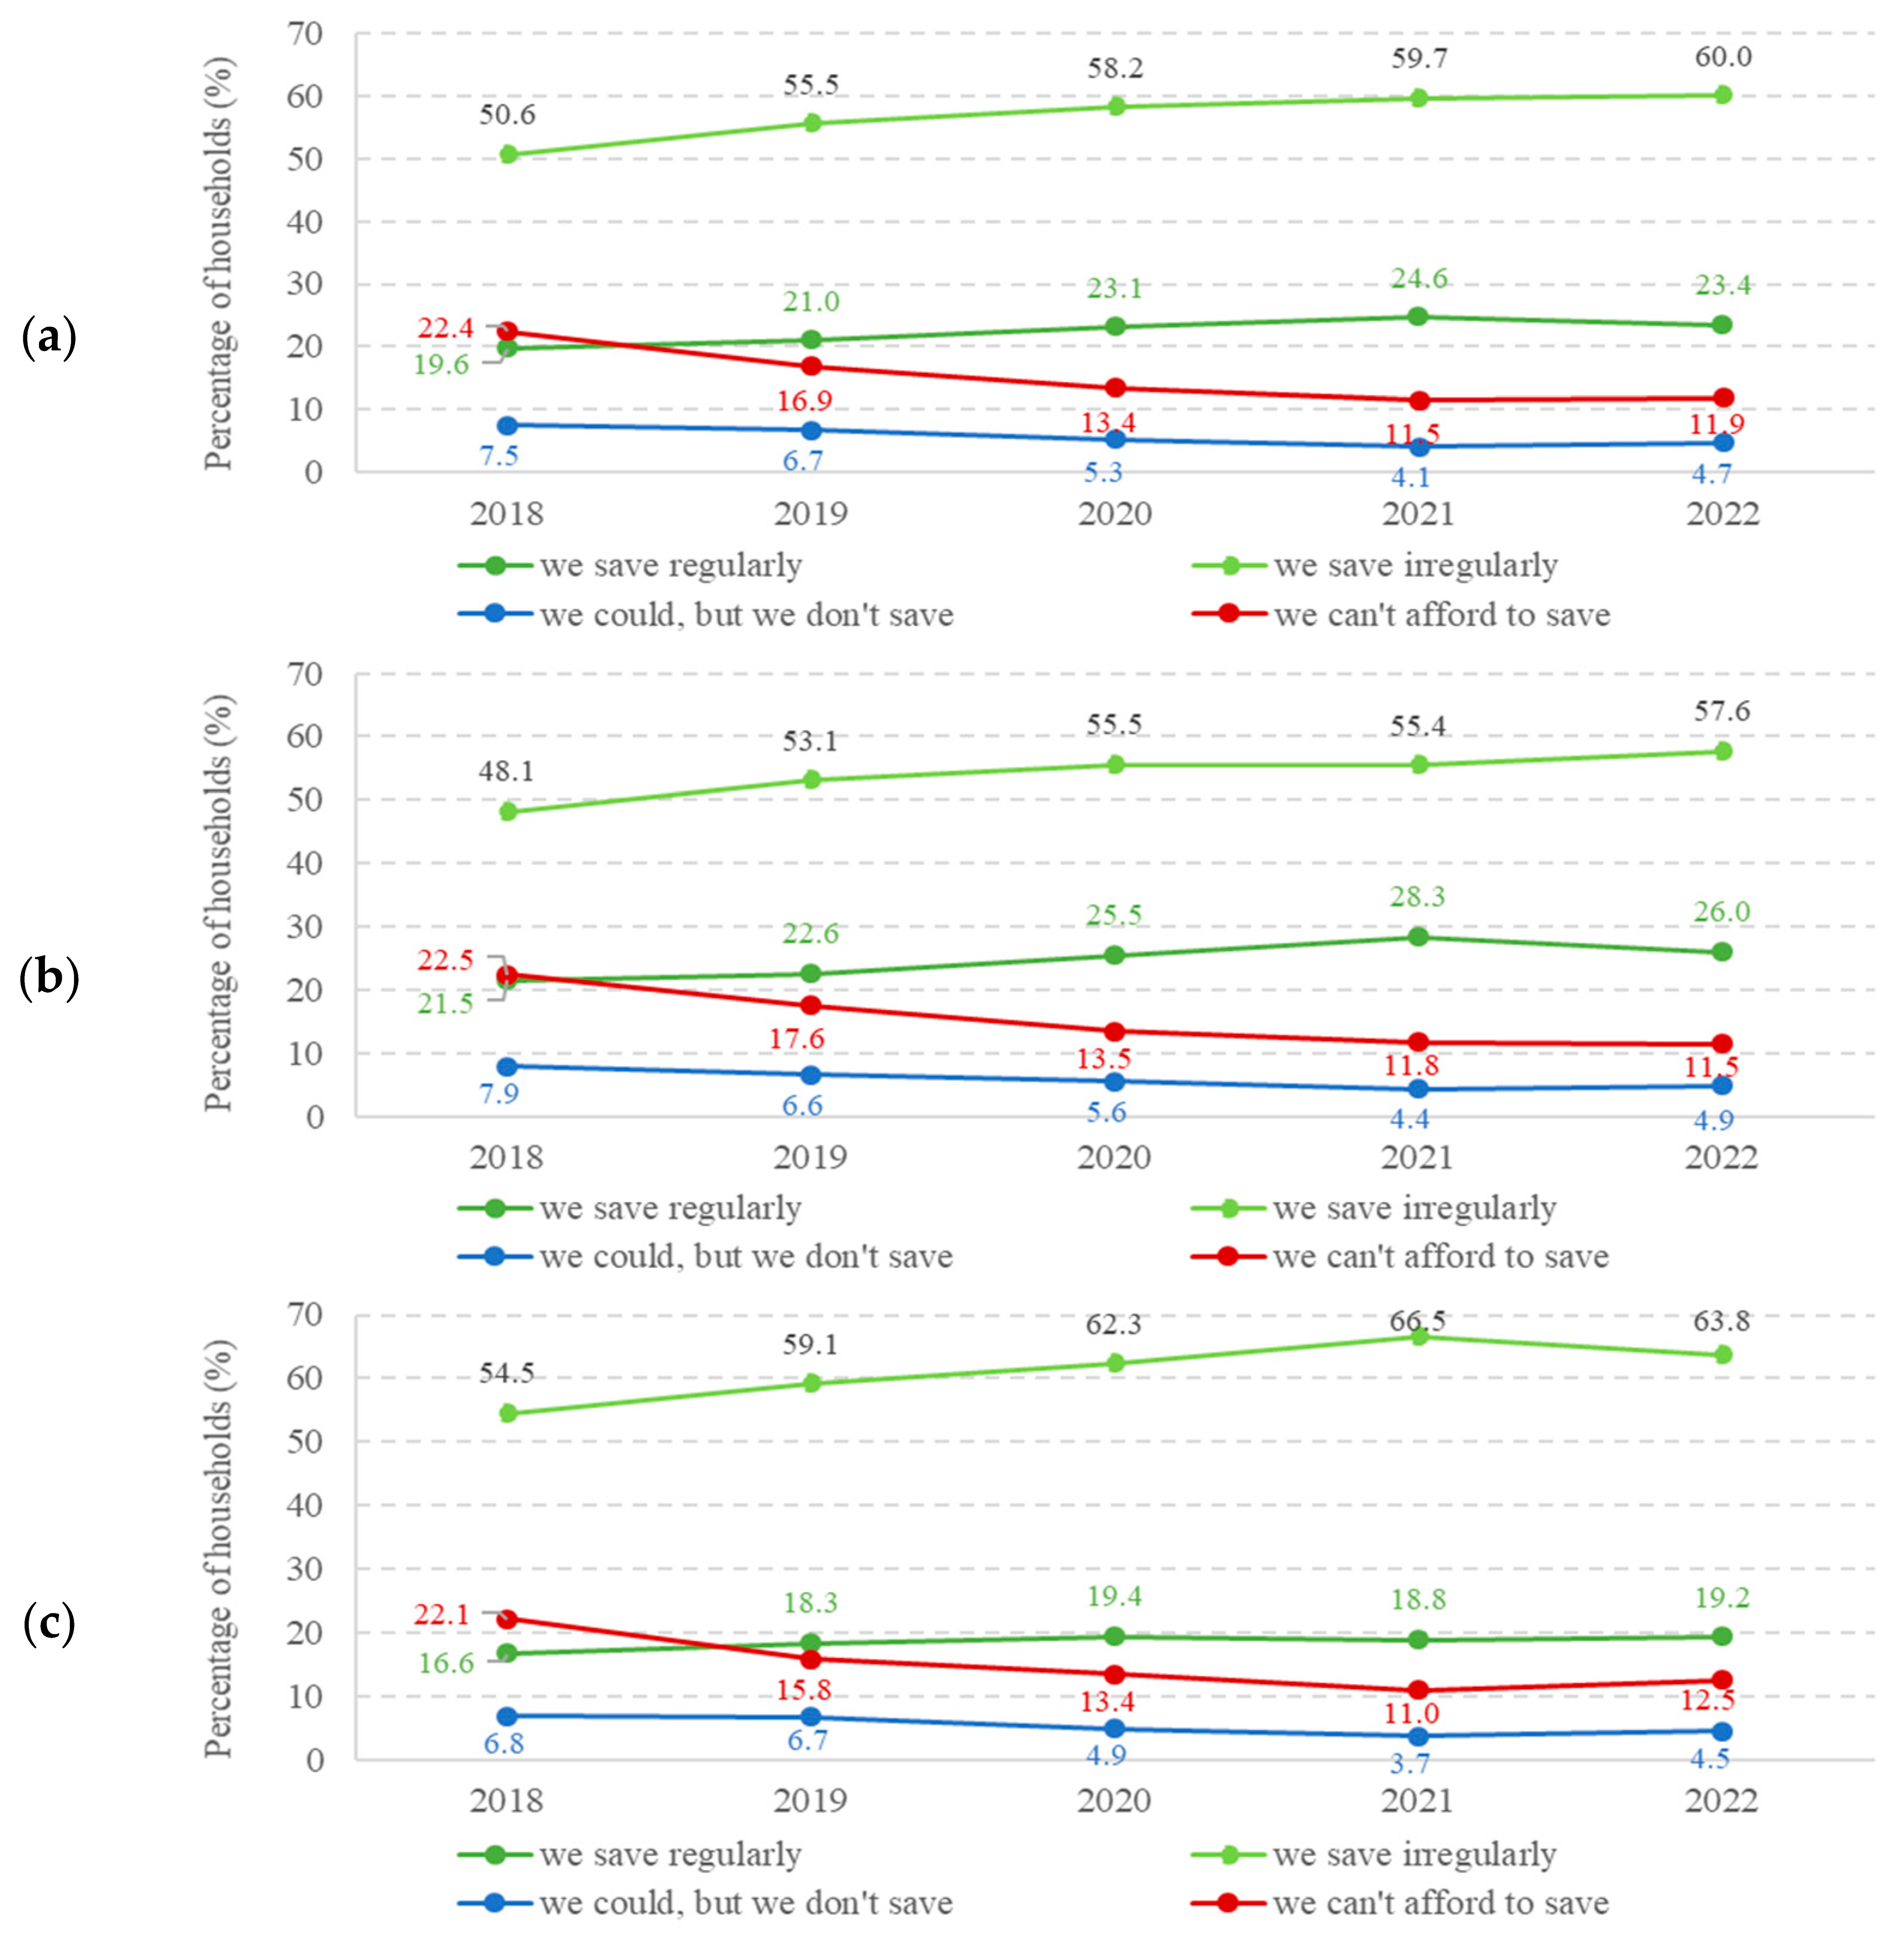
4.2. Unidimensional Assessment of Household Financial Situation

Disposable income of Polish households, both urban and rural, increased continuously from 2018 to 2021. The outbreak of the COVID-19 pandemic in 2020 did not alter this trend. Restrictions on service sectors such as trade, transport, gastronomy, tourism, entertainment, and employment limitations due to illness or quarantine compelled entrepreneurs to reduce working hours, jobs, or wages. However, in Poland, the outbreak did not cause an increase in the annual unemployment rate; it only slowed its decline to 3.2% (Table 2). In the first two quarters and the fourth quarter, it stood at 3.1%, with a slightly higher value of 3.3% in the third quarter [cf. [67]]. A significant increase was recorded only in the first quarter of 2021, but subsequent quarters saw a systematic decline to a level lower than in 2020.
It can be argued that government measures to counteract the effects of the pandemic also contributed to shielding the incomes of urban and rural households (Table 3). Between 2019 and 2021, real disposable income per capita in rural and urban households increased by 4% and 4.4%, respectively (Figure 2). It was not until 2022 that income of urban and rural households deteriorated, the decline being more severe in cities than in rural areas, with urban incomes falling by 5.7% compared to the previous year, three times higher than the decline in rural areas (Figure 2).
Throughout the study period, real disposable income per capita was lower in rural households than in urban households. It was about 30% lower in 2018 and 28–29% lower in 2019–2021. In 2022, the difference decreased to just under 24%. Thus, one can observe income convergence between urban and rural households, as the initial disadvantage of rural households diminished substantially over four years.
Throughout the study period, the real level of consumer spending was also lower in rural households, with the disadvantage being slightly larger than for income—33% in 2018–2020 and 26% in 2022 (Figure 2). The larger consumption disparities are atypical because, in general, inequality in consumption is smaller than in income. For the rural–urban divide, the reason may be reduced access to cultural and hospitality facilities, such as cinemas, theatres, restaurants, and cafes, as well as different consumption patterns [68]. Additionally, this group includes farmer households with unstable incomes and a greater propensity to save [21,30].
In the dynamics of consumer spending, a sudden drop was observed in 2020 (over 6% in both urban and rural households), which resulted from the imposed lockdowns (Figure 2). It was not so much due to the need for savings in uncertain times but rather to the limited opportunities for spending (closed shops, restaurants, hotels, entertainment venues, and other service facilities). Another fall in consumer spending was recorded in 2022 (2.8% in urban and only 0.3% in rural areas), but now it was a consequence of the income decline, especially in urban households.
The savings rate of Polish households before the pandemic, specifically in 2018–2019, remained relatively stable at 33–34%. In this period, it increased by only 0.8 percentage points in urban areas and by 1.7 percentage points in rural areas. The outbreak saw a surge in the savings rate—over 5 percentage points in both urban and rural households, reaching 38.5% and 41%, respectively. This increase primarily followed a lockdown-induced drop in expenditures, further bolstered by a slightly rising income level. In subsequent years, however, growing access to services led to higher consumption, which, coupled with a decline in income levels in 2022, contributed to decreasing savings rates. Throughout the study period, the savings rate was higher in rural than in urban households—by as much as 2.5 percentage points in 2020, decreasing to below 1 percentage point in the second and third years of the pandemic (Figure 2). Savings accumulated during the pandemic could have resulted from precautionary reasons and the need to safeguard against unexpected expenses or income loss, but they could also have been a consequence of lockdowns, leading to forced savings. In the subsequent years of the pandemic, the rate decreased in both urban and rural households (by 2.1 and 3.3 pp, respectively). These results align with the findings of Szustak et al. [19], which indicate that Polish households are more inclined to use their savings to compensate for lower incomes rather than taking on debt in the form of credit or loans.
Before the pandemic, over half of Polish households saved irregularly, while one in five households regularly set aside part of their income (Figure 3). In cities, a higher percentage of households saved regularly: 21.5% in 2018 and 22.6% in 2019, compared to 16.6% and 18.3% of rural households. Conversely, a higher percentage of rural households saved irregularly: 54.5% and 59.1%, compared to 48.1% and 53.1% in urban areas.
The pandemic did not reverse the upward trend in the percentage of saving households but only slightly slowed it down. In 2022, 83.4% of Polish households were saving, with the majority (60%) saving irregularly and 23.4% regularly. Differences between urban and rural areas persisted. In 2022, 57.6% of urban households saved irregularly, compared to 63.8% in rural areas. The percentage of households regularly saving was 6.8 pp higher in cities, standing at 26%. During the study period, the percentage of households that could save but did not decreased. Nationally, this was 7.5% in 2018, dropping to about 5% by 2022. This percentage was similar in both urban and rural areas, though slightly lower in rural households by about 1.1–0.5 pp. At the beginning of the study period, about 22% of households could not save due to low-income levels. However, this percentage steadily declined throughout the study period, reaching below 5% in 2022. This percentage was similar in both urban and rural areas (Figure 3).
It is worth noticing that rural households, despite having lower income, accumulated savings more frequently, had a smaller percentage of those declaring they could not afford to save, and had higher savings levels. These behaviors were observed both before and during the pandemic. As mentioned earlier, the reasons for this phenomenon can be attributed to the lower availability of recreational, leisure, and private medical services, as well as greater frugality of rural households due to less stable income sources, exacerbated in the uncertain times of the pandemic.
In 2018, two-thirds of Polish households were not indebted. The pandemic did not increase debt levels; on the contrary, due to improved income conditions (Figure 2), the percentage of households without loans or credits increased by 2.5 pp in 2021, and the percentage of households that did not meet their repayment obligations on time decreased by 1.7 pp. Only in 2022 was there a slight deterioration, with a 0.3 pp decrease in the percentage of households without debt and a 0.3 pp increase in the percentage of households not meeting loan or credit repayment deadlines (Figure 4).
Rural households exhibited greater debt aversion, with the percentage of debt-free households ranging from 71.7% in 2018 to 74.3% in 2021, before decreasing by 2.5 pp in 2022. In urban areas, this percentage increased throughout the study period, from 63.4% to 66.8%. Among urban households, the deterioration in income conditions in 2022 was reflected in a slight increase (by 0.4 pp) in the percentage of households struggling with timely debt repayments. These results confirm the findings of Szustak et al. [19], which indicate that the decline in savings among Polish households may be due to their reluctance to incur debt during uncertain times.
The share of food (and non-alcoholic beverages) in consumption expenditures was higher in rural than in urban households throughout the studied period (Figure 5). This directly results from the poorer income conditions of rural households. Before the pandemic, the food share was 24–25% in urban households and about 5 pp higher in rural ones. In 2020, the shock caused by the pandemic, concerns about food access, and the perceived need to stockpile food increased the food share in both urban and rural households by about 2.5 pp. However, this increase did not translate into a rise in total consumption expenditures due to significant declines in other types of expenditures, including culture and recreation, gastronomy and hotels, clothing and footwear, etc. [68].
In contrast, the share of housing (and energy) in consumption expenditures was lower in rural than in urban households throughout the studied period. This mainly results from the absence of rent payments, including administrative fees of housing cooperatives, which are more prevalent in urban multi-family buildings. Additionally, the phenomenon of renting apartments, along with the associated rental fees, occurs more frequently in urban than in rural areas.

4.3. Multidimensional Assessment of Household Financial Situation

The value of the synthetic indicator was calculated for each household, which led to the assessment of its financial situation according to the classification presented in Table 1. Since the percentage of households with a “very low” financial situation did not exceed 0.2% each year, it was decided to combine the two lowest financial assessment classes, i.e., “low + very low” (Figure 6).
Throughout the study period, which includes two years before and three years during the pandemic, the financial situation of rural households was consistently worse than that of urban households (Figure 6). Each year, rural households had a higher percentage of low or very low assessments, 14–17%, compared to 10–12% in urban areas. Conversely, urban areas had a higher percentage of high or very high assessments—35–39% versus 24–27% in rural areas.
Year 2019, before the outbreak of the pandemic, saw the greatest improvement in the financial situation of both urban and rural households of the entire study period (Figure 6). Back in 2018, 12.2% of urban household financial situation was assessed as low or very low, 31.5% as high, and 3.9% as very high. In rural areas, the respective figures were about 5 pp higher, and 9 pp and 2 pp lower. In 2019, the percentage of households with a low or very low assessment decreased (in urban areas by about 2 pp and in rural areas by about 3 pp), the percentage of households with a high assessment increased (by about 3 pp and 2 pp, respectively), and with very high assessment (by 0.4 pp in both urban and rural areas). Thus, improvement was greater in rural than in urban areas and was in general driven by the improved income situation of both urban and rural households (Figure 2). This favorable income dynamics for Polish households persisted since Poland’s accession to the EU, with a slight slowdown in 2011–2013 [21,32]. The growing income also contributed to the increase in consumption expenditures and in the savings rate.
The 2020 year brought a slight deterioration in the household financial situation, due mainly to its worsening among wealthier households, and affecting urban more than rural (Figure 6). Both types of households saw a 2 pp decrease in the percentage with high or very high assessment, and a slight increase of 0.2 pp in the percentage with a low or very low assessment. The introduction of movement restrictions and social isolation in the first months of the pandemic contributed to a decline in small business income, mainly in catering, hospitality, recreation, beauty and hairdressing. This reduced the income of business owners, thus affecting mainly the wealthiest of self-employed households. The introduction of a number of legal and organizational measures in the Anti-Crisis Shield (Table 3) allowed business owners to maintain their companies afloat and also to keep the jobs, possibly shielding employees more than the owners. As a result, despite the outbreak, average household income actually increased by about 2% (Figure 2). The biggest contribution to the deterioration of the financial situation assessment in 2020 was a decline in consumer spending of more than 6% and a 2 pp increase in the share of food expenses (Figure 5). The reason for these changes was a completely changed consumer spending structure [68]. The lockdowns cut down on shopping in stationary stores, shrank service spending in general, and all but eliminated leisure travel, catering, or private dental services. At the same time, households increased at-home consumption of food and non-alcoholic beverages, partly due to fear of food shortages, partly because they had no other choice. As a result, the food share in total consumption also increased.
In 2021, the effects of state financial backing for businesses and households, along with the easing of social restrictions, significantly improved financial assessments (Figure 6). In cities, the second year of the pandemic saw a 2 pp increase in the percentage of households with high or very high assessments, exceeding 38%. In rural areas, this increase was higher—about 3 pp, reaching 28%. Simultaneously, there was a slight decrease (below 1 pp) in the percentage of households with low or very low assessments, down to 10% in cities and 14% in rural areas. This improvement was driven by the continuing rise in real household income, increased consumer spending, and a shrinking share of household budgets spent on food and non-alcoholic beverages (Figure 2 and Figure 5).
The state of epidemic ended in May 2022 [60]. Polish economy was then already facing another crisis of the Russian-Ukrainian war that broke out in February. The year 2022 was the first year in the study period when real household income dropped down from the previous year—as did consumer spending and savings rates (Figure 2 and Figure 5). Consequently, the financial situation of both urban and rural households deteriorated. The percentage of urban households with high or very high assessments dove down by 2.5 pp, while the percentage with low or very low assessments increased by 1.4 pp. Among rural households, the changes were smaller—the percentage with high or very high assessments decreased by only 0.7 pp, and the percentage with low or very low assessments increased by 1.3 pp.
The impact of the said factors—namely the year of the study and the class of residence—on the synthetic index of the household financial situation was examined through the regression analysis described by formula (1). It was found that in 2020 (the first year of the pandemic) and in 2022 (its last year), the value of the synthetic index decreased significantly from the pre-pandemic year of 2019 (Table 4). In 2020, the index was 0.0084 lower, and in 2022—0.0062 lower. In 2021, however, the change from the reference year of 2019 was statistically insignificant. Therefore, during the pandemic, only in 2020 and 2022 was the household financial situation significantly worse than in the pre-pandemic year.
In 2019, the synthetic index of the financial situation was 0.037 lower for rural households than for urban ones. This difference was statistically significant and increased significantly only in 2021—to the level of 0.042 (=0.037 + 0.005). Conversely, the observed contraction of the difference in 2022 was not significant (Table 4).
Among all categories, households with the very high assessment of financial situation exhibited, unsurprisingly, the highest values of stimulants and the lowest of destimulants (Table 5).
Compared to the general population of households, this category had 2.5 times higher equivalent disposable income, 2 times higher equivalent consumption expenditures, and 1.5 times higher savings rates (45%). Additionally, their food and housing shares were both half the general averages, constituting 16% and 10%, respectively (Table 5). This category showed a left-skewed distribution of income and consumption expenditures (Figure 7). The distributions of the savings rate and the shares of fixed expenditures had the smallest range compared to other categories. Moreover, only in this category did the distribution of the savings rate not include negative values (Figure 7 and Figure 8).
Households with high assessment had approximately one-third higher incomes and consumer expenditures (Table 5), with right-skewed distributions similar to Class I (Figure 7). The distribution of the savings rate included negative values and exhibited left-skewed asymmetry, similar to the other two classes with lower assessments (Figure 7). The shares of fixed expenditures in consumer spending was about 25% lower than the overall average for households from 2018 to 2022 (Table 5).
Households with medium assessment were the most numerous each year, comprising 51% to 53% of urban and 58% to 61% of rural households. The partial indices in this class were closest to the overall average values. Indeed, the real incomes and expenditures were only 20% lower, the savings rate about 2 pp higher, and the two shares of fixed expenditures also 2–3 pp higher (Table 5). The distribution of the savings rate was strongly left-skewed (Figure 7), while the distributions of food and housing shares varied widely with the broadest range of all classes (Figure 8).
Households with low or very low assessments had lower values of stimulants and higher values of destimulants compared to the general population. The real disposable income in this category was only 40% of the overall average, and consumer expenditures were just 60% (Table 5). The distribution of incomes and the savings rate was strongly left-skewed (Figure 7). In this class, food expenditures accounted for 41% of consumer spending, and housing expenditures for another 28%.

5. Discussion

The COVID-19 pandemic had far-reaching effects on the financial situation of households worldwide. Numerous studies indicate that the pandemic caused abrupt changes in income levels, consumption patterns, savings, and debt. In response to the ensuing economic crisis, governments of many countries implemented extensive financial support measures aimed at alleviating the pandemic’s negative consequences, including aid programs and stimulus packages [14,69,70,71].
A series of household surveys conducted in April, June, and September of 2020 by Kalinowski et al. [72] revealed growing worries about worsening financial situations and rising poverty but only in the April round, scarcely two months after epidemic was declared in Poland. In the June and September rounds, respondents’ optimism increased. It is easy to imagine that the unprecedented spread of the pandemic and the fear of its consequences likely increased worries about households’ economic future. Soon, however, despite the initial shock and lockdowns, the favorable labor market conditions (decline in unemployment) and rising income levels improved social sentiments [18,20,67].
As shown in this paper, the income situation of Polish households improved steadily until 2021. Research by Dudek and Landmesser-Rusek [73] confirms that average real incomes of Polish households increased in 2019–2020, unlike their decline in the EU-27. The rapid implementation of organizational and legal measures under the Anti-Crisis Shield undoubtedly contributed to this favorable development in Poland. Adamowicz’s [20] research shows that these measures effectively mitigated the negative effects of the economic shock caused by the pandemic. Poland’s broad and successful anti-crisis measures warrant further study in the context of inevitable future health crises.
The increase in savings, one of the most visible effects of the pandemic, stemmed from two distinct reasons. One was the forced reduction in consumption due to lockdowns, and the other—a precautionary motive arising from uncertainty about the future [18,74,75,76]. Limited access to goods and services, such as travel and dining out, led many households to reduce their spending, which clearly boosted their savings.
The pandemic period created conditions that made it easier to break the consumption lock–maintaining current consumption despite declining income by using accumulated savings or incurring new obligations. As highlighted by Kalinowski et al. [72], during a crisis, all households face the same constraints, making it easier to accept their economic downturn, lower aspirations, and in the process boost savings, or at least prevent further debt accretion. During economic prosperity, households have higher aspirations and are more likely to view their standard of living unfavorably, at least relative to that of their neighbors. However, during the pandemic, widespread information about deteriorating economic conditions makes it easier to reassess their situation as comparatively comfortable. Additionally, pandemic restrictions—such as limited access to leisure services—allow wealthier households to lower their aspirations for luxury services, while poorer households that never used these services before the pandemic do not feel worse off. Indeed, one of the main results of this study is that, in Poland, the percentage of households saving regularly or irregularly increased after the outbreak, while the percentage of those who could save but did not decreased, reflecting a growing awareness of the need for savings triggered by the pandemic.
The literature also highlights the problem of rising debt during the pandemic, especially among households that experienced job losses or reduced wages. As households faced declining incomes and growing living costs, many resorted to loans to finance their consumption [70]. The rise in debt during difficult times is particularly concerning, as it can lead to long-term financial problems if not addressed. However, this problem did not significantly affect Poland, where the percentage of households without loans or credit increased after the outbreak. According to Szustak et al. [19], this phenomenon is due to the stronger aversion to debt, long observed among Polish households.
Korzeniowska et al. [18] note that the COVID-19 pandemic led to factors that could negatively impact household incomes. These included repeated lockdowns, temporary closure of some industries, reduced wages and working hours. However, after comparing 2019 and 2020 data, the authors found an improvement in income levels across all residential locality classes. The research conducted in this study aligns with these findings, indicating a systematic improvement in the income situation of urban and rural households from 2018 to 2021, with only a slight decline in 2022.
Revealed rural–urban differences in unidimensional indicators find their confirmation in literature. Many studies on Polish households continue to highlight the place of residence as a significant factor differentiating income acquisition opportunities, income distribution, and income inequalities [21,22,77], expenditure patterns [68], consumption deficiencies [78], material deprivation, and poverty [73,79]. These studies consistently show that, compared to urban households, rural ones still experience lower income levels, higher inequality, consumption deficiencies, and poverty—all despite the dynamic transformations in rural areas [80,81] and noticeable convergence processes [21,77]. Perhaps the novel result obtained in this study is the convergence-inducing impact of the pandemic. Indeed, its slump years were less detrimental and the recovery year more beneficial to the rural households. These findings resonate with the most critical aspects of socio-economic cohesion—a priority among national policies and a cornerstone of the European Union’s sustainable development strategy.

6. Conclusions

With the onset of the COVID-19 pandemic, Polish households grew increasingly concerned about their future financial situation, and the looming specter of poverty [18]. Korzeniowska et al. [71] emphasized that repeated lockdowns during the pandemic could negatively impact household incomes. Government measures to curb the pandemic focused on maintaining social distance and limiting mobility. Consequently, restrictions on certain activities (e.g., tourism, entertainment, gastronomy, cosmetic and hairdressing services), ensuing stoppages, shift work, and reduced working hours could lead to a significant reduction in household incomes. Additionally, individuals who came down with the disease or were quarantined also would earn less.
This study shows that, compared to 2019, the pandemic caused a statistically significant deterioration of household financial situation in 2020 and 2022. Conversely, the slight improvement in 2021 was not statistically significant. It is important to note that in 2022, the pandemic crisis was compounded by the outbreak of the Russia-Ukraine war in February. Thus, the results only partially answered the first research question (RQ1) positively.
A unidimensional analysis of selected financial indicators did not yield clear results in assessing changes in household financial situation during the pandemic. Some indicators implied an improvement, while others suggested deterioration. Positive changes included an increase in real disposable income (2018–2021, with a decline in 2022), a rise in the savings rate (only in 2020), and growing percentage of households saving regularly or irregularly, or having no debt throughout the study period. Conversely, negative changes encompassed an increase in budget shares spent on food and non-alcoholic beverages in the first year of the pandemic, which decreased in subsequent years but remained higher than pre-pandemic levels. This was mainly the ripple effect of panic buying and stockpiling caused by fears of supply chain disruptions and food shortages. Limited access to various catering services also led to increased food expenditures in household budgets.
A multidimensional analysis of the financial situation revealed a slight deterioration in household finances in 2020. Both urban and rural areas saw fewer households with high or very high financial assessments and more households with low or very low assessments. An improvement in 2021 temporarily reversed those changes, showing an increase in households with high or very high financial assessments and a slight decrease in those with low or very low assessments. The year 2022 brought more substantial adverse changes than 2020, indicating a pronounced deterioration in the household financial situation.
Although rural households consistently presented a worse financial situation than urban ones throughout the study period, the difference did not remain constant. In 2020, the rural–urban gap changed very little from its pre-pandemic level. It widened significantly in 2021 but shrank in 2022 to a level beyond what was observed in 2019. However, this last change was not significant at the 0.05 p-value level. This allowed a negative answer to the second research question (RQ2).
The authors contributed to the literature by identifying the impact of the COVID-19 pandemic on the financial situation of urban and rural households in Poland. The added value of the research lies in the use of large databases (over 150,000 records) and the individual synthetic assessment of the financial situation using the TOPSIS method for each analyzed household. Previously, in the literature, this method was applied to data aggregated across various dimensions.

7. Limitations and Recommendations

Studying complex phenomena—such as the assessment of household financial situations—requires the use of composite indicators whose construction is based on multidimensional methods, as unidimensional explorations may often yield ambiguous results. Through the multidimensional analysis of household financial situations, this study contributes to the understanding of the pandemic’s overall effects on household finances, and the varying exposure of rural and urban households to those effects. This contribution may constitute a first step on the road to a systematic effort of developing effective strategies to counteract the effects in the future.
The research, however, is not without weaknesses. Given that in household budget surveys it is often easier to obtain respondents’ subjective opinions than values of objective indicators, those subjective factors play an increasingly important role in analyzing household financial behavior [82]. Further research, possibly borrowing some methods from behavioral economics, should also focus on developing schemes for constructing synthetic indicators that incorporate subjective factors, often measured on weak scales.
Indeed, limited data availability, caused by respondents’ reluctance to answer questions about their objective assets or debt levels, and the lack of a clear definition of financial situation, necessitates further research to standardize the set of financial situation indicators. This standardization would reduce the arbitrariness of approaches to studying this complex concept in the future.
Given the significant heterogeneity of urban and rural households, future research should consider the degree of urbanization in these areas. This approach would explore the differences in financial situations between households in smaller towns and metropolises, and in functionally distinct rural areas. The diversity of the latter is so important that the Central Statistical Office introduced in 2023 HBS an additional classification criterion.

Author Contributions

Conceptualization, A.W., R.G.-W., J.S., A.O. and T.O; methodology, A.W. and R.G.-W.; software, A.W.; validation, A.W., R.G.-W., J.S., A.O. and T.O.; formal analysis, A.W., R.G.-W., J.S., A.O. and T.O.; investigation, A.W., R.G.-W. and J.S.; resources, A.W., R.G.-W., J.S., A.O. and T.O.; data curation, A.W.; writing—original draft preparation, A.W., R.G.-W. and J.S.; writing—review and editing, A.W., R.G.-W., J.S., A.O. and T.O.; visualization, A.W. and R.G; supervision, A.W., R.G.-W., J.S., A.O. and T.O.; project administration, A.W., R.G.-W. and J.S.; funding acquisition, J.S. All authors have read and agreed to the published version of the manuscript.

Funding

The research was financed from resources of the Faculty of Economics, Poznań University of Life Sciences.

Institutional Review Board Statement

Not applicable.

Informed Consent Statement

Not applicable.

Data Availability Statement

The original contributions presented in the study are included in the article, further inquiries can be directed to the corresponding author.

Acknowledgments

The authors A.O. and T.O. were supported by Portuguese funds, by The Portuguese Foundation for Science and Technology (FCT), through the project UIDB/Multi/00006/2020.

Conflicts of Interest

The authors declare no conflicts of interest.

Appendix A

# This is a (simplified) TOPSIS function coded in R
library(tidyverse)
TOPSIS <- function(X, stims){
# X holds all partial variables
# stims identifies which variables in X are stimulants
# Transform X to get normalized Z
X %>%
# winsorize 5% top & 5% bottom of the variables
mutate(across(everything(), DescTools::Winsorize)) %>%
# perform min-max normalization
mutate(across(all_of(stims), ~ (.x-min(.x))/(max(.x)-min(.x)))) %>%
mutate(across(-all_of(stims), ~ (max(.x)-.x)/(max(.x)-min(.x)))) -> Z
# The ideal in Z is now a vector of 1’s and the anti-ideal is a vector of 0’s
# Calculate distances from the anti-ideal and ideal
Z %>% mutate(across(everything(), ~ (.x-0)^2)) %>%
mutate(dminus2 = rowSums(.)) %>% pluck(“dminus2”) %>% sqrt -> dminus
Z %>% mutate(across(everything(), ~ (.x-1)^2)) %>%
mutate(dplus2 = rowSums(.)) %>% pluck(“dplus2”) %>% sqrt -> dplus
# Calculate and return the synthetic index q
dminus/(dminus + dplus) -> q
q
}
# Example execution:
X %>% TOPSIS(stims = c(1,2,3))

References

  1. Rozporządzenie Ministra Zdrowia z dnia 20 marca 2020 r. w sprawie ogłoszenia na obszarze Rzeczypospolitej Polskiej stanu epidemii. Dz.U. z 2020; r. poz. 491 (Regulation of the Health Minister on the declaration of a state of epidemic in the territory of the Republic of Poland. J. Laws 2020; item 491). Available online: https://isap.sejm.gov.pl/isap.nsf/download.xsp/WDU20200000491/O/D20200491.pdf (accessed on 2 May 2024).
  2. Rozporządzenie Ministra Zdrowia z dnia 12 maja 2022 r. w sprawie ogłoszenia na obszarze Rzeczypospolitej Polskiej stanu zagrożenia epidemicznego. Dz.U. z 2022; r. poz. 1028 (Regulation of the Health Minister on the declaration of a state of epidemic emergency in the territory of the Republic of Poland. J. Laws 2022; item 1028). Available online: https://isap.sejm.gov.pl/isap.nsf/download.xsp/WDU20220001028/O/D20221028.pdf (accessed on 2 May 2024).
  3. Rozporządzenie Ministra Zdrowia z dnia 14 czerwca 2023 r. w sprawie odwołania na obszarze Rzeczypospolitej Polskiej stanu zagrożenia epidemicznego. Dz.U. z 2023; r. poz. 1118 (Regulation of the Health Minister on the revocation of a state of epidemic emergency in the territory of the Republic of Poland. J. Laws 2023; item 1118). Available online: https://isap.sejm.gov.pl/isap.nsf/download.xsp/WDU20230001118/O/D20231118.pdf (accessed on 2 May 2024).
  4. ESPON. Geography of COVID-19 Outbreak and First Policy Responses in European Regions and Cities. Final Report; ESPON: Luxembourg, 2021. [Google Scholar]
  5. Hołoga, D.; Winiarski, J. Ocena ekonomiczno-społeczna skutków walki z pandemią COVID-19 w Szwecji—Zasoby, działania, rezultaty. Współczesna Gospod. 2021, 12, 11–30. [Google Scholar]
  6. Bourdin, S.; Jeanne, L.; Nadou, F.; Noiret, G. Does lockdown work? A spatial analysis of the spread and concentration of COVID-19 in Italy. Reg. Stud. 2021, 55, 1182–1193. [Google Scholar] [CrossRef]
  7. Goodman-Bacon, A.; Marcus, J. Using difference-in-differences to identify causal effects of COVID-19 policies. Surv. Res. Methods 2020, 14, 153–158. [Google Scholar] [CrossRef]
  8. Born, B.; Dietrich, A.M.; Müller, G.J. The lockdown effect: A counterfactual for Sweden. PLoS ONE 2021, 16, e0249732. [Google Scholar] [CrossRef] [PubMed]
  9. ESPON. Territorial Impacts of COVID-19 and Policy Responses in European Regions and Cities. Final Report; ESPON: Luxembourg, 2022. [Google Scholar]
  10. Bourdin, S.; Cottereau, V.; Hermet, F.; Jean-Pierre, P.; Medeiros, E. How have Europe’s outermost regions dealt with the economic and social consequences of the COVID-19 crisis? Effects, policies and recommendations. Reg. Sci. Policy Pract. 2023, 15, 1820–1841. [Google Scholar] [CrossRef]
  11. Albacete, N.; Fessler, P.; Kalleitner, F.; Lindner, P. How has COVID-19 affected the financial situation of households in Austria? Monetary Policy & the Economy, Oesterreichische Nationalbank (Austrian Central Bank). 2021, issue Q4/20–Q1/21, 111–130. Available online: https://www.oenb.at/dam/jcr:d05a7f28-e7aa-43b8-b54d-9ffbe5ff3861/07_mop_Q4_20-Q1_21_How-has-COVID-19-affected-the-financial-situation.pdf (accessed on 2 May 2024).
  12. Tokarz-Kocik, A.; Bera, A.; Drela, K.; Malkowska, A. The Impact of the COVID-19 Pandemic on the Labour Market in the Hotel Industry: Selected Conditions in Poland. Sustainability 2023, 15, 4886. [Google Scholar] [CrossRef]
  13. Zawadka, J.; Jęczmyk, A.; Wojcieszak-Zbierska, M.M.; Niedbała, G.; Uglis, J.; Pietrzak-Zawadka, J. Socio-Economic Factors Influencing Agritourism Farm Stays and Their Safety during the COVID-19 Pandemic: Evidence from Poland. Sustainability 2022, 14, 3526. [Google Scholar] [CrossRef]
  14. Nicolis, O.; Maidana, J.P.; Contreras, F.; Leal, D. Analyzing the Impact of COVID-19 on Economic Sustainability: A Clustering Approach. Sustainability 2024, 16, 1525. [Google Scholar] [CrossRef]
  15. Bloom, N.; Bunn, P.; Mizen, P.; Smietanka, P.; Thwaites, G. The Impact of COVID-19 on Productivity. LSE Research Online Documents on Economics 121314, London School of Economics and Political Science, LSE Library. 2023. Available online: http://www.nber.org/papers/w28233.pdf (accessed on 2 May 2024).
  16. Pak, A.; Adegboye, O.A.; Adekunle, A.I.; Rahman, K.M.; McBryde, E.S.; Eisen, D.P. Economic Consequences of the COVID-19 Outbreak: The Need for Epidemic Preparedness. Front. Public Health 2020, 8, 241. [Google Scholar] [CrossRef]
  17. Clemente-Suárez, V.J.; Navarro-Jiménez, E.; Jimenez, M.; Hormeño-Holgado, A.; Martinez-Gonzalez, M.B.; Benitez-Agudelo, J.C.; Perez-Palencia, N.; Laborde-Cárdenas, C.C.; Tornero-Aguilera, J.F. Impact of COVID-19 Pandemic in Public Mental Health: An Extensive Narrative Review. Sustainability 2021, 13, 3221. [Google Scholar] [CrossRef]
  18. Korzeniowska, A.M.; Rutecka-Góra, J.; Swacha-Lech, M.; Waliszewski, K. Wpływ Pandemii COVID 19 na Finanse Osobiste; Wydawnictwo Uniwersytetu Ekonomicznego we Wrocławiu: Wrocław, Poland, 2023. [Google Scholar]
  19. Szustak, G.; Gradoń, W.; Szewczyk, Ł. Household financial situation during the COVID-19 pandemic with particular emphasis on savings—An evidence from Poland compared to other CEE states. Risks 2021, 9, 166. [Google Scholar] [CrossRef]
  20. Adamowicz, M. COVID-19 Pandemic as a Change Factor in the Labour Market in Poland. Sustainability 2022, 14, 9197. [Google Scholar]
  21. Wołoszyn, A. Nierówności dochodowe gospodarstw domowych w Polsce i ich uwarunkowania społeczno-ekonomiczne (Income Inequalities of Households in Poland and Their Socio-Economic Conditions); PWN: Warsaw, Poland, 2020. [Google Scholar]
  22. Wołoszyn, A.; Wysocki, F. Income inequality of Polish rural and urban households in 2010–2017. Ann. Pol. Assoc. Agric. Agribus. Econ. 2020, 22, 360–368. [Google Scholar] [CrossRef]
  23. French, D.; Vigne, S. The causes and consequences of household financial strain: A systematic review. Int. Rev. Financ. Anal. 2019, 62, 150–156. [Google Scholar] [CrossRef]
  24. Leszczyńska, M. Ocena społecznego zrównoważenia rozwoju w Polsce według kryterium dynamiki dochodów gospodarstw domowych. Nierówności Społeczne Wzrost Gospod. 2014, 37, 410–420. [Google Scholar]
  25. Rólczyński, T. The financial situation of Polish households—An assessment. Cent. East. Eur. J. Manag. Econ. 2013, 1, 177–193. [Google Scholar]
  26. Bucher-Koenen, T.; Fessler, P.; Silgoner, M.A. Households’ Financial Resilience, Risk Perceptions, and Financial Literacy: Evidence from a Survey Experiment; ZEW Discussion Papers, No. 23–074; ZEW—Leibniz-Zentrum für Europäische Wirtschaftsforschung, Mannheim, Germany, 2023. Available online: https://hdl.handle.net/10419/283612 (accessed on 29 April 2024).
  27. Sokół, M.; Paździor, A.; Zienkiewicz, K. Postrzeganie sytuacji finansowej gospodarstw domowych w Polsce w warunkach niepewności (Perception of the financial situation of households in Poland in conditions of uncertainty). J. Mod. Sci. 2023, 5, 427–447. [Google Scholar] [CrossRef]
  28. Paździor, A.; Majek, A. Impact of COVID-19 on Household’s Financial Situation in Poland. Eur. Res. Stud. J. 2021, XXIV, 492–502. [Google Scholar] [CrossRef]
  29. Świecka, B.; Musiał, M. Diagnoza finansów gospodarstw domowych w największych miastach Polski. Finans. Rynk. Finans. Ubezpieczenia 2016, 82, 821–832. [Google Scholar]
  30. Jones, C.A. Farm Household Well-Being Comparing Consumption and Income-Based Measures; Economic Research Report, No 9; USDA: Washington, DC, USA, 2010. [Google Scholar]
  31. Kozera, A.; Stanisławska, J.; Wysocki, F. Sytuacja finansowa gospodarstw domowych zamieszkujących obszary wiejskie w Polsce po wstąpieniu Polski do Unii Europejskiej. Rocz. Nauk. Ekon. Rol. I Rozw. Obsz. Wiej. 2014, 101, 91–101. [Google Scholar] [CrossRef]
  32. Wereda, W.; Prokopowicz, D. Economic and financial situation of households in Poland—Analysis and diagnosis. Polityki Europejskie Finans. Mark. 2017, 18, 24–258. [Google Scholar]
  33. Fasianos, A.; Lydon, R. Do households with debt cut back their consumption more? New evidence from the United Kingdom. Bull. Econ. Res. 2022, 74, 737–760. [Google Scholar] [CrossRef]
  34. Schlagenhauf, D.; Garriga, C. Identifying “Default Thresholds” in Consumer Liabilities Using High Frequency Data; Meeting Papers; Society for Economic Dynamics: 2017; No. 1305. Available online: https://red-files-public.s3.amazonaws.com/meetpapers/2017/paper_1305.pdf (accessed on 2 May 2024).
  35. Mazurek-Krasodomska, E. Sytuacja finansowa gospodarstw domowych i jej determinanty. Pr. Nauk. Uniw. Ekon. We Wrocławiu 2011, 174, 550–561. [Google Scholar]
  36. Zalega, T. Assessment of the financial situation, determinants and the level of debt of seniors’ households. Nierówności Społeczne Wzrost Gospod. 2018, 55, 41–59. [Google Scholar] [CrossRef]
  37. Kolasa, A. Sytuacja finansowa Sektora Gospodarstw Domowych w I kw. 2017 r; Departament Analiz Ekonomicznych NBP: Warszawa, Poland, 2017; Volume 3. [Google Scholar]
  38. Wołoszyn, A.; Kozera, A.; Głowicka-Wołoszyn, R.; Stanisławska, J. Nierówności dochodowe w różnych typach funkcjonalnych gmin wiejskich województwa wielkopolskiego (Income inequalities across functional types of rural communes of the Wielkopolska province). Zesz. Nauk. PTE Zielona Góra 2016, 5, 123–135. [Google Scholar]
  39. CSO (Statistics Poland—CSO). Zeszyt metodologiczny. Badanie budżetów gospodarstw domowych (Methodological Notebook. Household Budget Survey); GUS: Warsaw, Poland, 2018. [Google Scholar]
  40. Kahneman, D.; Krueger, A.B. Developments in the measurement of subjective well-being. J. Econ. Perspect. 2006, 20, 3–24. [Google Scholar] [CrossRef]
  41. Gerrans, P.; Speelman, C.; Campitelli, G. The Relationship Between Personal Financial Wellness and Financial, Wellbeing: A Structural Equation Modelling Approach. J. Fam. Econ. 2014, 35, 145–160. [Google Scholar] [CrossRef]
  42. CSO (Statistics Poland—CSO). Household Budget Survey. Unpublished database, unidentifiable microdata for 2018–2022.
  43. Wołoszyn, A.; Głowicka-Wołoszyn, R. Dochód i wykształcenie jako determinanty stopy oszczędności gospodarstw domowych w Polsce. Zesz. Nauk. Uniw. Szczecińskiego 2015, 74, 733–743. [Google Scholar]
  44. Dudek, H. Skale Ekwiwalentności—Estymacja na Podstawie Kompletnych Modeli Popytu; Wydawnictwo SGGW: Warszawa, Poland, 2011. [Google Scholar]
  45. Łuczak, A.; Kalinowski, S. Assessing the level of the material deprivation of European Union countries. PLoS ONE 2020, 15, e0238376. [Google Scholar] [CrossRef] [PubMed]
  46. Roszkowska, E.; Filipowicz-Chomko, M.; Wachowicz, T. Wykorzystanie metody TOPSIS do oceny zróżnicowania rozwoju województw Polski w latach 2010–2014 w kontekście kształtowania się ładu instytucjonalnego. Pr. Nauk. Uniw. Ekon. We Wrocławiu 2017, 469, 149–158. [Google Scholar]
  47. Głowicka-Wołoszyn, R.; Wołoszyn, A.; Wysocki, F. Quality of life in farmers’ households assessment with TOPSIS method. In Proceedings of the 2018 International Scientific Conference “Economic Sciences for Agribusiness and Rural Economy”, Warsaw, Poland, 7–8 June 2018; Warsaw University of Life Sciences Press: Warsaw, Poland, 2018; pp. 257–263. [Google Scholar]
  48. Hellwig, Z. On the Problem of Weighting in International Comparisons. In Study VII of the UNESCO Statistical Office, Towards a System of Quantitative Indicators of Components of Human Resources Indicators Development; UNESCO: Paris, France, 1969. [Google Scholar]
  49. Hwang, C.L.; Yoon, K. Multiple Attribute Decision-Making: Methods and Applications; Springer: Berlin, Germany, 1981. [Google Scholar]
  50. Wysocki, F. Metody Taksonomiczne w Rozpoznawaniu Typów Ekonomicznych Rolnictwa i Obszarów Wiejskich (Taxonomic Methods in Recognizing Economic Types of Agriculture and Rural Areas); Wydawnictwo Uniwersytetu Przyrodniczego w Poznaniu: Poznań, Poland, 2010. [Google Scholar]
  51. Tukey, J.W. Exploratory Data Analysis; Addison-Wesley: Boston, MA, USA, 1977. [Google Scholar]
  52. Głowicka-Wołoszyn, R.; Wysocki, F. Right-Skewed distribution of features and the identification problem of the financial autonomy of local administrative units. In Classification and Data Analysis. SKAD 2019. Studies in Classification, Data Analysis, and Knowledge Organization; Jajuga, K., Batóg, J., Walesiak, M., Eds.; Springer: Berlin/Heidelberg, Germany, 2020; pp. 251–264. [Google Scholar]
  53. Stępień, S.; Polcyn, J.; Borychowski, M. Determinanty zrównoważonego rozwoju ekonomiczno-społecznego rodzinnych gospodarstw rolnych w Polsce. Ekonomista 2021, 1, 56–86. [Google Scholar] [CrossRef]
  54. Wiśniewski, J.W. Korelacja i regresja w decyzjach kadrowych. Stud. Ekon. Zesz. Nauk. Uniw. Ekon. Katowicach 2015, 242, 245–254. [Google Scholar]
  55. Bywalec, C. Ekonomika i Finanse Gospodarstw Domowych; Wydawnictwo Naukowe PWN: Warszawa, Poland, 2009. [Google Scholar]
  56. EUROSTAT. Total Unemployment Rate. Available online: https://ec.europa.eu/eurostat/databrowser/view/tps00203/default/table (accessed on 29 April 2024).
  57. CSO (Central Statistical Office—CSO). Aktywność ekonomiczna ludności Polski—4 kwartał 2022 r. (Labour force Survey in Poland—Quarter 4/2022); GUS: Warsaw, Poland, 2023. [Google Scholar]
  58. Ustawa z dnia 31 marca 2020 r. o zmianie ustawy o szczególnych rozwiązaniach związanych z zapobieganiem, przeciwdziałaniem i zwalczaniem COVID-19, innych chorób zakaźnych oraz wywołanych nimi sytuacji kryzysowych oraz niektórych innych ustaw. Dz.U. 2020; poz. 568 (Act of 31 March 2020 amending the Act on special solutions related to the prevention, counteraction and combating of COVID-19, other infectious diseases and crisis situations caused by them and certain other acts. J. Laws 2020; item 568). Available online: https://isap.sejm.gov.pl/isap.nsf/download.xsp/WDU20200000568/O/D20200568.pdf (accessed on 2 May 2024).
  59. Dębkowska, K.; Kłosiewicz-Gorecka, U.; Szymańska, A.; Ważniewski, P.; Zybertowicz, K. Tarcza Antykryzysowa… Koło ratunkowe dla firm i gospodarki? Gniazdowski, M., Kubisiak, A., Kutwa, K., Rybacki, J. (współpr.); Polski Instytut Ekonomiczny: Warsaw, Poland, 2021. [Google Scholar]
  60. Ustawa z dnia 16 kwietnia 2020 r. o szczególnych instrumentach wsparcia w związku z rozprzestrzenianiem się wirusa SARS-CoV-2. Dz.U. 2020; poz. 695 (Act of 16 April 2020 on special support instruments in connection with the spread of the SARS-CoV-2 virus. J. Laws 2020; item 695). Available online: https://isap.sejm.gov.pl/isap.nsf/download.xsp/WDU20200000695/O/D20200695.pdf (accessed on 2 May 2024).
  61. Ustawa z dnia 14 maja 2020 r. o zmianie niektórych ustaw w zakresie działań osłonowych w związku z rozprzestrzenianiem się wirusa SARS-CoV-2. Dz.U. 2020; poz. 875 (Act of 14 May 2020 amending certain acts on protective measures in connection with the spread of the SARS-CoV-2 virus. J. Laws 2020; item 875). Available online: https://isap.sejm.gov.pl/isap.nsf/download.xsp/WDU20200000875/O/D20200875.pdf (accessed on 2 May 2024).
  62. Ustawa z dnia 19 czerwca 2020 r. o dopłatach do oprocentowania kredytów bankowych udzielonych przedsiębiorcom dotkniętym skutkami COVID-19 oraz o uproszczonym postępowaniu o zatwierdzenie układu w związku z wystąpieniem COVID-19. Dz.U. 2020; poz. 1086 (Act of 19 June 2020 on subsidies to interest on bank loans granted to entrepreneurs affected by the effects of COVID-19 and on simplified proceedings for approval of an arrangement in connection with the occurrence of COVID-19. J. Laws 2020; item 1086). Available online: https://isap.sejm.gov.pl/isap.nsf/download.xsp/WDU20200001086/O/D20201086.pdf (accessed on 2 May 2024).
  63. Ustawa z dnia 17 września 2020 r. o zmianie ustawy o szczególnych rozwiązaniach związanych z zapobieganiem, przeciwdziałaniem i zwalczaniem COVID-19, innych chorób zakaźnych oraz wywołanych nimi sytuacji kryzysowych oraz niektórych innych ustaw. Dz.U. 2020; poz. 1639 (Act of 17 September 2020 amending the Act on special solutions related to the prevention, counteracting and combating of COVID-19, other infectious diseases and crisis situations caused by them and certain other acts. J. Laws 2020; item 1639). Available online: https://isap.sejm.gov.pl/isap.nsf/download.xsp/WDU20200001639/O/D20201639.pdf (accessed on 2 May 2024).
  64. Ustawa z dnia 9 grudnia 2020 r. o zmianie ustawy o szczególnych rozwiązaniach związanych z zapobieganiem, przeciwdziałaniem i zwalczaniem COVID-19, innych chorób zakaźnych oraz wywołanych nimi sytuacji kryzysowych oraz niektórych innych ustaw. Dz.U. 2020; poz. 2255 (Act of 9 December 2020 amending the Act on special solutions related to the prevention, counteraction and combating of COVID-19, other infectious diseases and crisis situations caused by them and certain other acts. J. Laws 2020; item 2255). Available online: https://isap.sejm.gov.pl/isap.nsf/download.xsp/WDU20200002255/O/D20202255.pdf (accessed on 2 May 2024).
  65. Kańduła, S.; Przybylska, J. Financial instruments used by Polish municipalities in response to the first wave of COVID-19. Public Organ. Rev. 2021, 21, 665–686. [Google Scholar] [CrossRef]
  66. Dvorak, J. Response of the Lithuanian municipalities to the First Wave of COVID-19. Balt. Reg. 2021, 13, 70–88. [Google Scholar] [CrossRef]
  67. Słomba, A.; Palac, P. Wpływ pandemii COVID-19 oraz wojny rosyjsko-ukraińskiej na wskaźnik kondycji gospodarstw domowych w Polsce (The impact of the COVID-19 pandemic and the war Russian-Ukrainian war on the condition index of the households in Poland). Probl. Econ. Law 2023, 8, 57–68. [Google Scholar] [CrossRef]
  68. Mieszała, M.; Głowicka-Wołoszyn, R.; Wołoszyn, A.; Stanisławska, J. Consumer expenditure of rural households in Poland. Ann. Pol. Assoc. Agric. Agribus. Econ. 2023, 25, 232–242. [Google Scholar] [CrossRef]
  69. Baker, S.R.; Robert, F.A.; Meyer, S.; Pagel, M. Constantine Yannelis, How Does Household Spending Respond to an Epidemic? Consumption during the 2020 COVID-19 Pandemic. Rev. Asset Pricing Stud. 2020, 10, 834–862. [Google Scholar] [CrossRef]
  70. Dursun-de Neef, Ö.H.; Schandlbauer, A. COVID-19, bank deposits, and lending. J. Empir. Financ. 2022, 68, 20–33. [Google Scholar] [CrossRef]
  71. Ren, H.; Zheng, Y. COVID-19 vaccination and household savings: An economic recovery channel. Financ. Res. Lett. 2023, 54, 103711. [Google Scholar] [CrossRef]
  72. Kalinowski, S.; Łuczak, A.; Koziolek, A. The Social Dimension of Security: The Dichotomy of Respondents’ Perceptions during the COVID-19 Pandemic. Sustainability 2022, 14, 1363. [Google Scholar] [CrossRef]
  73. Dudek, H.; Landmesser-Rusek, J. What explains the differences in material deprivation between rural and urban areas in Poland before and during the COVID-19 pandemic? Stat. Transit. New Ser. 2023, 24, 37–52. [Google Scholar] [CrossRef]
  74. Coibion, O.; Gorodnichenko, Y.; Weber, M. The Cost of the COVID-19 Crisis: Lockdowns, Macroeconomic Expectations, and Consumer Spending; National Bureau of Economic Research: Cambridge, MA, USA, 2020; Working Paper No. 27141; Available online: https://www.nber.org/system/files/working_papers/w27141/w27141.pdf (accessed on 2 May 2024).
  75. Baker, S.R.; Farrokhnia, R.A.; Meyer, S.; Pagel, M.; Yannelis, C. How does household spending respond to an epidemic? Consumption during the 2020 COVID-19 pandemic. Rev. Asset Pricing Stud. 2020, 10, 834–862. [Google Scholar] [CrossRef]
  76. Spatt, C.S. A Tale of Two Crises: The 2008 Mortgage Meltdown and the 2020 COVID-19 Crisis. Rev. Asset Pricing Stud. 2020, 10, 759–790. [Google Scholar] [CrossRef]
  77. Wołoszyn, A.; Głowicka-Wołoszyn, R. Income inequality of rural households and the sources of their income. Ann. Pol. Assoc. Agric. Agribus. Econ. 2024, 26, 324–337. [Google Scholar]
  78. Kozera, A.; Głowicka-Wołoszyn, R.; Stanisławska, J. Niedobory konsumpcji w gospodarstwach domowych rolników po wstąpieniu Polski do UE. Rocz. Nauk. SERiA 2014, 16, 274–280. [Google Scholar]
  79. Kalinowski, S. Ubóstwo i wykluczenie na wsi. In Polska Wieś 2022. Raport o Stanie Wsi; Wilkin, J., Hałasiewicz, A., Eds.; Wyd. FDPA, WN Scholar: Warszawa, Poland, 2022; pp. 153–169. [Google Scholar]
  80. Heffner, K.; Twardzik, M. Rural areas in Poland—Changes since joining the European Union. Eur. Countrys. 2022, 14, 420–438. [Google Scholar] [CrossRef]
  81. Stanny, M.; Rosner, A.; Komorowski, Ł. Monitoring rozwoju obszarów wiejskich. Etap IV. Dekada przemian społeczno-gospodarczych (Monitoring of Rural Development. Stage IV. A Decade of Socio-Economic Changes); Fundacja Europejski Fundusz Rozwoju Wsi Polskiej, Instytut Rozwoju Wsi i Rolnictwa PAN: Warszawa, Poland, 2023. [Google Scholar]
  82. Grzywińska-Rąpca, M.; Grzybowska-Brzezińska, M. Financial Situation In The Assessments of the Head of the Household and their Relationship with Debt in Different Phases of the Life Cycle: A Case Study (Poland). J. East. Eur. Res. Bus. Econ. 2023, 2023, 426741. [Google Scholar] [CrossRef]
Figure 1. Schematic of research stages. Source: own elaboration.
Sustainability 16 08516 g001
Figure 2. Trends in income, consumption expenditures, and savings rates in households: all (a), urban (b) and rural (c). Source: own elaboration based on non-identifiable microdata from BBGD [42].
Sustainability 16 08516 g002aSustainability 16 08516 g002b
Figure 3. Trends in saving behaviors in households: all (a), urban (b), and rural (c). Source: own elaboration based on non-identifiable microdata from BBGD [42].
Sustainability 16 08516 g003
Figure 4. Trends in debt behaviors in households: all (a), urban (b), and rural (c). Source: own elaboration based on non-identifiable microdata from BBGD [42].
Sustainability 16 08516 g004
Figure 5. Trends in the shares of fixed expenditures in households: all (a), urban (b), and rural (c). Source: own elaboration based on non-identifiable microdata from BBGD [42].
Sustainability 16 08516 g005
Figure 6. Classification of urban and rural households based on the synthetic assessment of their financial situation. Source: own elaboration based on non-identifiable microdata from BBGD [42].
Sustainability 16 08516 g006
Figure 7. Distribution of partial indices—income (a), expenditures (b), and savings (c) across financial situation assessment classes. Source: own elaboration based on non-identifiable microdata from BBGD [42].
Sustainability 16 08516 g007aSustainability 16 08516 g007b
Figure 8. Distribution of partial indices—share of food and non-alcoholic beverages in consumption expenditures (a) and share of housing and energy in consumption expenditures (b) across financial situation assessment classes. Source: own elaboration based on non-identifiable microdata from BBGD [42].
Sustainability 16 08516 g008
Table 1. Classes of household financial situation from the values of the synthetic index.
ClassAssessment of Household Financial SituationRange of Synthetic Index (qi)
Ivery high⟨0.8; 1.0⟩
IIhigh⟨0.6; 0.8)
IIImedium⟨0.4; 0.6)
IVlow⟨0.2; 0.4)
Vvery low⟨0.0; 0.2)
Source: own elaboration based on [46].
Table 2. Poland’s unemployment rate in 2018–2022 across urban and rural areas.
YearQuarterUnemployment Rate in QuartersUnemployment Rate in Years
UrbanRuralPolandUrbanRuralPoland
2018I3.74.84.23.64.33.8
II3.53.83.6
III3.54.33.8
IV3.54.23.8
2019I3.74.33.93.23.43.3
II3.03.53.2
III3.03.23.1
IV3.02.72.9
2020I3.03.33.13.13.33.2
II3.13.23.1
III3.13.53.3
IV3.03.23.1
2021I4.04.04.03.33.43.4
II3.53.53.5
III3.03.13.0
IV2.73.22.9
2022I3.03.23.12.73.12.9
II2.52.82.6
III2.73.22.9
IV2.63.32.9
Source: own elaboration based on [57].
Table 3. Legal and organizational solutions of the Anti-Crisis Shields with potential impact on households’ financial situation.
For EmployeesFor Employers
  • Subsidies for employee wages (in case of downtime or reduced working hours)
  • Standstill benefit for employees
  • One-time standstill benefits for the self-employed and those working under specific contracts (commission and task-specific contracts)
  • Possibility of re-granting the standstill benefit
  • Possibility to offset losses incurred in 2020 by individuals whose revenues drop by half, in the PIT and CIT adjustments for 2019 and subsequent years
  • Extension for PIT submissions
  • Care allowance for parents of children under 8 due to the suspension of kindergartens and school activities
  • Standstill support for small and medium-sized enterprises and the self-employed
  • Non-repayable loan for micro-companies up to 5000 PLN
  • 3-month exemption from Social Security (ZUS) premiums for micro-entrepreneurs and the self-employed
  • Extension of the possibility of exemption from Social Security (ZUS) premiums
  • Support for rail transport, culture, education, gastronomy, tourism, and entertainment sectors
  • 3-month deferral of loan repayments, up to 5000 PLN
Source: own elaboration based on [58,59,60,61,62,63,64].
Table 4. Results of the regression analysis.
TermEstimateStandard Errort-Statisticp-Value
(Intercept)0.57890.0009643.26980.000
Y2020−0.00840.0013−6.58054.71×10−11
Y20210.00140.00131.05890.290
Y2022−0.00620.0013−4.85291.22×10−06
CLrural−0.03700.0014−25.71861.73×10−145
Y2020:CLrural0.00020.00200.08880.929
Y2021:CLrural−0.00500.0020−2.46380.014
Y2022:CLrural0.00370.00201.83490.067
R-squared0.0216
Adjusted R-squared0.0215
Sigma8.6081
AIC−127,029.05
Descriptive statistic (mean ± standard deviation)
Location class2019202020212022
rural0.542 ± 0.1180.534 ± 0.1140.538 ± 0.1150.539 ± 0.118
urban0.579 ± 0.1290.570 ± 0.1290.580 ± 0.1310.573 ± 0.132
all0.564 ± 0.1260.556 ± 0.1240.564 ± 0.1270.560 ± 0.128
Source: own elaboration.
Table 5. Characteristics of the classes of financial situation assessment.
Partial indexClass of Financial Situation AssessmentAll Households (2018–2022)
IIIIIIIV
Very HighHighMediumLow
real equivalent income (PLN/equivalent unit)89534881294814703645
real equivalent consumption expenditures (PLN/equivalent unit)44232980183513592250
savings rate (%)45.233.630.5−2.028.9
share of food and non-alcoholic beverages in consumption expenditures (%)16.324.434.741.031.3
share of housing and energy in consumption expenditures (%)9.915.222.228.120.1
Source: own elaboration based on non-identifiable microdata from BBGD [42].
Disclaimer/Publisher’s Note: The statements, opinions and data contained in all publications are solely those of the individual author(s) and contributor(s) and not of MDPI and/or the editor(s). MDPI and/or the editor(s) disclaim responsibility for any injury to people or property resulting from any ideas, methods, instructions or products referred to in the content.

