Article

A Sustainable Production Planning Scheme for New Energy Vehicles in China

1
School of Management, Guizhou University, Guiyang 550025, China
2
School of Tourism Management, Guizhou University of Commerce, Guiyang 550014, China
3
State Key Laboratory of Public Big Data, Guizhou University, Guiyang 550025, China
4
College of Science, Minzu University of China, Beijing 100081, China
*
Author to whom correspondence should be addressed.
Sustainability 2024, 16(19), 8543; https://doi.org/10.3390/su16198543
Submission received: 16 August 2024 / Revised: 4 September 2024 / Accepted: 26 September 2024 / Published: 30 September 2024
(This article belongs to the Special Issue Energy Saving and Emission Reduction from Green Transportation)

Abstract

:
The carbon emissions of new energy vehicles (NEVs)have transited from the use stage to the production stage, indicating that the environmental impact of NEVs in the manufacturing stage cannot be ignored. To reduce carbon emissions and maintain profits, this study proposes a fuzzy multi-objective optimization model to achieve a sustainable production planning scheme for NEVs. The proposed model not only considers the maximum profits of automobile enterprises but also the minimum target of carbon emissions in the production process, to coordinate the optimal production quantity. The results show that the output of NEVs in different price ranges has different proportions. The market share of blade electric vehicles is the highest, accounting for 39% of the NEV market, and the proportion of plug-in hybrid and blade electric vehicles is increasing. The sensitivity analysis further reflects the impact of government subsidy “recession” and body lightweight on the output, carbon emissions, and annual profits of NEVs in China. Accordingly, this paper provides policy implications for achieving a sustainable production planning scheme for NEVs in China.

1. Introduction

Transportation is a key area of fossil energy consumption and greenhouse gas emissions and has become one of the fastest growing areas of carbon emissions in China in recent years [1,2,3]. With the increasing number of traditional fuel vehicles, the excessive consumption of non-renewable energy and emissions of pollutants have seriously damaged the ecological environment. Therefore, more and more countries are developing and using clean energy as automotive fuel to mitigate the adverse impact on the environment [4,5]. China’s new energy vehicles (NEVs) have developed rapidly in recent years. NEVs development situation refers to the growth of the NEV industry, technological advances, market acceptance, and other aspects of their combined performance, which could ease energy and environmental pressures [5,6,7].
At present, alternative fuels for vehicles in China mainly include electric energy, hydrogen energy, and methanol, which have been promoted to varying degrees throughout China [8]. Previous studies only defined NEVs as blade electric vehicles (BEVs), plug-in hybrid electric vehicles (PHEVs), and fuel cell vehicles (FCVs). However, at present, the industrial development of methanol vehicles (MVs) in China has been at the forefront of the world [9,10]. A mechanism of coordinated development of the upstream and downstream industrial chains of “coal-coke-gas-alcohol-machinery” has been launched in rich methanol provinces such as Guizhou, Shanxi and Shaanxi provinces. This opens up a new channel for the transportation energy revolution, providing a reserve plan for alleviating the pressure on energy supply [11]. In addition, these vehicles have their own advantages and disadvantages in terms of the comprehensive evaluation. Combined with the characteristics of China’s energy structure, it is difficult to solve the problems of high energy consumption and high carbon emissions in the fields of manufacturing and transportation by only developing a single energy source as a vehicle fuel [12]. Therefore, energy structure transformation of the automobile industry should be in the direction of diversification. This study will add research on methanol vehicles to the definition of traditional NEVs, that is, the following NEVs represent BEVs, PHEVs, FCVs, and MVs.
Electric vehicles driven by electric energy have become the future development direction of the automobile industry in China and even the world [13,14]. However, the rapid development of electric vehicles also faces many problems and tests, such as battery cruising range, the convenience of charging piles and the high vehicle prices [15,16]. A hydrogen fuel cell vehicle is an important way to utilize hydrogen energy in the current transportation field. It uses hydrogen as fuel and directly converts the chemical energy into electrical energy, and has the characteristics of high energy conversion efficiency and zero emissions [17]. Hydrogen fuel cell vehicles also have problems such as imperfect supporting infrastructure, dependence on imports of core materials, and cost constraints that hinder their further development. As low-carbon energy, methanol has been widely used as an alternative energy in transportation and other fields due to its advantages of convenient storage and transportation and large-scale production [18,19]. Methanol vehicles also have the characteristics of safety, reliability, environmental protection and economy [20,21]. Although methanol vehicles are environmentally friendly in the process of use, more than 77% of methanol in China is coal-based methanol, resulting in higher carbon emissions throughout the life cycle than other types of vehicles [22]. Life cycle emissions and energy consumption of transport fuels, vehicles, and related emerging technologies can be calculated by the GREET model [23].
In order to alleviate the increasingly prominent contradictions between environmental pollution and energy supply, China is actively promoting the development of NEVs [3,24]. However, one of the difficulties facing the large-scale deployment of NEVs is the acceptance of market, that is, consumers recognize it and are willing to buy and use new fuel vehicles. At the same time, whether they have a complete industrial supply chain and other factors also seriously affect the success of NEVs promotion. At present, the passenger cars on the market are still dominated by fuel vehicles. Although NEVs have developed rapidly in recent years, their market share in 2021 will only be 13.4% [25].
Body lightweight technology is to reduce the curb weight of the car body on the basis of ensuring the strength and safety performance of the car body, thereby improving the power performance of the car, reducing fuel consumption, and reducing exhaust pollution [26]. 20–25% of the dead weight of a car is in the body, and the lightweight of body materials plays an important role [27]. Academician Sun Fengchun proved in his research project that the curb weight of BEVs can be reduced by 10%, and their driving range can be increased by 5% to 6% [28]. Due to the needs of environmental protection and energy conservation, the lightweight of automobiles has become one of the trends in the development of automobiles in the world. It has become the most important means to reduce the weight of vehicle bodies by using a large number of lightweight and high-strength materials. The all-aluminum body can reduce the weight of the vehicle body [29] which is of great benefit to environmental protection. Lightweight materials such as aluminum are widely used in the automotive industry to reduce the overall weight of the vehicle, reducing energy consumption and greenhouse gas emissions [30]. Study shows that a 10% reduction in vehicle weight can improve fuel economy by 6–8% [31]. Therefore, adopting an all-aluminum body for new energy vehicles is a feasible way to promote environmentally sustainable development. Since the end of the 1980s, countries with developed automobile industries, such as the United States, Europe and Japan, have continued to increase their investment in research and development of aluminum body, and made breakthrough progress [32,33].
NEVs can effectively reduce carbon emissions, but they are not completely free of carbon dioxide. For traditional fuel vehicles, the carbon emissions of the life cycle mainly come from the use stage, of which the carbon emissions account for about 80% of the life cycle [34], while the carbon emissions of BEVs mainly come from the production stage. According to relevant data, it is estimated that by 2025, the emissions from the material production of BEVs will account for 45%, and by 2040, the carbon emissions from the material production will reach about 85% [35]. It can be seen that accelerating the low-carbon transformation of the industrial chain and supply chain has become the key to carbon neutrality in the era of NEVs, especially in the material production of automobiles and the production process of power batteries.
Therefore, this study conducted a multi-objective optimization study from the perspective of new energy vehicle enterprises. Considering the environmental issues, minimizing carbon emissions at the manufacturing stage of the automobile as much as possible; considering the problem of economic benefits, corporate profits can most directly present the development status and trend of the alternative fuel vehicle industry. Finally, it needs to be considered that with the current gradually increasing market penetration rate of NEVs, how to balance the market demand and manufacturer supply.
The structure of this study is as follows: Section 2 introduces a comprehensive literature survey of application methods. Section 3 introduces the comprehensive method and model-building process adopted in this study. In Section 4, an optimization algorithm is proposed to deal with the model. In Section 5, a numerical example is used to verify the effectiveness of the model, and the optimization results and sensitivity analysis of the model are presented. Section 6 refines the corresponding policy recommendations, research limitations, and future work prospects based on the results of this study. The technical route flow chart of the study is as follows (Figure 1).

2. Literature Review
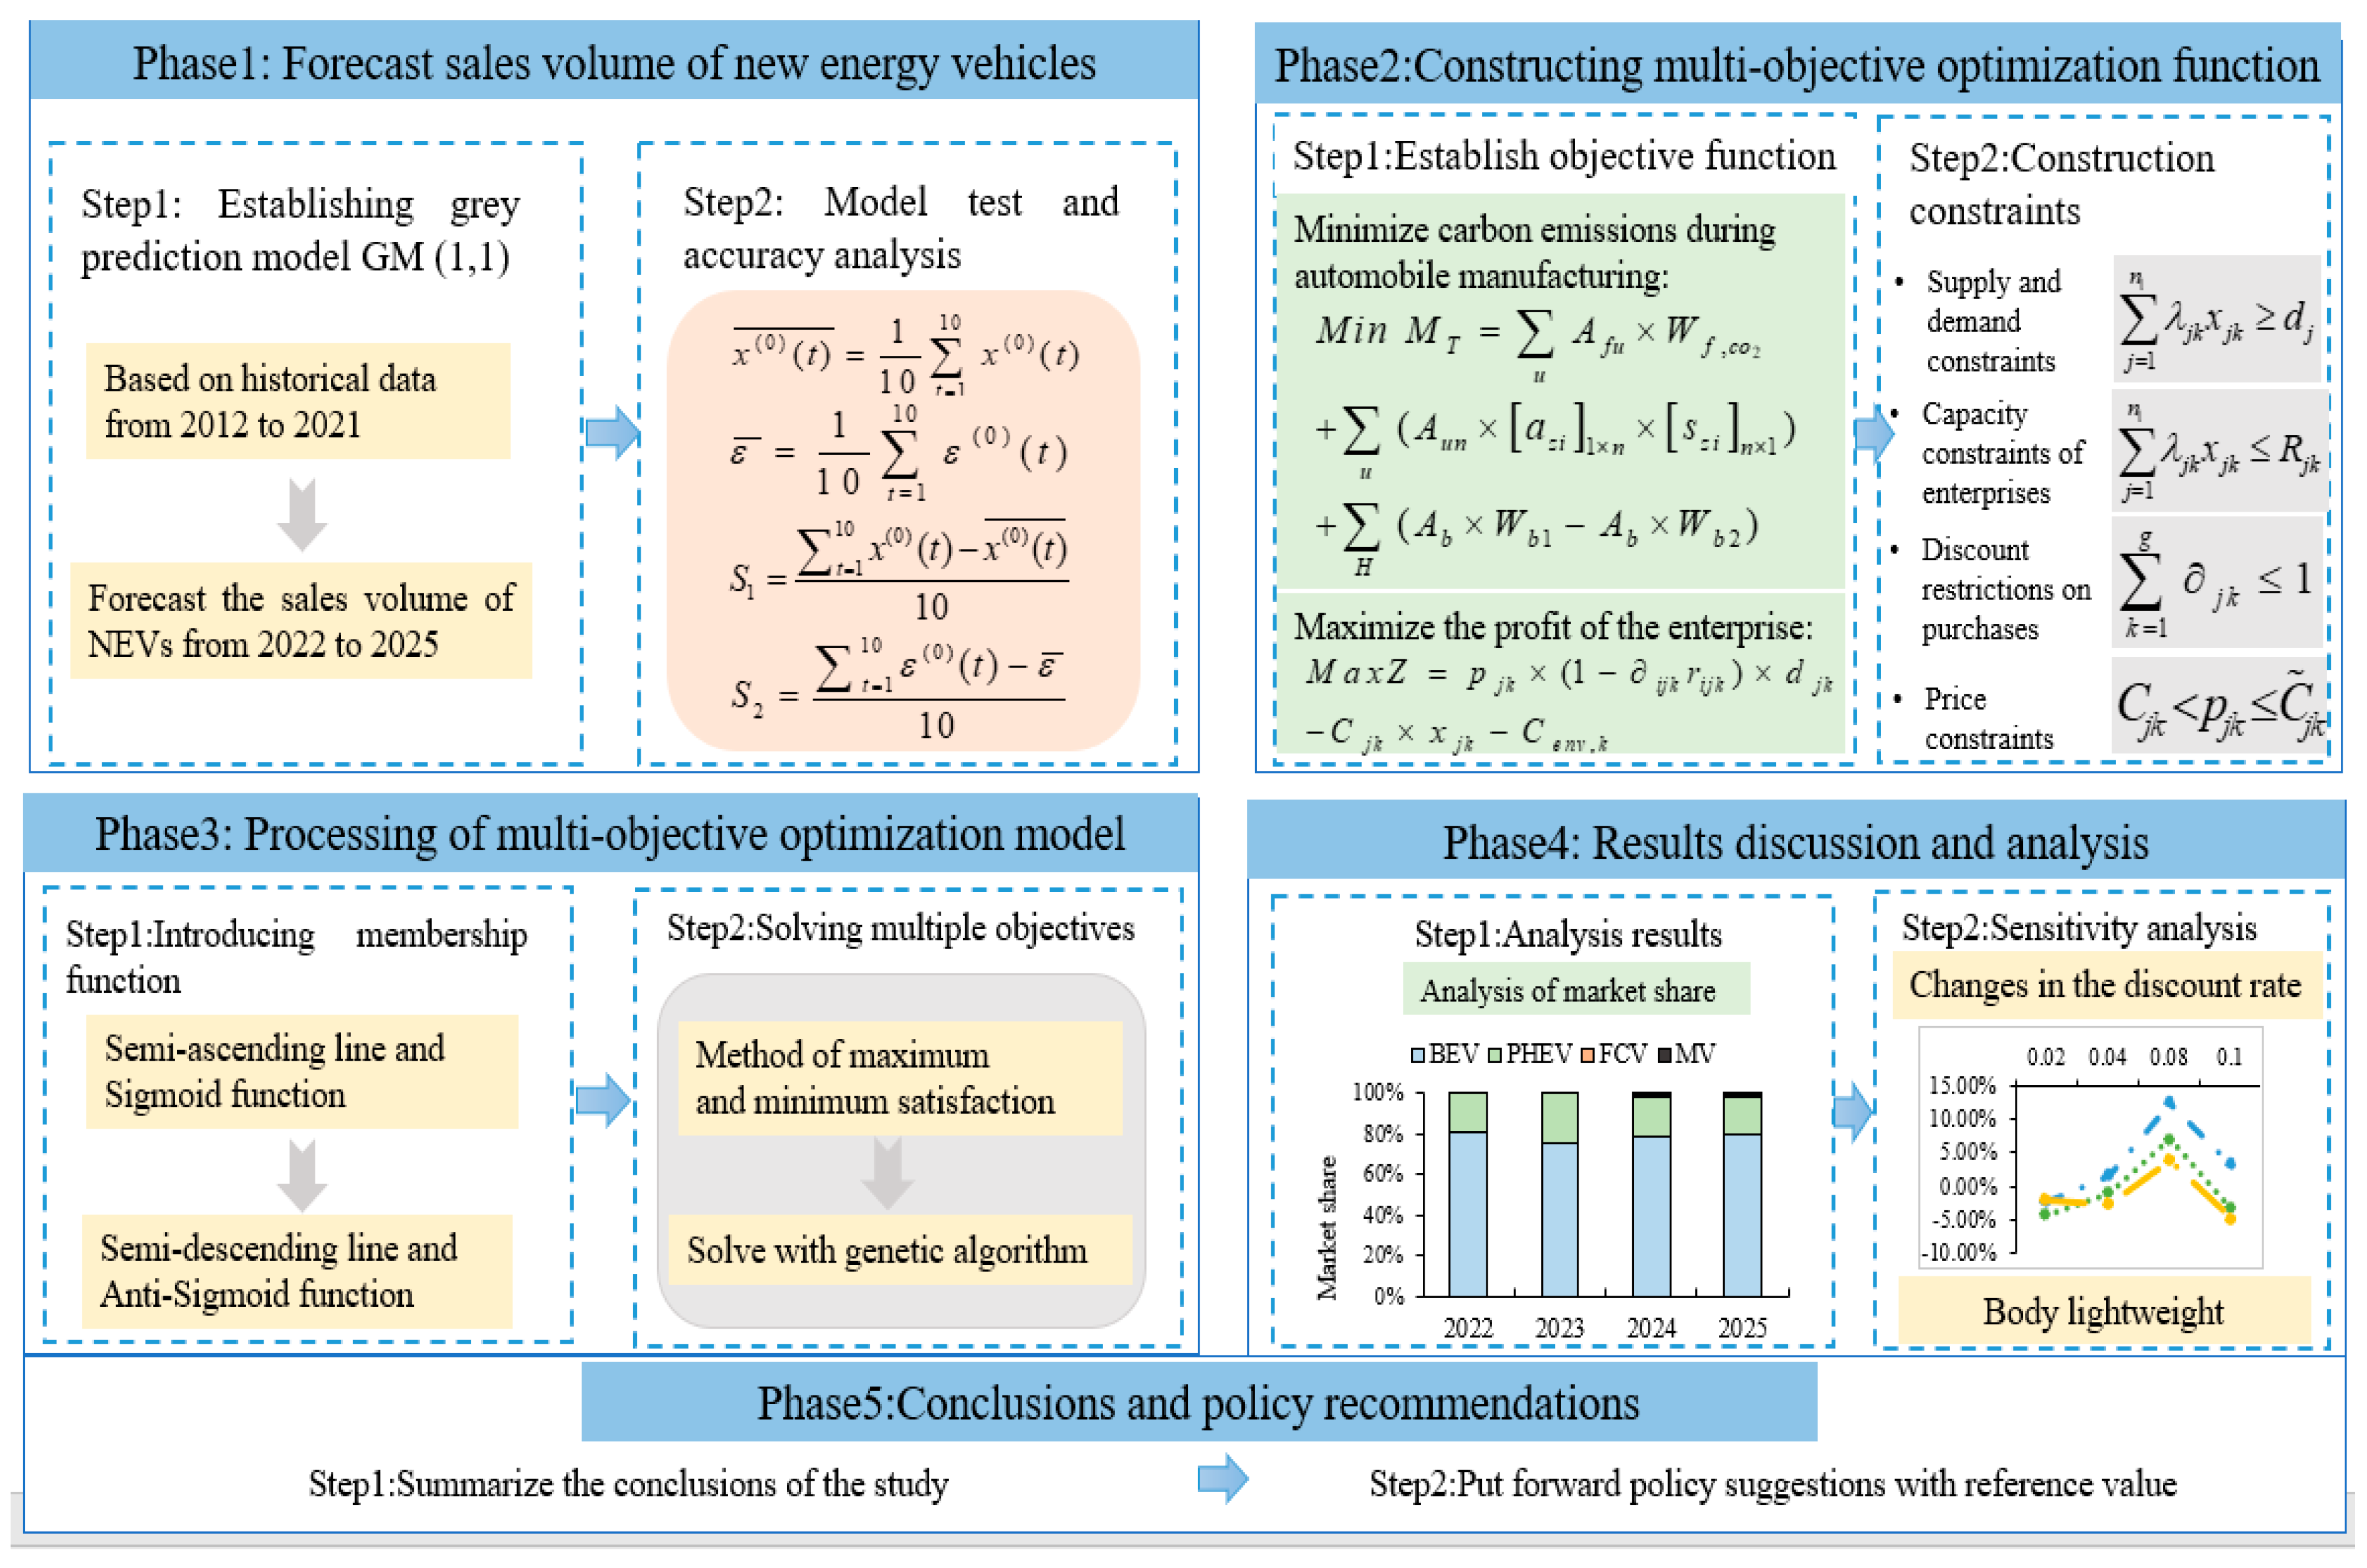
NEVs refer to vehicles that can help overcome environmental problems by gradually replacing fossil fuels with potentially more environmentally sustainable energy carriers (such as electricity, hydrogen or alcohol fuels, etc. [36,37,38]. The research and application of NEVs have been the focus of global attention in recent years. Scholars have carried out research work around the development of energy sources.
Among the evaluation problems of the development of various NEVs, most of the studies have solved the problems by adopting the method of comprehensive evaluation. Some studies focus on the combination of methods. Ullah et al. (2018) used the multi-criteria decision analysis method to evaluate the three gaseous fuels of compressed natural gas, liquefied petroleum gas, and liquefied natural gas in Pakistan from four main indicators: technology, economy, society and environment [39]. Xue et al. (2020) comprehensively evaluated the AFVs’ industrial development of 10 typical cities in China based on the gray relative analysis technology, TOPSIS and PCA methods. Some studies have considered policy-related influencing factors [40]. For instance, Li et al. (2020) proposed the FANP-SWOT method and established an evaluation index system including society, economy, technology, environment and policy, which can be used to evaluate the development prospects of methanol vehicles in China [41]. Sehatpour et al. (2017) ranked and evaluated various alternative fuel vehicles in Iran’s transport sector based on economic, technical, social, and policy-related indicators [42]. Ma et al. (2019) established an entropy weight model based on AHP with government support policies as the research direction, and quantitatively analyzed the development of NEVs through a series of indicators [43].
According to the current situation of the development of NEVs, some scholars have studied the model of how they will spread in the future market. The first method is the traditional econometric model, which can be used to mine the correlation between sample data based on statistical theory [44]. For example, Du et al. (2019) [45] used the extended Logistic model to predict the future car ownership in China. The second model is a relatively popular intelligent method in recent years [46,47,48]. For example, Lonan and Ardi. (2020) [49] developed a system dynamics model to show that the policy support provided by the government through infrastructure development, manufacturing and consumer purchasing power subsidies is critical to the large-scale adoption of electric vehicles. Jiao et al. (2022) [50] established a two-stage Stackelberg game model to show that subsidies, dual credit policies and charging pile construction have a positive impact on the diffusion of NEVs. The third model is the relatively classic Bass model [51]. Xian et al. (2022) analyzed the development trend of FCV in the future from the aspects of technology, application and market conditions based on the Bass model [52]. Kumar et al. (2022) predicted the sales volume of electric vehicles in 20 major countries based on the Bass model [53]. Different from the previous prediction methods, GM (1,1) only needs few data to make predictions, and when predicting sample data with more obvious trends, the accuracy of the prediction results is very high [54]. Therefore, GM (1,1) is more suitable for forecasting the sales volume of NEVs in China.
On the other hand, the research on multi-objective optimization of NEVs mostly focuses on the location of charging stations [55,56,57,58], energy scheduling during the charging process [59,60,61,62], and the design of vehicle system architecture [63,64,65]. This study uses the GM (1,1) to forecast the sales volume of NEVs in China and takes the sales volume as the reference data for the production volume of NEVs. On this basis, this study establishes an optimization model with enterprises to obtain the optimal production volume of NEVs. According to the evolution trend of government subsidy “recession” and body lightweight reduction, the impact of both on the production of NEVs, corporate profits and carbon emissions in the manufacturing stage of NEVs is analyzed. The analysis results have certain reference value for the formulation of national government policies, the production planning arrangements of new energy automobile enterprises, and the improvement of automobile manufacturing technology around carbon emissions.

3. Methodology

This study establishes a multi-objective optimization model to formulate strategies for the NEVs development. The symbolic assumptions are shown in Table 1.

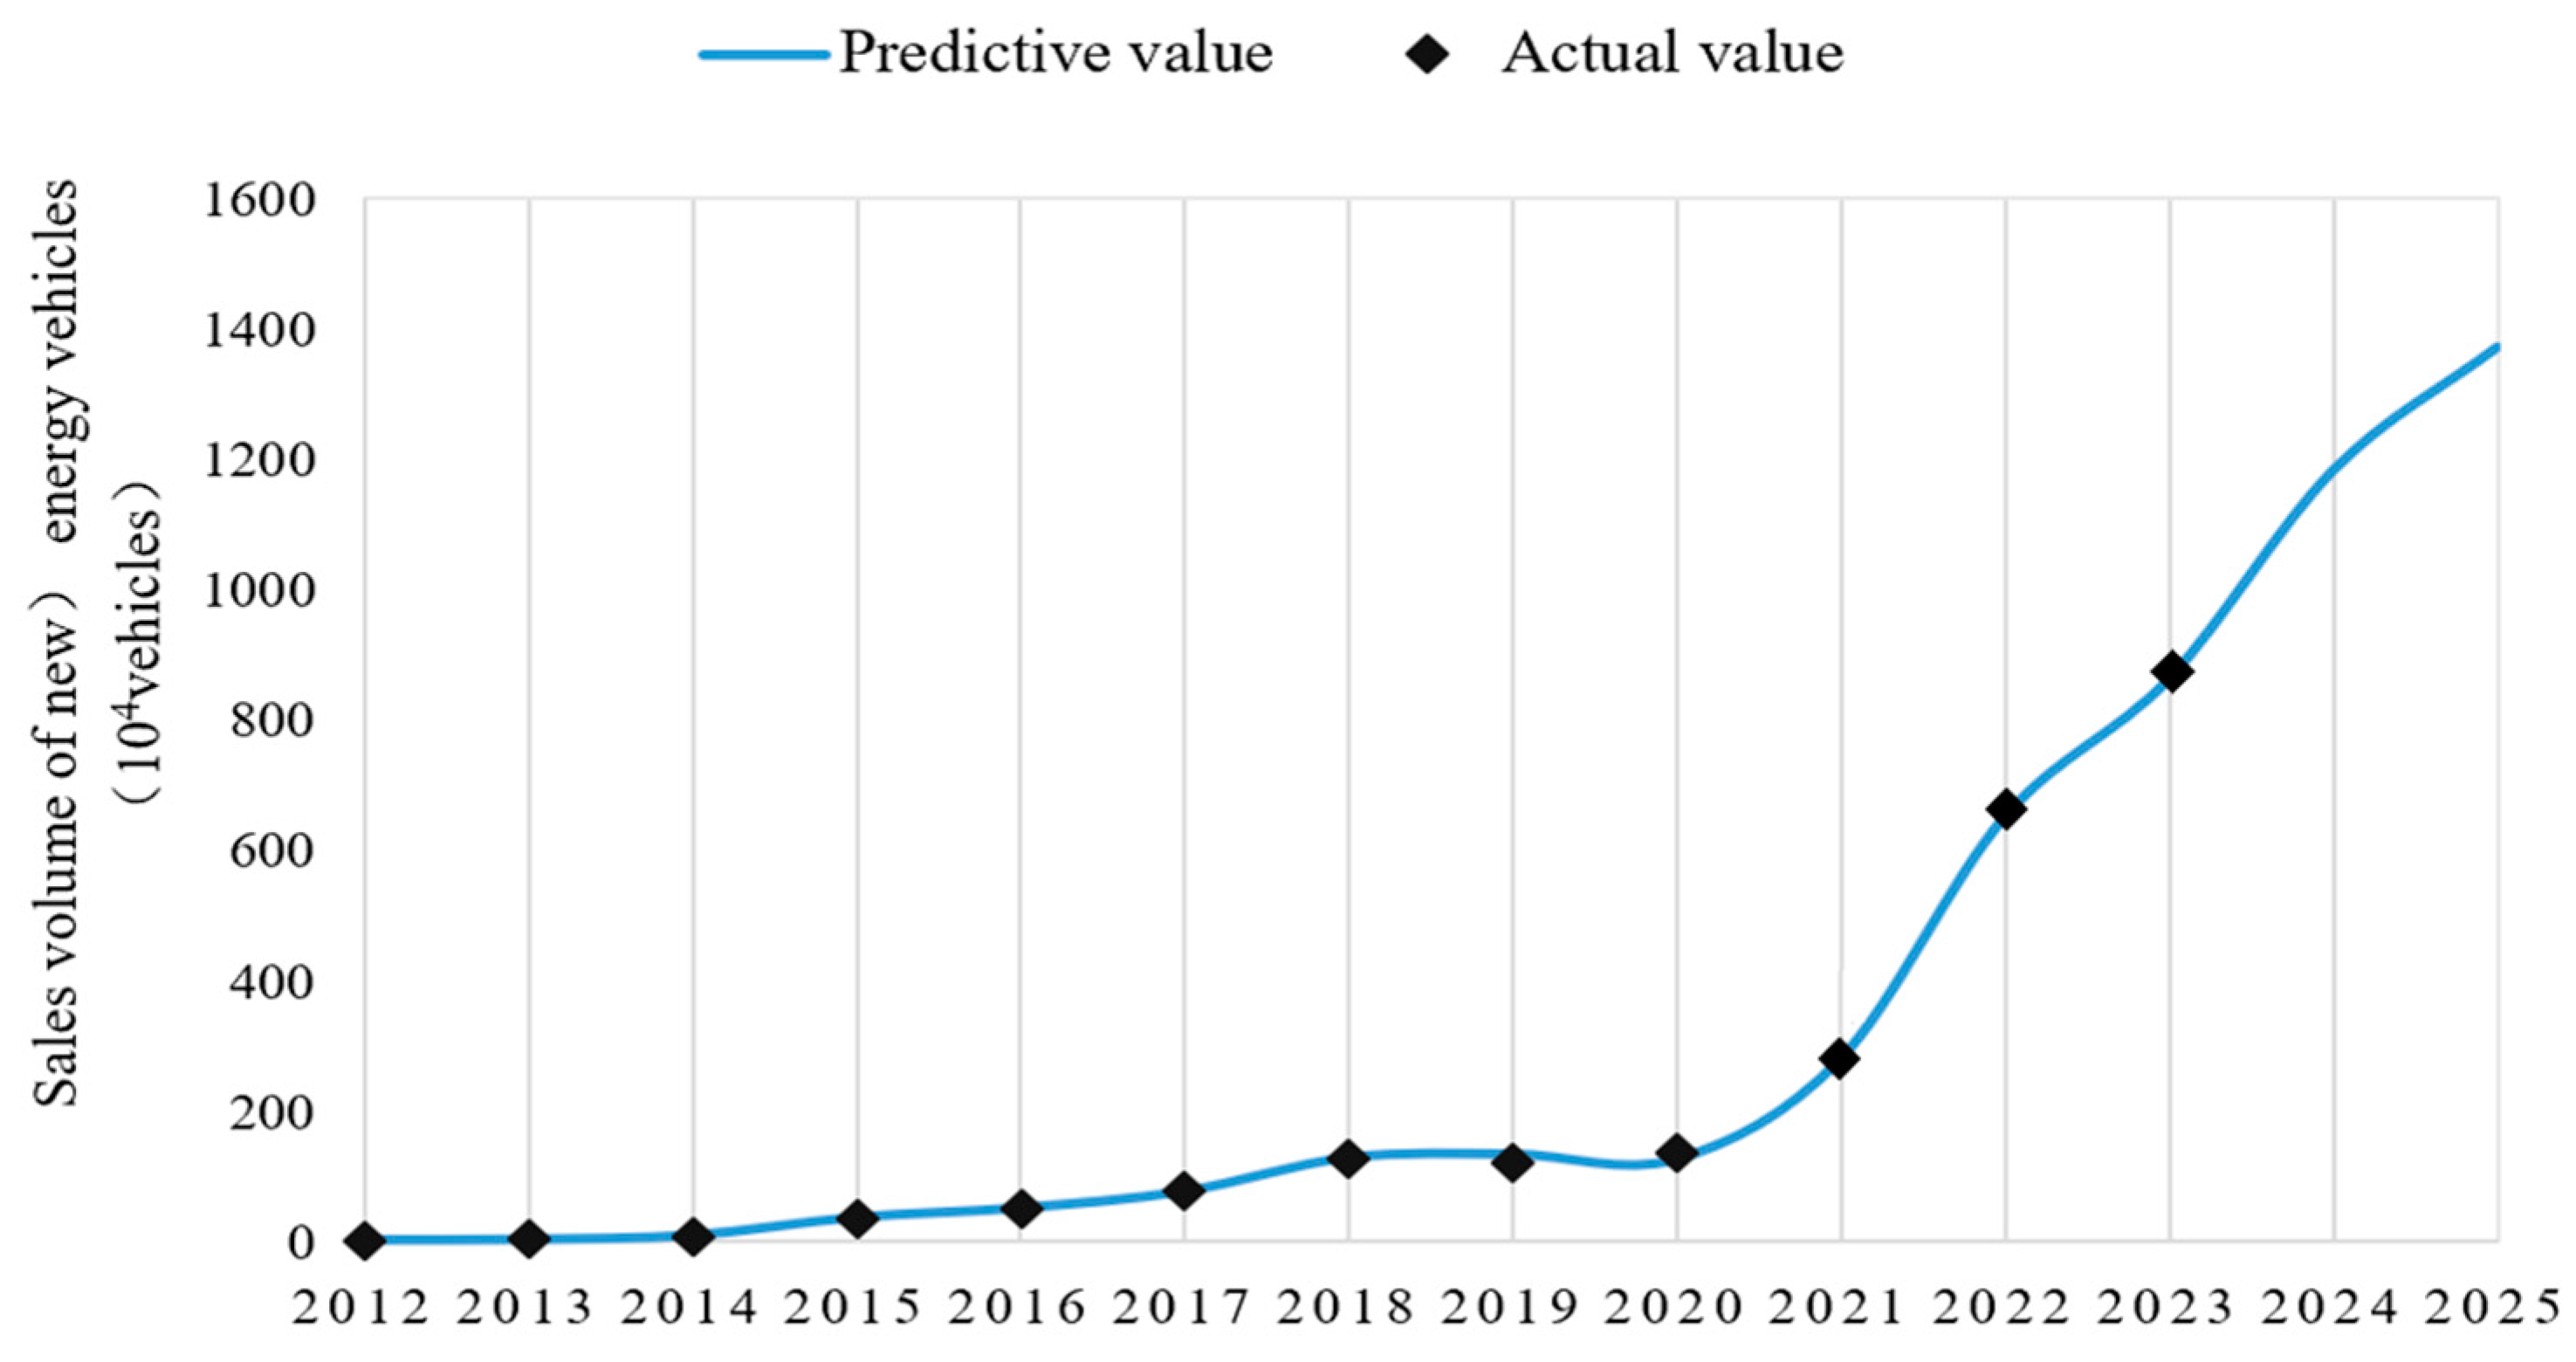
3.1. Grey Prediction Model GM (1,1)

3.1.1. Model Establishment

Assume that the original data of sales volume of NEVs from 2012 to 2021 are listed as follows.
x ( 0 ) ( t ) = ( x ( 0 ) ( 1 ) , x ( 0 ) ( 2 ) , x ( 0 ) ( 3 ) , , x ( 0 ) ( 9 ) , x ( 0 ) ( 10 ) )
x ( 0 ) ( 1 ) , x ( 0 ) ( 2 ) , x ( 0 ) ( 3 ) ,   , x ( 0 ) ( 9 ) , x ( 0 ) ( 10 ) are 10 observations.
The detailed steps of model establishment, inspection and precision analysis are shown in Appendix A.1. The approximate data sequence is as follows:
x ^ ( 0 ) ( t + 1 ) = x ^ ( 1 ) ( t + 1 ) x ^ ( 1 ) ( t )

3.1.2. Analysis of Original Data and Prediction Results

The original data of this study is the annual sales volume of NEVs in China from 2012 to 2021, as shown in Figure 2.
It can be seen that 2013–2015 is a rapid development stage of NEVs in China, in which the sales volume surged in 2014 and 2015, with a year-on-year growth rate of more than 300%. Since then, the sales volume of NEVs has continued to increase from 2016 to 2018. However, as entered the epidemic period in 2019, China’s new energy vehicle industry was inevitably impacted, with a slight decrease in sales and a trend of decline year by year.
According to the above grey prediction model, after checking the relevant data on the official website of the China Automobile Association, the sales volume of NEVs from 2024 to 2025 is predicted by using MATLAB 2022b and other software for calculation and statistics, as shown in Figure 3.
The first 10 items of data refer to the actual sales volume of NEVs from 2012 to 2021. It can be seen from Figure 3 that the line smoothness of the first 10 items of data is high. For the predicted data, after calculating the variance ratio and residual error, it reaches the level I accuracy of gray prediction, and the level of prediction accuracy is excellent.

3.2. Objective Function

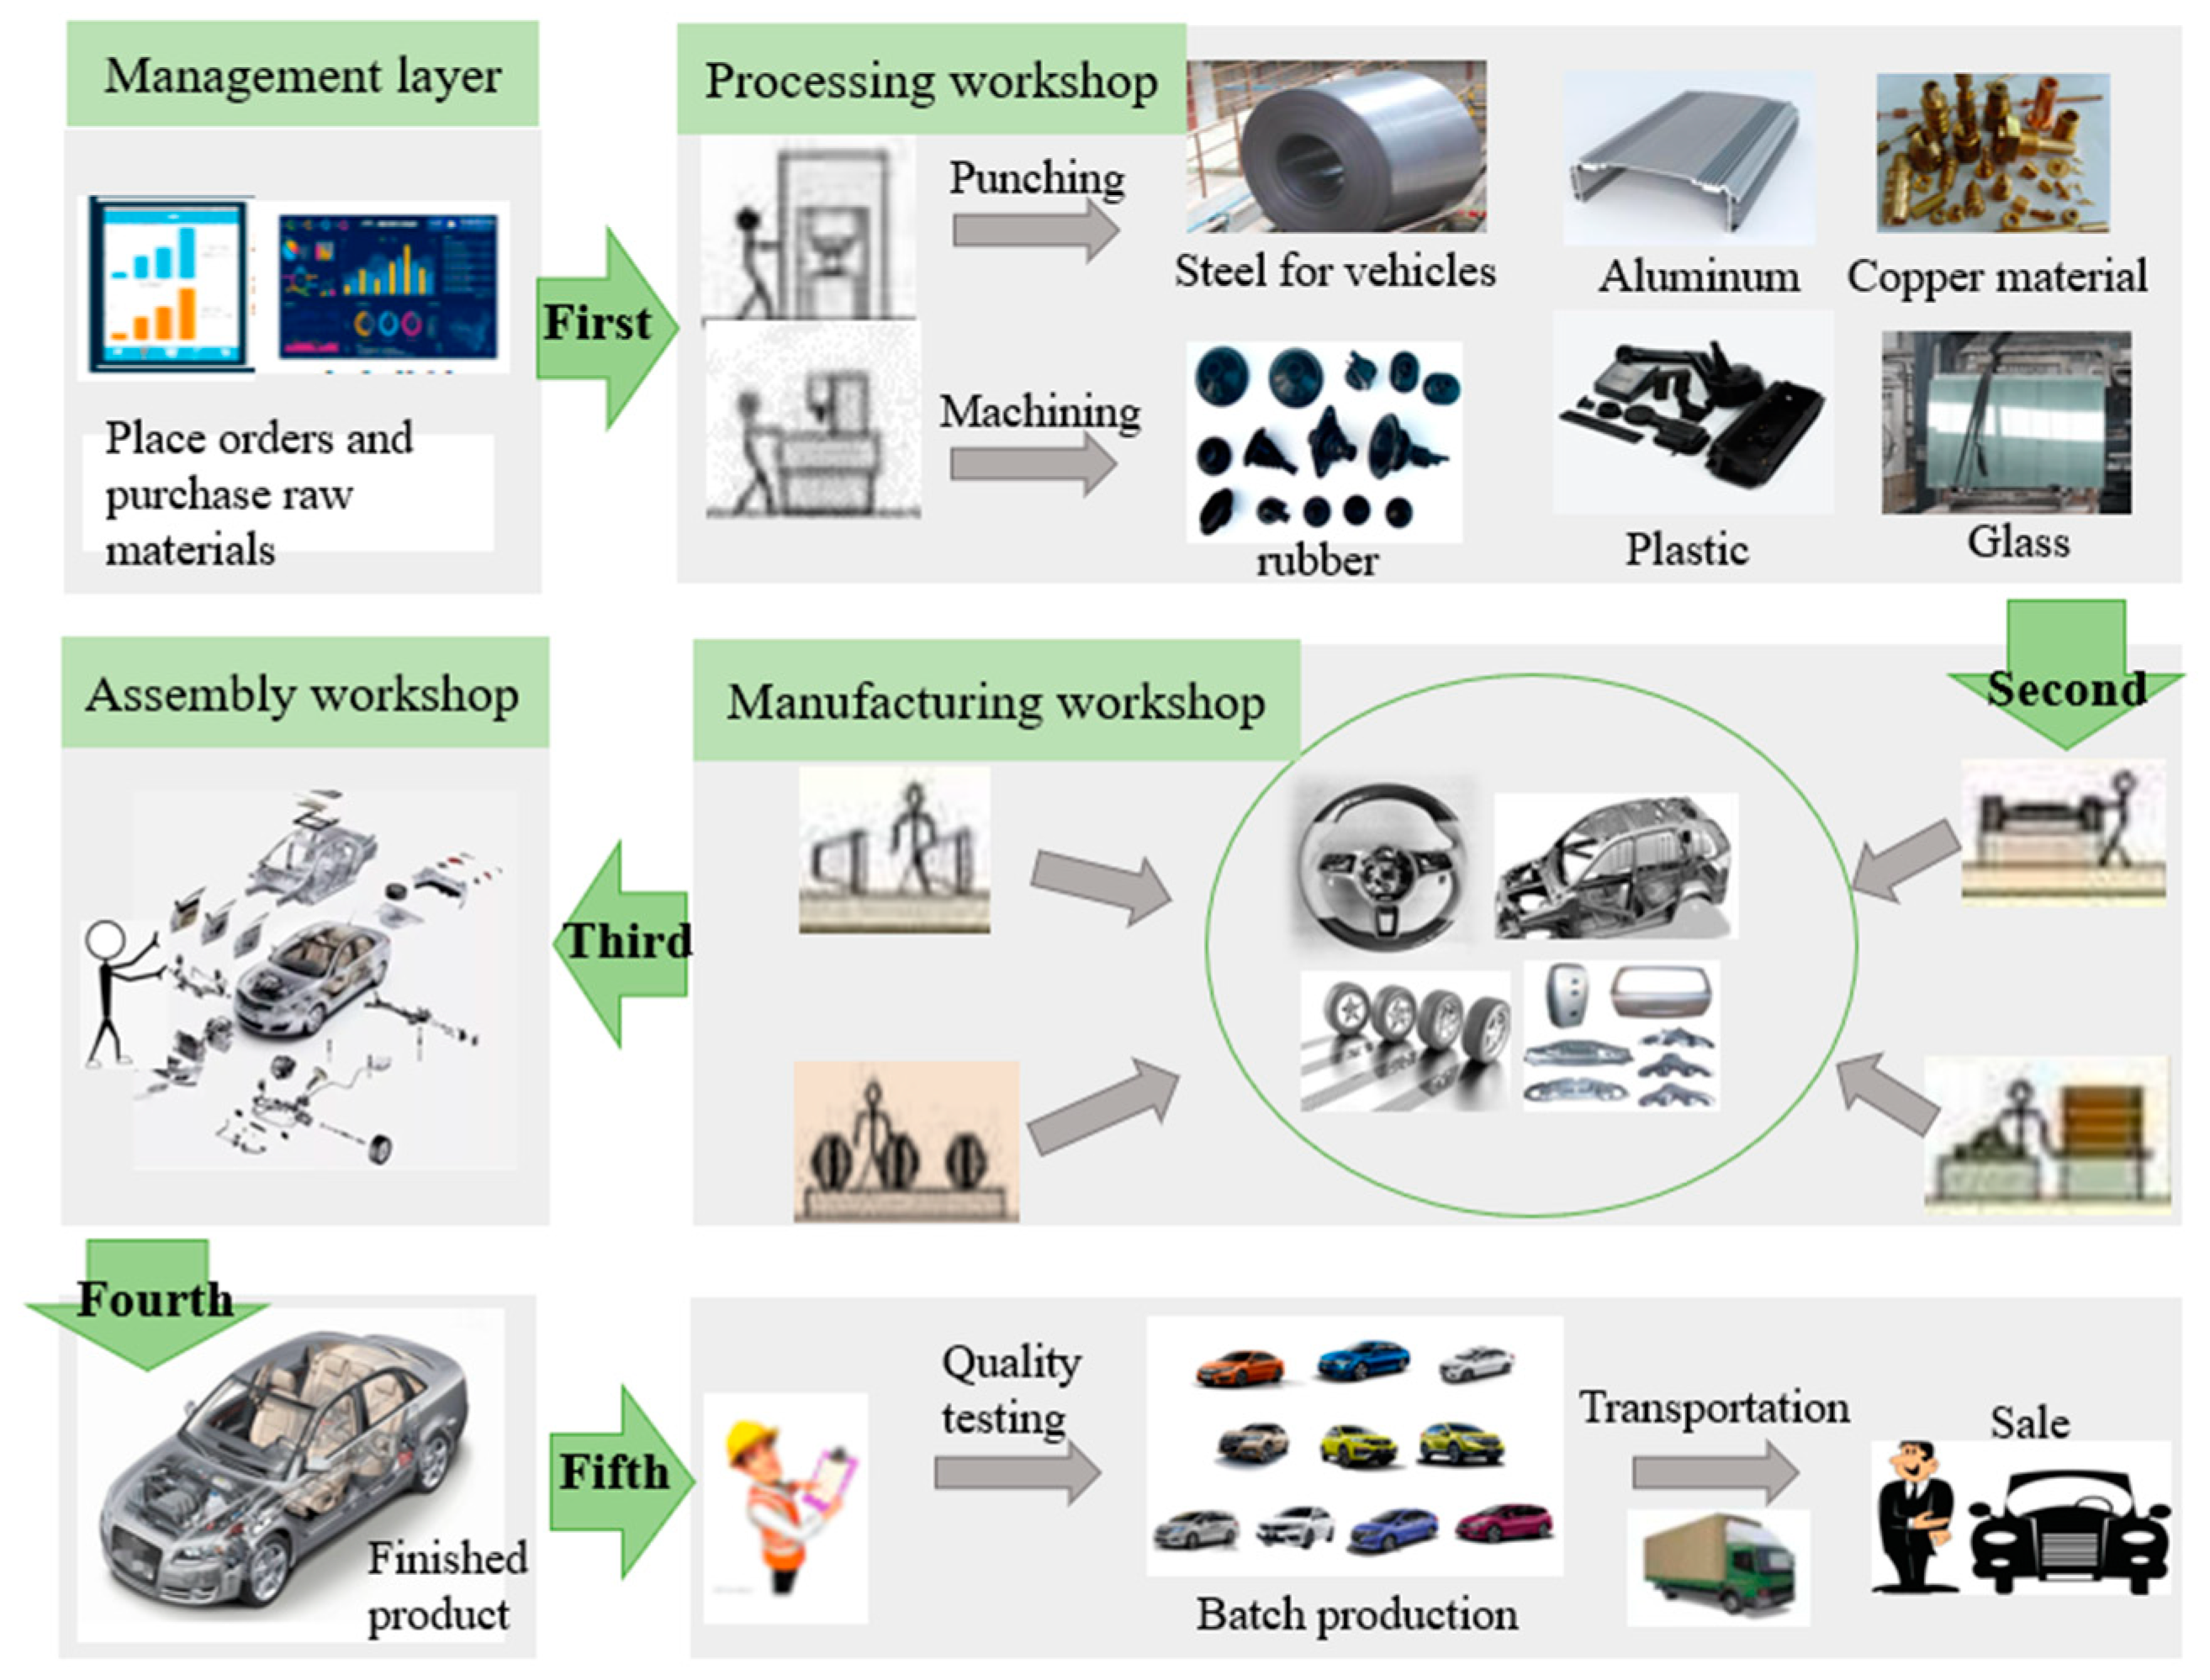
3.2.1. Minimize Carbon Emissions

For traditional fuel vehicles, the carbon emissions of the whole life cycle mainly come from the use stage, of which the carbon emissions in the use stage account for about 80%, while the carbon emissions of BEVs mainly come from the production stage. Due to China’s energy being dominated by thermoelectricity, EVs indirectly generate a certain amount of carbon emissions during the charging process. Carbon emissions during the use phase should also be addressed. However, reducing carbon emissions during the use phase requires long-term deployment and cooperation between the government, experts, manufacturers, and other stakeholders, while minimizing carbon emissions during the production process is a more feasible and efficient carbon reduction measure for companies. Therefore, from the perspective of new energy vehicle manufacturers, it is an effective carbon emission reduction measure to reduce the carbon emissions of vehicles in the manufacturing process as much as possible. The first goal of the enterprise is to minimize carbon emissions in the automobile manufacturing stage (MT). Carbon emissions in the vehicle manufacturing stage (MT) generally include the emissions of vehicle raw material acquisition (M1), manufacturing equipment (M2) and vehicle scrapping or recycling (M3).
(1)
Vehicle raw material acquisition stage
Determine the vehicle material quality matrix A = a j i 1 × u , a j i is the quality of the i raw material for j type vehicles, assuming that the material utilization matrix of part processing is α = d i a g α 11 , α 12 , , α i i , , α n n , and the transformation matrix during material manufacturing is β = β i f u × n , then the material consumption of automobile life cycle is:
A f u = A × α 1 × β 1
Therefore, the carbon emission matrix of automobile raw materials in the production process:
M 1 = u A f u × W f , c o 2
In the above formula, u represents the corresponding component category, α is the diagonal matrix, and α n n represents the processing utilization rate of material n. β i f represents the conversion rate in the preparation process of material i, A f u represents the quantity of the raw material f required for the component u, and W f , c o 2 represents the CO2 emissions generated by the acquisition of the unit mass raw material f. The carbon emissions of the vehicle at this stage are calculated by using the main constituent materials and proportions of each part [66].
(2)
Manufacturing and assembly stage
Firstly, the component quality matrix A u n = a z u × n is established to represent the quality of component n required by component u. Secondly, the carbon emission matrix W n , c o 2 of the parts in the processing and manufacturing process is constructed to represent the CO2 emissions generated in the manufacturing process of parts n.
W n , c o 2 = a z i 1 × n × s z i n × 1
Therefrom, it can be concluded that the carbon emission model of the automobile during the assembly and manufacturing process is:
M 2 = u A u n × W n , c o 2 = u ( A u n × a z i 1 × n × s z i n × 1 )
In the formula, a z refers to the mass of vehicle materials consumed during the processing and manufacturing of parts, a z i refers to the mass of the part of vehicle i, and s z i refers to the CO2 emission intensity during the processing and manufacturing of component i. The main emission parts involved in the assembly process include painting, heating, material handling, etc. The carbon emissions generated by these processes are ignored due to the difficulty of statistics and calculation [67].
(3)
Scrap recovery stage
After a certain mileage or a specified service life, vehicles are reasonably scrapped and recycled mainly through disassembly, smashing, reproduction, remanufacture, reuse, and other procedures. Therefore, the model of the scrap recovery stage is:
M 3 = H ( A b × W b 1 A b × W b 2 )
wherein, h refers to the recycled parts, Ab refers to the material matrix of the scrap recycling process, W b 1 refers to the matrix of CO2 emission of recycled materials per unit mass, and W b 2 refers to the matrix of CO2 emission reduction of recycled materials per unit mass. Therefore, the first objective function of automobile manufacturers is:
M i n   M T = u A f u × W f , c o 2 + u ( A u n × a z i 1 × n × s z i n × 1 ) + H ( A b × W b 1 A b × W b 2 )

3.2.2. Maximize Profits

The second goal of the enterprise is to maximize profits. To achieve profit maximization, it is essential to increase the sales revenue of automobiles and reduce the cost of environmental pollution expenditure. The environmental pollution expenditure mainly takes into account the penalty fees for CO2 emissions during automobile manufacturing [68], and the sales profit is expressed by the total sales minus the total cost. To sum up, the objective function of the enterprise is as follows:
M a x Z = p j k × ( 1 i j k r i j k ) × d j k C j k × x j k C e n v , k
C e n v , k = j = 1 n 1 k = 1 g θ c o 2 × M j k , c o 2
In the above formula, p j k is the price at which enterprise k sells j-type cars and i j k is the discount rate provided by enterprise k for consumer i who purchases j-type cars; rijk is the discount coefficient, if r i j k = 1, enterprise k provides discount; And if r i j k = 0, the enterprise does not provide a discount. d j k is the number of j-type cars sold by enterprise k, C j k is the cost of producing j-type cars by enterprise k, and x j k is the number of j-type cars production by enterprise k. C e n v , k is the environmental pollution expenditure and θ c o 2 is the penalty price of CO2 (kg/yuan).

3.3. Constraints

(1)
Supply and demand constraints. The number of cars manufactured by enterprises should meet the market demand as much as possible. Therefore, the supply and demand constraints are as follows:
k = 1 g λ j k x j k d j j = 1 , 2 , , n 1
λ j k is the coefficient of a production decision. If λ j k = 1, enterprise k produces j-type automobiles; If λ j k = 0, enterprise k does not produce cars of type j. x j k represents the number of j-type cars produced by enterprise k, and, j = 1,2, …, n1, k = 1,2, …, g. d j refers to the demand for j-type vehicles on the market.
(2)
Capacity constraints of automobile enterprises. The maximum production capacity that vehicle enterprise k can provide is R j k , the number of cars manufactured by any enterprise should not exceed its maximum production capacity, namely:
j = 1 n 1 λ j k x j k R j k k = 1 , 2 , , g
(3)
Discount restrictions on car purchases. Different automobile enterprises develop different discount strategies for customers when purchasing different models,
0 j k 1 ,   k = 1 , 2 , , g
j k is the discount rate for car purchases provided by enterprise k.
(4)
Price constraints. The upper limit of the sales price of automobiles is set as C ˜ j k , C j k is the cost of automobile manufacturing, and q is the elasticity coefficient of the price [69].
C j k < p j k C ˜ j k j = 1 , 2 , , n 1   k = 1 , 2 , , g
C ˜ j k = C j k × ( 1 + q ) j = 1 , 2 , , n 1   k = 1 , 2 , , g
q [ 0.5 , 2.5 ]
In addition to the abovementioned Constraints, policy support, and market development also significantly impact enterprises’ profits. The government encourages the development of NEVs and encourages enterprises to develop in the direction of green and low-carbon using policy guidance and financial support. Actively applying for policy support and financial subsidies could reduce transition costs. However, since 2017, the subsidies for NEVs have gradually declined, and enterprises also need to make timely changes to reduce their reliance on policy subsidies. To increase profits, reduce costs through technological innovation or other energy-saving and emission-reduction measures. The market environment is the direct background of enterprise operation and profit realization. The changes profoundly affect the enterprise’s sales strategy, production plan, and profit expectations. Based on the requirements of the environment for green and low-carbon transformation, the demand for NEVs would gradually increase in the future, and related enterprises would increase R&D investment. More and more new enterprises will enter the market, and the market competition is becoming more and more intense. The development of new products and research on new technologies, as well as the enhancement of brand image, and the development of new products and research of new technologies to improve brand image and competitiveness are essential for the future profitability of the enterprise.

4. Multi-Objective Optimization Model

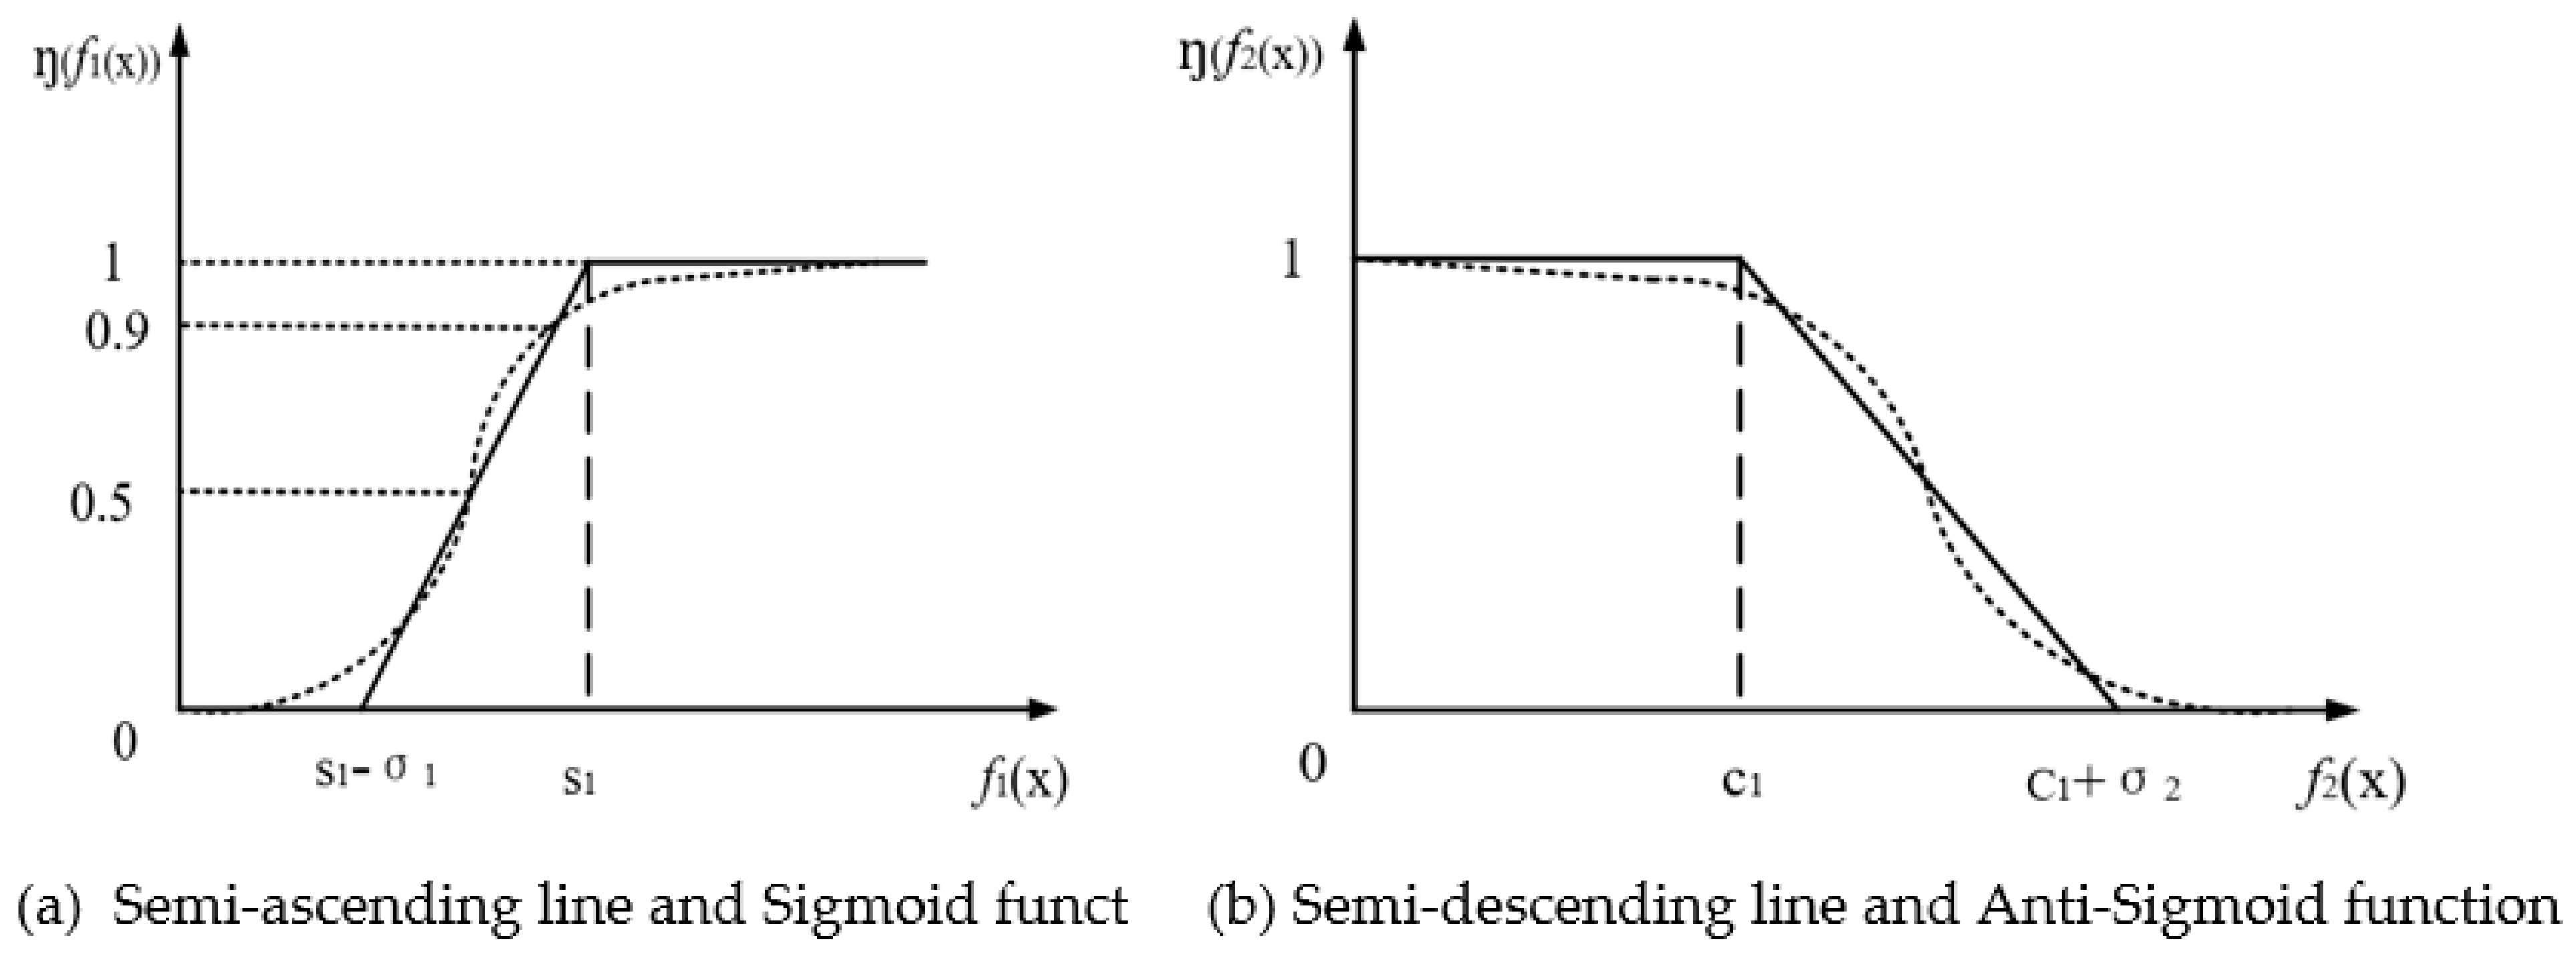
4.1. Membership Transformation of the Objective Function

In the multi-objective optimization problems, the optimal solution should include the contribution of each sub-objective, but the sub-objectives hardly achieve the optimal solution at the same time. The relationship between the optimal solution and the sub-objective optimal solution is blurred, and it is difficult to determine the limit [70]. In addition, it is impossible to directly compare the advantages and disadvantages of each optimal solution [71]. Based on this, the fuzzy mathematical principle is used to solve the multi-objective optimization problem. Solution idea: firstly, solve the optimal solution of each sub-objective under all constraints, then use these optimal solutions to blur the sub-objective functions, and then find the solution to maximize the membership function of the intersection, which is the optimal solution of the multi-objective optimization problem. Fuzzy mathematics uses accurate mathematical methods to express and deal with the actual objective fuzzy phenomena. To achieve this goal, first, determine the membership function η. The size of η reflects the satisfaction of the optimization results, η = 1 means the most satisfied, and η = 0 means the most dissatisfied.
The selection of membership functions is the core of solving such problems, and it relies more on practical experience [72]. Therefore, the semi-rising straight line is selected as the membership function of the company’s sales profit target, and the semi-descending straight line is selected as the membership function of the carbon emission target [73]. The membership functions corresponding to the two sub-objective functions are shown in Figure 4. The expressions of functions are formulas (17) and (18) respectively.
η ( f 1 ( x ) ) = 0 , f 1 ( x ) s 1 σ 1 f 1 ( x ) ( s 1 σ 1 ) σ 1 , s 1 σ 1 < f 1 ( x ) s 1 1 , f 1 ( x ) > s 1
η ( f 2 ( x ) ) = 0 , f 2 ( x ) c 1 + σ 2 c 1 + σ 2 f 2 ( x ) σ 2 , c 1 < f 2 ( x ) < c 1 + σ 2 1 , f 2 ( x ) c 1
where, s 1 , σ 1 and c 1 , σ 2 are the curve characteristic parameters, where s 1 and c 1 are the optimal values of f 1 ( x ) and   f 2 ( x ) respectively, and the maximum acceptable range of   f 2 ( x ) is ( 0 , c 1 + σ 2 )
It can be seen from Figure 4 that the membership functions of the semi-ascending line and the semi-descending line are not differentiable at f 1 ( x ) = s 1 and f 2 ( x ) = c 1 + σ 2 . This study uses the continuous derivative Sigmoid function (cur.ve in Figure 4a) to replace the semi-ascending linear membership function, and the continuously derivable Anti-Sigmoid function to replace the semi-descending linear membership function degree function, as shown in the curve in Figure 4b. The Sigmoid function curve has the same half-open shape as the curve of the half-rising or half-falling linear function, so it is suitable as a membership function described by linguistic values such as “maximum” and “minimum”. The mathematical expression of the Sigmoid function is as follows:
y = [ 1 + e a ( x c ) 1 ] 1
The mathematical expression of the Anti-Sigmoid function is:
y = 1 [ 1 + e a ( x c ) 1 ] 1
In the formula, a and c are the shape parameters of the sigmoid function.

4.2. Application of Sigmoid and Anti-Sigmoid Functions

In order to make the Sigmoid function fully close to the half-rising linear function and the Anti-Sigmoid function fully close to the half-falling linear function, it is necessary to reasonably set parameters a and c. In this study, the points at η = 0.5 and η = 0.9 are taken as the coincidence point, the coordinates of the two points can be obtained as:
x 1 = s 1 σ 1 2 y 1 = 1 + e a ( x c ) 1 1 = 0.5
x 2 = s 1 σ 1 10 y 2 = 1 + e a ( x c ) 1 1 = 0.9
From the above formula, we can get the parameter conversion relationship between the Semi-ascending linear function and the Sigmoid function:
a = 5 ln 3 σ 1 c = S 1 σ 1 2 + σ 1 5 ln 3
Similarly, according to the above principles, the equation of parameter conversion between Semi-descending linear function and Anti-Sigmoid function can be obtained as follows:
a = 5 ln 3 σ 2 c = c 1 + σ 2 2 σ 2 5 ln 3
The membership function of each objective is as follows:
η f 1 ( x ) = 1 1 + exp 5 ln 3 σ 1 f 1 ( x ) ( s 1 σ 1 2 + σ 1 5 ln 3 ) 1
η f 2 ( x ) = 1 1 1 + exp 5 ln 3 σ 2 f 2 ( x ) ( c 1 + σ 2 2 σ 2 5 ln 3 ) 1

4.3. Method of Maximum and Minimum Satisfaction

The optimization problem in which both the objective function and the constraint conditions are fuzzy or one of them is fuzzy is called a fuzzy optimization problem. In this study, the maximum and minimum satisfaction method is used to convert the multi-objective function combined with the membership function into a single objective function. For the membership functions η ( f 1 ( x ) ) and η ( f 2 ( x ) ) of each objective function in the model, define μ as the satisfaction of η ( f 1 ( x ) ) and η ( f 2 ( x ) ) , as shown in the Equation (25).
μ = min η ( f 1 ( x ) ) , η ( f 2 ( x ) )
According to the maximum-minimum rule of fuzzy set theory [74], the multi-objective model is transformed into a maximum-minimum function model, that is to maximize the satisfaction μ, and its mathematical description is as follows:
max μ s . t . η ( f 1 ( x ) ) μ η ( f 2 ( x ) ) μ 0 μ 1 E q u a t i o n s   ( 26 ) ( 31 )
By substituting the first two terms of Equation (26) into the feasible region of Equations (23) and (24) respectively, the multi-objective optimization problem can be transformed into a single-objective nonlinear programming problem. The mathematical model is:
max μ s . t . f 1 ( x ) μ σ 01 s 1 σ 01 f 2 ( x ) μ σ 02 c 1 σ 02 0 μ 1 E q u a t i o n s   ( 26 ) ( 31 )
The synthetic function η f 1 x ,   f 2 x μ satisfies the continuous derivative function over the entire domain, thus enhancing the robustness of the algorithm.

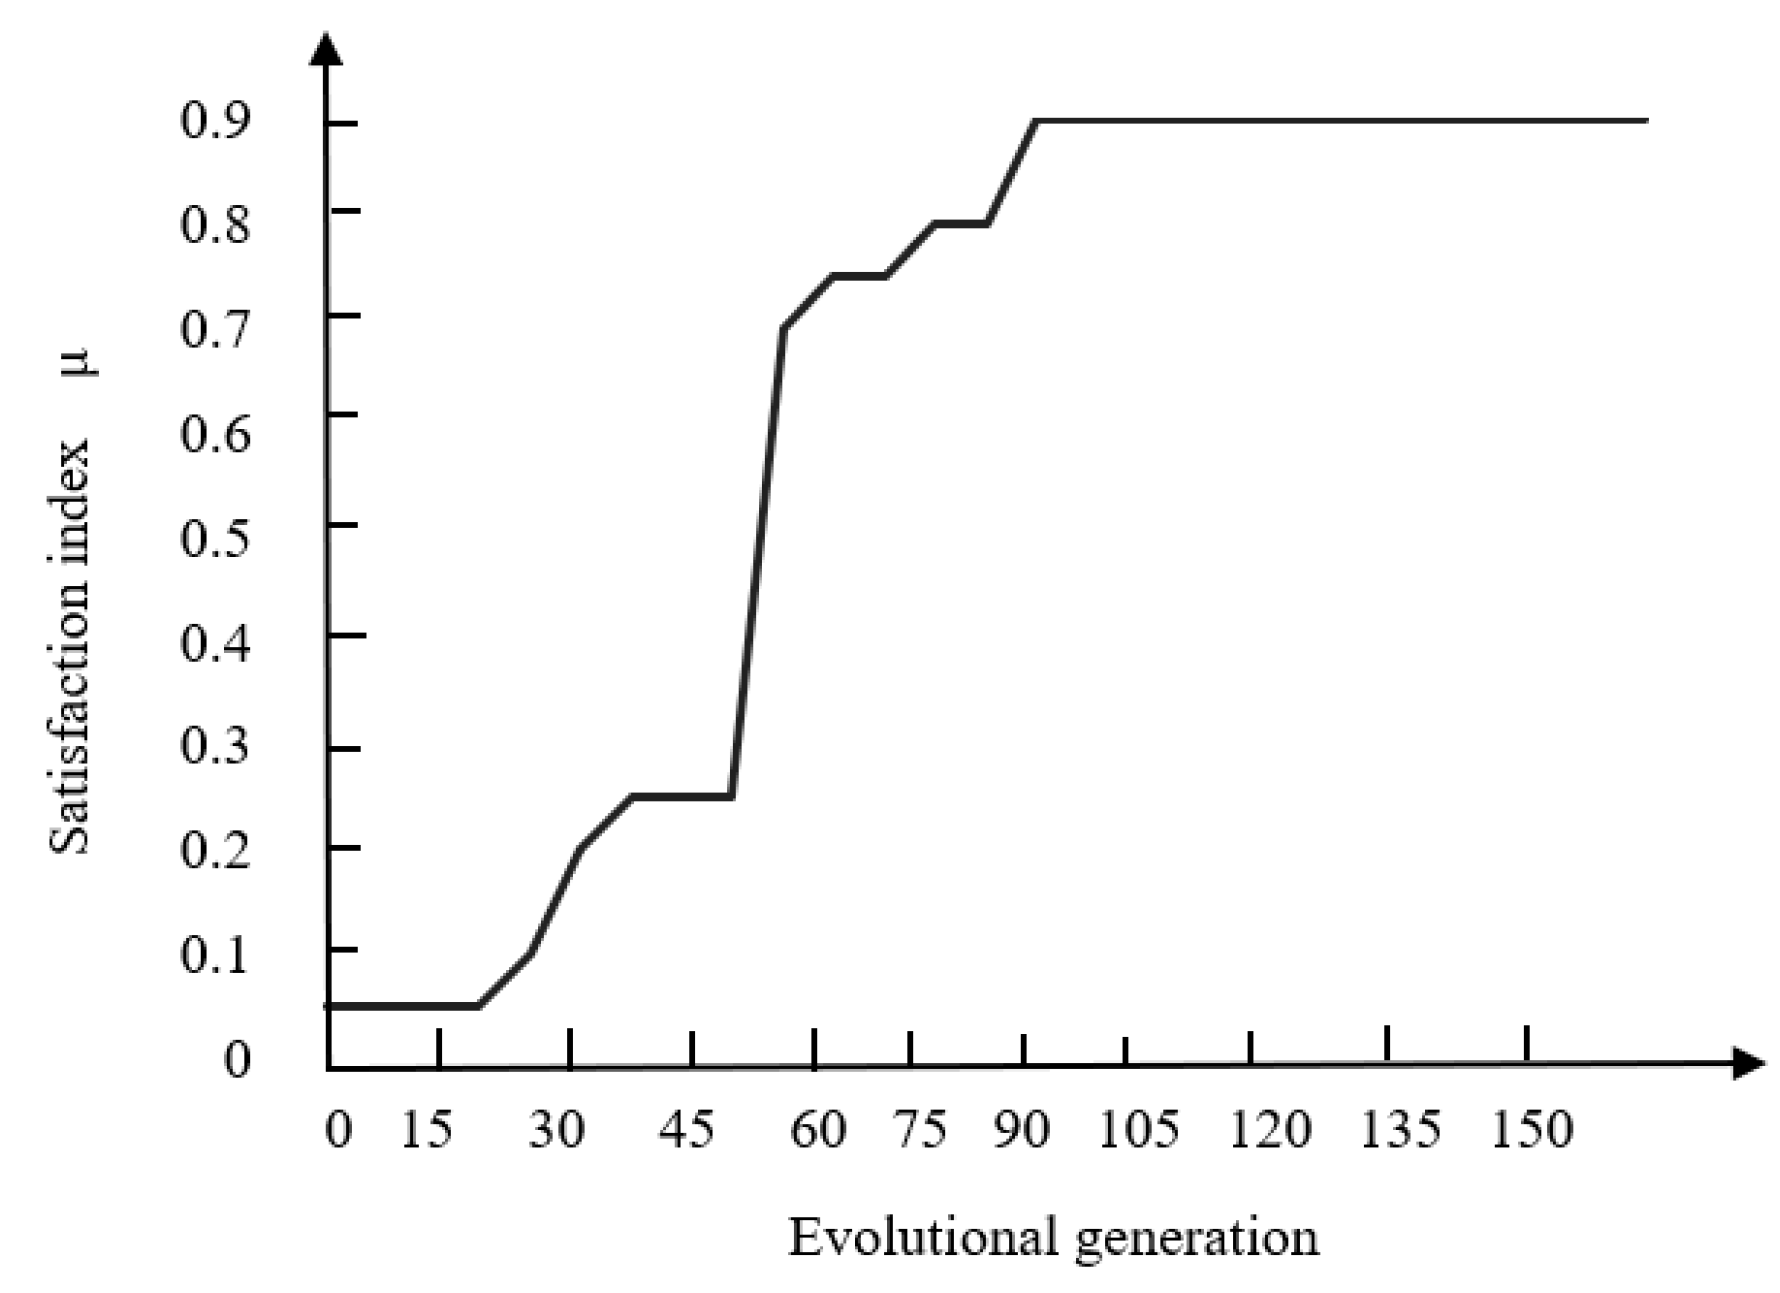
4.4. Genetic Algorithm Solution

The model of this study is a multi-objective and multi-constraint optimization problem, which is relatively complicated to solve. These algorithms have been widely used in power systems [75,76], car charging station layouts [77,78]. Therefore, this study intends to use this algorithm to solve the established model. The specific process is shown in Figure 5.

5. Scenario Design and Case Analysis

5.1. Information About Case

This section will take the development scale of NEVs and the scenario design goal of carbon emission reduction in the transportation field from 2022 to 2025 as an example for simulation experiments.
According to GM (1,1), the annual sales volume of NEVs in the domestic market from 2022 to 2025 is obtained as the lower limit of vehicle production in that year. On this basis, the carbon emissions and profits of vehicles manufactured by enterprises are calculated respectively. The carbon emissions of passenger cars will peak in 2027, with an annual emission of about 940 million tons (excluding the carbon emissions of vehicle cycles) [79]. According to the statistics of the China Automobile Association, the proportion of vehicle cycle carbon emissions in the life cycle of the passenger vehicle fleet is 26% [80], and it is estimated that by 2025, the emissions in the material production phase of electric vehicles will account for 55% [81], so the total limit of vehicle cycle carbon emissions of passenger vehicles is 330 million tons. According to previous data, the proportion of NEVs in China’s carbon emissions in the automotive industry is about 5% [82]. According to the survey, the cost of NEVs is about 85% of the price of the vehicle [83]. In Section 3.1.2 of this study, the sales volume of NEVs from 2022 to 2025 is predicted. The scope of this case analysis is the production of NEVs, corresponding corporate profits and carbon emissions from 2022 to 2025. The relevant data (Table 2) and parameters (Table 3) of materials required for automobile manufacturing are shown below, and the process of automobile production and manufacturing is shown in Figure 6.

5.2. Analysis of the Results of the Case

GA is used to solve the optimization model when only the optimization objectives (7) and (8) are considered. The sub-objectives in the optimization model are respectively fuzzified according to Equations (15) and (16), so as to transform the original multi-objective optimization problem into a single-objective optimization problem based on maximum satisfaction, and then the single-objective optimization model is solved by GA. The satisfaction of the optimal planning scheme of each evolutionary generation in the optimization is shown in Figure 7; the final optimization result is shown in Figure 8.
It can be seen from Figure 7 that in the process of evolution, the satisfaction of the best individuals in the population has steadily improved and reached the optimal value of 0.90 after 100 generations, and the program time is 0.528 s, which shows that GA has good convergence in solving the optimization problem of automobile production planning.
It can be seen from the results in Figure 8 that if only the maximum annual profit of the enterprise is considered, the corresponding output of NEVs from 2022 to 2025 will be 10.752 million, 15.977 million, 20.597 million and 25.693 million respectively. In these four years, the corresponding total profit of the enterprise can reach the theoretical maximum value f 1 ( x ) , but the carbon emissions are relatively large. On the contrary, if only the goal of minimum carbon emissions is considered, the profits of enterprises will be reduced accordingly. Although the carbon emission can also reach its theoretical minimum value f 2 ( x ) , in fact, these two nodes often do not coincide in the system. Therefore, the two sub-objectives of the production planning model are contradictory to a certain extent, and it is difficult to achieve the optimum at the same time.
Secondly, it can be clearly seen that the output of NEVs to minimize annual carbon emissions is closer to the optimal value (the result of multi-objective optimization). This is because when solving the satisfaction model, the membership degrees of the two sub-objectives in the original optimization model are calculated to be η ( f 1 ( x ) ) = 0.90 and η ( f 2 ( x ) ) = 0.95 respectively. The closer the membership degrees are to 1, the more satisfactory the corresponding scheme is. Therefore, the result of minimizing the objective is closer to the result of multi-objective optimization.
Through further analysis, it can be seen that a more reasonable planning result can be obtained by using the fuzzy multi-objective optimization method. Although each sub-optimization objective has not reached its theoretical optimal value, its satisfaction index is above 0.90. Specifically, in 2022, the maximum profit value that the enterprise can obtain will be decreased from 57.516 billion yuan to 51.505 billion yuan, a decrease of 10.53%. At this time, the output of automobiles will be 7.016 million, and the annual carbon emissions in the automobile manufacturing stage will also be decreased from 9.521 million tons to 6.247 million tons, a decrease of 34.39%.
From Figure 9a, we can know that the production of MVs and FCVs keeps increasing with the growth over the years. This is benefited from the implementation of the government’s promotion policy [84,85] and the efforts of related auto companies in R&D. Under the fuzzy multi-objective optimization scheme, there is a certain gap between the production of BEVs and PHEVs in different price ranges. The proportion of PHEVs with a sales price of 100,000 yuan to 200,000 yuan and 200,000 yuan to 300,000 yuan has decreased, while the proportion of cars with a price of more than 300,000 yuan has increased. By 2025, its value will be 34.76%, which is close to 1/3 of the production of PHEVs in the market. It can be seen that vehicles of mid-to-high-end models are increasingly becoming the main sales force in the new energy vehicle market.
Figure 9b shows the proportion of the output of different types of NEVs in the market. From 2022 to 2025, BEVs are still the main force in the development of China’s new energy vehicle market, with their market share of more than75%. The output of PHEVs has also changed correspondingly, but not less than 19%. However, FCVs and MVs have not been popularized nationwide. Therefore, local governments have issued relevant promotion policies according to local conditions. Under the guidance of policies and the active implementation of major auto enterprises, the output of FCVs and MVs will rise significantly in 2024 and 2025, which is of great significance for further accelerating China’s auto industry to achieve the goal of “dual carbon”.

5.3. Sensitivity Analysis

(1)
Changes in the discount rate
On 31 December 2021, China’s four ministries and commissions issued the Notice on the Fiscal Subsidy Policy for the Promotion and Application of NEVs in 2022, which clarifies the policy that “the subsidy standard for NEVs in 2022 will be 30% lower than that in 2021”, and that more than 300,000 yuan new energy vehicles will not be supplemented (excluding vehicles in the “power change” mode) [86]. All major auto enterprises have to raise the sales price to ensure the stability of revenue. Therefore, this section will analyze how the output, annual carbon emissions and corporate profits of NEVs change on the basis of the same cost of vehicles.
In this study, the value of the initial discount rate i j k is set as 0.12. Figure 10 shows the output of NEVs, annual carbon emissions in the automobile manufacturing stage and the change rate of enterprise profits based on the discount rate. It can be clearly seen that changes in the discount rate of car manufacturers will significantly affect consumers’ demand for NEVs, thereby affecting the output of automobiles and the profits of enterprises.
(2)
Body lightweight
This section analyzes the impact on the changes in the amount of high-strength steel and aluminum alloy on the carbon emissions in the vehicle manufacturing stage and the change in the output of NEVs.
Figure 11a shows the results obtained by comparing the optimal output in 2022 under the multi-objective optimization scheme. Compared with aluminum alloy, the output of NEVs is more sensitive to the use of high-strength steel, and the more high-strength steel is used, the more the output of NEVs will increase.
Figure 11b shows the changes in carbon emissions of BEVs, PHEVs, FCVs and MVs in the manufacturing stage of high-strength steels and aluminum alloys under different usage ratios. It can be seen that the change in the proportion of steel use is more significant than that of aluminum alloy for the carbon emission change in the manufacturing stage of the four NEVs. This is because the proportion of aluminum use is relatively low. It can be found from Figure 11b that the change in the use of high-strength steel is the most obvious for the carbon emission change of FCVs in the manufacturing process, which further indicates that steel accounts for the largest proportion of FCVs in the main body among the four models, accounting for 64.3%, and the carbon emission of FCVs in the manufacturing process is also the largest, which has a great relationship with the complexity of manufacturing fuel cell systems [87]. However, PHEVs take second place, because PHEVs’ oil-electric hybrid system makes their carbon emissions in the manufacturing process higher than BEVs. Finally, it is only observed from Figure 11b that the change in aluminum alloy usage is not obvious for the change in carbon emissions of the four vehicles. Through the analysis of data, it is known that the change in carbon emissions of BEVs is greater than that of the other three vehicles, indicating that aluminum materials account for a larger proportion of BEVs. The conclusion obtained from Figure 11b shows that the change in the use of high-strength steel is significant compared with the change in carbon emissions of aluminum alloy in the manufacturing stage of NEVs. Therefore, under the total carbon emission quota, the change in the use of high-strength steel is more significant than the change in the output of NEVs.

6. Conclusions and Policy Implications

In order to analyze the long-term development level of China’s NEVs (BEVs, PHEVs, FCVs and MVs). Although PHEVs retain the internal combustion engine, they combine the advantages of traditional fuel vehicles and pure electric vehicles in improving energy efficiency, replacing electricity part of the time, and reducing emissions, which has particular potential for energy saving and emission reduction. we forecast the sales volume of China’s NEVs from 2022 to 2025 based on the grey prediction model GM (1,1) and build a multi-objective optimization model with the minimum carbon emissions in the automobile manufacturing stage and the maximum annual profits of enterprises. This study also uses the Sigmoid function to fuzzifier the multi-objective, and the genetic algorithm is applied to solve the final goal, so as to explore the optimal output of China’s NEVs during the 14th Five-Year Plan period and the maximum profit that enterprises can obtain. On this basis, we conducted a sensitivity analysis on the “recession” of subsidies for purchasing NEVs and the impact of body lightweight on the environmental benefits of vehicles, and explored the impact of changes in these two factors on the output of NEVs, corporate profits and carbon emissions generated by automobile manufacturing. The main conclusions of the study are as follows:
(1) In the solution of the multi-objective optimization scheme, the output of NEVs obtained with the goal of minimizing the carbon emissions in the automobile manufacturing stage is closer to the optimal value, and the optimization results reduce the total carbon emissions of automobiles in the manufacturing stage by 34%, while the annual profits of enterprises in the multi-objective optimization scheme are closer to the results obtained with the goal of maximizing the profits of enterprises. 34% is optimal for minimizing carbon emissions and maximizing profits, which the proposed multi-objective model calculates. The result provides an important reference point for policymakers and industry practitioners. Therefore, it can be seen that the production planning scheme in this study has certain advantages, which can not only achieve a significant emission reduction effect but also help enterprises to obtain better profits as much as possible.
(2) In the optimized production planning scheme, the output of BEVs priced below 100,000 yuan and above 300,000 yuan accounted for the largest proportion of production, indicating that BEVs in these two price ranges are more popular with consumers. However, PHEVs with a price of more than 300,000 yuan have always had a relatively large proportion in the market. Compared with PHEVs at other prices, they have more advantages and are more popular with consumers. In contrast, the current production proportion of FCVs and MVs in the market is still relatively small. With the continuous introduction of promotion policies and the commitment of major automobile enterprises to research and development, the production of these two vehicles will continue to rise, and will occupy an important position in the NEVs’ market after 2024 and 2025.
(3) From the perspective of changes in corporate discount rates, the reduction of corporate discounts has affected the sales of NEVs, reduced their production and reduced the total carbon emissions of automobile manufacturing, thus reducing the company’s annual profits.
(4) From the perspective of body lightweight, the sensitivity of the change in the use of high-strength steel and aluminum alloy to the production of NEVs and the change in carbon emissions in the manufacturing stage is different. This is related to the different proportions of steel and aluminum in the raw materials of the vehicle body in different models. The change in the use of high-strength steel has the largest impact on the carbon emissions of FCVs in the manufacturing stage, while the change in the use of aluminum alloy has more a significant impact on the carbon emissions of BEVs than the other three vehicles.
Overall, China’s NEVs have a good development prospect. However, while focusing on the development of the industry, we cannot ignore the pollution caused by the manufacturing process of automobiles. Enterprises should reasonably plan the output of NEVs and strive for maximum profit as far as possible under the condition of meeting the market demand. This study provides a reference scheme and value for the production planning of new energy vehicle enterprises in China. The direction of future research can start with the change in subsidy policy and the price of power battery raw materials. By analyzing the impact of the changes in subsidy policies on the output of NEVs, especially the output of vehicles with a price of more than 300,000 yuan, we can better help enterprises to plan the best production plan. At the same time, automobile enterprises can also strive for greater profits on the basis of effective control of carbon emissions in the production stage. This is of great significance for the good development of NEVs in China.
Based on the above conclusions, the following policy implications are proposed:
(1) For the plan to formulate the production planning of NEVs, enterprises cannot ignore the carbon emissions generated by the automobile in the manufacturing stage while pursuing profits. The government can increase the constraints on enterprises by formulating corresponding carbon tax policies or carbon emission reduction targets, and supervise enterprises to assume their social responsibility to protect the environment.
(2) As for the government’s subsidy for purchasing NEVs, different enterprises can determine the sales discount according to their development (based on Section 5.3 (1)). Although the support of the central government is limited, the local government should provide technical subsidies and related industry research and development funds according to the actual situation, especially support for fuel cell vehicles and methanol vehicles with good development momentum in the future, so as to inject new momentum into the development of the new energy vehicle market.
(3) Manufacturers should accelerate the research and development and application of body lightweight technology to reduce the use of raw materials with high carbon emissions. The government can use certain economic means to provide technical support and encourage enterprises to reasonably increase the proportion of light materials such as high-strength steel and aluminum alloys used in automobile manufacturing (based on Section 5.3 (2)), so as to effectively reduce carbon emissions by reducing the vehicle equipment quality while ensuring the vehicle power and enable NEVs to truly achieve energy conservation and emission reduction. Regarding the selection of body materials, this study has fully considered the advantages of lightweight materials (aluminum alloy, titanium alloy, carbon fiber, etc.) in terms of energy saving and emission reduction. However, applying these advanced materials also faces the challenge of cost control. Therefore, the material’s physical properties, cost, and production process should be considered comprehensively in the practical application to achieve the best energy-saving and emission-reduction effect.

Author Contributions

L.X.: Writing—original draft, Writing-review & editing, Formal analysis, Supervision, Validation; F.Y.: Writing—original draft, Conceptualization, Methodology, Formal analysis; Y.Y.: Methodology, Writing—review & editing, Visualization; C.C.: Formal analysis, Supervision, Validation; W.H.: Formal analysis, Supervision. All authors have read and agreed to the published version of the manuscript.

Funding

This work was supported by the Guizhou Office of Philosophy and Social Science Planning China [grant numbers 22GZQN20].

Institutional Review Board Statement

Not applicable.

Informed Consent Statement

Not applicable.

Data Availability Statement

Data will be made available on reasonable request.

Conflicts of Interest

The author declare that they have no known competing financial interests or personal relationships that could have appeared to influence the work reported in this study.

Abbreviations

NEVs: New Energy Vehicles; MVs: Methanol Vehicles; BEVs: Blade Electric Vehicles; PHEVs: Plug-in Hybrid Electric Vehicles; FCVs: Fuel Cell Vehicles; GM: Grey Model; GA: Genetic Algorithm.

Appendix A

Appendix A.1. The Steps of Grey Model GM (1,1) Are as Follows

(1)
Accumulate the original data to obtain a new data sequence:
x ( 1 ) ( t ) = ( x ( 1 ) ( 1 ) , x ( 1 ) ( 2 ) , x ( 1 ) ( 3 ) , , x ( 1 ) ( 9 ) , x ( 1 ) ( 10 ) )
where each data of x ( 1 ) ( t ) represents the accumulation of the previous data. Therefore,
x ( 1 ) ( t ) = k = 1 t x ( 0 ) ( k ) , t = 1 , 2 , 10
(2)
The first order linear differential equation of x ( 1 ) ( t ) is established based on year t:
d ( x ) ( 1 ) d t + a ( x ) ( 1 ) = u
In the above formula, the parameter of a is called development coefficient, u is the grey action, and both are unknown coefficients to be solved. Note that the matrix composed by a and u is U ^ = ( a   u ) . As long as the parameters of a and u are calculated, x ( 1 ) ( t ) can be obtained and then the predicted value of x ( 0 ) ( t ) .
(3)
Generate B and constant vector Y by averaging the accumulated data, that is:
B = 1 2 ( x ( 1 ) ( 1 ) + x ( 1 ) ( 2 ) )   1 1 2 ( x ( 1 ) ( 2 ) + x ( 1 ) ( 3 ) )   1 1 2 ( x ( 1 ) ( 8 ) + x ( 1 ) ( 9 ) )   1 1 2 ( x ( 1 ) ( 9 ) + x ( 1 ) ( 10 ) )   1 ,   Y = x ( 0 ) ( 2 ) x ( 0 ) ( 3 ) x ( 0 ) ( 9 ) x ( 0 ) ( 10 )
(4)
Solving grey parameter U ^ by the least square method
U ^ = ( a   u ) = ( B T B ) 1 B T Y
(5)
Substitute the grey parameter U ^ into (1.4) and solve.
x ^ ( 1 ) ( t + 1 ) = ( x ( 0 ) ( 1 ) u a ) e a t + u a t = 1 , 2 , 3 , , 9 , 10
In the above formula, U ^ is the approximate value calculated by the least square method, so x ^ ( 1 ) ( t + 1 ) is a value approximate to x ( 1 ) ( t + 1 ) . In order to distinguish between them, it is recorded as x ^ ( 1 ) ( t + 1 ) .
(6)
Discrete the function expressions x ^ ( 1 ) ( t + 1 ) and x ^ ( 1 ) ( t ) , and make a difference between them to restore the original sequence of x ( 0 ) . The approximate data sequence is as follows:
x ^ ( 0 ) ( t + 1 ) = x ^ ( 1 ) ( t + 1 ) x ^ ( 1 ) ( t )

Appendix A.2. Model Inspection and Precision Analysis

(1)
Calculate the residual ε ( 0 ) ( t ) and relative error ε ^ ( x ) between x ( 0 ) ( t ) and x ( 0 ) ,
ε ( 0 ) ( t ) = x ( 0 ) x ^ ( 0 ) ( t ) , t = 1 , 2 , , 10
ε ^ ( x ) = ε ( 0 ) ( t ) x ( 0 ) ( t )
Then the average relative error is:
ψ ¯ = 1 10 1 t = 1 10 ε ( 0 ) ( t ) x ( 0 ) ( t )
(2)
Calculate the mean and variance S1 of the original data x ( 0 )
S 1 = t = 1 10 x ( 0 ) ( t ) x ( 0 ) ( t ) ¯ 10
x ( 0 ) ( t ) ¯ = 1 10 t = 1 10 x ( 0 ) ( t )
(3)
Calculate the average value ε ¯ of ε ( 0 ) ( t ) and the variance S2 of the residual.
ε ¯ = 1 10 t = 1 10 ε ( 0 ) ( t )
S 2 = t = 1 10 ε ( 0 ) ( t ) ε ¯ 10
(4)
Calculate variance ratio C
C = S 1 S 2

References

  1. Li, C.; Negnevitsky, M.; Wang, X.; Yue, W.L.; Zou, X. Multi-criteria analysis of policies for implementing clean energy vehicles in China. Energy Policy 2019, 129, 826–840. [Google Scholar] [CrossRef]
  2. Li, P.; Xia, X.; Guo, J. A review of the life cycle carbon footprint of electric vehicle batteries. Sep. Purif. Technol. 2022, 296, 121389. [Google Scholar] [CrossRef]
  3. Liang, L.; Mei, Q.; Li, C. Does “Dual Credit Policy” Really Matter in Corporate Competitiveness? Sustainability 2024, 16, 6991. [Google Scholar] [CrossRef]
  4. Robles, J.O.; Azzaro-Pantel, C.; Garcia, G.M.; Lasserre, A.A. Social cost-benefit assessment as a post-optimal analysis for hydrogen supply chain design and deployment: Application to Occitania (France). Sustain. Prod. Consum. 2020, 24, 105–120. [Google Scholar] [CrossRef]
  5. Irfan, M.; Hao, Y.; Ikram, M.; Wu, H.; Akram, R.; Rauf, A. Assessment of the public acceptance and utilization of renewable energy in Pakistan. Sustain. Prod. Consum. 2021, 27, 312–324. [Google Scholar] [CrossRef]
  6. Li, C.; Negnevitsky, M.; Wang, X.; Wang, H.; Hu, Y. Evaluating Consumer Acceptance of the Commercial Fleet of Methanol Vehicles in China. Front. Energy Res. 2021, 9, 792982. [Google Scholar] [CrossRef]
  7. International Energy Agency (IEA). Reliable, Affordable Access to All Fuels and Energy Sources. 2024. Available online: https://www.iea.org/topics/energy-security (accessed on 1 September 2024).
  8. Jia, T.; Li, C.; Wang, H.; Hu, Y.-J.; Wang, S.; Xu, G.; Hoang, A.T. Subsidy policy or dual-credit policy? Evolutionary game analysis of green methanol vehicles promotion. Energy 2024, 293, 130763. [Google Scholar] [CrossRef]
  9. Chen, Q.; Li, C. The Green Paradox in NEV Manufacturing: Regulatory Impacts on Innovation from a Stakeholder Perspective. Energies 2024, 17, 3508. [Google Scholar] [CrossRef]
  10. Yang, Y.; Li, Q.; Li, C.; Qin, Q. User Requirements Analysis of New Energy Vehicles Based on Improved Kano Model. Energy 2024, 309, 133134. [Google Scholar] [CrossRef]
  11. Li, C.; Jia, T.; Wang, H.; Wang, X.; Negnevitsky, M.; Hu, Y.-J.; Zhao, G.; Wang, L. Assessing the prospect of deploying green methanol vehicles in China from energy, environmental and economic perspectives. Energy 2023, 263, 125967. [Google Scholar] [CrossRef]
  12. Li, S.; Wang, D.; Wang, S.; Zhou, C. Structure–connection–performance integration lightweight optimisation design of multimaterial automotive body skeleton. Struct. Multidiscip. Optim. 2023, 66, 198. [Google Scholar] [CrossRef]
  13. Liu, B.; Zhang, Q.; Liu, J.; Hao, Y.; Tang, Y.; Li, Y. The impacts of critical metal shortage on China’s electric vehicle industry development and countermeasure policies. Energy 2022, 248, 123646. [Google Scholar] [CrossRef]
  14. Ma, S.-C.; Xu, J.-H.; Fan, Y. Characteristics and key trends of global electric vehicle technology development: A multi-method patent analysis. J. Clean. Prod. 2022, 338, 130502. [Google Scholar] [CrossRef]
  15. Aguilar, P.; Groß, B. Battery electric vehicles and fuel cell electric vehicles, an analysis of alternative powertrains as a mean to decarbonise the transport sector. Sustain. Energy Technol. Assess. 2022, 53, 102624. [Google Scholar] [CrossRef]
  16. Li, C.; Hao, Q.; Wang, H.; Hu, Y.-J.; Xu, G.; Qin, Q.; Wang, X.; Negnevitsky, M. Assessing green methanol vehicles’ deployment with life cycle assessment-system dynamics model. Appl. Energy 2024, 363, 123055. [Google Scholar] [CrossRef]
  17. Ren, J.; Toniolo, S. Life cycle sustainability decision-support framework for ranking of hydrogen production pathways under uncertainties: An interval multi-criteria decision making approach. J. Clean. Prod. 2018, 175, 222–236. [Google Scholar] [CrossRef]
  18. Hu, Y.-J.; Yang, L.; Cui, H.; Wang, H.; Li, C. Developing a balanced strategy: A multi-objective model for emissions reduction and development of civil aviation in China. Energy 2024, 307, 132597. [Google Scholar] [CrossRef]
  19. Chen, Z.; Shen, Q.; Sun, N.; Wei, W. Life cycle assessment of typical methanol production routes: The environmental impacts analysis and power optimization. J. Clean. Prod. 2019, 220, 408–416. [Google Scholar] [CrossRef]
  20. García, I.; Miguel, L.J. Is the electric vehicle an attractive option for customers? Energies 2012, 5, 71–91. [Google Scholar] [CrossRef]
  21. Perčić, M.; Vladimir, N.; Fan, A. Techno-economic assessment of alternative marine fuels for inland shipping in Croatia. Renew. Sustain. Energy Rev. 2021, 148, 111363. [Google Scholar] [CrossRef]
  22. Oliveira, G.D.; Dias, L.C. Influence of Demographics on Consumer Preferences for Alternative Fuel Vehicles: A Review of Choice Modelling Studies and a Study in Portugal. Energies 2019, 12, 318. [Google Scholar] [CrossRef]
  23. Wang, S.; Li, C.; Hu, Y.-J.; Wang, H.; Xu, G.; Zhao, G.; Wang, S. Assessing the prospect of bio-methanol fuel in China from a life cycle perspective. Fuel 2024, 358, 130255. [Google Scholar] [CrossRef]
  24. Sun, X.; Li, Z.; Wang, X.; Li, C. Technology Development of Electric Vehicles: A Review. Energies 2019, 13, 90. [Google Scholar] [CrossRef]
  25. Zhang, C.; Liu, C.; Wang, Y. A fuzzy multi-objective optimization-based evaluation model of wind power accommodation capability. Power Syst. Technol. 2015, 39, 426–431. [Google Scholar] [CrossRef]
  26. Yao, C. Lightweight automotive design technology and material application analysis. In Proceedings of the 2019 4th International Conference on Mechanical, Control and Computer Engineering (ICMCCE 2019), Hohhot, China, 24–26 October 2019; pp. 514–519. [Google Scholar] [CrossRef]
  27. Burd, J.T.J.; Moore, E.A.; Ezzat, H.; Kirchain, R.; Roth, R. Improvements in electric vehicle battery technology influence vehicle lightweighting and material substitution decisions. Appl. Energy 2021, 283, 116269. [Google Scholar] [CrossRef]
  28. Gao, Y.; Zou, X.; Chen, R.; Ma, Y.; Li, C.; Zhang, Y. Freight Mode Coordination in China: From the Perspective of Regional Differences. Sustainability 2020, 12, 2996. [Google Scholar] [CrossRef]
  29. Duan, L.; Xiao, N.C.; Hu, Z.; Li, G.; Cheng, A. An efficient lightweight design strategy for body-in-white based on implicit parameterization technique. Struct. Multidiscip. Optim. 2017, 55, 1927–1943. [Google Scholar] [CrossRef]
  30. Attir, A.; Naït-Abdesselam, F.; Faraoun, K.M. Lightweight anonymous and mutual authentication scheme for wireless body area networks. Comput. Netw. 2023, 224, 109625. [Google Scholar] [CrossRef]
  31. Li, C.; Jia, T.; Wang, S.; Wang, X.; Negnevitsky, M.; Wang, H.; Hu, Y.; Xu, W.; Zhou, N.; Zhao, G. Methanol Vehicles in China: A Review from a Policy Perspective. Sustainability 2023, 15, 9201. [Google Scholar] [CrossRef]
  32. Anyasodor, G.; Koroschetz, C. Industrial based volume manufacturing of lightweight aluminium alloy panel components with high-strength and complex-shape for car body and chassis structures. J. Phys. Conf. Ser. 2017, 896, 012093. [Google Scholar] [CrossRef]
  33. Tisza, M.; Lukács, Z. High strength aluminum alloys in car manufacturing. In International Deep Drawing Research Group 37th Annual Conference, 37th Annual Conference of the International-Deep-Drawing-Research-Group (IDDRG)—Forming of High Performance Sheet Materials and Components; Worswick, M., Butcher, C., Bardelcik, A., Eds.; IOP Publishing: Bristol, UK, 2018. [Google Scholar] [CrossRef]
  34. Yang, L.; Yu, B.; Yang, B.; Chen, H.; Malima, G.; Wei, Y.-M. Life cycle environmental assessment of electric and internal combustion engine vehicles in China. J. Clean. Prod. 2021, 285, 124899. [Google Scholar] [CrossRef]
  35. Zhao, G.; Wang, X.; Negnevitsky, M.; Li, C. An up-to-date review on the design improvement and optimization of the liquid-cooling battery thermal management system for electric vehicles. Appl. Therm. Eng. 2023, 219, 119626. [Google Scholar] [CrossRef]
  36. Zhang, L.; Qin, Q. China’s new energy vehicle policies: Evolution, comparison and recommendation. Transp. Res. Part A Policy Pract. 2018, 110, 57–72. [Google Scholar] [CrossRef]
  37. Zheng, W.; Li, Y.; Zhang, M.; Shao, Z.; Wang, X. Reliability evaluation and analysis for NEV charging station considering the impact of charging experience. Int. J. Hydrogen Energy 2022, 47, 3980–3993. [Google Scholar] [CrossRef]
  38. Lan, H.; Hao, D.; Hao, W.; He, Y. Development and comparison of the test methods proposed in the Chinese test specifications for fuel cell electric vehicles. Energy Rep. 2022, 8, 565–579. [Google Scholar] [CrossRef]
  39. Ullah, K.; Hamid, S.; Mirza, F.M.; Shakoor, U. Prioritizing the gaseous alternatives for the road transport sector of Pakistan: A multi criteria decision making analysis. Energy 2018, 165, 1072–1084. [Google Scholar] [CrossRef]
  40. Xue, F.; Huang, Q.; He, C.; Pathak, B. Using an Entropy-GRA, TOPSIS, and PCA Method to Evaluate the Competitiveness of AFVs—The China Case. Promet-Zagreb 2020, 32, 655–666. [Google Scholar] [CrossRef]
  41. Li, C.; Negnevitsky, M.; Wang, X. Prospective assessment of methanol vehicles in China using FANP-SWOT analysis. Transp. Policy 2020, 96, 60–75. [Google Scholar] [CrossRef]
  42. Sehatpour, M.-H.; Kazemi, A.; Sehatpour, H.-E. Evaluation of alternative fuels for light-duty vehicles in Iran using a multi-criteria approach. Renew. Sustain. Energy Rev. 2017, 72, 295–310. [Google Scholar] [CrossRef]
  43. Ma, Y.; Shi, T.; Zhang, W.; Hao, Y.; Huang, J.; Lin, Y. Comprehensive policy evaluation of NEV development in China, Japan, the United States, and Germany based on the AHP-EW model. J. Clean. Prod. 2019, 214, 389–402. [Google Scholar] [CrossRef]
  44. Ren, J.; Ren, X.; Shen, W.; Man, Y.; Lin, R.; Liu, Y.; He, C.; Manzardo, A.; Toniolo, S.; Dong, L. Industrial system prioritization using the sustainability-interval-index conceptual framework with life-cycle considerations. AIChE J. 2020, 66, e16961. [Google Scholar] [CrossRef]
  45. Zhili, D.; Boqiang, L.; Chunxu, G. Development path of electric vehicles in China under environmental and energy security constraints. Resour. Conserv. Recycl. 2019, 143, 17–26. [Google Scholar] [CrossRef]
  46. Dai, Z.; Zhang, B. Electric vehicles as a sustainable energy Technology: Observations from travel survey data and evaluation of adoption with Machine learning method. Sustain. Energy Technol. Assess. 2023, 57, 103267. [Google Scholar] [CrossRef]
  47. Wei, H.; Fan, L.; Ai, Q.; Zhao, W.; Huang, T.; Zhang, Y. Optimal energy allocation strategy for electric vehicles based on the real-time model predictive control technology. Sustain. Energy Technol. Assess. 2022, 50, 101797. [Google Scholar] [CrossRef]
  48. Dai, B.; Wang, H.; Li, B.; Li, C.; Tan, Z. Capacity model and optimal scheduling strategy of multi-microgrid based on shared energy storage. Energy 2024, 306, 132472. [Google Scholar] [CrossRef]
  49. Lonan, E.S.; Ardi, R. Electric Vehicle Diffusion in the Indonesian Automobile Market: A System Dynamics Modelling. In Proceedings of the 2020 IEEE International Conference on Industrial Engineering and Engineering Management (IEEE IEEM), Singapore, 14–17 December 2020; pp. 43–47. [Google Scholar]
  50. Jiao, Y.; Yu, L.; Wang, J.; Wu, D.; Tang, Y. Diffusion of new energy vehicles under incentive policies of China: Moderating role of market characteristic. J. Clean. Prod. 2022, 353, 131660. [Google Scholar] [CrossRef]
  51. Li, X.; Xiao, X.; Guo, H. A novel grey Bass extended model considering price factors for the demand forecasting of European new energy vehicles. Neural Comput. Appl. 2022, 34, 11521–11537. [Google Scholar] [CrossRef]
  52. Xian, Y.; Xia, M.; Su, S.; Guo, M.; Chen, F. Research on the Market Diffusion of Fuel Cell Vehicles in China Based on the Generalized Bass Model. IEEE Trans. Ind. Appl. 2022, 58, 2950–2960. [Google Scholar] [CrossRef]
  53. Kumar, R.R.; Guha, P.; Chakraborty, A. Comparative assessment and selection of electric vehicle diffusion models: A global outlook. Energy 2022, 238, 121932. [Google Scholar] [CrossRef]
  54. He, L.-Y.; Pei, L.-L.; Yang, Y.-H. An optimised grey buffer operator for forecasting the production and sales of new energy vehicles in China. Sci. Total. Environ. 2020, 704, 135321. [Google Scholar] [CrossRef] [PubMed]
  55. Celli, G.; Pilo, F.; Monni, G.; Soma, G.G. Optimal Multi-Objective Allocation of Fast Charging Stations. In Proceedings of the 2018 IEEE International Conference on Environment and Electrical Engineering and 2018 IEEE Industrial and Commercial Power Systems Europe (EEEIC/I&CPS Europe), Palermo, Italy, 12–15 June 2018; pp. 1–6. [Google Scholar]
  56. Lou, J.; Qiu, Z.; Yu, J.; Guo, C. Urban charging station location model based on multi-objective programming. J. Phys. Conf. Ser. 2018, 1053, 012028. [Google Scholar] [CrossRef]
  57. Battapothula, G.; Yammani, C.; Maheswarapu, S. Multi-Objective Optimal Scheduling of Electric Vehicle batteries in Battery Swapping Station. In Proceedings of the 2019 IEEE PES Innovative Smart Grid Technologies Europe (ISGT-Europe), Bucharest, Romania, 29 September–2 October 2019; pp. 1–5. [Google Scholar]
  58. Han, T.; Yan, Y.; Safar, B. Optimal integration of CCHP with electric Vehicle parking lots in energy hub. Sustain. Energy Technol. Assess. 2023, 58, 103324. [Google Scholar] [CrossRef]
  59. Swief, R.A.; El-Amary, N.H.; Kamh, M.Z. Optimal Energy Management Integrating Plug in Hybrid Vehicle Under Load and Renewable Uncertainties. IEEE Access 2020, 8, 176895–176904. [Google Scholar] [CrossRef]
  60. Hong, T.; Cao, J.; Zhao, W.; Lu, M. Electric Vehicle Charging Scheduling Algorithm Based on Online Multi-objective Optimization. In Proceedings of the 17th IEEE International Wireless Communications and Mobile Computing Conference (IEEE IWCMC), Harbin, China, 28 June–2 July 2021; pp. 1141–1146. [Google Scholar] [CrossRef]
  61. Kong, W.; Cai, T.; Fan, Y.; Jiang, F.; Wan, S. Multi-objective Optimal Charging Scheduling Strategy for Electric Vehicles Considering Traffic Flow, Power Grid, and Charging Stations. In International Conference On Intelligent Traffic Systems And Smart City (ITSSC 2021); Tan, G., Cen, F., Eds.; SPIE: Bellingham, WA, USA, 2022. [Google Scholar] [CrossRef]
  62. Sehatpour, M.-H.; Kazemi, A. Sustainable fuel portfolio optimization: Integrated fuzzy multi-objective programming and multicriteria decision making. J. Clean. Prod. 2018, 176, 304–319. [Google Scholar] [CrossRef]
  63. Zhou, X.; Qin, D.; Yao, M.; Xie, Z. Representation, generation, and optimization methodology of hybrid electric vehicle powertrain architectures. J. Clean. Prod. 2020, 256, 120711. [Google Scholar] [CrossRef]
  64. Yumiki, S.; Susuki, Y.; Oshikubo, Y.; Ota, Y.; Masegi, R.; Kawashima, A.; Ishigame, A.; Inagaki, S.; Suzuki, T. Autonomous vehicle-to-grid design for provision of frequency control ancillary service and distribution voltage regulation. Sustain. Energy Grids Netw. 2022, 30, 100664. [Google Scholar] [CrossRef]
  65. Eckert, J.J.; Barbosa, T.P.; Silva, F.L.; Roso, V.R.; Silva, L.C.; da Silva, L.A.R. Optimum fuzzy logic controller applied to a hybrid hydraulic vehicle to minimize fuel consumption and emissions. Expert Syst. Appl. 2022, 207, 117903. [Google Scholar] [CrossRef]
  66. Wang, X.; Sun, P.; Zuo, W.; Bai, J. Multi-objective optimization of automobile body frame considering weight, rigidity, and frequency for conceptual design. Adv. Mech. Eng. 2022, 14, 16878132221078495. [Google Scholar] [CrossRef]
  67. Yan, X. Energy demand and greenhouse gas emissions during the production of a passenger car in China. Energy Convers. Manag. 2009, 50, 2964–2966. [Google Scholar] [CrossRef]
  68. Qin, Q.; He, H.; Li, L.; He, L.-Y. A Novel Decomposition-Ensemble Based Carbon Price Forecasting Model Integrated with Local Polynomial Prediction. Comput. Econ. 2020, 55, 1249–1273. [Google Scholar] [CrossRef]
  69. Zhao, J.-H.; Zeng, D.-L.; Che, L.-P.; Zhou, T.-W.; Hu, J.-Y. Research on the profit change of new energy vehicle closed-loop supply chain members based on government subsidies. Environ. Technol. Innov. 2020, 19, 100937. [Google Scholar] [CrossRef]
  70. Guo, X. Multi-objective task scheduling optimization in cloud computing based on fuzzy self-defense algorithm. Alex. Eng. J. 2021, 60, 5603–5609. [Google Scholar] [CrossRef]
  71. Yin, L.; Sun, Z. Multi-layer distributed multi-objective consensus algorithm for multi-objective economic dispatch of large-scale multi-area interconnected power systems. Appl. Energy 2021, 300, 117391. [Google Scholar] [CrossRef]
  72. Mahajan, S.; Gupta, S.K. On fully intuitionistic fuzzy multiobjective transportation problems using different membership functions. Ann. Oper. Res. 2021, 296, 211–241. [Google Scholar] [CrossRef]
  73. Shojaeefard, M.H.; Mollajafari, M.; Pishe, N.E.; Mousavi, S.M. Plug-in fuel cell vehicle performance and battery sizing optimization based on reduced fuel cell energy consumption and waste heat. Sustain. Energy Technol. Assess. 2023, 56, 103099. [Google Scholar] [CrossRef]
  74. Medynskaya, M.K. Fuzzy set theory. The concept of fuzzy sets. In Proceedings of the 2015 XVIII International Conference on Soft Computing and Measurements (SCM), St. Petersburg, Russia, 19–21 May 2015; pp. 30–31. [Google Scholar]
  75. Mustapha, H.; Buhari, M.; Ahmad, A.S. An Improved Genetic Algorithm based Power System Stabilizer for power system stabilization. In Proceedings of the 2019 IEEE Africon, Accra, Ghana, 25–27 September 2019; pp. 1–5. [Google Scholar]
  76. Wang, Z.; Jia, Y.; Cai, C.; Chen, Y.; Li, N.; Yang, M.; Li, Q. Study on the Optimal Configuration of a Wind-Solar-Battery-Fuel Cell System Based on a Regional Power Supply. IEEE Access 2021, 9, 47056–47068. [Google Scholar] [CrossRef]
  77. Harighi, T.; Padmanaban, S.; Bayindir, R.; Hossain, E.; Holm-Nielsen, J.B. Electric Vehicle Charge Stations Location Analysis and Determination—Ankara (Turkey) Case Study. Energies 2019, 12, 3472. [Google Scholar] [CrossRef]
  78. Zheng, Y.; Xie, S.; Hu, Z.; Wang, J.; Kong, S. The optimal configuration planning of energy hubs in urban integrated energy system using a two-layered optimization method. Int. J. Electr. Power Energy Syst. 2020, 123, 106257. [Google Scholar] [CrossRef]
  79. Federation, A.E. Transformation and Challenges of the Automotive Industry in 2022, Prediction of the Time Point of Carbon Peak in the Automotive Industry, Emission Reduction Efforts and Realization Paths. 2022. Available online: https://www.vzkoo.com/read/20220825842b4500607976e0be38becf.html (accessed on 5 September 2022).
  80. Center, C.A.T.R. Research Report on China’s Low Carbon Automobile Action Plan. 2021. Available online: https://baijiahao.baidu.com/s?id=1705395243056129836&wfr=spider&for=pc (accessed on 5 September 2022).
  81. Federation, A.G.A.A. Transformation and Challenges: How Zero Emission Vehicle Transformation Can Help China Reach the Peak of Carbon and Reduce Carbon Emissions in the Automotive Industry. 2022. Available online: http://www.tanpaifang.com/tanguwen/2022/0119/81909.html (accessed on 5 September 2023).
  82. Center, C.A.T.R. Research Report on China’s Automobile Low Carbon Action Plan. 2022. Available online: https://www.cdmfund.org/31352.html (accessed on 5 September 2023).
  83. Shi, Y.; Wang, H.; Li, C.; Negnevitsky, M.; Wang, X. Stochastic optimization of system configurations and operation of hybrid cascade hydro-wind-photovoltaic with battery for uncertain medium- and long-term load growth. Appl. Energy 2024, 364, 123127. [Google Scholar] [CrossRef]
  84. Commission, G.D.A.R. Action Plan for Accelerating the Construction of Fuel Cell Vehicle Demonstration City Clusters in Guangdong Province (2022–2025). 2022. Available online: http://drc.gd.gov.cn/gkmlpt/content/3/3993/post_3993253.html#877 (accessed on 6 May 2023).
  85. Commission, G.D.A.R. The Latest Policy of Methanol Vehicles: Guizhou Province Issued the Support Policy for the Promotion and Application of Methanol Vehicles. 2022. Available online: http://www.nyjinghong.com.cn/page-22-243.html (accessed on 5 September 2023).
  86. Ministry Of Finance, M.O.I.A. Notice on the Financial Subsidy Policy for the Promotion and Application of New Energy Vehicles in 2022. 2021. Available online: http://jjs.mof.gov.cn/zhengcefagui/202112/t20211231_3780322.htm (accessed on 5 September 2023).
  87. Tanç, B.; Arat, H.T.; Conker, Ç.; Baltacioğlu, E.; Aydin, K. Energy distribution analyses of an additional traction battery on hydrogen fuel cell hybrid electric vehicle. Int. J. Hydrogen Energy 2019, 45, 26344–26356. [Google Scholar] [CrossRef]
Figure 1. The technology roadmap of the study.
Sustainability 16 08543 g001
Figure 2. Sales volume of NEVs in China from 2012 to 2021. Data source: China Automobile Industry Association.
Sustainability 16 08543 g002
Figure 3. Fitting curve between actual and forecast sales of NEVs in China from 2012 to 2025.
Sustainability 16 08543 g003
Figure 4. Membership function corresponding to the objective function.
Sustainability 16 08543 g004
Figure 5. Flow chart of solving with GA.
Sustainability 16 08543 g005
Figure 6. Process of automobile manufacturing.
Sustainability 16 08543 g006
Figure 7. The convergence of the algorithm.
Sustainability 16 08543 g007
Figure 8. Changes in output, carbon emissions, and annual profits of NEVs under different optimization objectives.
Sustainability 16 08543 g008
Figure 9. Proportion of output of NEVs in different price ranges under multi-objective optimization scheme. (a) Proportion of output. (b) Market share.
Sustainability 16 08543 g009
Figure 10. The change rate of new energy vehicle output, annual carbon emissions in the manufacturing stage and enterprise profits under different discount rates.
Sustainability 16 08543 g010
Figure 11. Incremental change in the proportion of the use of high-strength steel and aluminum alloy to the output of NEVs (a) and the change in carbon emissions of vehicles in the manufacturing stage (b).
Sustainability 16 08543 g011
Table 1. Meaning and specific explanation of indicators.
IndicesDescriptionVariables Related to Carbon Emissions
jVehicle type, j ∈ {1,2, …, n1}uThe items of parts and components
kAuto companies, k ∈ {1,2, …, g} a j i The quality of the i raw material of vehicle j
Variables related to enterprise profitsαnnThe processing utilization rate of the n material
xjkThe number of vehicles of type j produced by enterprise k β i f The conversion rate of the preparation process of the i material
RmaxMaximum carbon emissions of NEVs at the peak of carbon (annual/100 million tons) A f u The quantity of raw material f required for part u
PjkThe price of vehicle of type j sold by enterprise k W f , c o 2 The CO2 emission of the f unit mass raw material during acquisition
CjkThe cost of a vehicle of type j sold by enterprise k a z u × n Matrix of the mass of the n part required by component u
i j k Discount rate provided by enterprise k for consumer i who j-type vehicles(0 < j k < 1) W n , c o 2 The CO2 emission of the n part during the manufacturing
rijkIf rijk = 1, enterprise k offers discounts; if rijk = 0, enterprise k does not offer discounts a z Quality of vehicle materials consumed in the manufacturing process of parts processing
λjkIf λjk = 1, enterprise k produces vehicles of type j; If λjk = 0, enterprise k does not produce vehicles of type j a z i The quality of the i component of the vehicle
djThe demand for vehicles of type j s z i The CO2 emission intensity of the i component in the manufacturing process
C e n v , k The environmental pollution expenditure of enterprise kHRecovered parts and components
θ c o 2 The penalty price of CO2 (kg/yuan)AbThe matrix of materials in the scrap recycling process
M j k , c o 2 The CO2 emissions of vehicles in the manufacturing stage (kg)Wb1The matrix of CO2 emissions per unit mass of recovered materials
q*Price elasticity coefficientWb2The matrix of CO2 emission reduction per unit mass
Table 2. Emission factors of CO2 of vehicle raw materials in the manufacturing stage.
Name of MaterialThe Emission Factor of CO2 (kg·t−1)Name of MaterialThe Emission Factor of CO2 (kg·t−1)
Steel8.2copper18.382
Cast iron 0.942Glass1.471
Wrought aluminum19.436rubber2.908
Cast aluminum20.588plastic2.427
Table 3. Related parameters of the case.
Related ParametersNumerical Value
Vehicle mileage in one year (km)15,000.00
Carbon emissions of NEVs in vehicle cycle (100 million tons/year)0.165
The penalty price for CO2 emission (tons/yuan)50.00
The rate of discount on sales (%)88.00
Disclaimer/Publisher’s Note: The statements, opinions and data contained in all publications are solely those of the individual author(s) and contributor(s) and not of MDPI and/or the editor(s). MDPI and/or the editor(s) disclaim responsibility for any injury to people or property resulting from any ideas, methods, instructions or products referred to in the content.

