Abstract
Desert grasslands are a crucial component of terrestrial ecosystems that play vital roles in regional and global hydrological cycling, climate change, and ecosystem balance through variations in their soil moisture content (SMC). Despite this, current research on the SMC of desert grasslands remains insufficient, with many areas remaining underexplored. In this study, we focused on a typical desert grassland located in the northern foothills of the Yinshan Mountains. Ground-penetrating radar (GPR) exploration and soil sampling were used to test existing mixed-media models, and a new mixed-media model was calibrated using cross-validation methods. Among the three general mixed-media models, the Topp and Roth models yielded more accurate SMC estimates for the study area, with root mean square errors of 0.0091 g/cm3 and 0.0054 g/cm3, respectively, and mean absolute percentage errors of 25.86% and 19.01%, respectively, demonstrating their high precision. A comparison of the calibrated and original mixed-media models revealed that the estimation accuracy was significantly improved after parameter calibration. After parameter calibration, the Ferre model achieved an accuracy comparable to that of the Topp model. Parameter-calibrated models can be used to estimate the SMC using GPR data, offering a higher precision than general models and possessing greater suitability for the study area. The soil in the study area is primarily composed of sand particles and is therefore more compatible with the parameters of the Topp model, whereas the Ferre model requires further parameter calibration to achieve effective application.
1. Introduction
Studying the soil moisture content (SMC) is of great importance on a global scale. Understanding the SMC helps to optimize agricultural production, manage water resources, cope with climate change, and protect ecosystems, thereby also promoting sustainable development and environmental adaptability [1,2,3]. As an important component of terrestrial ecosystems, changes in the SMC of desert steppe ecosystems are crucial to regional and global hydrological cycling, climate change, and ecosystem balance [4,5]. In central and western Inner Mongolia, both typical and desert grasslands are sensitive to global changes due to the fragility and volatility of their climatic conditions and the impact of complex social factors related to human activities [6,7]. However, the vegetation productivity, soil fertility, and ecosystem stability of desert steppe ecosystems are generally lower than those of other semi-arid grasslands. Therefore, desert steppes are considered to be fragile grassland ecosystems that are highly sensitive to grazing disturbance [8,9]. The SMC is a key indicator that can be used to measure the stability and health status of desert steppes.
Studying the SMC contributes to improving the understanding of water cycling processes within desert grassland ecosystems and supplies critical parameters for climate models, thereby augmenting their predictive capacity for future climate scenarios [10]. The advancement of agriculture and livestock farming in desert grassland areas is constrained by their soil moisture conditions; as a result, gaining insights into the distribution and variability of the SMC can inform adjustments to agricultural planting strategies, pasture management, and grassland conservation, thereby promoting the sustainable development of the agricultural and livestock industries [11]. Using the findings of research on SMC, governments and policymakers can formulate more scientific water resource management policies, land use plans, and ecological compensation mechanisms, ensuring ecological security and socioeconomic sustainability in desert grassland areas [12,13]. Altogether, studying the SMC in desert grasslands holds significant academic and practical importance for maintaining ecosystem stability, promoting the development of the agricultural and livestock industries, addressing climate change, preventing natural disasters, and formulating scientific policy and resource management strategies [14].
Traditional methods for detecting the SMC include drying methods, nuclear techniques, time-domain reflectometry, and remote sensing measurements. Among these methods, the first three are suitable for small-scale assessments, are capable of determining the volumetric moisture content only at individual points, and are invasive to the soil profile. Although remote sensing measurements are applicable to large-scale measurements, this method suffers from a low resolution and requires minimal vegetation cover [15,16,17,18,19]. In contrast to these conventional approaches, ground-penetrating radar (GPR) has emerged as a method for obtaining the SMC at the mesoscale, and it has the advantages of in situ measurement precision, the convenient acquisition of soil moisture data, and enhanced measurement efficiency [20,21,22,23,24,25].
Numerous studies have shown that GPR can be used to estimate the soil moisture content. In a previous study, Eppstein and Dougherty conducted three-dimensional visualization analysis of the soil moisture content using borehole radar at a test site in Vermont [26]. Zou et al. applied a combination of electrical resistivity tomography and GPR profiles to monitor the spatiotemporal dynamics and hydrological processes of the soil moisture during the wetting and drying phases [27]. Cheng et al. used an unmanned-aerial-vehicle-supported GPR system to conduct spatial scanning surveys at varying elevations along the Yangtze River’s riparian zones and mid-channel islands. Their field study demonstrated that the obtained soil moisture measurements were comparable to those acquired using invasive time domain reflectometry (TDR) methods [28]. Grote et al. used GPR to ascertain the SMC of the uppermost 10 cm layer in a vineyard in California. Their findings revealed that the root mean square error (RMSE) of the volumetric moisture content estimated via GPR was 1%, underscoring GPR’s capability for rapid, non-invasive, and spatially dense estimation of the shallow soil moisture over extensive areas [29]. Liu et al. used GPR to conduct a non-invasive assessment of the root zone soil moisture, successfully visualizing it in three dimensions and illustrating the spatial variability of the SMC. This method facilitates a deeper understanding of the local-scale variability of subsoil moisture and the ecohydrological processes within the soil–plant–atmosphere continuum [30].
The Tabu River Basin is a typical arid to semi-arid desert grassland. The basin exhibits uneven spatiotemporal distributions of moisture, heat, and complex surface types, and it is considered to be a data-scarce region. To develop a fast non-invasive SMC estimation method suitable for desert steppes and to enrich the dielectric constant–SMC estimation model in such areas, in this study, we focused on the desert grassland at the northern foothills of the Yinshan Mountains in the Tabu River Basin. GPR was used to measure the soil dielectric constants, which were then used in conjunction with existing dielectric constant–SMC mixed-media models to estimate the SMC. These estimates were compared with actual SMC measurements to verify the accuracy of the different empirical models and to assess the applicability of the existing models to the study area. To obtain the optimal model for this region, cross-validation methods were further used to calibrate the parameters of the mixed-media models using the measured soil dielectric constants and moisture content data. The findings of this study provide a reference and scientific basis for future hydrodynamic research using GPR in typical desert grassland agro-pastoral transitional zones.
2. Materials and Methods
Overview of Study Area and Data Acquisition
The study area is located in the upper reaches of the Tabu River Basin in Baotou, Inner Mongolia, China (111°12′52.645″ E, 41°21′18.54″ N), and is characterized by a typical desert steppe environment (Figure 1a,b). This region has a continental monsoon climate, with an annual average temperature of 3.36 °C. The annual precipitation is 311.2 mm and approximately 80% of the precipitation occurs during the summer months, from July to September. The annual average evaporation rate is 1365.2 mm, with the highest evaporation occurring during the summer [31]. The grassland within the radar detection area is covered with dead grass, and the terrain is flat, open, and devoid of dense structures (Figure 1d).
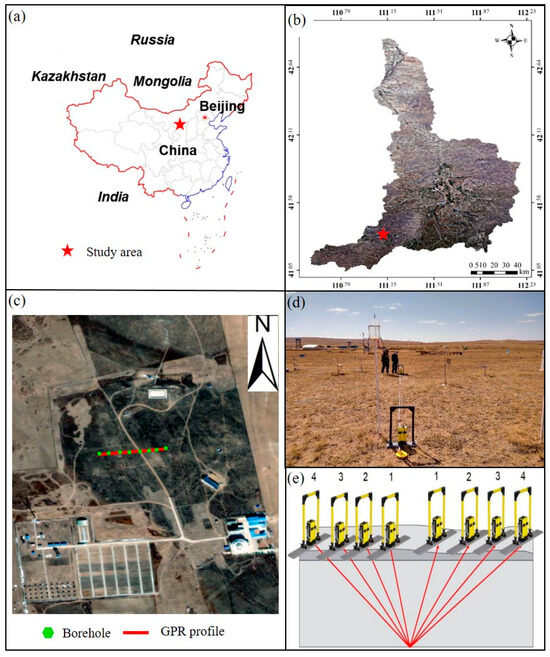
Figure 1.
Locations of the (a) study area, (b) Tabu Basin, and (c) soil sampling points and GPR profile. (d) CMP working photos and (e) schematic diagram of the CMP (GPR: ground-penetrating radar; CMP: common midpoint).
In our investigation, we used the pulseEKKO transceiver-separated digital GPR system (Sensors & Software, Mississauga, ON, Canada), and the common midpoint (CMP) method was used for detection in early October 2023. The CMP survey line is depicted in Figure 1c. We used 100 MHz frequency antennas equipped with a U-shaped handle for the point measurements for the CMP method. The minimum offset was 0.6 m, the maximum offset was 10 m, the offset increment was 0.2 m (0.1 m increments for both Tx and Rx, with each CMP collecting 48 traces in total), and the survey point spacing was 5 m. A schematic diagram of the CMP operation is shown in Figure 1e. A total of 2208 CMP survey points were completed, covering a radar detection profile length of 120 m. Subsequently, soil core sampling was conducted on the radar test profile. Soil samples were collected from the upper 2 m in eight boreholes, and the sampling interval was 10 cm. Laboratory experiments were conducted to determine the SMC and particle size distribution of the samples at the Inner Mongolia Key Laboratory of Soil Quality and Nutrient Resources.
3. Methods
3.1. Ground Radar Observations and Data Interpretation
Based on its operating frequency, GPR can be used to detect sediment features at depths ranging from a few meters to several tens of meters underground. In addition, GPR can differentiate sediments based on their orientation, grain size, compaction, and sorting, making it the most effective tool currently available for shallow subsurface physical property identification [20,32]. Water molecules are polar and possess a relatively high dielectric constant, significantly affecting the propagation characteristics of high-frequency electromagnetic wave signals. This provides a solid geophysical basis for using GPR technology to detect the moisture content of media. The non-contact nature, continuous measurement, and high efficiency of GPR technology make it well-suited for large-scale moisture content detection, and thus it was chosen as the method for use in this study [33,34].
Van Overmeeren et al. conducted 10 GPR surveys over 13 months at two test sites in the Netherlands and demonstrated that the SMC of the sandy unsaturated zone could be measured from the surface using GPR, and the velocity of the GPR electromagnetic waves could be estimated from the slope of the hyperbolic events [35]. Boll et al. used the CMP method to detect layered structures in sandy field soils and estimated the SMC at depths ranging from 1.5 to 2 m [36]. Greaves et al. used a more complex amplitude spectrum analysis method to derive stacking velocities from CMP radar data, demonstrating that the velocity information of GPR electromagnetic waves can be used to determine the moisture content of subsurface media [36]. Figure 2 shows the data processing workflow for estimating the SMC using the GPR CMP method. After obtaining the original CMP profile through forward modeling or actual measurements, linear gain processing was applied to enhance the prominence of the effective waves. Velocity analysis was then conducted, a reasonable time window for scanning the hyperbolic trajectories was selected based on the actual data, and the stacking velocities were extracted using the average amplitude energy criterion and the average amplitude criterion. The stacking velocities were then converted into interval velocities and layer thicknesses using the Dix equation, and the relative dielectric constants of the respective layers were obtained based on the relationship between the velocity of the radar waves and the relative dielectric constants. The calculation method used can be expressed as follows [27,37]:
where V is the velocity of the electromagnetic waves in the soil (m/ns), c is the velocity of the electromagnetic waves in vacuum (m/ns), and εr is the relative dielectric constant. Finally, the SMC was calculated based on the theory of mixed-media dielectric models [38,39,40].
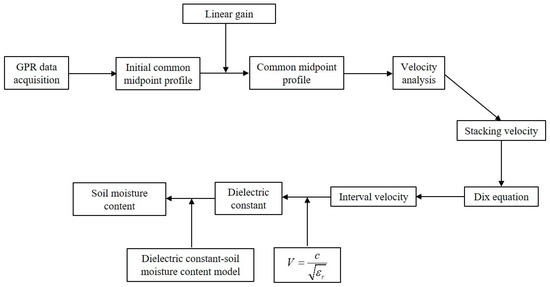
Figure 2.
Analysis scheme for CMP profile data processing (GPR: ground-penetrating radar; CMP: common midpoint).
3.2. Mixed-Media Model
Extensive research has been conducted on the determination of the SMC based on dielectric constants [41,42]. The mixed-media dielectric model can effectively characterize the correlation between the SMC and the dielectric constant. The soil volumetric water content can be derived using empirical or semi-theoretical models that relate the soil volumetric water content θc to the dielectric constant εr. Prominent among these models are the Topp, Roth, and Ferre models [43,44,45], which are presented below:
Topp model: θc = −0.053 + 0.0293ε − 0.00055εr2 + 0.0000043εr3,
Roth model: θc = −0.078 + 0.0448εr − 0.00195εr2 + 0.0000361εr3,
Of these models, the Topp model is currently the most widely applied, and it is particularly suitable for fitting the relationship between the SMC and the soil dielectric constant in light-textured soils [43].
3.3. Soil Sample Analysis
3.3.1. Soil Particle Size and Mass Moisture Content
Disturbed and undisturbed soil samples were collected from two stratigraphic layers at shallow depths across four distinct profiles within the research area using a soil coring device. Stones and organic materials were carefully removed from the disturbed soil samples, followed by natural air-drying for 2 days. Subsequently, the sand fraction was sieved through a 5 mm mesh, and the clay fraction was passed through a 2 mm mesh for preparation. Particle size analysis of the two types of disturbed soil samples was conducted in the laboratory using a Malvern laser particle size analyzer (Malvern Instruments, Malvern, UK). This apparatus can determine the volumetric percentages of particles of varying sizes within the soil, with a measurable size range of 0.01–2000 μm and a repeat measurement error of less than 2%. The soil particles were then classified into one of the following three categories according to the international particle size grading texture classification system: sand (>20 μm), silt (2–20 μm), or clay (<2 μm).
3.3.2. SMC of Soil Samples
A stratified random sampling approach was used during the sampling. Six soil profiles were sampled at each point from depths of 0–2 m. Samples were collected at 10 cm intervals, specifically at depths of 20, 40, 60, 80, and 100 cm. After sampling, the samples were dried in an oven at 105 °C until a constant weight was achieved. The wet soil weight (Ww), dry soil weight (Wd), and aluminum box weight were recorded. Finally, the SMC θm for each sample was calculated using the following equation:
θm = (Ww − Wd)/Wd.
Considering the uniform soil texture and minimal spatial variability observed in the soil profile obtained via radar detection, undisturbed soil samples were collected at 10 cm intervals within a 0–100 cm depth range near the midpoint of the profile using a core cutter. The same technique was used to determine the dry bulk density (γ) of the soil within the study area. The results indicate that the variation in γ within the 0–100 cm depth range was minimal, with an average value of 1.38 g/cm3. This closely aligns with the findings of Yang et al. [46], who measured the dry bulk density of soils in a study area that was not affected by grazing. Consequently, a uniform soil dry bulk density (γ) of 1.38 g/cm3 was adopted in our study.
The soil volumetric water content was calculated using the following equation:
θc = γ × θm.
3.4. Cross-Validation and Error Analysis
3.4.1. Cross-Validation
To evaluate the predictive performances of various mixed-media models, the model parameters were calibrated based on the measured SMC and dielectric constant (εr) data from five boreholes. The data for the remaining three boreholes were used to validate the models. Cross-validation was conducted for four data combination scenarios, namely, C1, C2, C3, and C4, and the model parameters were calibrated using multiple regression analysis. The specific grouping details are presented in Table 1.

Table 1.
Groups of boreholes used to conduct cross-validation.
3.4.2. Error Analysis
The RMSE and mean absolute percentage error (MAPE) are two commonly used indicators for measuring the prediction accuracy. These indicators can help assess the performances of predictive models. In this study, the RMSE and MAPE were used to evaluate the performances of the mixed-media dielectric models. The RMSE can be calculated using the following equation:
The MAPE can be calculated using the following equation:
In these equations, θm is the measured SMC obtained via the stratified pumping test in the ith test section, θc is the SMC calculated using the model, and n is the total number of data points. The RMSE reflects the overall deviation between the model estimates and measured data. A smaller RMSE value indicates that the model has better estimation results for θ.
In this study, we also used the Akaike information criterion (AIC) [47] and the Bayesian information criterion (BIC) [48] to compare the effectiveness of the various mixed-media dielectric models in terms of the parameter estimation. Not only do both the AIC and BIC measure the deviation between measured data and model-predicted data, but they also reflect the instability caused by different numbers of model parameters [49]. Smaller AIC and BIC values indicate better parameter estimation models. The equations used to calculate the AIC and BIC are as follows:
where ESS is the sum of the squared residuals between θc; it was calculated for the various mixed-media dielectric models and the measured θm. n is the total number of samples, and p is the number of model parameters.
4. Results
4.1. Soil Particle Size Analysis
The analysis results for the soil samples are presented in Table 2. The mean sand, silt, and clay contents of the soil borehole samples were 71.3%, 25.61%, and 3.09%, respectively. The mean sand content was the highest, indicating that the soil samples were predominantly sandy with a relatively stable composition, and the soil particle size decreased with increasing depth. Overall, the soil lithology along the radar profile was characterized by a predominance of sand and a minimal amount of clay, resulting in a relatively homogeneous texture. Based on this analysis, the sand and silt contents, which together accounted for 96.91% of the soil composition, were the primary factors influencing the variability of the soil texture (Figure 3).
Table 2.
Physical characteristics of the soil.
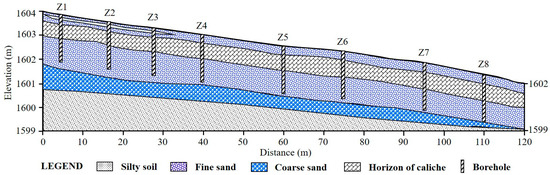
Figure 3.
Sectional hydrogeological map.
4.2. Prediction of the SMC Using Existing Mixed-Media Models
The SMC predictions obtained using three commonly used mixed-media models are depicted in Figure 4, and their prediction accuracies are presented in Table 3. Overall, the SMCs predicted using the models tended to be lower than the measured values. Notably, the Ferre model exhibited significant errors between the predicted and measured values, with an R2 value that became negative, indicating a substantial deviation between the estimated and predicted values. In contrast, both the Topp and Ferre models had R2 values of 0.5659, suggesting that the predictions obtained using these models can reflect the actual SMC reasonably well. The predictive capabilities of the models are thus acceptable, even when using general parameters applicable to most regions worldwide; this may be related to the uniform soil texture, higher content of fine particles, and high sand content in the study area [27,50]. The RMSE and MAPE values of the three models indicate that the predictive capability of the Roth model was comparable, but slightly superior, to that of the Topp model. A comparison of the AIC and BIC values of the models revealed that the four-parameter Topp and Roth models significantly outperformed the two-parameter Ferre model in terms of the predictive ability. Overall, the Roth model was found to be the most suitable mixed-media model for the study area.
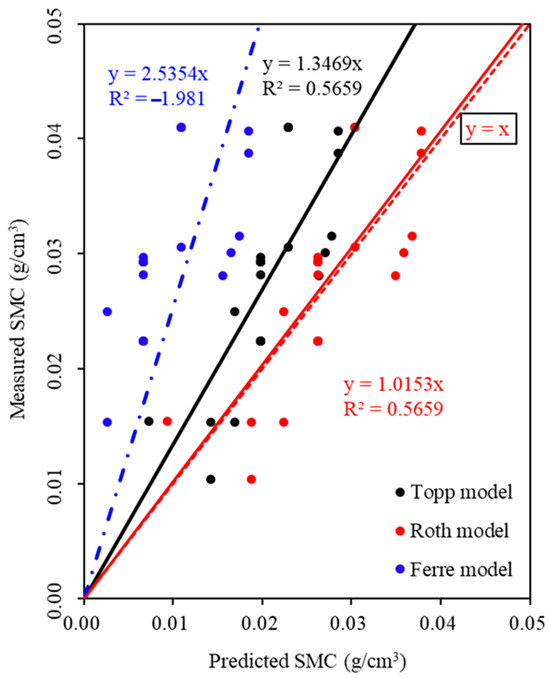
Figure 4.
Comparison of the predicted SMC and measured SMC.
Table 3.
Accuracy of existing mixed-media models when used to predict the soil moisture content.
4.3. Cross-Validation Calibration of Mixed-Media Model Parameters
The model parameters calibrated via the cross-validation technique, juxtaposed with the comparative analysis of their predicted and actual values, are shown in Table 4 and Figure 5. The findings reveal that the Topp model, which performed best with cohort C3, had the highest coefficient of determination (R2 value of 0.9028) between the predicted and actual values. Conversely, the Ferre model, which performed the best for cohort C1, yielded the highest R2 value between the predicted and actual values (R2 value of 0.5874). The Topp model, when applied to cohort C1, yielded a negative R2 value, whereas the predictive outcomes for cohorts C2, C3, and C4 were predominantly favorable. In contrast, the Ferre model demonstrated superior performance for cohort C1, and cohorts C2, C3, and C4 all exhibited negative R2 values, signifying considerable divergence between the predicted and actual values under these data configurations. This implies that the Ferre model is ill-suited for the prediction of the SMC within the study area. In contrast, the Topp model only yielded a significant deviation between the predicted and actual values in one instance (cohort C1) across the four data configurations, which underscores the superior predictive stability and enhanced applicability of the Topp model for the soil conditions in the study area compared with the Ferre model.
Table 4.
Fitting models obtained via cross-validation and their estimation accuracy.
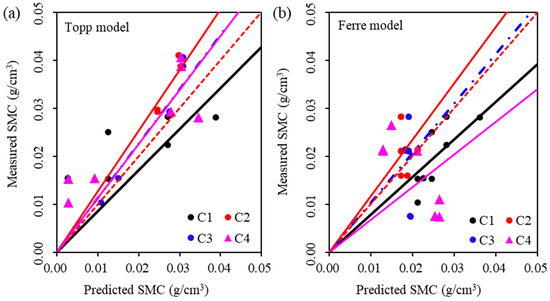
Figure 5.
Mixed-media Topp (a) and Ferre (b) model for predicting the SMC.
Consequently, in this study, we used the Topp model parameters calibrated from the C3 cohort and the Ferre model parameters calibrated from the C1 cohort in conjunction with the dielectric constants associated with all of the borehole data to estimate the SMC. The results are provided in Figure 6, and the precision of the predictions is presented in Table 5.
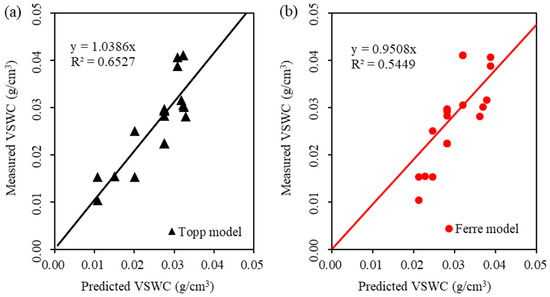
Figure 6.
Prediction of the soil volumetric water content obtained using Topp (a) and Ferre (b) model after parameter calibration.
Table 5.
Optimization models obtained via cross-validation and their estimation accuracy.
The results show that the R2 values of the predicted and measured values following parameter calibration of the Topp and Ferre models were 0.6527 and 0.5449, respectively. Both values were high, and significant improvements were achieved compared with the uncalibrated results. Specifically, the R2 value of the Topp model increased by 0.0868 from the previous value of 0.5659, and the Ferre model’s R2 value increased by 2.5259 from the previous value of −1.981, demonstrating substantial improvement. This suggests that the Topp model possesses greater applicability and can effectively predict the SMC in the study area, even without parameter calibration. Meanwhile, the Ferre model’s applicability is lower, and it requires parameter calibration to achieve satisfactory predictive outcomes. The RMSE values of the Topp and Ferre models were 0.5% and 0.6%, respectively, and their MAPE values were 14.34% and 20.56%, respectively, indicating that the estimated values were close to the true values and that the estimation results were reliable. The AIC and BIC values of the two models were relatively close, suggesting that the estimation results obtained using the four-parameter Topp model and the two-parameter Ferre model were similar and not significantly influenced by the number of model parameters.
5. Discussion
GPR was used to estimate the shallow soil moisture content of typical desert grasslands in the northern foothills of the Yinshan Mountains using three universal dielectric constant soil moisture models. The results show that the accuracy of the SMC estimated using the existing models is still acceptable. The new model with parameter calibration has a higher accuracy, and it can estimate the shallow soil moisture content and its spatial distribution more accurately in similar areas. Our results contribute to the understanding of soil moisture estimation methods for desert grassland areas, which is instrumental for evaluating the carrying capacity and resilience of ecosystems, as well as their responses to climate change, thereby providing a scientific foundation for ecological conservation and restoration [51,52].
The RMSE values of the SMC estimated using the Topp, Roth, and Ferre models were 0.0091 g/cm3, 0.0054 g/cm3, and 0.0208 g/cm3, and the R2 values were 0.566, 0.566, and −1.981, respectively. The estimation accuracies of the Topp and Roth models were acceptable, and the estimation error of the Ferre model was very large. The prediction ability of the model calibrated using the parameters was significantly improved. The R2 values of the predicted and measured values for the Topp and Ferre models were 0.6527 and 0.5449, respectively, which reached a high level. These measurement results are better than the estimation results that Cheng et al. [28] obtained using an unmanned aerial vehicle–supported GPR system and are lower than the estimation accuracy that Li et al. [33] achieved using the neural network architecture optimization model. This indicates that the neural network architecture model could be used to improve estimation accuracy in the future [53]. The overall high precision of the estimation results attained in this study may be related to the low SMC in the study area. However, Cao et al. noted that a high SMC can affect radar wave reflection, and under high-conductivity conditions, GPR inversion results may be poor [54]. Additionally, as the SMC increases, the RMSE also increases, leading to poorer inversion effects. This finding aligns with Giroux and Chouteau’s observations in 2010 [55]. The uniformity of the soil texture and the low spatial variability in the study area contributed to the relative reliability of the estimation results. This conclusion is similar to that of Mahmoudzadeh’s field-scale research [50]. In addition, Ranalli et al. [56,57,58] found that the radar resolution decreases with increasing penetration depth and interlayer thickness. The depth range measured in this study was shallow and stratigraphic stratification was not involved, which also reduced the uncertainty of the radar testing and water content estimation [27]. It is noteworthy that while the RMSE between the estimated and measured values was small, the MAPE ranged from 14.34% to 20.56%. This small RMSE can be attributed to the low SMC in the study area, and for such small values, the MAPE is a better indicator of the overall error.
In this study, we preliminarily verified the reliability of using GPR to estimate the soil moisture content in typical desert grassland areas at the northern Yinshan Mountains; however, the research was conducted in only one place at one time. Long time series observations should be conducted in the future, and real-time monitoring of the soil moisture has been achieved using the parameter-calibrated model presented in this paper [4,27,59]. In addition, remote sensing and aerial photogrammetry can be combined to observe and quickly measure large-scale spatiotemporal variations in the soil moisture content [60,61]. The Topp, Roth, and Ferre models applied in this study are all widely used models, and although we recalibrated the parameters using measured data in the study area and proposed parameter sets that are more suitable for the study area, these models are all empirical models. Moreover, GPR, a geophysical method, also has a certain degree of ambiguity and uncertainty, increasing the uncertainty of soil moisture estimation using GPR.
6. Conclusions
Using the information given, GPR was used to estimate the SMC of the predominantly fine sand in the desert steppe in the northern Yinshan Mountains. The parameter calibration and estimation results of the dielectric constant–SMC model were tested using the measured SMC data. We confirmed the universality of the Topp and Roth models in a desert steppe area. We also demonstrated that the model using the new parameter calibration method has a higher accuracy and is more suitable for estimating the SMC based on GPR data in desert steppe areas. The verification and optimization of the model not only improve current methods for determining the local SMC, but also increase the model’s practicability.
Our research only considered a test point in a desert grassland area in autumn, and the verification and optimization of the dielectric constant–SMC model were completed on the point scale. The temporal and spatial scales of the research can both be expanded. In the future, the optimized model will be combined with long-term sequence observations to realize real-time monitoring of the SMC and to give full play to GPR’s advantages of being non-destructive and having a high resolution for estimating the SMC. In addition, joint remote sensing will be used to estimate soil moisture content at the regional scale in a desert steppe environment to obtain more accurate estimation results, as well as to better optimize agricultural production, manage water resources, respond to climate change, and protect ecosystems, thus promoting sustainable development and environmental adaptability in desertification areas.
Author Contributions
Conceptualization and Writing—original draft preparation, K.L.; methodology, Z.L.; investigation, G.J. and R.J.; resources and data curation, Z.L. and X.Y.; writing—review and editing, T.L.; funding acquisition, K.L. and X.Y. All authors have read and agreed to the published version of the manuscript.
Funding
This study was supported by the China Institute of Water Resources and Hydropower Research (IWHR) Research & Development Support Program (Grant No. MK2022J01); Natural Science Foundation of the Inner Mongolia Autonomous Region of China (Grant No. 2022QN05026); the National Natural Science Foundation of China (No. 42072291).
Institutional Review Board Statement
Not applicable.
Informed Consent Statement
Not applicable.
Data Availability Statement
The data presented in this study are available on request from the corresponding author.
Conflicts of Interest
The authors declare no competing interest.
References
- Abdulraheem, M.I.; Chen, H.; Li, L.; Moshood, A.Y.; Zhang, W.; Xiong, Y.; Zhang, Y.; Taiwo, L.B.; Farooque, A.A.; Hu, J. Recent Advances in Dielectric Properties-Based Soil Water Content Measurements. Remote Sens. 2024, 16, 1328. [Google Scholar] [CrossRef]
- Zhang, M.H.; Feng, X.; Bano, M.; Liu, C.; Liu, Q.; Wang, X. Soil water content estimation by using ground penetrating radar data full waveform inversion with grey wolf optimizer algorithm. Vadose Zone J. 2024, e20379. [Google Scholar] [CrossRef]
- Lei, L.; Zheng, J.; Li, S.; Yang, L.; Wang, W.; Zhang, F.; Zhang, B. Soil Hydrological Properties’ Response to Long-Term Grazing on a Desert Steppe in Inner Mongolia. Sustainability 2023, 15, 16256. [Google Scholar] [CrossRef]
- Rasheed, M.W.; Tang, J.; Sarwar, A.; Shah, S.; Saddique, N.; Khan, M.U.; Imran Khan, M.; Nawaz, S.; Shamshiri, R.R.; Aziz, M. Soil Moisture Measuring Techniques and Factors Affecting the Moisture Dynamics: A Comprehensive Review. Sustainability 2022, 14, 11538. [Google Scholar] [CrossRef]
- Lu, Q.; Liu, K.; Zeng, Z.; Liu, S.; Li, R.; Xia, L.; Guo, S.; Li, Z. Estimation of the Soil Water Content Using the Early Time Signal of Ground-Penetrating Radar in Heterogeneous Soil. Remote Sens. 2023, 15, 3026. [Google Scholar] [CrossRef]
- Kawamura, K.; Akiyama, T.; Yokota, H.; Tsutsumi, M.; Yasuda, T.; Watanabe, O.; Wang, G.; Wang, S. Monitoring of forage conditions with MODIS imagery in the Xilingol steppe, Inner Mongolia. Int. J. Remote Sens. 2005, 26, 1423–1436. [Google Scholar] [CrossRef]
- Wang, X.; Dong, J.; Baoyin, T.; Bao, Y. Estimation and Climate Factor Contribution of Aboveground Biomass in Inner Mongolia’s Typical/Desert Steppes. Sustainability 2019, 11, 6559. [Google Scholar] [CrossRef]
- Wang, B.; Wu, L.; Chen, D.; Wu, Y.; Hu, S.; Li, L.; Bai, Y. Grazing simplifies soil micro-food webs and decouples their relationships with ecosystem functions in grasslands. Glob. Chang. Biol. 2020, 26, 960–970. [Google Scholar] [CrossRef] [PubMed]
- Zhang, R.; Wang, Z.; Han, G.; Schellenberg, M.P.; Wu, Q.; Gu, C. Grazing induced changes in plant diversity is a critical factor controlling grassland productivity in the Desert Steppe, Northern China. Agric. Ecosyst. Environ. 2018, 265, 73–83. [Google Scholar] [CrossRef]
- Seneviratne, S.I.; Corti, T.; Davin, E.L.; Hirschi, M.; Jaeger, E.B.; Lehner, I.; Orlowsky, B.; Teuling, A.J. Soil moisture–climate interactions: A review. Atmos. Res. 2010, 99, 583–600. [Google Scholar]
- Liu, Y.; Zhang, X.; Wang, Z. Soil moisture and livestock production in desert steppe regions of northwest China: Implications for sustainable management. Agric. Water Manag. 2020, 233, 106079. [Google Scholar]
- Zhang, H.; Wang, W.; Li, F. Soil moisture-based vegetation restoration techniques in desert steppe regions of Inner Mongolia, China. Ecol. Eng. 2019, 135, 100–108. [Google Scholar]
- Wang, L.; Li, Z.; Zhang, Y. A soil moisture-based framework for water resource management in desert steppe regions. Water Resour. Manag. 2016, 30, 5189–5204. [Google Scholar]
- Reichle, R.H.; Koster, R.D.; Liu, P.; Mahanama, S.P.P.; Njoku, E.G.; Owe, M. Assessment of the SMAP level-4 surface and root-zone soil moisture product using in situ measurements. J. Hydrometeorol. 2017, 18, 2921–2945. [Google Scholar] [CrossRef]
- Tran, A.P.; Vanclooster, M.; Lambot, S. Improving soil moisture profile reconstruction from ground-penetrating radar data: A maximum likelihood ensemble filter approach. Hydrol. Earth Syst. Sci. 2013, 17, 2543–2556. [Google Scholar] [CrossRef]
- Binley, A.; Hubbard, S.S.; Huisman, J.A.; Revil, A.; Robinson, D.A.; Singha, K.; Slater, L.D. The emergence of hydrogeophysics for improved understanding of subsurface processes over multiple scales. Water Resour. Res. 2015, 51, 3837–3866. [Google Scholar] [CrossRef]
- Piroddi, L.; Rassu, M. Application of GPR Prospection to Unveil Historical Stratification inside Monumental Buildings: The Case of San Leonardo de Siete Fuentes in Santu Lussurgiu, Sardinia, Italy. Land 2023, 12, 590. [Google Scholar] [CrossRef]
- Cui, F.; Bao, J.; Cao, Z.; Li, L.; Zheng, Q. Soil hydraulic parameters estimation using ground penetrating radar data via ensemble smoother with multiple data assimilation. J. Hydrol. 2020, 583, 124552. [Google Scholar] [CrossRef]
- Paz, C.; Alcalá, F.J.; Carvalho, J.; Ribeiro, L. Current uses of ground penetrating radar in groundwater-dependent ecosystems research. Sci. Total Environ. 2017, 595, 868–885. [Google Scholar] [CrossRef]
- Tran, A.P.; Vanclooster, M.; Zupanski, M.; Lambot, S. Joint estimation of soil moisture profile and hydraulic parameters by groundpenetrating radar data assimilation with maximum likelihood ensemble filter. Water Resour. Res. 2014, 50, 3131–3146. [Google Scholar] [CrossRef]
- Zajícová, K.; Chuman, T. Application of ground penetrating radar methods in soil studies: A review. Geoderma 2019, 343, 116–129. [Google Scholar] [CrossRef]
- Huisman, J.A.; Hubbard, S.S.; Redman, J.D.; Annan, A.P. Measuring soil water content with ground penetrating radar: A review. Vadose Zone J. 2003, 2, 476–491. [Google Scholar] [CrossRef]
- Shen, H.; Li, X.; Duan, R.; Zhao, Y.; Zhao, J.; Che, H.; Liu, G.; Xue, Z.; Yan, C.; Liu, J.; et al. Quality evaluation of ground improvement by deep cement mixing piles via ground-penetrating radar. Nat. Commun. 2023, 14, 3448. [Google Scholar] [CrossRef] [PubMed]
- Vereecken, H.; Huisman, J.A.; Bogena, H.; Vanderborght, J.; Vrugt, J.A.; Hopmans, J.W. On the value of soil moisture measurements in vadose zone hydrology: A review: Soil moisture and hydrology. Water Resour. Res. 2008, 44, W00D06. [Google Scholar] [CrossRef]
- Vereecken, H.; Huisman, J.A.; Pachepsky, Y.; Montzka, C.; van der Kruk, J.; Bogena, H.; Weihermüller, L.; Herbst, M.; Martinez, G.; Vanderborght, J. On the spatiotemporal dynamics of soil moisture at the field scale. J. Hydrol. 2014, 516, 76–96. [Google Scholar] [CrossRef]
- Eppstein, M.J.; Dougherty, D.E. Efficient three-dimensional data inversion: Soil characterization and moisture monitoring from cross-well ground penetrating radar at a Vermont test site. Water Resour. Res. 1998, 34, 1889–1900. [Google Scholar] [CrossRef]
- Zou, C.; Zhang, S.; Jiang, X.; Chen, F. Monitoring and characterization of water infiltration in soil unsaturated zone through an integrated geophysical approach. Catena 2023, 230, 107243. [Google Scholar] [CrossRef]
- Cheng, Q.; Su, Q.; Binley, A.; Liu, J.; Zhang, Z.; Chen, X. Estimation of surface soil moisture by a multi-elevation UAV-based ground penetrating radar. Water Resour. Res. 2023, 59, e2022WR032621. [Google Scholar] [CrossRef]
- Grote, K.; Hubbard, S.; Rubin, Y. Field-scale estimation of volumetric water content using ground-penetrating radar ground wave techniques. Water Resour. Res. 2003, 39, 1321. [Google Scholar] [CrossRef]
- Liu, X.; Chen, J.; Butnor, J.R.; Qin, G.; Cui, X.; Fan, B.; Lin, H.; Guo, L. Noninvasive 2D and 3D mapping of root zone soil moisture through the detection of coarse roots with ground-penetrating radar. Water Resour. Res. 2020, 56, e2019WR026930. [Google Scholar] [CrossRef]
- Jin, J.; Liu, T.; Liao, Z.; Wang, M.; Wang, Z. Interaction between intermittent river and groundwater in arid and semiarid basin considering the influence of evaporation on isotopic compositions. J. Hydrol-Reg. Stud. 2024, 54, 101876. [Google Scholar] [CrossRef]
- Babaeian, E.; Sadeghi, M.; Jones, S.B.; Montzka, C.; Vereecken, H.; Tuller, M. Ground, proximal, and satellite remote sensing of soil moisture. Rev. Geophy. 2019, 57, 530–616. [Google Scholar] [CrossRef]
- Li, Z.; Zeng, Z.; Xiong, H.; Lu, Q.; An, B.; Yan, J.; Li, R.; Xia, L.; Wang, H.; Liu, K. Study on Rapid Inversion of Soil Water Content from Ground-Penetrating Radar Data Based on Deep Learning. Remote Sens. 2023, 15, 1906. [Google Scholar] [CrossRef]
- Yuan, W.; Liu, S.; Zhao, Q.; Deng, L.; Lu, Q.; Pan, L.; Li, Z. Application of Ground-Penetrating Radar with the Logging Data Constraint in the Detection of Fractured Rock Mass in Dazu Rock Carvings, Chongqing, China. Remote Sens. 2023, 15, 4452. [Google Scholar] [CrossRef]
- Overmeeren, R.A.V.; Sariowan, S.V.; Gehrels, J.C. Ground penetrating radar for determining volumetric soil water content; results of comparative measurements at two test sites. J. Hydrol. 1997, 197, 316–338. [Google Scholar] [CrossRef]
- Greaves, R.J.; Lesmes, D.P.; Lee, J.M.; Toksoz, M.N. Velocity variations and water content estimated from multi-offset, ground-penetrating radar. Geophysics 1996, 61, 683–695. [Google Scholar] [CrossRef]
- Annan, A.P. Ground-Penetrating Radar. In Near-Surface Geophysics; Butler, D.K., Ed.; Society of Exploration Geophysicists: Houston, TX, USA, 2005; Volume 13. [Google Scholar] [CrossRef]
- Steelman, C.M.; Endres, A.L.; Jones, J.P. High-resolution ground-penetrating radar monitoring of soil moisture dynamics: Field results, interpretation, and comparison with unsaturated flow model. Water Resour. Res. 2012, 48, W09538. [Google Scholar] [CrossRef]
- Suman, S.; Srivastava, P.K.; Pandey, D.K.; Prasad, R.; Mall, R.K.; O’Neill, P. Comparison of soil dielectric mixing models for soil moisture retrieval using SMAP brightness temperature over croplands in India. J. Hydrol. 2021, 602, 126673. [Google Scholar] [CrossRef]
- Steelman, C.M.; Endres, A.L. Comparison of petrophysical relationships for soil moisture estimation using GPR ground waves. Vadose Zone J. 2011, 10, 270–285. [Google Scholar] [CrossRef]
- Weiler, K.W.; Steenhuis, T.S.; Boll, J.; Kung, K.J.S. Comparison of Ground Penetrating Radar and Time-Domain Reflectometry as Soil Water Sensors. Soil Sci. Soc. Am. J. 1998, 62, 1237–1239. [Google Scholar] [CrossRef]
- Černý, R. Time-domain reflectometry method and its application for measuring moisture content in porous materials: A review. Measurement 2009, 42, 329–336. [Google Scholar] [CrossRef]
- Topp, G.C.; Davis, J.L.; Annan, A.P. Electromagnetic determination of soil water content: Measurements in coaxial transmissions lines. Water Resour. Res. 1980, 16, 574–582. [Google Scholar] [CrossRef]
- Roth, C.H.; Malicki, M.A.; Plagge, R. Empirical evaluation of the relationship between soil dielectric constant and volumetric water content as the basis for calibrating soil moisture measurements by TDR. Soil Sci. 1992, 43, 1–13. [Google Scholar] [CrossRef]
- Ferre, P.A.; Rudolph, D.L.; Kachanoski, R.G. Spatial averaging of water content by time domain reflectometry: Implications for twin rod probes with and without dielectric coatings. Water Resour. Res. 1996, 32, 271–279. [Google Scholar] [CrossRef]
- Yang, Z.; Miao, P.; Zheng, Y.; Guo, J. Impacts of Grazing on Vegetation and Soil Physicochemical Properties in Northern Yinshan Mountain Grasslands. Sustainability 2023, 15, 16028. [Google Scholar] [CrossRef]
- Akaike, H. Information theory as an extension of the maximum likelihood principle. In Proceedings of the Second International Symposium on Information Theory, Tsahkadsor, Armenia, 2–8 September 1971; Petrov, B.N., Csaki, F., Eds.; Akademiai Kiado: Budapest, Hungary, 1973; pp. 267–281. [Google Scholar]
- Schwarz, G. Estimating the Dimension of a Model. Ann. Stat. 1978, 6, 461–464. [Google Scholar] [CrossRef]
- Enemark, T.; Peeters, L.J.M.; Mallants, D.; Batelaan, O. Hydrogeological conceptual model building and testing: A review. J. Hydrol. 2019, 569, 310–329. [Google Scholar] [CrossRef]
- Mahmoudzadeh Ardekani, M.R. Off-and on-ground GPR techniques for field-scale soil moisture mapping. Geoderma 2013, 200–201, 55–66. [Google Scholar] [CrossRef]
- Li, Y.; Shao, M.; Li, X. Dynamics of soil moisture and its relationship with vegetation cover in a desert steppe of Inner Mongolia, China. J. Arid Environ. 2018, 155, 47–55. [Google Scholar]
- Lei, T.; Gu, Q.; Guo, X.; Ma, J.; Zhang, Y.; Sun, X. Urease activity and urea hydrolysis rate under coupling effects of moisture content, temperature, and nitrogen application rate. Int. J. Agric. Biol. Eng. 2018, 11, 132–138. [Google Scholar] [CrossRef]
- Leong, Z.X.; Zhu, T. Direct velocity inversion of ground penetrating radar data using GPRNet. J. Geophys. Res-Sol. Earth 2021, 126, e2020JB021047. [Google Scholar] [CrossRef]
- Cao, Q.; Song, X.; Wu, H.; Gao, L.; Zhang, G. Mapping the response of volumetric soil water content to an intense rainfall event at the field scale using GPR. J. Hydrol. 2020, 583, 124605. [Google Scholar] [CrossRef]
- Giroux, B.; Chouteau, M. Quantitative analysis of water-content estimation errors using ground-penetrating radar data and a low-loss approximation. Geophysics 2010, 75, WA241–WA249. [Google Scholar] [CrossRef]
- Ranalli, D.; Scozzafava, M.; Tallin, M.; Colagrande, S. GPR signal attenuation vs. depth on damaged flexible road pavements. In Proceedings of the International Workshop on Advanced Ground Penetrating Radar, IEEE, Naples, Italy, 27–29 June 2007. [Google Scholar]
- van der Kruk, J.; Streich, R.; Green, A.G. Joint dispersion inversion of broadside and endfire CMP georadar data for properties of a thin-surface waveguide. Geophysics 2006, 71, K19–K29. [Google Scholar] [CrossRef]
- van der Kruk, J.; Steelman, C.M.; Endres, A.L.; Vereecken, H. Dispersion inversion of electromagnetic pulse propagation within freezing and thawing soil waveguides. Geophys. Res. Lett. 2009, 36, L18503. [Google Scholar] [CrossRef]
- Haruzi, P.; Schmäck, J.; Zhou, Z.; van der Kruk, J.; Vereecken, H.; Vanderborght, J.; Klotzsche, A. Detection of tracer plumes using full-waveform inversion of time-lapse ground penetrating radar data: A numerical study in a high-resolution aquifer model. Water Resour. Res. 2022, 58, e2021WR030110. [Google Scholar] [CrossRef]
- Bayarri, V.; Prada, A.; García, F.; De Las Heras, C.; Fatás, P. Remote Sensing and Environmental Monitoring Analysis of Pigment Migrations in Cave of Altamira’s Prehistoric Paintings. Remote Sens. 2024, 16, 2099. [Google Scholar] [CrossRef]
- Romano, G.; Capozzoli, L.; Abate, N.; De Girolamo, M.; Liso, I.S.; Patella, D.; Parise, M. An Integrated Geophysical and Unmanned Aerial Systems Surveys for Multi-Sensory, Multi-Scale and Multi-Resolution Cave Detection: The Gravaglione Site (Canale di Pirro Polje, Apulia). Remote Sens. 2023, 15, 3820. [Google Scholar] [CrossRef]


Disclaimer/Publisher’s Note: The statements, opinions and data contained in all publications are solely those of the individual author(s) and contributor(s) and not of MDPI and/or the editor(s). MDPI and/or the editor(s) disclaim responsibility for any injury to people or property resulting from any ideas, methods, instructions or products referred to in the content. |
© 2024 by the authors. Licensee MDPI, Basel, Switzerland. This article is an open access article distributed under the terms and conditions of the Creative Commons Attribution (CC BY) license (https://creativecommons.org/licenses/by/4.0/).