Abstract
Building on updated estimates of the social cost of carbon obtained from the most recent literature, this article proposes a social cost of carbon-based benchmark for carbon pricing to drive world countries’ carbon pricing policies up to 2050, consistent with the Paris Agreement targets. By using a dataset on net effective carbon rates developed by the Organisation for Economic Co-operation and Development (OECD), we firstly compare both explicit and implicit carbon pricing in 2021 in 71 OECD and non-OECD countries with the social cost of carbon benchmark for 2021 and calculate the degree of internalization of the social cost of carbon averagely related to their carbon pricing instruments. We find that there is a serious gap in current climate policies, which are far from creating optimal pricing conditions to reduce global emissions to levels needed by the Paris Agreement. The economic and distributional feasibility of a full implementation of the carbon pricing benchmark is tested in the same set of countries using two indicators, which are calculated for 2025, 2030, 2040 and 2050. Since the test results are income-regressive among income country groups, benchmark implementation by countries within the cooperative approaches of Paris Agreement art. 6 should be accompanied by the creation of an international cooperative fund aimed to recycle at least part of the revenues collected by high-income countries to compensate affected population in lower-income countries.
1. Introduction
According to the last World Bank report on carbon pricing [1], there are 75 carbon taxes and emissions trading schemes in operation worldwide. Even if some countries are making progress, current carbon pricing instruments only cover around 24% of global greenhouse gas emissions. Carbon price levels of most instruments are lower than those needed in the long run to induce, through research into innovative technologies and changes in lifestyles, the containment of global emissions required by the Paris Agreement goal.
The context of this article is the international debate on effective carbon pricing levels needed to prevent as much climate change as possible in a cost-effective way. Building on updated estimates of the social cost of carbon (SCC) obtained from the most recent literature, we propose an SCC-based benchmark for carbon pricing for the transition period (up to 2050) that is consistent with the Paris Agreement temperature mitigation goal [2]. The main function of the SCC benchmark is to allow the assessment of the degree of internalization of the external costs of carbon dioxide (CO2) emissions by state-regulated carbon pricing instruments (carbon taxes, cap and trade emission trading systems—ETS, energy taxes). Through the suggested benchmark, world governments can understand their positioning in carbon pricing during the transition and voluntarily raise carbon pricing rates (directly or indirectly, by reducing the emission cap in emission trading systems) with the aim of preventing future climate damages in a cost-effective way. In a “cap and trade” system, such as the EU-ETS, the market price of emission permits reflects the marginal cost of reducing emissions for a given cap: since a full internalization of the external costs of CO2 emissions is not guaranteed, the SCC can be used as a benchmark to assess the degree of internalization of the external costs of CO2 emissions into the permits market price, as proposed in this article, providing useful information to adjust the emission cap of the emission trading scheme. The benchmark is useful both for the domestic and the international dimension of carbon pricing instruments. For example, it can be used to further develop the cooperative approaches between countries foreseen by art. 6 of the Paris Agreement [2] (bilateral or multilateral agreements between countries on both market and non-market emission reduction measures). Art. 6 aims to increase the level of emission reduction ambition of each party’s pledges, embodied in its Nationally Determined Contributions (NDC), through three main types of voluntary bilateral or multilateral cooperative approaches [3]: (1) by transferring Internationally Transferred Mitigation Outcomes (ITMO) from one country to another for use towards achieving its NDC, avoiding double counting (art. 6.2); (2) through a United Nation Framework Convention on Climate Change (UNFCCC) centralized baseline-and-crediting cooperative mechanism for companies authorized by parties (6.4), that will update and substitute the Clean Development Mechanism introduced by Article 12 of the Kyoto Protocol; (3) finally, articles 6.8–9 provide a very general framework for non-market cooperative approaches (approaches that do not involve the transfer of ITMO), that in principle includes also bilateral or multilateral coordination between countries on mitigation measures that do not involve trading of emission permits, such as energy and carbon taxes, or carbon border tariffs.
Some definitions and preliminary clarifications are needed. The SCC represents the value in monetary terms of the long-term global damages of climate change attributable to the emission in a certain year of an additional ton of carbon or carbon dioxide into the atmosphere. The SCC is a form of environmental externality; specifically, it measures the pre-tax marginal external costs of CO2 emissions [4]. The utility of measuring the SCC is related to the wide range of applications of external cost measurement, among which are cost-benefit analysis, monetary based life-cycle environmental impact assessment, and environmental pricing (“internalization” of external costs through taxes or market-based instruments). According to some environmental economists [5,6,7], the SCC should be used to calculate the optimal level of the carbon tax (the point where the cost of emissions reduction equals the marginal social cost of carbon emissions), meaning that society is better off reducing emissions until the benefits continue to outweigh the costs.
Carbon taxes and other carbon pricing instruments, such as cap-and-trade schemes and carbon border taxes, are key tools for governments to reduce greenhouse gas emissions in a cost-effective way [8]. The Organisation for Economic Cooperation and Development (OECD) [9] and many other authors [10] believe that energy taxes based on a fixed rate per fuel quantity (e.g., excise duties on fossil fuels) should be included within the range of carbon pricing instruments, given that they specifically apply to a tax base that is directly proportional to CO2 emissions. Following the definitions of the OECD [9], we prefer to refer to “effective carbon pricing”, a concept that includes both explicit carbon pricing (the tax base is the carbon content of the fuel) and implicit carbon pricing (even if the tax base is different, it is directly proportional to CO2 emissions, allowing the calculation of the implicit carbon rate). Implicit forms have the same influence on relative product prices as a carbon tax.
For a long time, environmental economists have recommended carbon pricing instruments as the most cost-effective policy option for reducing emissions. In a critical review of previous literature, Baranzini et al. [11] present and discuss seven reasons for using carbon pricing in climate policy, among which is the empirical observation that when making purchase decisions, most consumers are more influenced by prices than by environmental concerns. More recently, Sterner et al. [12] recap the three main arguments for the superiority of carbon pricing mechanisms for allocating available financial resources to support the achievement of ambitious environmental targets: (1) pricing mechanisms are compatible with market competition rules, allowing the shifting of emission abatement measures between firms with different skills, technologies and abatement costs, thus enabling the world community to save huge amounts of financial resources to reduce emissions (static efficiency); (2) the level of the carbon price signal speeds up research and investments aimed at developing alternative low- and zero-carbon technologies (dynamic efficiency gain); (3) carbon pricing is not only a cost for firms and consumers but it is also an opportunity for governments, that can rely on its revenues to finance research, to incentivize the market uptake of low carbon innovations and to cope with distributional issues that could compromise its feasibility.
After the Paris Agreement, the debate on the carbon pricing benchmark enlarged from the SCC approach, suggested by mainstream economic theory, to the cost of emission reduction approach and other, more pragmatic, trial and error approaches. Both the High-Level Commission report on carbon pricing [13] and, a few years later, that of the OECD on effective carbon pricing [9], two major contributions suggesting a worldwide carbon pricing benchmark, criticized the uncertainty of SCC estimates and the low levels of the most authoritative ones (36 USD(2007)/t CO2 for year 2015 in the central estimate by the Intergovernmental Working Group (IWG) [14]; 31 USD(2010)/t CO2 for 2015 in Nordhaus [15]). These works questioned the ability of the SCC approach to recommend carbon price levels that could significantly slow down the projected increase in global temperature and suggested reference values based on alternative second-best approaches, such as the cost of emission reduction (see Section 2). Among supporters of the latter, Kaufman et al. [16] argued that the temperature target of the Paris Agreement provides an acceptable reference to calculate the optimal (expected) marginal cost of emissions reductions needed to achieve the target. This task requires fair conventional supply-demand models of the future energy system and its technologies, avoiding much more complex climate-economy modelling. However, supporters of the cost-benefit approach (involving SCC calculation) highlighted that the uncertainties encountered by the emission reduction cost method to define optimal carbon pricing are not less than those of the SCC [17,18]. Aldy et al. [18] highlight that a policy-consistent carbon price calculation depends not only on long-term subjectively determined assumptions about future policies but also on critical assumptions about technologies that are not commercially available today. Moreover, they underline the importance of measuring the benefits of addressing climate change as a means for evaluating and justifying climate policy. Replacing cost-benefit analysis and SCC measurement with cost-effectiveness analysis could slow down and delay the implementation of climate policies that are instead urgently required and justified by the scale of climate risks. The goal of reducing the uncertainty of the SCC estimates can be achieved by adopting transparent science-based protocols in the various steps of SCC calculation, as done since 2009 by the IWG in the US [14,19,20,21].
Our article intervenes in this debate by fully supporting the arguments of Aldy et al. [18] in favor of an SCC-based approach in cost-benefit appraisal of carbon policies and by advancing a policy proposal where this approach is applied in the context of carbon pricing. Building on a recent critical literature review on the SCC [17]), updated to the outcomes of the Environmental Protection Agency—EPA report of November 2023 [22] and its preparatory studies, we believe that the time is ripe to use the SCC as an international benchmark for assessing the adequacy of carbon pricing policies worldwide. In the last 5–10 years, SCC estimates have tended to be much higher and more accurate than previously estimated [17,21,22,23,24]. We believe that the objections to using too low and under-estimated SCC values, raised firstly by the High-Level Commission [13] and then by OECD [9] in their respective contributions proposing a carbon pricing benchmark, have been overcome by the most recent estimates of the SCC.
Comparing countries’ effective carbon pricing with the optimal cost of mitigation [16] might be considered practical, but it is counterproductive (not to say dangerous) for several reasons. The main reason is that the cost of reducing emissions to a policy target is not able to represent the size of the climate risks. As shown by the IPCC Special Report on 1.5 °C [25], the Paris Agreement’s temperature mitigation target reduces the expected damage from climate change but does not avoid it altogether. We need a benchmark for carbon pricing that raises the ambition from minimum costs of (partial) mitigation to the much higher benefits of climate change mitigation.
Another reason is that increasing taxes is socially difficult and the cost of the emission reduction approach shows taxation only as a further cost for people. On the contrary, an SCC-based benchmark allows measurement of the economic return of emission reduction in terms of avoided economic damage: it conceives effective carbon pricing not as a cost but as an investment with high social returns, and this could make the difference in public communication. When cost-benefit analysis is applied to carbon taxation, the two approaches are complementary and should be used for their respective purposes. The SCC is needed to establish the optimal level of carbon taxation while the cost of emissions reduction is needed to find the new optimal level of emissions reduction given the tax, which means balancing the cost with the climate benefits of emissions reduction.
Our main motivations for an SCC-based benchmark for carbon pricing can be summarized as follows: (a) the opportunity for countries to follow a common price signal of the economic convenience of investing in emission reduction measures that reflects a science-based estimate of the benefits (the avoided climate damage related to emission reductions); (b) the relevance of this information in enabling public communication to explain to people why carbon taxes are an opportunity (they have an economic return in terms of avoided damage) and not just an additional cost; (c) a uniform benchmark for all countries in the world that covers the external costs of CO2 emissions would re-establish fair environmental competition in international trade, avoiding free riders and global CO2 emissions waste (carbon leakage).
How would the proposed benchmark work? Bearing in mind that the full framework of the policy proposal is developed in the article through the implementation of our methodology, that includes a feasibility test for major challenges, the basic elements of our policy proposal can be anticipated as follows:
- −
- Yearly benchmark for carbon pricing conventionally expressed in USD/t CO2 emitted in a certain year, uniform for all countries, that increases each year of a given period (for example 2025–2050).
- −
- Internationally agreed science-based procedure to estimate the SCC value path to use as a benchmark (possibly under the auspices of the UNFCCC and IPCC).
- −
- An international competent body (or a task force) responsible for calculating the SCC under the procedure.
- −
- Environmental tax reform (revenue neutral tax reform) to favor country-level implementation of the SCC benchmark.
- −
- Compensation fund to manage distributional impacts in lower-income countries.
- −
- Rulebook to promote bilateral and multilateral agreements between high-income countries and lower-income countries under Articles 6.8–9 of the Paris Agreement. The rulebook is dedicated to implementing an SCC-based carbon pricing benchmark through national measures.
Once the SCC-based benchmark is established by the international competent body, governments can assess the average degree of internalization of the CO2 external cost related to their carbon pricing instruments by comparing the ratio between the carbon pricing revenues and CO2 emissions in a given year (including non-priced emissions, reduced rates or free emission permits allocations—so called “effective carbon pricing rates” [9]) with the worldwide SCC-based benchmark for the same year. The comparison can be made in various ways: considering all carbon pricing instruments, or single instruments; considering emissions of the whole economy or specific sectors only. Our article provides a first example of how the benchmark can be used by assessing the internalization of the CO2 emissions external costs considering all main effective carbon pricing schemes (carbon taxes + ETS + energy taxes) currently in force at the national scale (all economy sectors) in 71 Countries, using the OECD dataset on effective carbon rates [26].
Our analysis highlights that the world is currently far from the path of carbon pricing that fully internalizes the external costs of CO2 emissions, and which would enable deep CO2 emission reductions in line with the Paris Agreement goals. Not all hope is lost: our projections at 2050 simulating an immediate political turning point on carbon pricing (full and homogenous implementation of the SCC-based benchmark starting from 2025 up to 2050) suggest that the economic incidence of the tax burden on gross domestic product (GDP) would not be unrealistic for most of the high-income countries, while regressive effects for lower-income countries could be totally absorbed through an international compensation fund financed through just a part of the tax revenues collected in high-income countries. Finally, we show that the current Paris Agreement framework already has some rules and mechanisms that could be used to jointly enhance international cooperation on emissions trading mechanisms, carbon and energy taxation, and financial support for lower-income countries, but further political action is needed to further develop the needed regulations and to find coordinated and mutually convenient solutions.
Given that the aim of this article is to propose and discuss a global SCC-based benchmark to driving countries’ effective carbon pricing policies in the 2025–2050 timeframe, it is important to highlight its boundaries. Collateral—even if important—topics related to carbon pricing instruments, such as the effectiveness of different carbon pricing instruments, optimal design of carbon pricing revenue recycling, how to extend domestic carbon pricing coverage, or how to link different emission trading systems currently in force in different regions, remain outside of the scope of this article.
Our policy proposal substantially differs from other scholars’ contributions on how to increase carbon pricing worldwide after the Paris Agreement for its emphasis on the social cost of carbon as a science-based indicator to establish a dynamic international benchmark for countries’ carbon pricing policies, rather than an empirically adjusted benchmark to reach an agreed level of emission reduction [16,27,28]. In our approach, international negotiations on carbon pricing would be boosted by science and research rather than being held back by the inevitable contingent constraints that hinder an ambitious political objective.
The structure of the article is described as follows. Section 2 deepens the literature review on carbon pricing benchmarks with a particular focus on previous proposals and on distributional impacts, allowing the methodology to evaluate the main challenges and barriers to the implementation of the SCC benchmark. Section 3 illustrates the methodology with which we develop, test and improve our policy proposal, and briefly describes the dataset used for its implementation. Section 4 implements the first step of our methodology (setting the benchmark), by selecting SCC benchmarks over the period 2021–2050 through a review of the latest SCC literature. Section 5 corresponds to the second step of our methodology (benchmark use) and shows the results of an exercise where we use the benchmark to assess the degree of internalization of the CO2 external costs at the country level (comparison of current average country carbon rates with the SCC benchmark level). In Section 6, we test our main policy proposal by exploring the countries’ economic capacity to implement the SCC benchmark during the transition (up to 2050) and suggest complementary measures within the framework of the Paris Agreement. The main aim is to quantify the distributional disparities between groups of countries of a full implementation of the SCC benchmark, that must and can be overcome through a proper reallocating of expected revenues from carbon pricing. Section 7 is dedicated to the conclusions by recapping the main results, limits of the analysis and policy implications.
2. Literature Review on Carbon Pricing Benchmarks and Distributional Impacts
One of the most authoritative proposals for an international benchmark for carbon pricing has been developed in the OECD report on Effective Carbon Rates [9], in the framework of its work on energy taxation and effective carbon pricing at the global scale (OECD Series on Carbon Pricing and Energy Taxation [29]), with which the OECD monitors carbon taxes, CO2 emission permits prices and fuel excise duties rates in the OECD and many non-OECD countries. With the Inventory on fossil fuel support measures [30] the OECD also monitors subsidies that lower pre-tax fossil fuel prices for domestic use (direct subsidies), tax exemptions and tax allowances on energy products (indirect subsidies), allowing a more precise picture of effective carbon pricing that goes well beyond what default energy tax rates say. The OECD’s report on Effective Carbon Rates [9] suggests an international benchmark for carbon pricing (Section 3. “How far do we need to go to decarbonise?”) with three different levels: the first two levels (30 EUR/t CO2 by 2025 and 60 EUR/t CO2 by 2030) are consistent with a slow decarbonization scenario, in which net zero emissions are achieved by 2060; the third value (120 EUR/t CO2 by 2030) is consistent with a faster decarbonization scenario (net zero emissions are achieved by mid-century) and is presented as “a new benchmark that allows assessing progress towards carbon prices in the near future that are in line with current decarbonisation goals” [9], p. 8. If we look at sources supporting the OECD’s choice of these benchmark levels, we find that they are obtained from Kaufman et al. [16], whose “near term to net zero CO2” approach is based on energy-economy modelling and a long-term assessment of technology costs needed to abate CO2 emissions consistently with the Paris Agreement 1.5–2.0 °C goal. The OECD [9] renounces the climate damage assessment approach to define a benchmark for carbon pricing with the arguments that SCC estimates are uncertain due to the high variability of climate damage modelling results and that a second-best, more practical approach is available, based on costs of emission reductions needed to achieve a policy target. Unfortunately, these claims are not based on an updated literature review on the SCC and the range of variability of the CO2 cost estimates obtained with the cost of emissions reduction approach is not lower than that of the damage approach [17,18,25]. The IPCC special report on 1.5 °C [25] estimates a cost variability range of the emission reduction cost approach applied to a long-term stabilization scenario at 1.5 °C, which is between 15 and over 1,000 USD/t CO2 in 2030 (a year for which it is relatively easier to predict costs), and it increases to 200–10,000 USD/t CO2 in 2070. When implementing the cost of emission reduction approach consistently with a long-term temperature target, it is necessary to make long-term forecasts of the most promising technological innovations, their learning curves, the economies of scale, the regulatory policies, and of the size of subsidies needed for the commercial maturation of innovations as compared with the prevailing technologies: the evaluator who applies the mitigation cost approach at 1.5–2.0 °C no less relies on subjective/political choices than the climate change damage modeler does.
Besides the OECD, other authoritative sources contributed to the debate on the carbon pricing benchmark. At the end of 2016, the Carbon Pricing Leadership Coalition activated a High-level Commission on Carbon Prices, led by Nobel laureate Joseph Stiglitz and Lord Nicholas Stern, with the objective of identifying indicative corridors of carbon prices that can be used to guide the design of carbon-pricing instruments to deliver on the ambition of the Paris Agreement and support the achievement of the Sustainable Development Goals. The report of the High-level Commission on Carbon Prices [13] concludes that the explicit carbon-price corridor consistent with the achievement of the Paris Agreement should be at least 40–80 USD/t CO2 by 2020 and 50–100 USD/t CO2 by 2030. These ranges are based on a wide body of cost valuations that exclude the estimate of the climate change damage that would be avoided by reducing carbon emissions. “The Commission’s conclusions are based on its members’ experience and judgment, and draw on multiple lines of evidence—including technological roadmaps and technology assessments, national pathway analyses, and integrated assessment models—taking into account the strengths and limitations of these various information sources” [13], p. 50. The Commission renounced the use of estimates of the SCC, since “many of the impact functions used in modeling exercises to calculate the social costs of carbon are biased downward” [13], p. 52. In France, the Quinet Commission [31] recommends a much higher 250 EUR/t CO2 from 2030, 500 EUR/t CO2 from 2040 and 775 EUR/t from 2050. Unfortunately, the French benchmarks for carbon pricing are also “shadow prices” based on studies of technology and energy system costs needed to achieve substantial emissions reductions. Among the representatives of the pragmatic approach, van den Bergh et al. [27] suggest a dynamic strategy to upscale carbon pricing based on gradual steps along two parallel tracks: (1) founding a carbon pricing coalition among the most ambitious nations to implement a uniform carbon price at least as high as the minimum of the carbon taxes or carbon market prices in the member economies; (2) reorienting climate negotiations to a focus on global carbon pricing. The coalition should put increasing pressure on non-members to join by applying a uniform border carbon tariff (with a rate not higher than the minimum carbon price) on imports of goods and raw materials from non-members. In this approach, the carbon price benchmark is both the starting point (for member countries) and the target to reach (non-members), while the benchmark increase is left to negotiations ultimately driven by the Paris Agreement goal (“The starting price could then be increased regularly with an announced amount until emissions reduction conforms to a plausible pathway to the 1.5 or 2 °C temperature target” [27], p. 1063).
In recent years, the mainstream literature on the need to increase the level of carbon pricing for achieving net zero emissions has been paralleled by a new stream of literature more focused on the social acceptability of carbon pricing in relation to income distribution issues [32,33,34]. Existing evidence of distributional impacts of carbon pricing shows ambiguous results, often related to the income level of countries. Dorband et al. [35] find progressive distributional effects for countries with per capita incomes of below USD 15,000 per year at PPP-adjusted USD(2011), while carbon pricing tends to be regressive in higher-income countries depending on the pattern of energy expenditure among income groups. By dynamically analyzing the EU case in the context of international value chains, Merkle and Dolphin [36] find that a full uniformization of carbon prices within EU countries as well as across countries would have made policies less regressive in most EU countries over 2010–2020. This is because carbon pricing exemptions, such as on imports of goods or air travel, have benefited higher-income households more than lower-income ones. Corresponding to these developments, the literature on how to reduce or reverse the regressive effects of carbon pricing is also experiencing a fertile moment. Boyce [37] and Budolfson et al. [38] demonstrate that equal per capita payments from carbon revenue (equal carbon dividends) can successfully address the distributional and political challenges of carbon pricing. Oswald et al. [39] propose a carbon tax with differentiated rates in relation to the distinction between basic and luxury consumption. Corvino [40] discusses the ethical arguments of a combination of a uniform carbon tax plus equal per capita revenue dividends plus a “limitarian” tax to restrict rich people’s wasteful emissions.
The awareness of the distributional effects of carbon pricing is high in the international negotiations as well, and it is probably the main reason why the Paris 21st Conference of the Parties—COP [2] did not succeed in agreeing a mechanism for setting a global price on carbon [12]. After a first period of discouragement due to this outcome, economists started to look with greater attention at the regulatory framework offered by the agreement text, particularly art. 6 on voluntary cooperative mechanisms [41,42,43]. More and more bilateral and multilateral initiatives are being launched between countries in a bottom-up implementation of carbon credit trading under Article 4 (Nationally Determined Contributions—NDCs) and Article 6 (Cooperative Mechanisms) of the Paris framework [3,44,45]. Leveraging a growing awareness that carbon pricing revenues can and should be recycled by governments to mitigate distributional impacts of carbon pricing and increase cooperation between rich and poor countries, on 8 September 2023, African leaders adopted the Nairobi Declaration [46] urging world leaders for a global carbon tax on fossil fuels to accelerate action against climate change. In the same period, the European Commission President Ursula von der Leyen [47] asked G20 leaders to join a proposal for “Paris Aligned Carbon Markets” [48], that aims at accelerating the development of domestic carbon pricing and the implementation of the Paris Agreement art. 6 rulebook for international compliance carbon markets agreed in Glasgow at COP 26 [49]. COP 28 in Dubai (December 2023) agreed to “Transitioning away from fossil fuels in energy systems, in a just, orderly and equitable manner, accelerating action in this critical decade, so as to achieve net zero by 2050 in keeping with the science” [50], p. 5 but no substantial advance was made on the issues related to carbon pricing, particularly on the possibility of further developing art. 6.8–9 (Cooperative Non-Market Approaches) to strengthen international cooperation on domestic energy tax policies [51]. The COP 28 Earth Negotiations Bulletin writes: “Under the SBSTA, parties discussed draft SBSTA conclusions containing a progress report of the Glasgow Committee on Non-Market Approaches, and a draft CMA decision on recommendations regarding ongoing and future work. In the decision text, parties debated a reference to carbon pricing as a domestic fiscal measure to implement climate policies. Many developing country groups opposed this, stating that carbon pricing is a market approach. Some also opposed a reference to nature-based solutions on the same basis. The EU supported the inclusion, observing that levies and taxes are economic, but not market instruments” [51], p. 11.
3. Methods and Materials
The aim of the methodology of the article is to develop, apply, test and refine our policy proposal, based on an SCC benchmark for carbon pricing. During the exposition of the various steps of the methodology, we will also describe the main literature sources and dataset used. Figure 1 provides an overview of the method and data sources used in this article to propose and discuss an SCC-based benchmark for carbon pricing.
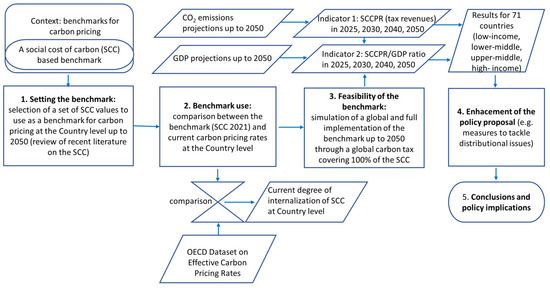
Figure 1.
Methodology overview (steps, datasets [26], indicators).
We have not applied any original integrated assessment model to develop and test the SCC benchmark. The originality of our analysis consists in organizing in a consistent framework what is to our belief the “best available” knowledge and data offered in the different areas under study (SCC, carbon pricing, emissions scenarios, GDP and population projections).
The first objective of our method is the establishment of a carbon pricing benchmark based on the SCC (step 1). In this article, we obtain the SCC through a literature review that is a shorter and more dedicated version of a much more detailed literature review of the SCC made by one of the authors [17]. Section 4 is dedicated to describing how and why we selected the contribution of Azar et al. [52] for the task of providing a set of SCC values for yearly emissions 2021–2050, to use as a benchmark for countries’ carbon pricing policies. Outside this article, we recommend that this fundamental step of the methodology is accomplished by an international competent body, responsible for calculating the reference SCC values under established scientific protocols. The protocols developed by the US-IWG (including the EPA in this group) to provide SCC reference values are based on the transparent use of previously validated Integrated Assessment Models—IAM (or individual modules, such as damage functions or discounting procedure) developed in collaboration with academics and scholars following the recommendations of an authoritative third-party body [53]. The US case represents a best practice to be transferred to the UNFCCC/IPCC framework. A description of these protocols is directly provided by the IWG [19,21] and EPA [22]. Molocchi [17] provides a critical review of the US case providing motivations for the transfer of this experience to the European and international context.
The step 2 objective (benchmark use) is to provide an example of benchmark use by assessing the gap of current countries’ carbon pricing policies in the internalization of CO2 emission external costs (comparison between the current level of the SCC benchmark and effective carbon pricing rates at the country level). The results of this exercise are presented in Section 5. For the comparison, we rely on the OECD database of effective carbon rates [26], which offers a homogeneous and complete picture of current average carbon pricing rates at the country level. More precisely, this database monitors the net Effective Carbon Rates (ECR) and CO2 emissions for 71 countries (38 OECD, 33 non-OECD) by considering energy taxes, carbon taxes and CO2 tradable permits, net of direct fossil fuel subsidies that decrease pre-tax fossil fuel prices. The database focuses on pricing instruments that specifically apply to a tax base that is directly proportional to CO2 emissions or energy use, offering a representation of net average ECR for emissions of energy use sectors (road, off-road, electricity, industry, buildings, agriculture and fisheries), detailed by fuel type (coal, fuel oil, diesel, kerosene, gasoline, LPG, natural gas, other fossil fuels and non-renewable waste). It therefore excludes taxes and fees that are only partially correlated with CO2 emissions or energy use, such as value added taxes, vehicle circulation taxes, or other environmental taxes not related to CO2 emissions. The dataset excludes royalties on the extraction or exploitation of fossil resources that are applied in some countries. Direct subsidies are also considered in the OECD’s net ECR indicator through an accurate country-level monitoring of these forms of support through the Inventory of fossil fuel support measures [30]. Data on CO2 emissions regulated by emissions trading schemes are obtained from official registries and the average ECR takes into account the allocation of free permits. Tax rates and permit prices refer to the same base year [26].
In contrast to other approaches that exclude energy taxes in monitoring carbon pricing worldwide [1,54] the OECD data base includes both explicit (the tax base is the carbon content of the fuel) and implicit carbon pricing measures (even if the tax base is not the fuel carbon content, it is directly proportional to CO2 emissions, allowing the calculation of the implicit carbon rate). Our main motivation in adopting the OECD data base is that implicit forms, such as excise duties on fossil fuels, have wide diffusion in most countries: a benchmark analysis based just on explicit instruments inevitably provides a limited picture of effective carbon pricing instruments affecting CO2 emissions.
Overall, the OECD database covers 88% of 2021 world fossil fuel CO2 emissions [55] and 91% of GDP [56]. Since the last available OECD data on ECR are related to year 2021, the step 2 comparison between countries’ ECP with the SCC benchmark (calculation of the current degree of internalization of the SCC at the country level) is referred to year 2021.
In step 3 (feasibility of the benchmark), the objective is to make a test to explore both the economic capacity of countries (particularly low- and middle-income countries) to implement the benchmark during the transition towards net zero emissions (until 2050), and the opportunities offered by carbon pricing revenues to manage the regressive effects on income. To do this, we assume an immediate (from 2025), full (100%) and worldwide implementation of the benchmark through an SCC-based uniform tax until the year 2050. This is an extreme scenario, voluntarily chosen to understand the main economic challenges of our policy proposal (starting from distributional implications), to eventually improving its main features. For the test, we use two linked indicators: the Social Cost of Carbon Pricing Revenue (SCCPR), which measures the country-level expected carbon tax revenue (obtained by multiplying the expected CO2 emissions by the SCC-based tax) and the SCCPR to GDP ratio, which measures incidence of the expected carbon tax revenue in GDP. The former offers information on financial resources that would be collected by states and potentially available to compensate distributional impacts, both domestically and in international cooperation; the latter provides information on the economic capacity of countries with a different income to sustain intense carbon pricing policies: low-income countries are in a worse position to afford high carbon prices (EUR/t) rather than high-income countries, so we need to monitor in order that the ratio between the expected carbon pricing revenue and GDP in low-income countries does not assume extreme values, much higher than in high-income countries. The proposed indicators have been chosen to explore and discuss the main challenges posed by the benchmark. A high SCCPR to GDP ratio does not necessarily mean that the uniform SCC-based benchmark is economically unfeasible, for at least three reasons: (1) carbon pricing policies can and should be implemented in a “tax revenue neutral” fiscal framework (so-called environmental fiscal reform, see Section 6); (2) high incidence in GDP means also high revenues that can be at least in part recycled by each government to compensate the most vulnerable layers of the domestic population; (3) impacts in poor countries can be totally relieved by appropriate (cooperation-based) transfer of resources collected through carbon pricing measures in high-income countries to compensate distributional impacts in low-income countries. The two indicators provide useful information to assess in advance distributional issues and consequently design appropriate (bilateral or multilateral) cooperative mechanisms between countries aimed at a full and homogenous implementation of the SCC-based benchmark for carbon pricing, avoiding distributional impacts (for example, the redistribution of all carbon tax revenues to all populations through an equal per capita lump-sum would have a progressive effect, as suggested by Boyce [37] and Budolfson et al. [38]). In Section 6, the two indicators are calculated in years 2025, 2030, 2040 and 2050 for the same set of 71 countries of the OECD dataset [26], and then reaggregated into four income per capita groups of countries by relying on the World Bank classification into high/upper middle/lower middle/low-income countries [57].
Regarding projected CO2 emissions (the potential tax base needed for calculating indicator 1 in Figure 1), we traced for the set of 71 countries the same emission reduction path obtained by Azar et al. [52] for global emissions in their optimal tax scenario. In the original contribution by Azar et al. [52], emissions are projected to decrease in the optimal scenario (with the carbon tax) by 50% in 2030 (reaching 20 Mt CO2) and by 70% in 2050 (12 Mt CO2). Subsequently, they become negative from 2065 onwards. We differentiated emission reductions between countries of the OECD database by using the modelled domestic emissions projections at 2050 compatible with the 1.5 °C temperature goal of the Paris Agreement elaborated by Carbon Action Tracker [58]. Regarding GDP projections needed for indicator 2 in Figure 1, we reconstruct the expected growth dynamic until 2050 by applying the OECD long-term forecast of real GDP for OECD countries [59]. The OECD forecast is based on an assessment of the economic climate in individual countries and the world economy, using a combination of model-based analyses and expert judgement [59]. This indicator is measured in USD at constant prices and Purchasing Power Parities (PPPs) using 2015 as the base year. For countries not covered by the OECD forecast, we made projections at 2050 based on the countries’ average annual GDP growth rate over 2013–2022 [60]. Moreover, we assume that in the 2023–2050 period, countries can reach higher income classes by making a projection of their Gross National Income (GNI) per capita at 2050 based on the average annual GNI growth over 2013–2022 [61] and on population forecast [62]. More detailed information on the methods used in the test (step 3) is provided in Appendix A (CO2 emissions and GDP projections) and B (country classification by income between 2025–2050).
The step 4 objective is fine-tuning of our policy proposal of an SCC-based benchmark for carbon pricing. After discussing the results of the test simulations, in Section 6 we add more elements and details of the policy proposal by suggesting complementary measures to tackle the regressive effects for low and middle-income countries and by exploring the opportunities to integrate the carbon pricing benchmark in the current Paris Agreement text, particularly through the cooperative approaches of art. 6.
Lastly, the method allows us to draw the policy implications of an SCC-based benchmark in the context of the Paris Agreement and future negotiations for its full implementation (step 5, Section 7).
4. Establishing an SCC-Based Benchmark for Carbon Pricing
In this section, we obtain the SCC values to use as a benchmark for carbon pricing through a literature review that is a shorter and more dedicated version of a much more detailed literature review of the SCC made by one of the authors [17]. While we focus here on a few recent SCC estimates for carbon pricing, it is important to introduce the scope and selection criteria of the original literature review. Molocchi [17] analyses literature reviews published in 2017–2023 and selected original contributions in 2012–2023 to find out and discuss a set of best values to use in cost-benefit analysis. One of its purposes is to provide a proposal of SCC values to update the external cost values for CO2 emissions recommended by the EC Handbook on external cost of transport [4]. His article develops and applies a qualitative and critical method for selecting the best SCC estimates which starts from analyzing values estimated under study reviews conducted within institutional processes [21,22,23,63], and then analyses the study reviews and meta-analysis made in academic or research contexts, and in the end delves into selected academic studies that provide original estimates of the social cost of carbon. The method proposed by Molocchi [17] relies on a priority principle that implicitly reflects the degree of third-party screening and discussion of the SCC values deemed to be the preferred values by authors. This method for reviewing literature on the SCC is the opposite to the conventional one that finds out and lays down for statistical analysis all possible estimates of the SCC ever published in the academic literature. Overall, this work analyzed 53 studies, 33 of which produced quantitative estimates of SCC. A subset of six works [22,52,64,65,66,67] that meet minimum quality standard criteria—such as update to the latest science and modelling, accuracy in the various steps of SCC calculation (particularly regarding completeness in the coverage of damage types and robustness of damage functions) and transparency—is finally selected and discussed. A comparison of these selected estimates, made by the author at the same discount rate and currency price, shows in all cases much higher SCC levels than those estimated by the US-IWG [21], which were rushed out in February 2021 pending completion of the SCC update process during the Biden administration. A distinctive position among these studies is that of the EPA, which is a member of the IWG. In November 2023, the EPA released the final version of its report on the social cost of the three main greenhouse gases (SC-GHG), which finally incorporates numerous methodological updates compared to previous IWG reports, as recommended by the scientific community [18,53,68].
The EPA report represents a qualitative leap from previous IWG studies. Even if the main purpose of its report is to produce SC-GHG estimates to use in Cost-Benefit Analysis (CBA) and regulatory impact assessment under US federal laws (and not in carbon pricing), it is worth synthesizing its features to highlight recent advancements in SCC modelling and estimation. The SC-GHG best estimates of the new EPA report no longer rely on the three IAMs used in previous IWG works (DICE, FUND, PAGE [19]). The EPA addresses the near-term recommendations of the NASEM [53] by adopting a modular approach to SC-GHG estimation where each module of the calculation process draws on the updated knowledge from the relevant scientific disciplines, assembled in a single integrated assessment model developed by the EPA itself [17,22]. For each emission year in the period 2020–2080, the EPA obtains a frequency distribution of the SC-GHG by averaging Montecarlo results for the combination of three alternative climate damage functions and three near-term discount rates (1.5%, 2.0% and 2.5%), given the same probabilistic socio-economic and emission scenario [69]. Assuming the central rate of 2%, the average of the SC-CO2 frequency distribution estimated by the EPA [22] for the year 2020 is 193 USD(2020)/t CO2. In the period up to 2050 (the time horizon assumed in this article), the EPA’s SC-CO2 grows quite linearly, increasing to 230 USD(2020)/t CO2 in 2030 and reaching 308 USD(2020)/t CO2 in 2050. Innovations introduced by the EPA report result in a much higher SC-CO2 than previous IWG reports. If one compares the SCC estimated by the EPA [22] with the IWG’s latest value [21] in the same year (2020) and at the same discount rate (2.5%) –thus comparing all the methodological updates introduced by EPA, except discounting– the new SCC value increases by 54%. If the comparison is made assuming the central social discount rate (SDR) recommended by the two reports (respectively 51 USD(2020)/t CO2 at SDR 3.0% in IWG and 193 USD(2020)/t CO2 at SDR 2.0% in EPA), the increase of the SCC reaches +278% [17].
As anticipated, the EPA’s SCC yearly values are not designed for use in carbon taxation. They reflect very accurate and updated baseline scenario assumptions that exclude the simulation of a global carbon tax. For example, the IAM developed by the EPA [22] is not designed to provide information on the possible emission reduction response of world economies to a full and immediate implementation of an SCC-based pricing scheme. In a carbon pricing context, the EPA’s new estimates for the SCC are meaningful to define the starting level for optimal carbon pricing for the first year only (2020).
At least two recent studies, included in Molocchi’s [17] selection of best recent works, should be mentioned for estimating the SCC within a broader model suitable for carbon taxation: Hänsel et al. [65] and Azar et al. [52]. Both contributions extend and update DICE (Dynamic Integrated model of Climate and the Economy), the IAM originally developed by Nobel laureate Nordhaus [7]. DICE not only calculates the SCC under a baseline/no additional climate policy scenario; one of its main features is the inclusion of a CO2 abatement marginal cost function and the possibility to simulate a global carbon tax policy scenario, finding the optimal emission, temperature and carbon tax dynamic trajectories by balancing the cost of emissions reductions and the marginal damage of climate change. Even if the stated aims of the two studies differ (the aim of Hänsel et al. [65] is to verify if an economically optimal climate policy based on a dynamic SCC tax is consistent with the Paris Agreement goal of limiting temperature increase well below 2° C and possibly 1.5 °C, while Azar et al. [52] aim to estimate the social cost of methane (SCM) in a modelling framework consistent with the social cost of carbon dioxide, thus proposing the SCM/SC-CO2 as an alternative indicator to the widely known Global Warming Potential – GWP), they use the same economic damage function, obtained from the econometric meta-analysis by Howard and Sterner [70], that in principle includes all climate damages except catastrophic-type damages. Both contributions show that when using updated versions of DICE, the SCC calculated under the “optimization scenario” (with a carbon tax equalling the SCC) allows fast and substantial CO2 emission reductions, consistent with the Paris Agreement goal of limiting temperature increase to well below 2 °C and possibly 1.5 °C. In Hänsel [65], two different discounting approaches are adopted, following Drupp et al. [71] where experts’ preferred long run specifications of the Ramsey formula are investigated. In the median expert’s view, full decarbonization (zero emissions) takes place by 2065 and temperature increase is mitigated to 1.4 °C by 2100 (with a slight overshoot), while with the median expert path full decarbonization results in 2080 and temperature increase is mitigated to 1.8 °C by the same year. In the median expert path, each expert’s chosen pair of discounting parameters is used to run the calculation of the SCC and the median SCC is taken on runs for all experts. In the median expert’s view, the median values of each Ramsey parameter resulting from the expert survey are considered (Pure Rate of Time Preference—PRTP = 0.5% and Elasticity of Marginal Utility—EMU = 1.0%). In Azar et al. [52] the median expert’s view, which is used for discounting damage in the calculation of the optimal SCC, allows to cut global CO2 emissions by 50% at 2030 as compared to 2020 (reaching about 20 Gt CO2), and by 70% at 2050 (reaching about 12 Gt CO2); CO2 emissions become negative in 2066 and go on declining to about −17 Gt CO2 in 2085 (afterwards, they stabilize at that level). Their model shows that it is optimal to limit the global average surface temperature increase to 1.5 °C above the 1850–1900 average by 2100 after peaking at almost 1.7 °C in 2070. Even if no detailed information is provided on marginal CO2 abatement cost curves assumed in these works, technology readiness level of promising innovations is to a certain degree taken into account, at least in the long term. In fact, both studies include negative emission technologies (carbon dioxide removal technologies such as biomass energy with carbon capture and storage, afforestation programs and direct air capture) within the model authors use for their preferred estimates and discuss their role in influencing the speed of decarbonization and the effectiveness of an SCC-based tax.
If we consider the SCC results obtained by the two studies under the same discounting assumptions (“median expert view”), Hänsel et al. [65] estimate 208 USD(2015)/t CO2 for 2020 emissions, while Azar et al. [52] estimate for the same year 192 USD(2015)/t CO2. To compare with the EPA’s estimate (expressed in USD(2020)), the two inflation-updated values become respectively 226 USD(2020)/t CO2 and 208 USD(2020)/t CO2, that are slightly higher than EPA’s 193 USD(2020)/t CO2 calculated with a 2.0% near term discount rate. It’s worth to note that comparison with this value is appropriate since the calibrated Ramsey formula parameters used by the EPA (2023) to calculate the 2.0% rate case are PRTP (pure rate of time preferences) 0.2 and EMU (elasticity of marginal utility in respect to consumption per capita) 1.24. The equivalent consumption per capita growth rate that equates the Ramsey formula to obtain 2.0% with these parameters is 1.45. Combining the Ramsey parameters of “the median expert view” of Hänsel et al. [65] and Azar et al. [52] (PRTP 0.5% and EMU 1.0 in both cases) with a 1.45 growth rate, we obtain a near term discount rate of 1.95%, that can be approximated to the EPA near term 2.0% rate. Both works provide SCC values that are quantitavely consistent with those of the EPA, with the key difference that they offer an SCC path for future years that is calculated under a policy scenario with a worldwide implementation of a carbon tax fully aligned with the SCC, while the EPA’s SCC values reflect a baseline scenario for CO2 emissions without such an assumption. More precisely, while in the EPA’s baseline scenario (taken from Rennert et al. [69]) world CO2 emissions slowly decline from the current 42 Gt CO2 to 33 Gt CO2 by 2050, in the optimal scenario by Azar et al. [52] the emission reduction path is much more radical: global emissions reduce to 12 Gt CO2 by 2050 and become negative from 2065 onwards. To represent the SCC benchmark under an optimized global carbon tax scenario, we have a slight preference for Azar et al. [52] rather than Hänsel et al. [65], since the former updates the original DICE-2016R2 model by including methane emissions and an atmospheric methane cycle, an improved carbon cycle and energy balance model, enabling an estimation of the social cost of methane (SCM) and of the SC-CO2 in a consistent framework.
As a sensitivity analysis of our preferred SCC estimate for 2020 emissions (208 USS(2020)/t CO2 [52]), we can make reference to a few other estimates based on the same 2% near term discount rate, included by Molocchi [17] in its subset of selected best values:
- (a)
- 185 USD(2020)/t CO2: this is the best estimate provided by Rennert et al. [67] by using the Greenhouse Gas Impact Value Estimator (GIVE) model with a sectoral type of damage module (damage in different sectors or of different types are summed up to obtain an aggregate figure). GIVE damage module has been adopted by the EPA [22] as one of its three alternative damage functions (results with the three options are averaged by EPA to obtain final SSC estimates). The GIVE damage module [67] includes estimation of climate damage occurring in four sectors or impact categories: health (heat and cold-related mortality), energy expenditures for space heating and cooling (buildings only), agriculture (welfare changes due to crop productivity loss using a general computable equilibrium model) and coastal regions (various impact-pathways of sea level rise). Even if GIVE includes also two tipping points related to sea level rise (the melting effects of the Antarctic Ice Sheet—AIS and Greenland Ice Sheet—GIS on sea level rise [72]), it cannot cover the wider range of tipping points currently analyzed in the economic literature [73]. Considering the limited coverage of tipping points, GIVE estimates are much more comparable to SCC estimates limited to non-catastrophic damages.
- (b)
- 205 USD(2020)/t CO2: this is a sensitivity case provided by Rennert et al. [67] where the GIVE model runs a global GDP damage function elaborated by Howard and Sterner [70] representing non-catastrophic damage, which has been adopted by the EPA (with corrections) as the second of its alternative three damage functions [22].
- (c)
- 438 USD(2020)/t CO2: a further sensitivity case where Molocchi [17] assumes that the GIVE framework by Rennert et al. [67] uses, instead of the EPA-corrected Howard and Sterner damage function (non-catastrophic damage), an alternative damage function that includes both non-catastrophic and catastrophic damage (spec. 7, Table 2 in Howard and Sterner [70]). Even if both parameters of Howard and Sterner’s [70] econometric analysis of this function are statistically significant, in the EPA’s [22] review of their work the total damage (catastrophic and non-catastrophic) function calculated by Howard and Sterner is deemed an ill-grounded estimate because original observations do not reflect a detailed modelling of climate tipping points (which is why the EPA considers only the non-catastrophic coefficient of the econometric specification 7 in Table 2 of Howard and Sterner [70]).
Catastrophic damage (so called “climate tipping points”) is indeed relevant. Examples are the thawing of permafrost (due to the feedback effect on carbon dioxide and methane emissions), the disintegration of the ice cap, or a change in the circulation of important sea currents. In the literature on SCC, this set of phenomena (not to be confused with the impacts of extreme meteorological events related to long-term temperature increase) is denoted with the term “tipping points”, defined as “subsystems of the Earth system, present on a sub-continental scale which, under certain circumstances, small or slow perturbations can transform into a state qualitatively different from the ordinary one” [73], p. 1. Even if the economic literature on tipping points is fast developing [66,72,73,74,75], economic damage estimates of these complex phenomena are still too uncertain and specific to be included in a comprehensive and robust estimate of the SCC [17]. Following the judgment of the EPA [22], we prefer not to include tipping points in our preferred estimate of the SCC, and to consider the SCC estimate that includes this type of damage (438 USD(2020)/t CO2 for 2020 emissions) as a possible upper level for our benchmark, for sensitivity analysis purposes.
To recap, Figure 2 shows the SCC optimal path taken from Azar et al. [52], adopted in this article to represent the international benchmark for carbon pricing in the 2021–2050 period (all values are updated to constant USD(2021)). The SCC increases over the period with a clear linear trend, due to a combination of climate and economic factors (the projected growth of GDP increases future willingness to pay to avoid climate damages, increasing the SCC in time).
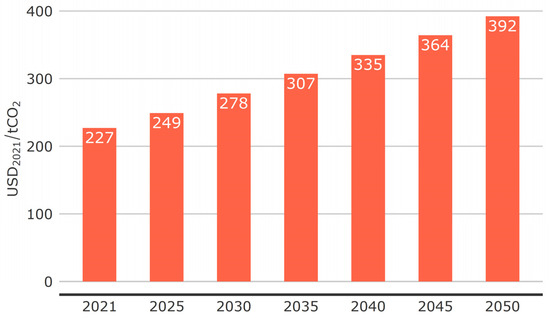
Figure 2.
SC-CO2 in the DICE optimized emissions reduction path 2021–2050 (USD(2021)/t CO2). Source: elaboration of Azar et al. [52]. Original values are updated to 2021 prices. SCC data for 2021–2050 have been extracted from the original graph by using a data extraction tool (Plotdigitizer). Since the obtained rough data show a small dispersion both above and below a linear trend, for the benchmark we linearly interpolated the extracted data.
If we compare our suggested SCC-based benchmark with the highest of the three levels of benchmark adopted by the OECD [9] in its report on effective carbon pricing (120 EUR/t CO2 by 2030, unspecified currency year), our benchmark for emissions in the same year (278 USD(2021)/t CO2 by 2030) is equivalent to 235 EUR(2021)/t CO2: it nearly doubles (+96%) the most ambitious of the OECD’s. This is not the only difference with the OECD: our benchmark provides yearly differentiated (increasing) reference values from 2021 to 2050, providing the opportunity for governments to make ex post yearly comparisons with their effective carbon rates (see Section 5 for a comparison in 2021) and to make forecast comparisons with their carbon price strategies on a longer time period than 2030, consistent with the timing of a net zero emission scenario by 2050, as needed by the Paris Agreement goal [16].
5. Using the Benchmark: Where Do Countries Stand in the Internalization of the SCC?
What is the current situation on effective carbon pricing and where do world countries stand as compared to the SCC benchmark? In this section, we present the results of a comparison between the current level of effective (both implicit and explicit) carbon pricing and the proposed SCC-based benchmark, and we highlight the main differences with the benchmark adopted by the OECD (2021).
For the comparison, we assume the same currency (USD(2021)) and the same year (SCC 2021), since 2021 is the last available year of the OECD database on Net Effective Carbon Rates—NECR [26] (NECR values of the data base are measured in EUR(2021). The average exchange rate for 2021 is 1 EUR(2021) = 1.183 USD(2021)). As stated in Section 3 (Methods and Materials), the carbon pricing instruments covered by the OECD dataset are energy taxes, carbon taxes and CO2 tradable permits. Internalization in energy prices is calculated by also considering the role of direct subsidies to fossil fuels (financial transfers that decrease pre-tax fossil fuel prices) that are still present in some middle- and low-income countries. We have elaborated the dataset to obtain the average level of internalization of the SCC in four subsets of countries by using the World Bank [57] thresholds to classify countries in high/higher middle/lower middle/low-income groups. High-income economies are those in which 2022 GNI per capita (inflation adjusted to 2023) was more than USD 13,845, upper-middle-income economies are those in which 2022 GNI per capita was between USD 4,466 and USD 13,845, lower-middle-income economies between USD 1,136 and USD 4,465, low-income economies USD 1,135 or less. In Appendix B, we provide more information on how we elaborated the dynamic country classifications by income per capita from 2021 to 2050.
Figure 3 shows that the degree of internalization of the SCC-based benchmark for year 2021 (227 USD(2021)/t CO2) for the total set of 71 countries is very low (11.6%) and a similar result is obtained in the four income country groups: the ratio between NECR and the SCC benchmark is low not only in lower-income groups, as expected, but also in the high-income group of countries (22.7%), which should lead other countries in reducing emissions. Figure 3 highlights a serious delay of national climate policies in establishing the optimal pricing conditions needed to invert (in the short term) the historical increase in global CO2 emissions and then to achieve (in a longer term) deep cuts in CO2 emissions.
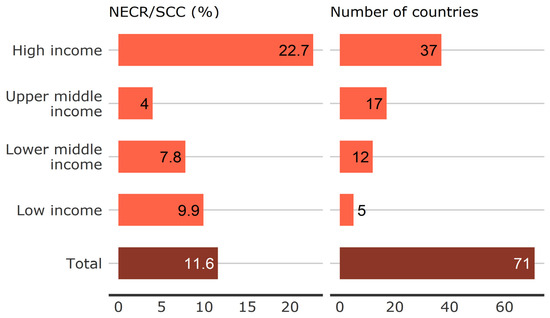
Figure 3.
Average internalization of the SCC (NECR/SCC) in 2021, set of 71 countries (38 OECD, 33 non-OECD). Source: authors’ elaboration of OECD ([26] and Azar et al. [52].
For sensitivity analysis purposes, if the upper value of 438 USD(2020)/t CO2 suggested in Section 4 [67,73], that represents a more uncertain SCC estimate that includes catastrophic damage, is used as a benchmark for carbon pricing for 2021 emissions (457 USD(2021)/t CO2), the degree of internalization of the external costs would reduce to 5.7% for the 71 states (11.2% for high-income countries), highlighting an even wider gap in current carbon pricing policies compared to the SCC benchmark.
Table 1 offers additional information on the current situation by calculating either the absolute revenues (Net Effective Carbon Pricing Revenue—NECPR, penultimate column, obtained by multiplication of each country’s average NECR with its potential tax base in terms of CO2 emissions from fossil fuels) and the NECPR to GDP ratio (last column), an indicator that expresses both the potential difficulty of countries in bearing the costs of pricing and the financial opportunities related to a growing amount of revenues.

Table 1.
Net effective carbon rate (NECR), net effective carbon pricing revenue (NECPR) and NECPR incidence in GDP in year 2021. Source: elaboration of OECD ECR database [26].
Current revenues from implicit and explicit carbon pricing in the whole set of 71 countries amount to USD 772 billion in 2021. NECPR incidence in GDP for the whole set of 71 countries is 0.86%, with a percentage for high-income countries (1.03%) that is slightly higher than the average. Paradoxically, the percentage of the lower-middle-income group (1.04%) exceeds those of the upper-middle- (0.48%) and high-income groups. This outcome is mainly related to the significant role of road transport energy taxes in some lower-income countries, rather than to explicit forms of carbon pricing. For example, India (lower-middle-income group) shows an economy-wide NECR of 22.2 USD(2021)/t CO2) and an average NECPR to GDP ratio of 1.7%, which is much higher than the high-income average. According to the detailed sectoral data provided by the OECD’s dataset [26], the average carbon rate of gasoline tax in the Indian road transport sector is 198 USD(2021)/t CO2 and that of the diesel tax is 162 USD(2021)/t CO2. No carbon taxes or ETS are in force in 2021 (India is planning an ETS from 2025 [1]). In China (upper middle-income country group in 2021), the economy-wide NECPR to GDP ratio is 0.48% (NECR is 8.5 USD(2021)/t CO2). According to the detailed sectoral data [26], the gasoline tax for road transport in China is equivalent to 104 USD(2021)/t CO2, the diesel tax is 70 USD(2021)/t CO2, while the average carbon pricing rate of the newly introduced ETS (2021), calculated on fossil fuel emissions in the electricity sector, is much lower, at 6.4 USD(2021)/t CO2.
The poor performance of high-income countries in current levels of carbon pricing finds a better clarification in Figure 4, that highlights unpleasant disparities between countries in a group that should be much more ambitious and cohesive in its carbon pricing policies. While the average NECR for these countries is 51.4 USD(2021)/t CO2 (1.03% of GDP), the USA pays on average 17.4 USD(2021) (a ridiculous 0.37% of GDP), Australia 25.1 USD(2021) (0.57% GDP), Japan 36.4 USD(2021) (0.84% GDP). On the other side, other high-income countries pay per ton of CO2 more than double the group average: Germany 106.7 USD(2021) (1.94% GDP), UK 129.2 USD(2021) (1.36% GDP), Italy 130.1 USD(2021) (1.97% GDP), France 131.2 USD(2021) (1.42% GDP). There is a group of eastern European countries with even higher revenue to GDP ratios, such as Estonia (4.25%), Czech Republic (3.14%) and Poland (3.12%), notwithstanding their NECR is around 70 USD(2021)/t CO2 (this is due to their relatively high CO2 emissions as compared to GDP). Some high-income countries pay a higher NECR, such as Switzerland (200.3 USD(2021)/t CO2) and Denmark (157.2 USD(2021)/t CO2), but due to their relatively low CO2 emissions and high GDP their revenue to GDP ratio is much lower (respectively 0.83% and 1.31%).

Figure 4.
Net Effective Carbon Rate (USD(2021)/t CO2) and Net Effective Carbon Pricing Revenue by GDP (%) in year 2021, 37 high-income countries. Source: authors’ elaboration of OECD [26] and World Bank [56].
In the lower middle- and low-income countries of the dataset, some stand out as best cases in effective carbon pricing at the world level, given that they achieve an internalization degree of the SCC which is even above the high-income countries’ average of 22.7%: Uganda 45% (120.7 USD(2021)/t CO2), Kenya 35% (92.8 USD(2021)/t CO2), Rwanda 29% (77.9 USD(2021)/t CO2). To complete the picture, in the 17 upper middle-income group of countries, we still find some best-case countries (Costa Rica pays 115.1 USD(2021)—that is, 43% of the SCC benchmark—and Paraguay 63 USD(2021), 24% of the SCC), but we also find very important countries with an internalization of the external costs that is lower than 5%: Brazil pays only 0.2 USD(2021)/t CO2, Russia 5.3 USD(2021) and China 8.5 USD(2021)/t CO2 (internalization of the SCC benchmark is 3.2%).
We can present some more examples of the specific carbon pricing instruments that produce these results. In the EU member states, the high average NECR values result from high energy taxes in the road transport sector and—to a lesser but increasing extent—the price of ETS permits, which increased from 35 to 85 EUR/t CO2 during 2021 (41–100 USD(2021)). In Italy, 85.1% of overall CO2 emissions from energy use were priced in 2021. Even though no carbon tax is in force, the gasoline tax in transport is equivalent to 381 USD(2021)/t CO2, the diesel tax net of the duty rebate in road freight sector is 274 USD(2021)/t CO2, natural gas excise duty revenue in the building sector is equivalent to 79 USD(2021)/t CO2, while the average ETS revenue is equivalent to 63 USD(2021)/t CO2 in the electricity sector and 44 USD(2021)/t CO2 in industry (only a share of industry emissions are covered by the ETS). If we use the SCC 2021 benchmark of 227 USD(2021)/t CO2 for the Italian case, a good potential for increased revenue is mainly found in the expansion of the ETS in the residential, aviation and maritime transport sectors and in the elimination of the numerous energy tax rebates and exemptions in all sectors [76].
For comparison with Italy, we can take the US case, where 32% of country emissions are priced (62% less than Italy’s) and the country NECR is 17.4 USD(2021) (87% less). There are three active ETS in the US: California, Washington, and the Regional Greenhouse Gas Initiative (RGGI), participated by eleven Northeast states (Connecticut, Delaware, Maine, Maryland, Massachusetts, New Hampshire, New Jersey, New York, Pennsylvania, Rhode Island, Vermont). Energy taxes in the US transport sector are much lower than in Italy (both gasoline and diesel are around 53 USD(2021)/t CO2), fuel taxes in non-road sectors (buildings, industry, agriculture and off-road transport) are on average close to zero (0.9 USD(2021)/t CO2), no carbon tax revenue is registered and the average carbon rate generated by the three regional ETS is negligible (1.3 USD(2021)/t CO2 in the electricity sector, 1.2 USD(2021) in the building sector and 0.7 USD(2021) in industry). When the SCC benchmark for 2021 (227 USD(2021)/t CO2) is used to assess carbon pricing policies in the US, the poor performance of regional and scattered carbon pricing initiatives becomes clear. Moreover, the benchmark highlights the extent of the gap in the US between the level of pricing required for full internalization of climate damage and the persistent domestic willingness to defend the competitiveness of industry by not raising energy taxes on fossil fuels. As a measure of CO2 external costs, the SCC aims to establish a level playing field for environmentally fair competition in the global economy.
In terms of internalization of the external costs of CO2 emissions at the country level, to present some examples in the high-income groups based on our SCC-based benchmark value for 2021 (227 USD(2021)/t CO2), Switzerland ranks first with 75%, followed by Denmark (59%), Sweden (57%), Netherlands (56%); France and Italy are at 49%, Germany 40%. All the above-mentioned countries stay above the average internalization degree of high-income countries of 22.7%. Very rich countries in the high-income groups have an internalization degree of the CO2 external costs that is incredibly low: USA 6.5%, Australia 9.4%, Japan 13.6%.
We can also compare our results for country groups in terms of current degree of internalization of the SCC benchmark with those achieved by the same set of countries using the OECD benchmark (OECD, 2021). Since effective carbon pricing data refer to the year 2021, we refer to the closest benchmark level proposed by the OECD [9] (30 EUR/t for the year 2025, that is 34.2 USD(2021)). The outcome would be:
- −
- in the set of 71 countries, the average internalization of the OECD benchmark in 2021 would increase to 76.8% (average NECR is 26.3 USD(2021)/t CO2, that is 76.8% of the 34.2 USD(2021) benchmark);
- −
- the high-income countries group (37 countries) would reach an average NECR of 51.4 USD(2021)/t CO2, that is 50% above the OECD benchmark (the benchmark is achieved by high-income countries 4 years before 2025);
- −
- the other country groups of the available dataset (34 countries) would remain far below the OECD benchmark, precisely at 25.7% by the 17 countries of the upper middle-income group (9.1 USD(2021)/t CO2), 49.6% by the 12 countries of the lower-middle-income group (17.6 USD(2021)/t CO2) and 63.1% by the five countries of the low-income group (22.4 USD(2021)/t CO2).
The main message that comes out from this analysis using the OECD benchmark for 2025 is this: high-income countries have already done the job, now it is the turn of lower-income countries. This message would be completely misleading. On the contrary, the main message provided by the exercise presented in this section, in which we use a science-based benchmark that represents a conservative estimate of climate damage (non-catastrophic damage), is as follows:
- −
- all countries, some more than others, are lagging behind. The carbon pricing levels reached by European countries (mostly through high energy taxes and the UE-ETS permit price) are still far from reaching a sustainable path for carbon pricing;
- −
- all countries should be involved in reaching the SCC benchmark (the SCC is global by definition);
- −
- since all countries must be involved, given the different economic responsibilities and capacities, all high-income countries should take the lead as compared to lower-income countries.
With an SCC benchmark, carbon pricing free riders among high-income countries would be exposed to the public with economic arguments based on climate science. As anticipated in the introduction, we believe that high-income countries would adopt and implement the SCC-based benchmark for a mix of informative, economic and policy drivers:
- −
- greater awareness for countries of their effective positioning on carbon pricing;
- −
- stronger arguments for governments in their communication with citizens on tax issues (SCC pricing is not a cost but an investment with global returns);
- −
- science-based level playing field in economic competition, based on the internalization of climate risk into prices, avoiding trade wars between environmental forerunners and free riders;
- −
- opportunity to raise higher revenues for financing climate transition costs while supporting lower-income countries;
- −
- a more cooperative international scenario.
6. Discussion of the SCC-Based Benchmark and Fine-Tuning of the Policy Proposal
How high could the revenues by GDP become due to a carbon pricing strategy of full implementation of the SCC benchmark? How can distributional issues be integrated in an SCC-based benchmark for carbon pricing involving all countries in its implementation? In this section, we improve our main policy proposal by discussing two major challenges to implementing the SCC-based benchmark on a global scale: countries’ economic capacity to afford high carbon pricing levels and equity issues (regressive distributional effects). We will do this through a “stress test” aimed at exploring both the economic capacity of countries to implement the benchmark during the transition towards net zero emissions (until 2050), and the opportunities offered by carbon pricing revenues to absorb regressive income effects.
The feasibility test assumes the same carbon pricing scenario as in Azar et al.’s [52] optimal scenario, meaning that all countries adopt a carbon tax (or any other implicit or explicit carbon pricing measure that applies to a tax base that is directly proportional to CO2 emissions, as in OECD [9]), let us say from 2025, by immediately applying 100% of the recommended SCC up to year 2050, without any differentiation between rich and poor countries. This is an extreme case, voluntarily chosen to understand the main economic challenges or obstacles to our policy proposal and, consequently, to suggest complementary conditions or measures to better manage them. Note that the SCC-based benchmark for 2021–2050 CO2 emissions proposed in Section 3 assumes that all world countries apply the same carbon tax rate. Any free rider could compromise the successful achievement of emission reductions that are implicit in the model with which the optimal carbon tax is calculated. An equal SCC for all countries would help restore conditions of fair competition from the point of view of climate change. Brown technologies would homogenously pay more for their carbon emissions in all sectors and countries, thus stimulating the diffusion of alternative green technologies worldwide.
For the test, we will use the two projection-based indicators presented in Section 3 (Methods and Materials): the Social Cost of Carbon Pricing Revenue (SCCPR) and its incidence in GDP (SCCPR to GDP ratio).
Due to data constraints, the test is limited to the same set of 71 countries of the OECD database [26]. Appendix A recaps the main assumptions and dataset used for the simulation. Results for years 2025, 2030, 2040 and 2050 are shown in Figure 5 for the whole set of 71 countries and each income group; results at the country level are provided in the text.
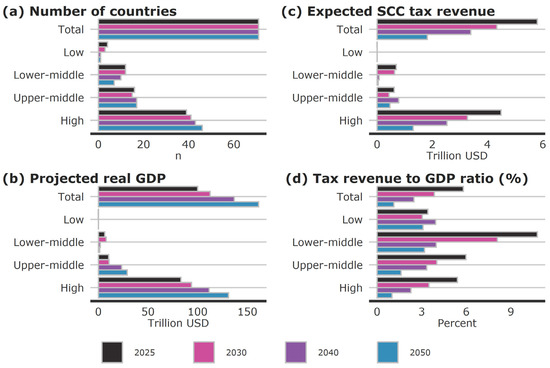
Figure 5.
Final results of the simulation of the Social Cost of Carbon Pricing Revenue (SCCPR) on GDP, 2025, 2030, 2040, 2050.
Graphs (c) and (d) in Figure 5 show that the larger economic impacts are expected in the first period of implementation of the uniform SCC-based carbon tax, after which both revenues (c) and ratios (d) decline year by year until 2050. This result is due to two factors: (1) in an SCC-based carbon pricing scenario, CO2 emissions are projected to decline very fast in the OECD set of countries (−47% in 2021–2030, −84% in 2021–2050) and (2) GDP is expected to grow by 81% in 2021–2050.
The amount of revenues than can be potentially raised in all 71 countries of the OECD database is USD(2021) 5.8 trillion in 2025 (5.8% of the aggregated GDP). The high-income countries will raise most of the funds (USD(2021) 4.5 trillion), with a SCCPR to GDP ratio of 5.4%, which seems quite feasible (comparable with the current ratio of some east-European countries, such as Estonia at 4.3% or Poland at 3.1%). The most impacted group of countries is the lower-middle-income group, with 10.8% of GDP, followed by the upper middle-income (6.0%) and the low-income group (3.4%). At the country level, in the upper middle-income group the SCCPR to GDP ratio in year 2025 goes from 2.1% for Costa Rica to 18.5% for South Africa. In the lower-middle-income group, the ratio goes from 2.9% for Ivory Coast to 12.8% for India and 20.2% for Kyrgyzstan. The low-income group of our dataset has a narrower range (2.1–5.3%), due to the small number of countries in this group (only four in 2025). The lower-middle-income group of countries would be required to make twice as much effort as high-income countries, and the upper-middle-income group would also be required to make more effort than high-income countries. This is clearly a regressive result, but not all hope is lost: as anticipated in the literature review on carbon pricing (Section 2), redistributive measures can be suggested by relying on the possibility of allocating part of the expected revenues in high-income countries for redistributive measures in lower-income countries.
Figure 6 shows the expected levels of the SCCPR to GDP ratio in years 2025, 2030, 2040 and 2050 for high-income countries in 2025. We apply a dynamic country grouping method based on the World Bank [57] classification and projections to 2050 of the gross national income (GNI) per capita. For example, while China’s 2021 GNI per capita falls in the upper-middle country group of the World Bank classification [57], in our projection to 2050 China enters in the high-income class of countries from the year 2025. More information on the assumptions related to our projections on income groupings and a figure summing up evolution in 2021–2050 for each of the 71 countries of the OECD dataset is provided in Appendix B.
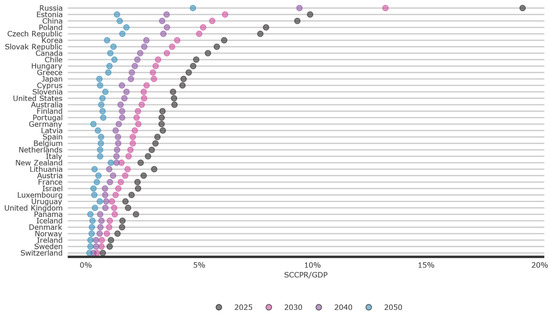
Figure 6.
Social cost of carbon pricing revenue incidence on GDP (SCCPR/GDP %) in years 2025, 2030, 2040, 2050, for high-income countries in 2025.
Looking at simulation results in the first year (2025), we find a small group of low-emission and high-income countries with a low SCCPR to GDP ratio (for example Switzerland 0.8%, and Sweden 1.1%), a larger group with percentages between about 2% and 8% (for example, the UK 1.9%, France 2.3%, Italy 2.7%, Germany 3.3%, USA 3.9%, Korea 6.1%, Poland 7.9%), and a minority of countries with higher percentages (Russia 19.2%, Estonia 9.9% and China 9.3%). In subsequent years, the SCC-based carbon pricing scenario produces its emission reduction effects, reducing both the revenue-to-GDP ratios and the intragroup extremes: Russia’s ratio slowly declines to 13.2% in 2030, 9.4% in 2040 and 4.7% in 2050; China declines much faster to 5.6% in 2030, 3.4% in 2040 and 1.5% in 2050; the USA reduces to 2.6% in 2030, 1.7% in 2040 and 0.7% in 2050. As expected, the major tax incidence of our extreme simulation (immediate and 100% implementation of the SCC benchmark) happens at the beginning, while it decreases in the following years, as the adoption of more expensive innovations, pushed by carbon pricing, erodes its tax base (CO2 emissions).
The literature on environmental tax reform (ETR) provides strong arguments for how carbon pricing could grow to very high levels without increasing the overall tax level and avoiding impacts on economic growth [77,78]. Many authors and institutional reports propose and discuss the ETR as a way to increase environmental taxes through the substitution of other taxation instruments that hit production factors, such as taxes on labor income or company profits [77,79,80,81]. ETR is therefore a tax shift rather than a tax increase, whereby taxation is shifted from “goods” such as labor or capital to “bads” (emissions, natural resource depletion) [79].
From this perspective, we explore limits to carbon pricing growth by looking also at the ratio between the environmental taxation revenues and total taxation revenues of a country (the lower the ratio, the greater the growth potential of carbon pricing in a framework of ETR). The most recent tax data at the international scale are those of the Environmental Related Tax Revenue Database—ERTR [82], which categorizes taxes based on their environmental relevance, constructing environmentally related tax revenue with a breakdown by tax-base category, including energy, transport, pollution, and resources: environmental tax to total tax revenue ratios for OECD countries in 2021 range from 2.0% (Canada) to 10.5% (Greece), with an OECD average of 4.6% (2.5% USA, 3.6% Japan and 5.0% Australia, to cite a few examples). The OECD report on environmental tax reforms prepared for the G7 [81] provides the same indicator also for a set of non-OECD countries. Country ratios on tax revenues for non-OECD countries (2014 data) reached the maximum value of 14% (Dominican Republic), with 13% for India and Turkey, 10% for Korea, 8% for South Africa, and 7% for China. Focusing on the EU countries, according to Eurostat [83] in the last decade and particularly after COVID-19, the trend of the environmental to total tax revenue ratio for the whole EU27 area is declining (from 6.23% of GDP in 2016 to 5.02% in 2022), with most EU members currently ranging between 3% and 9%, except for Greece (13.6%) and Bulgaria (15.3%). Overall, although worldwide data coverage is poor (particularly for developing countries) and some countries’ ratios currently deviate from the average, there appears to be scope for substantially increasing carbon prices in the context of environmental tax reforms based on the substitution of labor and capital income taxes.
A second challenge for the SCC-based benchmark is the regressivity of impacts across country income classes. We believe that this is also not an insurmountable problem, as governments can count on the abundant revenue stream generated by carbon pricing, which can be used to address both domestic and international inequality issues. As stated in Section 2 (literature review), a wide range of academic proposals on how to reduce possible income regressivity of carbon pricing and consequently pursue progressivity has been proposed and discussed in the recent literature. Boyce [37] and Budolfson et al. [38] demonstrate that a simple measure, such as equal per capita payments for all households financed with redistribution of carbon revenues (equal carbon dividends) can successfully address the distributional and political challenges of carbon pricing. Such a measure is even redundant, since progressive results of this redistribution measure can still be obtained by limiting reallocation of revenues to non-rich households.
In the international context, regressivity between high-income and lower-income countries can be relieved by the creation of an international cooperative fund to compensate impacts of an internationally uniform SCC-based carbon pricing, to be financed with the revenues of the high-income countries. To fully absorb distributional impacts in lower-income countries, the fund could redistribute part of collected carbon revenues in high-income countries in lower-income countries, starting from the low- and the lower-middle-income group. Redistribution is based on the amount of carbon taxes annually paid by the population of each country of the lower-income groups. These funds could be either transferred to states to finance an equal payment to the less well-off population (in principle, all populations can be covered as well) or they could be directly transferred as a “carbon dividends check” through a dedicated UN program, focused on poor rural areas or mountainous/cold areas.
Such a fund could be designed under the multilateral cooperative framework for climate finance established by UNFCCC [84]. The opportunity to use one of the existing multilateral funds, such as the Green Climate Fund, for this purpose should be explored with further research. Art. 6 of the Paris Agreement, which foresees voluntary bilateral or multilateral cooperative approaches between countries for carbon mitigation measures in the framework of their NDCs, could be used to enhance both market-based instruments (art. 6.2 and art. 6.4) and non-market initiatives to reduce emissions (art. 6.8–9). While the market-based instruments regulated by art. 6.2 and 6.4 are currently finding implementation (Glasgow rulebook for international compliance carbon markets [49]), the non-market initiatives of art. 6.8–9 have so far met with little interest from the States [3]), presumably due to their current generic nature. Indeed, international initiatives could be taken to develop a similar rulebook under Articles 6.8–9 to promote bilateral and multilateral agreements between high-income countries and lower-income countries to implement an SCC-based carbon pricing benchmark through national measures (NDCs). After the introduction of the Carbon Border Adjustment Mechanism (CBAM) by the EU [85], the range of carbon pricing measures that can be adopted by countries within their NDCs further enlarged. Bilateral or multilateral agreements between rich and poor countries can deal with energy and carbon taxes, emission trading schemes and CBAM as well. These cooperative agreements could adopt a common carbon pricing benchmark—the SCC one—to fix the carbon rates of their domestic instruments (or to establish the emission cap in ETS, with the ex-post mechanism described in the introduction). Under these agreements, high-income countries should also commit to directing a certain percentage of their revenues to the designated international fund for the redistribution of carbon dividends to the participating lower-income countries. The desired rulebook on voluntary agreements for an SCC-based benchmark should include a section dedicated to the benchmark development and its recognition by all parties. As part of (and to strengthen) our policy proposal, we suggest the following:
- An internationally agreed science-based procedure to estimate the SCC values to use as a benchmark (possibly under the Intergovernmental Panel on Climate Change—IPCC work program). As stated in Section 3, the institutional procedures and scientific protocols adopted by the IWG (and EPA) to select best values of the SCC represent a best practice to be transferred to the UNFCCC/IPCC framework.
- An international competent body (or a task force) responsible for calculating the SCC under the procedure.
Moreover, art. 9 of the Paris Agreement [2] on climate finance could be used by Governments as a reference to develop the rulebook for the international fund that could help low and middle-income countries to overcome distributional issues related to the voluntary and cooperative implementation of domestic carbon pricing measures aligned with the SCC benchmark. We quote the following relevant paragraphs of art. 9: “1. Developed country Parties shall provide financial resources to assist developing country Parties with respect to both mitigation and adaptation in continuation of their existing obligations under the Convention” [2] (comma 1 art. 9). “3. As part of a global effort, developed country Parties should continue to take the lead in mobilizing climate finance from a wide variety of sources, instruments and channels, noting the significant role of public funds, through a variety of actions, including supporting country-driven strategies, and taking into account the needs and priorities of developing country Parties. Such mobilization of climate finance should represent a progression beyond previous efforts” [2] (comma 3 art. 9).
For the aim of understanding the redistributive financial potential of our policy proposal, we can make some estimates related to a full compensation of the distributional impacts in lower-income countries that emerged in our stress test. We estimate that the high-income group revenue of a full implementation of the SCC-based benchmark in 2025 would be so large that the entire amount of the expenses incurred in the middle-income and low-income countries of the OECD database [26] can be compensated through the fund by recycling just a 29% share of the revenues collected in high-income countries. Figure 7 provides a more detailed overview of the financial needs of the fund by country groups in 2025: a total of USD(2021) 1312 billion (that is, 29% of the revenue collected in the 39 high-income countries in that year, including Russia and China) is needed to compensate the costs incurred in the other 32 middle- and low-income countries for paying a globally uniform SCC-based tax. The remaining 71% (USD(2021) 3179 billion of the expected revenues in the same year) can be used by high-income countries for domestic purposes. The USD(2021) 1312 billion collected in lower-income groups would be available for domestic purposes as well. Repeating this exercise in the years after 2025 up to 2050 produces a gradual increase of the percentages borne by the high-income group (10 percentage points in 25 years: 33% in 2030, 34% in 2040, 39% in 2050), due to the gradually lower share of projected CO2 emissions of the high-income group as compared to other groups.

Figure 7.
Yearly financial needs of the compensation fund for upper middle-, lower middle- and low-income countries of the dataset. Years 2025, 2030, 2040 and 2050 (USD(2021) billion).
Obviously, this exercise is not representative for all the world’s countries, since the excluded countries (by the OECD dataset) represent 12% of global CO2 emissions and 9% of world GDP in 2021. With the available data sources, we cannot make reliable country-level projections on carbon pricing revenues for the remaining countries. Given that many countries excluded belong to all income classes and not only to the middle- and low-income classes (for example, Saudi Arabia, Qatar, and Kuwait are high-income countries not covered by the dataset), we believe that these results would not change much.
7. Conclusions and Policy Implications
In this article, we have proposed a global benchmark for countries’ carbon pricing in the 2021–2050 timeframe, built on an updated estimate of the social cost of carbon (SCC) obtained from the most recent literature. The main motivation of an SCC-based benchmark is to establish an internationally recognized and science-based signal that could drive countries’ carbon pricing policies up to the point that it fully internalizes the external costs of CO2 emissions. This would trigger technology innovation and investments for deep emissions reductions within a framework of fair environmental competition in international trade, avoiding free riding and waste of carbon emissions (carbon leakage).
We have found in the work by Azar et al. [52] the SCC reference values to suggest a global SCC benchmark for an effective carbon taxation. Their SCC pathway has a linear trend that increases yearly at constant prices from 227 USD(2021)/t CO2 in 2021 to 392 USD(2021)/t CO2 in 2050. These values represent an updated assessment of the SCC, based on one of the most commonly used integrated assessment models of climate damage (DICE), the results of which are in line with those of the recent US-EPA’s report [22]. The proposed benchmark is also policy effective, since the SCC values were originally calculated by Azar et al. [52] within a broader model that demonstrates that the optimal emission reduction path achievable with an SCC-based carbon taxation is in line with the Paris Agreement temperature mitigation goal. Using the OECD dataset on net effective carbon rates [26], which covers energy taxes, carbon taxes, emission permits and direct fossil fuel subsidies at the country level, we have then analyzed the current situation of 71 countries (38 OEDC and 33 non-OECD) to understand where they stand as compared to the SCC benchmark, finding that the average internalization of the SCC 2021 value for the whole set of countries is 11.6% (22.7% in the high-income group). This comparison highlights a serious gap (and delay) in current climate policies, which are far from creating optimal pricing conditions to invert (in the short term) the historical increase in global CO2 emissions and then to achieve (in a longer term) the deep cuts compatible with the Paris Agreement temperature goal.
Finally, we have discussed two major challenges to implementing the SCC-based benchmark on a global scale: countries’ economic capacity to afford high carbon pricing levels and the possibility of managing the distributional issues related to the implementation of the proposed benchmark within the Paris Agreement rules. To improve the policy proposal, the discussion purposely hypothesized an extreme scenario of immediate (from 2025) and globally uniform implementation of a tax based on the SCC covering all CO2 emissions related to fossil fuels until 2050. Even though the SCC benchmark is increasing over the years in 2025–2050, we found that the strongest economic impacts would occur in the early years rather than later, thanks to the expected emissions cuts (progressive reduction of the tax base) and to the economic growth expected in most of the world. In our test, we obtained revenue to GDP ratios for 2025 below 10% for 63 out of 70 countries (except for Russia, the remaining cases belong to upper-middle- and lower-middle-income groups). High carbon pricing ratios do not necessarily mean that the benchmark is not feasible. The literature on environmental tax reform provides arguments and suggestions for how the carbon price could raise to very high levels without increasing the overall tax burden. Our recommendation is that the benchmark be implemented by states through a broader national tax reform that simultaneously includes reductions in tax rates on labor and capital income.
Regarding distributional impacts, our test shows that the outcome for middle-income countries would be regressive (upper-middle- and lower-middle- countries have a higher revenue to GDP ratio than high-income countries). But the test also says that an abundant revenue stream will be generated by carbon pricing (USD(2021) 5.8 trillion in 2025 according to our simulation on the set of 71 countries, 4.5 trillion of which is in high-income countries): to manage distributional impacts at the national and international level, governments will be able to use these additional funds.
As an integral part of our policy proposal, we suggest the creation of an international cooperative fund to compensate impacts of an internationally uniform implementation of the SCC-based benchmark, to be totally financed with revenues from the high-income countries. To fully absorb distributional impacts in lower-income countries, the fund could redistribute part of carbon revenues collected in high-income countries to lower-income countries, starting from the low- and the lower-middle-income ones. Literature on distributional impacts suggests that a simple allocation criterion, such as an equal carbon payment for all populations, or income-differentiated payments to the less well-off population, could be effective to reach income progressivity. The United Nations Environmental Program (UNEP) could develop more detailed compensation programs to ensure equitable access to energy sources for families living in rural areas, commuters and those living in cold geographic areas.
How can the uniform benchmark and the international fund act concretely to prevent disparities, within the framework of the Paris Agreement? In Section 6, we described how the fund could be integrated within the Paris Agreement rules, mainly focusing on art. 6.8–9 concerning so-called “non-market” cooperative approaches between states to reduce emissions. New political initiatives are needed in the next COPs to develop a dedicated rulebook on the SCC benchmark under these articles, similar to the Glasgow COP 26 rulebook on art. 6.2 and 6.4. The new rulebook should promote bilateral and multilateral agreements between high-income countries and lower-income countries to implement an SCC-based carbon pricing benchmark through national measures (NDCs). Under these agreements, high-income countries should also commit to directing a certain percentage of their carbon pricing revenues to the designated international fund for the redistribution of carbon dividends to the participating lower-income countries. The international SCC benchmark would provide a common reference for bilateral and multilateral agreements between countries on the uniform carbon rates to be achieved. To strengthen the authority of the benchmark, we also propose that the new rulebook under art. 6.8–9 defines an internationally agreed scientific procedure to estimate the SCC benchmark and establishes an international competent body (or a task force) responsible for calculating the SCC within the procedure. How to find a method for scientific consensus on these issues can find a concrete example in the United States’ experience of the Interagency Working Group on the estimation and update of the social cost of greenhouse gases [17,22,63]. At the international scale, the IPCC is the designated authority on climate science including projected climate damage and SCC estimation, but governments can play a role in boosting research and activating international cooperation to develop scientific knowledge in this direction. Moreover, a science-based benchmark must be periodically updated to reflect the state of the art on modelling, scenarios and disciplines involved in SCC estimation. If we look at periods between the IPCC’s assessment reports, they amount to 5–9 years (publication years of the Summary for policy-makers: 1990, 1995, 2001, 2007, 2014, 2023). To allow the examination of previous IPCC reports, the SCC benchmark update deadlines could be planned within 2 years of the last published IPCC report.
We expect that the proposed mechanism could be mutually attractive for both developed and developing countries. Developed countries would benefit from a rational and science-based approach to establishing a level playing field both internally and in bilateral trade, preventing the global relocation of production processes due to carbon pricing asymmetries. A uniform benchmark for all world countries that internalizes the external costs of CO2 emissions would re-establish fair environmental competition in international trade, avoiding free riders and carbon leakage. Developing countries would benefit from the mechanism with a doubled flow of revenues: (a) that of revenues collected by domestic carbon pricing measures cooperatively agreed with high-income partners, and (b) the redistributive transfer of carbon dividends to households, managed by the international fund. Developing countries would see increased revenues from carbon pricing, with which they could finance more ambitious NDCs, and at the same time benefit from full compensation of distributional impacts.
Obviously, our analysis has many boundaries and limits. We did not use an original integrated assessment model to develop and assess our proposal of an SCC-based benchmark (we only organized available knowledge from different sources in a consistent framework). This has consequences on the limited potential of our method to analyze the environmental and macro-economic effects of a partial or/and gradual implementation of the suggested benchmark (for example, we rely on the global emission reductions obtained by Azar et al. [52] in their optimized SCC scenario). We hope to develop our own original model, but other authors who have already experimented with integrated climate-economy models can continue their research on the SCC and on the effectiveness of carbon pricing tools in reducing emissions. We underline the importance of addressing the issue of full climate damage coverage in the integrated climate economy modelling used for SCC estimation, by assessing all main impact pathways, including impacts on ecosystem services and tipping points [17].
Moreover, our projections in 2050 do not cover all the world’s countries but just the 71 countries of the OECD database. The excluded countries currently represent 12% of global CO2 emissions and 9% of world GDP in 2021. With the available data sources, we could not make reliable country-level projections on effective carbon pricing revenues for the remaining world countries. Comprehensive and consistent statistics on energy, emissions, GDP and tax revenues are an important area of research to enable more reliable long-term projections worldwide.
Another area of research is a full institutional viability of our proposal. In this article, we developed a preliminary assessment to integrate our proposal in the current framework of the Paris Agreement. For example, further research is needed to analyze existing UNFCC funds, before establishing a new one. Coordination between the different forms of support provided in international environmental cooperation and the model suggested here, based on redistributive transfers, should be also explored.
Continuation of research is needed to improve the understanding of how countries should cooperate to implement an international benchmark for carbon pricing which reflects the scientific knowledge on climate risks. A first step is taken with this article.
Author Contributions
Conceptualization, A.M.; methodology, A.M and G.M.; software and data curation, G.M.; writing and validation, A.M. All authors have read and agreed to the published version of the manuscript.
Funding
This work has been financed by the Research Fund for the Italian Electrical System under the Three-Year Research Plan 2022–2024 (DM MITE n. 337, 15.09.2022), in compliance with the Decree of 16 April 2018.
Institutional Review Board Statement
Not applicable.
Informed Consent Statement
Not applicable.
Data Availability Statement
Research data are available from the authors on request.
Acknowledgments
An abstract of a previous version of the paper has been accepted (1 June 2023) and then discussed (7 September 2023) at the 24th Global Conference on Environmental Taxation, Université Paris Dauphine, Paris, 6–8 September 2023. Authors thank all the reviewers for their precious comments and questions.
Conflicts of Interest
The authors declare no conflicts of interest.
Appendix A. CO2 Emissions and GDP Projections
A.1. CO2 Emissions Projections at 2050
The starting points to define the expected trajectory of CO2 emissions until 2050 for each country considered in this work are actual CO2 emissions data in 2021 (most recent values) from the OECD ECP database and global emission projections until 2050 in the SCC-based taxation scenario. According to Azar et al. [52], the optimal SCC-based emission reduction path decreases global emissions by half by 2030 (from 40 to 20 Gt CO2) and keeps decreasing (although at a slower pace) in subsequent years to reach 12 Gt by 2050. Since the trajectory of CO2 emissions by 2050 is provided by Azar et al. [52] as a global total, to obtain country-differentiated trajectories for each of the 71 countries of the OECD sample, we used the country-level modelled domestic emissions pathways by 2050 elaborated by Climate Action Tracker [58] under a scenario that is compatible with the 1.5 °C temperature goal of the Paris Agreement. The Climate Action Tracker [58] covers a major part of the OECD sample of countries. Country level CO2 emission projections at 2050 compatible with 1.5 °C are available to download at https://climateactiontracker.org/countries/, (accessed on 20 July 2023). For countries not covered, the projected emissions reduction 2021–2050 coefficient of a country in the same income per capita class and in the same geographical area is applied. For example, Madagascar (low income) is given 0.70 at 2050 (of 2021 emissions), that is the same coefficient of Ethiopia (low income). In the high-income class, Iceland is given 0.13, that is the same coefficient as Norway (high income). Moreover, we assumed a differentiated path between groups of countries in the first period (2021–2030): high-income and upper middle-income countries of the OECD database (71 countries) decrease emissions by 50% by 2030 and then decrease further with a linear trend to their 2050 Paris Agreement compatible level, while lower-middle-income and low-income countries are allowed to decrease with a slower linear trend from 2021 to 2050. For example, with these assumptions, a fast-growing country such as Nigeria (that currently is in the lower-middle-income class) with the SCC-based taxation scheme would reduce emissions by 14% in 2030 as compared to 2021. With this differentiation, the projected emissions for all 71 countries follow an emission reduction path that traces that obtained by Azar et al. [52] for global emissions, and precisely CO2 emissions are reduced by 47% by 2030 as compared to 2021 and by 84% by 2050.
Figure A1 shows the resulting emission projections we assumed as the potential base of the SCC tax.
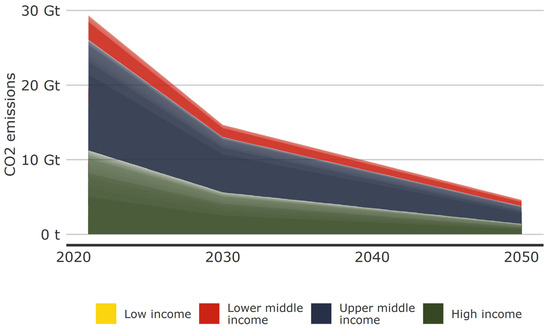
Figure A1.
CO2 emissions 2021–2050 (71 OECD and non-OECD countries).
Figure A1.
CO2 emissions 2021–2050 (71 OECD and non-OECD countries).

A.2. GDP Projections at 2050
The OECD [59] provides long-term real GDP projections for a subgroup of 41 countries (mostly OECD and some non-OECD) of our set of 71 countries, expressed in USD and 2015 purchasing power parities (ppp). To obtain real GDP projections (without ppp) for the 2022–2050 period, the growth index of this indicator in the 2022–2050 period (base 2021) is multiplied by the 2021 GDP figures (without ppp) from the World Bank [56]. Since the World Bank GDP indicator is expressed at constant 2015 USD, it is converted to constant 2021 USD using the US GDP deflator. Results obtained for this subgroup of countries starting from 2021 (reference year for this article’s analysis) to 2050 are shown in Table A1.
Table A1.
Real GDP long-term projections for OECD and some non-OECD countries in years 2025, 2030, 2040 and 2050 (USD(2021) billion). Source: Authors’ elaboration from OECD [59] and World Bank [56].
Table A1.
Real GDP long-term projections for OECD and some non-OECD countries in years 2025, 2030, 2040 and 2050 (USD(2021) billion). Source: Authors’ elaboration from OECD [59] and World Bank [56].
| Country | 2021 | 2025 | 2030 | 2040 | 2050 |
|---|---|---|---|---|---|
| Argentina | 645 | 767 | 866 | 1045 | 1221 |
| Australia | 1731 | 1956 | 2222 | 2811 | 3471 |
| Austria | 460 | 504 | 531 | 592 | 655 |
| Belgium | 566 | 609 | 647 | 723 | 800 |
| Brazil | 2099 | 2345 | 2608 | 3117 | 3586 |
| Canada | 1920 | 2103 | 2270 | 2609 | 2965 |
| Chile | 312 | 351 | 384 | 438 | 478 |
| China | 18,002 | 21,186 | 25,396 | 32,490 | 37,613 |
| Czech Republic | 240 | 268 | 295 | 333 | 363 |
| Denmark | 362 | 393 | 437 | 538 | 664 |
| Estonia | 35 | 39 | 45 | 60 | 79 |
| Finland | 260 | 271 | 285 | 316 | 351 |
| France | 2572 | 2690 | 2846 | 3186 | 3566 |
| Germany | 4037 | 4265 | 4407 | 4743 | 5175 |
| Greece | 229 | 264 | 290 | 326 | 343 |
| Hungary | 171 | 197 | 217 | 239 | 254 |
| Iceland | 23 | 26 | 29 | 34 | 39 |
| India | 3136 | 4196 | 5596 | 8453 | 11,244 |
| Indonesia | 1210 | 1550 | 1944 | 2749 | 3606 |
| Ireland | 509 | 621 | 700 | 843 | 959 |
| Israel | 434 | 502 | 578 | 755 | 968 |
| Italy | 2121 | 2276 | 2370 | 2552 | 2805 |
| Japan | 5068 | 5246 | 5394 | 5658 | 5804 |
| Korea | 1923 | 2133 | 2313 | 2478 | 2490 |
| Luxembourg | 78 | 86 | 95 | 112 | 131 |
| Mexico | 1371 | 1600 | 1830 | 2282 | 2751 |
| Netherlands | 962 | 1056 | 1118 | 1231 | 1382 |
| New Zealand | 241 | 265 | 292 | 346 | 408 |
| Norway | 478 | 513 | 553 | 641 | 744 |
| Poland | 679 | 771 | 848 | 947 | 972 |
| Portugal | 244 | 281 | 301 | 325 | 347 |
| Russia | 1707 | 1739 | 1816 | 1984 | 2095 |
| Slovak Republic | 115 | 123 | 134 | 152 | 165 |
| Slovenia | 59 | 69 | 74 | 82 | 87 |
| South Africa | 401 | 471 | 553 | 737 | 950 |
| Spain | 1407 | 1581 | 1725 | 1944 | 2100 |
| Sweden | 644 | 703 | 767 | 894 | 1030 |
| Switzerland | 863 | 925 | 997 | 1153 | 1338 |
| Türkiye | 1285 | 1584 | 1909 | 2496 | 3101 |
| United Kingdom | 3451 | 3780 | 4034 | 4543 | 5079 |
| United States | 23,315 | 25,025 | 27,107 | 31,303 | 35,827 |
For the remaining countries of our dataset for which the OECD does not provide long-term GDP projections (30 countries), an alternative methodology is used: the average annual GDP growth rate of the 2013–2022 period is used to project real GDP from 2022 (the latest available data) up to 2050. GDP figures, originally in 2015 USD are converted to 2021 USD using the GDP deflator of the United States. Average GDP growth rates, real GDP and the US GDP deflator are from the World Bank databank (86). Results are shown in Table A2.
Table A2.
GDP projections for those countries for which the OECD does not provide official figures (USD(2021) billion). Source: Authors’ elaboration from World Bank [86].
Table A2.
GDP projections for those countries for which the OECD does not provide official figures (USD(2021) billion). Source: Authors’ elaboration from World Bank [86].
| Country | 2021 | 2025 | 2030 | 2040 | 2050 |
|---|---|---|---|---|---|
| Bangladesh | 404 | 520 | 712 | 1337 | 2509 |
| Burkina Faso | 17 | 20 | 26 | 42 | 67 |
| Colombia | 311 | 354 | 417 | 577 | 799 |
| Costa Rica | 62 | 70 | 82 | 111 | 150 |
| Côte d’Ivoire | 61 | 80 | 111 | 217 | 421 |
| Cyprus | 26 | 29 | 33 | 43 | 55 |
| Dominican Republic | 101 | 124 | 160 | 267 | 446 |
| Ecuador | 106 | 111 | 117 | 130 | 145 |
| Egypt | 427 | 505 | 621 | 939 | 1422 |
| Ethiopia | 109 | 150 | 223 | 493 | 1089 |
| Ghana | 65 | 78 | 97 | 152 | 237 |
| Guatemala | 86 | 99 | 118 | 167 | 237 |
| Jamaica | 16 | 16 | 17 | 18 | 19 |
| Kenya | 101 | 121 | 150 | 233 | 361 |
| Kyrgyzstan | 10 | 12 | 14 | 21 | 32 |
| Latvia | 38 | 41 | 46 | 59 | 74 |
| Lithuania | 64 | 72 | 85 | 117 | 160 |
| Madagascar | 14 | 15 | 17 | 22 | 29 |
| Malaysia | 365 | 429 | 526 | 790 | 1188 |
| Morocco | 122 | 135 | 152 | 194 | 247 |
| Nigeria | 436 | 479 | 540 | 684 | 868 |
| Panama | 68 | 81 | 101 | 156 | 240 |
| Paraguay | 38 | 43 | 50 | 68 | 93 |
| Peru | 220 | 247 | 286 | 382 | 510 |
| Philippines | 360 | 437 | 557 | 905 | 1471 |
| Rwanda | 12 | 15 | 20 | 38 | 69 |
| Sri Lanka | 68 | 74 | 81 | 98 | 119 |
| Uganda | 41 | 49 | 61 | 95 | 149 |
| Ukraine | 156 | 134 | 110 | 75 | 51 |
| Uruguay | 65 | 70 | 76 | 89 | 105 |
Appendix B. Country Classification by Income
In this section, we explain how we elaborated the dynamic classification of countries by income per capita from 2021 to 2050. Every year, the World Bank classifies countries in four categories (low-, lower-middle-, upper-middle-, and high-income) based on gross national income (GNI) per capita expressed in current USD [57]). Clearly, each country’s classification can change year-on-year depending on several socio-economic variables such as economic growth, inflation, and population growth. Classifying countries based on their GNI per capita in every year up to 2050 is possible if GNI per capita forecasts are available. Such forecasts are made using a simple approach, similar to that used to forecast real GDP:
- calculation of the average GNI growth rate of the 2013–2022 period for every country;
- average GNI growth rates are used to project GNI up to 2050 for all countries;
- conversion of GNI projected values in 2021 constant USD (using the GDP deflator of the United States);
- calculation of GNI per capita dividing GNI forecasts by the official population projections by the Food and Agriculture Organization of the United Nations [62].
Historical GNI growth and GNI figures are from the World Bank databank [86]. Since the World Bank does not provide GNI growth rates for Australia, Iceland, Panama, and Turkey, for these countries the average GDP growth rate is used instead [60]. Figure A2 shows the evolution of each country’s classification by income per capita from 2021 to 2050, which is used in Section 6 for elaborations on the SCC-based carbon pricing incidence across country income groups.
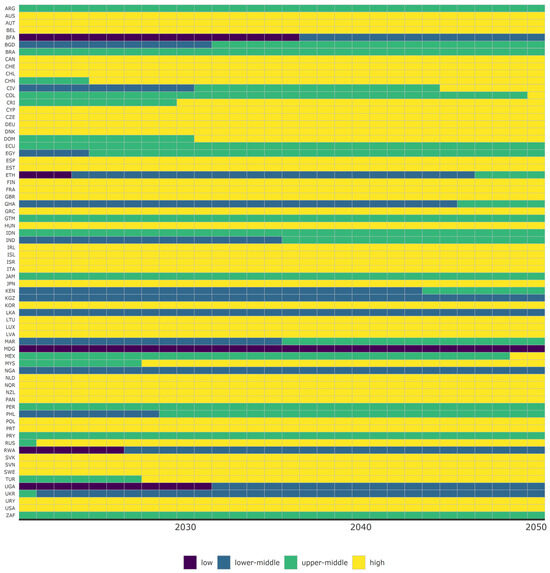
Figure A2.
Country classification on the basis of GNI per capita (World Bank method), source: authors’ elaboration from World Bank [57,86].
Figure A2.
Country classification on the basis of GNI per capita (World Bank method), source: authors’ elaboration from World Bank [57,86].
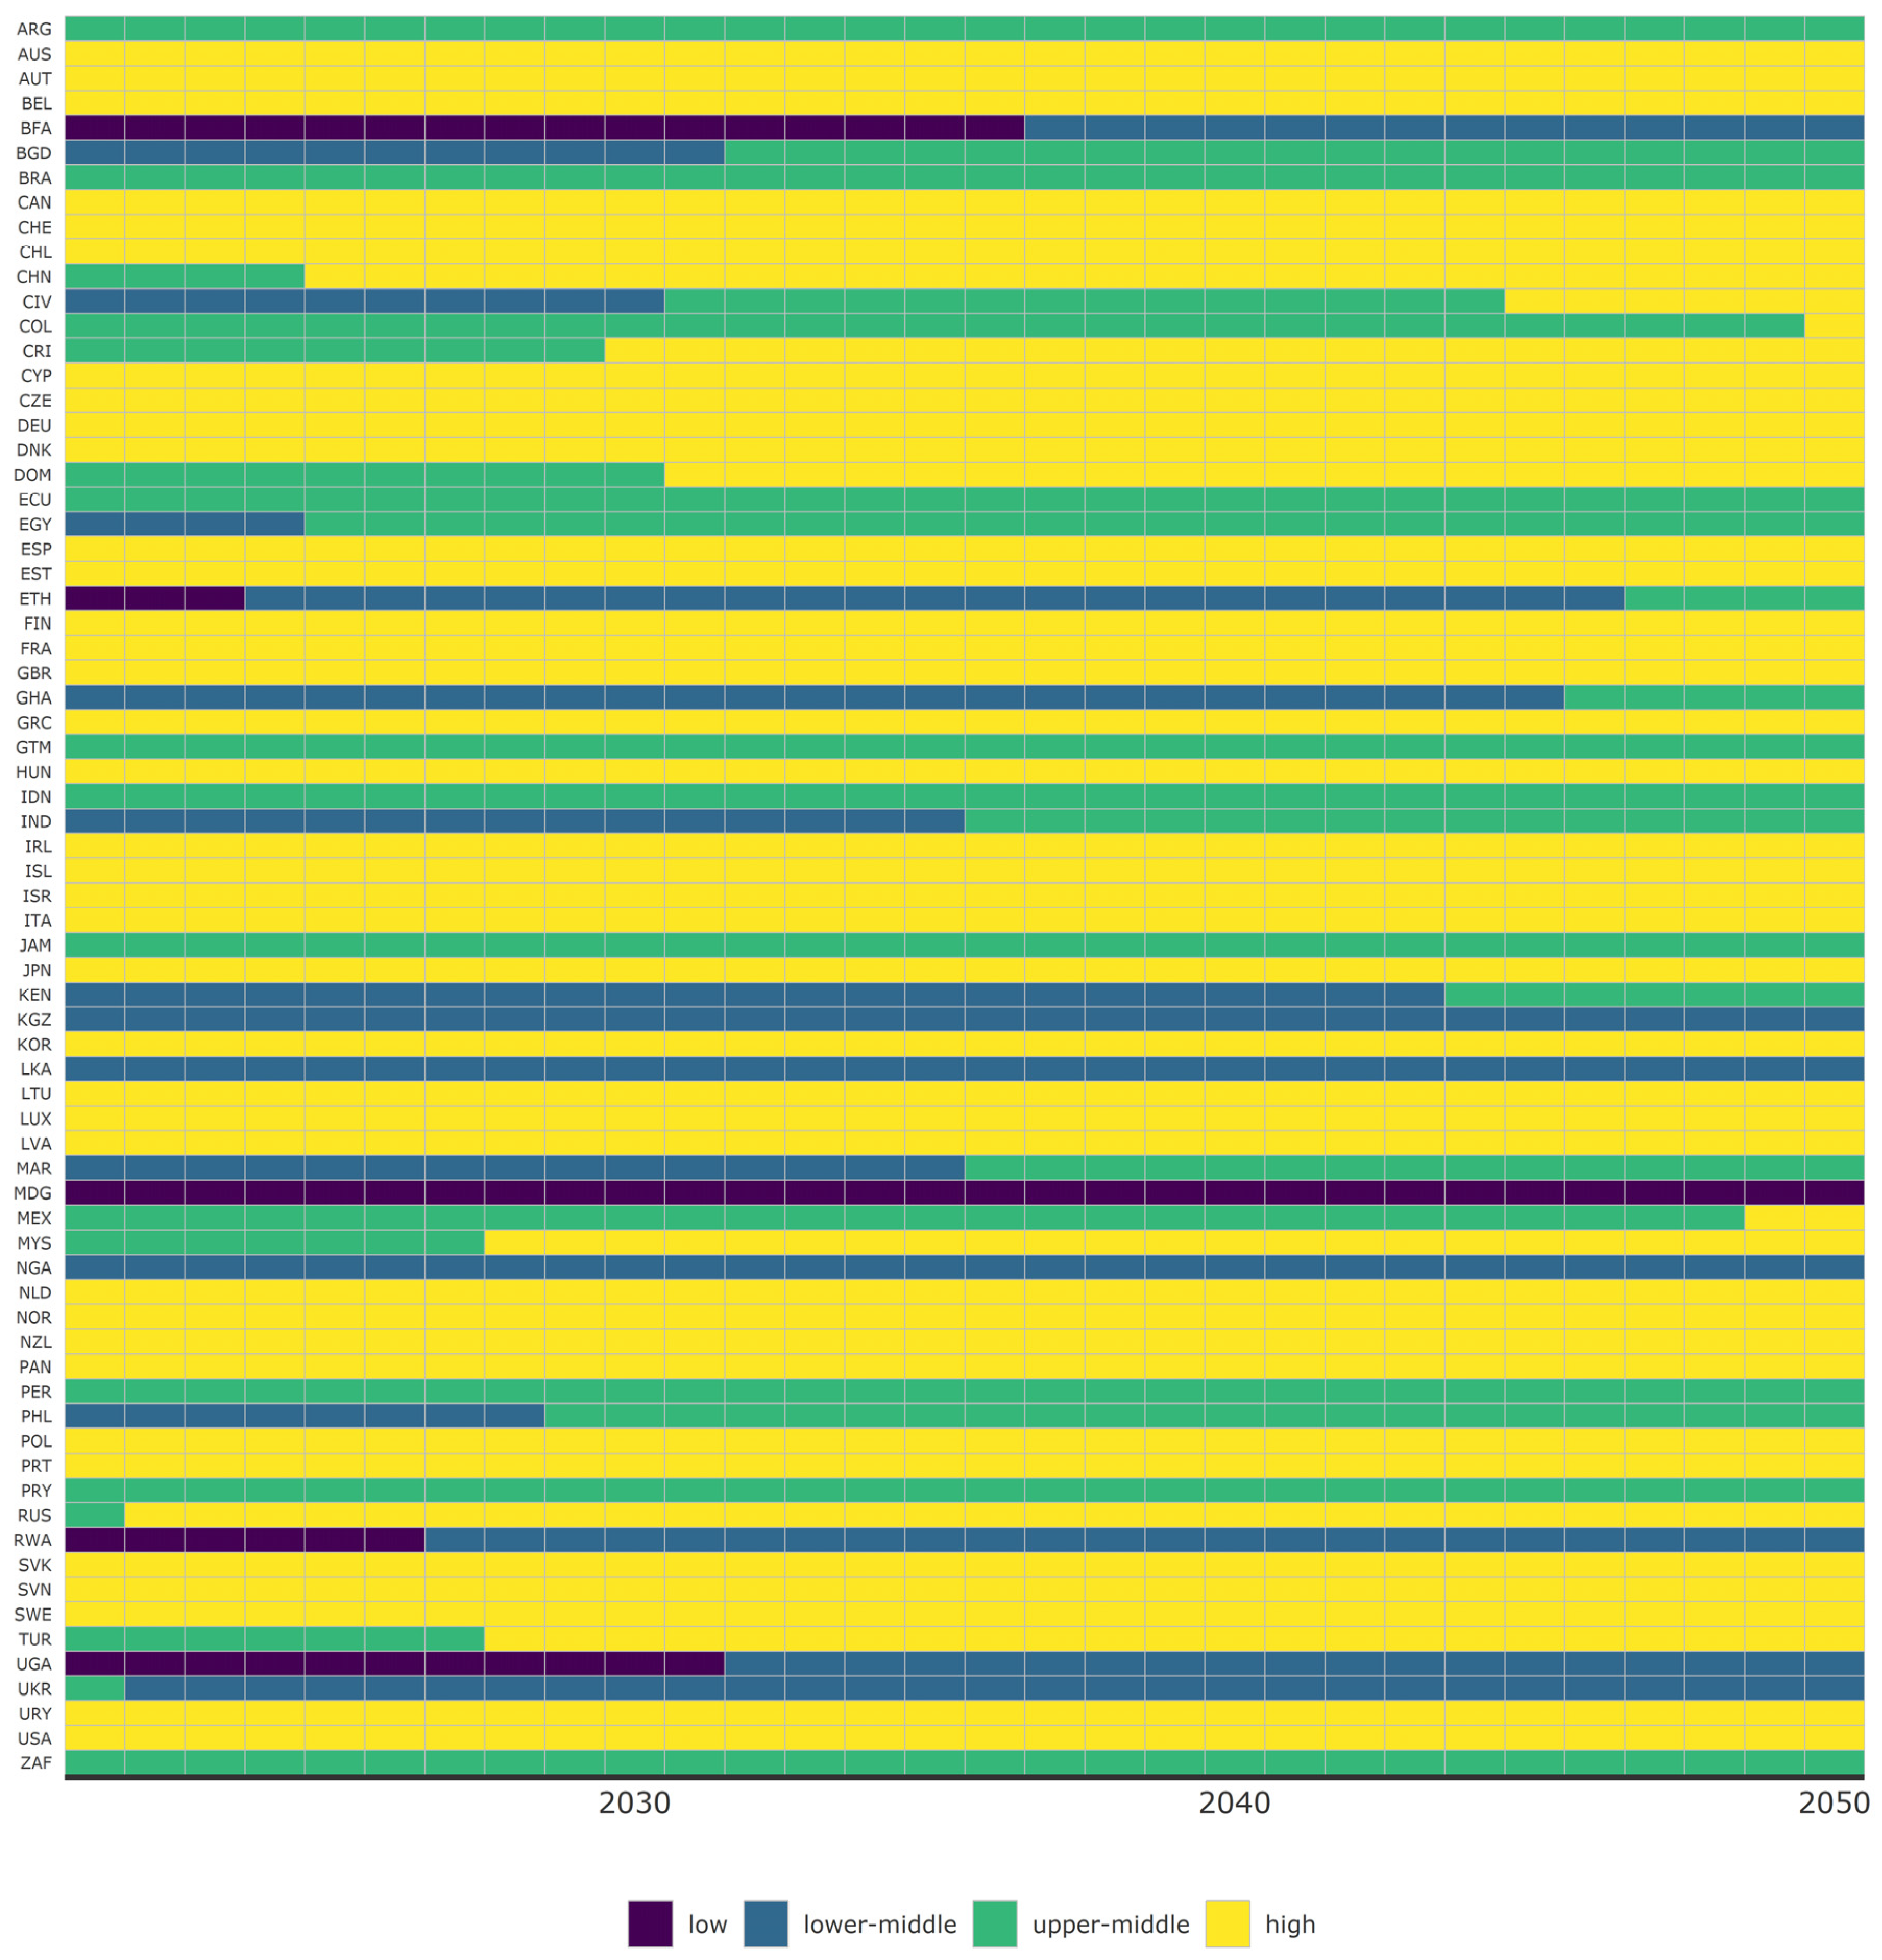
References
- World Bank. State and Trends of Carbon Pricing 2024; World Bank©: Washington, DC, USA, 2024; Available online: http://hdl.handle.net/10986/41544 (accessed on 15 September 2024).
- UNFCCC-COP 21. The Paris Agreement. Authentic Text, English Version. 2015. Available online: https://unfccc.int/sites/default/files/english_paris_agreement.pdf (accessed on 20 March 2024).
- UNDP. Support Guide for UNDP Article 6.2 Training Course, UNDP, New York. 2022. Available online: https://www.learningfornature.org/wp-content/uploads/2020/07/Support_Guide_UNDP_UNFCCC_23.01.2023-compressed.pdf (accessed on 25 October 2023).
- European Commission; Directorate-General for Mobility and Transport; Essen, H.; Fiorello, D.; El Beyrouty, K.; Bieler, C.; Vijngaarden, L.; Schroten, A.; Parolin, R.; Brambilla, M.; et al. Handbook on the External Costs of Transport—Version 2019—1.1; Publications Office of the European Union: Luxembourg, 2020; Available online: https://data.europa.eu/doi/10.2832/51388 (accessed on 10 February 2024).
- Baumol, W.J.; Oates, W.E. The Theory of Environmental Policy, 2nd ed.; Cambridge University Press: Cambridge, UK, 1988. [Google Scholar] [CrossRef]
- Sterner, T.; Coria, J. Policy Instruments for Environmental and Natural Resource Management; Routledge RFF Press: New York, NY, USA, 2011. [Google Scholar] [CrossRef]
- Nordhaus, W. Estimates of the Social Cost of Carbon: Concepts and Results from the DICE-2013R Model and Alternative Approaches. J. Assoc. Environ. Resour. Econ. 2014, 1, 273–312. [Google Scholar] [CrossRef]
- Majocchi, A. Foreword: Taxation and green growth—The role of carbon pricing. In Taxation and the Green Growth Challenge; Comelli, A., Milne, J.E., Andersen, M.S., Ashiabor, H., Eds.; Critical Issues in Environmental Taxation Series Vol. XXV; Edward Elgar Publishing: Cheltenham, UK, 2023; Available online: https://www.elgaronline.com/edcollchap/book/9781035317844/front-8.xml (accessed on 3 October 2023).
- OECD. Effective Carbon Rates 2021: Pricing Carbon Emissions through Taxes and Emissions Trading; OECD Series on Carbon Pricing and Energy Taxation; OECD Publishing: Paris, France, 2021. [Google Scholar] [CrossRef]
- Agnolucci, P.; Fischer, C.; Heine, D.; Montes de Oca Leon, M.; Pryor, J.; Patroni, K.; Hallegatte, S. Measuring Total Carbon Pricing. World Bank Res. Obs. 2024, 39, 227–258. [Google Scholar] [CrossRef]
- Baranzini, A.; van den Bergh, J.C.J.M.; Carattini, S.; Howarth, R.B.; Padilla, E.; Roca, J. Carbon pricing in climate policy: Seven reasons, complementary instruments, and political economy considerations. WIREs Clim. Chang. 2017, 8, e462. [Google Scholar] [CrossRef]
- Sterner, T.; Ewald, J.; Sterner, E. Economists and the climate. J. Behav. Exp. Econ. 2024, 109, 102158. [Google Scholar] [CrossRef]
- High Level Commission on Carbon Prices, Chairs Stiglitz J.E., Stern N. “Report of the High Level Commission on Carbon Prices”. Carbon Pricing Leadership Coalition. 2017. Available online: https://www.carbonpricingleadership.org/report-of-the-highlevel-commission-on-carbon-prices (accessed on 14 July 2024).
- IWG. Technical Support Document: Technical Update of the Social Cost of Carbon for Regulatory Impact Analysis Under Executive Order 12866. White House. 2016. Available online: https://www.epa.gov/sites/default/files/2016-12/documents/sc_co2_tsd_august_2016.pdf (accessed on 25 October 2023).
- Nordhaus, W.D. Revisiting the Social Cost of Carbon. Proc. Natl. Acad. Sci. USA 2017, 114, 1518–1523. [Google Scholar] [CrossRef] [PubMed]
- Kaufman, N.; Barron, A.R.; Krawczyk, W.; Marsters, P.; McJeon, H. A near-term to net zero alternative to the social cost of carbon for setting carbon prices. Nat. Clim. Chang. 2020, 10, 1010–1014. [Google Scholar] [CrossRef]
- Molocchi, A. Valuing the Social Cost of Carbon: Do economists really care about climate change? Econ. Policy Energy Environ. 2023, 2, 41–76. [Google Scholar] [CrossRef]
- Aldy, J.E.; Kotchen, M.J.; Stavins, R.N.; Stock, J.H. Keep climate policy focused on the social cost of carbon. Science 2021, 373, 850–852. [Google Scholar] [CrossRef]
- IWG. Technical Support Document: Social Cost of Carbon for Regulatory Impact Analysis Under Executive Order 12866. White House. 2010. Available online: https://www.epa.gov/sites/default/files/2016-12/documents/scc_tsd_2010.pdf (accessed on 25 October 2023).
- IWG. Technical Support Document: Technical Update of the Social Cost of Carbon for Regulatory Impact Analysis. Revised nov 2013. White House. 2013. Available online: https://obamawhitehouse.archives.gov/sites/default/files/omb/assets/inforeg/technical-update-social-cost-of-carbon-for-regulator-impact-analysis.pdf (accessed on 25 October 2023).
- IWG. Technical Support Document: Social Cost of Carbon, Methane, and Nitrous Oxide Interim Estimates under Executive Order 13990. White House. 2021. Available online: https://www.whitehouse.gov/wp-content/uploads/2021/02/TechnicalSupportDocument_SocialCostofCarbonMethaneNitrousOxide.pdf (accessed on 18 June 2023).
- EPA. “EPA Report on the Social Cost of Greenhouse Gases: Estimates Incorporating Recent Scientific Advances”. EPA, Docket ID No. EPA-HQ-OAR-2021-0317. November 2023. U.S. Environmental Protection Agency, Washington, DC 20460. Available online: https://www.epa.gov/system/files/documents/2023-12/epa_scghg_2023_report_final.pdf (accessed on 18 June 2024).
- IPCC-WG2. Estimating Global Economic Impacts from Climate Change—Cross working group box economics (chapter 16, 2495-2499). In Climate Change 2022: Impacts, Adaptation and Vulnerability. Working Group II Contribution to the Sixth Assessment Report of the IPCC; Rose, S., Diaz, D., Carleton, D., Drouet, L., Guivarch, C., Méjean, A., Eds.; Cambridge University Press: Cambridge, UK; New York, NY, USA, 2022; p. 3056. [Google Scholar] [CrossRef]
- Tol, R.S.J. Estimates of the social cost of carbon have increased over time. arXiv 2021, arXiv:2105.03656. [Google Scholar] [CrossRef]
- IPCC. Global Warming of 1.5 °C; Cambridge University Press: Cambridge, UK; New York, NY, USA, 2018; p. 616. Available online: https://www.ipcc.ch/sr15/ (accessed on 27 July 2023).
- OECD. Environmental policy: Effective carbon rates (Edition 2021). OECD Environ. Stat. (Database) 2022. [CrossRef]
- Bergh, J.C.J.M.v.D.; Angelsen, A.; Baranzini, A.; Botzen, W.J.W.; Carattini, S.; Drews, S.; Dunlop, T.; Galbraith, E.; Gsottbauer, E.; Howarth, R.B.; et al. A dual-track transition to global carbon pricing. Clim. Policy 2020, 20, 1057–1069. [Google Scholar] [CrossRef]
- Parry, I.; Black, S.; Roaf, J. Proposal for an International Carbon Price Floor among Large Emitters; IMF Staff Climate Notes 2021/001; International Monetary Fund: Washington, DC, USA, 2021. [Google Scholar]
- OECD. Pricing Greenhouse Gas Emissions: Turning Climate Targets into Climate Action; OECD Series on Carbon Pricing and Energy Taxation; OECD Publishing: Paris, France, 2022. [Google Scholar] [CrossRef]
- OECD. OECD Inventory of Support Measures for Fossil Fuels. 2022. Available online: https://www.oecd-ilibrary.org/agriculture-and-food/data/fossil-fuel-support_d86aea00-en (accessed on 15 July 2023).
- Quinet Commission. The Value for Climate Action. A Shadow Price for Carbon for Evaluation of Investments and Public Policies. France Strategie. 2019. Available online: https://www.strategie.gouv.fr/sites/strategie.gouv.fr/files/atoms/files/fs-the-value-for-climate-action-final-web.pdf (accessed on 15 July 2023).
- Carattini, S.; Baranzini, A.; Thalmann, P.; Varone, F.; Vöhringer, F. Green Taxes in a Post-Paris World: Are Millions of Nays Inevitable? Environ. Resour. Econ. 2017, 68, 97–128. [Google Scholar] [CrossRef]
- Klenert, D.; Mattauch, L.; Combet, E.; Edenhofer, O.; Hepburn, C.; Rafaty, R.; Stern, N. Making carbon pricing work for citizens. Nat. Clim. Chang. 2018, 8, 669–677. [Google Scholar] [CrossRef]
- Chancel, L. Global Carbon Inequality Over 1990–2019. Nat. Sustain. 2022, 5, 931–938. [Google Scholar] [CrossRef]
- Dorband, I.I.; Jakob, M.; Kalkuhl, M.; Steckel, J.C. Poverty and distributional effects of carbon pricing in low- and middle-income countries—A global comparative analysis. World Dev. 2018, 115, 246–257, ISSN 0305-750X. [Google Scholar] [CrossRef]
- Merkle, M.; Dolphin, G. Distributional Impacts of Heterogenous Carbon Prices in the EU. In IMF Working Papers, WP/24/149; International Monetary Fund: Washington, DC, USA, 2024. [Google Scholar] [CrossRef]
- Boyce, J.K. Carbon Pricing: Effectiveness and Equity. Ecol. Econ. 2018, 150, 52–61. [Google Scholar] [CrossRef]
- Budolfson, M.; Dennig, F.; Errickson, F.; Feindt, S.; Ferranna, M.; Fleurbaey, M.; Klenert, D.; Kornek, U.; Kuruc, K.; Méjean, A.; et al. Protecting the poor with a carbon tax and equal per capita dividend. Nat. Clim. Chang. 2021, 11, 1025–1026, ISSN 0921-8009. [Google Scholar] [CrossRef]
- Oswald, J.; Millward-Hopkins, J.; Steinberger, J.K.; Owen, A.; Ivanova, D. Luxury-focused carbon taxation improves fairness of climate policy. One Earth 2023, 6, 884–898, ISSN 2590-3322. [Google Scholar] [CrossRef]
- Corvino, F. Why a uniform carbon tax is unjust, no matter how the revenue is used, and should be accompanied by a limitarian carbon tax. J. Glob. Ethic- 2024, 20, 56–76. [Google Scholar] [CrossRef]
- Müller, B.; Michaelowa, A. How to operationalize accounting under Article 6 market mechanisms of the Paris Agreement. Clim. Policy 2019, 19, 812–819. [Google Scholar] [CrossRef]
- Edmonds, J.; Yu, S.; Mcjeon, H.; Forrister, D.; Aldy, J.; Hultman, N.; Cui, R.; Waldhoff, S.; Clarke, L.; DE Clara, S.; et al. How much could article 6 enhance nationally determined contribution ambition towards Paris agreement goals through economic efficiencyClim. Chang. Econ. 2021, 12, 2. [Google Scholar] [CrossRef]
- Stua, M.; Nolden, C.; Coulon, M. Climate clubs embedded in Article 6 of the Paris Agreement. Resour. Conserv. Recycl. 2022, 180, 106178. [Google Scholar] [CrossRef]
- Soezer, A. What is Article 6 of the Paris Agreement, and Why Is It Important? 2022. Available online: https://www.undp.org/energy/blog/what-article-6-paris-agreement-and-why-it-important (accessed on 25 October 2023).
- UNDP. Platform for Voluntary Bilateral Cooperation. 2024. Available online: https://carboncooperation.undp.org/ (accessed on 4 June 2024).
- African Union. The African Leaders Nairobi Declaration on climate change and call to action. Africa Climate Summit 8 September 2023. Available online: https://africaclimatesummit.org/resources (accessed on 3 November 2023).
- European Commission President. Statement by President von der Leyen at the first Session, ‘One Earth’, of the G20. European Commission Press Corner. 9 September 2023. Available online: https://ec.europa.eu/commission/presscorner/detail/en/statement_23_4422 (accessed on 20 October 2023).
- Summit for a New Global Financing Pact. Call to action for Paris Aligned Carbon Markets 22–23 June, Paris. 2023. Available online: https://nouveaupactefinancier.org/pdf/call-to-action-for-paris-aligned-carbon-markets.pdf (accessed on 29 October 2023).
- UNFCCC-COP 26. COP 26 Outcomes: Market Mechanisms and non-Market Approaches (Article 6). 2021. Available online: https://unfccc.int/process-and-meetings/the-paris-agreement/the-glasgow-climate-pact/cop26-outcomes-market-mechanisms-and-non-market-approaches-article-6 (accessed on 24 April 2024).
- UNFCCC-COP 28. Conference of the Parties Serving as the Meeting of the Parties to the Paris Agreement Fifth session United Arab Emirates, 30 November to 12 December 2023. Agenda Item 4. First Global Stocktake. FCCC/PA/CMA/2023/L.17. Revised Advanced Version. 2023. Available online: https://unfccc.int/sites/default/files/resource/cma2023_L17_adv.pdf (accessed on 10 June 2024).
- IISD. Summary of the 2023 Dubai Climate Change Conference: 30 November–13 December 2023. Earth Negot. Bullettin. 2023, 12, 482. Available online: https://enb.iisd.org/sites/default/files/2023-12/enb12842e_0.pdf (accessed on 14 March 2024).
- Azar, C.; Martín, J.G.; Johansson, D.J.; Sterner, T. The social cost of methane. Clim. Chang. 2023, 176, 71. [Google Scholar] [CrossRef]
- NASEM—National Academies of Sciences, Engineering, and Medicine. Valuing Climate Damages: Updating Estimation of the Social Cost of Carbon Dioxide; The National Academies Press: Washington, DC, USA, 2017. [Google Scholar] [CrossRef]
- Dolphin, G.; Xiahou, Q. World carbon pricing database: Sources and methods. Sci. Data 2022, 9, 573. [Google Scholar] [CrossRef] [PubMed]
- World Bank. CO2 Emissions (kt) 1990–2020. World Development Indicators. 2023. Available online: https://data.worldbank.org/indicator/EN.ATM.CO2E.KT (accessed on 10 July 2023).
- World Bank. GDP (constant US$2015). World Development Indicators. 2023. Available online: https://data.worldbank.org/indicator/NY.GDP.MKTP.KD (accessed on 10 July 2023).
- World Bank. World Bank Group Country Classifications by Income Level for FY24 (1 July 2023–30 June 2024). 2023. Available online: https://blogs.worldbank.org/opendata/new-world-bank-group-country-classifications-income-level-fy24 (accessed on 20 July 2023).
- NewClimate Institute and Climate Analytics. Climate Action Tracker©. Methodology. 2022. Available online: https://climateactiontracker.org/methodology/ (accessed on 20 July 2023).
- OECD. OECD Data. Real GDP Long-Term Forecast. 2023. Available online: https://www.oecd.org/en/data/indicators/real-gdp-long-term-forecast.html (accessed on 25 July 2023).
- World Bank. GDP growth (Annual %). World Development Indicators. 2023. Available online: https://data.worldbank.org/indicator/NY.GDP.MKTP.KD.ZG (accessed on 20 July 2023).
- World Bank. GNI growth (Annual %). World Development Indicators. 2023. Available online: https://data.worldbank.org/indicator/NY.GNP.MKTP.KD.ZG (accessed on 20 July 2023).
- FAO. “Annual Population. Year Projections”. FAOSTAT. 2023. Available online: https://www.fao.org/faostat/en/#data/OA (accessed on 20 July 2023).
- OECD. The social cost of carbon (chapter 14). In Cost-Benefit Analysis and the Environment: Further Developments and Policy Use; OECD Publishing: Paris, France, 2018. [Google Scholar] [CrossRef]
- Ricke, K.; Drouet, L.; Caldeira, K.; Tavoni, M. Country-level social cost of carbon. Nat. Clim. Chang. 2018, 8, 895–900. [Google Scholar] [CrossRef]
- Hänsel, M.C.; Drupp, M.A.; Johansson, D.J.A.; Nesje, F.; Azar, C.; Freeman, M.C.; Groom, B.; Sterner, T. Climate economics support for the UN climate targets. Nat. Clim. Chang. 2020, 10, 781–789. [Google Scholar] [CrossRef]
- Kikstra, J.S.; Waidelich, P.; Rising, J.; Yumashev, D.; Hope, C.; Brierley, C.M. The social cost of carbon dioxide under climate-economy feedbacks and temperature variability. Environ. Res. Lett. 2021, 16, 094037. [Google Scholar] [CrossRef]
- Rennert, K.; Errickson, F.; Prest, B.C.; Rennels, L.; Newell, R.; Pizer, W.; Kingdon, C.; Wingenroth, J.; Cooke, R.; Parthum, B.; et al. Comprehensive evidence implies a higher social cost of CO2. Nature 2022, 610, 687–692. [Google Scholar] [CrossRef]
- Wagner, G.; Anthoff, D.; Cropper, M.; Dietz, S.; Gillingham, K.T.; Groom, B.; Kelleher, J.P.; Moore, F.; Stock, J.H. Eight priorities for calculating the social cost of carbon. Nature 2021, 590. [Google Scholar] [CrossRef]
- Rennert, K.; Prest, B.C.; Pizer, W.A.; Newell, R.G.; Anthoff, D.; Kingdon, C.; Rennels, L.; Cooke, R.; Raftery, A.E.; Ševčíková, H.; et al. The social cost of carbon: Advances in long-termprobabilistic projections of population, GDP, emissions, and discount rates. Brook. Pap. Econ. Act. 2021, 2021, 223–305. [Google Scholar] [CrossRef]
- Howard, P.H.; Sterner, T. Few and Not So Far Between: A Meta-analysis of Climate Damage Estimates. Environ. Resour. Econ. 2017, 68, 197–225. [Google Scholar] [CrossRef]
- Drupp, M.A.; Freeman, M.C.; Groom, B.; Nesje, F. Discounting Disentangled. Am. Econ. J. Econ. Policy 2018, 10, 109–134. [Google Scholar] [CrossRef]
- Diaz, D. Estimating global damages from sea level rise with the coastal impact and adaptation model (CIAM). Clim. Chang. 2016, 137, 143–156. [Google Scholar] [CrossRef]
- Dietz, S.; Rising, J.; Stoerk, T.; Wagner, G. Economic impacts of tipping points in the climate system. Proc. Natl. Acad. Sci. USA 2021, 118, e2103081118. [Google Scholar] [CrossRef] [PubMed]
- Cai, Y.; Lontzek, T.S. The social cost of carbon under climatic and economic risk. J. Politi- Econ. 2019, 127, 2684–2734. [Google Scholar] [CrossRef]
- Dietz, S.; Koninx, F. Economic impacts of melting of the Antarctic Ice Sheet. Nat. Commun. 2022, 13, 5819. [Google Scholar] [CrossRef]
- Ministry of Environment, Land and Sea. The Italian Catalogue of Environmentally Friendly and of Environmentally Harmful Subsidies, 2016. Sinthesis (English Version). Directorate General for Sustainable Development, EU and International Affairs, with the Technical Assistance of Sogesid S.p.A, Roma. December 2016. Available online: https://www.mase.gov.it/sites/default/files/archivio/allegati/sviluppo_sostenibile/italy_catalogue_ehs_efs_synthesis_eng_0.pdf (accessed on 14 September 2024).
- Bovenberg, A.L.; de Mooij, R.A. Environmental tax reform and endogenous growth. J. Public Econ. 1997, 63, 207–237, ISSN 0047-2727. [Google Scholar] [CrossRef]
- Heine, D.; Black, S. Benefits beyond Climate: Environmental Tax Reform. In Chapter 1 of Fiscal Policies for Development and Climate Action; Pigato, M.A., Ed.; World Bank Group: Washington, DC, USA, 2018. [Google Scholar] [CrossRef]
- Ekins, P.; Speck, S. (Eds.) Environmental Fiscal Reform. A Policy for Green Growth; Oxford University Press: Oxford, UK, 2011. [Google Scholar]
- European Commission; Directorate-General for Enterprise and Industry, Directorate-General for Environment; Elliott, L.; Woollard, J.; Schweitzer, J.; Bapasola, A.; Sastre, S.; Paquel, K.; Elliott, T.; Hogg, D.; et al.; et al. Study on Assessing the Environmental Fiscal Reform Potential for the EU28—Final Report; Publications Office of the European Union: Luxembourg, 2016; Available online: https://data.europa.eu/doi/10.2779/86822 (accessed on 10 September 2024).
- OECD. “Environmental Fiscal Reform. Progress, Prospects and Pitfalls”. Working Document for the G7. May 2017. Available online: https://www.mase.gov.it/sites/default/files/archivio_immagini/Galletti/G7/5_G7_env_oecd_environmental_fiscal_reform_may_2017.pdf (accessed on 10 September 2024).
- OECD. Environmental policy: Environmentally related tax revenue database. Edition 2021. OECD Environ. Stat. (Database) 2022. [Google Scholar] [CrossRef]
- Eurostat. Environmental Tax Revenue, 2024 ed.; Eurostat Data Browser. 2024; Available online: https://doi.org/10.2908/TEN00141 (accessed on 24 September 2024).
- UNFCCC Standing Committee on Finance. Report on Progress Towards Achieving the Goal of Mobilizing Jointly USD 100 Billion per Year to Address the Needs of Developing Countries in the Context of Meaningful Mitigation Actions and Transparency on Implementation. Technical Report. UNFCCC Secretariat, Bonn. 2022. Available online: https://unfccc.int/sites/default/files/resource/J0156_UNFCCC%20100BN%202022%20Report_Book_v3.2.pdf (accessed on 19 October 2023).
- Regulation (EU) 2023/956 of the European Parliament and of the Council of 10 May 2023 establishing a carbon border adjustment mechanism. Available online: https://eur-lex.europa.eu/eli/reg/2023/956/oj (accessed on 10 February 2024).
- World Bank. World Bank DataBank. 2023. Available online: https://databank.worldbank.org/databases (accessed on 20 July 2023).
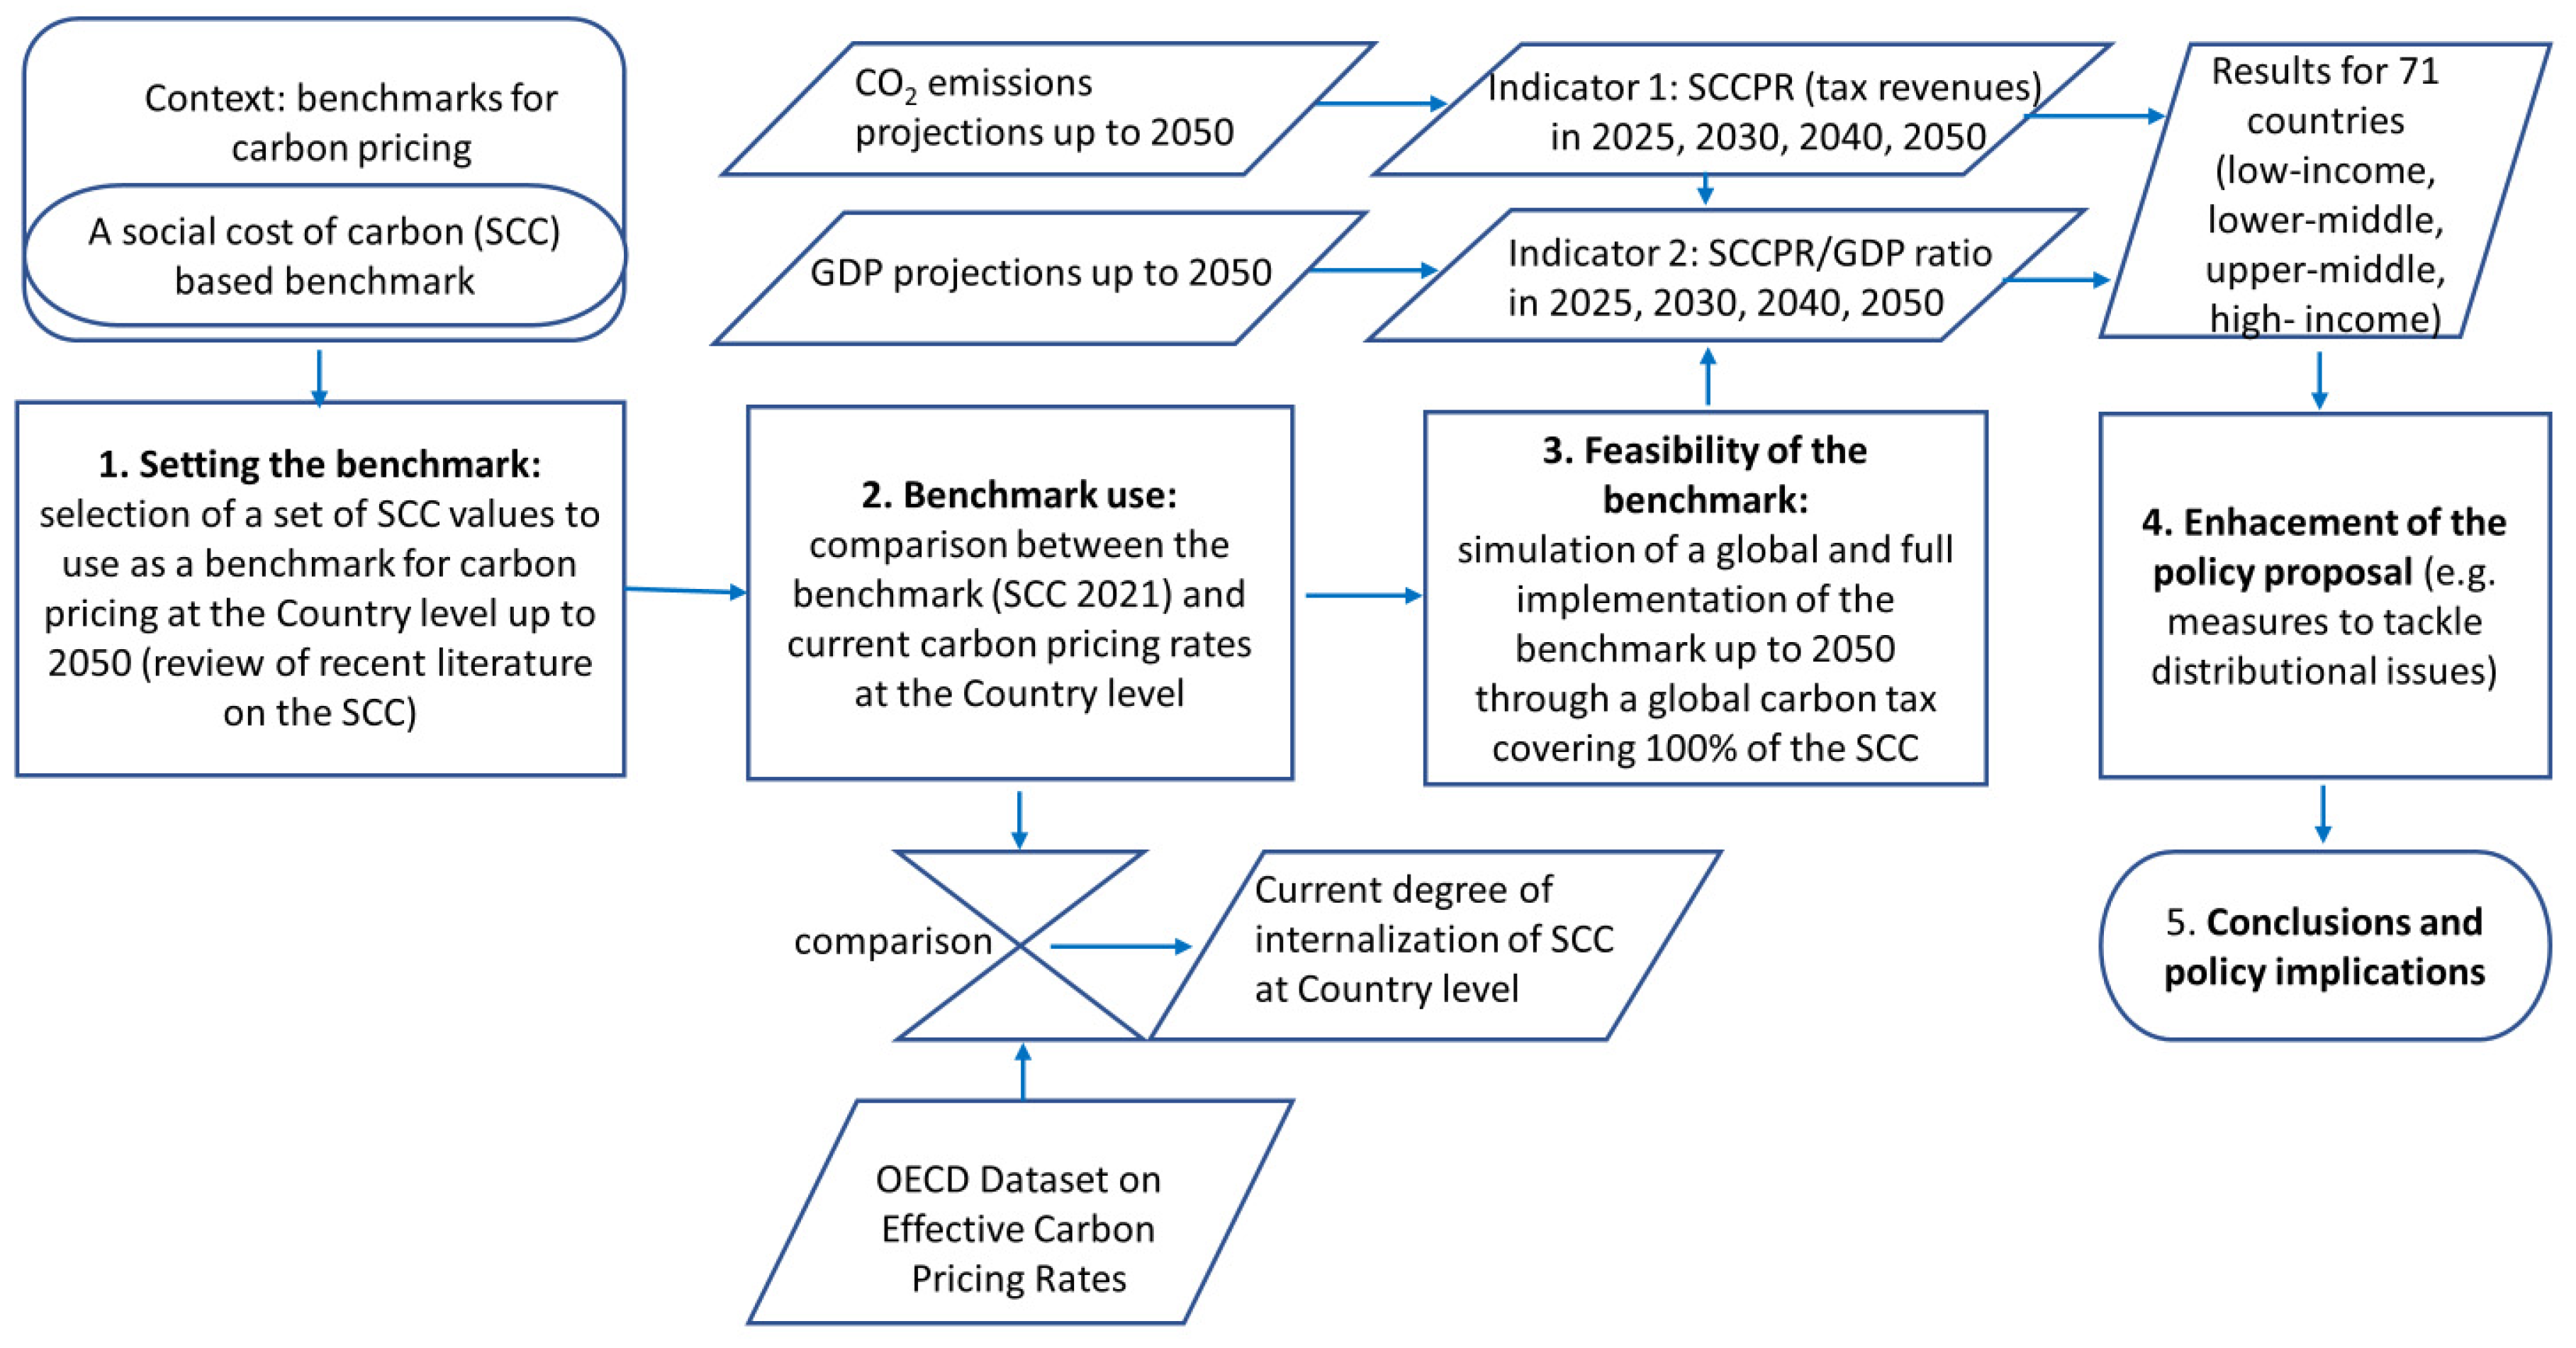
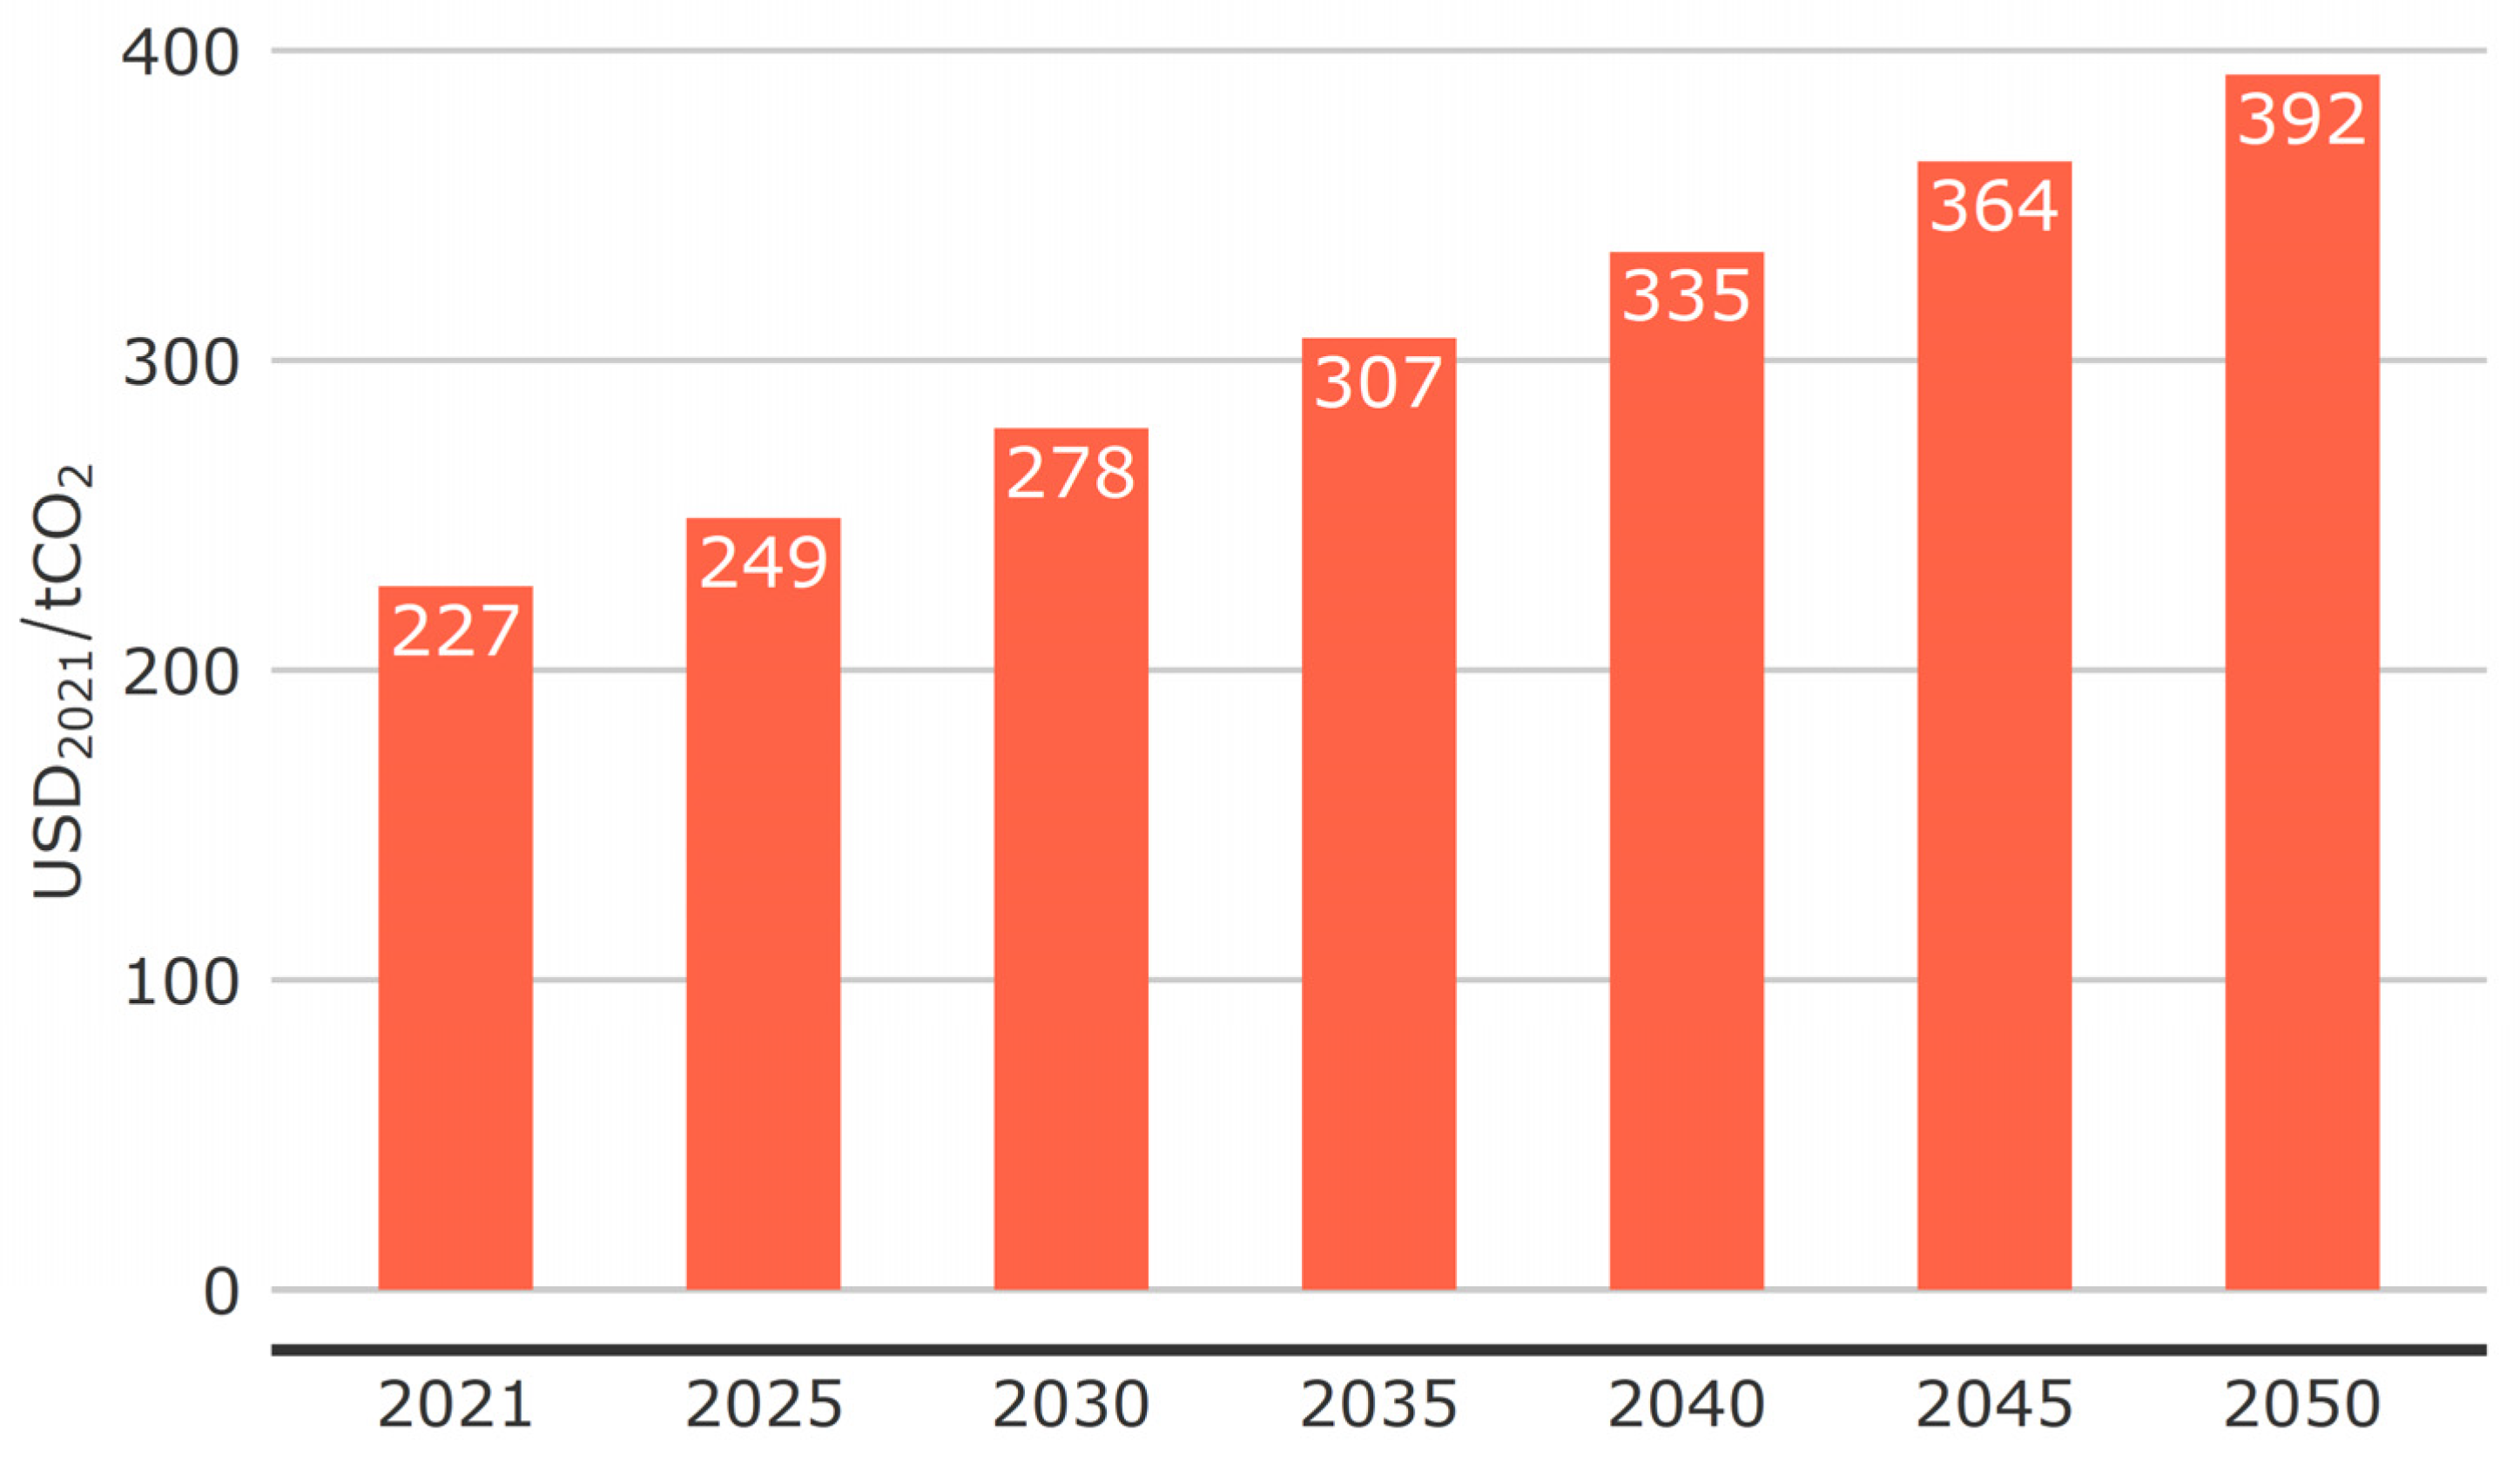

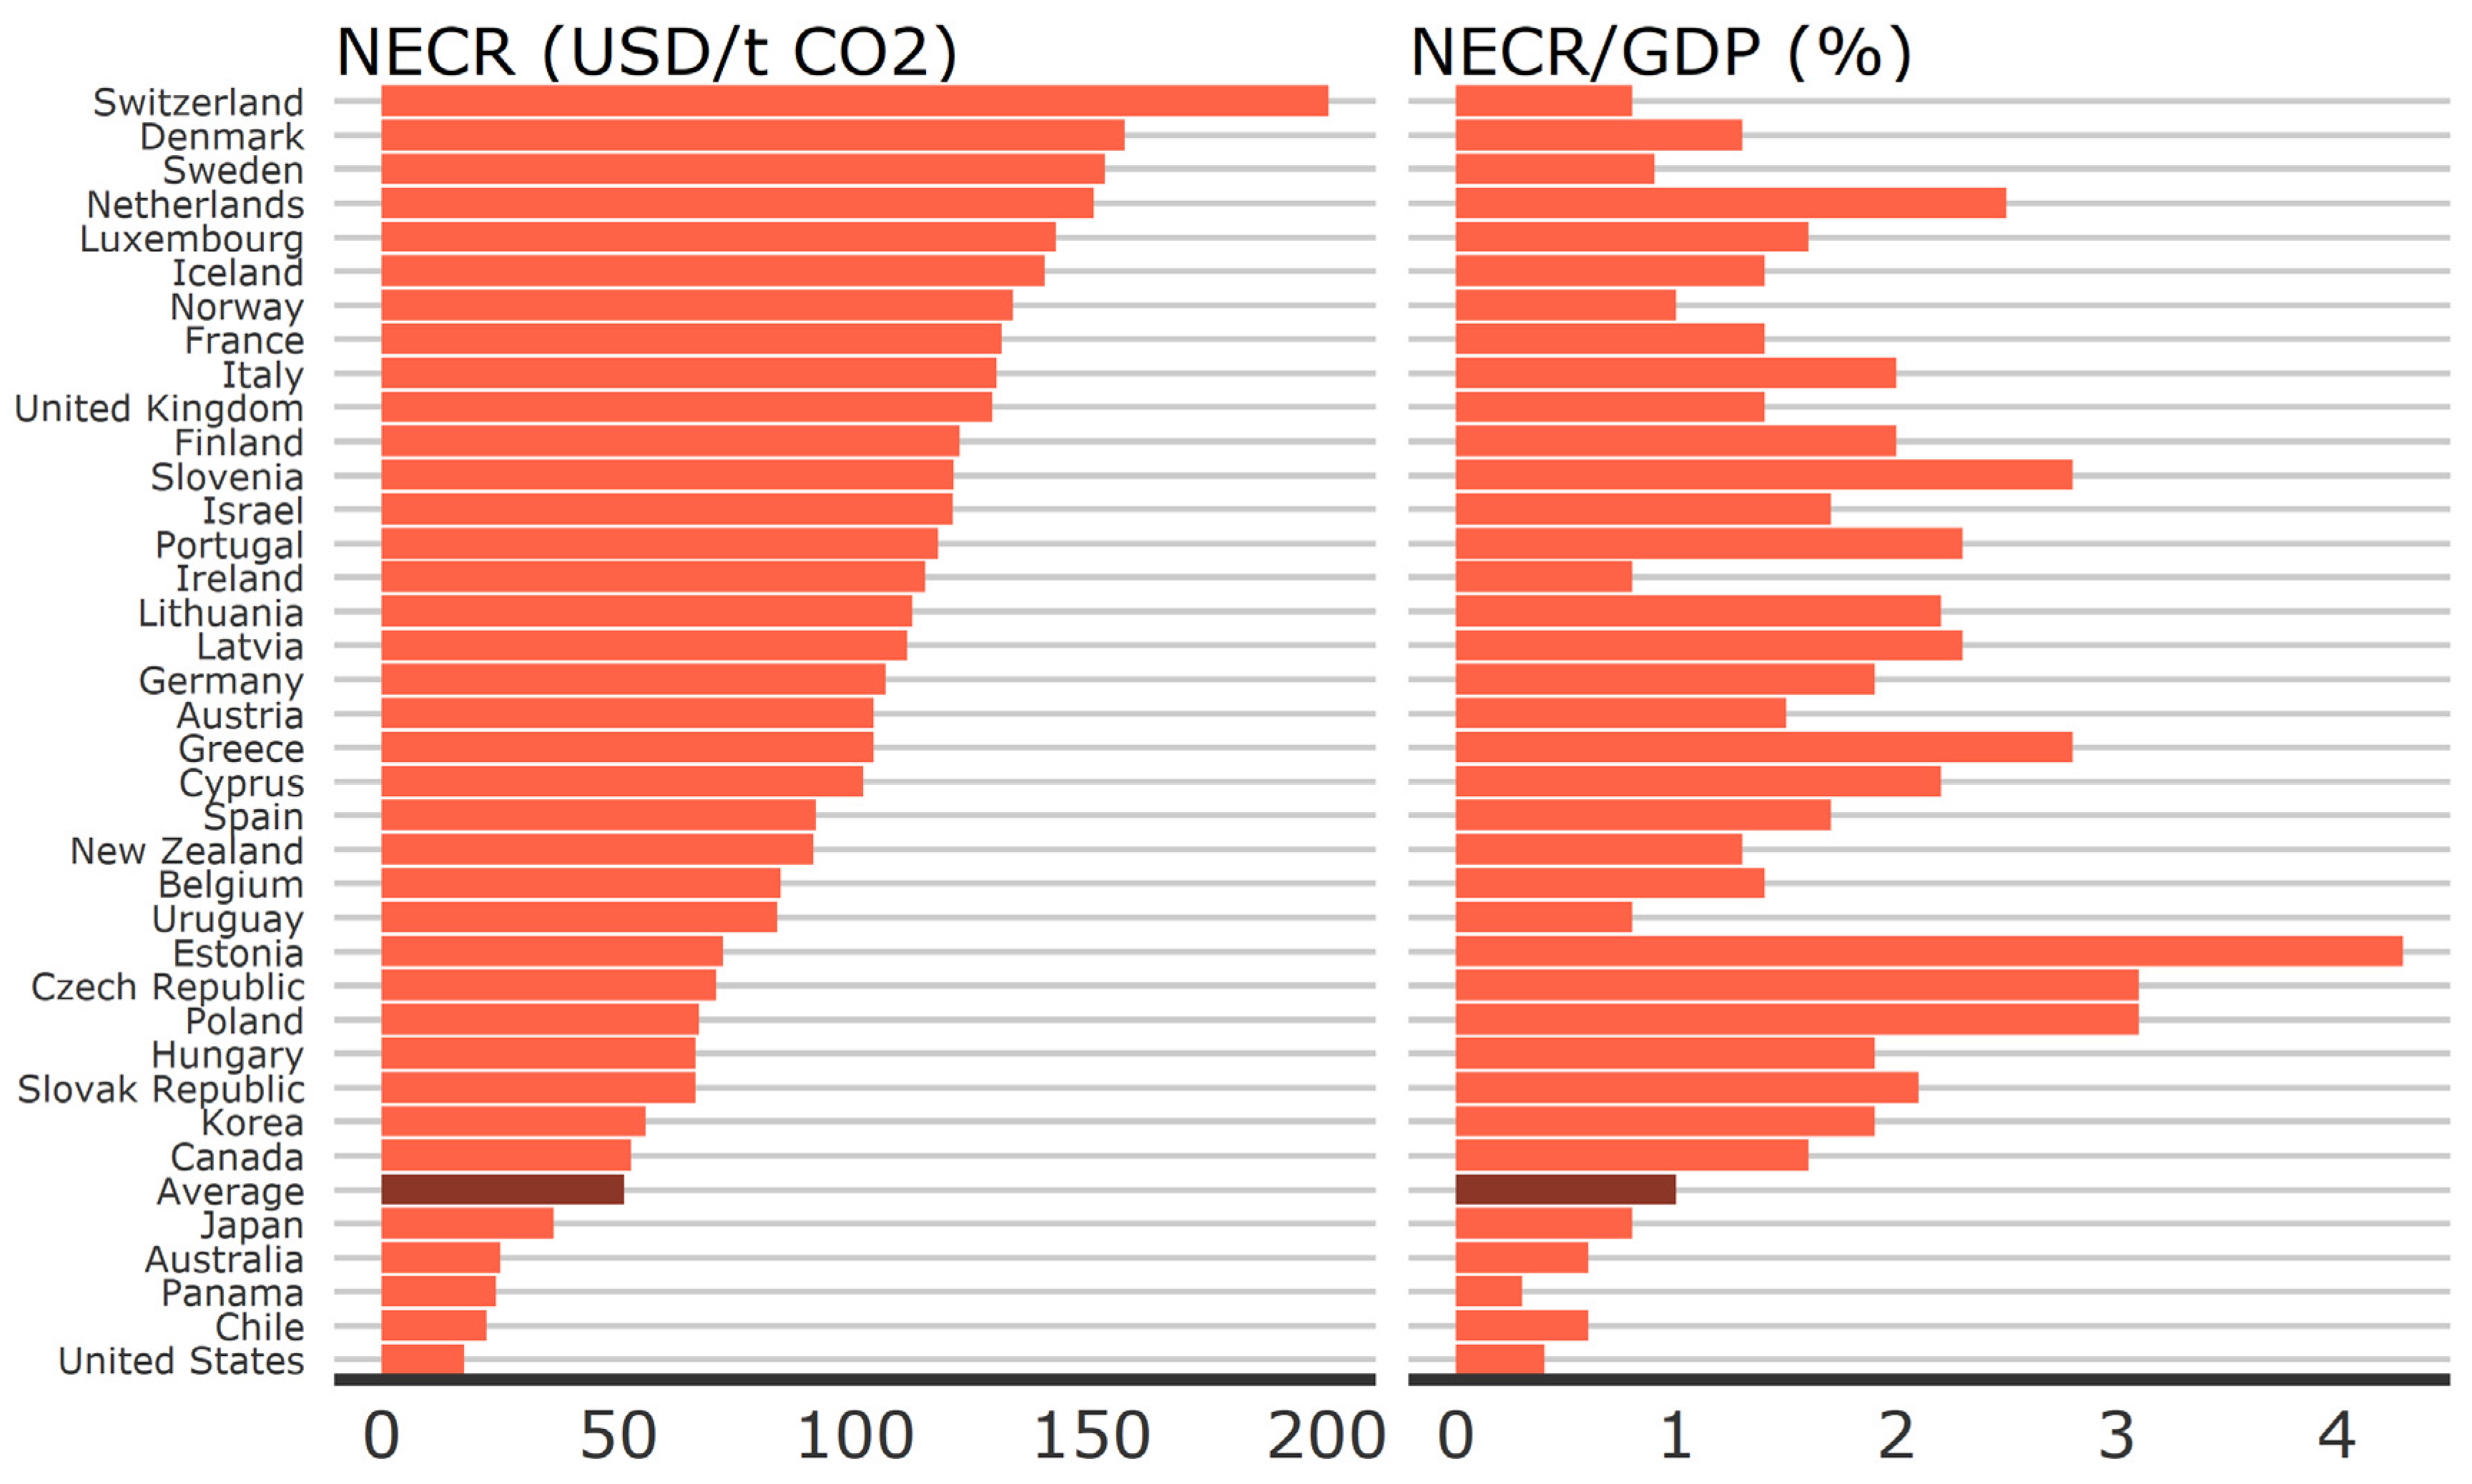
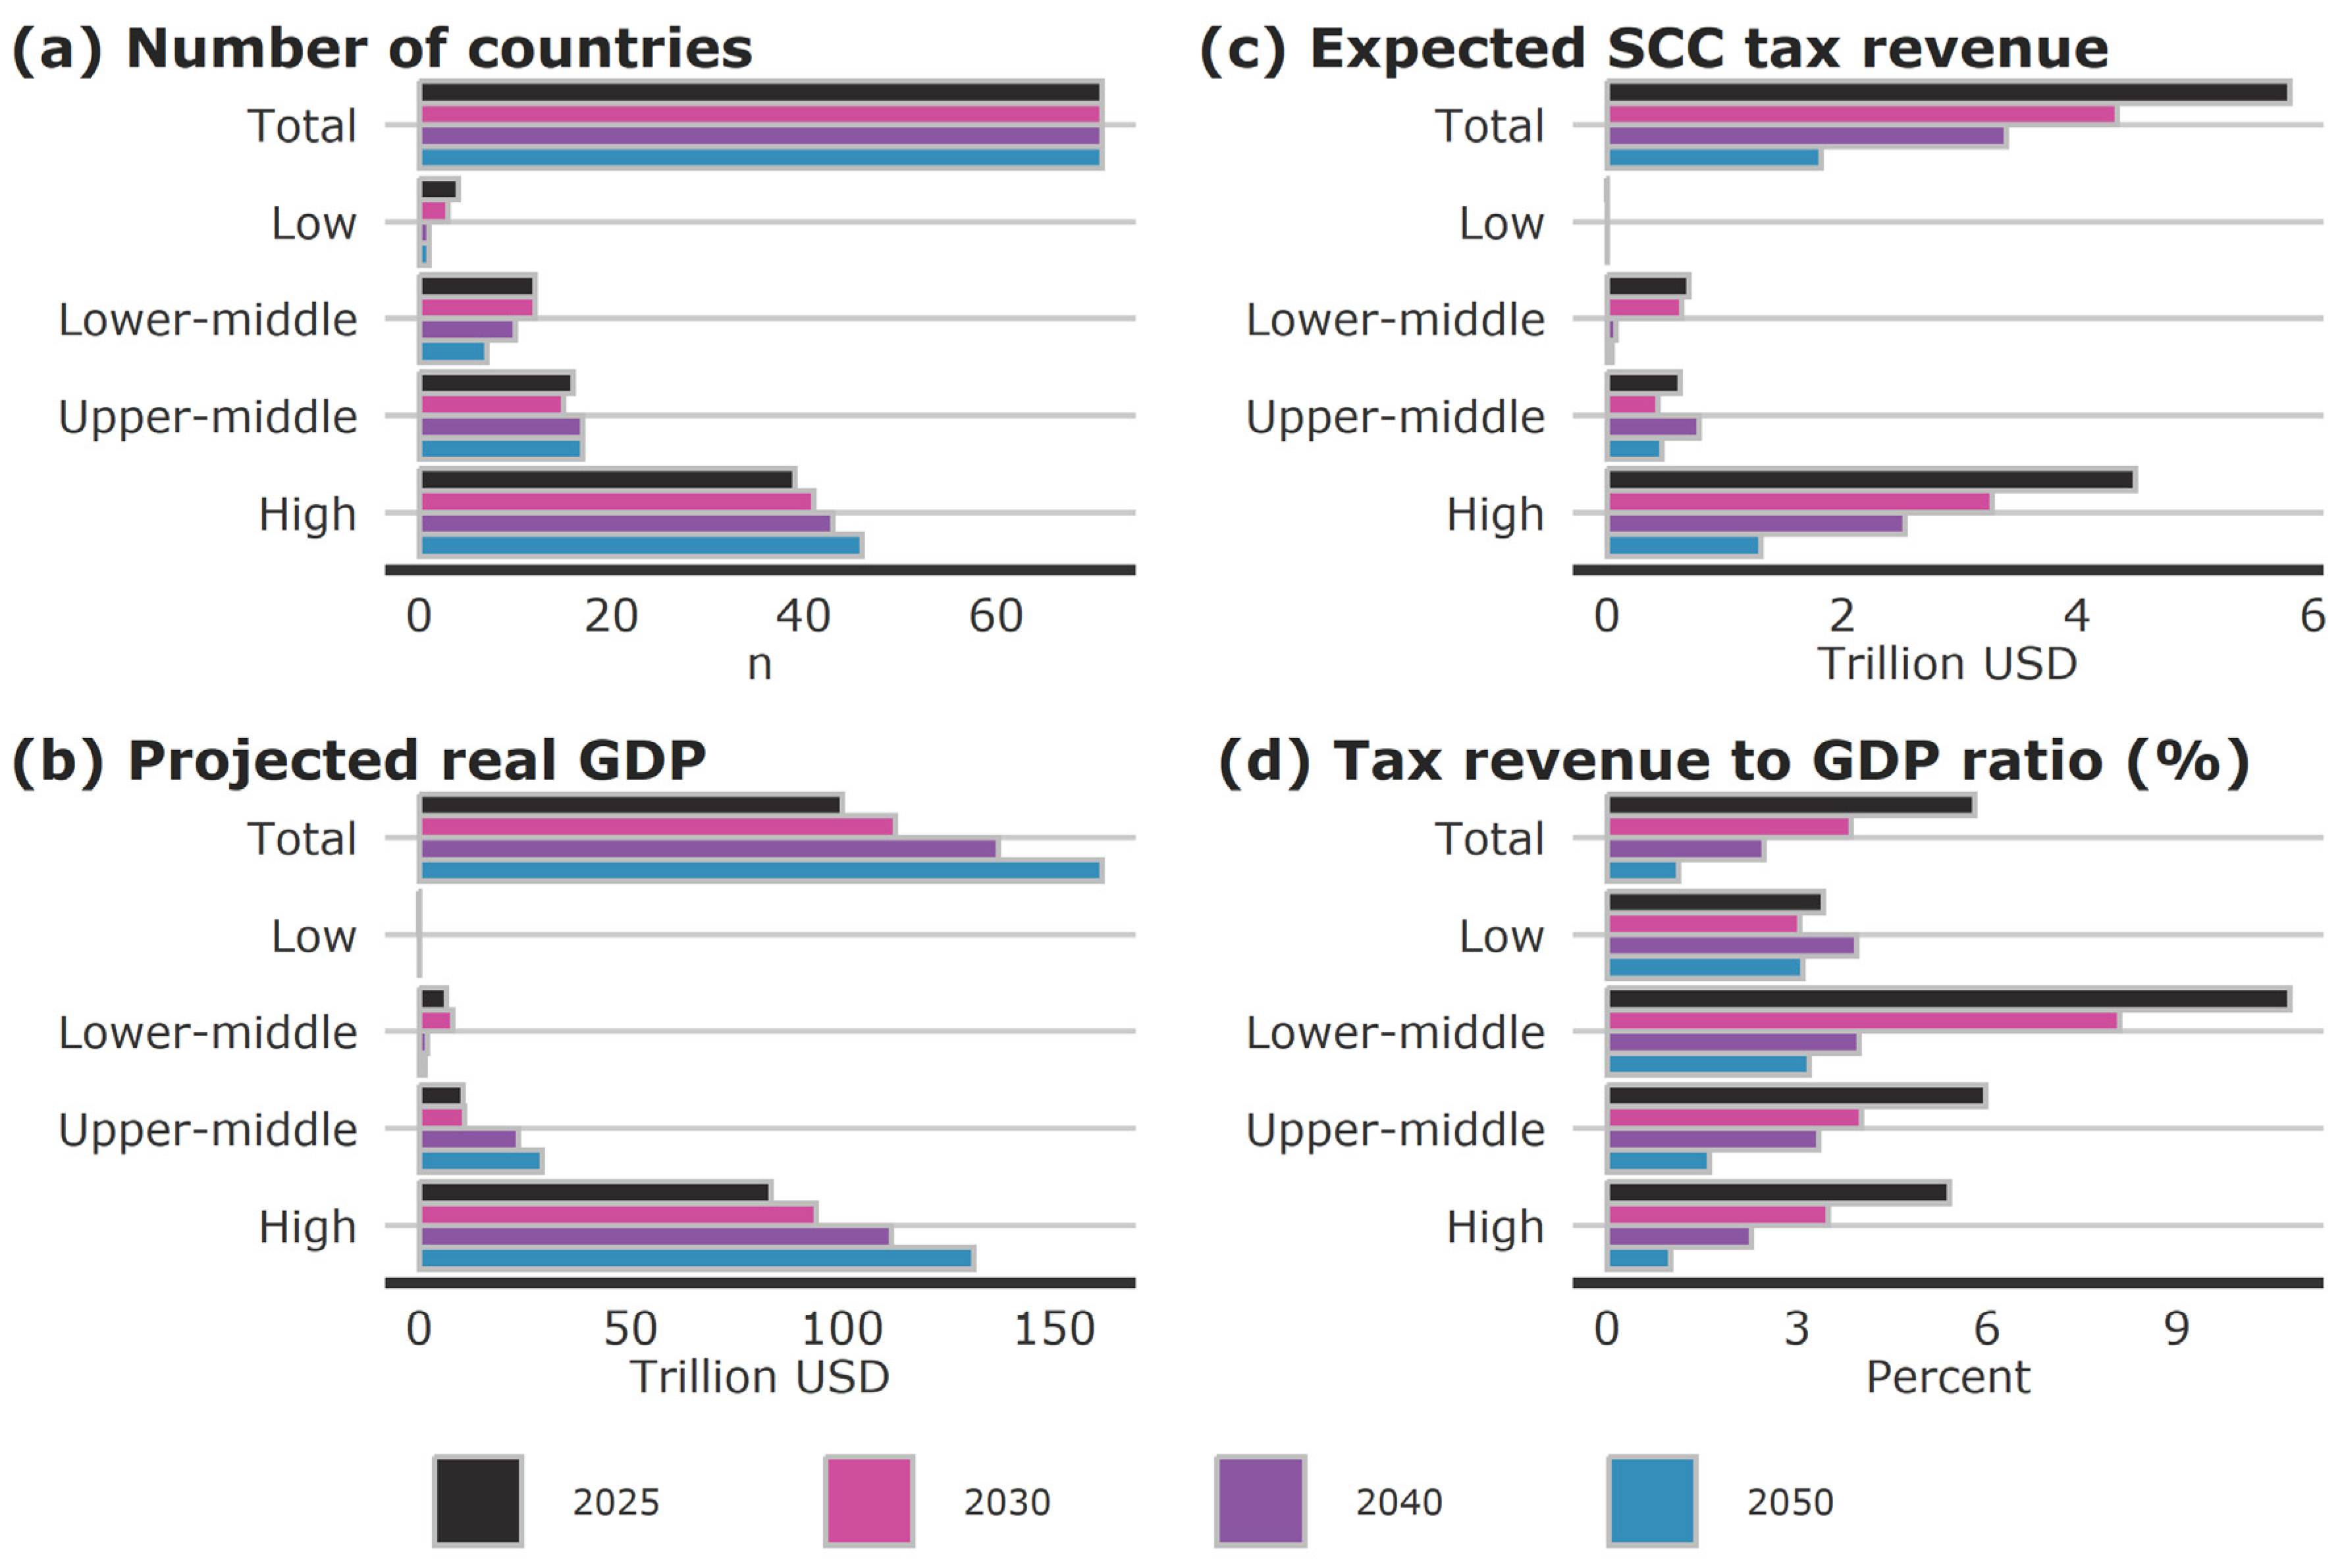

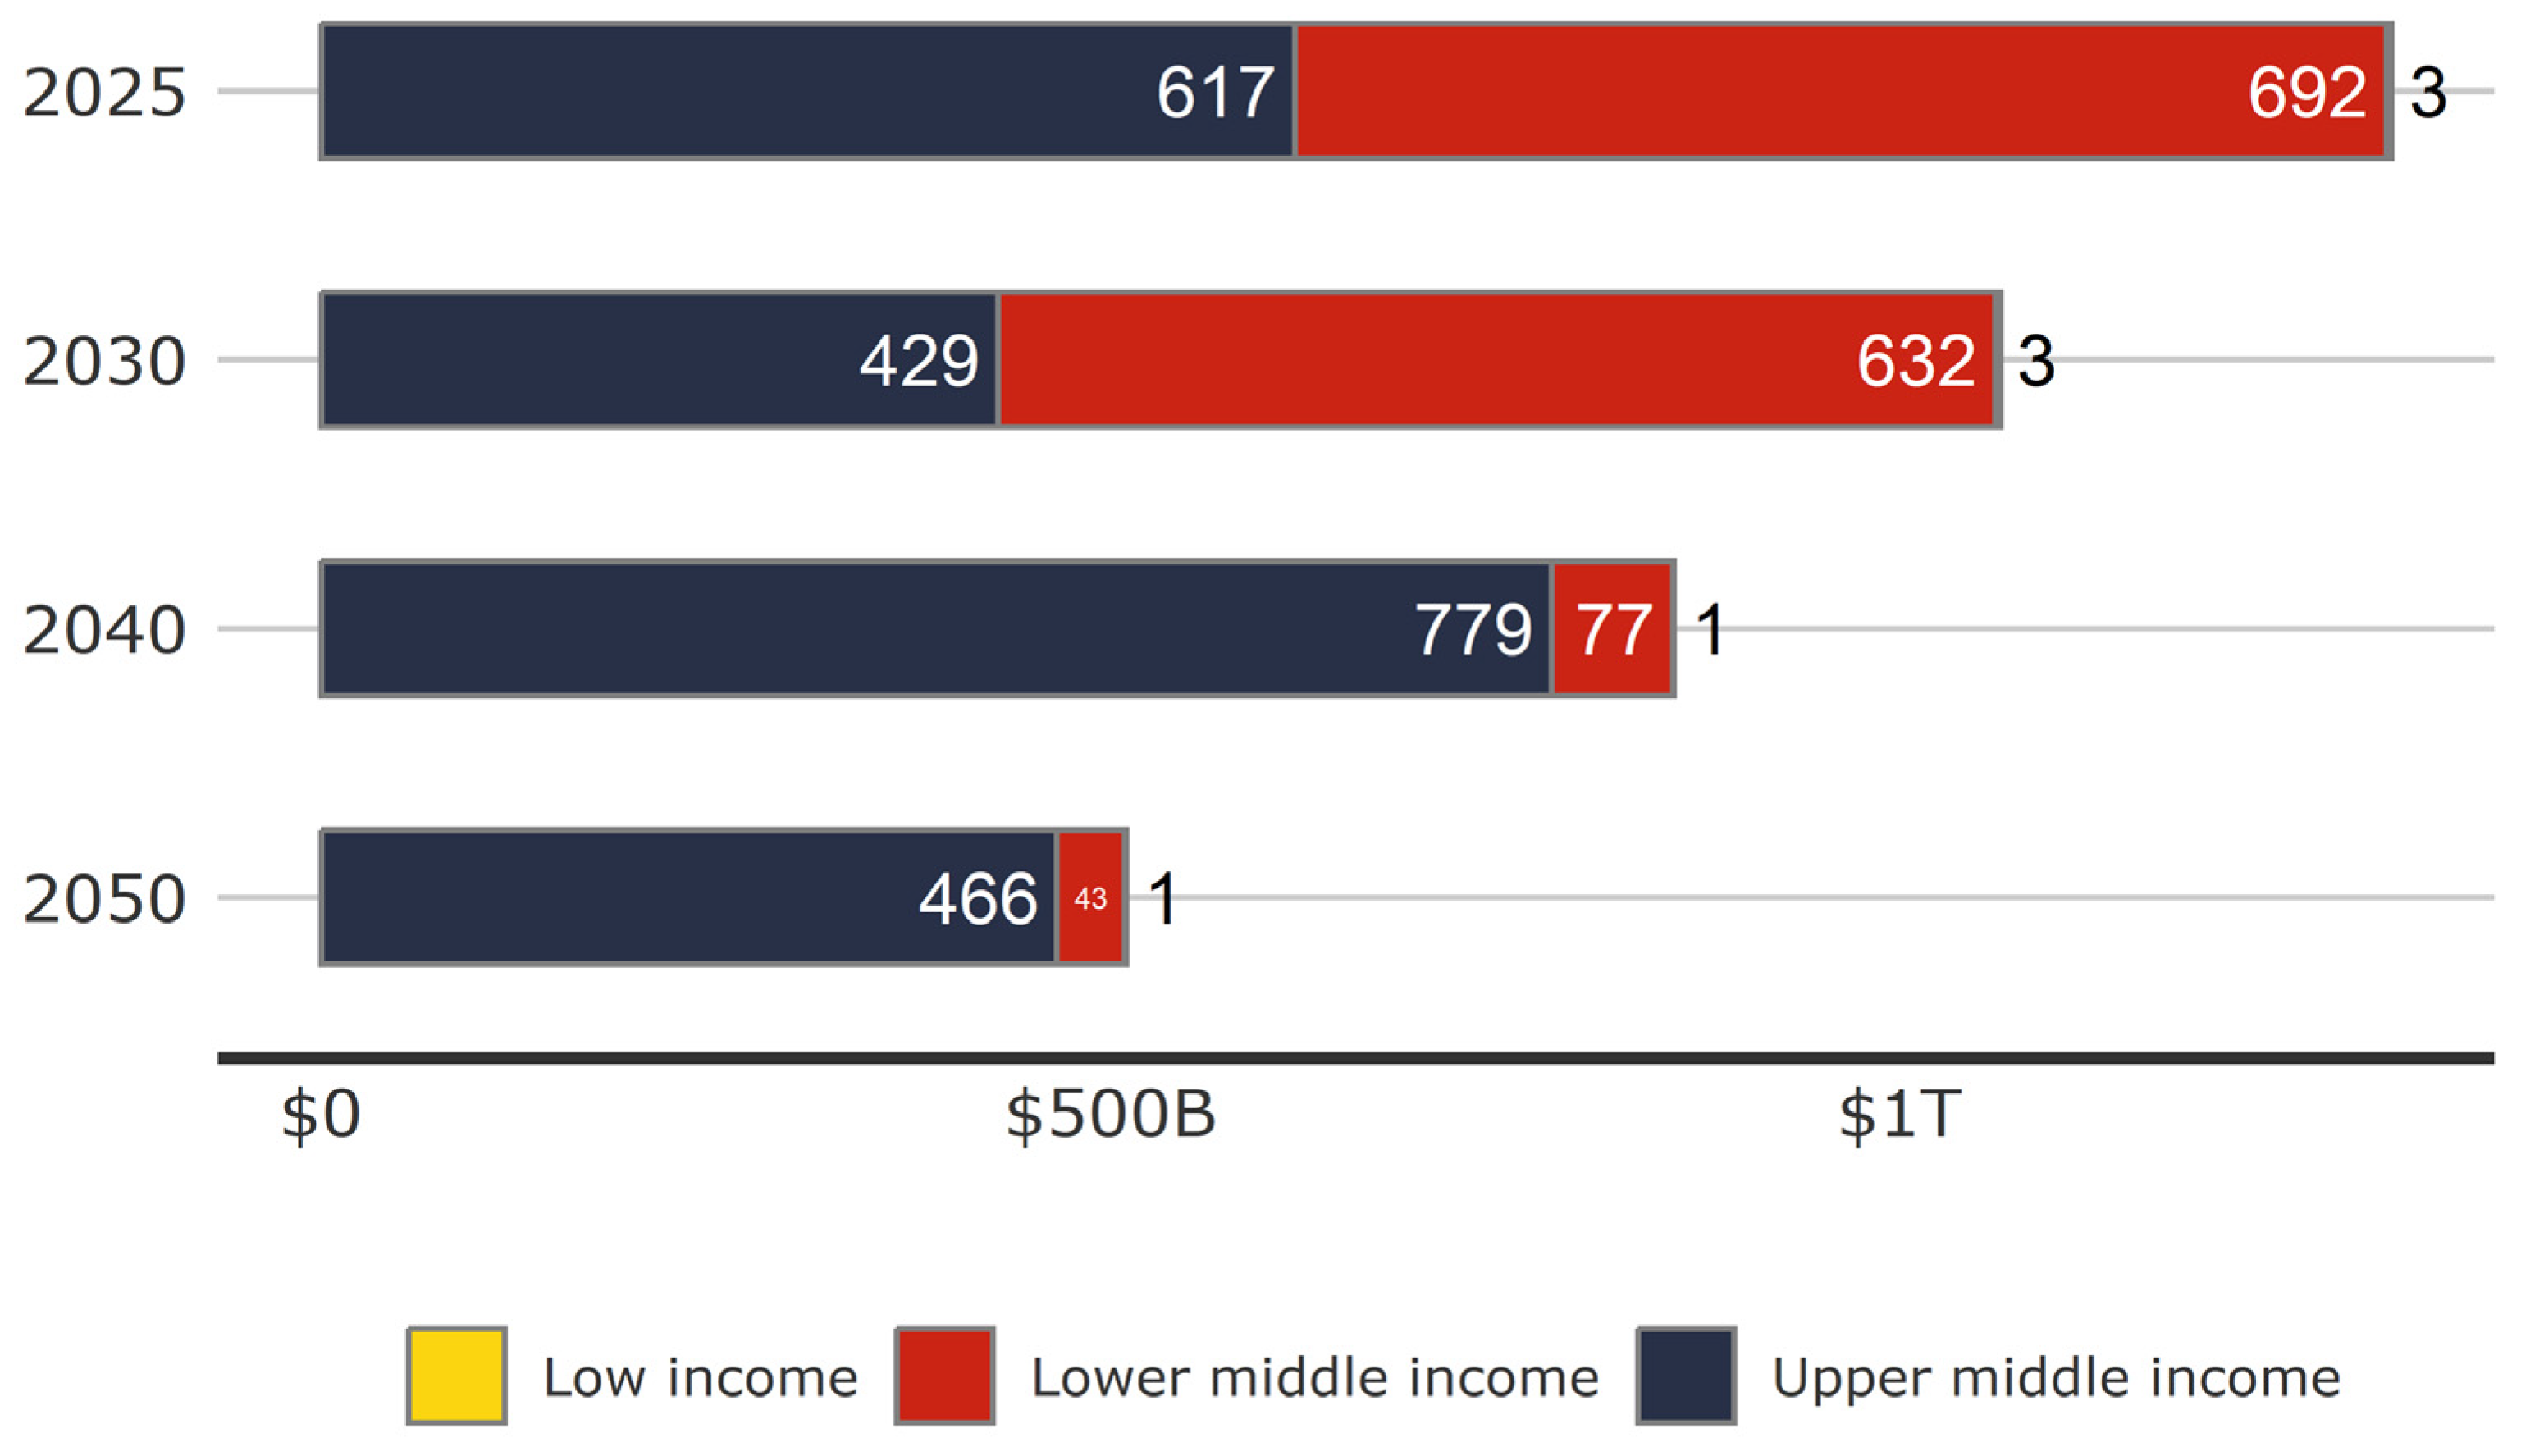
Disclaimer/Publisher’s Note: The statements, opinions and data contained in all publications are solely those of the individual author(s) and contributor(s) and not of MDPI and/or the editor(s). MDPI and/or the editor(s) disclaim responsibility for any injury to people or property resulting from any ideas, methods, instructions or products referred to in the content. |
© 2024 by the authors. Licensee MDPI, Basel, Switzerland. This article is an open access article distributed under the terms and conditions of the Creative Commons Attribution (CC BY) license (https://creativecommons.org/licenses/by/4.0/).