Article

CO2 Levels in Classrooms: What Actions to Take to Improve the Quality of Environments and Spaces

1
Environment and Health Department, Italian National Institute of Health, Viale Regina Elena 299, IT-00185 Rome, Italy
2
Department of Pediatrics and Child Neuropsychiatry, Policlinico Umberto I, University of Rome La Sapienza, Viale Regina Elena 324, IT-00161 Rome, Italy
3
Department of Agriculture, Environmental and Food Sciences, University of Molise, Via F. De Sanctis, IT-86100 Campobasso, Italy
4
Institute of Atmospheric Pollution Research, Division of Rome, c/o Ministry of Environment and Energy Security, IT-00147 Rome, Italy
*
Authors to whom correspondence should be addressed.
Sustainability 2024, 16(19), 8619; https://doi.org/10.3390/su16198619
Submission received: 7 August 2024 / Revised: 22 September 2024 / Accepted: 30 September 2024 / Published: 4 October 2024

Abstract

:
Indoor air quality (IAQ) is a crucial priority, especially since people spend most of their time indoors. Indoor air can be more polluted than outdoor air due to sources such as building materials, cleaning products, and heating systems. This condition can affect health and productivity, especially in schools and work environments. Students spend about a third of their day in classrooms, and studies have shown that poor IAQ can cause respiratory and allergic problems, especially among children, who are more vulnerable. Poor ventilation and excessive CO2 concentration are indicators of suboptimal indoor air quality, which can lead to symptoms such as headaches, fatigue, and worsening asthma. In Italy, the lack of specific legislation on indoor air quality in schools is a problem, but improved ventilation, both natural and mechanical, and monitoring of CO2 levels are recommended to prevent negative health consequences. This paper aims to describe a methodology to improve IAQ in schools. The paper discusses the results of a study conducted on CO2 and PM10 levels measured in real time in cold season (Nov–Mar) in different classrooms of primary and secondary schools present in a large Italian urban area in order to understand the IAQ state and identify possible improvement actions.

1. Introduction

Today, as never before, great attention must be paid to indoor air quality given that every day the population spends most of their time at home (smart working), in the office, at the bank, at the post office, at school, in shopping centers, in health facilities, in the gym, means of transport, etc. Although vital for the health of the population, it is on average more polluted than what we breathe outdoors due to the verifiable chemical, biological, and physical pollutants emitted by the numerous internal sources and may also be a by-product of the activities that are undertaken within them (e.g., transfer from building materials, paints, varnishes, solvents, cleaning products, detergents, air fresheners, combustion products related to heating and food preparation activities, ventilation mode, window opening behavior, cleaning and maintenance of ventilation and air conditioning systems, site characteristics, etc.) [1,2,3,4]. That is why it contributes significantly to the health and productivity level of teachers, non-teachers (school collaborator, external operators, etc.), staff and administrators, students, users, and visitors to indoor environments [5,6].
At the work and school levels, the best indoor air quality (IAQ) conditions lead to an increase in productivity, performance and learning abilities of the various users (workers, teachers, non-teachers, administrative employees and students) as they work and study with better quality, obtaining a reduction related symptoms (e.g., asthma, headaches, fatigue, etc.) which translated into economic terms means greater competitiveness of the country system, better educational outcomes and a reduction in public health costs [7,8]. Whatever the risk of exposure in indoor environments to students and staff, it takes on a particular meaning and importance, both for the vulnerabilities of the subjects (e.g., students and workers some with more or less complex sensitivities and disabilities, or with respiratory, asthmatic and allergic diseases, or alteration of the immune system, etc.) and because of the high length of stay. The need to control and monitor the IAQ in the various school environments and working contexts should therefore be underlined.
In European countries, children spend about a third of their day in classrooms. Primary and secondary schools in the European Community have about 76 million students (who are rapidly growing children and adolescents, some with physical and mental disabilities, sensory disabilities, migrants or minorities) and almost 4.5 million teachers, representing about 20% of the total population [9]. Poor IAQ in schools can lead to serious health problems among children, who are known to be more sensitive than adults to the consequences of air pollution [10,11]. Some studies conducted in Northern Europe have shown how current asthma in children and adolescents was positively associated with numerous factors present in the school environment, including very-volatile organic compounds (VVOC) e.g., formaldehyde, volatile organic compounds (VOC), particulate matter (PM10, PM2.5), semi-volatile organic compounds (SVOC), nitrogen dioxide (NO2), allergens (including animal skin derivatives), filamentous fungi-moulds, bacteria and humidity [12]. IAQ in school environments influences the performance and satisfaction of teaching staff, technical-administrative and non (increase/loss in productivity, concentration, response times, level of motivation; reduction in dissatisfaction; increase in professional skills; reduction in days of absence at school, stress, increased health and care costs borne by the worker, the SSN, etc.) and physical and mental well-being. Studies have also shown that poor IAQ and non-optimal microclimatic conditions can negatively influence students’ schoolwork performance (potentially leading to a decline and impaired learning abilities). On the other hand, in Italy, children spend 4 to 8 h a day for at least 5 days a week for 9 months of the year in school buildings (with full-time being more and more common), dedicating almost 30% of their time for at least 10 years (students) of their lives to this setting. Compared to other work and public environments, classrooms are significantly more crowded and have a higher density than offices. It is estimated that 15% of the population, equal to about 10,000,000 people, including students and teachers, study or work every day in about 45,000 public and private buildings throughout the country [13].
School buildings represent a category of environments in which a multiplicity and heterogeneity of didactic–educational activities and functions take place [14]. These buildings differ from other types of social buildings, as the infrastructural quality of the environments, the high rate of occupation of the spaces (number of students, proximity of students to each other, classroom layout, activity-movement of students, location of equipment didactic) have a strong impact on the health of the occupants. Italy has a number of classrooms, each with a different architecture, including the size and manner of window openings and thermal properties. The few epidemiological studies on air quality in schools and the implications on student health have highlighted the close relationship between exposure to indoor pollutants and the onset of respiratory and allergic symptoms in childhood [15,16].
Even now, many people overlook the essential need for air exchange, prioritizing thermal comfort or the energy aspect in an effort to avoid “wasting” energy or to reduce consumption and associated costs [17,18]. This is particularly true on days with extreme weather conditions, whether it is very hot or very cold.
The authors underline that any recommended approach does not rely on isolated actions but rather on a coordinated set of measures that must function together and complement each other to effectively reduce risk [19,20,21,22,23]. These actions should be integrated into the broader strategy of risk prevention and mitigation within an organization. Focusing on IAQ has always been crucial for promoting and protecting public health, and it is even more vital now, given that the majority of SARS-CoV-2 infections and its variants occur in indoor settings [24]. The release of infectious particles through breathing and exhalation in these enclosed spaces is the primary mode of transmission [25,26]. Therefore, the pursuit of improving IAQ in schools will result in a significant lifelong benefit to the health of students, teaching staff, technical-administrative staff, staff of external and non-external companies (e.g., level education, better living conditions, growth in health knowledge, greater employment and income opportunities, reduction of inequalities in health and social poverty, etc.), some of them with specific needs (physical and mental disabilities, asthmatics and allergies, migrants and minorities), who spend most of their time in school environments.
The scope of this case study is the optimization of the external air exchange strategy in a natural way through the manual opening of doors and windows (mode and duration) by the pupils and teachers, or with mechanical systems and, more in general, ventilation in order to make IAQ management “less complicated”. An aspect that especially in the colder months represents a challenge. Under these weather conditions, people tend to keep windows and balconies closed for longer periods or open them only for short intervals. Additionally, air conditioning systems are often used, which recirculate the same air without any exchange with the outside. Therefore, it is necessary to provide training and information on the IAQ importance and the close relationship between indoor environments and health, with the aim of promoting and facilitating actions to reduce exposure. It is crucial to clearly explain the role of air exchanges through opening windows and balconies as well as the potential contribution of mechanical systems.

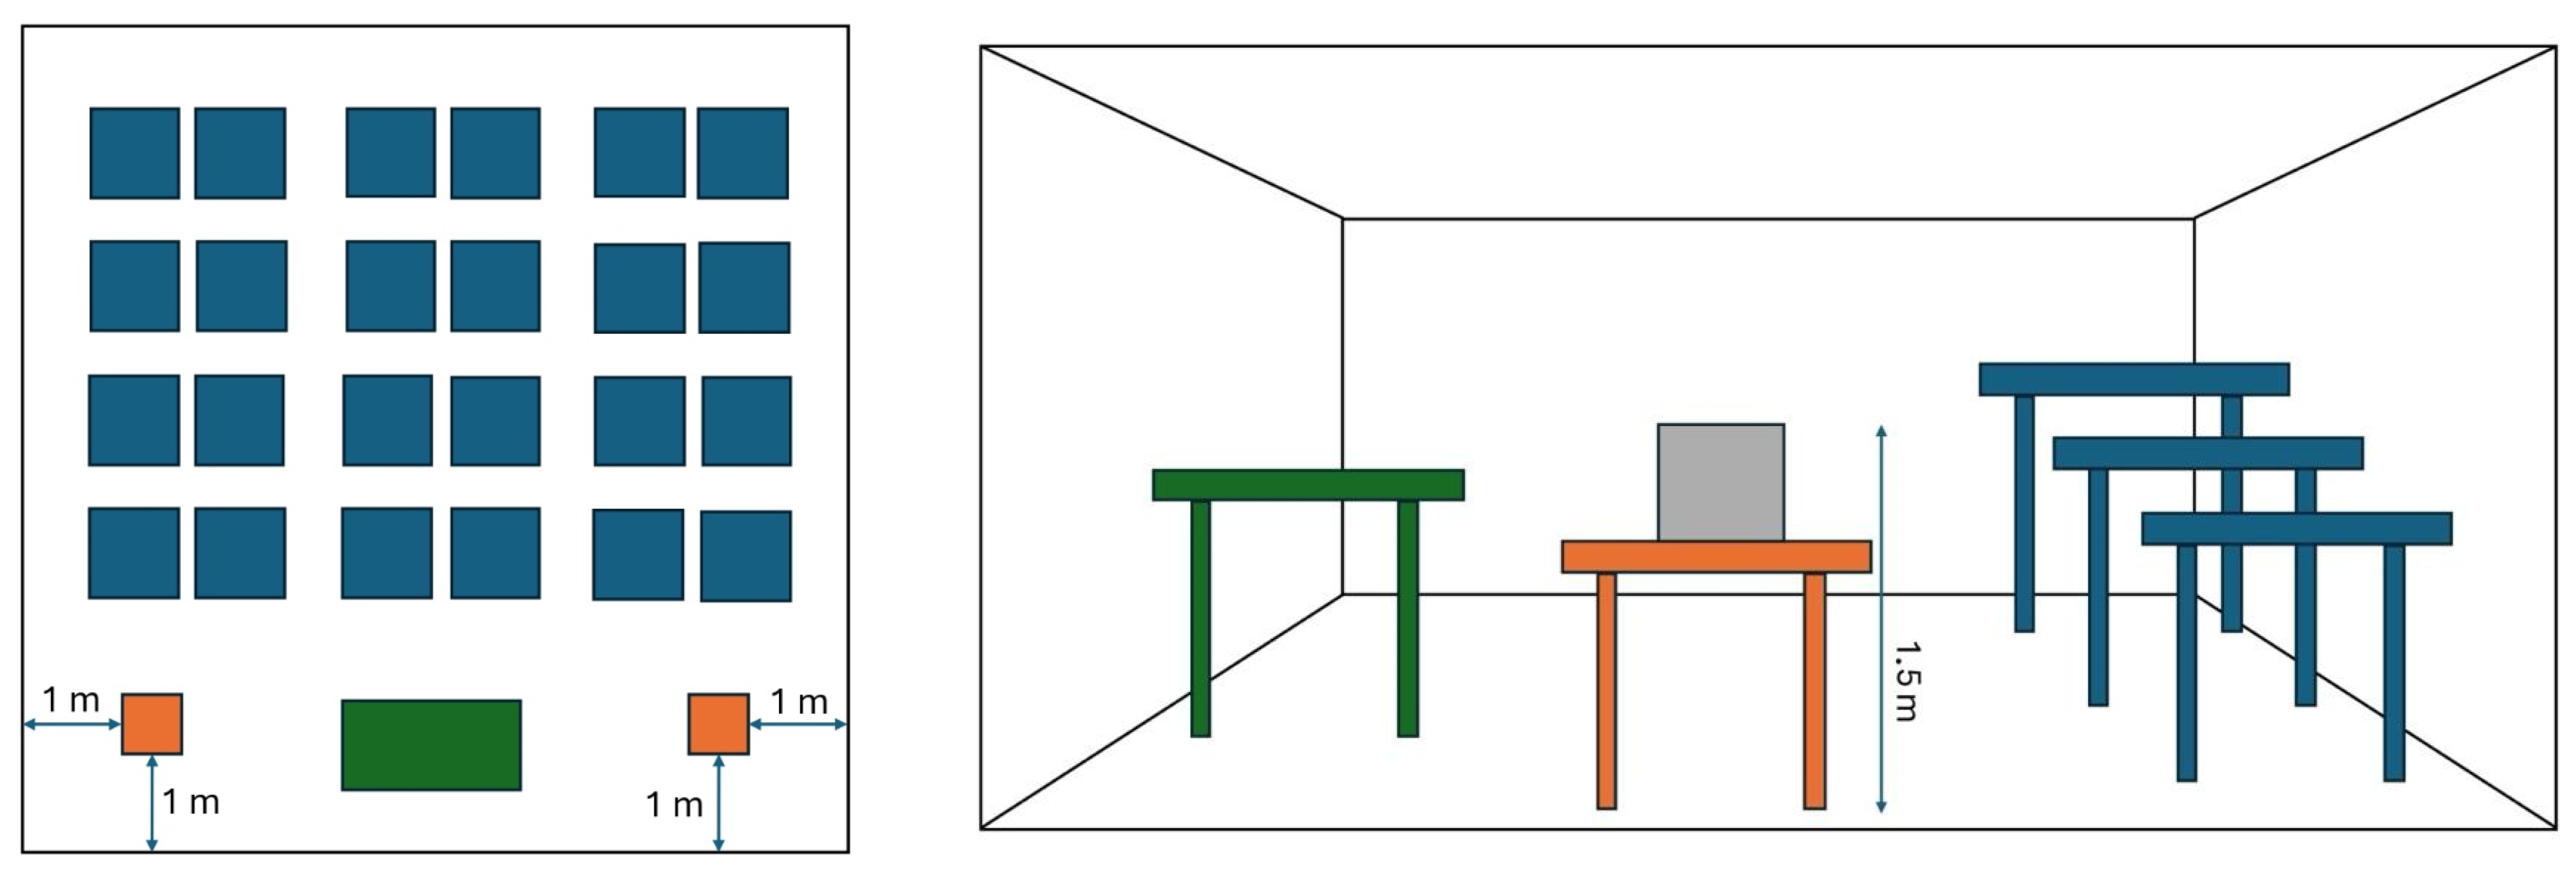
2. Materials and Methods
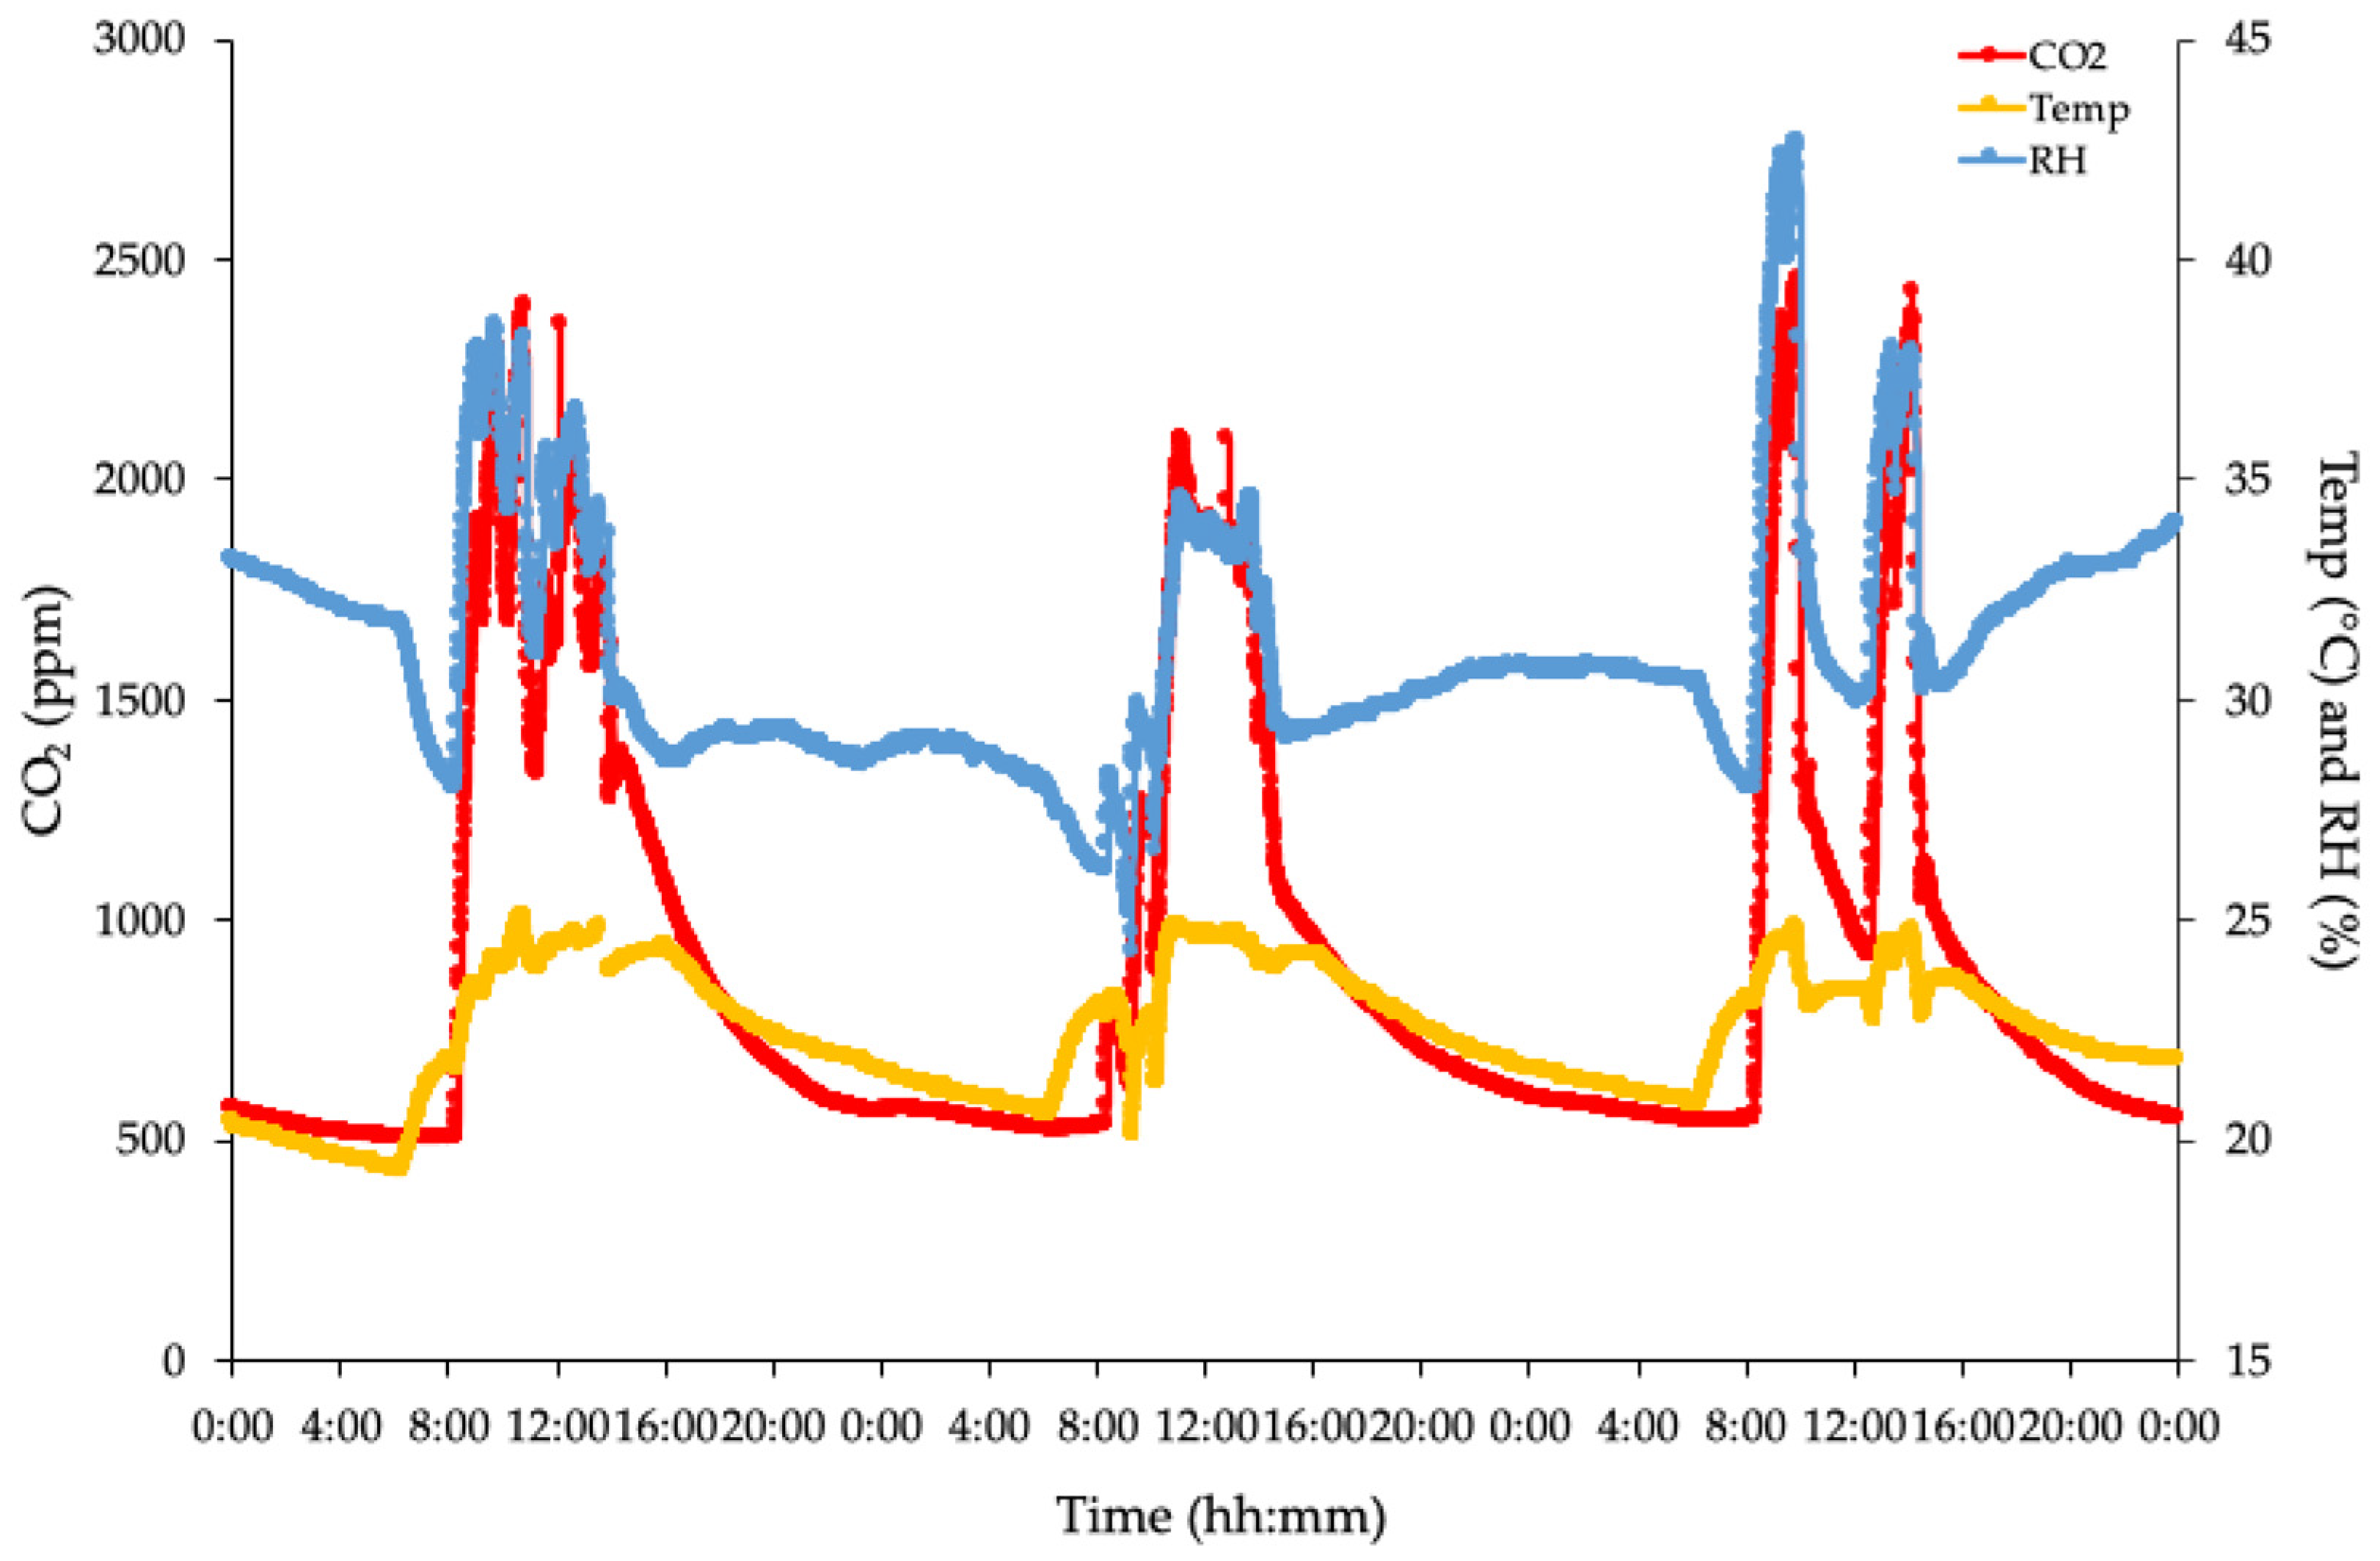
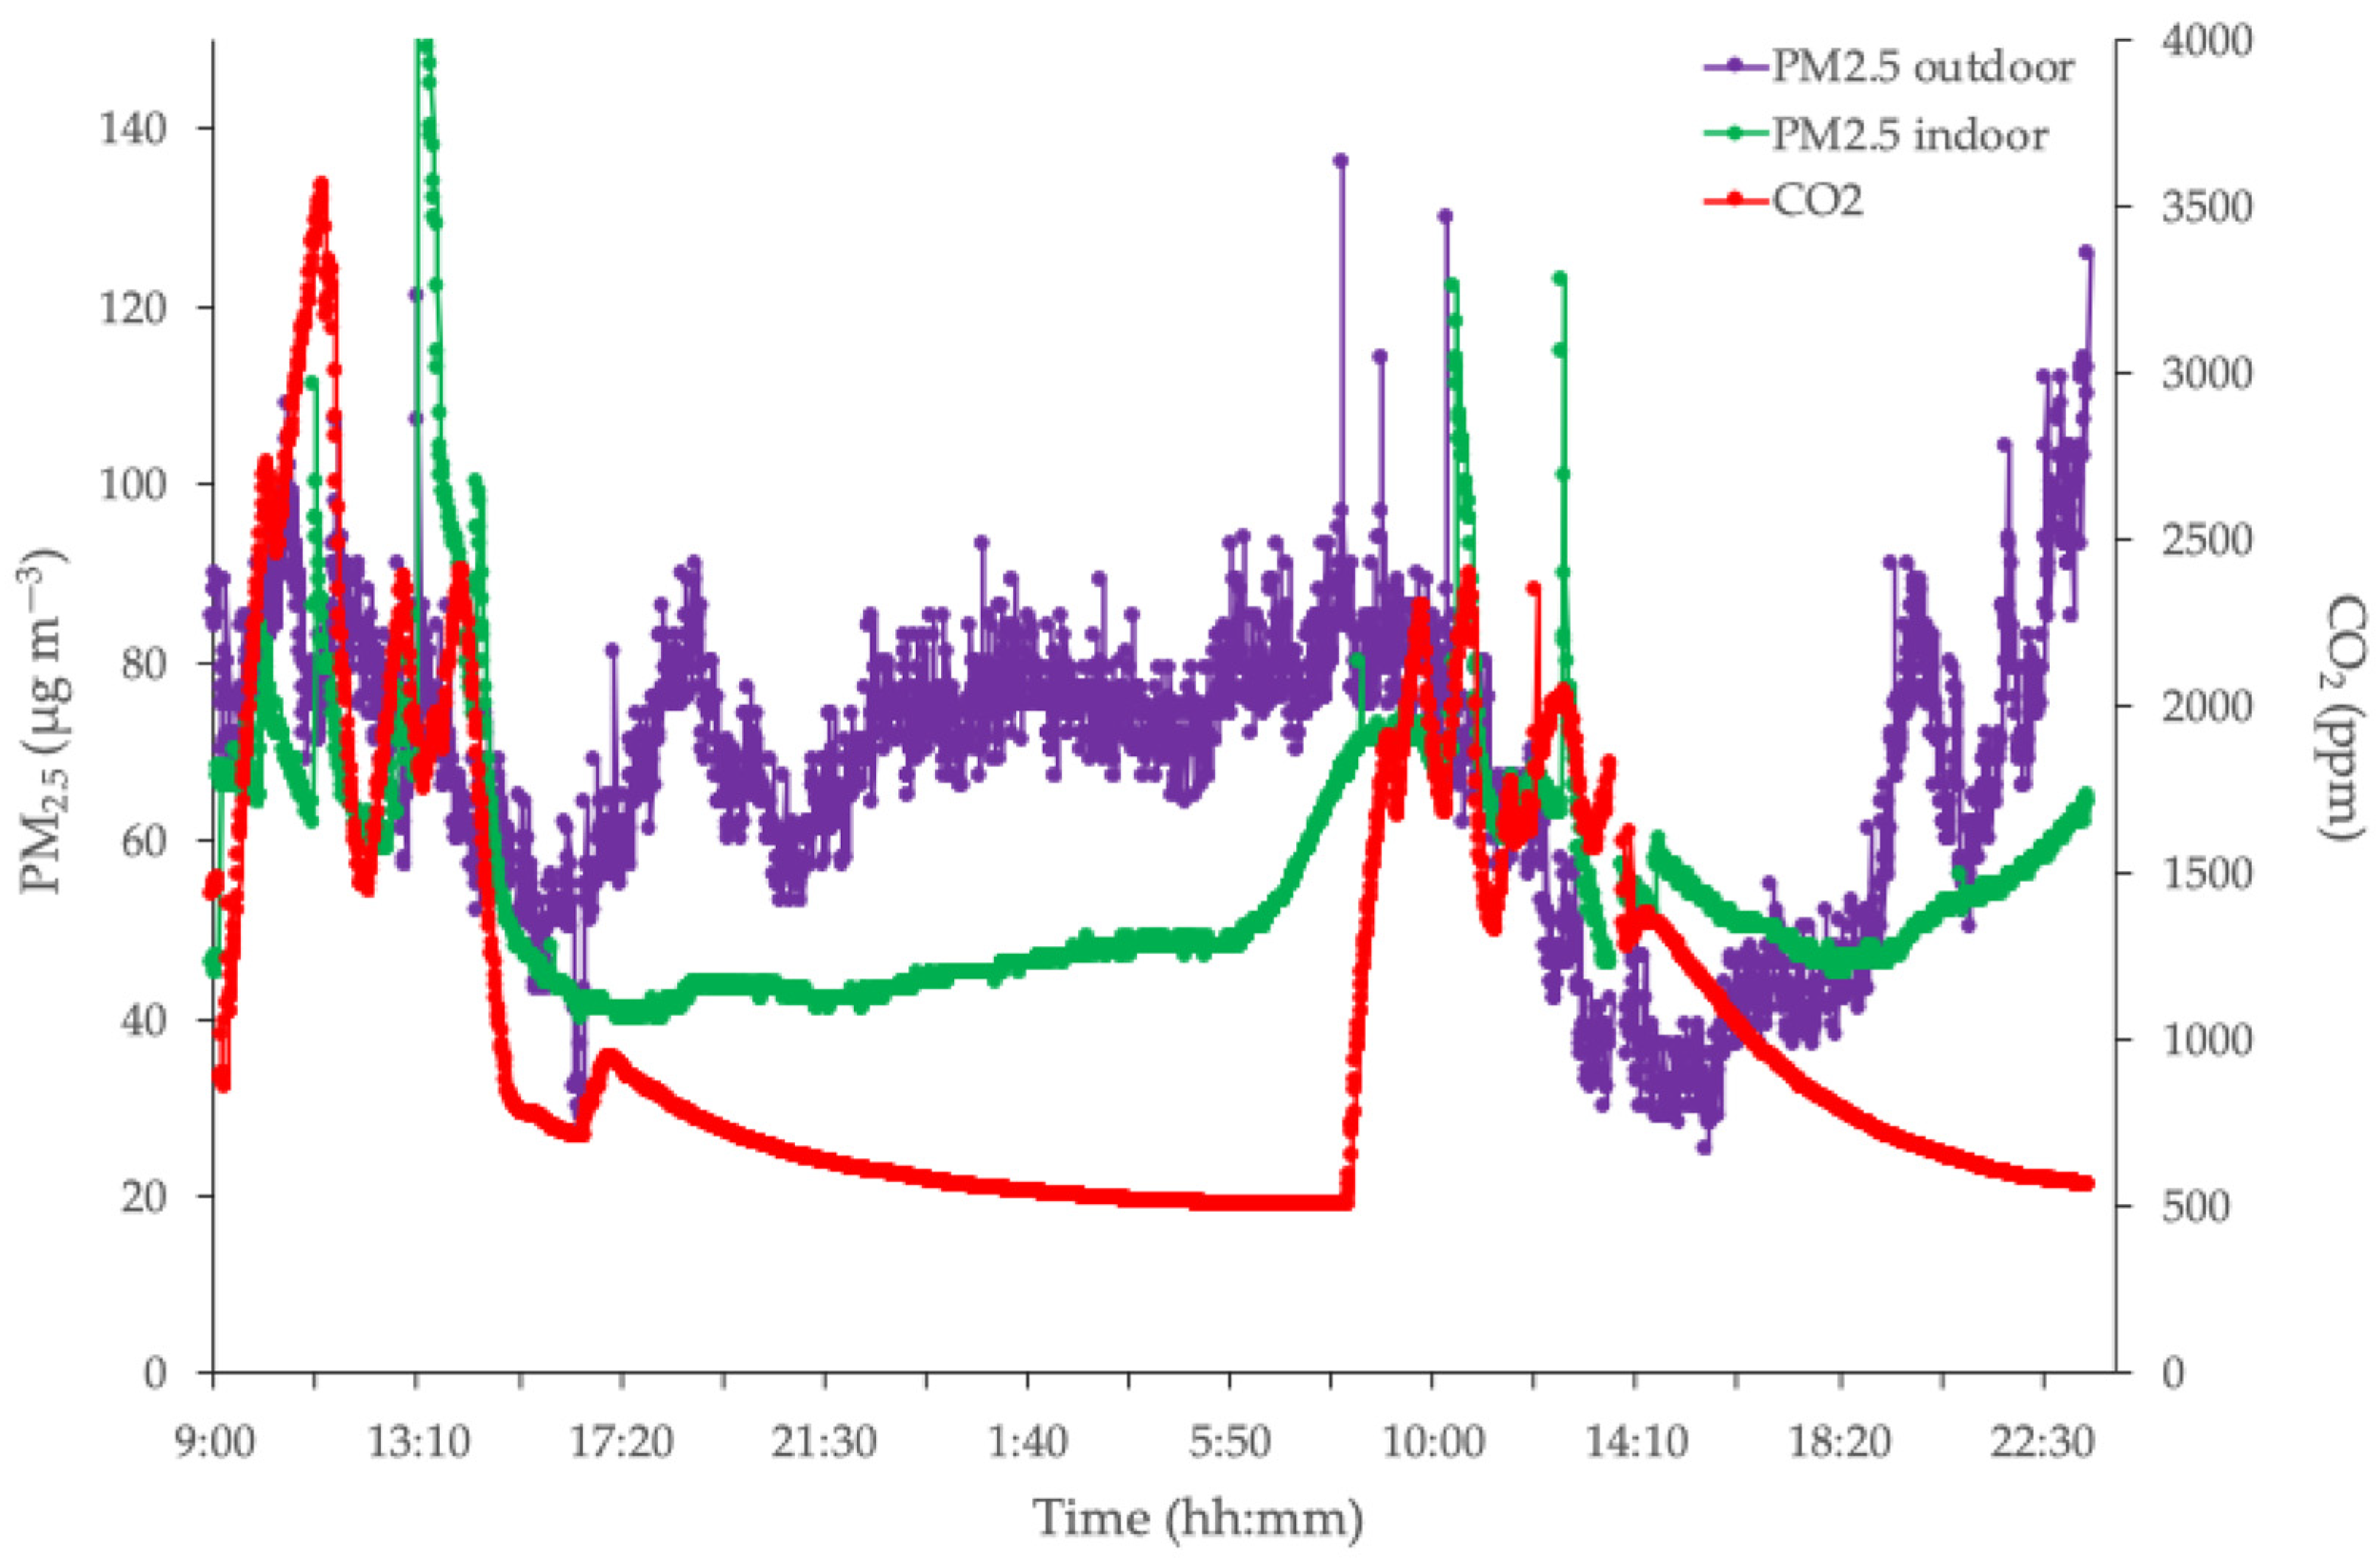
In a frame of a project aimed to evaluate the IAQ in Schools, among the different field surveys conducted to assess the presence of specific chemical pollutants such as volatile organic compounds (VOCs) including benzene, toluene, xylenes, ethylbenzene, aldehydes, and NO2, a specific focus was dedicated to CO2 and PM2.5. Particularly, over CO2, PM2.5 and microclimatic parameters (relative humidity-RH%, temperature-T °C, and air speed-m/s), data collected during one week during the school term in winter were determined and interpreted. Measurements were taken for CO2 concentration, RH%, T, and air speed to enhance the understanding of classroom conditions. Various methods and equipment were utilized for data collection, analysis, and monitoring: particulate matter (PM2.5) was analyzed by means of direct reading analyzers (mod. DustTrak) (TSI, Shoreview, MN, USA) [27]; CO2, humidity, temperature, and air speed by means of a q-track analyzer (TSI); NO2 by sampling using passive Radiello® samplers and chromatography (GC-MS, HPLC) determination. Furthermore, before sampling, it was extremely helpful to gather information and detailed characteristics of the various environments within the school building, such as the usage times and frequency of classrooms and other spaces.
About the analyzer, the DustTrak is a widely used aerosol monitor for measuring particulate matter (PM) concentrations in the air [28]. Basically, in the context of the DustTrak the precision refers to the instrument’s ability to consistently reproduce the same measurement under identical conditions whereas the accuracy refers to how close the DustTrak’s measurements are to the actual concentration of particulate matter [29]. For the first parameter, the DustTrak is known for having good precision, as it can provide consistent measurements in controlled environments or when measuring similar particulate levels [30]. On the other hand, while the DustTrak provides real-time data and is highly sensitive, its accuracy can sometimes vary, especially in environments with particles of different sizes or compositions [31,32]. This is because the DustTrak measures particulate concentrations using light scattering, which can be influenced by particle type, shape, and refractive index. Calibration with reference gravimetric samplers is often necessary to improve accuracy in specific settings [33]. In fact, a limitation of our study is that we did not assess the sensitivity of DustTrak calibration to different averaging intervals, as we lacked a higher-resolution reference instrument. For avoiding this issue, two different DustTrak were used for each sampling: both of them were calibrated the month before starting the first sampling.
The strategy used in this study responds to the ISO 16000-26 [34] sampling strategy for carbon dioxide (CO2) and the documents of the National Study Group (NSG) on indoor pollution of the ISS. These references allow comparison with other studies conducted. The choice of location is a compromise that allows us given the class layouts to be able to choose a location that can be representative. About the choice of height where putting the instrument our references were the ISO 16000 standards [34] and ISS indoor pollution NSG reports. Eight school buildings were selected for the study, with three classrooms from each school. In each classroom, surveys were conducted at one or two sampling points considered suitable for estimating indoor exposure. The optimal sampling point was typically at the center of the classroom or next to a chair, provided it was away from windows or ventilation and heating systems. This same point was used for measuring CO2 levels, humidity, temperature, and air speed. To ensure consistency, the same sampling points were used across all classrooms in the eight schools. The samplers were positioned at a height of approximately 1 to 1.5 m above the ground and at least 1 m away from any walls, continuous measurements were performed and recorded for one week (Mon–Fri). Temperature and RH were measured concurrently to improve understanding of occupancy and presence patterns. All the tests were repeated three times for a total of one month. Figure 1 shows the profile of a typical classroom investigated (average 22 pupils/students for each classroom) and the position of the instruments.
An important issue regarded the agreement between the two measurement systems involved in this study, particularly DustTrak for the outdoor measurements and the SidePack for the indoor measures. Figure 2 highlights this comparison: the agreement is good considering that the outdoor measurements were carried out in an area characterized by high traffic whereas the indoor measures were performed in different environmental situations (e.g., during school and no-activities, during closing, during room cleaning).
Using this approach, different schools (#8) in downtown Rome were investigated in terms of such parameters for evidencing how the CO2 levels changed in relationship with presence of students and teachers, environment and the spaces. The schools were chosen to be representative of Rome situation: located in historical buildings, in areas with a high density of traffic and with other buildings close to them. It should be considered that this scenario is quite similar and easy to be found in Rome.

3. Results

When carrying out the risk assessment for IAQ, the proximity of possible sources of outdoor pollution must also be taken into account: it emerged that most of the schools sampled are located in places with medium-high exposure to the pollutants derived from traffic. This aspect is attributable to the fact that most of the schools are old and therefore, at the time of construction, this problem did not arise, or that urban development followed the construction of the school.
Table 1 shows the results obtained after all the sampling. It can be seen that the coefficient of variation percentage (i.e., the ratio between standard deviation and mean value × 100) of the indoor PM2.5 concentrations is below 29% whereas the same parameter for outdoor PM2.5 outdoor is below 48%, higher than the previous one. This means that in the first case, the variability is not so large basically due to the homogeneity of the sampling location whereas in the second case the reason is the opposite. CO2 shows a mean value of 895 ppm with a maximum value of 2455 ppm: this variability, cv% of 54%, depends on different factors such as presence of activities in the classrooms, closing of the windows, etc. [15].
The further figures illustrate the variations of the concentrations of PM2.5, CO2, temperature and RH% in the classrooms during the weekly monitoring and recording in the winter season in the different campaigns. In particular, Figure 3 shows the daily fluctuations of CO2 concentrations, which are evident with peaks during the morning and afternoon hours during classroom activities (see also indoor temperatures and RH%).
These fluctuations reach peaks above 2500 ppm starting from the first hours of classroom use due to the phenomenon of CO2 accumulation from 8:30 h during the first winter period and then decrease slightly near 1300 ppm due to the opening of the windows and come up later. A similar trend is found in the second winter period with a value of 2000 ppm and then decreases below 1300 ppm whereas the windows are open. These CO2 values gradually return to baseline levels in the non-employment period. The data highlight the behavior and management of opening and closing windows in the classrooms of each school. The results are in line with several studies conducted.
Simultaneously, Figure 4 shows how the PM2.5 varies according to the carbon dioxide levels. The behavior of the indoor is strongly correlated to the emission sources present in the environment (i.e., students, activities, furniture, etc.); an increase can be noted during the first hours of the morning, when staff and students start to come in. A maximum peak occurs during the morning due to the poor ventilation (no windows opening), and an almost steady state occurs during the afternoon when other activities are present in those spaces.
Figure 5 highlights a typical situation in Rome’s schools: school activities during the morning described by low ventilation and an increase of CO2, and afternoon activities in the same spaces but with different ventilation conditions to thermal loads (e.g., windows opening, higher air exchanges). Such occurrences can be identified by the CO2 and PM2.5 indoor levels, which are high during the two mornings but quite constant (as trend) and low (as values) in the afternoon.
The PM2.5 indoor increases during the last hours of the second day can be reasonably due to the managing operations occurring in the late afternoon (e.g., cleaning procedures). In fact, the levels reached by PM2.5 indoor in this case (an increasing trend) are not surprising because also the PM2.5 outdoor values increase too much, so it is realistic to hypothesize an increase in the indoor aerosol strictly dependent on the outside conditions–infiltration.

4. Discussion

Before starting the discussion, the authors would like to underline that the results of this study were used to try to recommend a guideline value for CO2 that must take into account and should be complemented with dedicated training on indoor air quality, sources (e.g., cleaning products, furniture, decorations, school supplies, etc.), and proper management of window openings, doors, and balconies in classrooms in different weather seasons. The international literature points out that current knowledge is too limited to define a guideline value for CO2 to protect against health effects in indoor environments. Even today, it is still not possible to define a threshold for CO2 protection because of the lack of analysis on the on concentration–risk relationships [35,36].
When planning, selecting, and determining the duration of air monitoring, it is essential to first clarify the purpose, the desired outcomes, and the specific objectives of the sampling within a particular classroom, teaching laboratory, gym, environment, area, or administrative office in the school. Monitoring strategies must be developed based on the specific characteristics of each case, focusing on the pollutants likely to be present and including short-term, intermittent, or continuous sampling. These strategies should take into account the teaching and work activities of the teaching, technical, and administrative staff, the operational methods of instruction, the duration of occupancy, the state of occupancy (e.g., shared use of a classroom, laboratory, or gym by multiple classes at the same time), or non-occupancy, the presence and number of students, external staff engaged in daily cleaning or maintenance and system upgrades, as well as supplier activities. The sampling duration must consider all these factors, which can influence the representativeness of the monitoring.
The study was conducted in some classrooms located in the territory of a large Italian city, using continuous measurement systems of CO2 and PM concentration (PM10, PM2.5) during two school periods of educational activity, as part of the CCM Indoor School funded by the Ministry of Health. One of the objectives was to promote and carry out education and awareness campaigns on indoor air quality in schools, operational ways of improving and controlling outdoor air changes naturally and with mechanical systems in classrooms, and to understand what factors influence trends in CO2 and PM10 and PM2.5 concentrations. The purpose was to try to develop a national school air monitoring plan by identifying on the basis of the results by adopting strategies to control and improve indoor air quality in the shortest time.
From an operational standpoint, it is crucial to consider a wide range of factors to determine whether CO2 measurements can be deemed effective. These factors include the size of the space, timing and frequency of measurements, type of activities conducted, duration and level of occupancy, age and number of individuals, and their behavior. It is also essential to identify which actions may need to be reassessed based on the measurement results to enhance air exchange and ventilation. If necessary, adjustments to the measurement strategy should be made, such as selecting the appropriate environments or spaces, choosing the right devices or sensors with suitable technical characteristics, determining the optimal placement of these devices, and deciding on the measurement methods—whether fractional, continuous, or one-time. CO2 levels in classrooms are influenced by a complex interplay of factors including the number of students and teachers present, the nature of the activities (such as physical exertion), the characteristics and dimensions of the classrooms, how the spaces are used, the frequency and duration of door and window openings, the operation of the ventilation system, and the placement of automatic instruments or sensors.
IAQ in schools is conditioned [30,37] by a number of factors such as:
  • Number of sources (building materials, furnishings, teaching materials, cleaning products, equipment, PCs, printers, screens, scanners, or other electronic products, combustion, etc.). When the number of indoor sources is large, so will the concentrations of pollutants regardless of other factors; the age of the building/aging, level of energy efficiency of the school building; location and outdoor air quality;
  • Air exchange method-ventilation strategy (system operation consistent with the purposes and seasonality, number, shape, size and arrangement/location of the windows (which must take into account the purpose of the indoor environment).
Ventilation can take place naturally (number, shape, size and arrangement of windows, degree, duration, and opening method) or forced through the use of systems that take in outside air and introduce it into the indoor environment. In most of the buildings, especially in the new offices, the ventilation is exclusively of the forced type, which considers only the energy references. From a qualitative and quantitative point of view, ventilation should be such as not to introduce outdoor contaminants and remove/dilute indoor contaminants. This process takes place through the treatment and filtration system of the external air and the recirculation that is introduced into the indoor environments. At the moment, however, there are no legislative limits on indoor air quality levels, but various scientific works have identified the minimum ventilation rates on the basis of the WHO guide values to eliminate the effects of polluting or harmful parameters. Excessive air speed, on the other hand, can cause the detachment of pollutants from surfaces with the risk of inhalation by the occupants. Natural and forced ventilation therefore becomes an indispensable factor in order to be able to guarantee good indoor air quality and reduce the SBS phenomenon and the effects on workers’ health.
It is important to clarify that whereas CO2 measurements do not directly measure air changes, they serve as a useful indicator that indoor air is not being sufficiently replaced with fresh outdoor air. This can lead to an increased risk of infection, particularly in the context of the SARS-CoV-2 pandemic. CO2 levels, however, do not correlate with the actual presence of the virus, nor do they reflect the viral emission rates of individuals who have been in the space, since CO2 sensors do not detect COVID-19. As a result, a room with a given number of people will show the same CO2 concentration whether or not any of them are infected. Research indicates that CO2 levels can influence the aerostability of viruses [38], but it is also well known that CO2 alone is not a comprehensive IAQ measure. It does not account for other pollutants such as volatile organic compounds (VOCs), particulate matter (PM10 and PM2.5), carbon monoxide (CO), nitrogen dioxide (NO2), or biological contaminants like mold, allergens, bacteria, and viruses, all of which can be emitted from materials, furnishings, and various household products. In general, if CO2 levels consistently exceed 1000 ppmv in occupied spaces, it is a strong indication that ventilation needs to be improved. Some countries have already incorporated specific standards for CO2 concentrations into their regulations, providing clear guidelines on acceptable levels and measurement practices, which have proven invaluable in managing indoor environments effectively.
The main purpose of CO2 measurements is to identify environments with poor air changes. Historically, CO2 measurement has been considered an indicator of air changes and has not been linked to serious health outcomes until concentrations reach values above 5000 ppm or for prolonged exposures of several days. Growing evidence shows that exposures to CO2 concentrations over a period of time at common concentrations and below <3000 ppm can cause various physical or psychomotor responses, including reductions in cognitive abilities [39].
The objective of the measurements is to promote and implement operational ways of improving and controlling outdoor air changes naturally and with mechanical systems. This objective must be part of an organic vision of indoor environments in order to prevent uncomfortable situations, poor productivity, or health problems due to occupants’ exposure to various chemical, biological, and physical agents. Once again, it is emphasized that CO2 cannot be considered a single indicator of indoor air quality. Several studies have shown associations between CO2 and health symptoms [40,41,42,43,44].
The data obtained from CO2 measurement depend on a variety of factors:
Number of pupils, teachers, and conditions of use. Pupils and teachers are the main source of CO2;
Nature of activities (physical engagement);
Characteristics and size of rooms and indoor spaces;
Location of the school;
Frequency and duration of opening doors, windows and balconies;
Absence of other CO2-emitting sources, e.g., combustion;
Gear and timing of ventilation system operation.
Italy does not currently have a reference legislation on IAQ [45,46], there is a legislative delay that must be compulsorily and quickly filled, with the enactment of specific parameters containing suitable references for chemical and biological pollutants in line with those developed by WHO taking into account the type of activity carried out in school environments, the vulnerability and sensitivity of students and teaching and non-teaching staff, the levels of concentration of chemical and biological pollutants and finally the levels of exposure in such environments. The students, as they are the primary subjects to which all the cultural and educational services should be addressed and at the same time the most vulnerable because they are not yet fully developed and are constantly growing, must be subject to special attention and protection with regard to what may be the characteristics of “quality” indoor air, which is to be determined in different environments, places and functional spaces present in school buildings designed for these activities (e.g., classrooms, specialized educational workshops: multimedia, music, libraries, gyms, administrative offices, etc.). The current system of laws on health prevention and protection (Lgs.D. 81/2008) has also led to a confusion of language, a difficulty and an ambiguity of interpretation, and scope, which has not helped—and indeed has often confused and disoriented—the technicians and operators of the NHS and other interested parties (e.g., school leaders, RSPP, municipal technical offices, regional school offices, regional health offices, priority buildings, etc.) engaged in the development of programs and evaluations, influencing or slowing down the identification of specific actions for the prevention and reduction of exposure, knowledge and continuous training devoted to improving indoor air quality, and the different typical indoor environments. The European Commission has always provided useful recommendations on the subject of IAQ, as a result, in recent decades many countries have adopted regulations, drawn up national plans and adopted specific legislation, continuously carrying out air quality monitoring campaigns in schools (e.g., France), offices, hospitals, homes and subways [47]. Table 2 shows the CO2 guide values adopted by different countries in indoor [48]. It should be underlined that guide or reference values for CO2 may differ from country to country in several respects. First and foremost, the path used in drafting the guideline value e.g., method of construction, purpose, population considered, mechanisms of action and effects. Other important factors that can affect the guideline values are:
The state of knowledge at the time the guiding value was developed;
Relationship between body odor bioeffluents and CO2;
Impacts of CO2 on occupant health;
Measure of air exchange rates;
Measurement of natural and mechanical ventilation performance.
It should be noted that all of these are found in the original documents cited alongside the numerical value.
Finally, it should be considered the recent legislation on green building: the new Directive (EU) 2024/1275 of the European Parliament and of the Council of 24 April 2024 on the energy performance of buildings has much broader objectives. The internal environment and IAQ are real pillars today. It must be remembered that energy efficiency alone does not contribute much to the prevention of the health of the population of a building [60,61,62]. According to the article 2, the IAQ is the result of an assessment of the conditions within a building that affect the health and well-being of its occupants, based on parameters such as those relating to temperature, humidity, ventilation rate, and presence of contaminants.

5. Conclusions

The primary goal of CO2 measurements is to identify spaces with inadequate air circulation and to encourage the adoption of daily practices that enhance fresh air exchange, whether through natural means or mechanical systems. By doing so, effective improvement programs can be developed, and behavioral controls can be implemented from a comprehensive perspective. This proactive approach helps prevent issues related to discomfort, reduced productivity, or health problems that could arise from exposure to various chemical, biological, and physical agents, such as particulate matter (PM10, PM2.5), volatile organic compounds (VVOCs, VOCs, SVOCs), odors, bacteria, viruses, allergens, mold, humidity, and temperature fluctuations.
Measures aimed at improving air quality in schools can help prevent short-term symptoms or even severe acute forms, alleviate symptoms, limit the aggravation of a disease, and asthma attacks or episodes of anaphylaxis. In any case, they contribute to improving the quality of life of all people who regularly attend school for study or work. The size of classrooms is often insufficient and not adequate for the average number of students. The CO2 concentrations reflect the conditions of regular occupation (typically between 20–28 students and 1–2 teaching staff), crowding and the type of activity and can serve as indicators of lack of attention to the frequency and duration of changes air pollution, increasing opportunities for students to be exposed to airborne pathogens from healthy or asymptomatic carriers or even from carriers of incubating airborne diseases.
Continuous, periodic, or regularly scheduled CO2 measurements (e.g., weekly across different seasons) using automatic instruments, devices, or sensors are technically simpler than monitoring other occupant-emitted substances. However, to improve the interpretation and evaluation of the data for effective space management, it is essential to establish a well-designed measurement strategy. This strategy should carefully consider factors such as the size of the space, duration and frequency of use, type of activities, and occupancy levels. For instance, measurements taken during periods of low occupancy may reflect CO2 levels but provide a misleading assessment of risks compared to times of high occupancy.
Furthermore, to effectively utilize CO2 measurements, it is essential to include another important component in the overall prevention strategy, especially in such indoor locations: the systematic provision of targeted training, information, and awareness. This should emphasize the benefits and limitations of CO2 measurements (since they do not assess indoor air quality), outline the daily actions to be taken, and promote behaviors that will enhance the frequency of air exchanges and improve ventilation with fresh outdoor air.
Therefore, the pursuit of improving indoor air quality in schools will result in a significant lifelong benefit on the health of students, teaching staff, technical–administrative staff, staff of external and non-external companies (e.g., level education, better living conditions, growth in health knowledge, greater employment and income opportunities, reduction of inequalities in health and social poverty, etc.), some of them with specific needs (physical and mental disabilities, asthmatics and allergies, migrants and minorities), who spend most of their time in school environments.
Finally, the remarkable implication that the authors wish to reiterate is that CO2 measurements do not directly measure air exchange rates. Rather, these measurements should be viewed as a proxy indicating whether the indoor air has not been refreshed with outside air for a prolonged period regularly or effectively, potentially increasing the risk of infection.

Author Contributions

Conceptualization, G.S. and P.A.; methodology, G.S.; software, M.D.F. and A.d.C.; validation, M.I., R.M. and L.I.; formal analysis, M.I. and M.D.F.; investigation, G.S. and F.C.; resources, G.S., L.I., and A.d.C.; data curation, M.I., L.I., and C.D.F.; writing—original draft preparation, P.A.; writing—review and editing, G.S. and P.A.; visualization, G.S.; supervision, P.A.; project administration, G.S. and P.A.; funding acquisition, G.S. All authors have read and agreed to the published version of the manuscript.

Funding

The study was performed under the contract CCM-Indoor School funded by Italian Ministry of Health.

Institutional Review Board Statement

Not applicable.

Informed Consent Statement

Not applicable.

Data Availability Statement

Data is contained within the article.

Acknowledgments

The study was performed under the grant “Esposizione ad inquinanti indoor: linee guida per la valutazione dei fattori di rischio in ambiente scolastico e definizione delle misure per la tutela della salute respiratoria degli scolari e degli adolescenti (Indoor-school)”, CCM-13, financed by the Italian Ministry of Health and coordinated by the Italian National Institute of Health.

Conflicts of Interest

The authors declare no conflicts of interest.

References

  1. Stabile, L.; De Luca, G.; Pacitto, A.; Morawska, L.; Avino, P.; Buonanno, G. Ultrafine particle emission from floor cleaning products. Indoor Air 2021, 31, 63–73. [Google Scholar] [CrossRef] [PubMed]
  2. Alhussain, H.; Ghani, S.; Eltai, N.O. Breathing clean air: Navigating indoor air purification techniques and finding the ideal solution. Int. J. Environ. Res. Public Health 2024, 21, 1107. [Google Scholar] [CrossRef] [PubMed]
  3. Salonen, H.; Salthammer, T.; Castagnoli, E.; Täubel, M.; Morawska, L. cleaning products: Their chemistry, effects on indoor air quality, and implications for human health. Environ. Int. 2024, 190, 108836. [Google Scholar] [CrossRef] [PubMed]
  4. Morawska, L.; Li, Y.; Salthammer, T. Lessons from the COVID-19 pandemic for ventilation and indoor air quality. Science 2024, 385, 396–401. [Google Scholar] [CrossRef]
  5. Langiano, E.; Ferrara, M.; Falese, L.; Lanni, L.; Diotaiuti, P.; Di Libero, T.; De Vito, E. Assessment of indoor air quality in school facilities: An educational experience of pathways for transversal skills and orientation (PCTO). Sustainability 2024, 16, 6612. [Google Scholar] [CrossRef]
  6. Qutub, R.A.; Luo, Z.; Vasilikou, C.; Tavassoli, T.; Essah, E.; Marcham, H. Impacts of school environment quality on autistic pupil’s behaviours—A systematic review. Build. Environ. 2024, 265, 111981. [Google Scholar] [CrossRef]
  7. Miao, S.; Gangolells, M.; Tejedor, B. A comprehensive assessment of indoor air quality and thermal comfort in educational buildings in the Mediterranean climate. Indoor Air 2023, 2023, 6649829. [Google Scholar] [CrossRef]
  8. Branco, P.T.B.S.; Sousa, S.I.V.; Dudzińska, M.R.; Ruzgar, D.G.; Mutlu, M.; Panaras, G.; Papadopoulos, G.; Saffell, J.; Scutaru, A.M.; Struck, C.; et al. A review of relevant parameters for assessing indoor air quality in educational facilities. Environ. Res. 2024, 261, 119713. [Google Scholar] [CrossRef]
  9. Early Childhood Education Statistics. Available online: https://ec.europa.eu/eurostat/statistics-explained/index.php?title=Early_childhood_education_statistics (accessed on 12 June 2024).
  10. WHO. Literature Review on Chemical Pollutants in Indoor Air in Public Settings for Children and Overview of Their Health Effects with a Focus on Schools, Kindergartens and Day-Care Centres; Supplementary publication to the screening tool for assessment of health risks from combined exposure to multiple chemicals in indoor air in public settings for children; World Health Organization: Geneva, Switzerland, 2021. [Google Scholar]
  11. Khoshakhlagh, A.H.; Mohammadzadeh, M.; Gruszecka-Kosowska, A.; Oikonomou, E. Burden of cardiovascular disease attributed to air pollution: A systematic review. Global Health 2024, 20, 37. [Google Scholar]
  12. Wang, J.; Janson, C.; Gislason, T.; Gunnbjörnsdottir, M.; Jogi, R.; Orru, H.; Norbäck, D. Volatile organic compounds (VOC) in homes associated with asthma and lung function among adults in Northern Europe. Environ. Pollut. 2023, 321, 121103. [Google Scholar] [CrossRef]
  13. Education and Training Monitor 2023—Italy. Available online: https://op.europa.eu/webpub/eac/education-and-training-monitor-2023/en/country-reports/italy.html (accessed on 20 June 2024).
  14. Vitaliano, S.; Cascone, S.; D’Urso, P.R. Mitigating built environment air pollution by green systems: An in-depth review. Appl. Sci. 2024, 14, 6487. [Google Scholar] [CrossRef]
  15. Zauli Sajani, S.; Colaiacomo, E.; De Maio, F.; Lauriola, P.; Sinisi, L.; Gruppo SEARCH. School environment and children respiratory health: The SEARCH project. Epidemiol. Prev. 2009, 33, 239–241. [Google Scholar] [PubMed]
  16. Simoni, M.; Annesi-Maesano, I.; Sigsgaard, T.; Norback, D.; Wieslander, G.; Nystad, W.; Canciani, M.; Sestini, P.; Viegi, G. School air quality related to dry cough, rhinitis, and nasal patency in children. Eur. Respir. J. 2010, 35, 742–749. [Google Scholar] [CrossRef] [PubMed]
  17. Arya, V.K.; Rasheed, E.O.; Samarasinghe, D.A.S.; Wilkinson, S. Comparative analysis of indoor air quality and thermal comfort standards in school buildings across New Zealand with other OECD countries. Buildings 2024, 14, 1556. [Google Scholar] [CrossRef]
  18. Ismail, Z.-A. Machine learning applications for a better demand controlled ventilation system experience in buildings: A review. Open House Int. 2024, 49, 444–467. [Google Scholar] [CrossRef]
  19. Gruppo di Lavoro ISS Ambiente e Qualità Dell’aria Indoor. Indicazioni ad Interim per la Prevenzione e Gestione Degli Ambienti Indoor in Relazione Alla Trasmissione Dell’infezione da Virus SARS-CoV-2; Versione del 23 marzo 2020; Istituto Superiore di Sanità: Roma, Italy, 2020; (Rapporto ISS COVID-19, n. 5/2020). [Google Scholar]
  20. Gruppo di Lavoro ISS Ambiente e Qualità Dell’aria Indoor. Indicazioni ad Interim per la Prevenzione e Gestione Degli Ambienti Indoor in Relazione Alla Trasmissione Dell’infezione da Virus SARS-CoV-2; Versione del 21 aprile 2020; Istituto Superiore di Sanità: Roma, Italy, 2020; (Rapporto ISS COVID-19, n. 5/2020. Rev). [Google Scholar]
  21. Gruppo di Lavoro ISS Ambiente e Qualità Dell’aria Indoor. Indicazioni ad Interim per la Prevenzione e Gestione Degli Ambienti Indoor in Relazione Alla Trasmissione Dell’infezione da Virus SARS-CoV-2; Versione del 25 maggio 2020; Istituto Superiore di Sanità: Roma, Italy, 2020; (Rapporto ISS COVID-19, n. 5/2020. Rev.2). [Google Scholar]
  22. Gruppo di Lavoro ISS Ambiente e Qualità Dell’aria Indoor. Indicazioni ad Interim per la Prevenzione e Gestione Degli Ambienti Indoor in Relazione Alla Trasmissione Dell’infezione da Virus SARS-CoV-2; Versione del 18 aprile 2021; Istituto Superiore di Sanità: Roma, Italy, 2021; (Rapporto ISS COVID-19, n. 11/2021); Available online: https://www.iss.it/rapporti-covid-19/-/asset_publisher/btw1J82wtYzH/content/rapporto-iss-covid-19-n.-11-2021-indicazioni-ad-interim-per-la-prevenzione-e-gestione-degli-ambienti-indoor-in-relazione-alla-trasmissione-dell-infezione-da-virus-sars-cov-2.-aggiornamento-del-rapporto-iss-covid-19-n.-5-2020-rev.-2.-versione-del-18-aprile (accessed on 10 September 2024).
  23. New Coronavirus. Advice for Closed Environments. Available online: https://www.iss.it/documents/20126/0/Poster+INDOOR_r+%282%29.pdf/5d94072b-af95-fb36-a522-e63a3ea8d8cc?t=1584100070035 (accessed on 12 June 2024).
  24. Horne, J.; Dunne, N.; Singh, N.; Safiuddin, M.; Esmaeili, N.; Erenler, M.; Ho, I.; Luk, E. Building parameters linked with indoor transmission of SARS-CoV-2. Environ. Res. 2023, 2381, 117156. [Google Scholar] [CrossRef]
  25. Murphy, J.; Tharumakunarajah, R.; Holden, K.A.; King, C.; Lee, A.R.; Rose, K.; Hawcutt, D.B.; Sinha, I.P. Impact of indoor environment on children’s pulmonary health. Expert. Rev. Respir. Med. 2023, 17, 1249–1259. [Google Scholar] [CrossRef]
  26. WHO-CERN. Indoor Airborne Risk Assessment in the Context of SARS-CoV-2 Description of Airborne Transmission Mechanism and Method to Develop a New Standardized Model for Risk Assessment; WHO-CERN: Genève, Switzerland, 2024. [Google Scholar]
  27. Manigrasso, M.; Natale, C.; Vitali, M.; Protano, C.; Avino, P. Pedestrians in traffic environments: Ultrafine particle respiratory doses. Int. J. Environ. Res. Public Health 2017, 14, 288. [Google Scholar] [CrossRef]
  28. Kim, J.Y.; Magari, S.R.; Herrick, R.F.; Smith, T.J.; Christiani, D.C. Comparison of fine particle measurements from a direct-reading instrument and a gravimetric sampling method. J. Occup. Environ. Hyg. 2004, 1, 707–715. [Google Scholar] [CrossRef]
  29. Settimo, G.; Indinnimeo, L.; Inglessis, M.; De Felice, M.; Morlino, R.; di Coste, A.; Fratianni, A.; Avino, P. Indoor air quality levels in schools: Role of student activities and no activities. Int. J. Environ. Res. Public Health 2020, 17, 6695. [Google Scholar] [CrossRef]
  30. Rivas, I.; Mazaheri, M.; Viana, M.; Moreno, T.; Clifford, S.; He, C.; Bischof, O.F.; Martins, V.; Reche, C.; Alastuey, A.M.; et al. Identification of technical problems affecting performance of DustTrak DRX aerosol monitors. Sci. Total Environ. 2017, 584, 849–855. [Google Scholar] [CrossRef] [PubMed]
  31. Wang, Z.; Calderón, L.; Patton, A.P.; Sorensen Allacci, M.; Senick, J.; Wener, R.; Andrews, C.J.; Mainelis, G. Comparison of real-time instruments and gravimetric method when measuring particulate matter in a residential building. J. Air Waste Manag. Assoc. 2016, 66, 1109–1120. [Google Scholar] [CrossRef] [PubMed]
  32. Moazami, T.N.; Svendsen, K.H.; Buhagen, M.; Jørgensen, R.K. Comparing PM2.5, respirable dust, and total dust fractions using real-time and gravimetric samples in an exposure chamber study. Heliyon 2023, 9, e16127. [Google Scholar] [CrossRef] [PubMed]
  33. Li, Z.; Che, W.; Lau, A.K.H.; Fung, J.C.H.; Lin, C.; Lu, X. A feasible experimental framework for field calibration of portable light-scattering aerosol monitors: Case of TSI DustTrak. Environ. Pollut. 2019, 255, 113136. [Google Scholar] [CrossRef]
  34. International Standard ISO 16000-1:2004; Indoor Air—Part 1: General Aspects of Sampling Strategy Edition 1, 2004. Available online: https://www.iso.org/standard/39844.html (accessed on 3 November 2023).
  35. Rodeheffer, C.D.; Chabal, S.; Clarke, J.M.; Fothergill, D.M. Acute exposure to low-to-moderate carbon dioxide levels and submariner decision making. Aerosp. Med. Hum. Perform. 2018, 89, 520–525. [Google Scholar] [CrossRef]
  36. Mendell, M.J.; Chen, W.; Ranasinghe, D.R.; Castorina, R.; Kumagai, K. Carbon dioxide guidelines for indoor air quality: A review. J. Expo. Sci. Environ. Epidemiol. 2024, 34, 555–569. [Google Scholar] [CrossRef]
  37. De Marco, R.; Bugiani, M.; Cazzoletti, L.; Carosso, A.; Accordini, S.; Buriani, O.; Carrozzi, L.; Dallari, R.; Giammanco, G.; Ginesu, F.; et al. The control of asthma in Italy. A multicentre descriptive study on young adults with doctor diagnosed current asthma. Allergy 2003, 58, 221–228. [Google Scholar] [CrossRef]
  38. Haddrell, A.; Oswin, H.; Fernandez, M.O.; Robinson, J.F.; Cogan, T.; Alexander, R.; Mann, J.F.S.; Hill, D.; Finn, A.; Davidson, A.D.; et al. Ambient carbon dioxide concentration correlates with SARS-CoV-2 aerostability and infection risk. Nature Commun. 2024, 15, 3487. [Google Scholar] [CrossRef]
  39. Du, B.; Tandoc, M.C.; Mack, M.L.; Siegel, J.A. Indoor CO2 concentrations and cognitive function: A critical review. Indoor Air 2020, 30, 1067–1082. [Google Scholar] [CrossRef]
  40. Satish, U.; Mendell, M.J.; Shekhar, K.; Hotchi, T.; Sullivan, D.; Streufert, S.; Fisk, W.J. Is CO2 an indoor pollutant? Direct effects of low-to-moderate CO2 concentrations on human decision-making performance. Environ. Health Perspect. 2012, 120, 1671–1677. [Google Scholar] [CrossRef]
  41. Persily, A.; de Jonge, L. Carbon dioxide generation rates for building occupants. Indoor Air 2017, 278, 868–879. [Google Scholar] [CrossRef] [PubMed]
  42. Seppänen, O.A.; Fisk, W.J.; Mendell, M.J. Association of ventilation rates and CO2 concentrations with health and other responses in commercial and institutional buildings. Indoor Air 1999, 9, 226–252. [Google Scholar] [CrossRef]
  43. Guais, A.; Brand, G.; Jacquot, L.; Karrer, M.; Dukan, S.; Grévillot, G.; Molina, T.J.; Bonte, J.; Regnier, M.; Schwartz, L. Toxicity of carbon dioxide: A review. Chem. Res. Toxicol. 2011, 24, 2061–2070. [Google Scholar] [CrossRef] [PubMed]
  44. Annesi-Maesano, I.; Baiz, N.; Banerjee, S.; Rudnai, P.; Rive, S. Indoor air quality and sources in schools and related health effects. J. Toxicol. Environ. Health B Crit. Rev. 2013, 16, 491–550. [Google Scholar] [CrossRef] [PubMed]
  45. Settimo, G.; Manigrasso, M.; Avino, P. Indoor air quality: A focus on the European legislation and state-of-the-art research in Italy. Atmosphere 2020, 11, 370. [Google Scholar] [CrossRef]
  46. Settimo, G.; Yu, Y.; Gola, M.; Buffoli, M.; Capolongo, S. Challenges in IAQ for indoor spaces: A Comparison of the reference guideline values of indoor air pollutants from the governments and international institutions. Atmosphere 2023, 14, 633. [Google Scholar] [CrossRef]
  47. Michelot, N.; Marchand, C.; Ramalho, O.; Delmas, V.; Carrega, M. Monitoring indoor air quality in French schools and day-care centres. HVAC&R Res. 2013, 19, 1083–1089. [Google Scholar]
  48. Settimo, G.; Bertinato, L.; Martuzzi, M.; Inglessis, M.; D’Ancona, F.; Soggiu, M.; Brusaferro, S. CO2 Monitoring for Prevention and Management in Indoor Environments in Relation to the Transmission of SARS-CoV-2 Virus Infection; English Version; Interim Technical Note; Istituto Superiore di Sanità: Rome, Italy, 2022. [Google Scholar]
  49. Belgium. 6 November 2022. Loi Relative à L’amélioration de la Qualité de L’air Intérieur Dans les Lieux Fermés Accessibles au Public. Service Public Federal Sante Publique, Securite De La Chaine Alimentaire Et Environnement. Moniteur Belge 1-12-2022. Available online: https://www.health.belgium.be/fr/vers-un-cadre-legal-pour-la-qualite-de-lair-interieur#:~:text=La%20loi%20a%20pour%20objet,ou%20purement%20la%20sphère%20professionnelle (accessed on 29 September 2024).
  50. Finland. Classification for Indoor Environment 2018, Finnish Society of Indoor Air Quality and Climate, FISIAQ. Espoo, Finland, The Building Information Foundation RTS sr, Helsinki, Finland. Available online: https://finvac.org/wp-content/uploads/2020/06/Opas_ilmanvaihdon_mitoitukseen_muissa_kuin_asuinrakennuksissa_LUONNOS18062019.pdf (accessed on 29 September 2024).
  51. France. Haut Conseil de la Santé Publique-HCSP. Avis du 28 Avril 2021 Relatif à L’adaptation des Mesures D’aération, de Ventilation et de Mesure du Dioxyde de Carbone (CO2) Dans les éTablissements Recevant du Public (ERP) Pour maîtriser la Transmission du SARS-CoV-2. Available online: https://www.hcsp.fr/explore.cgi/avisrapportsdomaine?clefr=1009 (accessed on 29 September 2024).
  52. France. Haut Conseil de la Santé Publique-HCSP. Avis du 21 Janvier 2022 Relatif à la Mesure du Dioxyde de Carbone (CO2) Dans les Établissements Recevant du Public (ERP) Pour Maîtriser la Transmission du SARS-CoV-2. Available online: https://www.hcsp.fr/explore.cgi/avisrapportsdomaine?clefr=1154 (accessed on 29 September 2024).
  53. France. Arrêté du 27 Décembre 2022 Modifiant L’arrêté du 1er juin 2016 Relatif aux Modalités de Surveillance de la Qualité de L’air Intérieur Dans Certains Établissements Recevant du Public. Journal Officiel de la République Française, 29 Décembre 2022. Available online: https://www.legifrance.gouv.fr/jorf/id/JORFTEXT000046829603 (accessed on 29 September 2024).
  54. France. Décret no 2022-1690 du 27 Décembre 2022 Modifiant le Décret no 2012-14 du 5 Janvier 2012 Relatif à L’évaluation des Moyens D’aération et à la Mesure des Polluants Effectuées au Titre de la Surveillance de la Qualité de L’air Intérieur de Certains Établissements Recevant du Public. Journal Officiel de la République Française, 29 décembre 2022. Available online: https://www.legifrance.gouv.fr/jorf/id/JORFTEXT000046829352#:~:text=2012%20relatif%20...-,Décret%20n°%202022%2D1690%20du%2027%20décembre%202022%20modifiant,certains%20établissements%20recevant%20du%20public (accessed on 29 September 2024).
  55. The Netherlands. National Institute for Public Health and the Environment-RIVM. Ventilatie en COVID-19 Notitie bij LCI-richtlijn COVID-19. Notitie 3 juni 2021, wijziging 21 december 2021. Available online: https://lci.rivm.nl/aerogene-transmissie-sars-cov-2 (accessed on 29 September 2024).
  56. Portugal. Diário da República, 1.a Série. Saúde e Ambiente e Ação Climática Portaria no 138- G/2021 de 1 de Julho. Available online: https://diariodarepublica.pt/dr/detalhe/portaria/138-g-2021-166296490 (accessed on 29 September 2024).
  57. Instituto Nacional de Seguridad y Salud en el Trabajo (INSST). La Ventilación Como Medida Preventiva Frente al Coronavirus SARS-CoV-2. Documento Técnico. 2021. Available online: https://www.insst.es/noticias-insst/la-ventilacion-como-medida-preventiva-frente-al-coronavirus-sars-cov-2 (accessed on 29 September 2024).
  58. United Kingdom. UK BB101-Department for Education (DfE). Guidelines on Ventilation, Thermal Comfort and Indoor Air Quality in Schools, UK. 2018. Available online: https://www.gov.uk/government/publications/building-bulletin-101-ventilation-for-school-buildings (accessed on 29 September 2024).
  59. Centers for Disease Control and Prevention-CDC. Ventilation in Buildings. Update 12 May 2023. Available online: https://www.cdc.gov/coronavirus/2019-ncov/community/ventilation.html (accessed on 29 September 2024).
  60. WHO Guidelines for Indoor Air Quality: Selected Pollutants. Available online: https://iris.who.int/bitstream/handle/10665/260127/9789289002134-eng.pdf (accessed on 25 June 2024).
  61. WHO Global Air Quality Guidelines: Particulate Matter (PM2.5 and PM10), Ozone, Nitrogen Dioxide, Sulfur Dioxide and Carbon Monoxide. Available online: https://iris.who.int/handle/10665/345329 (accessed on 29 September 2024).
  62. Settimo, G.; Avino, P. The dichotomy between indoor air quality and energy efficiency in light of the onset of the COVID-19 pandemic. Atmosphere 2021, 12, 791. [Google Scholar] [CrossRef]
Figure 1. Layout (above and frontal layout sections) of a typical classroom and the related positions of the sampler (blue: student desk; green; teacher desk; orange: instrument desk).
Sustainability 16 08619 g001
Figure 2. Comparison between a DustTrak monitor for measuring outdoor aerosol (blue line) and a SidePack monitor for measuring indoor aerosol (orange line). The correlation equation between the two data sets is y = 1.137x − 0.861 whereas the agreement (as R2) is 0.811.
Sustainability 16 08619 g002
Figure 3. Typical CO2 fluctuations (ppm) during school and no-school activities in relationship with the temperature (T °C) and relative humidity (RH %) changes.
Sustainability 16 08619 g003
Figure 4. Typical PM2.5 indoor behavior related to the PM2.5 outdoor and CO2 levels.
Sustainability 16 08619 g004
Figure 5. Two-days trends of CO2 and PM2.5 indoor and outdoor in a Rome school where different activities are present in the morning and in the afternoon.
Sustainability 16 08619 g005
Table 1. Levels of PM2.5 indoor and outdoor along with CO2, temperature and relative humidity (RH) (# 7200 samplings).
PM2.5 Indoor
(µg m−3)
PM2.5 Outdoor
(µg m−3)
CO2
(ppm)
Temp
(°C)
RH
(%)
mean53.687.0894.422.431.1
median49.077.0657.022.430.6
minimum34.025.0503.019.324.3
maximum123.0284.02455.025.142.7
st. deviation15.447.7482.51.52.7
cv% 128.754.853.96.58.6
60th percentile53.088.0770.822.930.8
90th percentile74.0159.01821.424.434.2
95th percentile83.0198.01970.024.636.5
99th percentile105.0212.02286.524.840.5
1 cv% coefficient of variation.
Table 2. Guideline values of CO2 in an indoor environment in the laws of the various countries [48].
Country/AreaGuideline Values
European country
Belgium1620 mg m−3 (900 ppmv) for 8 h [49]
2160 mg m−3 (1200 ppmv) for 8 h [49]
FinlandS1 1350 mg m−3 (750 ppmv) [50]
S2 1710 mg m−3 (950 ppmv) [50]
France1440 mg m−3 (800 ppmv) [51,52,53,54]
1800 mg m−3 (1000 ppmv) [51,52,53,54]
Germany1800 mg m−3 (1000 ppmv)
<1800 mg m−3 (1000 ppmv) harmless concentration;
between 1800 mg m−3 (1000 ppmv)* and 3600 mg m−3 (2000 ppmv)* high concentration
>3600 mg m−3 (2000 ppmv) unacceptable concentration
Norway1800 mg m−3 (1000 ppmv)
The NetherlandsSchools and new buildings: 1710 mg m−3 (950 ppmv) [55]
2160 mg m−3 (1200 ppmv) [55]
Portugal1800 mg m−3 (1000 ppmv) [56]
2250 mg m−3 (1250 ppmv) [56]
Spain1440 mg m−3 (800 ppmv) [57]
1800 mg m−3 (1000 ppmv) [57]
World country
Brazil1800 mg m−3 (1000 ppmv)
Canada1800 mg m−3 (1000 ppmv)
Japan1800 mg m−3 (1000 ppmv)
schools: 2700 mg m−3 (1500 ppmv) average concentration during the school day
Hong Kong1440–1800 mg m−3 (800–1000 ppmv)* for 8 h
United Kingdom1800 mg m−3 (1000 ppmv)*, level used if the objective is energy saving
972 mg m−3 (1750 ppmv)* restored building schools [58]
1800 mg m−3 (1000 ppmv)* during the period of occupation
(classrooms equipped with VMC and VMC + natural ventilation)
2700 mg m−3 (1500 ppmv)* for more than 20 consecutive minutes every day (classrooms with natural ventilation)
3600 mg m−3 (2000 ppmv)* maximum concentration which must not be exceeded for more than 20 consecutive minutes each day (classrooms with natural ventilation)
Republic of Korea1800 mg m−3 (1000 ppmv)*
Singapore1800 mg m−3 (1000 ppmv)* for 8 h
United StatesCDC 1440 mg m−3 (800 ppmv) [59]
ASHRAE 1800 mg m−3 (1000 ppmv)
According to the ASHRAE 62.1:2016 standard, the limit value for the acceptability of IAQ is set equal to a difference between indoor and outdoor CO2 concentration of 1260 mg m−3 (700 ppmv) and corresponds to ventilation conditions considered uncomfortable by about 20 % of the people present;
1800 mg m−3 (1000 ppmv) Illinois
Taiwan1800 mg m−3 (1000 ppmv)*
* Where the reference document does not report the conversion factor mg m−3 to ppmv for CO2, the World Health Organization (WHO) conversion factors reported in the guidelines for indoor air quality [58] have been used: at 25 °C and 760 mmHg, 1 mg m−3 = 0.556 ppmv; 1 ppmv = 1.8 mg m−3.
Disclaimer/Publisher’s Note: The statements, opinions and data contained in all publications are solely those of the individual author(s) and contributor(s) and not of MDPI and/or the editor(s). MDPI and/or the editor(s) disclaim responsibility for any injury to people or property resulting from any ideas, methods, instructions or products referred to in the content.

