Article

Carbon Peak Control Strategies and Pathway Selection in Dalian City: A Hybrid Approach with STIRPAT and GA-BP Neural Networks

1
College of Management, Shenyang Jianzhu University, Shenyang 110168, China
2
Centre for Infrastructure Engineering, Western Sydney University, Penrith, NSW 2751, Australia
3
Centre for Infrastructure Engineering and Safety, School of Civil and Environmental Engineering, The University of New South Wales, Sydney, NSW 2052, Australia
4
Multidisciplinary Center for Infrastructure Engineering, Shenyang University of Technology, Shenyang 110870, China
*
Authors to whom correspondence should be addressed.
Sustainability 2024, 16(19), 8657; https://doi.org/10.3390/su16198657
Submission received: 3 September 2024 / Revised: 1 October 2024 / Accepted: 4 October 2024 / Published: 7 October 2024

Abstract

:
Mitigating the rate of global warming is imperative to preserve the natural environment upon which humanity relies for survival; greenhouse gas emissions serve as the principal driver of climate change, rendering the promotion of urban carbon peaking and carbon neutrality a crucial initiative for effectively addressing climate change and attaining sustainable development. This study addresses the inherent uncertainties and complexities associated with carbon dioxide emission accounting by undertaking a scenario prediction analysis of peak carbon emissions in Dalian, utilizing the STIRPAT model in conjunction with a GA-BP neural network model optimized through a genetic algorithm. An analysis of the mechanisms underlying the influencing factors of carbon emissions, along with the identification of the carbon emission peak, is conducted based on carbon emission accounting derived from nighttime lighting data. The GA-BP prediction model exhibits significant advantages in addressing the nonlinear and non-stationary characteristics of carbon emissions, attributable to its robust mapping capabilities and probabilistic analysis proficiency. The findings reveal that energy intensity, tertiary industry value, resident population, and GDP are positively correlated with carbon emissions in Dalian, ranked in order of importance. In contrast, population density significantly reduces emissions. The GA-BP model predicts carbon emissions with 99.33% accuracy, confirming its excellent predictive capability. The recommended strategy for Dalian to achieve its carbon peak at the earliest is to adopt a low-carbon scenario, with a forecasted peak of 191.79 million tons by 2033.

1. Introduction

Addressing climate change and environmental pollution has been a longstanding global concern, with cities functioning as pivotal hubs for human energy activities and greenhouse gas emissions. Mitigating the impact of global climate change is critically important. Globally, urban areas account for 75–80% of total carbon emissions, a figure that rises to approximately 80% in China [1,2], primarily driven by urban economic activities, construction, and transportation. To confront this challenge, the Paris Agreement highlights the urgency of peaking global greenhouse gas emissions quickly to limit the rise in average global temperature to 2 °C above pre-industrial levels, with efforts to cap it at 1.5 °C [3]. In response, over 130 countries and regions have set targets for carbon peaking and neutrality. In 2020, China committed to ambitious policy measures, aiming for carbon peaking by 2030 and carbon neutrality by 2060.
Within both international and domestic frameworks, we begin by refining the macro perspective established by prior scholars, specifically focusing on nations or provinces, and then break down carbon emission reduction targets into more precise local administrative regions, including districts, cities, and counties. Additionally, the emission factor methodology, frequently used by earlier researchers, operates on a macro-level accounting scope, making the acquisition of micro-level data challenging. To address this, we adopt a novel measurement technique, i.e., nighttime lighting data fitting, to systematically quantify the historical carbon emissions of the city. We further analyze the mechanisms driving carbon emissions within urban areas to accurately forecast future peaks and peak years using machine learning methodologies. By combining this new measurement method (nighttime lighting data fitting) with a scientific accounting of the city’s historical carbon emissions and a comprehensive analysis of the factors influencing emissions at both urban and regional levels, we can make more reliable predictions about future carbon emission peaks and peak years through machine learning. This approach not only clarifies the pathways to reaching peak emissions but also proposes targeted carbon emission control strategies, offering significant research value on both national and global scales.
This paper presents three key contributions, detailed as follows: (1) Dalian, Liaoning Province, a historically significant industrial city with a strong economy, has amassed substantial innovative resources and fostered high-quality development in sectors such as manufacturing and digital technology. However, the vitality of its industrial economy also places pressure on the environment, and its role as an energy importer highlights the need to balance environmental protection with economic growth. As a result, the research findings are highly representative. (2) This study adapts a well-regarded predictive method (the GA-BP model) from other fields and integrates it with the STIRPAT model to comprehensively examine the mechanisms driving urban carbon emissions. This approach addresses issues related to selecting constraining variables and mitigating model construction errors, thereby enhancing the analysis of factors affecting carbon emissions. (3) The combination of quantitative machine learning methods and qualitative scenario analysis improves the accuracy of predictions regarding the nonlinearity and non-stationarity of future carbon emissions. From these perspectives, this study serves as a valuable reference for developing intervention policies to promote sustainable urban development.
The following overview of the article’s structure is intended to enhance clarity. Section 1 introduces the background and key contributions of the article. Section 2 provides a literature review, summarizing current research progress, identifying research gaps, and proposing future research directions. Section 3 describes the data and research methodology, detailing the models and methods used, as well as the sources and processing of data. Section 4 analyzes the research results, focusing on the mechanisms influencing carbon emissions and predicting carbon peak trends. Section 5 presents the discussion, comparing the findings with previous studies and addressing the necessity and innovation of this research. Section 6 offers the conclusion, drawing on the research findings. Section 7 provides policy recommendations aimed at improving the effectiveness and efficiency of carbon emission reduction in Dalian, in line with sustainable development strategies. Section 8 addresses the research limitations and outlines future directions to overcome these shortcomings.

2. Literature Review

Previous studies suggest that certain provinces and cities are expected to peak by 2030, especially in the eastern region, followed by the central region, with the western region reaching its peak the latest [4]. Regarding individual cities studied in the past, Pang et al. [5] predicted that Fujian Province would peak in 2033, while Li et al. [6] projected a peak in 2040, highlighting substantial regional variation in the timing of carbon peaks. In addition to regional heterogeneity, another crucial factor contributing to differences in regional carbon peak times is the use of distinct methodologies for carbon emission accounting and forecasting in existing studies. These forecasting approaches vary in accuracy and stability, potentially leading to erroneous predictions and biases.
Currently, established methodologies for carbon emission accounting include the emission factor method [7], the mass balance method [8,9], and the actual measurement method [10]. While these methods provide a robust framework for calculation, they require intricate and comprehensive datasets. A novel method of remote-sensing data estimation [11,12,13,14] has since been proposed, and it is becoming increasingly prevalent in carbon emission research due to the strong positive correlation between the light gray values of spatial imagery and carbon emissions. This method is favored because the processing of spatial image data is both simple and accurate for simulating carbon emissions.
Research methodologies for predicting carbon emissions in existing studies are primarily classified into the following two major categories: (1) the influencing factor decomposition method and (2) artificial intelligence and machine learning. The influencing factor decomposition method typically involves using multiple elements from different dimensions that show strong correlations with carbon emissions as influencing factors. Relevant quantitative analysis is conducted to assess the importance of each factor and generate scenario forecasts. Specific models used in this approach include the IPAT model (Environmental Impact, Population, Affluence, Technology), the STIRPAT model [15,16,17], the system dynamics model [18], and the Logarithmic Mean Divisia Index model (LMDI) [19,20,21]. Notably, the STIRPAT model, a derivative of the IPAT model, considers factors such as population, wealth, and technology, and it addresses the non-proportional impact of these factors on carbon emissions, making it a widely acknowledged tool for identifying influences and forecasting total emissions. Scholars have also increasingly focused on temporal influences, with time-series models like the Gray Forecasting Model (GM) [22], Exponential Smoothing (ES) [23,24], and the Autoregressive Integrated Moving Average model (ARIMA) [25,26] gaining interest. These time-series methods rely on the assumption that historical carbon emissions data reflect the impact of all influencing factors, enabling the extrapolation of future trends based on past patterns. The second major category, artificial intelligence and machine learning, involves inputting historical data into machine learning algorithms to optimize and train models that automatically identify relationships between features and outcomes, resulting in high-precision models used for prediction and classification. Given the inherent uncertainty in carbon emissions, traditional methods often fall short, necessitating the use of AI algorithms with strong probabilistic analysis capabilities to improve prediction accuracy. This has led to the increasing application of optimization algorithms in the field of energy and carbon emission prediction [27,28,29], with combined algorithms proving more accurate and applicable than single algorithms. Consequently, the combination of prediction models has become a new research focus, offering lower computational costs and greater interpretability [30].
In summary, while research on the carbon peak has received considerable attention, significant deficiencies persist. These include challenges in acquiring fundamental data and substantial disparities in accounting methods. Additionally, in forecasting, the factor decomposition method often limits analysis to qualitative assessments and subjective judgments in both factor selection and model construction. Time-series methods, meanwhile, struggle to address the nonlinear and non-stationary characteristics of carbon emissions, often leading to inadequate result interpretations. In contrast, artificial intelligence algorithms offer promising solutions to these forecasting challenges. The innovation and contributions of this paper lie in several key areas, as follows: (1) It employs a combination of the influencing factor decomposition method and artificial intelligence machine learning techniques to comprehensively investigate urban carbon emission accounting. This approach overcomes issues related to constrained variable selection and model construction errors, thereby enhancing the analytical capabilities for uncertain variables. (2) Leveraging the nonlinear predictive capabilities and robustness of the GA-BP model, along with scenario analysis methods, it provides accurate predictions of carbon emissions. This comprehensive approach enables a thorough analysis of carbon emission forecasts from both quantitative and qualitative perspectives. (3) The study extends beyond a holistic analysis of Dalian to include a detailed examination of the influencing factors within various districts, cities, and counties in the region. This deeper investigation identifies actionable insights, offering valuable guidance for carbon emission reduction strategies applicable to other cities with similar developmental contexts.
Based on the summary of the above literature, two tables have been created to analyze the advantages of the research methods used in this paper compared to previous research methods, as shown in Table 1 and Table 2.
In conclusion, despite the extensive focus on peak carbon, notable shortcomings remain. These include challenges in obtaining basic data and significant differences in accounting methods. Remote-sensing data offers advantages due to its ease of acquisition and analysis, and the article’s examination of spatial heterogeneity further supports its suitability. Additionally, the factor decomposition method often limits analysis to qualitative assessments and subjective judgments when selecting factors and constructing models. Meanwhile, time-series methods struggle to address the nonlinear and non-stationary characteristics of carbon emissions, often leading to the insufficient interpretation of results. In contrast, artificial intelligence algorithms offer promising solutions to these forecasting challenges.

3. Materials and Methods

3.1. Research Methodology

3.1.1. The STIRPAT Model

The identification of influencing factors is fundamental to addressing issues in carbon emission research. The STIRPAT model integrates multiple dimensions, such as population, affluence, and technology levels, to comprehensively assess the impact of various factors. It further analyzes the relationship between carbon emissions and socio-economic indicators. One of the model’s key strengths is its incorporation of randomness and error terms, which allows for more precise evaluations of the disproportionate environmental impacts of different factors. This approach better accounts for the inherent variability of carbon emissions. Its straightforward calculation method is widely recognized by scholars and industry professionals alike. This paper synthesizes the selection of influencing factors based on previous scholarly literature, as detailed in Table 3.
The origin of the STIRPAT model can be traced back to Ehrlich [39], who proposed the IPAT model of environmental stress. With the application of the model, York [40] further improved on the IPAT model by further expanding the influencing factors, and the STIRPAT model was formally proposed, and is now widely used. The basic expression form of IPAT is as follows:
I = γ P a A b T c ε
In Equation (1), γ is the coefficient of the equation, P represents the population, A represents the level of affluence, T represents the level of technology, a, b, and c are the elasticity coefficients of the variables, and ε is the systematic error.
IPAT is a special expression of the STIRPAT model with all the coefficients of 1 and the simplest variables, so the STIRPAT model is more inclusive in the study of stochastic environmental influencing factors, and it can also better fit the instability of the environment. Based on this, this paper finally selects the number of resident population, population density, GDP, value added of tertiary industry, and energy intensity as the five influencing factors from three dimensions according to the model characteristics and the actual development of Dalian. The STIRPAT model in logarithmic form can be obtained by taking logarithms on both sides of the equation at the same time.
l n C = l n δ 0 + δ 1 l n X 1 + δ 2 l n X 2 + δ 3 l n X 3 + δ 4 l n X 4 + δ 5 l n X 5
where C denotes carbon emissions, δ0 denotes the constant term coefficient, δ1δ5 denote the elasticity coefficient of each variable, and X1X5 denote the number of resident population, population density, GDP, value added of tertiary industry, and energy intensity, respectively.

3.1.2. GA-BP Model

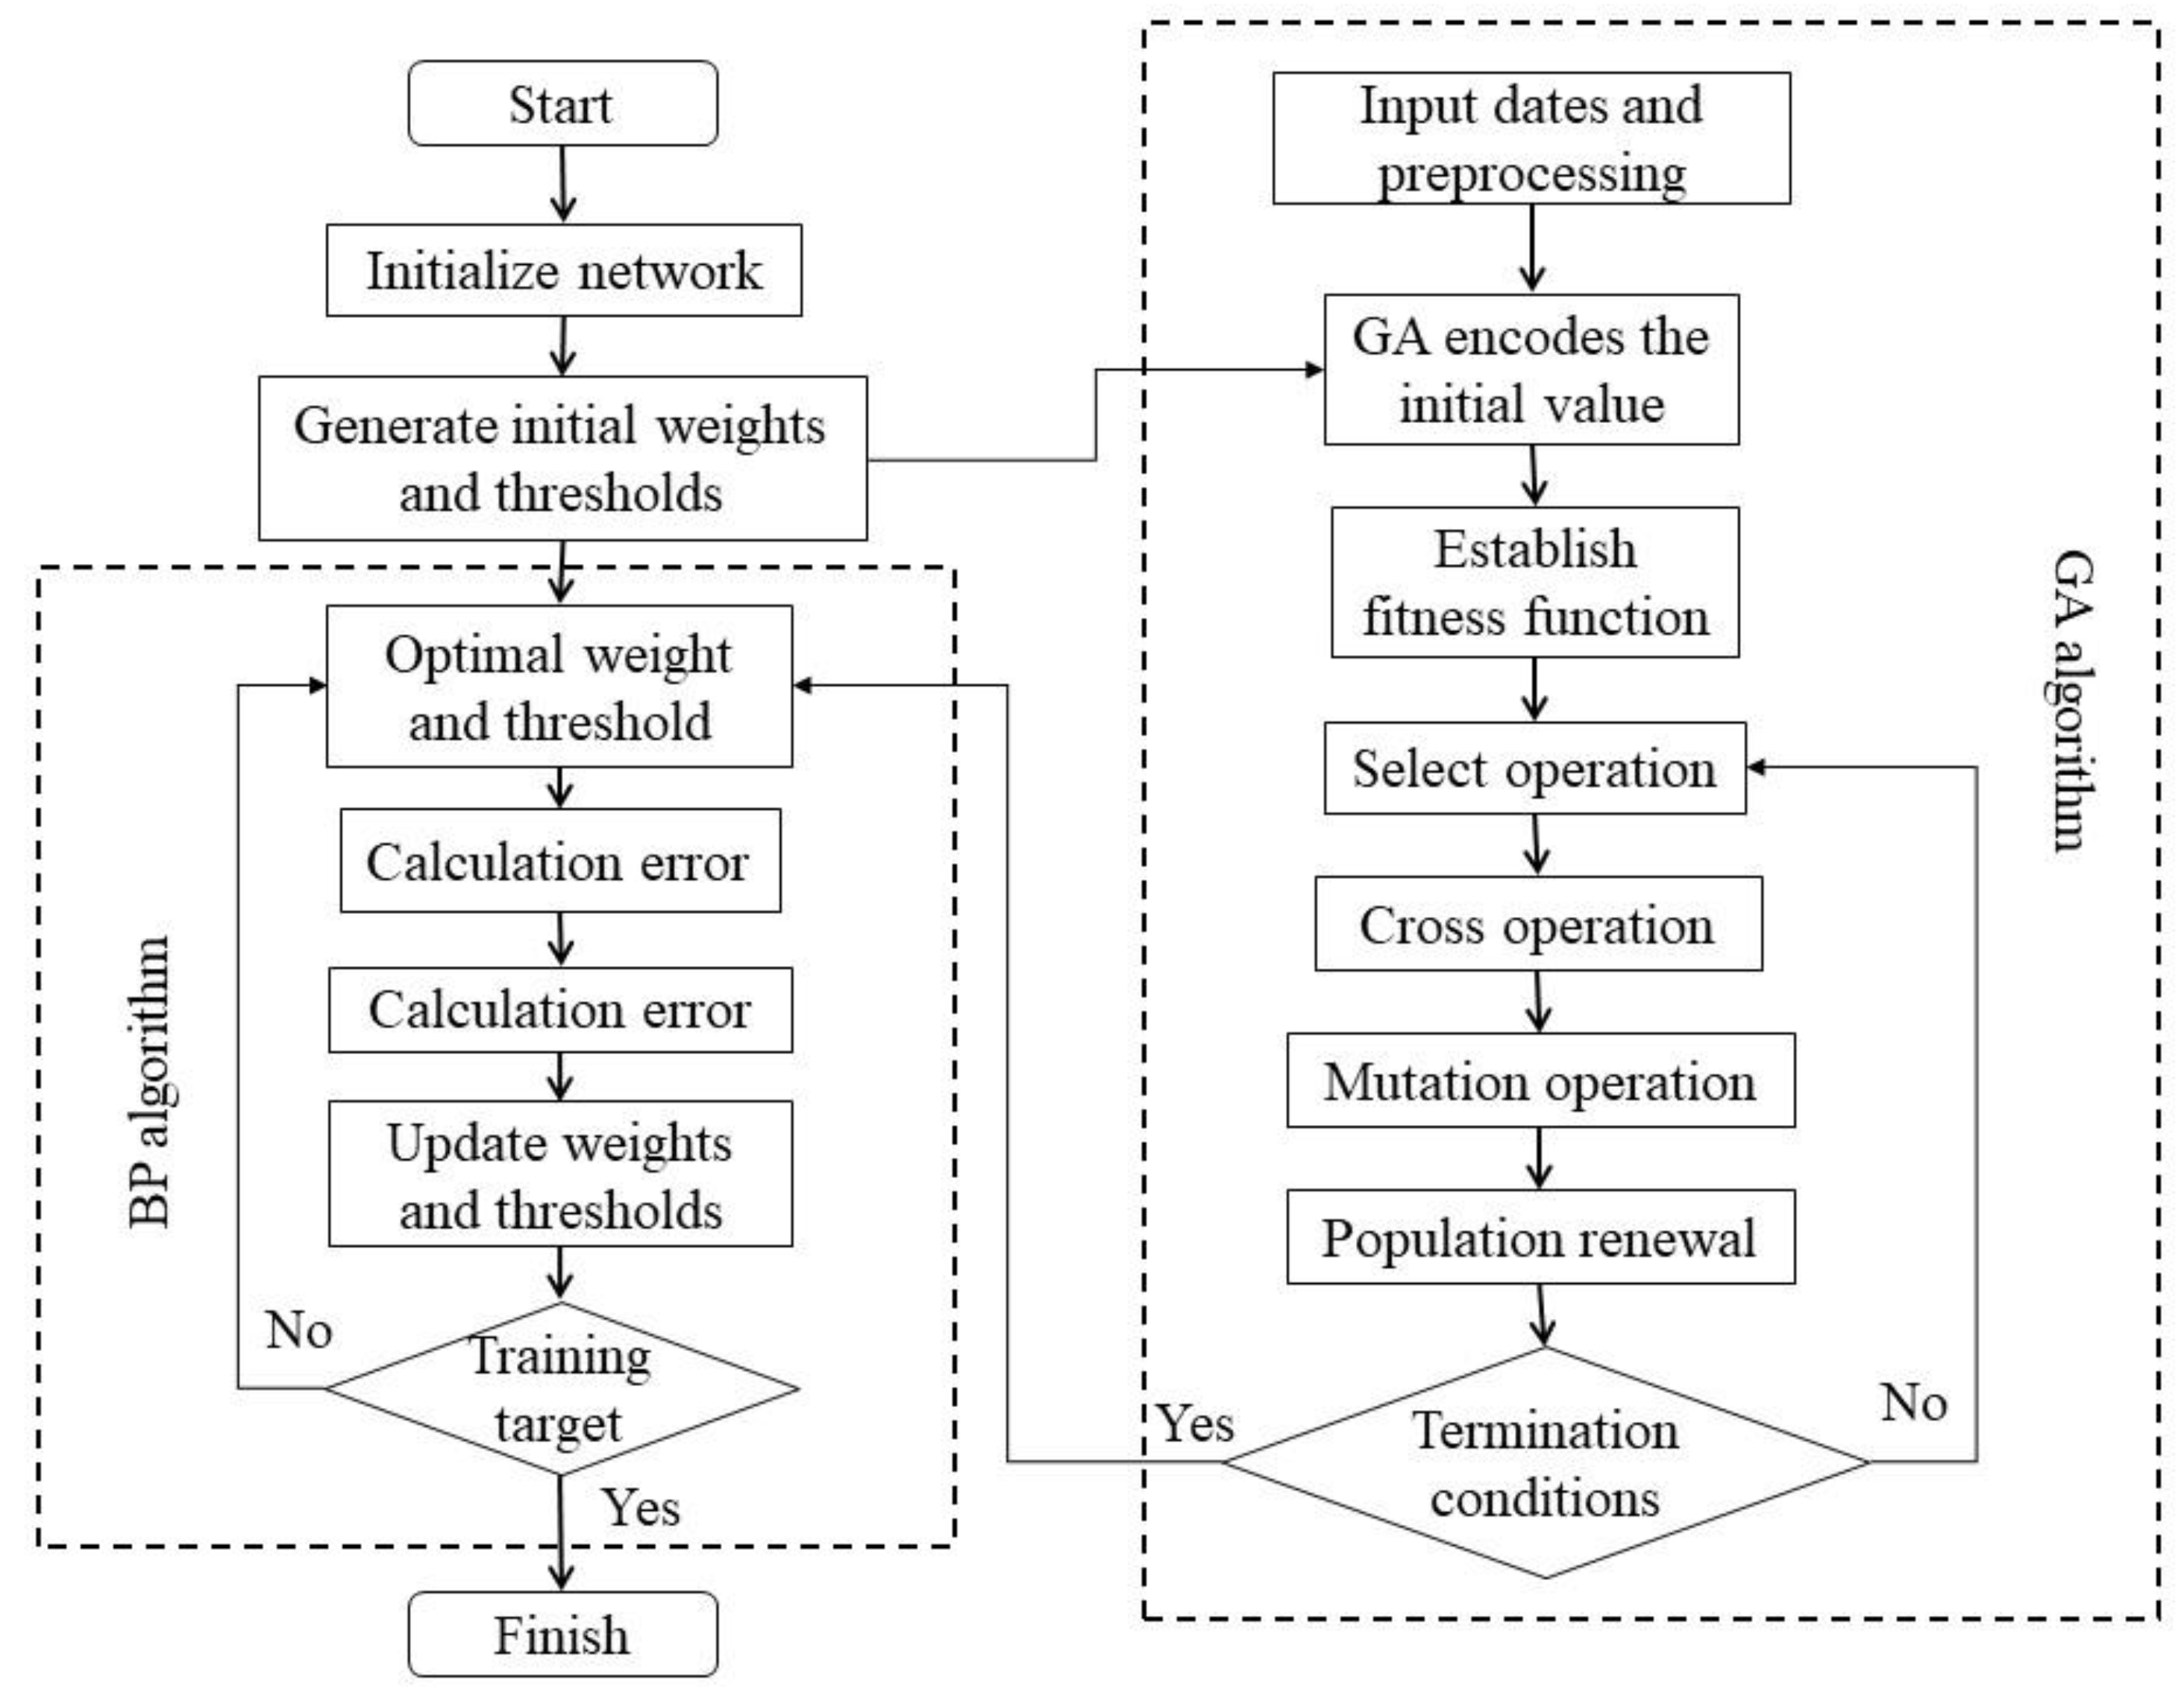
To accurately predict carbon emissions and urban carbon peaks, selecting an appropriate prediction model is crucial. The GA-BP model proposed in this paper has been widely used in various fields in previous prediction studies and can be applied to a range of nonlinear, chaotic, and dynamically varying time-series prediction problems, offering high prediction accuracy. In the Back Propagation (BP) neural network, Genetic Algorithms (GAs) optimize the network’s weights and thresholds to improve its performance and prediction accuracy, while also enhancing its nonlinear mapping capabilities. The GA-BP model addresses the shortcomings of local optimal solutions prior to optimization and has clear advantages in predicting nonlinear and non-stationary carbon emissions. This paper employs the GA-BP model to predict carbon emissions. Its principle is based on a multilayer feedback network using the error Back Propagation algorithm. The process is divided into three layers: the input layer, hidden layer, and output layer. Data are first received by the input layer, then processed through the hidden layer, and finally transferred to the output layer, where the result is calculated and output. The specific flow chart is shown as follows in Figure 1.
The modeling steps include:
(1)
Individual coding and population initialization; the form of entity coding is used for individuals, and the population individual consists of weights and thresholds between the input layer, the implicit layer, and the output layer of the BP network. The coding length is calculated as follows:
S = n × l + l + l × m + m
where n, l, and m are the number of neuron nodes in the input, hidden, and output layers of the BP network, respectively.
(2)
Selection of the fitness function of the training population: the individuals in the population are evaluated by the fitness function. In this paper, the fitness function is selected as the error of the BP neural network training:
E = 1 2 O = 1 m ( d o k y o ( k ) ) 2
f i t = 1 E
(3)
Selection process: Initially, the individual with the highest fitness value in the population is selected, and its structure is duplicated through calculation into the population. Individuals with lower fitness values undergo crossover and mutation operations, resulting in new chromosomes that are then re-evaluated for fitness and sorted accordingly. This study adopts the roulette wheel method for selection [41]:
P k = f ( x k ) k = 1 n f ( x k ) , k = 1,2 , , n
(4)
Crossover operation: In this paper, arithmetic crossover is used to linearly recombine the population. Assuming linear recombination between Xi and Xj, the new individual generated by arithmetic crossover for a pair of individuals of that population species is as follows:
X i t + 1 = a X i t + ( 1 + a ) X j t X j t + 1 = a X j t + ( 1 + a ) X i t
(5)
Mutation operation: To make each gene a mutation point, the j-th gene of the i-th individual is selected and the corresponding mutation operation is performed on it; the specific mutation operation is shown as follows.
X i j t + 1 = X i j t + 1 + X i j t + 1 X m a x × f g , r 1 > 0.5 X i j t + 1 = X i j t + 1 + X m i n X i j t + 1 × f g , r 1 < 0.5 f g = r 2 × ( 1 g G m a x )
where X m a x is the gene X i j t + 1 , the upper limit of the value of X m i n is the lower limit of the value of gene X i j t + 1 ; g is the current iteration number;   r 1   ,   r 2 is a random number between [0,1]; G m a x is the maximum evolution number.
(6)
Iterative optimization search: Based on the specified number of iterations, steps 2–5 are executed iteratively, with each cycle referred to as population evolution. The most optimal individuals that meet the requirements are then transformed into the initial weights and thresholds of the BP neural network.
(7)
Training and prediction with BP neural networks: the optimal weights and thresholds obtained from the previous operations are applied to the neural networks to initiate the BP neural network training process and to predict data using the successfully trained models.
The specific flow chart is shown in Figure 2.

3.2. Study Area and Data Sources

3.2.1. Overview of the Study Area

Dalian spans a total area of 12,574 square kilometers. As of June 2023, the city is administratively composed of one county (Changhai County) and seven districts (Zhongshan District, Xigang District, Shahekou District, Ganjingzi District, Lushunkou District, Jinzhou District, and Pulandian District), with two county-level cities (Wafangdian and Zhuanghe) under its jurisdiction (see Figure 3 for a detailed location map). With rapid economic growth, the city has developed significantly. Over the years, Dalian’s total GDP has been comparable to that of Shenyang, the provincial capital, and its incremental growth has been among the highest in the region.

3.2.2. Data Sources and Processing

(1)
Data sources (Table 4):
The description of data sources is shown in Table 4.
(2)
Data processing
➀ Night-lighting data and its correction
The Defense Meteorological Satellite Program (DMSP) is a U.S. initiative that operates the Operational Linescan System (OLS). Similarly, the National Polar-orbiting Partnership (NPP) supports the Visible Infrared Imaging Radiometer Suite (VIIRS). Both systems were originally designed for meteorological monitoring, particularly to capture weak moonlight reflected by clouds at night. However, due to their unique spot amplification capabilities, they later became capable of detecting faint near-infrared radiation from the Earth’s surface at night [46], enabling them to capture city and town lights in cloud-free conditions [47] and visually monitor the radiance of land, atmosphere, ice, and oceans in the visible and infrared wavelengths. This capability has been gradually applied to carbon emission estimation in recent years [48]. The DMSP/OLS satellite sensor, launched in 1976, and the NPP/VIIRS sensor, launched in late 2011, provide extensive nocturnal remote-sensing data. However, data acquired by different sensors in the same year, as well as data from the same sensors, can differ, leading to discontinuities and oversaturation. To ensure the authenticity and accuracy of the data, this paper processes the raw nighttime light images using mutual correction and saturation correction techniques. Following the approach of Chang et al. [49], the data are corrected to address discontinuities and oversaturation in the DMSP/OLS dataset (2001–2013) and to de-noise the NPP/VIIRS dataset (2012–2022). The specific principles are as follows [50].
D N ( i , j ) = 0 ,   D N ( i , j ) a = 0 D N ( i , j ) b = 0 ( D N i , j a + D N i , j b ) / 2 ,   D N ( i , j ) a 0 ,   D N ( i , j ) b 0
where D N ( i , j ) is the grayscale value of image element j in the corrected year i image; D N ( i , j ) a and D N ( i , j ) b denotes the grayscale value of image element j in the image acquired by 2 different sensors after correction.
D N ( i , j ) = D N ( i 1 , j ) ,   D N ( i 1 , j ) > D N ( i , j ) D N ( i , j ) ,   D N ( i 1 , j ) D N ( i , j )
In the formula, D N ( i , j ) and D N ( i 1 , j ) denote the grayscale value of image element j in the saturation-corrected and continuously corrected images in year i and year i − 1 after correction, respectively.
➁ Estimating Carbon Emissions from Energy Consumption
Carbon emissions from energy consumption are calculated using the IPCC carbon emission factor method, with refinements based on Zhao et al.’s study [51]. In this approach, the activity data of subsectors and energy subtypes are multiplied by the corresponding carbon emission factors and carbon oxidation rates, and then summed to determine the total emissions. This method is concise, widely applicable, easy to use for data acquisition, and highly recognized. This study focuses on calculating emissions from nine selected energy types, with specific formulas outlined as follows:
E j = i = 1 9 Q i j × β i × α i
where Ej is the carbon emission from energy consumption in Dalian in year j; Qij is the consumption of energy type i in Dalian in year j; βi is the emission factor of energy type i in Dalian; αi is the carbon oxidation rate of energy type i in Dalian. The specific values are shown in Table 5.
➂ Fitting of carbon emissions to nighttime light values
The calibrated nighttime light grayness value serves as a proxy for human activities, with a positive correlation between the intensity of human activities and carbon emissions. Higher DN values correspond to increased carbon emissions. Therefore, by fitting and analyzing the relationship between carbon emissions and nighttime light gray values in Dalian from 2001 to 2022, a comprehensive long-term dataset of carbon emissions for Dalian can be established. Given the linear growth trends in both nighttime lighting data and carbon emissions, a single-variable linear regression model without an intercept is constructed as follows:
Y = k X
where Y denotes carbon emissions; X denotes corrected nighttime light data DN values; and k is the fitting coefficient.
According to the linear regression analysis conducted using SPSS software (V.29), the fitting results between the gray value of nighttime lights and carbon emissions are presented in Table 6.
Using the calculation from Equation (12), the carbon emissions of Dalian and its county-level cities can be obtained year by year. With a goodness of fit of 0.983, there is a strong positive correlation between carbon emissions and nighttime light grayness values. This correlation highlights that as nocturnal light intensity increases, so do carbon emissions.

4. Analysis of the Results of the Study

4.1. Driver Analysis

Based on data collection of influencing factors and subsequent logarithmic transformations, a ridge regression analysis was employed to mitigate multicollinearity among variables, ensuring the model accurately reflects the relationship between carbon emissions and the influencing factors. The choice of the K-value (K = 0.095) was determined using the variance inflation factor. The regression results are presented in Table 7, showing that all variables satisfy the significance test and that the model is reasonably set.
An expression for the driving factor affecting carbon emissions in Dalian is derived.
C = 1.102 + 0.362 l n X 1 + 0.173 l n X 2 + 0.417 l n X 3 + 0.820 l n X 4 0.180 l n X 5
To clarify the contribution of each factor to carbon emissions and enhance the precise implementation of emission reduction measures, we refer to the method for calculating contribution values proposed by scholars such as Wang et al. [52]. This approach involves multiplying the elasticity coefficients of the influencing factors by their average annual growth rate to assess their impact on carbon emission changes. The contribution to the change in CO2 emissions is calculated as the ratio of the influence of these factors on CO2 emission changes to the annual growth rate. The formula is as follows:
D i = I i V E = b i × v i V E
where Di represents the contribution of influence factor i to carbon emissions from 2001 to 2022; Ii represents the effect of influence factor i on carbon emissions from 2001 to 2022. Mainly, the percentage change in carbon emissions when influence factor i is increased by bi; VE represents the rate of change of carbon emissions over the period of 2001–2022; bi represents the elasticity coefficient of influence factor i; and vi represents the average rate of change in influence factor i over the period of 2001–2022.
A further analysis of the intrinsic driving mechanisms of carbon emissions across various dimensions of the five major influencing factors reveals the three following categories: the population scale effect (contribution rate of resident population, contribution rate of population density), the economic scale effect (contribution rate of GDP, contribution rate of value added from the tertiary industry), and the energy intensity effect (contribution rate of energy efficiency). The results of this analysis are shown in Figure 4.
From the figure, it can be seen that from 2001 to 2022, with the exception of Zhongshan District, Xigang District, and Shahekou District, the total effect in other regions is positive, indicating that the overall impact of each influencing factor generally promotes carbon emissions. Notably, the economic scale effect and the energy intensity effect have the most significant impact in driving carbon emissions. By analyzing the distribution of contribution values, targeted strategies for carbon emission reduction can be more effectively identified for each region.
For Dalian, the contribution rate of economic scale is 122.31%, the contribution rate of energy intensity is –61.98%, and the contribution rate of population scale to carbon emissions is only 1.81%. This indicates that while Dalian’s economy continues to develop and grow, it significantly contributes to the increase in carbon emissions. However, energy intensity plays a crucial role in reducing carbon emissions, highlighting a substantial opportunity for further improvement in Dalian’s carbon reduction efforts. Enhancing energy intensity remains essential, and this can be facilitated by technological advancements such as improving transmission infrastructure, developing new energy microgrids, and leveraging digital technologies like Internet+ to enhance energy efficiency and implement effective carbon emission reduction strategies.
Similarly, in terms of carbon emission reduction, the economic scale effect has a negative impact on Zhongshan District, Xigang District, and Shahekou District. These areas may reduce carbon emissions through economic development, but it is essential to pay attention to the methodology. It is recommended to support green decarbonization through the digital economy, utilizing big data, artificial intelligence, and other digital technologies to achieve industrial green transformation, carbon emissions management, and other related goals. The energy intensity effect has a negative impact on Ganjingzi District, Lushunkou District, Jinzhou District, Pulandian District, Changhai County, Wafangdian City, and Zhuanghe City. By advancing technological innovation, industrial upgrading, and transformation, these areas can improve energy efficiency, maximize production capacity, and drive economic growth while reducing carbon emissions. The population size effect has a negative impact on Shahekou District, Changhai County, Wafangdian City, and Zhuanghe City. In these areas, the timely implementation of the three-child policy, talent development programs, and public environmental awareness initiatives can help turn the population disadvantage into a demographic advantage.

4.2. GA-BP Neural Network Training and Prediction

4.2.1. Network Training

➀ Determination of model structure
The structure of the BP neural network consists of three main components: an input layer, a hidden layer, and an output layer. While the input and output layers are singular, the configuration of the hidden layer varies depending on specific research objectives and challenges. Previous studies have shown that a neural network with a three-layer structure can approximate any nonlinear continuous function with arbitrary accuracy, while an excessive number of hidden layers increases the complexity of network training and slows convergence. Therefore, in line with the research framework of this study, the model was determined to have one input layer, one hidden layer, and one output layer.
From the above, it is known that the number of neurons in the input layer is 5, and the number of neurons in the output layer is 1. The role of the hidden layer neurons is to map the input data to a higher level of feature representation, so as to improve the model’s classification and prediction ability, which affects the network’s learning ability and model accuracy to a certain extent. Usually, the number of nodes selection relies on the empirical formulas to be obtained.
M = m + n + a
where m is the number of input layers, n is the number of output layers, and a is a constant between 0 and 10.
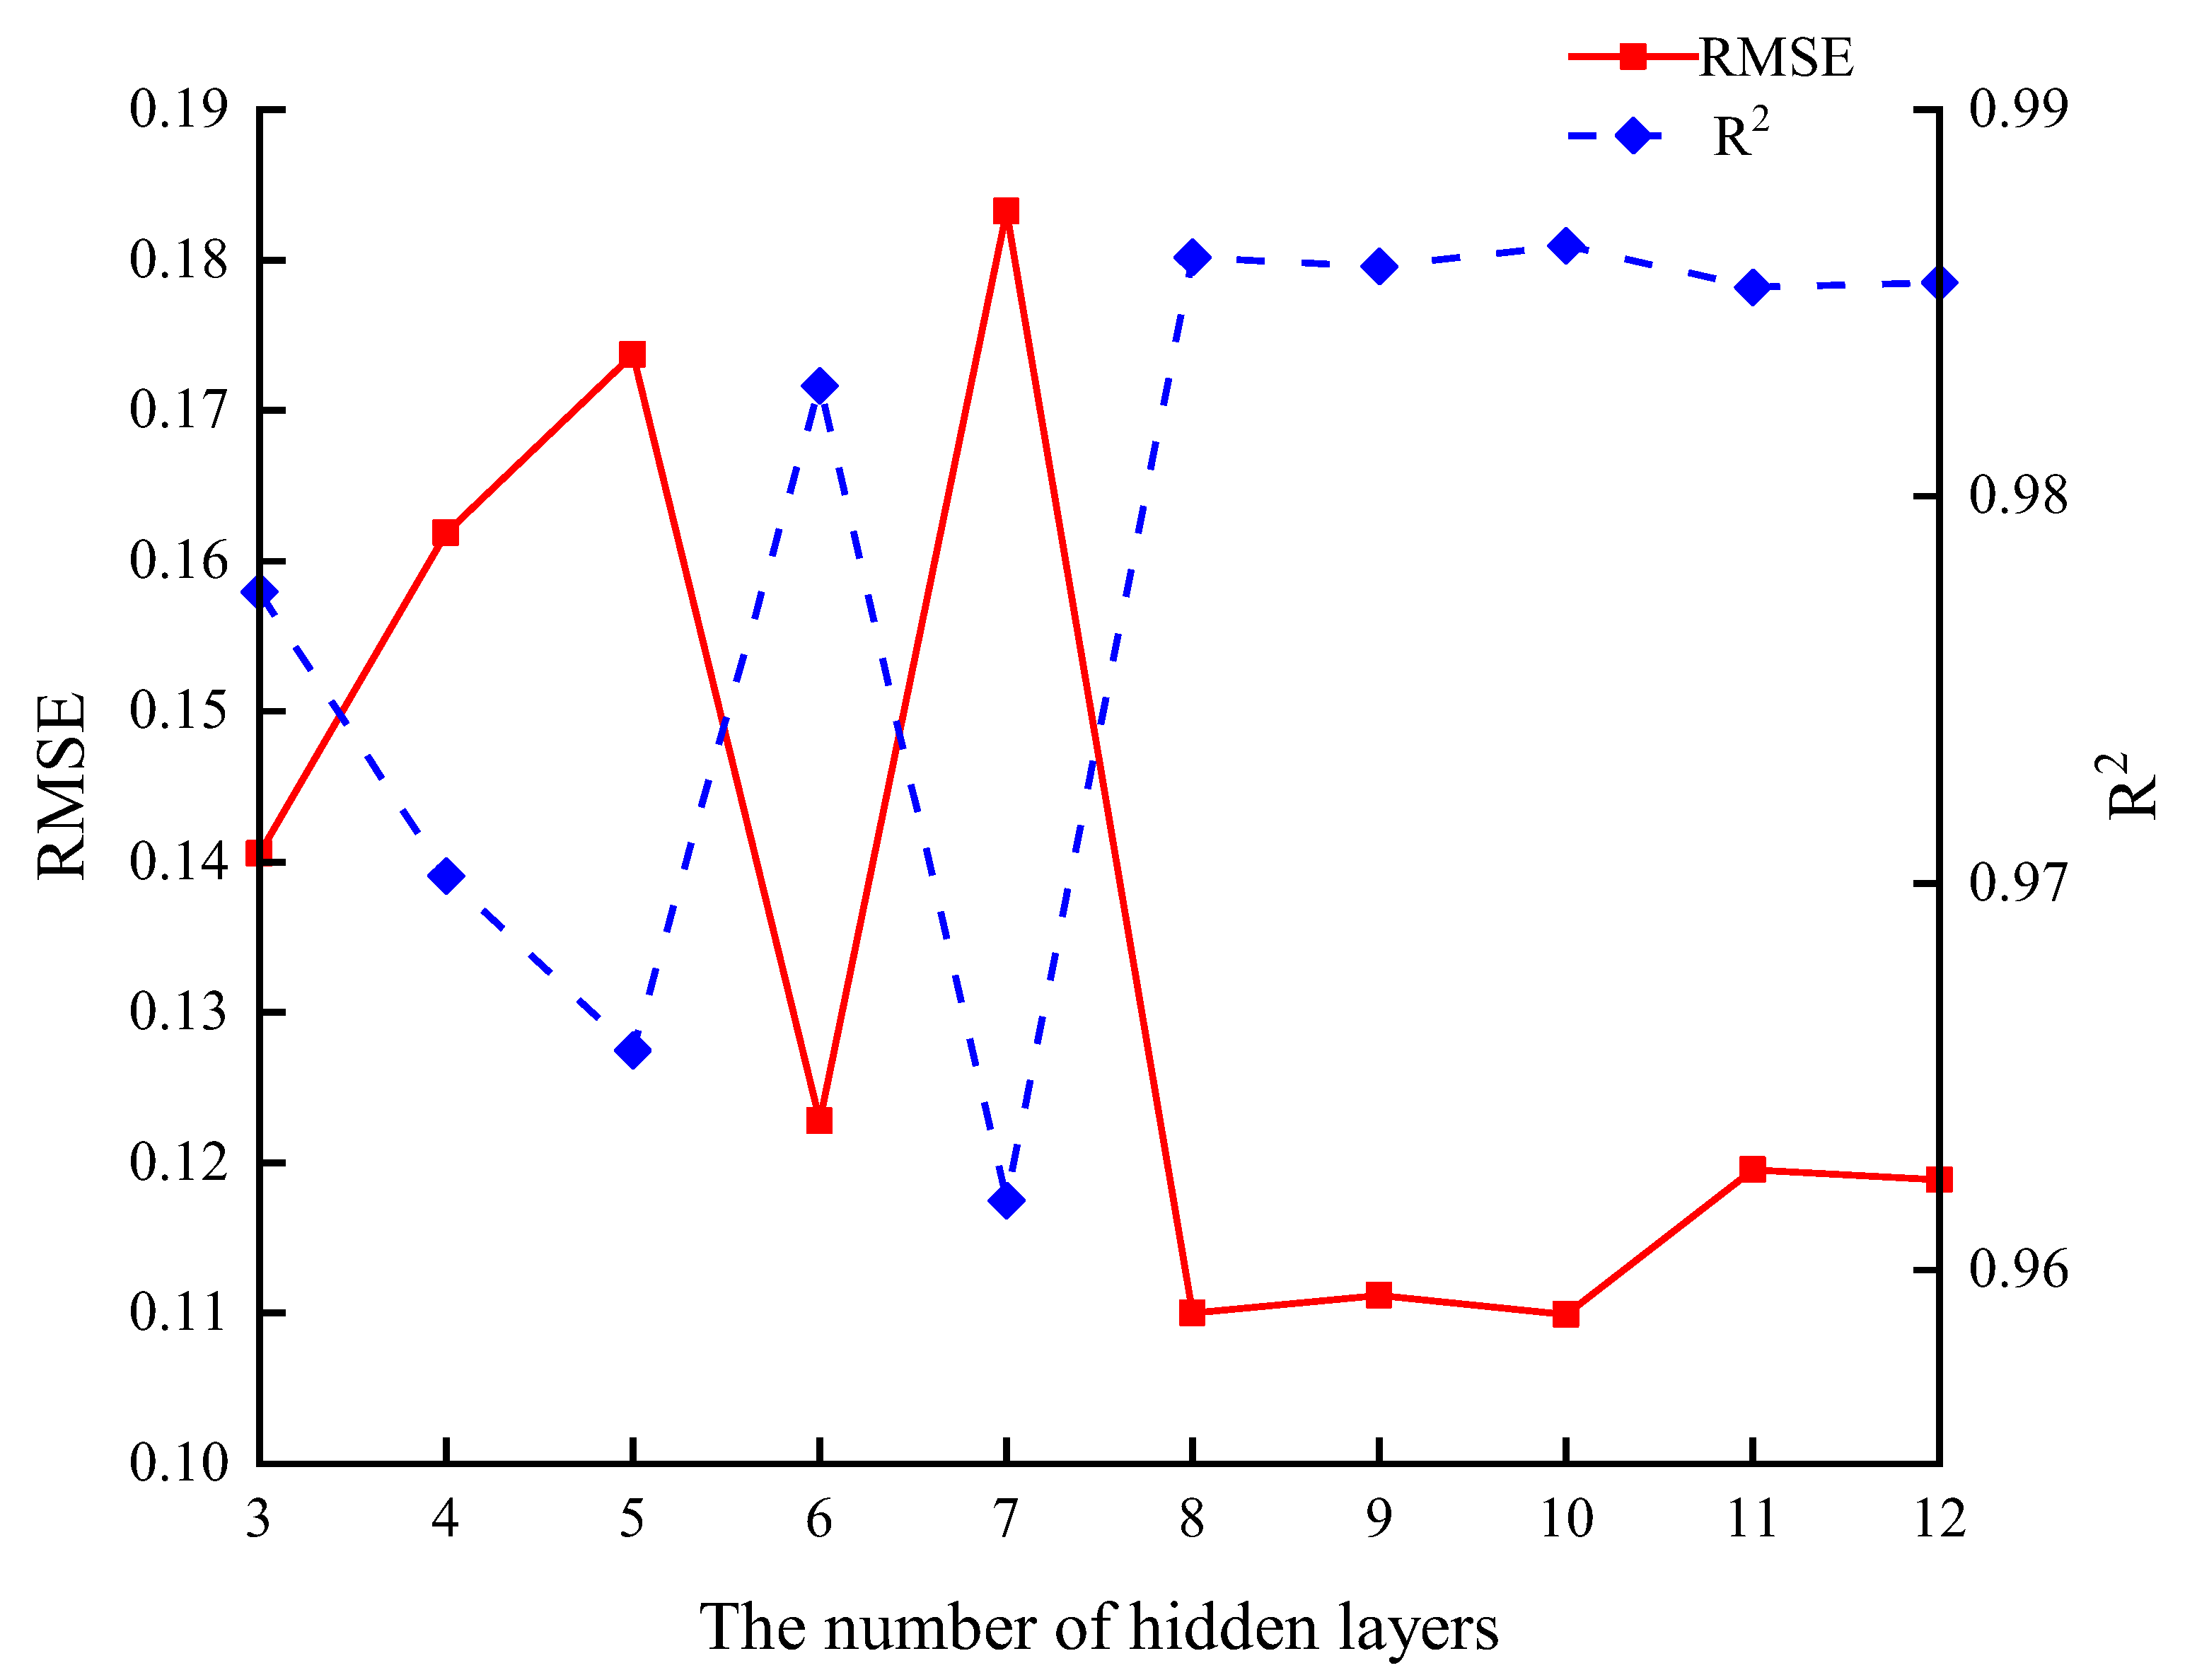
Based on the aforementioned experience, the optimal number of neurons in the hidden layer was determined to range between 3 and 12. The selection criterion for the number of hidden layer nodes was based on minimizing the root mean square error (RMSE) and maximizing the coefficient of determination (R2) when fitting predicted values against actual values. This approach effectively identified the best model parameter, ensuring optimal performance in predicting outcomes.
After model training and debugging, the resultant error for a different number of hidden layer nodes is shown in Figure 5. The model is best trained when the number of hidden layer nodes is 10, so the model result is determined to be 5-10-1.
➁ Model function determination
Initially, the BP neural network initializes the weight coefficients between neurons with random values [53,54]. Adjustments are then iteratively made to these weights based on the deviation between the output and expected values, continuing until the error or the number of iterations reaches the pre-set threshold, at which point the network training is complete. The training algorithms for neural networks include traingd, traingdm, and trainlm, among others [55,56]. In this case, the traingd algorithm is used, which employs gradient descent in Back Propagation. The transfer function of the hidden layer is the sigmoid function, also known as the hyperbolic tangent S-shaped function, defined as follows:
f x = 1 e x 1 + e x
The output layer uses a linear function as the transfer function, and the activation function is chosen to be a tansig function or a purelin function, defined as:
y = 2 1 + exp 2 x 1
y = x
Genetic Algorithms (GAs) generally choose the objective function as the fitness function, which can represent the individual fitness evaluation characteristics intuitively. In this paper, the standard error function is chosen as the fitness function, as shown below.
F = f R M S E x = 1 N i = 1 n ( y i y i ) 2
➂ Network training results
The network training results are shown in Figure 6, which shows the regression fitting degree of the test set, validation set, training set and all sample set, and the corresponding correlation coefficients R2 values are 0.9969, 0.9864, 0.9932 and 0.9935, respectively. Taking the validation samples fitting situation as the basis for judging the performance of the network, it can be seen that the training results of the network are excellent, with a good fitting effect, and the accuracy of the model reaches 99.33%.
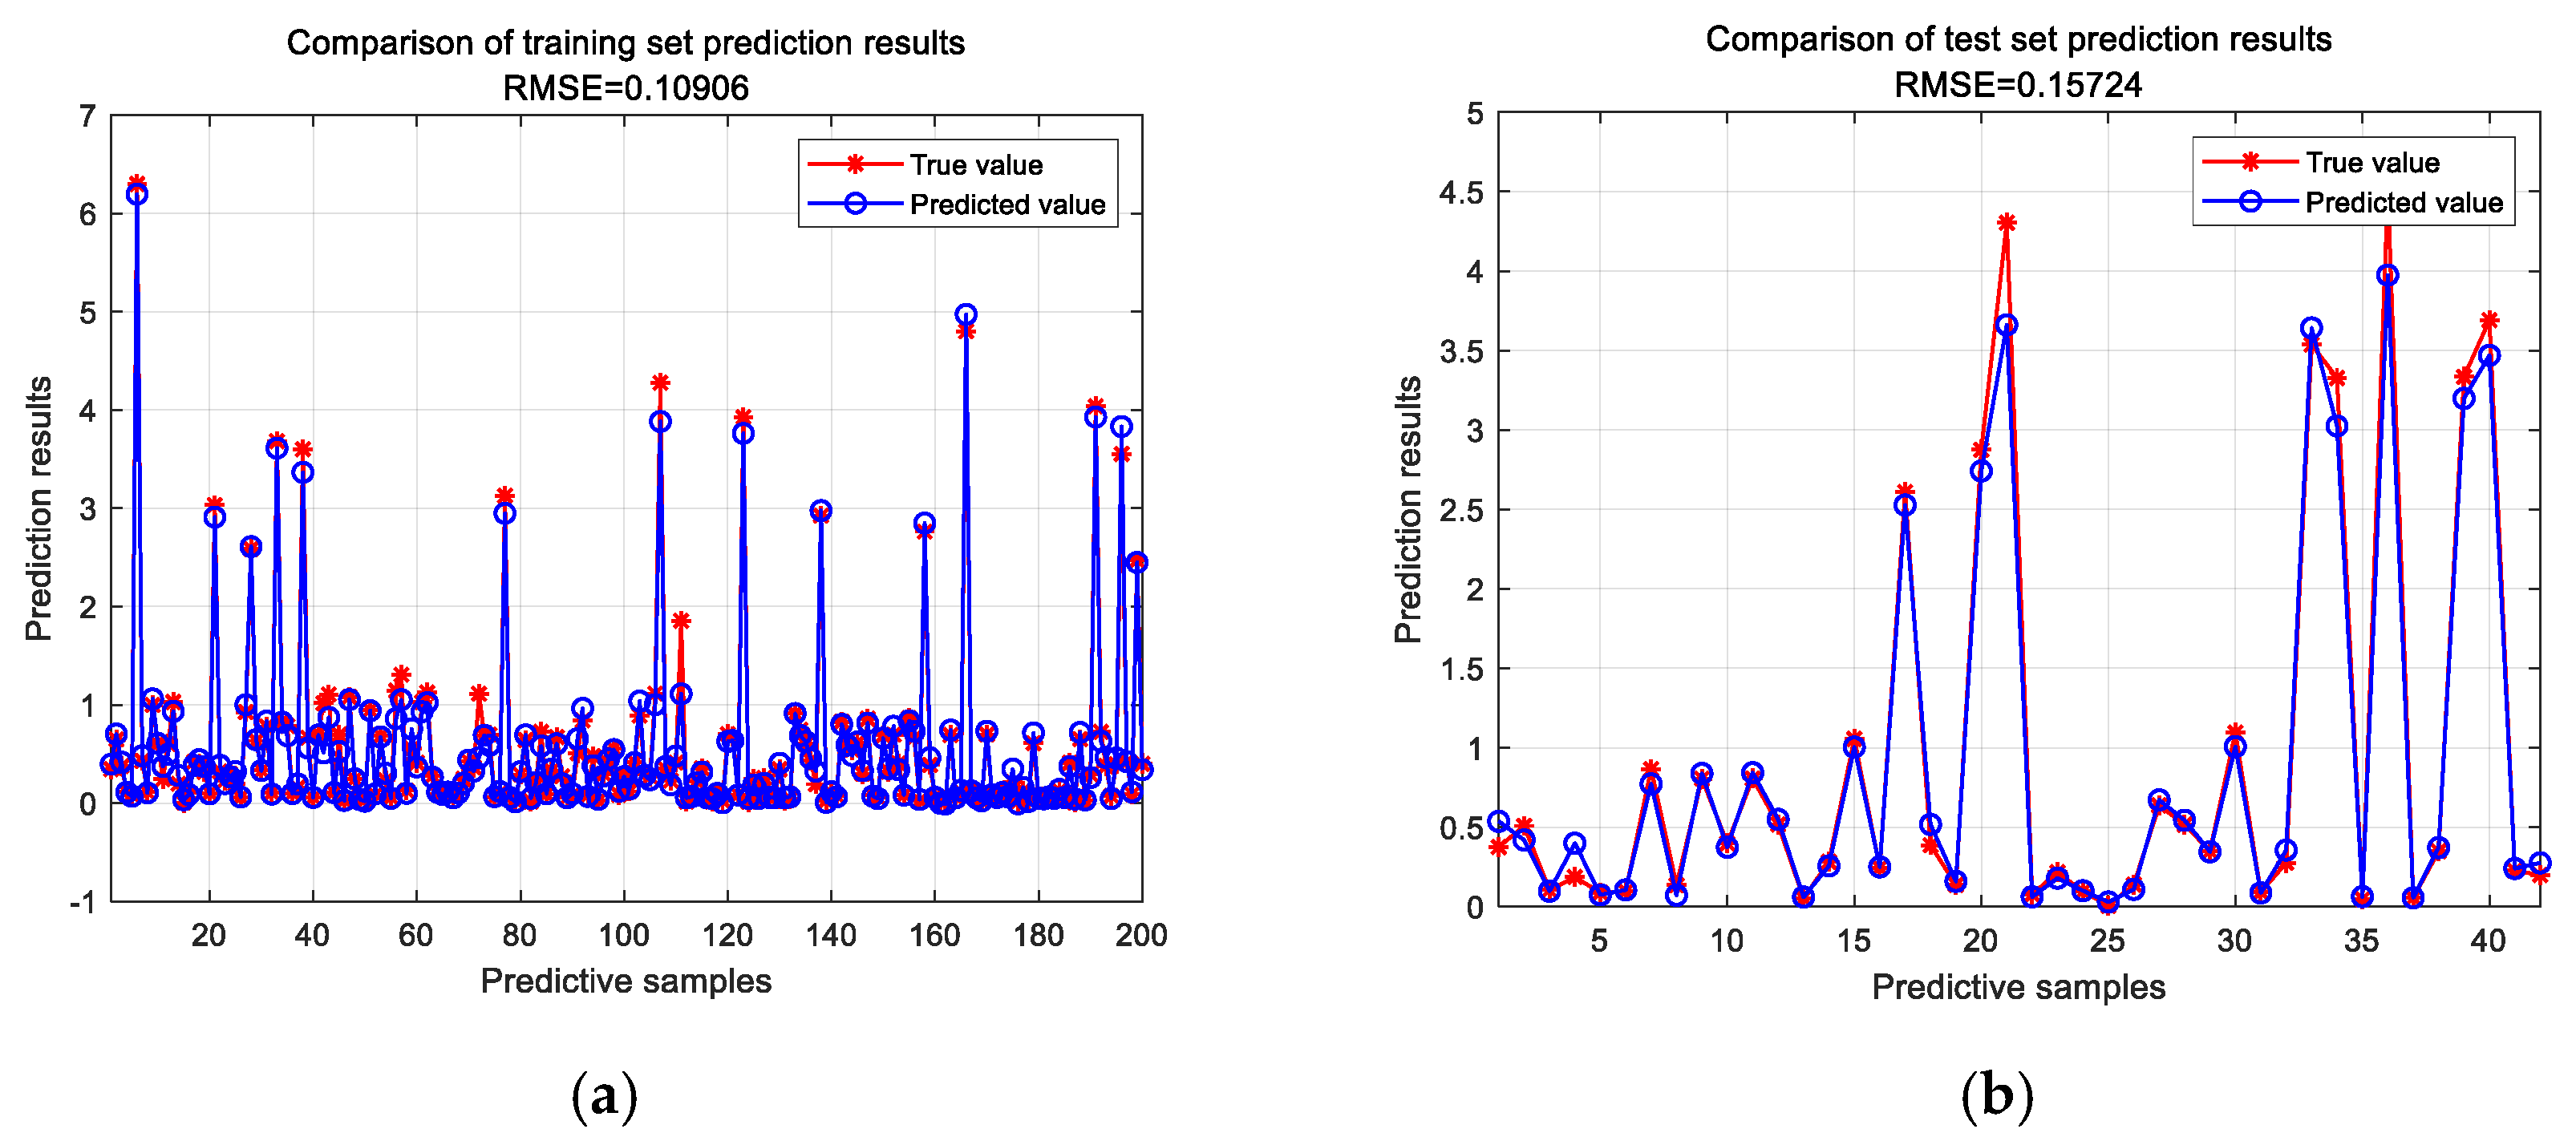
The predicted values of the training set and test set are compared with the actual values respectively, as shown in Figure 7, which shows that the predicted values of the output results match the actual values to a high degree, with the same trend in change. The RMSE index of the training set prediction samples is only 0.1090; similarly, the RMSE index of the test set prediction samples is 0.1572, which are both less than 1, indicating that the discrepancy between predicted and actual values is remarkably minimal, which means that the model exhibits high stability in its predictions, meeting the practical requirements for model application [57].
To assess the impact of the Genetic Algorithm (GA), a conventional Back Propagation (BP) neural network model with a 5-10-1 architecture was developed and subsequently compared with the GA-BP model to evaluate the test errors of various models. The findings are presented in Figure 8. A detailed comparison reveals that the optimized GA-BP model demonstrates superior predictive performance compared to the BP model, thereby offering substantial support for the appropriate application of the research methodology.
All of the above data presentations show that the GA-BP neural network provided in this paper has a strong prediction performance to evaluate future carbon emissions.

4.2.2. Prediction of the Network

① Scenario model construction based on the scenario analysis method:
Due to varying influences from policy, economy, energy consumption, and other factors, regional carbon emissions exhibit considerable disparities, based on the results of STIRPAT and the distribution of contribution values, as well as reviewing materials such as the 14th Five-Year Plan, the Government Work Report, and the Statistical Bulletin of National Economic and Social Development released by Dalian, and coupled with the evolving trends in influencing factors over time. A structured development model for Dalian City from 2023 to 2035 is designed, encompassing four scenarios: high-carbon, baseline, low-carbon, and low-carbon optimization. Variations in influencing factors across each scenario are categorized as upper, median, and low, with detailed distributions presented in Table 8 and Table 9. Furthermore, to ensure forecast accuracy over extended periods, this study establishes forecasting intervals spanning three phases: 2023–2026, 2027–2030, 2031–2035, employing interpolation for missing data.
➁ Peak and time prediction of carbon peaking:
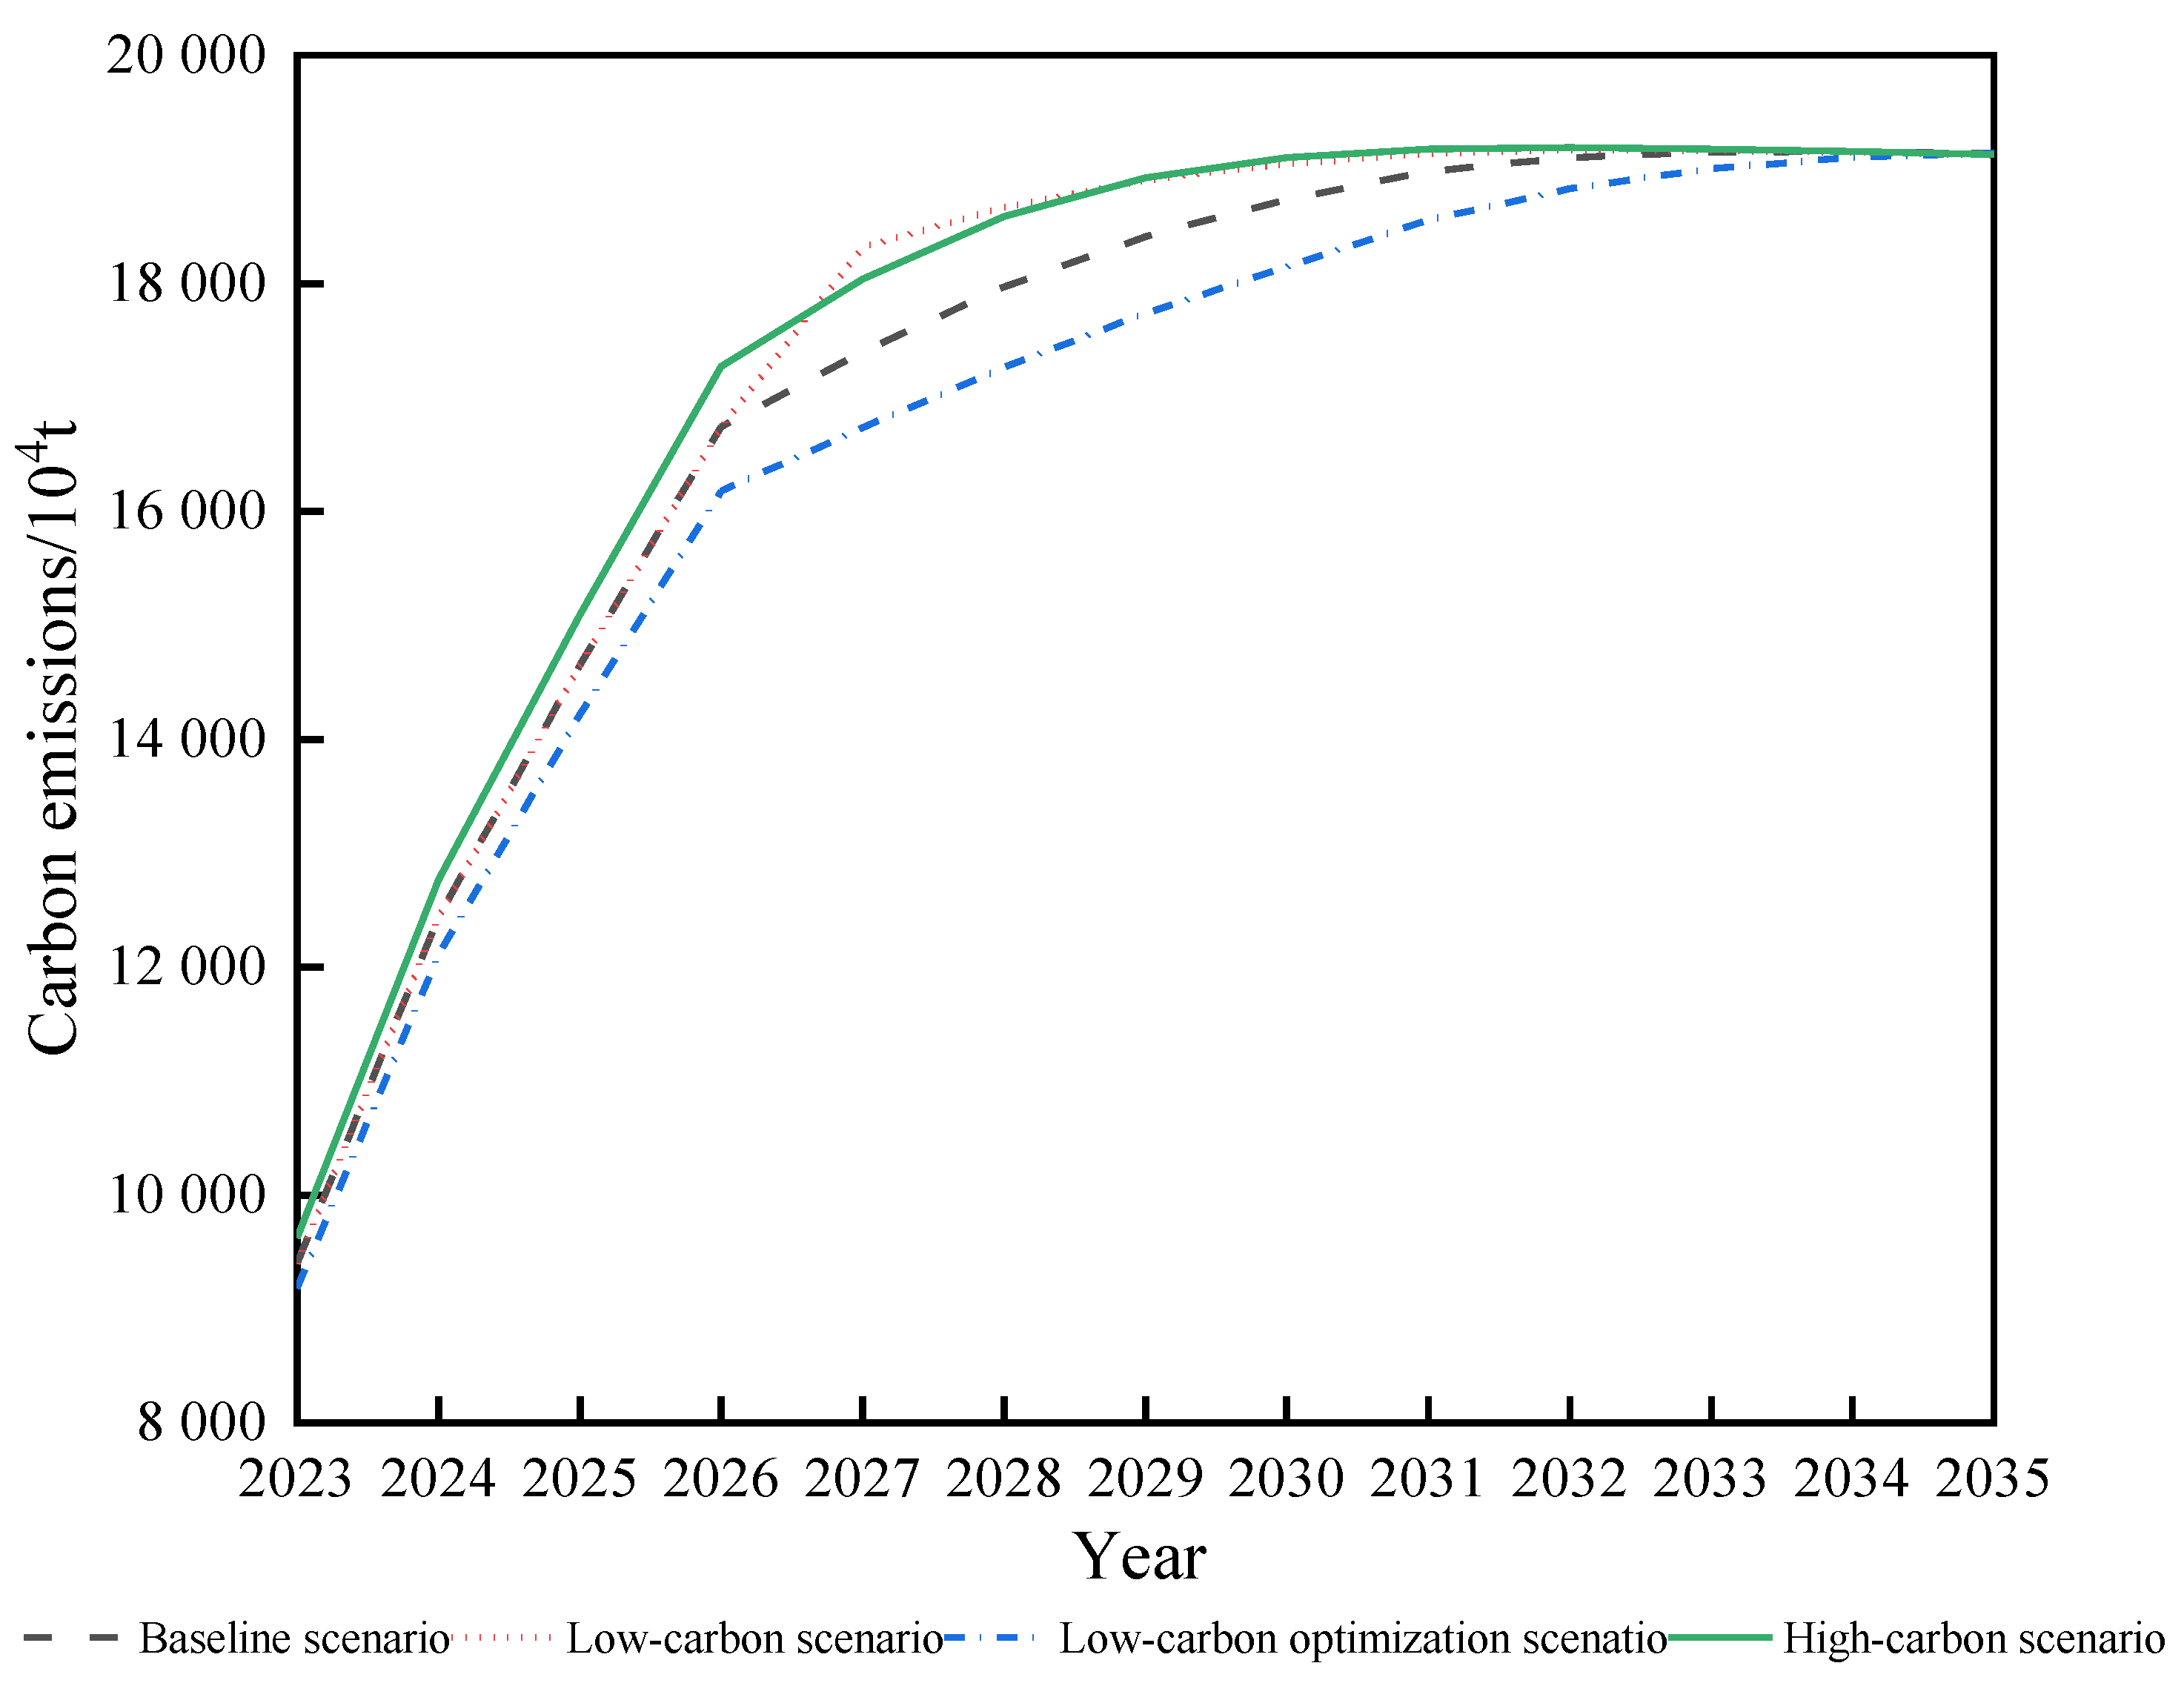
The multi-scenario parameters set above are imported into the trained GA-BP model as input variables to obtain the carbon emissions of Dalian City from 2023 to 2035 as follows.
Figure 9 illustrates that Dalian City is projected to peak between 2033 and 2035, with emissions reaching a peak range of 19,145.39 to 19,166.90 million tons. Comparisons indicate that carbon emissions under the three scenarios follow an inverted U-shaped curve, consistent with the environmental Kuznets theory. The predictive results indicate significant differences in carbon emissions among scenarios before 2033, while emissions converge post 2033. The baseline scenario maintains current development trends without adding new policy constraints, achieving a carbon peak of 191.4539 million tons in 2035. The low carbon scenario focuses on reducing energy intensity and advancing low-carbon technologies, achieving a peak of 191.669 million tons in 2033. The high-carbon scenario prioritizes economic growth over decarbonization measures, also peaking in 2033 at 191.7883 million tons. Meanwhile, the low-carbon optimization scenario promotes continuous low-carbon development within the framework of energy conservation policies, although it fails to achieve a carbon peak despite lower overall emissions. In conclusion, the low-carbon scenario appears more suitable for the development of the Dalian region, emphasizing targeted emission reductions alongside sustainable economic development.

5. Discussion

This paper introduces a novel perspective by focusing on district-level analysis within the context of cities and counties, selecting Dalian City—understudied relative to national or provincial scales—as its primary research object. This smaller-scale investigation enables a more focused analysis of specific issues compared to the broader-scale studies typically conducted by researchers. For example, some scholars’ studies on the national or province-wide scale mostly focus on large-scale spatial agglomeration characteristics or carbon emission efficiency areas [58,59], analyzing the influence of a single characteristic element on the spatial effect and efficiency of carbon emissions, which is precisely limited to the mechanism of the role of a single element, and the scope of the more macroscopic and lack of specific policy implementation behaviors. Previous studies have shown that population and GDP are the main driving factors affecting carbon emissions from transportation [60], and energy intensity is the main inhibiting factor affecting carbon emissions from tourism and transportation in East China [61]. This study uncovers diverse characteristics across various districts, cities, and counties. For example, Shahekou, Changhai, Wafangdian, and Zhuanghe show a negative impact on carbon emissions due to demographic factors, whereas other districts exhibit a positive influence. Similarly, Shahekou District, Jingang District, and Zhongshan District demonstrate a positive influence on energy intensity, in contrast to other districts that display negative impacts. These divergent outcomes are likely influenced by distinct developmental stages and regional characteristics, which dictate varying governance approaches.
Moreover, the present study effectively utilizes the GA-BP model to predict carbon emissions in Dalian across diverse scenarios. In contrast to earlier linear prediction approaches, for example, both Lin [62] and Huang [63] used the multiple regression equations constructed by the STIRPAT model to predict the predicted values of carbon emissions from the construction industry in Jiangxi Province and Guangxi Province, respectively. This investigation introduces an optimized GA-BP model focusing on critical influencing factors. The parameter-optimized network exhibits strong generalization abilities, effectively addressing overfitting (as demonstrated in Figure 5, with a root mean square error of less than 1). Importantly, the results indicate a decline in BP performance with larger sample sizes [64]; in contrast, the GA-BP hybrid model demonstrates markedly improved prediction accuracy due to its intricate architecture and parameter refinement. The enhanced global search capabilities and robust nonlinear mapping of this optimized network effectively circumvent local optima, ensuring superior performance. Through the integration of parameter and machine learning algorithm optimizations, this research employs a probabilistic stochastic approach to simulate uncertainties, enhancing the model’s adaptability to complex environmental changes and improving prediction accuracy.

6. Research Conclusions

The three principal aspects of the preceding discussion include the mechanisms influencing carbon emission factors in the selected research object, the accuracy of the chosen machine learning model in predicting carbon emissions, and the alignment of the research findings with pathways for carbon emission reduction. Consequently, this study employs night-light remote-sensing data to quantify carbon emissions in Dalian City from 2001 to 2022, including emissions at the district, city, and county levels. Furthermore, we identify key driving and mitigating factors influencing Dalian City’s carbon emissions using the decomposition analysis of STIRPAT model variables. Based on these findings, we integrate scenario analysis and utilize the high-precision GA-BP model to project Dalian City’s carbon emissions from 2023 to 2035. The final compilation of the results and the highlights of the discussion are presented below.
(1)
The main positive drivers of carbon emissions in Dalian, ranked by significance, are energy intensity, value added from the tertiary industry, number of residents, and gross regional product, with impact factors of 0.820, 0.417, 0.362, and 0.173, respectively. Conversely, population density acts as a mitigating factor, with an impact coefficient of −0.180.
(2)
Across the districts and counties of Dalian, the economic scale negatively impacts carbon emission reductions in Zhongshan District, Xigang District, and Shahekou District. Similarly, energy intensity negatively affects Ganjingzi District, Lushunkou District, Jinzhou District, Pulandian District, Changhai County, Wafangdian City, and Zhuanghe City. Additionally, population scale exerts a negative influence on Shahekou District, Changhai County, Wafangdian City, and Zhuanghe City.
(3)
The low-carbon scenario represents a pathway that optimally balances economic and environmental development in the Dalian City region. According to projections, peak carbon emissions are expected to occur in 2033, reaching a maximum of 191.79 million tons.

7. Policy Recommendations

Within the framework of Sustainable Development Goals (SDGs), it is emphasized that “sustainable energy offers significant opportunities to reshape lifestyles, enhance economic efficiencies, and safeguard the environment”. Crucially, “reducing energy carbon intensity stands pivotal in achieving long-term climate objectives”. Therefore, lowering energy carbon emissions intensity stands out as a key advantage in bolstering energy efficiency and expediting critical initiatives like integrated photovoltaic architecture. Drawing inspiration from Ganjingzi District’s model of high consumption and low intensity, this district has decisively curtailed the indiscriminate development of “two high” projects by implementing rigorous energy-saving reviews, conducting environmental assessments, and managing safety assessments. Additionally, it has established a comprehensive inventory of “two high” projects currently under construction and those in stock, facilitating dynamic management practices. Concurrently, the district emphasizes the importance of key enterprises in reducing energy consumption and carbon emissions, successfully establishing an online monitoring system for energy consumption within major energy-using units. The implementation of comprehensive energy-saving initiatives across society encompasses actions such as the closure of traditional high-energy-consuming enterprises, adjustments to the industrial structure, reductions in coal-powered electricity generation hours, and the shortening of production times for cement enterprises. Furthermore, it aims to optimize energy structure measures to fully harness energy-saving potential. As a coastal city, Dalian should leverage its industrial strengths in clean energy sources such as wind and hydropower, optimize its energy consumption structure, curtail coal consumption, foster the transition to green energy, and diversify energy usage through technological advancements. These measures constitute effective strategies to optimize the energy landscape and diminish energy carbon emissions intensity.
Regarding the manifold pressures from rapid urbanization on sustainable development, including freshwater supply, sewage treatment, living conditions, and public health, it is advocated that ‘high-density urban populations can bolster efficiency and technological innovation while reducing resource and energy usage’. Therefore, fully harnessing the demographic benefits, managing population size within sustainable limits, promoting low-carbon initiatives nationwide, fostering eco-awareness and ecological civilization, reducing waste and excessive consumption, and advocating for a green, low-carbon, and healthful lifestyle are essential. Currently, Dalian is still in the late stage of industrialization and urbanization, with extensive ongoing development. The increasing demand for a better quality of life leaves considerable room for per capita energy consumption to rise. Emphasizing the potential of nationwide green and low-carbon initiatives is crucial to significantly reducing total end-use energy consumption and carbon emission intensity.
Low-carbon technology innovation serves as a formidable driver in advancing the transformation of energy structures, and Dalian’s robust economic foundation has laid a solid groundwork for the research and development in this domain. Initiatives are increasingly focusing on deploying technologies like photovoltaic power generation, decentralized wind power, diversified energy storage, and high-efficiency heat pumps to enable the seamless integration of diverse energy sources. Hengli Petrochemical, a key enterprise in Wafangdian City, has invested over 300 million yuan to replace all existing fixed motors with variable frequency motors. This initiative aims to achieve energy savings exceeding one million tons of standard coal through the implementation of new high-efficiency catalysts, the transformation of depropanizing column systems, and the recovery of heat from exhaust gasses and circulating water, among other strategies. Yisheng Shanshong Chemical Group in Changhai County has successfully implemented heat recovery from its systems, resulting in energy savings and carbon reductions amounting to 60,000 tons of standard coal. Increased investments in scientific research and development are strategically aimed at advancing pivotal technologies in clean energy, energy conservation, carbon reduction in key industries, pollution control, ecological conservation, and efficient resource cycling. Dalian City comprises 13 districts and counties, each characterized by distinct functional orientations and leading industries. For example, Ganjingzi District prioritizes high-end equipment manufacturing and biomedicine, whereas Jinzhou District concentrates on advancing next-generation automobiles and public safety-related industries. Each district, city, and county must clearly delineate its strategic positioning, capitalize on its leading industries’ strengths, promote their enhancement and transformation, foster regional cooperation, and bolster integration across the upstream and downstream sectors of the industrial chain.
Prioritizing the enhancement of economic growth quality over its speed is essential. The 19th CPC National Congress report critically assessed that China’s economic growth has transitioned into a ‘period of speed shift’, aiming to enhance quality and efficiency, marking a shift from rapid growth to high-quality development. In the analysis of factors across various regions of Dalian, the economic scale effect only slows down in Zhongshan District, Xigang District, and Shahekou District, while other areas show a positive driving effect. Therefore, coordinating the relationship between high-quality economic development and environmental sustainability is a key focus for the city’s future growth. This includes building resilient infrastructure, promoting inclusive and sustainable industries, fostering innovation, and adjusting the industrial structure to enhance the efficiency and value-added contribution of the service-oriented tertiary industry. The proactive advancement of next-generation technologies, such as artificial intelligence, 5G infrastructure, new materials, and low-carbon technologies, through advanced IT, management practices, and big data analytics will directly foster high-quality economic growth, elevate regional GDP, and increase value-added contributions from the tertiary sector.

8. The Limitations

This paper proposes specific policy recommendations for emission reduction, but also identifies areas requiring further exploration. Firstly, there are some limitations in the selection of factors, including but not limited to policy orientation, innovation level, and micro-level factors such as residents’ income and climate. Based on data availability, future research can quantify these indicators and examine the impact of driving factors on carbon emissions from both macro and micro perspectives in greater depth. Secondly, enhancing the accuracy of parameter settings in scenario analysis is crucial, as certain indicators rely too heavily on subjective judgment and lack objective measurement. Future studies could incorporate dynamic simulations and other methods to more effectively manage the uncertainty of factor changes.

Author Contributions

Conceptualization, Y.S. and L.Z.; methodology, L.Z.; software, L.Z. and Y.Y.; data curation, L.Z. and Y.Y.; writing—original draft preparation, Y.S. and L.Z.; writing—review and editing, Y.S. and L.Z.; formal analysis, Y.S. and L.Z.; supervision, Y.S and Y.Y. All authors have read and agreed to the published version of the manuscript.

Funding

This research was funded by grants from the National Natural Science Foundation of China (42201293, 42101260) and the Social Science Planning Fund of Liaoning Province (L24AWT012).

Institutional Review Board Statement

Not applicable.

Informed Consent Statement

Not applicable.

Data Availability Statement

Data are available in a publicly accessible repository.

Conflicts of Interest

The authors declare no conflict of interest. The funders had no role in the design of the study; in the collection, analyses, or interpretation of data; in the writing of the manuscript; or in the decision to publish the results.

References

  1. Han, F.; Xie, R.; Lu, Y.; Fang, J.Y.; Liu, Y. The effects of urban agglomeration economies on carbon emissions: Evidence from Chinese cities. J. Clean. Prod. 2018, 172, 1096–1110. [Google Scholar] [CrossRef]
  2. Wang, X.P.; Feng, Q.; Song, J.C. The spatial association structure evolution of carbon emissions in Chengdu-Chongqing urban agglomeration and its influence mechanism. China Environ. Sci. 2020, 40, 4123–4134. [Google Scholar]
  3. Matthews, H.D.; Wynes, S. Current global efforts are insufficient to limit warming to 1.5 °C. Science 2022, 376, 1404–1409. [Google Scholar] [CrossRef]
  4. Zhang, G.M.; Wang, T.; Lou, Y.Y.; Guang, Z.C.; Zheng, H.J.; Li, Q.; Wu, J.Q. Research on China’s Provincial Carbon Emission Peak Path Based on a LSTM Neural. Chin. J. Manag. Sci. 2022, 32, 1–12. [Google Scholar]
  5. Pang, D.; Li, N.; Li, F.; Feng, K.S.; Peng, L.L.; Wang, Z. Mitigation strategy of Eastern China based on energy-source carbon emission estimation. Acta Sci. Circumstantiae 2021, 41, 1142–1152. [Google Scholar]
  6. Li, X.P.; Sun, S.P.; Zhang, Y.S.; Zhu, X. Carbon emission prediction and carbon peak path analysis in Fujian Province. Resour. Dev. Mark. 2023, 39, 139–147. [Google Scholar]
  7. Liu, J.H.; Wang, J.; Ding, X.Y.; Shao, W.W.; Mei, C.; Li, Z.J.; Wang, K.B. Assessing the mitigation of greenhouse gas emissions from a green infrastructure-based urban drainage system. Appl. Energy 2020, 278, 115686. [Google Scholar] [CrossRef]
  8. Guo, Q.; Ma, Y. Calculation Analysis of Carbon Emission Reduction for Sludge Treatment and Disposal Processes based on Mass Balance Approach. Water Purif. Technol. 2019, 38, 107–111. [Google Scholar]
  9. Jeonghwan, K.; BeomKeun, S.; Taehyoung, L.; Jongho, K.; Saewung, K.; GwiNam, B.; Gangwoong, L. Airborne estimation of SO2 emissions rates from a coal-fired power plant using two top-down methods: A mass balance model and Gaussian footprint approach. Sci. Total Environ. 2022, 855, 158826. [Google Scholar]
  10. Wang, M.; Zhou, Z.X.; Feng, M.M.; She, G.J.; Sun, R.Y. Online CO2 emission monitoring system for coal-fired power plant based on direct measurement and its accuracy verification. Coal Chem. Ind. 2022, 50, 18–21+33. [Google Scholar]
  11. Doll, H.C.; Muller, J.; Elvidge, D.C. Night-time Imagery as a Tool for Global Mapping of Socioeconomic Parameters and Greenhouse Gas Emissions. AMBIO J. Hum. Environ. 2000, 29, 157–162. [Google Scholar] [CrossRef]
  12. Rao, Y.C.; Wang, X.L.; Li, H.K. Forecasting electricity consumption in China’s Pearl River Delta urban agglomeration under the optimal economic growth path with low-carbon goals: Based on data of NPP-VIIRS-like nighttime light. Energy 2024, 294, 130970. [Google Scholar] [CrossRef]
  13. Zheng, Y.M.; Fan, M.L.; Cai, Y.L.; Fu, M.Z.; Yang, K.X.; Wei, C.Y. Spatio-temporal pattern evolution of carbon emissions at the city-county-town scale in Fujian Province based on DMSP/OLS and NPP/VIIRS nighttime light data. J. Clean. Prod. 2024, 442, 140958. [Google Scholar] [CrossRef]
  14. Sun, J.Y.; Qi, Y.B.; Guo, J.W.; Zheng, J.L.; Zhang, L.H.; Yang, X.Y. Impact of nighttime light data saturation correction on the application of carbon emissions spatialization: A comparative study of the correction effect and application effect based on five methods in China. J. Clean. Prod. 2024, 438, 140815. [Google Scholar] [CrossRef]
  15. Li, D.; Han, P.Y.; Li, K.X.; Di, Q.B.; Duan, Y. A Study on the Impact of Urbanization Level on Carbon Emissions Based on the STIRPAT Model: A Case Study of Five Major Urban Agglomerations in Northern China. Sustainability 2024, 16, 6134. [Google Scholar] [CrossRef]
  16. Wang, W.Y.; Wang, J.; Guo, F. Carbon Dioxide (CO2) Emission Reduction Potential in East and South Coastal China: Scenario Analysis Based on STIRPAT. Sustainability 2018, 10, 1836. [Google Scholar] [CrossRef]
  17. Han, N.; Luo, X.Y. Carbon emission peak prediction and reduction potential in Beijing-Tianjin-Hebei region from the perspective of multiple scenarios. J. Nat. Resour. 2022, 37, 1277–1288. [Google Scholar] [CrossRef]
  18. Wang, L.B.; Zhang, Y. Factors Decomposition and Scenario Prediction of Energy-Related CO2 Emissions in China. Electr. Power Constr. 2021, 42, 1–9. [Google Scholar]
  19. Zhang, H.; Li, S. Research on the Factors Influencing CO 2Emission Reduction in High-Energy-Consumption Industries under Carbon Peak. Sustainability 2023, 15, 13437. [Google Scholar] [CrossRef]
  20. Guan, Q. Decomposing and Decoupling the Energy-Related Carbon Emissions in the Beijing–Tianjin–Hebei Region Using the Extended LMDI and Tapio Index Model. Sustainability 2023, 15, 9681. [Google Scholar] [CrossRef]
  21. Nie, W.G.; Duan, H.M. A novel multivariable grey differential dynamic prediction model with new structures and its application to carbon emissions. Eng. Appl. Artif. Intell. 2023, 122, 106174. [Google Scholar] [CrossRef]
  22. Reham, A.; Yousef, A.N.; Arun, K.; Nirajan, S. Projection of Greenhouse Gas Emissions for the Road Transport Sector Based on Multivariate Regression and the Double Exponential Smoothing Model. Sustainability 2020, 12, 9152. [Google Scholar] [CrossRef]
  23. Li, B.; Ding, J.Q.; Yin, Z.Q.; Li, K.Y.; Zhao, X.; Zhang, L.X. Optimized neural network combined model based on the induced ordered weighted averaging operator for vegetable price forecasting. Expert Syst. Appl. 2020, 168, 114232. [Google Scholar] [CrossRef]
  24. Kgaugelo, R.M.; Khumbulani, M.; Tijani, O.A. Energy and Carbon Emission Efficiency Prediction: Applications in Future Transport Manufacturing. Energies 2021, 14, 8466. [Google Scholar] [CrossRef]
  25. Guo, X.; Fang, C. How does urbanization affect energy carbon emissions under the background of carbon neutrality? J. Environ. Manag. 2023, 327, 116878. [Google Scholar]
  26. Su, Z.L.; Yan, W.L.; Li, H.M.; Gao, L.Y.; Shou, W.Q.; Wu, J. Prediction of Agricultural Carbon Emission Based on Improved BP Neural Network with Optimized Sparrow Search Algorithm. Environ. Sci. 2024, 49, 1–15. [Google Scholar]
  27. Chen, Y.D.; Meng, H.; Li, M.K.; Zhang, H.L.; Zhang, C.; Liang, W.; Han, Y.; Ji, J. Transformer Carbon Emission Prediction Model Based on Support Vector Machine. Packging Eng. 2024, 45, 254–261. [Google Scholar]
  28. Vahid, A.; Mark, G. Day ahead carbon emission forecasting of the regional National Electricity Market using machine learning methods. Eng. Appl. Artif. Intell. 2023, 123, 106314. [Google Scholar]
  29. Wang, H.; Wei, Z.J.; Fang, T.; Xie, Q.J.; Li, R.; Fang, D.B. Carbon emissions prediction based on the GIOWA combination forecasting model: A case study of China. J. Clean. Prod. 2024, 445, 141340. [Google Scholar] [CrossRef]
  30. Yang, L.; Wang, M.; Li, L.P.; Yang, R.P. Prediction of carbon emissions of four provinces in the Yangtze River delta region based on STIRPAT model. J. Environ. Eng. Technol. 2024, 45, 1–13. [Google Scholar]
  31. Amira, R.; Han, H.; Abdelhak, A.; Ahmed, M.M. Energy use and energy-related carbon dioxide emissions drivers in Egypt’s economy: Focus on the agricultural sector with a structural decomposition analysis. Energy 2022, 258, 124821. [Google Scholar]
  32. Huang, Y.Z.; Matsumoto, K. Drivers of the change in carbon dioxide emissions under the progress of urbanization in 30 provinces in China: A decomposition analysis. J. Clean. Prod. 2021, 322, 129000. [Google Scholar] [CrossRef]
  33. Chen, J.Q.; Li, X.S.; Geng, Y.W.; Liu, X.C.; Li, G.L. Mechanism analysis and empirical research on urbanization and carbon emissions in China: Based on the perspective of economic development, population transfer, and urban expansion. J. Nat. Resour. 2024, 39, 1399–1417. [Google Scholar] [CrossRef]
  34. Quan, C.G.; Cheng, X.J.; Yu, S.S.; Xin, Y. Analysis on the influencing factors of carbon emission in China’s logistics industry based on LMDI method. Sci. Total Environ. 2020, 734, 138473. [Google Scholar] [CrossRef]
  35. Han, Y.; Ge, X.S. Spatial–Temporal Characteristics and Influencing Factors on Carbon Emissions from Land Use in Suzhou, the World’s Largest Industrial City in China. Sustainability 2023, 15, 13306. [Google Scholar] [CrossRef]
  36. Shao, Z.G.; Li, K.X.; Li, M.D. Research on driving factors and decoupling effect of carbon emissions in China’s transportation industry under the background of “dual carbon”. China Environ. Sci. 2024, 44, 1–13. [Google Scholar]
  37. Li, Z.Y.; Wang, X.Q. Analysis of the influencing factors of China’s coal life-cycle carbon emissions based on LMDI-LCA. Environ. Dev. Sustain. 2023, 26, 17383–17405. [Google Scholar] [CrossRef]
  38. Li, M.Y.; Gao, F.; Sun, B.X.; Liu, Y.; Gong, X.Z.; Nie, Z. Zero carbon-emission technology route construction and multifactor analysis of aluminum production in China. J. Clean. Prod. 2022, 370, 133535. [Google Scholar] [CrossRef]
  39. Ehrlich, P.R.; Holdrens, J.P. The Impact of Population Growth. Science 1971, 171, 1212–1217. [Google Scholar] [CrossRef]
  40. York, R.; Rosa, A.E.; Dietz, T. STIRPAT, IPAT and ImPACT: Analytic tools for unpacking the driving forces of environmental impacts. Ecol. Econ. 2003, 46, 351–365. [Google Scholar] [CrossRef]
  41. Tran, H.; Phan, G.T.T.; Do Quang, B.; Tran, V.P. Comparative evaluation of the performance of improved genetic algorithms and differential evolution for in-core fuel management of a research reactor. Nucl. Eng. Des. 2022, 398, 111953. [Google Scholar] [CrossRef]
  42. Zhang, Y.N.; Pan, J.H. Spatio-temporal simulation and differentiation pattern of carbon emissions in China based on DMSP/OLS nighttime light data. China Environ. Sci. 2019, 39, 1436–1446. [Google Scholar]
  43. Guo, A.J.; Zhang, Y.N.; Fang, Q.; Zhong, F.L. Economic network structure and spatial organization model in Gansu Province. Urban Probl. 2021, 3, 48–56. [Google Scholar]
  44. Li, X.; Li, D.; Xu, H.M.; Wu, C.Q. Intercalibration between DMSP/OLS and VIIRS night-time light images to evaluate city light dynamics of Syria’s major human settlement during Syrian Civil War. Int. J. Remote Sens. 2017, 38, 5934–5951. [Google Scholar] [CrossRef]
  45. Chen, J.D.; Liu, J.L.; Qi, J.; Gao, M.; Cheng, S.L.; Li, K.; Xu, C. City- and county-level spatio-temporal energy consumption and efficiency datasets for China from 1997 to 2017. Sci. Data 2022, 9, 101. [Google Scholar] [CrossRef]
  46. Vedeshin, L.A.; Shapovalov, D.A. The First Scientific and Technical Experiments in Space Earth Sciences (On the 60th Anniversary of Satellite Images of the Earth from Manned Spacecraft). Izv. Atmos. Ocean. Phys. 2023, 58, 1689–1692. [Google Scholar] [CrossRef]
  47. Zhang, B.; Wei, D.Q.; Ding, Y.; Jiang, H.T.; Yin, J. Research on Cities’ Carbon Emissions and Their Spatiotemporal Evolution Coupled with Nighttime Light Image and Land Use Data in the Pearl River Basin. Adv. Earth Sci. 2024, 39, 317–328. [Google Scholar]
  48. Elvidge, C.D.; Baugh, K.E.; Kihn, E.A. Mapping city lights with nighttime data from the DMSP operational linescan system. Photogrammetric. Eng. Remote Sens. 1997, 63, 727–734. [Google Scholar]
  49. Chang, J.B.; Fu, X.T.; Zheng, M.J.; Hao, S.Z. Temporal and Spatial Evolution and Prediction of Energy Consumption Carbon Emissions Based on Night Light Data in Shanxi Province. Environ. Sci. Technol. 2023, 46, 81–89. [Google Scholar]
  50. Guan, J.Y.; Li, D.; Wang, Y.F.; Wang, X.Y. DMSP-OLS and NPP-VIIRS night light image correction in China. Bull. Surv. Mapp. 2021, 67, 1–8. [Google Scholar]
  51. Zhao, M.; Hu, J.; Dai, J.; Li, L.F. The Accounting of CO2 Emissions Based on the Energy Balances. J. Ecol. Econ. 2012, 11, 30–32+157. [Google Scholar]
  52. Wang, M.W.; Che, Y.; Yang, K.; Wang, M.; Xiong, L.J.; Huang, Y.C. A local-scale low-carbon plan based on the STIRPAT model and the scenario method: The case of Minhang District, Shanghai, China. Energy Policy 2011, 39, 6981–6990. [Google Scholar] [CrossRef]
  53. Hu, H. Research on parallel iterative optimization based on BP neural network and genetic algorithm. Mech. Electron. 2019, 316, 28–34. [Google Scholar]
  54. Yu, Y.; Hoshyar, A.N.; Samali, B.; Zhang, G.; Rashidi, M.; Mohammadi, M. Corrosion and coating defect assessment of coal handling and preparation plants (CHPP) using an ensemble of deep convolutional neural networks and decision-level data fusion. Neural Comput. Appl. 2023, 35, 18697–18718. [Google Scholar] [CrossRef]
  55. Wang, L.; Yi, S.; Yu, Y.; Gao, C.; Samali, B. Automated ultrasonic-based diagnosis of concrete compressive damage amidst temperature variations utilizing deep learning. Mech. Syst. Signal Process. 2024, 221, 111719. [Google Scholar] [CrossRef]
  56. Yu, Y.; Zhang, C.; Xie, X.; Yousefi, A.M.; Zhang, G.; Li, J.; Samali, B. Compressive strength evaluation of cement-based materials in sulphate environment using optimized deep learning technology. Dev. Built Environ. 2023, 16, 100298. [Google Scholar] [CrossRef]
  57. Dou, Z.X.; Sun, Y.M.; Zhu, J.H.; Zhou, Z.J. The Evaluation Prediction System for Urban Advanced Manufacturing Development. Systems 2023, 11, 392. [Google Scholar] [CrossRef]
  58. Zhou, C.; Liu, W.L.; Lin, S.T.; Yan, J.N.; Wang, Y.Q. Spatial Effect of Urban Green Technology Innovation on Carbon Emissions in Yangtze River Economic Belt. Resour. Environ. Yangtze Basin 2024, 33, 1833–1843. [Google Scholar]
  59. Fei, T.T.; Ding, X.T.; Que, X.; Lin, J.; Lin, J.; Wang, Z.W.; Liu, J.F. Spatiotemporal Heterogeneity Analysis of Energy Carbon Emission Efficiency in China Based on the SBM-DEA and STWR Model. Environ. Eng. 2024, 43, 1–19. [Google Scholar]
  60. Song, Y.C.; Qin, S.; Jin, C.R. Regional Transport Carbon Emission Forecasting and Peak Carbon Pathway Planning in China. Environ. Sci. 2024, 49, 1–18. [Google Scholar]
  61. Liu, J.H.; Liu, Y.X.; Huang, L. Measurement and Driving Factor Analysis of Carbon Emissions from Tourism Transportation in East China. Res. Environ. Sci. 2024, 37, 626–636. [Google Scholar]
  62. Huang, W.X.; Gao, C.Z.; Wu, B.; Chen, T.; Yang, T.; Zhang, B. Development Path of Guangxi to Reach the Carbon Emission Peak Based on STIRPAT Model. Environ. Sci. 2024, 49, 1–25. [Google Scholar]
  63. Lin, L.Q.; Ma, T.Z. Prediction of carbon peak time of construction industry in Jiangxi Province based on STIRPAT model. Environ. Pollut. Control 2024, 46, 430–434+442. [Google Scholar]
  64. Ji, J.J.; She, D.L.; Alimu, A.B.L.T.; Pan, Y.C. Predicting Dissolved N2O Concentrations from Drainage Ditches in salt-affected farmlands Based on Optimized Backpropagation Neural Network. China Environ. Sci. 2024, 44, 1–10. [Google Scholar]
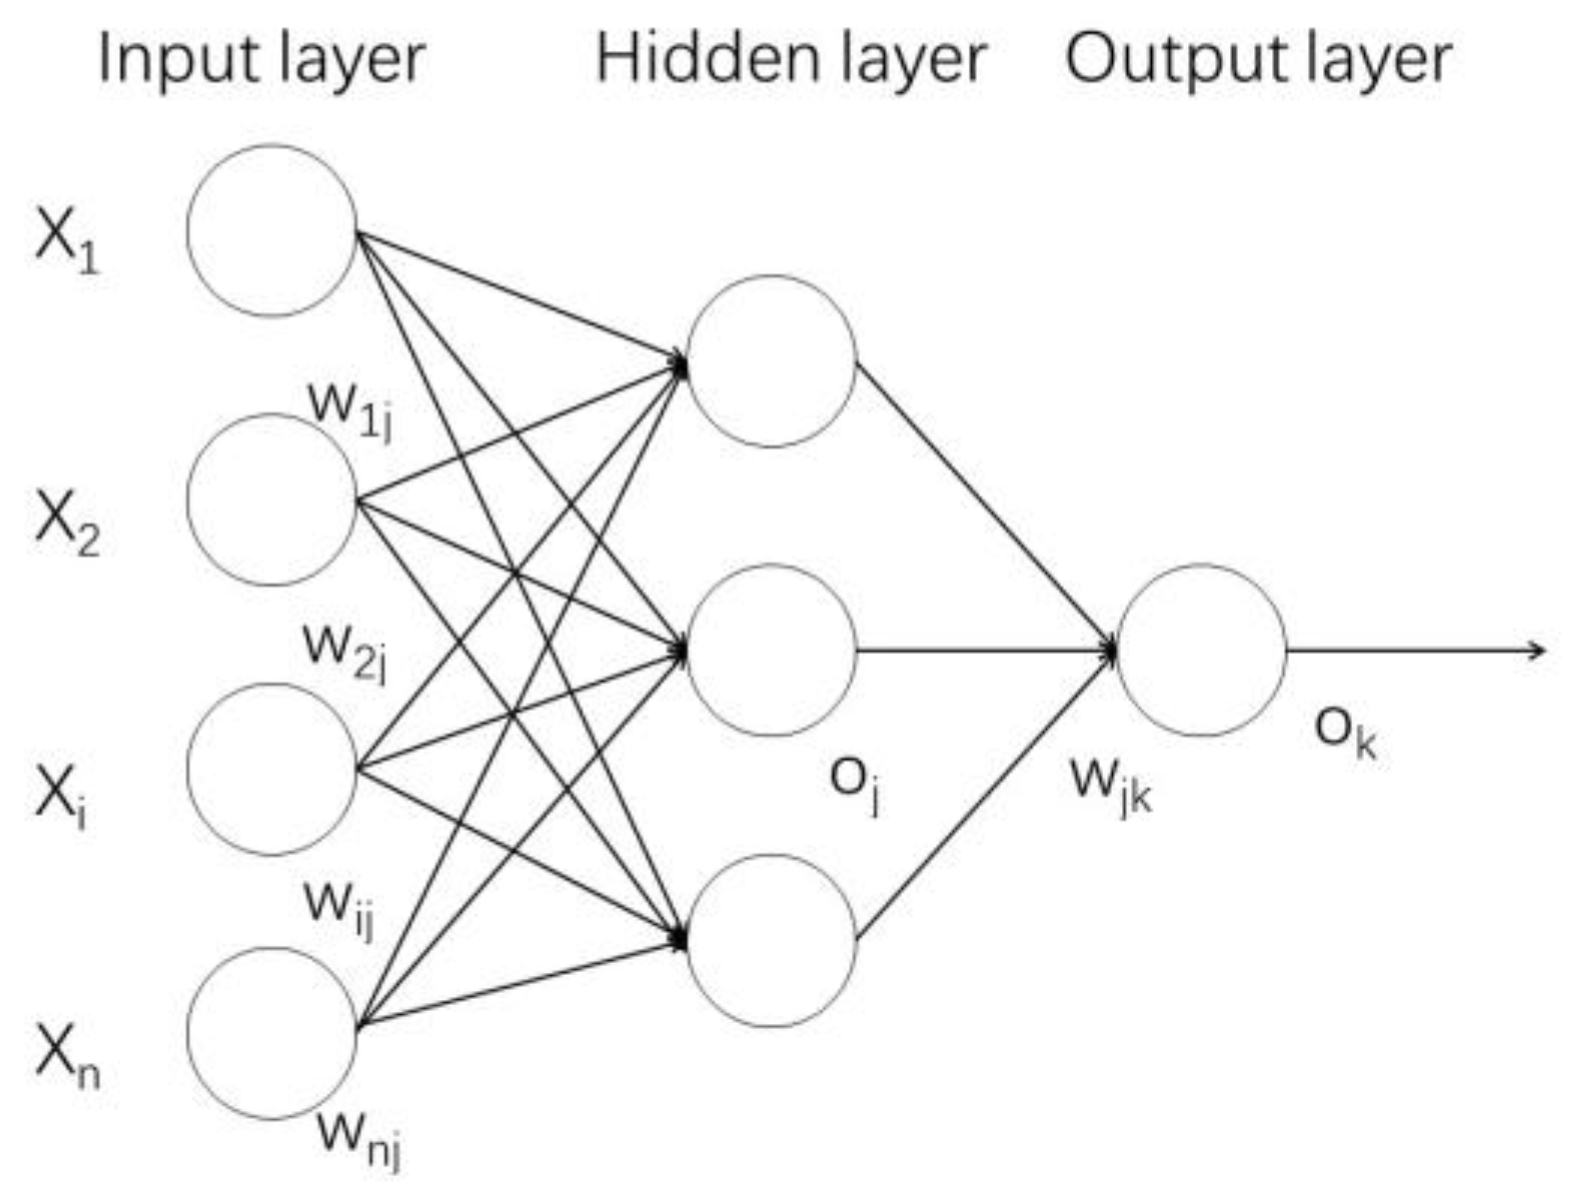
Figure 1. GA-BP structure.
Sustainability 16 08657 g001
Figure 2. Flowchart of GA-BP algorithm.
Sustainability 16 08657 g002
Figure 3. A map of the Dalian City administrative area.
Sustainability 16 08657 g003
Figure 4. Distribution of the contribution value of the effect of each factor.
Sustainability 16 08657 g004
Figure 5. The root mean square error and fitting coefficient corresponding to the number of different hidden layers.
Sustainability 16 08657 g005
Figure 6. Comparison of network training results.
Sustainability 16 08657 g006
Figure 7. Comparison of predicted and actual values of the network.
Sustainability 16 08657 g007
Figure 8. Comparison of BP and GA-BP.
Sustainability 16 08657 g008
Figure 9. Trend in total carbon emissions in Dalian, 2001–2035.
Sustainability 16 08657 g009
Table 1. Literature summary of carbon emissions accounting.
MethodComputational BasisAdvantagesDrawbacksApplication StatusSources
emission factor approachEm = AD × IF
where Em is GHG carbon emissions; AD is activity data; IF is emission factor.
Simple, clear and easy to understand, practical Karma, with lots of references.Emission factors are more geographically specific and have greater uncertaintyWidely used and authoritative, carbon accounting for design energy consumption can be used.[7]
mass balance method∑G0 = ∑G1 + ∑G2
where G0 is the input volume, G1 is the output volume; and G2 is the product loss volume.
Can accurately reflect actual local emissions and capture differences between facilities and equipmentResults are limited by the accuracy of the measurement equipment; statistical errors exist; workload is heavy and data requirements are numerousCan be used to check the accuracy of the results of other methods, mostly applied to accounting for emissions from industrial processes.[8,9]
practical measurement methodG = KQC
where G is the emission of a gas; Q is the medium flow rate; C is the concentration of a gas in the medium; and K is the unit conversion factor.
More precise resultsHigh cost, hard to obtain data, representativeness worth consideringIt should be used for carbon emission sources that are relatively narrow in scope, simple production emission chains, and natural emission sources that have the ability to obtain primary monitoring data, such as land-use change and forests.[10]
Remote-sensing data estimationRemote-sensing light data to extract light values for fittingObjective calculations, simple and clear data sourcesThe raw image data have errors that need to be corrected for useApplied to reflect studies related to human activities as a basis for spatial and temporal distribution studies.[11,12,13,14]
Table 2. Literature summary of carbon emission projections.
MethodVantageDrawbacksApplication StatusSources
STIRPAT modelPanel data are better at overcoming the effects of abrupt structural changes in time-series models, and enlarging the sample size improves the validity of the estimates.Inability to analyze indirect factorsMultiple use as a basis for application in combination with other influencing factor methods[15,16]
LMDI modelFlexible processing; low data requirements, simple and clear, effectively solving the residual problem in the decomposition and the problem of 0 and negative values in the dataIndirect factors and technology effects cannot be analyzed; only direct factors can be studied.It is widely used, mostly for energy structure and efficiency analysis.[18,19,20]
Gray ForecastingModelEfficient calculation results, friendly for less dataCannot analyze data with high complexity and uncertainty, not applicable to analyzing long-term forecasts; high data requirements.Research applied to predicting short- and medium- to long-term trends with small amounts of data.[21]
ARIMA modelSuitable for dealing with time series with trends and those that are non-stationarity; strong applicability to many types of time seriesModel selection is complex and requires repeated trials; for the presence of seasonal time series that capture incomplete featuresMostly applied to time-series data containing trends[24,25]
GA-BP modelsStrong parallel processing capability and robustness to compensate for the lack of local optimal solutionsHigh data requirements; long training timeIt can be applied to a variety of nonlinear, chaotic, and dynamically changing time-series forecasting problems.[26,27,28]
Table 3. Variable Interpretation.
VariableVariantAccount ForUnitData DescriptionSources
population size effectNumber of resident population/X1Year-end resident populationevery ten thousand peopleYear-end resident population[30,31,32,33,34]
Population density/X2Number of people per unit of land areapersons per square kilometerResident population/land area at the end of the year
economic scale effectGDP/X3gross domestic product (GDP)billionsGDP[30,33,34,35,36]
Value added of tertiary sector/X4Value created in the production process of the tertiary sectorbillionsValue added of tertiary industry
energy intensity effectEnergy intensity/X5Energy intensity of comprehensive energy output value of industrial enterprises above scaleten thousand yuan per tons of standard coalEnergy consumption/GDP[30,32,34,35,36,37,38]
Table 4. Description of data sources.
TypologySpecific IndicatorsSource
spatial data
(.shp file)
Provincial and municipal administrative divisions, counties and districts in ChinaDepartment of Natural Resources Geographic Information Management, People’s Republic of China
DMSP/OLS nighttime stabilized light data, NPP/VIIRS monthly average light emission dataNational Oceanic and Atmospheric Administration’s National Centers for Environmental Information (NCEI), related scholars [42,43,44]
Non-spatial data
(excel file)
Population, population densityDalian City Statistical Yearbook 2001–2022, Dalian City Demographic Yearbook 2001–2022
GDP, tertiary value addedDalian City Statistical Yearbook 2001–2022
energy consumptionDalian Statistical Yearbook 2001–2022, related scholars [45]
Table 5. Carbon emission factor coefficients and carbon oxidation rates.
Type of EnergyCarbon Emission Factor Coefficient (Tonnes CO2/Tonne)Carbon Oxidation Rate (%)
raw coal1.9810.97
Other coal washing0.9550.99
coke (processed coal used in blast furnace)2.8600.928
crude oil3.0200.98
petrol2.9250.98
diesel3.0330.98
diesel oil3.0960.982
fuel oil3.1700.985
liquefied petroleum gas3.1010.989
Note: Carbon emission factor coefficients refer to the Urban Greenhouse Gas Accounting Tool 2.0; carbon oxidation rates refer to the Provincial Greenhouse Gas Inventory Guidelines.
Table 6. 2001–2022 Dalian carbon emission fitting regression results.
Fitting Coefficient kThe Goodness-of-Fit R2The Adjusted Goodness-of-Fit R2Significance Level P
0.0300.9830.9820.000
Table 7. Plot of ridge regression results.
VariantCoefficient of ElasticityStandard Errort-Test ValueSignificance LevelAdmissibility FactorAdjustment of the Adjustability FactorF-Test Value
LnX10.3620.02912.4570.000 ***0.9310.930639.458 (0.000 ***)
LnX20.1730.0228.0340.000 ***
LnX30.4170.02219.3860.000 ***
LnX40.8200.03325.2080.000 ***
LnX5−0.1800.015−11.6020.000 ***
constant −1.1020.238−4.6290.000 ***
Note: *** represent the significance level of 1%.
Table 8. Scenario parameter variation range and setting basis.
Parameters and YearUpper ValueUpper QuartileLow ValueSetting Basis
Demographic2023–20262.892.592.29The Population Planning of Dalian City (2021–2030) predicts that “the population will reach 7.45 million in 2025 and 8.3 million in 2030”, and The New Characteristics and Trends of China’s Population Development predicts that “the total population will reach its peak in 2025–2030 and there will be a negative population growth”.
2027–20301.300.990.70
2031–20350.800.500.20
Population density2023–2026−0.30−0.40−0.50Statistics show that the average annual growth rate of population density in Dalian over the past two decades has been 0.40%. Nevertheless, slight changes in the administrative region’s land area have contributed to a declining population trend in Dalian, resulting in an anticipated decrease in the population density indicator.
2027–2030−0.50−0.60−0.70
2031–2035−0.70−0.80−0.90
GDP2023–202615.2014.2013.20The Outline of the Fourteenth Five-Year Plan for the National Economic and Social Development of Dalian City and the Vision for 2035 emphasizes that “GDP should achieve an average annual growth rate of more than 6% by 2025”, and The Action Program for The Revitalization and Development of Dalian City, “Ten New Breakthroughs and Three Years of Exceeding a Trillion” stipulates that “GDP should achieve an average annual growth rate of more than 6% by 2025”.
2027–20307.006.005.00
2031–20357.506.505.50
Tertiary value added2023–20266.065.765.46Statistical data indicate that the average annual growth rate of the added value of Dalian’s tertiary industry over the past two decades was 5.76%.
2027–20303.053.753.45
2031–20353.553.252.95
Energy intensity2023–2026−4.51−4.71−4.91The Outline of the 14th Five-Year Plan emphasizes that “energy consumption per unit of GDP will be reduced by 13%, and energy intensity is expected to be reduced by 30% by 2030 as compared to 2020”, and The Outline of the 14th Five-Year Plan for the National Economic and Social Development of the City of Dalian and the Vision for 2035 stipulates that “energy consumption per unit of GDP will be reduced by 2035 and complete the target set by the State (a cumulative reduction of 13.5%)”.
2027–2030−6.51−6.71−6.91
2031–2035−6.81−7.01−7.21
Table 9. Carbon emission multi-scenario value setting.
SightPPDGDPTHIRDEI
High-carbon scenarioUpper valueUpper valueUpper valueUpper valueMedian quartile
Baseline scenarioMedian quartileMedian quartileMedian quartileMedian quartileMedian quartile
Low-carbon scenariosMedian quartileMedian quartileMedian quartileMedian quartileMedian quartile
Low-carbon optimization scenariosLow valueLow valueLow valueLow valueUpper value
Disclaimer/Publisher’s Note: The statements, opinions and data contained in all publications are solely those of the individual author(s) and contributor(s) and not of MDPI and/or the editor(s). MDPI and/or the editor(s) disclaim responsibility for any injury to people or property resulting from any ideas, methods, instructions or products referred to in the content.