Article

Environmental Assessment and Restoration of the Hunjiang River Basin Based on the DPSIR Framework

1
Ecological Civilization Research Center, North China Electric Power University, Beijing 102206, China
2
MOE Key Laboratory of Resources Environmental Systems Optimization, North China Electric Power University, Beijing 102206, China
*
Author to whom correspondence should be addressed.
Sustainability 2024, 16(19), 8661; https://doi.org/10.3390/su16198661
Submission received: 27 August 2024 / Revised: 3 October 2024 / Accepted: 6 October 2024 / Published: 7 October 2024

Abstract

:
The Hunjiang River, a vital water system in northeastern China, has suffered severe ecological damage due to overexploitation. This study analyzes the basin’s environmental conditions from 2016 to 2020, identifies key restoration factors, and examines practical restoration projects. Investigating five major pollutants (permanganate index, chemical oxygen demand (COD), biochemical oxygen demand, ammonia nitrogen, total phosphorus) in eight sections, the study finds the Xicun section most polluted, mainly from Baishan City’s industrial and domestic discharges. The ammonia nitrogen concentration at the Zian section also shows deterioration. Using a DPSIR (Driving forces, Pressures, State, Impacts, Responses) framework, the study elucidates the relationship between environmental and socio-economic issues. Results indicate that population changes, industrial development, and water resource management have complex ecological impacts. Evaluating the urban water resource carrying capacity with the entropy weight method and correlation coefficient weighting method, the study finds that increasing forest coverage, improving wastewater treatment efficiency, and reducing COD emissions are crucial. Quantitative assessment of integrated protection and restoration projects involving mountains, rivers, forests, farmlands, lakes, and grasslands demonstrates their positive impact. This research reveals the interplay between the ecological environment and social factors, proposes practical restoration measures, and clarifies project effects, providing reliable decision-making schemes for policymakers.

1. Introduction

With the continuous advancement of human civilization, the volume of water extracted for urban, industrial, and agricultural purposes has been steadily increasing, leading to rivers and their basins worldwide being increasingly impacted by human activities [1]. The depletion of water resources and the deterioration of water quality have resulted in severe pollution of the ecological environment in various river basins [2]. However, watershed environmental management is complex, and humans face increasing challenges in balancing conflicting demands on river basins, including ensuring water security, flood control, protecting related ecosystem services, and minimizing biodiversity loss [2,3,4]. Scientifically and efficiently restoring already damaged watershed ecosystems and protecting those not yet affected is a global issue. The Hunjiang River, located in northeastern China, is one of the main tributaries of the Songhua River [5]. This basin is a crucial part of the cultural and economic development of northeastern China, primarily distributed across Jilin and Liaoning provinces, flowing through several major cities [6]. The Hunjiang River Basin (HRB) has also been damaged by human activities, with declining water resources, unstable mainstream water quality, some tributaries exceeding water quality standards, poor water system connectivity, and impaired ecosystem integrity [7], necessitating research to restore the basin’s ecological environment.
The Driving forces-Pressures-State-Impacts-Responses (DPSIR) framework is a method used to address the causal relationships between complex environmental issues and socio-economic factors [8]. This framework utilizes a structured approach to comprehend the complexity of environmental problems and elucidate how various factors interact with socioeconomic systems [9,10]. Decision-makers can analyze these five aspects to explore potential solutions to existing problems and develop more effective environmental policies and management strategies [11]. Currently, this framework has been widely applied in various fields, including urban sustainability research [12], waste management development [13], energy security protection [14], and biodiversity conservation [15]. Moreover, many scholars have employed this framework to address policy and decision-making issues in watershed environmental management. The framework has been widely applied in various water resource studies across different countries, such as water security assessment and water resource sustainability evaluation in China [16,17], sustainable water resource management in South Africa [18], river water pollution analysis in Indonesia [19], and water resource status investigation in Iran [20]. However, the optimization management strategies proposed in existing studies are all macro-level suggestions, lacking specific optimization measures and the ability to evaluate actual optimization effects.
Water Resource Carrying Capacity (WRCC) refers to the maximum scale of population, economy, and society that water resources can support in a given area while ensuring sustainable development and maintaining the current level of socio-economic development [21,22]. Empirical analysis based on WRCC often yields highly targeted and operable conclusions, which are beneficial for water resource planning according to the actual conditions of the studied basin, thereby enhancing the efficiency of water resource management [23,24,25]. Moreover, this method has strong applicability, and the conclusions drawn can also provide references for areas with similar geographic conditions, natural climates, and economic development [26,27]. For instance, Song et al. evaluated the water resource carrying capacity risks in different provinces of China, which helps identify and mitigate both short-term and long-term water resource risks [28]. Peng et al. applied the water resource carrying capacity method to the Tuo River Basin, revealing water environmental issues in the basin and providing guidance for sustainable water resource utilization [29]. Naimi Ait-Aoudia et al. assessed the WRCC of Algiers to determine the population size that the water resources in the Algiers region can support, focusing on water demand and supply factors [30]. The study identified vulnerabilities in the water supply system by simulating the per capita domestic water carrying capacity under various supply conditions and proposed specific improvement measures, such as encouraging residents to use water-saving devices, promoting household rainwater collection, adjusting water prices, and advancing the construction of two dams with a capacity of 266 million cubic meters [30]. Combining the DPSIR framework with the WRCC concept can clarify the relationships between complex environmental issues and various socio-economic factors while proposing more implementable decision-making suggestions. This approach also allows for the evaluation of actual optimization effects, aiding decision-makers in making more efficient decisions.
This study constructs a DPSIR framework to evaluate the environmental issues of four prefecture-level cities through which the Hunjiang River flows. It investigates how driving forces lead to urban pressures, subsequently affecting the state of the Hunjiang River and the impacts of these changes on ecosystems and socio-economic factors. By integrating the WRCC concept, the study analyzes the changes in WRCC over five years in the four cities, examining the relationships between water resource carrying capacity, regional development, environmental protection policies, and climate change. The Pearson correlation coefficient (PCC) method is employed to identify the correlation between various environmental variables and environmental pollution in the HRB. Based on this analysis, specific measures for the restoration and protection of the ecological environment in the HRB are proposed. This study aims to provide practical and effective planning schemes for the ecological environment protection of the HRB to achieve long-term ecological and economic coordinated development in the region.

2. Overview of the Basin

The Hunjiang River is the largest mainstream on the right bank of the Yalu River, originating from the northern side of Wanghuolou Mountain in the Longgang Mountains of the Changbai Mountain Range [31,32]. It spans a total length of 435 km and covers a basin area of 15,144 km2. This basin includes the urban areas of Baishan City and Tonghua City, as well as 49 towns and townships, with a total population of approximately 3.37 million [32]. Currently, there are three medium-sized reservoirs and seven small reservoirs constructed within the HRB. These water conservancy facilities provide significant economic and social benefits in flood control, irrigation, water supply, power generation, and fisheries. The HRB is generally classified as a temperate humid monsoon region, located at the northeastern edge of the global monsoon climate and is also influenced by a continental climate [33]. The main climatic characteristics include distinct seasons: a mild and short spring, a hot and rainy summer, a cool and dry autumn, and a long and cold winter. The annual average temperature ranges from 1.2 to 6.9 °C, with a frost-free period of 115 to 140 days. The coldest month is January, and the hottest month is July. The annual average rainfall is 887.1 mm, with precipitation concentrated from June to September, accounting for 70–80% of the annual total. The long-term average evaporation is 1193 mm [34]. In recent years, due to human activities, the water resources of the Hunjiang River have been decreasing annually, with water quality in some river sections exceeding standards. The reduced connectivity of the water system has compromised the integrity of the ecosystem. Habitat degradation, riverbank hardening, encroachment of buffer zones and wetlands, and reduced water system connectivity have all led to a sharp decline in biological populations. Additionally, vegetation degradation, gully erosion, and severe soil erosion in the middle and lower mountainous areas have resulted in a soil erosion modulus of up to 5000 tons per square kilometer. Urban water sources are under threat. Within 2 km of the mainstream and 1 km of the main tributaries of the Hunjiang River, there are 48 abandoned mines, presenting significant environmental and geological hazard issues. The forest community structure is suboptimal, forest quality and ecological service functions are low, and biodiversity is seriously threatened. Notably, the genetic diversity of protected plants such as Korean pine and Northeast yew has decreased, and populations of plants like the Korean arborvitae have diminished from very small populations to barely detectable individuals [33].

3. Materials and Methods

3.1. Data Source

In 2016, the State Council issued the “Outline of the 13th Five-Year Plan for National Ecological Protection (2016–2020)”, establishing new requirements for national environmental protection efforts. The plan’s implementation was assessed at the end of 2020. Subsequently, in 2020, the National Development and Reform Commission released the “Master Plan for Major Projects on the Protection and Restoration of Key National Ecosystems (2021–2035)”. To effectively implement this master plan, it is essential to review the execution of the “Outline of the 13th Five-Year Plan for National Ecological Protection”. This review highlights the interaction between ecological environments and social factors, proposes practical restoration measures, and clarifies project impacts, thereby providing reliable decision-making frameworks for policymakers. The main pollutant indexes in Hunjiang River Basin are permanganate index, chemical oxygen demand (COD), biochemical oxygen demand, ammonia nitrogen, and total phosphorus. The data of the five major pollutants are all from “Integrated Protection and Restoration Project for Mountains, Rivers, Forests, Farmlands, Lakes, Grasslands, and Deserts in the Hunjiang River Basin, Jilin Province”.

3.2. Construction of the DPSIR Framework

The DPSIR framework serves as a comprehensive model for integrating environmental status information, based on the fundamental idea that driving forces (D) in social and economic activities can lead to changes in environmental state (S) due to the pressures (P) they exert, thereby impacting (I) the ecological environment. Policymakers respond (R) by formulating or adjusting relevant regulations or policies to mitigate the impact on environmental resources and modify the trends of driving forces, pressures, states, and impacts [35,36]. To objectively and scientifically evaluate the current environmental status of the HRB, this study references the research findings of Ding et al. and constructs a DPSIR framework comprising 18 indicators (Table 1) [37]. In this study, driving forces refer to socio-economic processes, with the driving factors affecting water resources including gross domestic product (GDP) per capita, population, urbanization rate, and the proportion of the tertiary industry. Pressures refer to the demands of socio-economic development on water resources, including industrial wastewater discharge, per capita domestic water use, agricultural irrigation water use, and water use per CNY 10,000 of GDP. The state refers to the condition of the ecosystem under the influence of driving forces and pressures, including annual average precipitation, total water resources, per capita water resources, and forest coverage rate. Impacts refer to changes in the urban system development of the HRB caused by driving forces and pressures. The impacts of driving forces, pressures, and states on the HRB are reflected in three indicators: urban greening ratio, urban water supply coverage, and comprehensive urban water price. Responses refer to the various measures taken during the development of the HRB to ensure the sustainable development of the local ecosystem, including COD emission reduction, wastewater treatment rate, and pollution control investment.

3.3. Calculation of WRCC in the HRB—Coupling EWM with CCWM

3.3.1. Entropy Weight Method

The entropy weight method (EWM) is an objective weighting method widely used in the field of multi-indicator comprehensive evaluation [38]. This method determines the weight of each indicator by analyzing the entropy value of each evaluation indicator. The smaller the entropy value, the greater the dispersion of the indicator, and the greater its impact on the comprehensive evaluation [39]. This study uses the EWM to calculate the objective weights of 18 indicators in the DPSIR framework, with the formula as follows [40]:
p i j = x i j j = 1 4 x i j
E i = j = 1 4 p i j ln p i j ln 4
ω i = 1 E i i = 1 18 ( 1 E i )
In the formula, i represents the 18 indicator values in the DPSIR framework; j represents the four major cities the Hunjiang River flows through (Baishan City, Tonghua City, Benxi City, and Dandong City); x i j is the value of indicator i in city j of the HRB; p i j is the normalized value of indicator i in city j of the HRB; E i is the entropy value of indicator i, ranging from 0 , 1 ; ω i is the weight value of indicator i.

3.3.2. Correlation Coefficient Weighting Method

The correlation coefficient weighting method (CCWM) is a subjective weighting method that can better reflect the correlation between each indicator and the evaluation target. This method uses the correlation between the evaluation indicators and the target as the evaluation standard, assigning higher weights to the indicators that are more closely related to the evaluation target. This study uses the CCWM to calculate the subjective weights of the 18 indicators in the DPSIR framework, with the formula as follows:
ρ x , y = cov ( x , y ) D x D y = E x y E x E y D x D y
E x y is the mathematical expectation of the indicator (x, y); E x and E y are the mathematical expectations of indicators x and y, respectively; and D x and D y are the variances of indicators x and y, respectively. ρ x , y represents the similarity of the linear relationship between indicators x and y. To ensure the rationality of the weights of the 18 indicators in the DPSIR framework, this study comprehensively calculates the objective weights obtained by the EWM and the subjective weights obtained by the CCWM. Both weights are considered equally important, each accounting for 50%. The final comprehensive weights of the 18 indicators are obtained accordingly, and the WRCC of the four major cities in the HRB from 2016 to 2020 is calculated based on these weights.

3.4. Correlation Calculation of 18 Indicators in the DPSIR Framework—PCC Method

The PCC method is used to assess whether there is a linear relationship between two continuous variables. This method evaluates the strength of the linear relationship between two variables through the covariance matrix of the data. This study uses the PCC method to analyze the correlation between the 18 indicators and pollutants in the Hunjiang River, with the formula as follows:
r = ( X i X ¯ ) ( Y i Y ¯ ) ( X i X ¯ ) 2 ( Y i Y ¯ ) 2
In the formula, X i and Y i are the values of the two indicators to be evaluated; X ¯ and Y ¯ are the average values of the two types of indicators to be evaluated.

3.5. Evaluation of the Actual Effects of the MRFFLG Project—Objective Weighting Method Coupled with Single-Objective Fuzzy Comprehensive Evaluation

To quantify the actual restoration effects of the Mountains, Rivers, Forests, Farmlands, Lakes, and Grasslands (MRFFLG) project on the HRB ecosystem, this study divides the restoration effects into eight indicators: forest restoration, mine restoration, water ecological environment restoration, wetland restoration, social benefits, economic benefits, ecological benefits, and sustainability. Ten experts were invited to score the restoration effects of these ten indicators.
The Fuzzy Synthetic Evaluation Method is an evaluation method based on the concept of fuzzy mathematics. It uses the importance of various influencing factors as evaluation indicators to assess decision-making objectives affected by multiple factors. In this study, expert scores are used as the data source, and the single-objective fuzzy comprehensive evaluation method is employed to evaluate the actual effects of the MRFFLG project. When performing a fuzzy comprehensive evaluation, the following four operators are commonly used to calculate membership degrees based on different calculation methods: M 1 ( , ) , M 2 ( , ) , M 3 ( , ) , M 4 ( , ) . To ensure the reliability of the results, this study calculates the four operators and comprehensively considers the evaluation effects of the MRFFLG project.

4. Results and Discussion

4.1. Analysis of the Current Pollution Status of the HRB

This study investigated five major pollutants (permanganate index, COD, biochemical oxygen demand, ammonia nitrogen, total phosphorus) at eight sections (Balisao, Minzhu, Largu River Entrance, Xicun, Qujiaying Reservoir, Taoyuan Reservoir, Zian, Jiangyuan) in the HRB from 2016 to 2020, with the results shown in Figure S1. From 2016 to 2020, the COD at the Xicun section was the highest. Except for 2019, the permanganate index at the Xicun section was the highest in the other four years. Except for 2018, the biochemical oxygen demand at the Xicun section was the highest in the other four years. These results indicate that pollution at the Xicun section is relatively severe, influenced by industrial and domestic discharges from the main urban area of Baishan City, with concentrations of various pollutants consistently exceeding the national Class III water quality standards. Except for 2020, the ammonia nitrogen concentration at the Zian section was the highest in the other four years. The Zian section is located in the industrial and agricultural water use area of Tonghua City and is a section before the Hani River flows into the mainstream of the Hunjiang River. Affected by non-point source pollution and uncontained sewage in the catchment area, the water quality showed a deteriorating trend from 2016 to 2019, with ammonia nitrogen levels exceeding Class V standards. In 2016–2017, the total phosphorus concentration was highest at the Minzhu section, in 2018–2019 at the Xicun section, and in 2020 at the Largu River Entrance. Compared to the other four types of pollutants, total phosphorus pollution is more uncertain.
The above results indicate that the environmental pollution issues in the HRB urgently need to be addressed. Further environmental regulatory measures should be implemented, such as improving the treatment efficiency of industrial wastewater and enhancing the construction and operation of urban sewage treatment facilities [41]. Attention should be paid to agricultural non-point source pollution and industrial emissions, and more effective agricultural water management and industrial wastewater treatment strategies should be implemented [42]. The pollution problem in the Yellow River Basin shares similarities with HRB, with agricultural and industrial emissions being key factors leading to water quality deterioration [43]. Previous studies have shown that optimizing agricultural irrigation and promoting advanced wastewater treatment technologies can effectively reduce the levels of ammonia nitrogen and phosphorus in water bodies [44]. Meanwhile, the fluctuating distribution of total phosphorus highlights the complexity of pollutant transport and transformation processes within the basin [45]. Previous studies have shown that total phosphorus pollution is not only related to agricultural emissions, but also closely related to rainfall erosion, soil erosion, and hydrological changes within the watershed. Therefore, the total phosphorus concentration within HRB exhibits a fluctuating pattern [46]. More research is needed to understand the sources, migration pathways, and environmental impacts of these pollutants.

4.2. Environmental Assessment of the HRB Based on the DPSIR Framework

This study constructs the DPSIR framework for the four major prefecture-level cities—Baishan City, Tonghua City, Benxi City, and Dandong City—through which the HRB flows from 2016 to 2020, with the results shown in Table S1. For Baishan City, population is the primary driving force. From 2016 to 2020, the population of Baishan City decreased annually by 28%, significantly impacting the city’s water resource management and environmental conditions. Specifically, the population decline led to a decreasing trend in three key water resource pressure indicators: per capita domestic water use, agricultural irrigation water use, and water use per CNY 10,000 of GDP. This trend has a complex impact on the urban environment. The annual decrease in these three pressure indicators reduces the pressure on water resource utilization, creating conditions for increasing the urban greening ratio and water supply coverage. This indicates that with a declining population, Baishan City has more water resources available for urban greening and improving water supply coverage, potentially enhancing the urban ecological environment [47]. Meanwhile, during this period, the Baishan City government increased its efforts to develop the tertiary industry, with its proportion rising annually. This policy positively influenced the improvement of wastewater treatment capacity. The continuous increase in the wastewater treatment rate contributes to ecosystem restoration, which is also reflected in the annual growth of the forest coverage rate in Baishan City [48]. This indicates that the government has adopted proactive strategies for environmental protection and sustainable development, achieving certain results. However, Baishan City faces severe challenges in environmental infrastructure. The city’s sewage treatment facilities are aging, and the sewage collection and treatment capacity is insufficient. Overflow problems at sewage treatment plants are particularly severe during the rainy season. The root of this problem lies in the incomplete coverage of the rainwater-sewage diversion system and the relatively outdated technology of sewage treatment plants. Additionally, the decline in sewage treatment efficiency during winter and the lack of adequate sewage treatment facilities in small towns exacerbate this issue. Although the government has increased investment in pollution control annually, the effects of these investments have not yet reached the level required to improve urban infrastructure and address environmental challenges. Therefore, the annual average precipitation and total water resources in Baishan City show fluctuations, reflecting challenges in water resource management and environmental protection [49]. Overall, Baishan City has made certain achievements in addressing population changes, promoting industrial restructuring, and improving environmental infrastructure, but it also faces numerous challenges. Future development strategies should focus more on environmental protection and sustainable development while improving urban infrastructure to achieve more comprehensive and balanced urban development.
The situation in Tonghua City is similar to Baishan City in some aspects, but it also has its unique characteristics. The population decline in Tonghua City has similarly led to a decrease in water resource pressure indicators, increasing urban water supply coverage. In Baishan City and Tonghua City, population decline has led to a decrease in water resource pressure indicators, thereby improving the availability of water resources. Previous studies have shown that similar phenomena have also occurred in areas with declining populations, where water resource utilization pressure has decreased and more resources are being used to improve the urban ecological environment [50]. With the rise in the urbanization rate and the proportion of the tertiary industry, the demand structure for water resources in the city has changed, promoting the optimization of water resource management. The emphasis on ecological civilization construction has led to a steady increase in forest coverage, which is crucial for improving the city’s ecological quality and residents’ quality of life [51]. Previous studies have shown that urban green spaces contribute to the protection and management of water resources [52]. However, soil erosion and the uneven distribution of water resources remain significant challenges for Tonghua City [53]. These issues not only affect the progress of urban greening but also pose a threat to the overall water resource management of the city. Consequently, the urban greening ratio in Tonghua City continues to fluctuate, leading to variations in average precipitation, total water resources, and per capita water resources.
Unlike Baishan City and Tonghua City, the urbanization rate in Benxi City has been decreasing annually, while the proportion of the tertiary industry has been continuously increasing [54]. This change has significantly impacted the use and management of water resources. With the rise of the tertiary industry, traditional industrial activities have decreased, resulting in a significant reduction in industrial wastewater discharge. At the same time, per capita domestic water use and agricultural irrigation water use have also shown a downward trend, which may be related to more effective water resource management and technological advancements [55]. Under the combined influence of these factors, the pressure on water use per CNY 10,000 of GDP has been reduced annually, positively impacting the urban greening ratio and helping Benxi City maintain the highest urban water supply coverage (98.50%) among the four major cities. Although the government has reduced investment in pollution control, Benxi City has achieved significant results in environmental protection by strengthening the control of COD emission reduction and wastewater treatment rates. Existing research indicates that a comprehensive rainwater and sewage separation system is beneficial for alleviating water resource pollution problems [56]. However, Benxi City still faces challenges in water resources and the ecological environment. The fluctuations in key indicators such as annual average precipitation, total water resources, per capita water resources, and forest coverage reflect Benxi City’s vulnerability in addressing climate change and ecological restoration. Particularly, the fluctuations in forest coverage imply ecosystem instability, which may negatively impact soil and water conservation, water source protection, and biodiversity conservation.

4.3. Temporal and Spatial Changes of WRCC in the HRB

This study employs a comprehensive weighting method, combining the EWM with the CCWM, to calculate the Water Resource Carrying Capacity (WRCC) of the four major cities in the HRB under the DPSIR framework from 2016 to 2020, with the results presented in Table 2. From 2016 to 2020, the WRCC of the four major cities in the HRB, except for Benxi City, exhibited a fluctuating trend. The indicators affecting the WRCC of these cities vary: the impact of driving force indicators in Baishan City decreases annually, while the pressure indicators in Tonghua City and Benxi City also show a declining trend. Previous studies have found that the carrying capacity of urban water resources is influenced by the geographical location of the city [57]. For WRCC, driving force indicators represent the water resource demand driven by economic development and human livelihood, primarily influenced by population distribution and economic level. The population of Baishan City is the primary driving factor. From 2016 to 2020, the population of Baishan City decreased annually by 28%, significantly affecting the city’s water resource management and environmental conditions. Pressure indicators mainly reflect the environmental pressure brought by economic development. The changes in industrial structure in Tonghua City and Benxi City have impacted economic cleanliness, thereby affecting WRCC. From 2016 to 2020, the WRCC level of Dandong City has consistently been higher than the other three cities; this is attributed to Dandong City’s superior geographical conditions. Dandong City is an important port city in the Liaoning coastal economic belt and has abundant water systems, including 944 rivers over 2 km in length and 93 rivers with a basin area of over 50 square kilometers [58]. In addition to the Hunjiang River, the Yalu River, Ai River, and Dayang River are also important hydrological reserves for Dandong City, alleviating the WRCC pressure. However, the overall WRCC level of the HRB continues to decline annually, even though the four major cities in the HRB share the WRCC pressure with other water systems. In the HRB, except for the annually increasing response indicators, the other indicators show fluctuating trends, especially the water resource pressure indicators that decrease annually. Although the HRB has intensified its environmental governance responses, the persistent deterioration of environmental pollution problems severely affects water quality, causing the available clean water resources to fail to meet the basin’s development needs. Research has shown that in regions with rapid economic development, as urbanization accelerates and industrialization advances, the carrying capacity of water resources will be under greater pressure, manifested as greater fluctuations in WRCC [59]. Therefore, efforts should be strengthened to identify the pollution characteristics of the HRB, clarify the impact of existing environmental pollution problems on the DPSIR framework, and find effective measures to improve the WRCC of the HRB.

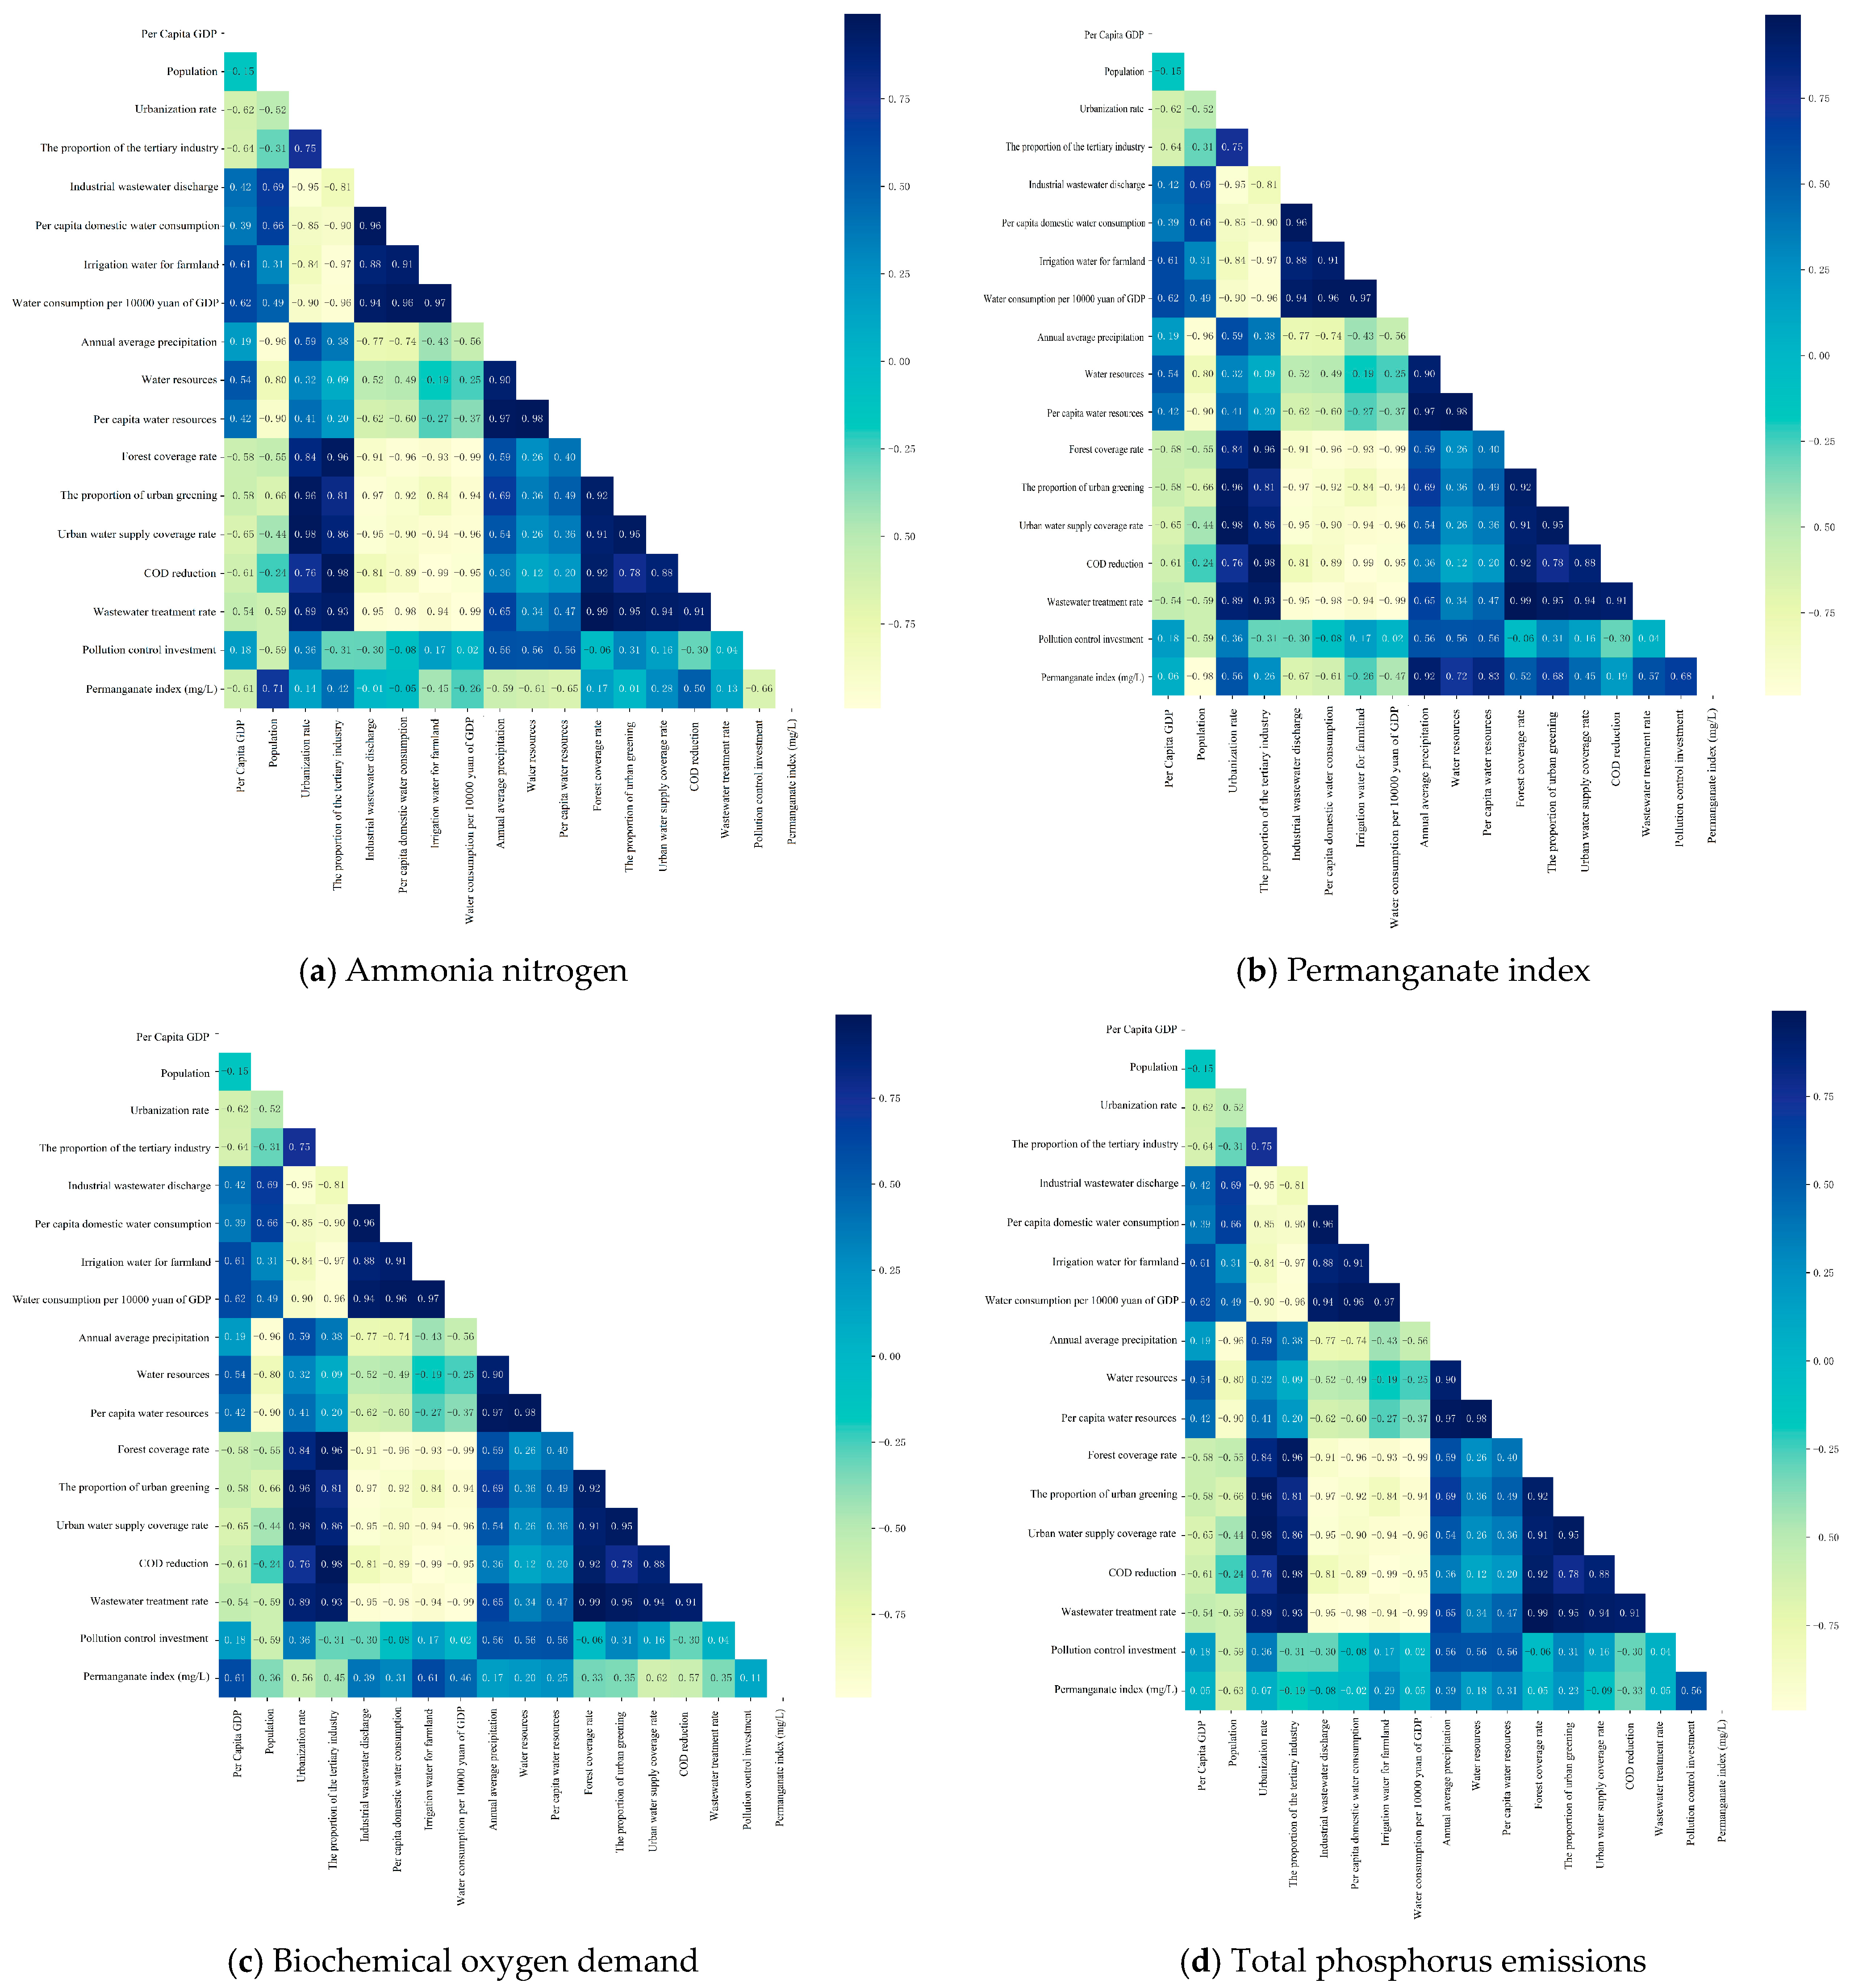
4.4. Impact of Each Indicator in the DPSIR Framework on Pollution in the HRB

To explore the root causes of environmental problems in the HRB and clarify the impact of each indicator in the DPSIR framework on pollution, this study uses the PCC method to analyze the correlation between the 18 indicators in the DPSIR framework and 4 major pollutants in the HRB (ammonia nitrogen, permanganate index, biochemical oxygen demand, and total phosphorus). Due to changes in urban water prices in the four cities of the HRB from 2016 to 2020, this indicator is excluded and replaced with the permanganate index indicator. The results are shown in Figure 1. For the four major pollutants, the positive correlation between forest coverage rate and wastewater treatment rate, the negative correlation between agricultural irrigation water and COD emission reduction, the negative correlation between forest coverage rate and water use per CNY 10,000 of GDP, and the negative correlation between wastewater treatment rate and water use per CNY 10,000 of GDP are the main reasons affecting their emissions. Existing research indicates that forest coverage rate can significantly affect water quality [60]. The higher the forest coverage rate, the stronger the water body’s self-purification capacity [61]. Consequently, the lower levels of ammonia nitrogen, permanganate index, biochemical oxygen demand, and total phosphorus in wastewater that needs to be treated reduces the pressure on wastewater treatment facilities, thus increasing the wastewater treatment rate [62]. The excessive use of pesticides and fertilizers in agricultural operations is one of the main causes of water pollution in the HRB. During irrigation, the residues of pesticides and fertilizers in the farmland infiltrate the soil and enter the surface water [63]. Pesticides and fertilizers are significant sources of pollutants such as ammonia nitrogen, permanganate index, biochemical oxygen demand, and total phosphorus in the environment [64]. An increase in irrigation water uses leads to higher emissions of pollutants, including COD [65].
Forests can enhance soil permeability, promote rainwater infiltration to form groundwater, and increase the regeneration capacity of water sources, playing an essential role in water conservation [66]. Forest ecosystems also provide various services, including climate regulation, biodiversity protection, and carbon sequestration [67]. As forest coverage increases, the ecological environment of the HRB will improve, helping maintain ecosystem stability and creating ecological service value. This will also increase water resource utilization efficiency, reducing water use per CNY 10,000 of GDP and subsequently decreasing the emissions of ammonia nitrogen, permanganate index, biochemical oxygen demand, and total phosphorus. Increasing the wastewater treatment rate facilitates water resource recycling. Efficient wastewater treatment allows treated water to be reused, directly supplying reclaimed water for industrial and agricultural use [68]. This reduces the load on water sources, thereby decreasing water use per CNY 10,000 of GDP and enhancing the economic benefits of water resources. As a result, emissions of ammonia nitrogen, permanganate index, biochemical oxygen demand, and total phosphorus are reduced. In summary, increasing forest coverage, improving wastewater treatment efficiency, and reducing COD emissions are essential measures for achieving environmental restoration and protection in the HRB.

4.5. Quantitative Assessment of Environmental Restoration Effects in the HRB Based on the MRFFLG Project

To achieve environmental restoration and protection in the HRB, an integrated protection and restoration project for MRFFLG has been carried out in Jilin Province, China. This project links MRFFLG, aiming for systematic environmental governance and planning in the HRB. To quantify the extent of environmental restoration in the HRB under the MRFFLG project, this study evaluates eight aspects: forest restoration, mine restoration, water ecological environment restoration, wetland restoration, social benefits, economic benefits, ecological benefits, and sustainability. First, ten experts were invited to score the restoration effects of these ten indicators, with the results shown in Table 3. Based on these results, this study uses the objective weighting method to evaluate the importance of each indicator (Table 4). The top three indicators in terms of weight are social benefits, economic benefits, and water ecological environment restoration. The increase in social benefits indicates that the MRFFLG project has a positive impact on improving the quality of life of residents. The importance of economic benefits reflects the positive impact of the project on the local economy. The implementation of the project has increased employment opportunities, enhanced the value of agricultural and forestry products, and promoted the development of ecological tourism, thereby increasing the income of residents and contributing to environmental sustainability. Water ecological environment restoration is one of the key areas for ecological restoration in the HRB. The project has played a significant role in reducing water pollution, restoring the self-purification capacity of rivers and lakes, and protecting aquatic biodiversity.
To evaluate the restoration effects of the eight indicators, this study uses the membership function to calculate the grades of each indicator’s restoration effects. The results show that the restoration effect of the forest restoration indicator is between good and average, indicating that the forest ecosystem has achieved a certain degree of recovery but still requires further strengthening of forest restoration efforts to ensure the completeness of forest ecosystem functions. The effect of the water ecological environment restoration indicator is rated as average. Although water ecological environment restoration is a key focus of environmental governance in the HRB, challenges exist in the implementation of governance work due to the involvement of multiple cities in Jilin and Liaoning provinces. Research has shown that although the project has made some progress in water ecological environment, the difficulty of watershed management is high due to the involvement of multiple cities in Jilin and Liaoning, and the complexity of the water ecosystem has increased the management time. Previous studies have shown that cross provincial watershed management is more complex than ordinary watersheds [69]. Additionally, the high complexity of aquatic ecosystems means that water environment restoration still requires a long time. In terms of mine restoration, wetland restoration, social benefits, economic benefits, ecological benefits, and sustainability, the restoration effects are all rated as very good, indicating that the project has had significant effects in improving environmental quality, promoting regional socio-economic development, and enhancing ecosystem services. Furthermore, this study evaluates the overall restoration effect of the project through a single-objective fuzzy comprehensive evaluation. The evaluation indicators with the highest probability among the four operator calculation results are all rated as very good. This indicates that the MRFFLG project is an effective means of ecological environment restoration in the HRB, promoting local socio-economic development while ensuring environmental restoration. The MRFFLG project not only improves environmental quality, but also has a positive impact on the living standards of local residents. The increase in employment opportunities, the value-added of agricultural and forestry products, and the development of ecotourism have brought new sources of income to local residents. The combination of economic and social benefits is equally significant in ecological restoration projects worldwide. For example, the Amazon restoration project in South America and China’s Grain for Green project both emphasize the synchronous promotion of environmental protection and economic development [70]. The success of the MRFFLG project demonstrates that through rational planning and multi-party coordination, regional economic development can be promoted while ensuring ecological restoration, enhancing community environmental awareness and participation.

5. Conclusions

This study provides a comprehensive analysis of the environment in the HRB and constructs the DPSIR framework to clarify the relationship between environmental restoration and social conditions in the basin, elucidating the main influencing factors of environmental restoration. The MRFFLG project is introduced as an environmental restoration initiative, and its actual restoration effects are evaluated. The results indicate that the HRB faces severe environmental pollution issues, particularly in the Xicun and Zian sections. The DPSIR framework analysis shows that population changes, industrial structure adjustments, and water resource management significantly impact environmental conditions. The WRCC analysis of each city reveals the complexity of environmental governance responses and the ever-changing demand for water resources. The relationships among forest coverage rate, wastewater treatment rate, agricultural irrigation water use, and COD emission reduction in the DPSIR indicators have a significant impact on pollutant emissions. Additionally, the evaluation of the MRFFLG project shows that the project has achieved significant success in forest restoration, water ecological environment restoration, mine restoration, and socio-economic benefits. In summary, environmental restoration and protection in the HRB require comprehensive management measures, including improving industrial wastewater treatment efficiency, strengthening the construction and operation of urban sewage treatment facilities, and implementing effective agricultural water management and industrial wastewater treatment strategies. Furthermore, the MRFFLG project provides a feasible model for ecological restoration and sustainable development in the HRB and offers valuable reference and guidance for other similar regions.

Supplementary Materials

The following supporting information can be downloaded at: https://www.mdpi.com/article/10.3390/su16198661/s1, Figure S1: Concentration of pollutants in each city; Table S1: Assessment results for each city.

Author Contributions

Conceptualization, S.T.; methodology, H.Y.; software, H.Y.; validation, S.T.; formal analysis, S.T.; investigation, S.T.; resources, S.T.; data curation, S.T.; writing—original draft preparation, S.T.; writing—review and editing, H.Y.; visualization, S.T.; supervision, S.T.; project administration, Y.L.; funding acquisition, S.T. All authors have read and agreed to the published version of the manuscript.

Funding

This research received no external funding.

Institutional Review Board Statement

Not applicable.

Informed Consent Statement

Not applicable.

Data Availability Statement

All data covered in this paper are available from the corresponding author upon request.

Conflicts of Interest

The authors declare no conflicts of interest.

References

  1. Molle, F.; Wester, P.; Hirsch, P. River Basin Closure: Processes, Implications and Responses. Agric. Water Manage. 2010, 97, 569–577. [Google Scholar] [CrossRef]
  2. Vörösmarty, C.J.; Pahl-Wostl, C.; Bunn, S.E.; Lawford, R. Global Water, the Anthropocene and the Transformation of a Science. Curr. Opin. Environ. Sustain. 2013, 5, 539–550. [Google Scholar] [CrossRef]
  3. Vörösmarty, C.J.; McIntyre, P.B.; Gessner, M.O.; Dudgeon, D.; Prusevich, A.; Green, P.; Glidden, S.; Bunn, S.E.; Sullivan, C.A.; Liermann, C.R. Global Threats to Human Water Security and River Biodiversity. Nature 2010, 467, 555–561. [Google Scholar] [CrossRef] [PubMed]
  4. Habersack, H.; Hein, T.; Stanica, A.; Liska, I.; Mair, R.; Jäger, E.; Hauer, C.; Bradley, C. Challenges of River Basin Management: Current Status of, and Prospects for, the River Danube from a River Engineering Perspective. Sci. Total Environ. 2016, 543, 828–845. [Google Scholar] [CrossRef]
  5. Su, X.; Yuan, W.; Xu, W.; Du, S. A Groundwater Vulnerability Assessment Method for Organic Pollution: A Validation Case in the Hun River Basin, Northeastern China. Environ. Earth Sci. 2015, 73, 467–480. [Google Scholar] [CrossRef]
  6. Zhang, Y.; Guan, D.; Jin, C.; Wang, A.; Wu, J.; Yuan, F. Analysis of Impacts of Climate Variability and Human Activity on Streamflow for a River Basin in Northeast China. J. Hydrol. 2011, 410, 239–247. [Google Scholar] [CrossRef]
  7. Jiang, X.; Liu, Y.; Zhao, R. A Framework for Ecological Compensation Assessment: A Case Study in the Upper Hun River Basin, Northeast China. Sustainability 2019, 11, 1205. [Google Scholar] [CrossRef]
  8. Tscherning, K.; Helming, K.; Krippner, B.; Sieber, S.; Paloma, S.G.Y. Does Research Applying the Dpsir Framework Support Decision Making? Land Use Policy 2012, 29, 102–110. [Google Scholar] [CrossRef]
  9. Malmir, M.; Javadi, S.; Moridi, A.; Neshat, A.; Razdar, B. A New Combined Framework for Sustainable Development Using the Dpsir Approach and Numerical Modeling. Geosci. Front. 2021, 12, 101169. [Google Scholar] [CrossRef]
  10. Maxim, L.; Spangenberg, J.H.; O’Connor, M. An Analysis of Risks for Biodiversity under the Dpsir Framework. Ecol. Econ. 2009, 69, 12–23. [Google Scholar] [CrossRef]
  11. Daniels, P.L. Climate Change, Economics and Buddhism—Part 2: New Views and Practices for Sustainable World Economies. Ecol. Econ. 2010, 69, 962–972. [Google Scholar] [CrossRef]
  12. Yang, X.; Yang, Z.; Quan, L.; Xue, B. Pursuing Urban Sustainability in Dynamic Balance Based on the Dpsir Framework: Evidence from Six Chinese Cities. Land 2024, 13, 1334. [Google Scholar] [CrossRef]
  13. Santos, E.; Fonseca, F.; Santiago, A.; Rodrigues, D. Sustainability Indicators Model Applied to Waste Management in Brazil Using the Dpsir Framework. Sustainability 2024, 16, 2192. [Google Scholar] [CrossRef]
  14. Esmaeili, H.; Almassi, M.; Ghahderijani, M. Dpsir Framework to Evaluate and Analyze Iran’s Energy Security. Discov. Appl. Sci. 2024, 6, 25. [Google Scholar] [CrossRef]
  15. Gunawan, H.; Setyawati, T.; Atmoko, T.; Subarudi; Kwatrina, R.T.; Yeny, I.; Yuwati, T.W.; Effendy, R.; Abdullah, L.; Mukhlisi; et al. A Review of Forest Fragmentation in Indonesia under the Dpsir Framework for Biodiversity Conservation Strategies. Glob. Ecol. Conserv. 2024, 51, e02918. [Google Scholar] [CrossRef]
  16. Li, J.; He, W.; Jiang, E.; Yuan, L.; Qu, B.; Degefu, D.M.; Ramsey, T.S. Evaluation and Prediction of Water Security Levels in Northwest China Based on the Dpsir Model. Ecol. Indic. 2024, 163, 112045. [Google Scholar] [CrossRef]
  17. Bai, Y.; Qin, J.; Liu, W.; Li, L.; Wu, Y.; Zhang, P. The Dpsir Model-Based Sustainability Assessment of Urban Water Resources: A Comparative Study of Zhuhai and Macao. Water 2024, 16, 1413. [Google Scholar] [CrossRef]
  18. Georgiou, P.; Mattas, C.; Mattas, K.; Lazaridou, D.; Nastis, S. Sustainable Water Resources Management Based on the Dpsir Framework in East and West African Countries. In Value Chain Dynamics in a Biodiverse Environment: Advances in Biodiversity, Sustainability, and Agri-Food Supply Chain Development; Springer: Berlin/Heidelberg, Germany, 2024; pp. 77–106. [Google Scholar]
  19. Sulastri, W.L.; Sudradjat, A. Analysis of Water Resources Management Using the Dpsir Framework: Driver–Pressure–State–Impact–Response for River Water Pollution in Cilamaya Watershed. Int. J. Adv. Multidiscip. 2024, 3, 407–417. [Google Scholar]
  20. Ebrahim, S.; Jamshidi, D.; Alikaei, S. Development and Application of an Effective Conceptual Framework for the Analysis of Water Resources Based on the Dpsir Technique (Case Study: Bagh Faiz Neighborhood of Tehran). J. Environ. Stud. 2024, 50, 17–41. [Google Scholar]
  21. Lv, A.; Han, Y.; Zhu, W.; Zhang, S.; Zhao, W. Risk Assessment of Water Resources Carrying Capacity in China. JAWRA J. Am. Water Resour. Assoc. 2021, 57, 539–551. [Google Scholar] [CrossRef]
  22. Ren, C.; Guo, P.; Li, M.; Li, R. An Innovative Method for Water Resources Carrying Capacity Research–Metabolic Theory of Regional Water Resources. J. Environ. Manage. 2016, 167, 139–146. [Google Scholar] [CrossRef] [PubMed]
  23. Guo, L.; Zhu, W.; Wei, J.; Wang, L. Water Demand Forecasting and Countermeasures across the Yellow River Basin: Analysis from the Perspective of Water Resources Carrying Capacity. J. Hydrol. Reg. Stud. 2022, 42, 101148. [Google Scholar] [CrossRef]
  24. Wang, Y.; Cheng, H.; Huang, L. Water Resources Carrying Capacity Evaluation of a Dense City Group: A Comprehensive Water Resources Carrying Capacity Evaluation Model of Wuhan Urban Agglomeration. Urban Water J. 2018, 15, 615–625. [Google Scholar] [CrossRef]
  25. Han, Y.; Jia, S. An Assessment of the Water Resources Carrying Capacity in Xinjiang. Water 2022, 14, 1510. [Google Scholar] [CrossRef]
  26. Jia, Z.; Cai, Y.; Chen, Y.; Zeng, W. Regionalization of Water Environmental Carrying Capacity for Supporting the Sustainable Water Resources Management and Development in China. Resour. Conserv. Recycl. 2018, 134, 282–293. [Google Scholar] [CrossRef]
  27. Wang, Y.; Wang, Y.; Su, X.; Qi, L.; Liu, M. Evaluation of the Comprehensive Carrying Capacity of Interprovincial Water Resources in China and the Spatial Effect. J. Hydrol. 2019, 575, 794–809. [Google Scholar] [CrossRef]
  28. Song, Q.; Wang, Z.; Wu, T. Risk Analysis and Assessment of Water Resource Carrying Capacity Based on Weighted Gray Model with Improved Entropy Weighting Method in the Central Plains Region of China. Ecol. Indic. 2024, 160, 111907. [Google Scholar] [CrossRef]
  29. Peng, J.; Tong, H.; Liu, X.; Feng, Y.; Zhu, Y.; Wu, Y.; Chu, Z.; Zheng, B. Comprehensive Evaluation of Water Resources and Environmental Carrying Capacity Based on Dualistic Water Cycle Analysis and Its Application in the Tuo River Basin, China. Ecol. Indic. 2023, 146, 109897. [Google Scholar] [CrossRef]
  30. Naimi Ait-Aoudia, M.; Berezowska-Azzag, E. Water Resources Carrying Capacity Assessment: The Case of Algeria’s Capital City. Habitat Int. 2016, 58, 51–58. [Google Scholar] [CrossRef]
  31. Sheng, H.; Xu, X.M.; Gao, J.H.; Kettner, A.J.; Shi, Y.; Xue, C.F.; Wang, Y.P.; Gao, S. Frequency and Magnitude Variability of Yalu River Flooding: Numerical Analyses for the Last 1000 Years. Hydrol. Earth Syst. Sci. 2020, 24, 4743–4761. [Google Scholar] [CrossRef]
  32. Keevil, H.A.; Monecke, T.; Goldfarb, R.J.; Feng, T. Metallogeny of the Hunjiang Basin, Northeastern North China Block. Ore Geol. Rev. 2022, 148, 104995. [Google Scholar] [CrossRef]
  33. Wang, Y.; Li, Y. Evaluation of Ecosystem Protection and Restoration Effects Based on the Mountain-River-Forest-Field-Lake-Grass Community Concept: A Case Study of the Hunjiang River Basin in Jilin Province, China. Water 2024, 16, 2239. [Google Scholar] [CrossRef]
  34. Keevil, H.A.; Monecke, T.; Goldfarb, R.J.; Möller, A.; Kelly, N.M. Geochronology and Geochemistry of Mesozoic Igneous Rocks of the Hunjiang Basin, Jilin Province, Ne China: Constraints on Regional Tectonic Processes and Lithospheric Delamination of the Eastern North China Block. Gondwana Res. 2019, 68, 127–157. [Google Scholar] [CrossRef]
  35. Xue, H.; Li, S.; Chang, J. Combining Ecosystem Service Relationships and Dpsir Framework to Manage Multiple Ecosystem Services. Environ. Monit. Assess. 2015, 187, 117. [Google Scholar] [CrossRef]
  36. Spanò, M.; Gentile, F.; Davies, C.; Lafortezza, R. The Dpsir Framework in Support of Green Infrastructure Planning: A Case Study in Southern Italy. Land Use Policy 2017, 61, 242–250. [Google Scholar] [CrossRef]
  37. Ding, Y.; Li, X.; Wang, D.; Xu, J.; Yu, Y. Study on Spatial and Temporal Differences of Water Resource Sustainable Development and Its Influencing Factors in the Yellow River Basin, China. Sustainability 2023, 15, 14316. [Google Scholar] [CrossRef]
  38. Delgado, A.; Romero, I. Environmental Conflict Analysis Using an Integrated Grey Clustering and Entropy-Weight Method: A Case Study of a Mining Project in Peru. Environ. Model. Softw. 2016, 77, 108–121. [Google Scholar] [CrossRef]
  39. Xu, H.; Ma, C.; Lian, J.; Xu, K.; Chaima, E. Urban Flooding Risk Assessment Based on an Integrated K-Means Cluster Algorithm and Improved Entropy Weight Method in the Region of Haikou, China. J. Hydrol. 2018, 563, 975–986. [Google Scholar] [CrossRef]
  40. Zhu, Y.; Tian, D.; Yan, F. Effectiveness of Entropy Weight Method in Decision-Making. Math. Probl. Eng. 2020, 2020, 3564835. [Google Scholar]
  41. Wang, Y.J.; Yuan, Y.; Xue, H.; Yu, Y.; Shi, Y.; Wen, H.A.; Xu, M. Analysis on Operation and Water Quality Characteristics of Centralized Wastewater Treatment Plants of Industrial Parks in Yellow River Basin, China. Water 2024, 16, 806. [Google Scholar] [CrossRef]
  42. Jia, X.M.; Zhang, Y.; Afrane, S.; Chen, J.L.; Yang, P.J.; Mao, G.Z. Simulating the Land Use Change Effects on Non-Point Source Pollution in the Duliujian River Basin. Environ. Geochem. Health 2024, 46, 179. [Google Scholar] [CrossRef] [PubMed]
  43. Du, H.B.; Ji, X.P.; Chuai, X.W. Spatial Differentiation and Influencing Factors of Water Pollution-Intensive Industries in the Yellow River Basin, China. Int. J. Environ. Res. Public Health 2022, 19, 497. [Google Scholar] [CrossRef] [PubMed]
  44. Wang, S.Z.; Hu, J.; He, S.J.; Wang, J.L. Removal of Ammonia and Phenol from Saline Chemical Wastewater by Ionizing Radiation: Performance, Mechanism and Toxicity. J. Hazard. Mater. 2022, 433, 128727. [Google Scholar] [CrossRef]
  45. He, J.; Li, C.X.; Tan, X.Y.; Peng, Z.H.; Li, H.D.; Luo, X.H.; Tang, L.; Wei, J.; Tang, C.J.; Yang, W.C.; et al. Driving Factors for Distribution and Transformation of Heavy Metals Speciation in a Zinc Smelting Site. J. Hazard. Mater. 2024, 471, 134413. [Google Scholar] [CrossRef]
  46. Cui, M.M.; Yang, B.; Ren, G.Q.; Stevanato, P.; Fan, X.; Huang, P.; Sun, J.F.; Du, D.L. Increased and Fluctuating Phosphorus Nutrient Availability Positively Affects the Growth of the Invasive Plant Solidago Canadensis. Flora 2023, 309, 152422. [Google Scholar] [CrossRef]
  47. Wang, Z.; Yu, Y.; Zhou, R. A Longitudinal Exploration of the Spatiotemporal Coupling Relationship and Driving Factors between Regional Urban Development and Ecological Quality of Green Space. Ecol. Indic. 2024, 164, 111864. [Google Scholar] [CrossRef]
  48. Wachholz, A.; Jawitz, J.W.; Borchardt, D. From Iron Curtain to Green Belt: Shift from Heterotrophic to Autotrophic Nitrogen Retention in the Elbe River over 35 Years of Passive Restoration. Biogeosciences 2024, 21, 3537–3550. [Google Scholar] [CrossRef]
  49. Chen, S.; Dong, S.N.; Cao, Z.G.; Guo, J.T. A Compound Approach for Monthly Runoff Forecasting Based on Multiscale Analysis and Deep Network with Sequential Structure. Water 2020, 12, 2274. [Google Scholar] [CrossRef]
  50. Larraz, B.; San-Martin, E. A Tale of Two Dams: The Impact of Reservoir Management on Rural Depopulation in Central Spain. Water Resour. Manage. 2021, 35, 4769–4787. [Google Scholar] [CrossRef]
  51. Xia, Q.; Zhang, J.Q.; Chen, Y.A.; Ma, Q.; Peng, J.Y.; Rong, G.Z.; Tong, Z.J.; Liu, X.P. Pollution, Sources and Human Health Risk Assessment of Potentially Toxic Elements in Different Land Use Types under the Background of Industrial Cities. Sustainability 2020, 12, 2121. [Google Scholar] [CrossRef]
  52. Yang, B.; Lee, D. Urban Green Space Arrangement for an Optimal Landscape Planning Strategy for Runoff Reduction. Land 2021, 10, 897. [Google Scholar] [CrossRef]
  53. Cheng, Q.; Yang, Y.H.; Du, Y. Failure Mechanism and Kinematics of the Tonghua Landslide Based on Multidisciplinary Pre- and Post-Failure Data. Landslides 2021, 18, 3857–3874. [Google Scholar] [CrossRef]
  54. Chen, Y.; Zhang, D.N. Evaluation of City Sustainability Using Multi-Criteria Decision-Making Considering Interaction among Criteria in Liaoning Province China. Sustain. Cities Soc. 2020, 59, 102211. [Google Scholar] [CrossRef]
  55. Fan, Y.K.; Ma, S.M. Integrating Fuzzy Analytic Hierarchy Process into Ecosystem Service-Based Spatial Planning: A Case Study of the Shenyang Metropolitan Area, China. Ecol. Inf. 2024, 81, 102625. [Google Scholar] [CrossRef]
  56. Wang, Q.W.; Zhao, R.Z.; Wang, N. Spatially Non-Stationarity Relationships between High-Density Built Environment and Waterlogging Disaster: Insights from Xiamen Island, China. Ecol. Indic. 2024, 162, 112021. [Google Scholar] [CrossRef]
  57. Jiang, H.Y.; He, G. Analysis of Spatial and Temporal Evolution of Regional Water Resources Carrying Capacity and Influencing Factors-Anhui Province as an Example. Sustainability 2023, 15, 11255. [Google Scholar] [CrossRef]
  58. Han, G.X.; Shi, Y.J.; Lu, Y.L.; Liu, C.F.; Cui, H.T.; Zhang, M. Coupling Relation between Urbanization and Ecological Risk of Pahs on Coastal Terrestrial Ecosystem around the Bohai and Yellow Sea. Environ. Pollut. 2021, 268, 115680. [Google Scholar] [CrossRef]
  59. Yang, L.Z.; Chen, Y.Z.; Lu, H.W.; Qiao, Y.F.; Peng, H.; He, P.M.; Zhao, Y.S. Cloud Model Driven Assessment of Interregional Water Ecological Carrying Capacity and Analysis of Its Spatial-Temporal Collaborative Relation. J. Clean. Prod. 2023, 384, 135562. [Google Scholar] [CrossRef]
  60. Li, S.; Li, J.K.; Hao, G.R.; Li, Y.J. Evaluation of Best Management Practices for Non-Point Source Pollution Based on the Swat Model in the Hanjiang River Basin, China. Water Supply 2021, 21, 4563–4580. [Google Scholar] [CrossRef]
  61. Tang, Z.X.; Zhou, Z.X.; Wang, D.; Luo, F.B.; Bai, J.Z.; Fu, Y. Impact of Vegetation Restoration on Ecosystem Services in the Loess Plateau, a Case Study in the Jinghe Watershed, China. Ecol. Indic. 2022, 142, 109183. [Google Scholar] [CrossRef]
  62. Qiu, M.; Wei, X.; Hou, Y.; Spencer, S.A.; Hui, J. Forest Cover, Landscape Patterns, and Water Quality: A Meta-Analysis. Landsc. Ecol. 2023, 38, 877–901. [Google Scholar] [CrossRef]
  63. McKnight, U.S.; Rasmussen, J.J.; Kronvang, B.; Binning, P.J.; Bjerg, P.L. Sources, Occurrence and Predicted Aquatic Impact of Legacy and Contemporary Pesticides in Streams. Environ. Pollut. 2015, 200, 64–76. [Google Scholar] [CrossRef] [PubMed]
  64. Wang, H.; He, P.; Shen, C.; Wu, Z. Effect of Irrigation Amount and Fertilization on Agriculture Non-Point Source Pollution in the Paddy Field. Environ. Sci. Pollut. Res. 2019, 26, 10363–10373. [Google Scholar] [CrossRef] [PubMed]
  65. Chen, S.; Xia, Y.H.; Wan, H.Y.; Wang, R.P.; Lu, Y.Z.; Ao, Y.F.; Zhou, Y.M.; Shang, S.H. Spatiotemporal Patterns and Main Driving Factors of Drainage Water Quality of an Arid Irrigation District with Shallow Groundwater Table. Environ. Sci. Pollut. Res. 2023, 30, 117250–117264. [Google Scholar] [CrossRef] [PubMed]
  66. Pavlidis, G.; Tsihrintzis, V.A. Environmental Benefits and Control of Pollution to Surface Water and Groundwater by Agroforestry Systems: A Review. Water Resour. Manag. 2018, 32, 1–29. [Google Scholar] [CrossRef]
  67. Ali, A. Linking Forest Ecosystem Processes, Functions and Services under Integrative Social-Ecological Research Agenda: Current Knowledge and Perspectives. Sci. Total Environ. 2023, 892, 164768. [Google Scholar] [CrossRef]
  68. Lahlou, F.Z.; Mackey, H.R.R.; Al-Ansari, T. Role of Wastewater in Achieving Carbon and Water Neutral Agricultural Production. J. Clean. Prod. 2022, 339, 130706. [Google Scholar] [CrossRef]
  69. Wan, W.H.; Zheng, H.; Liu, Y.Y.; Zhao, J.S.; Fan, Y.Q.; Fan, H.B. Ecological Compensation Mechanism in a Trans-Provincial River Basin: A Hydrological/Water-Quality Modeling-Based Analysis. Water 2022, 14, 2542. [Google Scholar] [CrossRef]
  70. Garate-Quispe, J.; Herrera-Machaca, M.; Auquipata, V.P.; Aguirre, G.A.; Quispe, S.B.; Carpio-Vargas, E.E. Resilience of Aboveground Biomass of Secondary Forests Following the Abandonment of Gold Mining Activity in the Southeastern Peruvian Amazon. Diversity 2024, 16, 233. [Google Scholar] [CrossRef]
Figure 1. Relationships Between 18 Indicators in the DPSIR Framework and 4 Major Pollutants in the HRB.
Sustainability 16 08661 g001
Table 1. DPSIR Framework for HRB.
FactorIndicatorUnit
Driving forcePer Capita GDP104 CNY
Population104
Urbanization Rate%
Proportion of Tertiary Industry%
StressIndustrial Wastewater Discharge104 t
Per Capita Domestic Water UseM3
Agricultural Irrigation Water Use104 m3
Water Use per CNY 10,000 of GDP104 CNY/m3
StateAnnual Average PrecipitationMm
Total Water Resources108 m3
Per Capita Water Resources104 m3/Person
Forest Coverage Rate%
ImpactUrban Greening Ratio%
Urban Water Supply Coverage%
Comprehensive Urban Water PriceCNY/t
RespondCOD Emission ReductionT
Wastewater Treatment Rate%
Pollution Control Investment108 CNY
Table 2. WRCC of the Four Major Cities in the HRB from 2016 to 2020.
YearCityWRCC
2016Baishan370.06
Tonghua2106.67
Benxi2749.23
Dandong4651.29
2017Baishan565.13
Tonghua2004.68
Benxi2661.43
Dandong4544.10
2018Baishan375.98
Tonghua2202.40
Benxi2515.40
Dandong4325.56
2019Baishan385.41
Tonghua2102.30
Benxi2388.31
Dandong4411.44
2020Baishan397.37
Tonghua2054.19
Benxi2143.98
Dandong4463.22
Table 3. Expert Scores for Each Indicator of the MRFFLG Project.
ExpertForest
Restoration
Mine RehabilitationWater
Ecosystem Restoration
Wetland
Restoration
Social BenefitEconomic BenefitEcological
Benefit
Sustainability
18385818589798091
27890857780899083
38580858284768775
49085909092918585
58590839591888176
68085828083849284
78287818584899086
88386829080769495
99391949392768585
108489928179807979
Table 4. Importance Evaluation of Each Restoration Indicator.
IndicatorWeight
Forest restoration0.0931
Mine rehabilitation0.1062
Water ecosystem restoration0.1352
Wetland restoration0.0988
Social benefit0.1162
Economic benefit0.1638
Ecological benefit0.1620
Sustainability0.1247
Disclaimer/Publisher’s Note: The statements, opinions and data contained in all publications are solely those of the individual author(s) and contributor(s) and not of MDPI and/or the editor(s). MDPI and/or the editor(s) disclaim responsibility for any injury to people or property resulting from any ideas, methods, instructions or products referred to in the content.

