Article

Colour Analysis of Sausages Stuffed with Modified Casings Added with Citrus Peel Extracts Using Hyperspectral Imaging Combined with Multivariate Analysis

1
School of Regional Innovation and Social Design Engineering, Faculty of Engineering, Kitami Institute of Technology, 165 Koen-cho, Kitami 090-8507, Hokkaido, Japan
2
RIKEN Centre for Advanced Photonics, RIKEN, 519-1399 Aramaki-Aoba, Aoba-ku, Sendai 980-0845, Miyagi, Japan
Sustainability 2024, 16(19), 8683; https://doi.org/10.3390/su16198683 (registering DOI)
Submission received: 22 August 2024 / Revised: 4 October 2024 / Accepted: 7 October 2024 / Published: 8 October 2024

Abstract

:
Recycling citrus peel waste offers several significant contributions to sustainability, transforming what would otherwise be discarded into valuable resources. In this study, the colour of sausages stored for 16 days, with varying amounts of orange extract added to the modified casing solution, was evaluated using response surface methodology (RSM) and a hyperspectral imaging system within the spectral range of 350–1100 nm for the first time. To enhance model performance, spectral pre-treatments such as normalisation, first derivative, standard normal variate (SNV), second derivative, and multiplicative scatter correction (MSC) were applied. Both raw and pre-treated spectral data, along with colour attributes, were fitted to a partial least squares regression model. The RSM results indicated that the highest R2 value, 80.61%, was achieved for the b* (yellowness) parameter using a second-order polynomial model. The interactive effects of soy oil and orange extracts on b* were found to be significant (p < 0.05), and the square effects of soy oil on b* were significant at the 1% level. The identified key wavelengths for colour parameters can simplify the model, making it more suitable for practical industrial applications.

1. Introduction

Colour is a crucial factor that significantly affects the acceptance of food products. For instance, oxymyoglobin (MbO2), which is myoglobin in meat combined with oxygen, gives the meat a desirable pink-red colour that consumers typically associate with freshness [1]. However, when MbO2 undergoes autoxidation, it converts into metmyoglobin, turning the meat brown—a colour that consumers often view as stale and unacceptable. Traditionally, meat colour values have been measured using the CIELAB colour space system with instruments like Minolta and Hunter Lab colourimeters [2]. However, these methods depend on measuring random spots across the meat surface and averaging the results, which may not accurately reflect the entire surface [3]. Therefore, it is crucial to develop a rapid and reliable analytical method or tool for accurately quantifying colour and facilitating fast online monitoring.
Hyperspectral imaging (HSI) is an innovative and cutting-edge technology that combines spectroscopy with imaging, enabling the simultaneous acquisition of both spectral and spatial data from a subject [4,5,6,7,8,9,10]. It has gained widespread recognition for its effectiveness in grading and classifying meat products [7], authenticating meat types [11,12,13], and predicting the various quality attributes of meat [14]. Furthermore, HSI has been widely used to monitor total volatile basic nitrogen (TVB-N) levels of meat products [15,16]; hydroxyproline content [17] and bacterial contamination in chicken [18,19]; triphosphate content [5,20], pH [21], and colour in ready-to-eat sausages [3]; and the quality attributes of packaged sausage (bratwurst) [22], beef [23,24,25], and brined pork samples [26,27].
Sausages, among the oldest processed meat products, account for a significant portion of global meat consumption due to their distinct flavour and unique texture [28,29]. While cooking sausages from raw remains popular, there is a growing interest in pre-cooked sausages as part of ready meals [30]. This trend creates new opportunities for producers in the market, particularly for those with limited time for cooking. During cooking, casings must be durable enough to hold the sausage filling [31]. Natural hog casings, known for their excellent tenderness and elasticity, are widely used in sausage production [32,33]. However, casing bursts during manufacturing or drying can significantly disrupt production efficiency. As a result, there is a strong need to enhance the properties of these casings to improve their performance. Santos et al. (2008) investigated how varying concentrations of soy lecithin and soy oil (as a surfactant solution) affected the properties of natural hog casings, finding that treated casings exhibited significantly greater elasticity and tensile strength compared to control samples [34]. Bakker et al. (1999) studied the effects of adding dry/slush salt along with lactic acid, citric acid, and phosphates (P) on the mechanical properties and hygiene of natural casings (hog and sheep casings) [35]. Their research indicated that casings treated with lactic or citric acid inhibited the growth of halophilic bacteria, suggesting these treatments could extend the shelf life of the casings. Subsequently, Feng et al. (2014) combined these methods, leading to modified casings with increased porosity [36]. This porous structure facilitated better pressure release, reducing the likelihood of casing bursts. However, the increased porosity may also make the casings more susceptible to lipid oxidation and microbial growth. To address this, adding natural preservatives could help extend the shelf life of these unique sausages.
The citrus peel contains a significant amount of biologically active compounds, such as phenolic acids and flavonoids, which can be extracted to enhance the reuse and value of these by-products [37,38]. Citrus peels, typically considered waste, often end up in landfills, contributing to the global waste problem [38,39,40]. Large amounts of citrus waste in landfills can lead to methane emissions, a potent greenhouse gas [41,42]. Recycling these peels reduces the volume of organic waste sent to landfills, where it would otherwise decompose and emit greenhouse gases like methane [43], a potent contributor to climate change. Citrus peels are rich in valuable compounds like essential oils [44,45], flavonoids [43,46,47], pectin [48,49,50], and dietary fibres [51,52,53], which can be extracted and used in various industries. These natural compounds can serve as alternatives to synthetic chemicals, reducing the reliance on non-renewable resources. Flavonoids, a major group of dietary phenolics, are commonly found in vegetables, fruits, cereals, and crops [54]. These low molecular weight compounds comprise two benzene rings connected to a heterocyclic pyran ring with oxygen [55]. Flavonoids have antioxidant [56,57,58,59] and antimicrobial properties [60,61,62], which can be used as natural preservatives in food and cosmetics [63,64]. This reduces the need for synthetic chemicals, which can be harmful to both human health and the environment. Moreover, flavonoids are known for their health benefits, including anti-inflammatory [65,66] and antiproliferative properties [67,68]. By using waste citrus peels to produce these beneficial compounds, it supports the development of healthier, more natural products for consumers. By extracting these valuable compounds, the peels can be repurposed, reducing the amount of organic waste generated by the citrus industry. Moreover, utilising waste materials and reducing reliance on synthetic chemicals and materials helps lower the overall carbon footprint of production processes, contributing to climate change mitigation [69]. It would be intriguing to explore how the colour of sausages is affected by modifying casings by adding citrus peel extracts.
As aforementioned, colour is the key quality indicator that consumers rely on to judge sausage’s freshness, maturity, and taste, making it a crucial factor in their purchasing decisions [3]. There is limited information on evaluating the colour of cylinder-shaped sausages stuffed in modified casings with citrus peel extracts using HSI. This study aims to assess how the various combinations of surfactant solutions and orange extract additions impact the colour of sausage stuffed in a modified casing with citrus peel extracts, using hyperspectral imaging along with algorithms. Following this, key wavelengths will be identified to evaluate the colour of sausage with different treatment combinations.

2. Materials and Methods

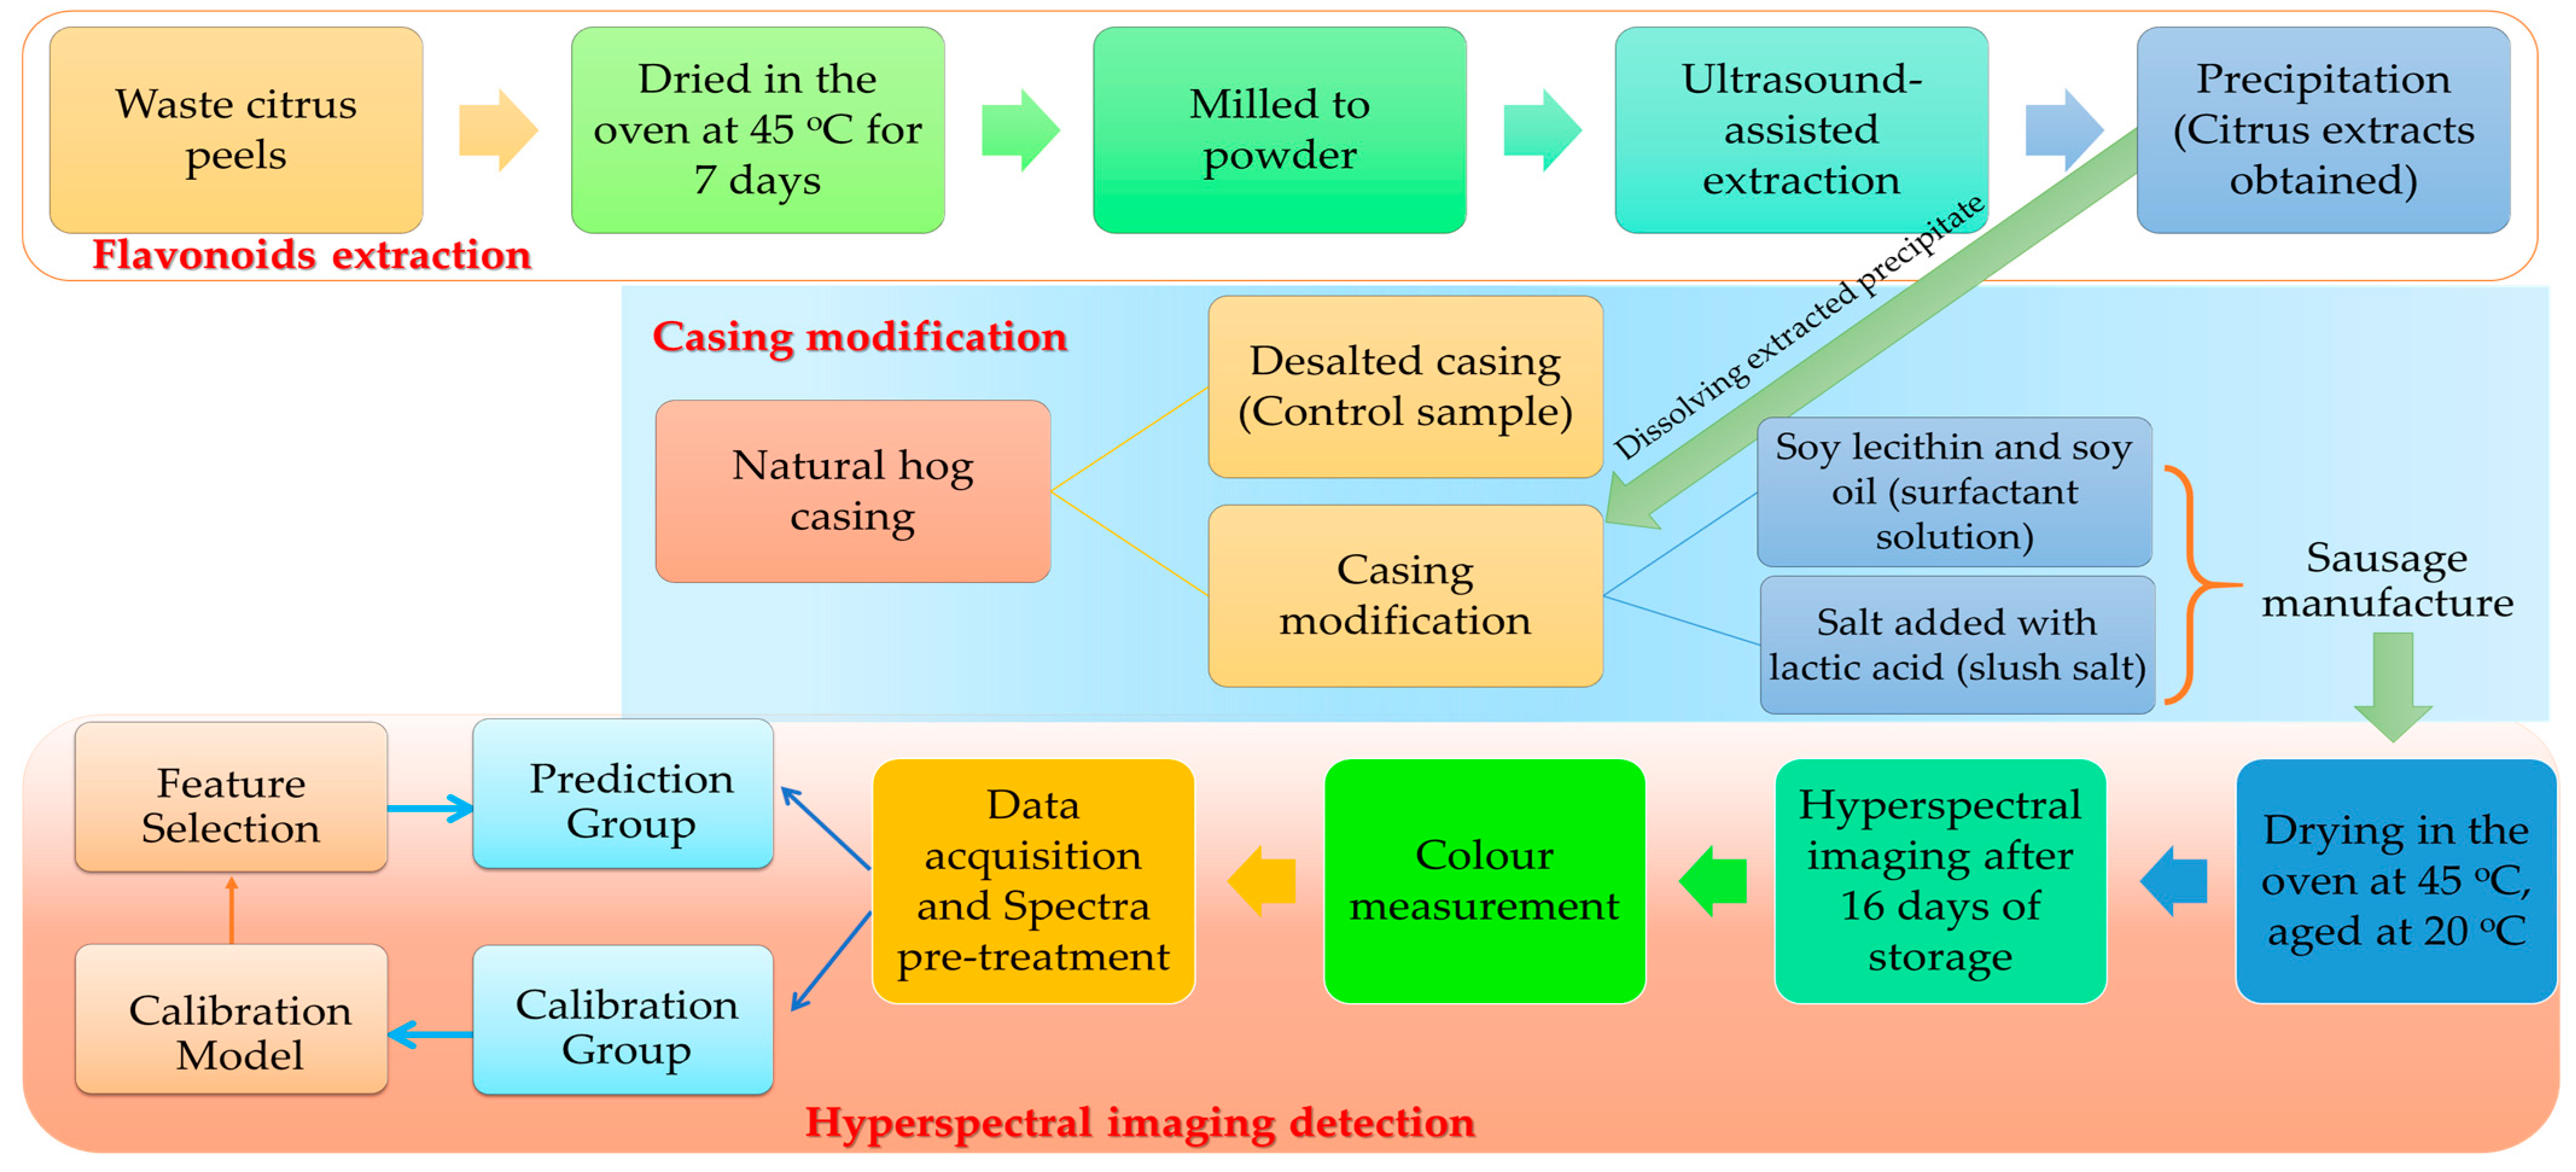
2.1. Sample Preparation

The sausages were prepared as follows. (1) Visible fat was removed from the lean pork, and 30% of pork back fat and 70% of lean pork were sterilely cut into 5 × 5 cm pieces. (2) Approximately 10% of Chinese white wine (52% of ethanol, v/v), 1.7% of spice and seasoning extracts, 2.9% of salt, and 1.7% of sugar were mixed with the pork back fat and lean pork. (3) The mixture was left to cure for 1 h, then ground once using a 5 mm plate. (4) The resulting meat and fat mixture (filling) were stuffed into both modified and control hog casings using a stuffing machine (STX-4000-TB2-PD-BL, Electric Meat Grinder & Sausage Stuffer, STX International, Lincoln, NE, USA). (5) The sausages were twisted into sections and hung in the oven to dry for 24 h at 45 °C, followed by an additional 48 h of ageing at 20 °C. (6) After this process, the sausages were sectioned, sterilised, cut, and vacuum-sealed. The packaged sausage sections were then stored at 4 °C for sixteen days before HSI and colour measurement.
For casing modification, natural hog casings (Pakumogu.com, Niigata Prefecture, Japan) were rinsed with distilled water and placed in a homogenised surfactant solution. The modified solution, composed of soy lecithin and soy oil along with citrus peel extracts, was prepared by dissolving the components in distilled water using magnetic agitation at 325 rpm, heating to 60 °C, and then cooling to 25 °C before adding the casings. The citrus peel extracts were obtained through ultrasound-assisted extraction of waste from Valencia sweet oranges (Citrus sinensis). Detailed information on the extraction process can be found in the study by Feng (2022) [70]. The effects of variables such as soy lecithin (Xα, SL), soy oil (Xβ, SO), treatment time (Xγ, T), the addition of citrus extracts (Xδ, CE), and lactic acid (Xε, LA) in the slush salt were analysed using response surface methodology (RSM). The central composite design (CCD) was carried out with Minitab 21.1 software (Kozo Keikaku Engineering Inc., Tokyo, Japan). After immersing, the casings were removed from the modified solution (without rinsing) and preserved with slush salt and lactic acid.

2.2. Hyperspectral Image Capture and Processing

A laboratory visible near-infrared hyperspectral imaging system (NH-4-KIT, EBA Japan, Tokyo, Japan) with a spectral range of 350 nm to 1100 nm was used for push-broom line-scanning of the sausage surface after 16 days of storage. The system employed a 10-bit charge-coupled device camera with a frame rate of 100 fps and an exposure time of 12.47 ms. It captured a total of 151 contiguous spectral bands at 5 nm intervals. The halogen lamp light source was positioned on three sides of the camera, and a white sheet was used to ensure even light distribution. The calibration of the HSI system was performed using a dark reference (0% reflectance) with the camera lens covered by an opaque cap and a white reference (100% reflectance) before measurement. Imaging acquisition was carried out in reflectance mode at a room temperature of 20 °C. A low reflectance background (black sheet) was utilized to create a strong contrast between the sample and its background. The hyperspectral images were analysed and processed using control software (HSAnalyzer, version 1.2, EBA Japan, Tokyo, Japan), supported by a computer. HSI spectra were extracted and processed with HSAnalyzer software (EBA Japan, Tokyo, Japan). To define the region of interest (ROI), a manual separation process was used to isolate the sample from the background or any undesirable background. The average spectra from the selected ROIs of each sausage were then used to develop the model.
The important wavelengths were identified by selecting the weighted regression coefficients (BW) with the largest absolute values. This approach allows the model to be simplified, potentially enhancing its accuracy by removing noise and redundant information. A new, simplified model was then developed based on these selected wavelengths.

2.3. Colour Measurement

After acquiring hyperspectral images, the surface colours of the sausages were measured using a tristimulus colourimeter (Chroma CM-700D, D65 illuminant, 2° observer; Konica-Minolta Ltd., Osaka, Japan). The colourimeter was calibrated with a standard white calibration plate before taking measurements. The colour was evaluated using the CIELAB colour space system (Commission Internationale de L’éclairage), where L* indicates lightness (ranging from total black at L* = 0 to total white at L* = 100), a* represents the red/green component, and b* indicates the yellow/blue balance. Each measurement was performed in triplicate.
The entire experimental flow is illustrated in Figure 1.

2.4. Chemometrics Analysis and Model Development

For RSM, the CCD approach includes star points to ensure that the design provides consistent information in all directions of the fitted surface, making the design rotatable. The centre point was performed six times to assess the reproducibility of the method, and each combination was tested in a single run, following a randomised order. This approach helps minimize the impact of unexplained variability in the observed responses caused by external factors. After fitting the second-order polynomial model using the response variable (colour parameters) and the five independent variables, the analysis of variance results will show the p-value (the probability value associated with the F-statistic). A commonly used significance level of 5%, which typically indicates a statistically significant difference, is employed to evaluate its effect. For more stringent levels, such as 1%, this indicates greater confidence in the results, with the chance of committing a Type I error (false positive) reduced to 1%.
For the partial least squares regression (PLSR) model, various spectral data pre-treatments were applied, including the first and second derivatives, normalisation, standard normal variate treatment (SNV), and multiplicative scatter correction (MSC), to enhance model performance. One-third of the samples were set aside for the prediction set, while the remaining two-thirds were used for the calibration set. The relationship between antioxidant activity and spectra was analysed using a partial least squares regression model across the full wavelength range. The model’s predictive capabilities were evaluated by comparing metrics such as the determination coefficients of validation (Rv2) and calibration (Rc2), along with the root mean square error of calibration (RMSEC) and validation (RMSEV). The software Vektor Direktor (v1.1, KAX Group, Sydney, Australia) was used to perform the multivariate analyses, including PLSR, and to carry out all necessary computations.

3. Results and Discussion

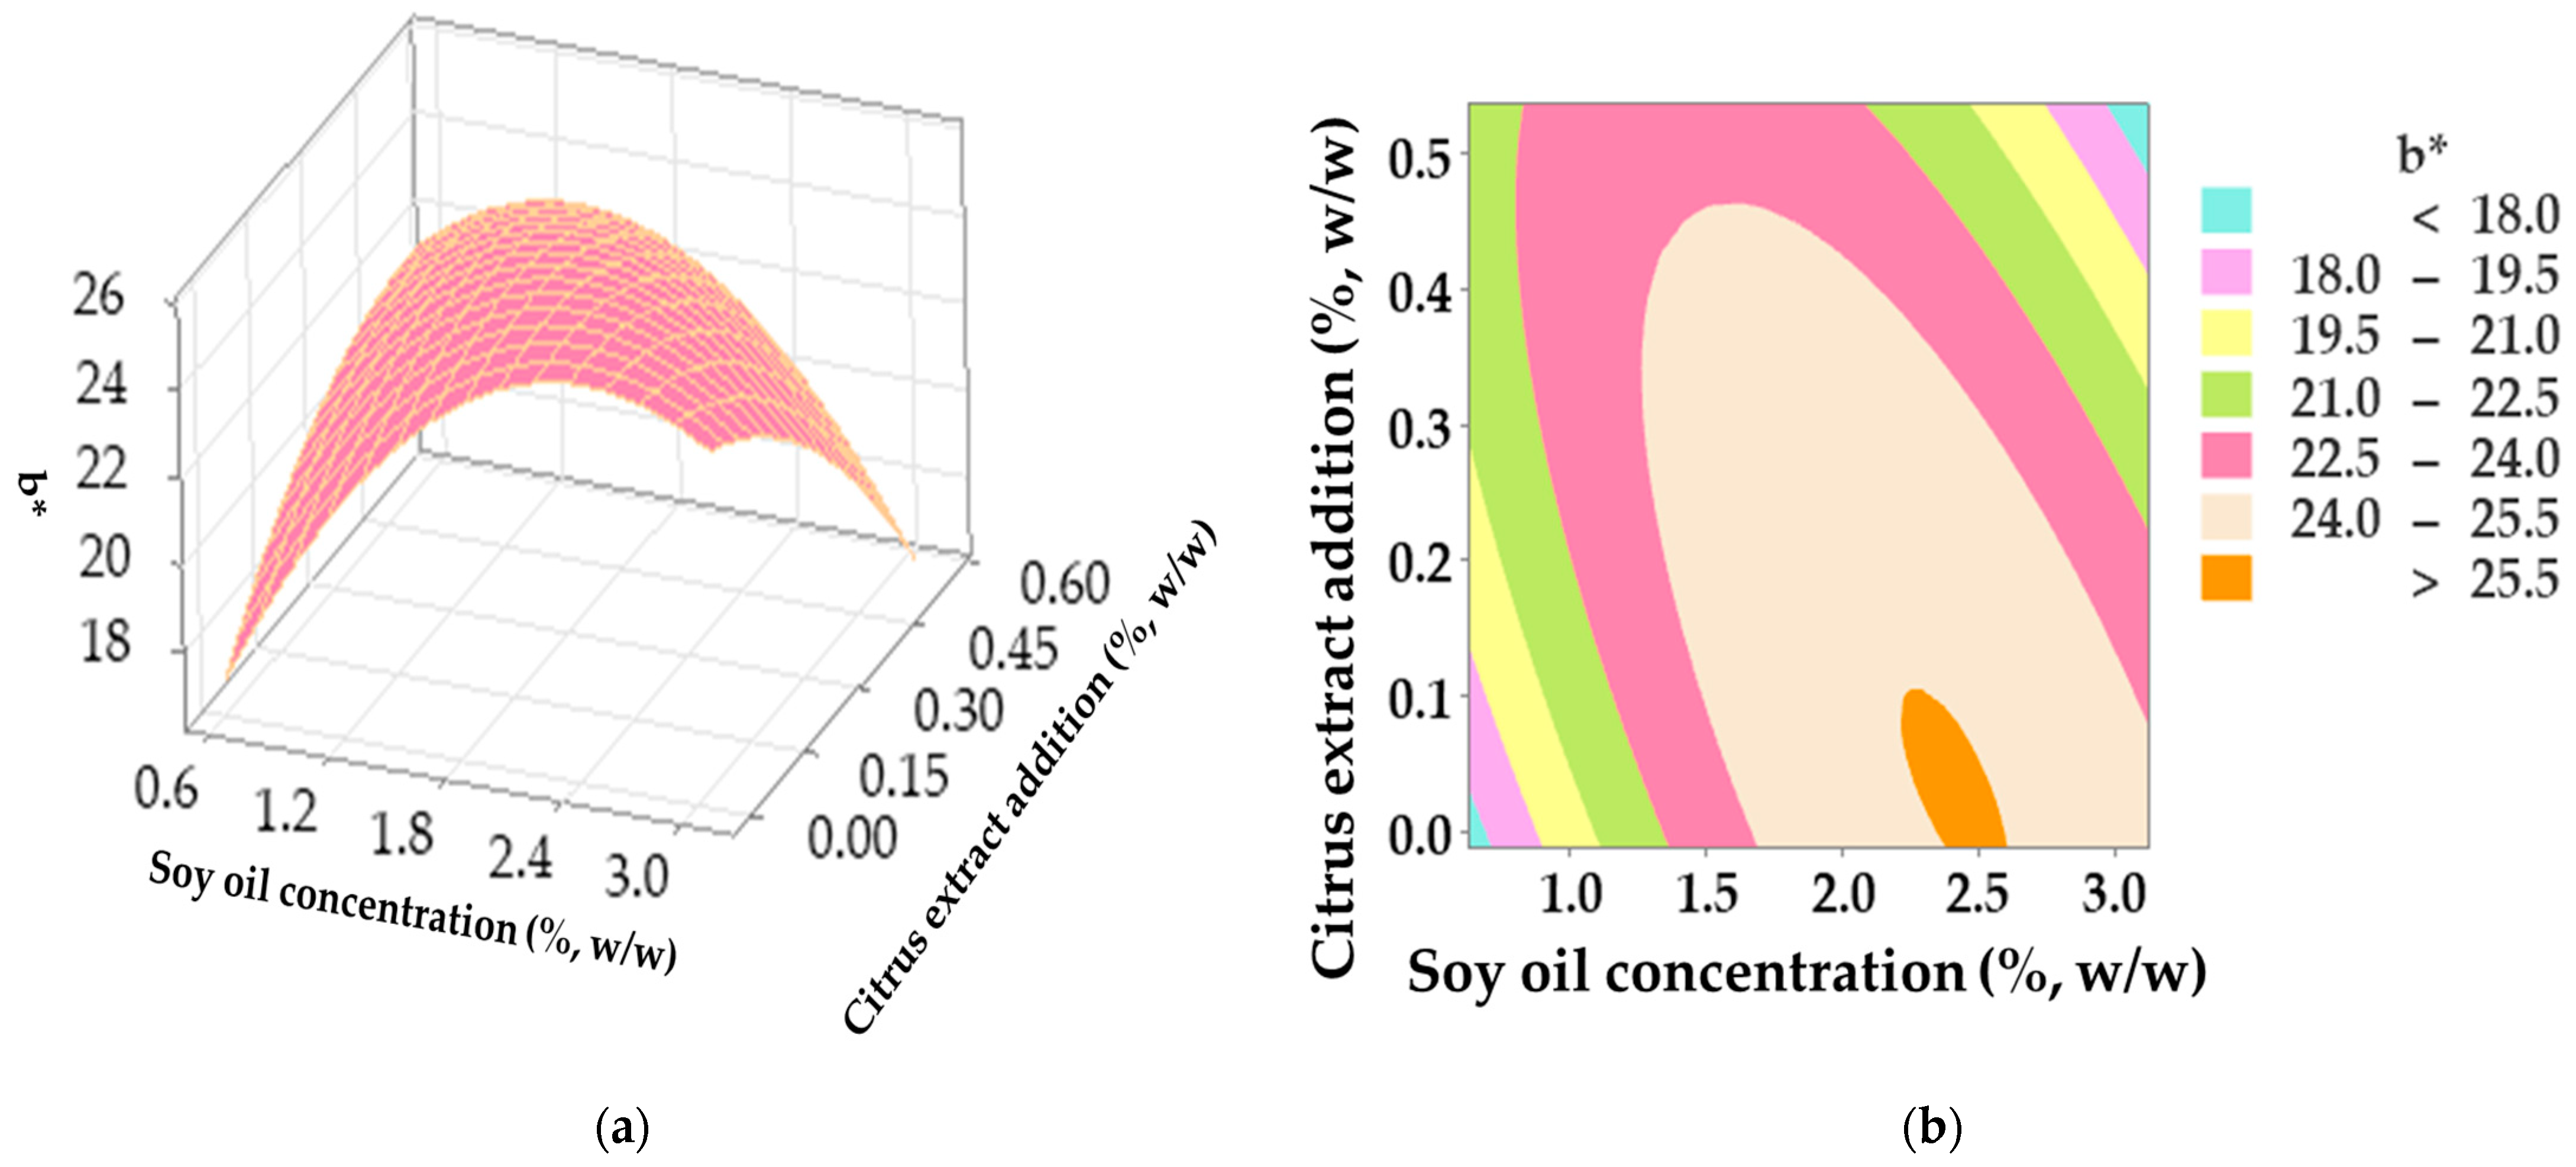
3.1. Effects on the Colour of Sausages Stuffed in Modified Casings with the Addition of Citrus Peel Extracts

The combined effects of the five variables on the colour parameters of the sausage surface were analysed using RSM. The regression model for the b* parameter achieved the highest R2 value at 80.61%, while the L* parameter had the lowest R2 value at 60.79%. It can thus be found that 39.21% of the variation remains unexplained. Sampling variability, such as differences in fat distribution during sausage stuffing, may be one reason for the unexplained luminosity. Another potential reason could be the limitations of the model, as the polynomial model may not fully capture the complexity of the relationship between lightness and the independent variables, leading to omitted variable bias. The lack of fit for the models developed for all textural parameters was insignificant (p > 0.05), indicating that these models were highly reliable. The predicted polynomial equations for the CIELAB attributes, in uncoded units, are as follows:
Y L * = 76.4 + 4.11   X α + 5.6   X β + 0.74   X γ + 87.1   X δ + 8.14   X ε 0.123   X α 2 + 0.78   X β 2 0.00199   X γ 2 + 20.0   X δ 2 0.153   X ε 2 0.991   X α X β 0.0093   X α X γ + 6.21   X α X δ 0.106   X α X ε 0.0422   X β X γ 11.32   X β X δ + 0.074   X β X ε 0.257   X γ X δ 0.0139   X γ X ε 3.95   X δ X ε
Y a * = 2.2 + 4.04   X α + 9.12   X β + 0.014   X γ + 28.2   X δ 1.11   X ε 0.116   X α 2 1.317   X β 2 + 0.000929   X γ 2 11.57   X δ 2 + 0.0565   X ε 2 0.1   X α X β 0.0086   X α X γ + 0.92   X α X δ 0.136   X α X ε 0.0324   X β X γ 0.33   X β X δ 0.063   X β X ε + 0.003   X γ X δ 0.0037   X γ X ε 1.35   X δ X ε
Y b * = 4.6 + 12.26   X α + 16.57   X β + 0.223   X γ + 82.5   X δ 2.25   X ε 0.277   X α 2 2.39   X β 2 + 0.00067   X γ 2 16.8   X δ 2 + 0.119   X ε 2 1.057   X α X β + 0.0066   X α X γ + 1.48   X α X δ 0.477   X α X ε 0.0551   X β X γ 9.03   X β X δ + 0.147   X β X ε 0.158   X γ X δ 0.01   X γ X ε 2.71   X δ X ε
The measured and predicted colour attributes are shown in Table 1. The interaction between soy oil and orange extracts on the b* value was found to be significant (p < 0.05), with the square effect of soy oil on b* being significant at the 1% level (p < 0.01). Based on the corresponding coefficient from Formula (3), the addition of citrus extracts (82.5) had the most significant impact on the b* (yellowness) of the sausage surface after 16 days of storage at 4 °C, although this effect was not significant at the 5% level (p > 0.05). The higher b* value may be due to the orange pigments in the citrus extracts that dye the surface of the modified casing.
For the two-way interactive effects on the b* value, the 3D surface plot [Figure 2a] and 2D contour plot [Figure 2b] demonstrate that the b* value exceeded 22.5 when a high concentration of soy oil (>1.5%) was combined with the addition of orange extracts. A high concentration of soy oil affects the yellowness (b* value) of sausage primarily due to the natural colour of soy oil and its influence on the overall colour of the modified casing. Soy oil has a yellow hue, and when used in higher concentrations, it imparts more of its colour to the modified casing surface, leading to an increase in the b* value, which measures the degree of yellowness in the CIELAB colour space. Additionally, soy oil can influence the distribution and reflection of light on the sausage surface, further enhancing the perception of yellowness. This effect is particularly noticeable when combined with other ingredients, such as orange extracts, which may also contribute to the colour change. The impact of pre-emulsified soybean oil on sausage colour was studied, and the authors observed that the level of soybean oil substitution had a consistent effect only on b* (p < 0.05) [71]. It was noted that the increase in the b* value of samples containing soybean oil could be attributed to the oil’s yellow colour, particularly at higher levels of soybean oil substitution [71]. Although that relevant study measured the cross-sectional cut rather than the surface of the sausage like the current study, the pure white nature of the hog casing is susceptible to dyes from the modified solution, which is composed of abundant pigments from orange extracts and soybean oil. This will definitely affect the yellowness of the sausage’s surface. Cava and Ladero (2023) studied the effects of pomegranate peel extracts on the colour of Iberian dry uncured sausages during ripening [72]. The authors stated that the orange-yellow dye from the pomegranate peel extract, primarily attributed to carotenoids rather than anthocyanins [73], significantly influenced the CIE b*-value of the sausages treated with the extract. Phenolic compounds (such as hesperidin, other flavonoids, and polyphenols) donate electrons or hydrogen atoms to neutralise free radicals, preventing oxidative damage to myoglobin and other pigments. The antioxidant activity of these phenolics helps maintain the reduced (bright red) state of myoglobin by delaying its oxidation to metmyoglobin (which appears brownish). This process helps the sausage retain its fresh, red colour for a longer period, even during storage. Metal ions like iron and copper can catalyse oxidation reactions, but phenolic compounds can bind to these metal ions, reducing their pro-oxidative activity. By preventing lipid oxidation in the sausage, phenolics reduce the formation of secondary oxidation products, such as malondialdehyde (MDA), which can cause further oxidative damage to both lipids and proteins, accelerating colour degradation. By minimising oxidative stress, phenolic compounds slow down the degradation of both pigments and lipids, thus helping to preserve the sausage’s visual appeal. It has been reported that pomegranate peel extracts help inhibit surface discolouration in various muscle foods [74].

3.2. Calibration Model for Colour Parameters at Full Wavelengths

The partial least squares regression model utilised spectral data from the full range of 350 to 1100 nm. For assessing the lightness of samples with modified casings, pre-treatment did not significantly enhance model performance. However, normalisation improved the Rc2 from 0.585 to 0.595 and the Rp2 from 0.338 to 0.379 for redness (a*). When dealing with hyperspectral data, normalisation proves to be more effective than conventional spectrophotometry in achieving a higher signal-to-noise ratio. Normalisation helps mitigate the impact of noise present in the spectra. By scaling the data, normalisation reduces the dominance of noisy or irrelevant features, allowing the PLSR model to better capture the signal related to the target variable. Hyperspectral data can vary significantly in intensity due to differences in sample preparation, measurement conditions, or inherent variability in the spectra. Normalisation adjusts for these differences, ensuring that all spectra are on a comparable scale. This helps the PLSR model focus on the underlying patterns rather than being influenced by variations in intensity. When spectra are normalised, the features (wavelengths) are on a similar scale, which makes it easier for the PLSR algorithm to compare and relate different features. This can improve the model’s ability to identify and use relevant features for prediction. Moreover, normalisation can help reduce multicollinearity, a common issue in hyperspectral data where many features (wavelengths) are highly correlated. By standardising the range and distribution of the data, normalization can make the relationships between features more distinct, thereby improving the model’s performance.
Additionally, the application of first and second derivatives helps to remove background noise and baseline drift while clarifying subtle spectral features. SNV is specifically designed to address variability in reflectance spectra caused by light scattering. For example, spectra pre-treated by SNV enable the prediction of yellowness (b*), although the Rp2 is not very high (Na vs. 0.023).

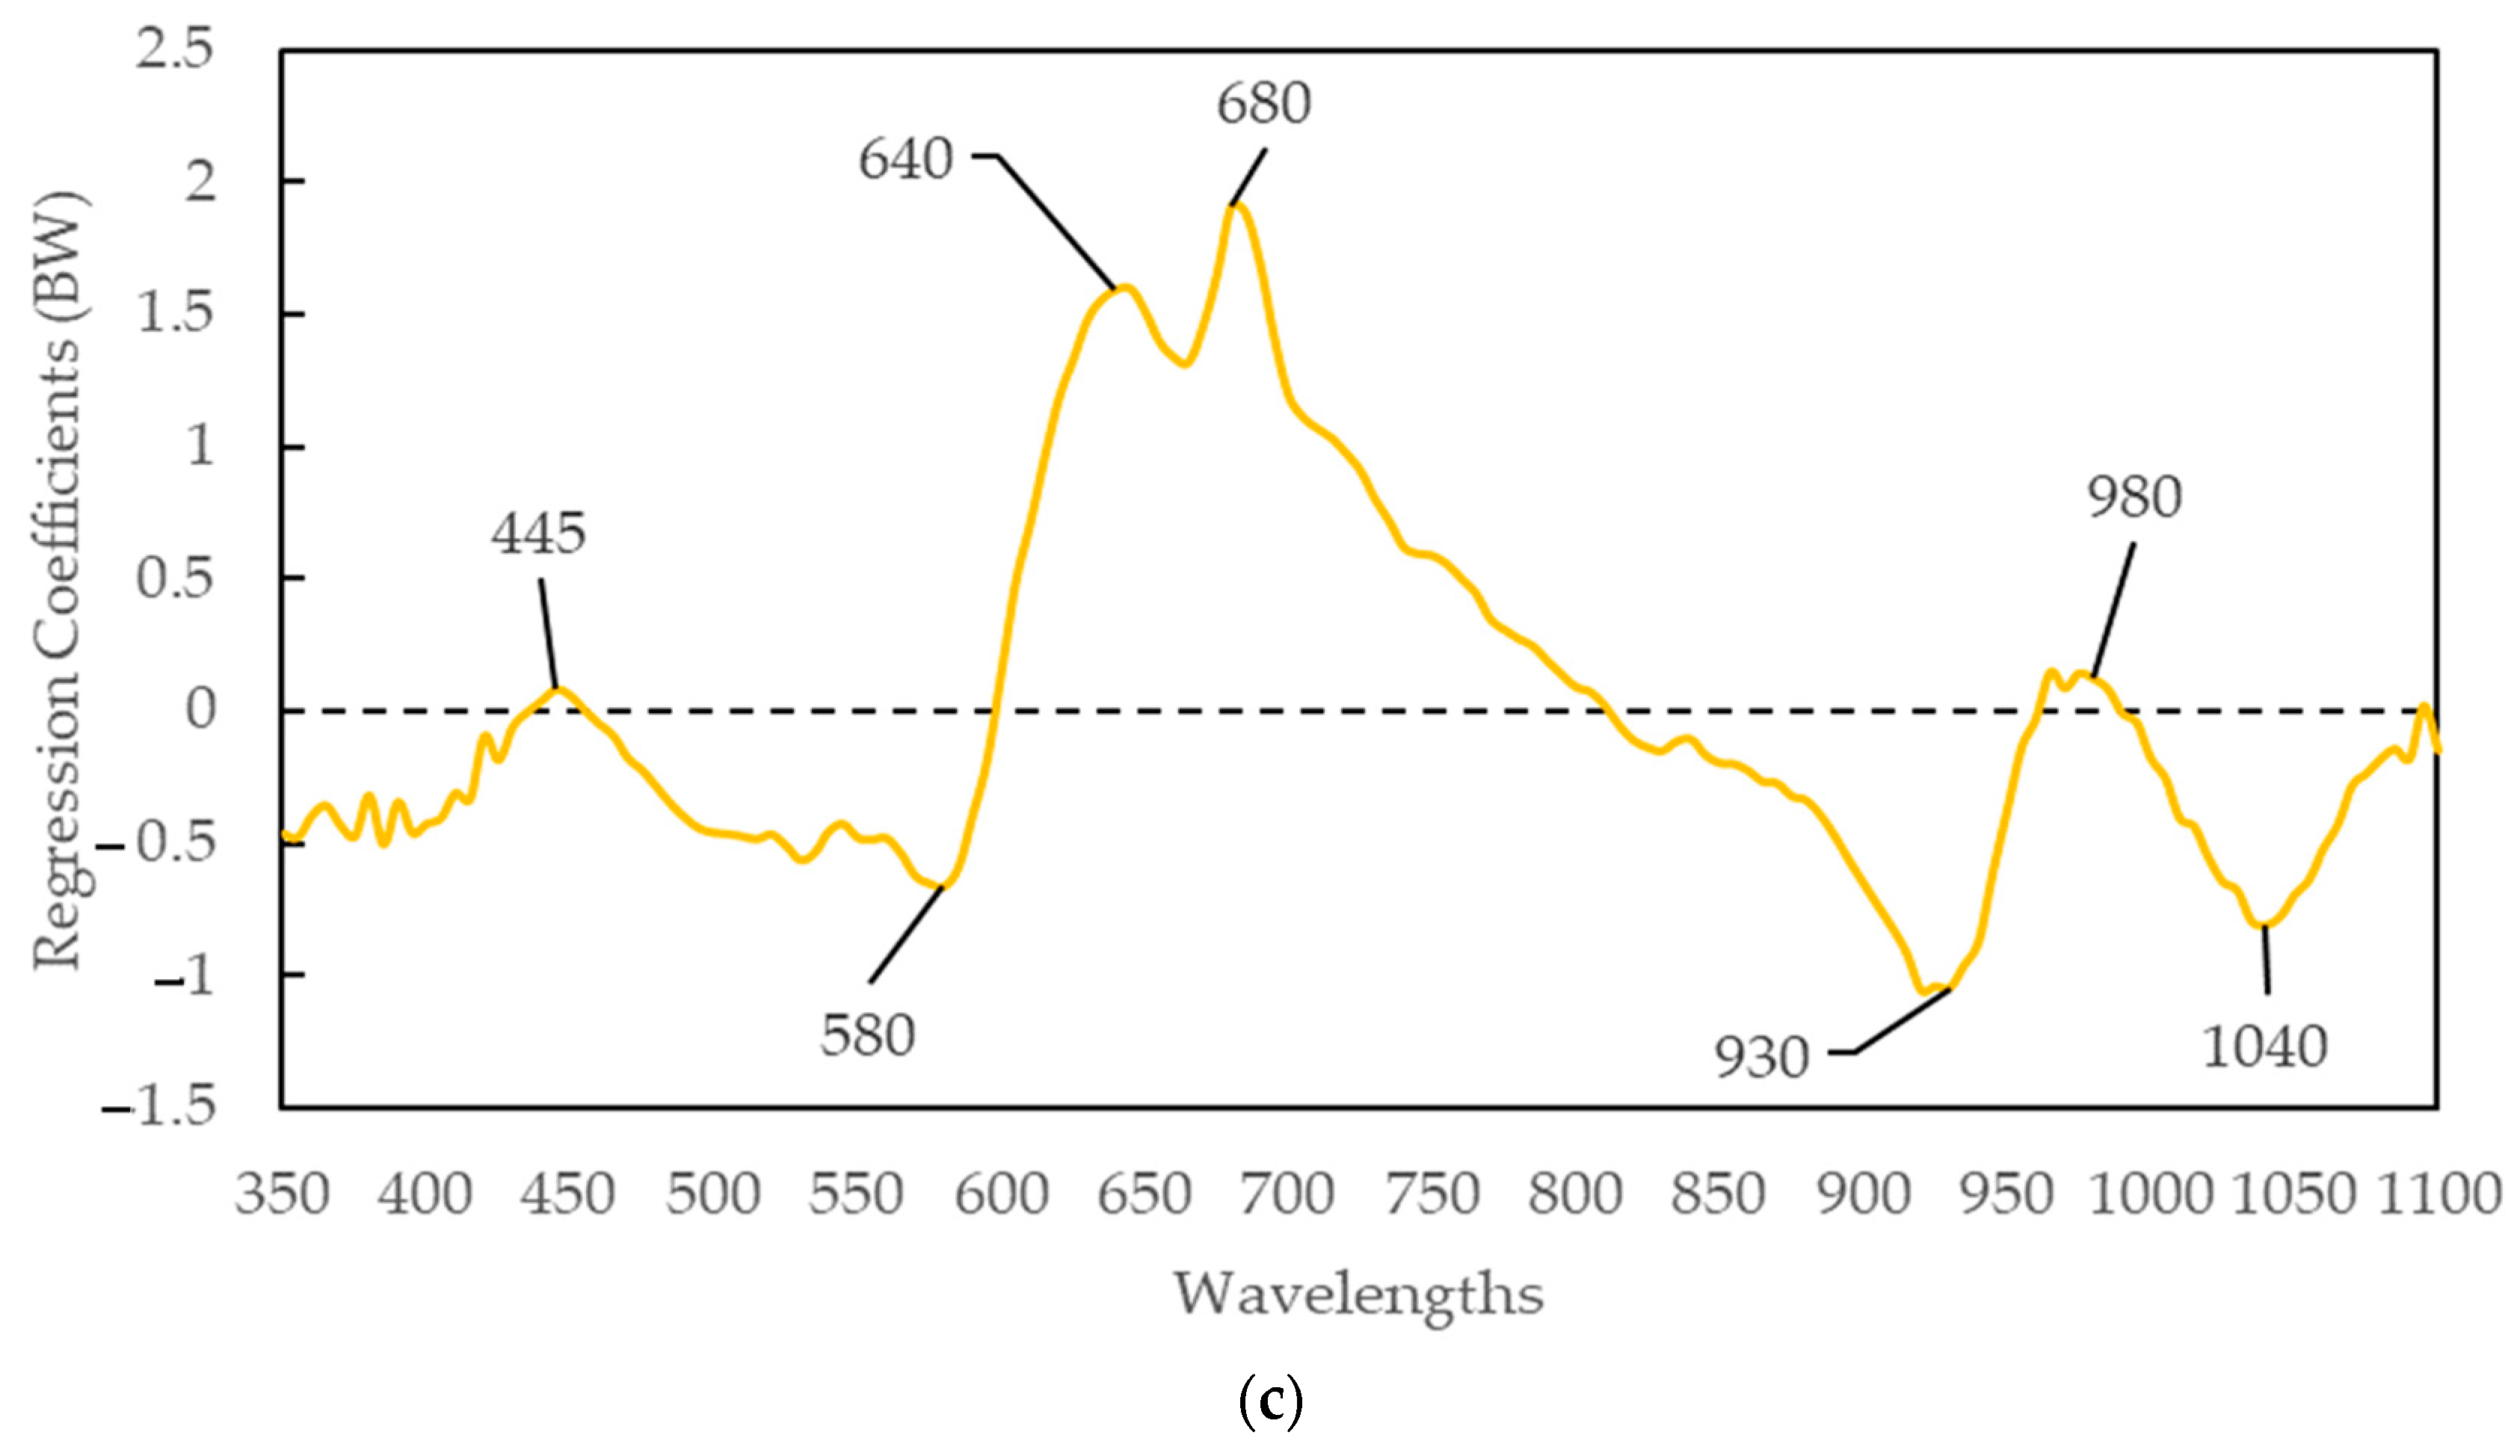
3.3. Calibration Model for Colour Parameters at Important Wavelengths

Regression coefficients of the best model performances were employed for selecting feature wavelengths for lightness (365, 395, 640, 685, 740, 840, 930, 970, 995, and 1005 nm), redness (365, 495, 580, 640, 665, 685, 925, and 975 nm), and yellowness (445, 580, 640, 680, 930, 980, and 1040 nm) (Figure 3). The predictive performance of the newly developed models using these selected wavelengths is shown in Table 2.
It was observed that the Rc2 value for redness (0.627) slightly improved in the reduced model compared to the model using the full range of wavelengths (0.595) when the spectral data were normalised (Table 2). This improvement may result from the removal of pixel outliers and unnecessary noise. The prediction accuracy using the selected important wavelengths is similar to that of the full wavelength range, with around 93% of the wavelengths discarded, thereby streamlining the models. Moreover, selecting specific wavelengths may provide a better understanding of the relationship between colour parameters and the spectral bands. For example, the absorption band in the 600–700 nm range is usually associated with the formation of oxymyoglobin. The absorption band at 790 nm is related to the third overtone of N-H stretching, which is associated with proteins. Similarly, the subtle absorption at 780 nm may be related to the third overtone of O-H stretching, while the absorption at 980 nm is likely linked to the second overtone of O-H stretching associated with water. Additionally, the absorption at 940 nm is connected to fat and corresponds to the third overtone of C-H stretching [3,70].

4. Conclusions

In this study, the colour attributes of sausages with various modified casings were rapidly and non-invasively predicted using hyperspectral imaging. The accuracy of predicting lightness and redness can be slightly improved by combining hyperspectral imaging with multivariate data analysis.
Response surface methodology was employed to study the impact of various modification processes, using different concentrations of orange extracts, on colour attributes. The analysis achieved an R2 of 80.61% for yellowness with an insignificant lack of fit. A significant interaction was observed between soy oil and orange extracts affecting the b* value, which exceeded 22.5 when a high concentration of soy oil (>1.5%) was combined with orange extracts. Key wavelengths were identified that could be utilised to develop a simple and cost-effective multispectral system or for using in online industrial applications. In summary, extracting flavonoids from waste orange peels supports sustainability by reducing waste, optimising resource use, minimising chemical inputs, enhancing energy efficiency, and generating economic and environmental benefits. This practice aligns with the principles of the circular economy, where waste is minimised, and value is extracted from every part of the production process. By recycling citrus peel waste, it can make full use of the fruit, ensuring that every part of the harvested produce contributes to something valuable, which aligns with the principles of a circular economy. The results obtained from this approach can be used to automate the inspection and quality assessment of sausages by incorporating advanced image processing algorithms into industrial machine vision systems, based on colour attributes. Other aspects of sausages with this unique casing, such as sensory characteristics and antimicrobial activity, could be influenced by citrus peel extracts and require further studies for evaluation.

Funding

This research was funded by the Iijima Tojuro Memorial Foundation for the Promotion of Food Science (FY 2022 and FY 2023); the Leading Initiative for Excellent Young Researchers (LEADER) of the Government of Japan Ministry of Education, Culture, Sports, Science and Technology (MEXT) (2020L0277); the Mishima Kaiun Memorial Foundation (FY 2022); the Japan Society for the Promotion of Science Grant-in-Aid for Early Career Scientists (20K15477); Grants-in-Aid for Regional R&D Proposal-Based Program from Northern Advancement Centre for Science & Technology of Hokkaido Japan (T-2-4); Sasakawa Scientific Research Grant from The Japan Science Society (2022-3005); and the President’s Discretionary Grants, funded by the Kitami Institute of Technology (FY 2021 and FY 2022).

Institutional Review Board Statement

Not applicable.

Informed Consent Statement

Not applicable.

Data Availability Statement

Data are contained within this article.

Acknowledgments

The author would also like to thank the anonymous reviewers for their constructive comments.

Conflicts of Interest

The authors declare no conflicts of interest.

References

  1. Tofteskov, J.; Hansen, J.S.; Bailey, N. Modelling the autoxidation of myoglobin in fresh meat under modified atmosphere packing conditions. J. Food Eng. 2017, 214, 129–136. [Google Scholar] [CrossRef]
  2. Erdmann, M.E.; Lautenschlaeger, R.; Zeeb, B.; Gibis, M.; Weiss, J. Effect of differently sized O/W emulsions loaded with rosemary extract on lipid oxidation in cooked emulsion-type sausages rich in n-3 fatty acids. LWT-Food Sci. Technol. 2017, 79, 496–502. [Google Scholar] [CrossRef]
  3. ElMasry, G.; Sun, D.-W.; Allen, P. Near-infrared hyperspectral imaging for predicting colour, pH and tenderness of fresh beef. J. Food Eng. 2012, 110, 127–140. [Google Scholar] [CrossRef]
  4. Xu, Z.; Han, Y.; Zhao, D.; Li, K.; Li, J.; Dong, J.; Shi, W.; Zhao, H.; Bai, Y. Research Progress on Quality Detection of Livestock and Poultry Meat Based on Machine Vision, Hyperspectral and Multi-Source Information Fusion Technologies. Foods 2024, 13, 469. [Google Scholar] [CrossRef] [PubMed]
  5. Feng, C.-H.; Arai, H.; Rodríguez-Pulido, F.J. Assessment of adenosine triphosphate content in sausages stuffed in different modified casing treatments added with orange extracts, utilising hyperspectral imaging combined with multivariate analysis. Front. Nutr. 2024, 11, 1370339. [Google Scholar] [CrossRef] [PubMed]
  6. Rodríguez-Pulido, F.J.; Mora-Garrido, A.B.; González-Miret, M.L.; Heredia, F.J. Research progress in imaging technology for assessing quality in wine grapes and seeds. Foods 2022, 11, 254. [Google Scholar] [CrossRef] [PubMed]
  7. Yu, Y.; Chen, W.; Zhang, H.; Liu, R.; Li, C. Discrimination among fresh, frozen–stored and frozen–thawed beef cuts by hyperspectral imaging. Foods 2024, 13, 973. [Google Scholar] [CrossRef] [PubMed]
  8. Sun, J.; Yang, F.; Cheng, J.; Wang, S.; Fu, L. Nondestructive identification of soybean protein in minced chicken meat based on hyperspectral imaging and VGG16-SVM. J. Food Compos. Anal. 2024, 125, 105713. [Google Scholar] [CrossRef]
  9. Wang, Q.; He, Y. Rapid and nondestructive classification of Cantonese sausage degree using hyperspectral images. Appl. Sci. 2019, 9, 822. [Google Scholar] [CrossRef]
  10. Jia, W.; van Ruth, S.; Scollan, N.; Koidis, A. Hyperspectral Imaging (HSI) for meat quality evaluation across the supply chain: Current and future trends. Curr. Res. Nutr. Food Sci. 2022, 5, 1017–1027. [Google Scholar] [CrossRef]
  11. Jia, W.; Ferragina, A.; Hamill, R.; Koidis, A. Modelling and numerical methods for identifying low-level adulteration in ground beef using near-infrared hyperspectral imaging (NIR-HSI). Talanta 2024, 276, 126199. [Google Scholar] [CrossRef] [PubMed]
  12. Squeo, G.; DE ANGELIS, D.; Artuso, F.; Fiorani, L.; Lai, A.; Faccia, M.; Caponio, F.; Summo, C. Authentication of ripened sausages according to the animals rearing system by NIR hyperspectral imaging. In Proceedings of the Ninth International Conference in Spectral Imaging, Bilbao, Spain, 6–10 July 2024; pp. 197–198. [Google Scholar]
  13. Masithoh, R.E.; Pahlawan, M.F.R.; Kim, J.; Arief, M.A.A.; Kurniawan, H.; Hernanda, R.A.P.; Amanah, H.Z.; Cho, B.-K. Shortwave infrared hyperspectral imaging for the determination of pork adulteration in minced beef and lamb. Food Control 2024, 166, 110736. [Google Scholar] [CrossRef]
  14. Yi, W.; Zhao, X.; Yun, X.; Borjigin, G.; Dong, T. Identification of geographical origin of beef by visible-near infrared hyperspectral recovery from color images. J. Food Compos. Anal. 2024, 135, 106622. [Google Scholar] [CrossRef]
  15. Zhang, Y.; Xue, H.; Ma, Q.; Li, Y.; Zhou, Q.; Sun, J.; Wang, W. Potential of two-dimensional correlation-based dual-band visible/near infrared spectroscopy to predict total volatile basic nitrogen content in meat. J. Food Compos. Anal. 2024, 133, 106451. [Google Scholar] [CrossRef]
  16. Cai, M.; Li, X.; Liang, J.; Liao, M.; Han, Y. An effective deep learning fusion method for predicting the TVB-N and TVC contents of chicken breasts using dual hyperspectral imaging systems. Food Chem. 2024, 456, 139847. [Google Scholar] [CrossRef]
  17. Xiong, Z.; Sun, D.-W.; Pu, H.; Xie, A.; Han, Z.; Luo, M. Non-destructive prediction of thiobarbituric acid reactive substances (TBARS) value for freshness evaluation of chicken meat using hyperspectral imaging. Food Chem. 2015, 179, 175–181. [Google Scholar] [CrossRef] [PubMed]
  18. Ye, X.; Iino, K.; Zhang, S. Monitoring of bacterial contamination on chicken meat surface using a novel narrowband spectral index derived from hyperspectral imagery data. Meat Sci. 2016, 122, 25–31. [Google Scholar] [CrossRef]
  19. Qiu, R.; Zhao, Y.; Kong, D.; Wu, N.; He, Y. Development and comparison of classification models on VIS-NIR hyperspectral imaging spectra for qualitative detection of the Staphylococcus aureus in fresh chicken breast. Spectrochim. Acta Part A Mol. Biomol. Spectrosc. 2023, 285, 121838. [Google Scholar] [CrossRef] [PubMed]
  20. Feng, C.-H.; Makino, Y.; Yoshimura, M.; Rodríguez-Pulido, F.J. Estimation of adenosine triphosphate content in ready-to-eat sausages with different storage days, using hyperspectral imaging coupled with R statistics. Food Chem. 2018, 264, 419–426. [Google Scholar] [CrossRef]
  21. Crichton, S.O.J.; Kirchner, S.M.; Porley, V.; Retz, S.; von Gersdorff, G.; Hensel, O.; Sturm, B. High pH thresholding of beef with VNIR hyperspectral imaging. Meat Sci. 2017, 134, 14–17. [Google Scholar] [CrossRef]
  22. Siripatrawan, U.; Makino, Y. Simultaneous assessment of various quality attributes and shelf life of packaged bratwurst using hyperspectral imaging. Meat Sci. 2018, 146, 26–33. [Google Scholar] [CrossRef] [PubMed]
  23. Velásquez, L.; Cruz-Tirado, J.P.; Siche, R.; Quevedo, R. An application based on the decision tree to classify the marbling of beef by hyperspectral imaging. Meat Sci. 2017, 133, 43–50. [Google Scholar] [CrossRef] [PubMed]
  24. Cai, J.; Lu, Y.; Olaniyi, E.; Wang, S.; Dahlgren, C.; Devost-Burnett, D.; Dinh, T. Beef marbling assessment by structured-illumination reflectance imaging with deep learning. J. Food Eng. 2024, 369, 111936. [Google Scholar] [CrossRef]
  25. Erena, T.; Belay, A.; Hailu, D.; Asefa, B.G.; Geleta, M.; Deme, T. Modeling of Ethiopian beef meat marbling score using image processing for rapid meat grading. J. Imaging 2024, 10, 130. [Google Scholar] [CrossRef]
  26. Guo, L.; Hong, C.; Wang, W.; Zhang, X.; Chen, J.; Chen, Z.; Ashokkumar, M.; Ma, H. Evaluation of low-temperature ultrasonic marination of pork meat at various frequencies on physicochemical properties, myoglobin levels, and volatile compounds. Meat Sci. 2024, 217, 109606. [Google Scholar] [CrossRef]
  27. Achata, E.M.; Inguglia, E.S.; Esquerre, C.A.; Tiwari, B.K.; O’Donnell, C.P. Evaluation of Vis-NIR hyperspectral imaging as a process analytical tool to classify brined pork samples and predict brining salt concentration. J. Food Eng. 2019, 246, 134–140. [Google Scholar] [CrossRef]
  28. Teixeira, A.; Silva, S.; Guedes, C.; Rodrigues, S. Sheep and goat meat processed products quality: A review. Foods 2020, 9, 960. [Google Scholar] [CrossRef]
  29. Font-i-Furnols, M. Meat consumption, sustainability and alternatives: An overview of motives and barriers. Foods 2023, 12, 2144. [Google Scholar] [CrossRef]
  30. Feng, C.-H.; Sun, D.-W. Optimisation of immersion vacuum cooling operation and quality of Irish cooked sausages by using response surface methodology. Int. J. Food Sci. Technol. 2014, 49, 1850–1858. [Google Scholar] [CrossRef]
  31. Harper, B.; Barbut, S.; Lim, L.-T.; Marcone, M. Microstructural and textural investigation of various manufactured collagen sausage casings. Food Res. Int. 2012, 49, 494–500. [Google Scholar] [CrossRef]
  32. Feng, C.H.; Garcia Martin, J.F.; Li, C.; Liu, B.L.; Song, X.Y.; Dong, Q.L.; Wang, W.; Yang, Y. Evaluation of physicochemical properties and microbial attributes of cooked sausages stuffed in casing modified by surfactants and lactic acid after immersion vacuum cooling and long-term storage. Int. J. Food Sci. Technol. 2016, 51, 2270–2279. [Google Scholar] [CrossRef]
  33. Feng, C.-H.; Arai, H.; Rodríguez-Pulido, F.J. Evaluating Moisture Content in Immersion Vacuum-Cooled Sausages with Citrus Peel Extracts Using Hyperspectral Imaging. Life 2024, 14, 647. [Google Scholar] [CrossRef]
  34. Santos, E.d.; Müller, C.M.O.; Laurindo, J.B.; Petrus, J.C.C.; Ferreira, S.R.S. Technological properties of natural hog casings treated with surfactant solutions. J. Food Eng. 2008, 89, 17–23. [Google Scholar] [CrossRef]
  35. Bakker, W.A.M.; Houben, J.H.; Koolmees, P.A.; Bindrich, U.; Sprehe, L. Effect of initial mild curing, with additives, of hog and sheep sausage casings on their microbial quality and mechanical properties after storage at difference temperatures. Meat Sci. 1999, 51, 163–174. [Google Scholar] [CrossRef] [PubMed]
  36. Feng, C.-H.; Drummond, L.; Sun, D.-W.; Zhang, Z.-H. Evaluation of natural hog casings modified by surfactant solutions combined with lactic acid by response surface methodology. LWT-Food Sci. Technol. 2014, 58, 427–438. [Google Scholar] [CrossRef]
  37. Peng, Q.; Zhang, Y.; Zhu, M.; Bao, F.; Deng, J.; Li, W. Polymethoxyflavones from citrus peel: Advances in extraction methods, biological properties, and potential applications. Crit. Rev. Food Sci. Nutr. 2024, 64, 5618–5630. [Google Scholar] [CrossRef] [PubMed]
  38. Diniso, T.; Oriola, A.O.; Adeyemi, J.O.; Miya, G.M.; Hosu, Y.S.; Oyedeji, O.O.; Kuria, S.K.; Oyedeji, A.O. Citrus wastes: A valuable raw material for biological applications. J. Appl. Pharm. Sci. 2024, 14, 11–26. [Google Scholar] [CrossRef]
  39. Venkataraman, S.; Rajendran, D.S.; Kumar, P.S.; Rangasamy, G.; Vaidyanathan, V.K. A Comprehensive Review on the Refinery of Citrus Peel Towards the Production of Bioenergy, Biochemical and Biobased Value-Added Products: Present Insights and Futuristic Challenges. Waste Biomass Valorization 2024, 1–22. [Google Scholar] [CrossRef]
  40. Medina-Herrera, N.; Martínez-Ávila, G.C.G.; Robledo-Jiménez, C.L.; Rojas, R.; Orozco-Zamora, B.S. From citrus waste to valuable resources: A biorefinery approach. Biomass 2024, 4, 784–808. [Google Scholar] [CrossRef]
  41. Kim, J.-H.; Lee, T.; Tsang, Y.F.; Moon, D.H.; Lee, J.; Kwon, E.E. Functional use of carbon dioxide for the sustainable valorization of orange peel in the pyrolysis process. Sci. Total Environ. 2024, 941, 173701. [Google Scholar] [CrossRef]
  42. Pratiksha; Adhikary, M. Industrial Production of Citrus By-products and Its Processing Techniques. In Citrus Fruits and Juice: Processing and Quality Profiling; Springer: Singapore, 2024; pp. 391–417. [Google Scholar]
  43. Yu, S.; Zhao, Y.; Li, L.; Zhao, H.; Liu, M.; Jiang, L. Flavonoids from citrus peel display potential synergistic effects on inhibiting rumen methanogenesis and ammoniagenesis: A microbiome perspective. Environ. Sci. Pollut. Res. 2024, 31, 21208–21223. [Google Scholar] [CrossRef] [PubMed]
  44. Grover, S.; Aggarwal, P.; Kumar, A.; Kaur, S.; Yadav, R.; Babbar, N. Utilizing citrus peel waste: A review of essential oil extraction, characterization, and food-industry potential. Biomass Convers. Biorefinery 2024, 1–22. [Google Scholar] [CrossRef]
  45. Ibrahim, F.M.; Mohammed, R.S.; Abdelsalam, E.; Ashour, W.E.-S.; Magalhães, D.; Pintado, M.; El Habbasha, E.S. Egyptian Citrus Essential Oils Recovered from Lemon, Orange, and Mandarin Peels: Phytochemical and Biological Value. Horticulturae 2024, 10, 180. [Google Scholar] [CrossRef]
  46. Ashraf, H.; Iahtisham-Ul-Haq; Butt, M.S.; Nayik, G.A.; Ramniwas, S.; Damto, T.; Ali Alharbi, S.; Ansari, M.J. Phytochemical and antioxidant profile of citrus peel extracts in relation to different extraction parameters. Int. J. Food Prop. 2024, 27, 286–299. [Google Scholar] [CrossRef]
  47. Koolaji, N.; Shammugasamy, B.; Schindeler, A.; Dong, Q.; Dehghani, F.; Valtchev, P. Citrus peel flavonoids as potential cancer prevention agents. Curr. Dev. Nutr. 2020, 4, nzaa025. [Google Scholar] [CrossRef]
  48. Kurita, O.; Fujiwara, T.; Yamazaki, E. Characterization of the pectin extracted from citrus peel in the presence of citric acid. Carbohydr. Polym. 2008, 74, 725–730. [Google Scholar] [CrossRef]
  49. Liu, N.; Yang, W.; Li, X.; Zhao, P.; Liu, Y.; Guo, L.; Huang, L.; Gao, W. Comparison of characterization and antioxidant activity of different citrus peel pectins. Food Chem. 2022, 386, 132683. [Google Scholar] [CrossRef] [PubMed]
  50. Zhang, S.; Hu, H.; Wang, L.; Liu, F.; Pan, S. Preparation and prebiotic potential of pectin oligosaccharides obtained from citrus peel pectin. Food Chem. 2018, 244, 232–237. [Google Scholar] [CrossRef] [PubMed]
  51. Gu, Q.; Gao, X.; Zhou, Q.; Li, Y.; Li, G.; Li, P. Characterization of soluble dietary fiber from citrus peels (Citrus unshiu), and its antioxidant capacity and beneficial regulating effect on gut microbiota. Int. J. Biol. Macromol. 2023, 246, 125715. [Google Scholar] [CrossRef]
  52. Huang, J.-Y.; Liao, J.-S.; Qi, J.-R.; Jiang, W.-X.; Yang, X.-Q. Structural and physicochemical properties of pectin-rich dietary fiber prepared from citrus peel. Food Hydrocoll. 2021, 110, 106140. [Google Scholar] [CrossRef]
  53. Feng, X.; Yu, B.; Regenstein, J.M.; Wang, L. Effect of particle size on composition, physicochemical, functional, and structural properties of insoluble dietary fiber concentrate from citrus peel. Food Sci. Technol. Int. 2023, 29, 195–203. [Google Scholar] [CrossRef] [PubMed]
  54. Sammani, M.S.; Clavijo, S.; González, A.; Cerdà, V. Development of an on-line lab-on-valve micro-solid phase extraction system coupled to liquid chromatography for the determination of flavonoids in citrus juices. Anal. Chim. Acta 2019, 1082, 56–65. [Google Scholar] [CrossRef] [PubMed]
  55. Maleki, S.J.; Crespo, J.F.; Cabanillas, B. Anti-inflammatory effects of flavonoids. Food Chem. 2019, 299, 125124. [Google Scholar] [CrossRef] [PubMed]
  56. Huynh, T.T.H.; Wongmaneepratip, W.; Vangnai, K. Relationship between Flavonoid Chemical Structures and Their Antioxidant Capacity in Preventing Polycyclic Aromatic Hydrocarbons Formation in Heated Meat Model System. Foods 2024, 13, 1002. [Google Scholar] [CrossRef]
  57. de Lima, D.P.; Júnior, E.d.S.P.; de Menezes, A.V.; de Souza, D.A.; de São José, V.P.B.; da Silva, B.P.; de Almeida, A.Q.; de Carvalho, I.M.M. Chemical composition, minerals concentration, total phenolic compounds, flavonoids content and antioxidant capacity in organic and conventional vegetables. Food Res. Int. 2024, 175, 113684. [Google Scholar] [CrossRef]
  58. Wang, C.; Song, Z.; Cao, Y.; Han, L.; Yu, Q.; Han, G.; Zhu, X. Characterization of sodium alginate-carrageenan films prepared by adding peanut shell flavonoids as an antioxidant: Application in chilled pork preservation. Int. J. Biol. Macromol. 2024, 266, 131081. [Google Scholar] [CrossRef]
  59. Bhatt, P.; Kumar, V.; Malik, M.K.; Kumar, T. Citrus flavonoids: Recent advances and future perspectives on preventing cardiovascular diseases. In The Flavonoids; Apple Academic Press: Palm Bay, FL, USA, 2024; pp. 131–152. [Google Scholar]
  60. Perz, M.; Szymanowska, D.; Janeczko, T.; Kostrzewa-Susłow, E. Antimicrobial Properties of Flavonoid Derivatives with Bromine, Chlorine, and Nitro Group Obtained by Chemical Synthesis and Biotransformation Studies. Int. J. Mol. Sci. 2024, 25, 5540. [Google Scholar] [CrossRef]
  61. Lopes, I.; Campos, C.; Medeiros, R.; Cerqueira, F. Antimicrobial Activity of Dimeric Flavonoids. Compounds 2024, 4, 214–229. [Google Scholar] [CrossRef]
  62. Hamid, M.E.; Alamri, F.; Abdelrahim, I.M.; Joseph, M.; Elamin, M.M.; Alraih, A.M.; Abdelrahim Sr, I.M.; Al Hafez, M.A. Effects of Antimicrobial Flavonoids Against Representative Bacteria and Fungi: A Review of the Literature. Cureus 2024, 16, e62765. [Google Scholar] [CrossRef]
  63. d’Avanzo, N.; Mancuso, A.; Mare, R.; Silletta, A.; Maurotti, S.; Parisi, O.I.; Cristiano, M.C.; Paolino, D. Olive Leaves and Citrus Peels: From Waste to Potential Resource for Cosmetic Products. Cosmetics 2024, 11, 41. [Google Scholar] [CrossRef]
  64. Ahire, E.D.; Khairnar, S.J.; Surana, K.R.; Kshirsagar, S.J. Role of Flavonoids in Dermatology and Cosmetic Preparations. In The Flavonoids; Apple Academic Press: Palm Bay, FL, USA, 2024; pp. 277–292. [Google Scholar]
  65. Lin, C.F.; Lin, M.H.; Hung, C.F.; Alshetaili, A.; Tsai, Y.F.; Jhong, C.L.; Fang, J.Y. The anti-inflammatory activity of flavonoids and alkaloids from Sophora flavescens alleviates psoriasiform lesions: Prenylation and methoxylation beneficially enhance bioactivity and skin targeting. Phytother. Res. 2024, 38, 1951–1970. [Google Scholar] [CrossRef] [PubMed]
  66. Krishna, A.A.; Abhirami, B.L.; Bashi, M.B.; Jaice, R.; Jasim, A.R.M.; Kumaran, A. Identification and anti-inflammatory activity of flavonoids from Cardiospermum halicacabum in murine RAW 264.7 macrophage-A bioassay-guided approach. Food Biosci. 2024, 61, 104510. [Google Scholar] [CrossRef]
  67. Jayaram, S.; Sarojini, S.; Anand, S.B.; Raj, A.A.I.; Parakadan, A.; Philip, I.; Biswas, S. Citrus for wellness: Exploring the bioactive properties of Citrus medica fruit peel with emphasis on its anticancer, antioxidant, antimicrobial and anthelmintic properties. Plant Sci. Today 2024, 11, 616–625. [Google Scholar] [CrossRef]
  68. Feng, C.-H.; García-Martín, J.F.; Broncano Lavado, M.; López-Barrera, M.d.C.; Álvarez-Mateos, P. Evaluation of different solvents on flavonoids extraction efficiency from sweet oranges and ripe and immature Seville oranges. Int. J. Food Sci. Technol. 2020, 55, 3123–3134. [Google Scholar] [CrossRef]
  69. Sial, T.A.; Rajpar, I.; Khan, M.N.; Ali, A.; Shan, M.; Rajput, A.B.; Shah, P.A.N. Impact of Fruit and Vegetable Wastes on the Environment and Possible Management Strategies. In Planet Earth: Scientific Proposals to Solve Urgent Issues; Springer: Cham, Switzerland, 2024; pp. 307–330. [Google Scholar]
  70. Feng, C.-H. Optimizing Procedures of Ultrasound-Assisted Extraction of Waste Orange Peels by Response Surface Methodology. Molecules 2022, 27, 2268. [Google Scholar] [CrossRef]
  71. Cheetangdee, N. Effect of partial replacement of porcine fat with pre-emulsified soybean oil using fish protein isolate as emulsifier on characteristic of sausage. J. Food Sci. Technol. 2017, 54, 1901–1909. [Google Scholar] [CrossRef] [PubMed]
  72. Cava, R.; Ladero, L. Pomegranate peel as a source of antioxidants for the control of lipid and protein oxidation during the ripening of Iberian dry uncured sausages. Meat Sci. 2023, 202, 109198. [Google Scholar] [CrossRef]
  73. Borochov-Neori, H.; Judeinstein, S.; Tripler, E.; Harari, M.; Greenberg, A.; Shomer, I.; Holland, D. Seasonal and cultivar variations in antioxidant and sensory quality of pomegranate (Punica granatum L.) fruit. J. Food Compos. Anal. 2009, 22, 189–195. [Google Scholar] [CrossRef]
  74. Das, A.K.; Nanda, P.K.; Chowdhury, N.R.; Dandapat, P.; Gagaoua, M.; Chauhan, P.; Pateiro, M.; Lorenzo, J.M. Application of Pomegranate by-Products in Muscle Foods: Oxidative Indices, Colour Stability, Shelf Life and Health Benefits. Molecules 2021, 26, 467. [Google Scholar] [CrossRef]
Figure 1. An outline of the primary experimental procedures.
Sustainability 16 08683 g001
Figure 2. The yellowness (b*) of the sausage surface as affected by soy oil concentration and citrus extract addition: (a) 3D surface plot; (b) 2D contour plot.
Sustainability 16 08683 g002
Figure 3. Selection of the feature wavelengths for L*: lightness (a); a*: red/green (b); and b*: yellow/blue (c) based on regression coefficients from the PLSR model.
Sustainability 16 08683 g003aSustainability 16 08683 g003b
Table 1. Measured and predicted CIELAB attributes of sausage surface with different modified casing treatments.
TreatmentsL*a*b*
MeasuredPredictedMeasuredPredictedMeasuredPredicted
150.3453.734.745.0723.7525.08
251.5251.954.445.2524.6224.96
357.3957.355.405.2727.6927.69
453.3652.765.745.9127.2827.34
556.8856.715.264.9227.4426.78
657.8353.734.495.0727.7925.08
751.7852.795.014.3424.5424.34
852.8452.483.924.4423.2223.66
951.2551.735.225.6724.7825.89
1052.8052.155.616.1526.1925.48
1153.1353.735.685.0725.3925.08
1251.1050.954.454.1422.6622.46
1354.3254.315.485.1424.0323.96
1454.4155.546.165.6624.7524.75
1555.6355.624.283.9622.3322.71
1653.3352.544.544.7023.2823.15
1757.4955.641.963.1320.8221.92
1854.0152.824.504.5123.7323.65
1952.7952.034.884.8622.4722.72
2050.3350.923.723.0820.419.87
2152.5452.933.963.7922.7523.09
2251.4050.764.394.5523.0223.47
2357.3555.472.673.7822.8123.00
2453.5953.784.114.5723.8223.77
2551.5952.584.824.3423.6623.08
2654.9053.734.305.0722.5925.08
2753.0953.054.494.3325.8425.38
2852.2653.736.305.0725.5625.08
2953.7553.735.915.0725.8125.08
3054.2554.635.134.9325.5125.39
3153.3255.014.744.6224.4224.62
3252.5954.273.092.9021.4920.77
Note: L*: lightness; a*: red/green; and b*: yellow/blue.
Table 2. PLSR statistical parameters with raw and pre-treatment spectra for sausages with different modified casings.
ParametersWavelengthsPre-TreatmentsCalibration GroupPrediction Group
Rc2Root Mean Square Error of Calibration (%)Rp2Root Mean Square Error of Prediction (%)
L*FullRaw data (untreated)0.5031.6320.4361.351
SNV0.4651.6930.4191.370
First Derivation0.4331.7430.2351.573
MSC0.4641.6940.4161.375
Second Derivation0.3011.935Na1.937
Normalisation0.5091.6210.4331.354
Important (365, 395, 640, 685, 740, 840, 930, 970, 995, and 1005 nm)Raw data (untreated)0.3841.8160.4961.277
SNV0.3251.9020.1421.665
First Derivation0.4611.6990.2471.560
MSC0.3241.9020.1441.664
Second Derivation0.4041.7860.1661.642
Normalisation0.3821.8200.4561.326
a*FullRaw data (untreated)0.5850.8080.3380.619
SNV0.6500.7430.2000.680
First Derivation0.3581.005Na0.802
MSC0.6390.7540.2210.672
Second Derivation0.3940.977Na0.818
Normalisation0.5950.7980.3790.600
Important (365, 495, 580, 640, 665, 685, 925, and 975 nm)Raw data (untreated)0.6020.7910.2270.669
SNV0.2091.116Na0.821
First Derivation0.2711.071Na0.801
MSC0.2051.118Na0.817
Second Derivation0.3421.017Na0.806
Normalisation0.6270.7660.2060.678
b*FullRaw data (untreated)0.0762.060Na1.480
SNV0.1192.0120.0231.369
First Derivation0.2901.806Na1.628
MSC0.1172.0140.0241.368
Second Derivation0.5751.398Na1.770
Normalisation0.4161.638Na1.471
Important (445, 580, 640, 680, 930, 980, and 1040 nm)Raw data (untreated)0.6031.351Na1.611
SNV0.1761.946Na1.478
First Derivation0.1861.935Na1.541
MSC0.1741.948Na1.476
Second Derivation0.4541.584Na2.015
Normalisation0.4811.545Na1.625
Note: SNV: standard normal variate; MSC: multiplicative scatter correction; Na: Not available.
Disclaimer/Publisher’s Note: The statements, opinions and data contained in all publications are solely those of the individual author(s) and contributor(s) and not of MDPI and/or the editor(s). MDPI and/or the editor(s) disclaim responsibility for any injury to people or property resulting from any ideas, methods, instructions or products referred to in the content.

