Scenario Simulation and Efficiency Study of Hydropower Development to Promote Regional Sustainable Development: An Empirical Analysis of a Province in Southwestern China


Abstract
1. Introduction
- (1)
- The SD model was built, which can dynamically explain the interplay between hydropower growth and regional sustainable development.
- (2)
- The relative driving efficiency of hydropower development on regional sustainable development was examined using the Super-SBM model.
- (3)
- The technical efficiency (TE) curves, inputs, and outputs of several models were evaluated, and two essential factors for boosting regional sustainable development were filtered out.
2. Materials and Methods
2.1. Data Sources
2.2. Methodology
2.2.1. Entropy Weight Method and System Dynamics
2.2.2. Super-SBM
3. Results
3.1. Building and Testing the SD Model
3.1.1. Analysis of the Structure of the SD Model
3.1.2. SD Model Boundaries and Hypotheses
3.1.3. Illustrating and Analyzing Stock and Flow Diagrams
3.2. Calculating and Analyzing the Efficiency of Hydropower for Sustainable Regional Development
3.2.1. Measurement Metrics for the Super-SBM Model
3.2.2. Setting up Multiple Hydropower Development Modes
3.2.3. Examining Hydropower’s Effectiveness in Contributing to Regional Sustainable Development
- (1)
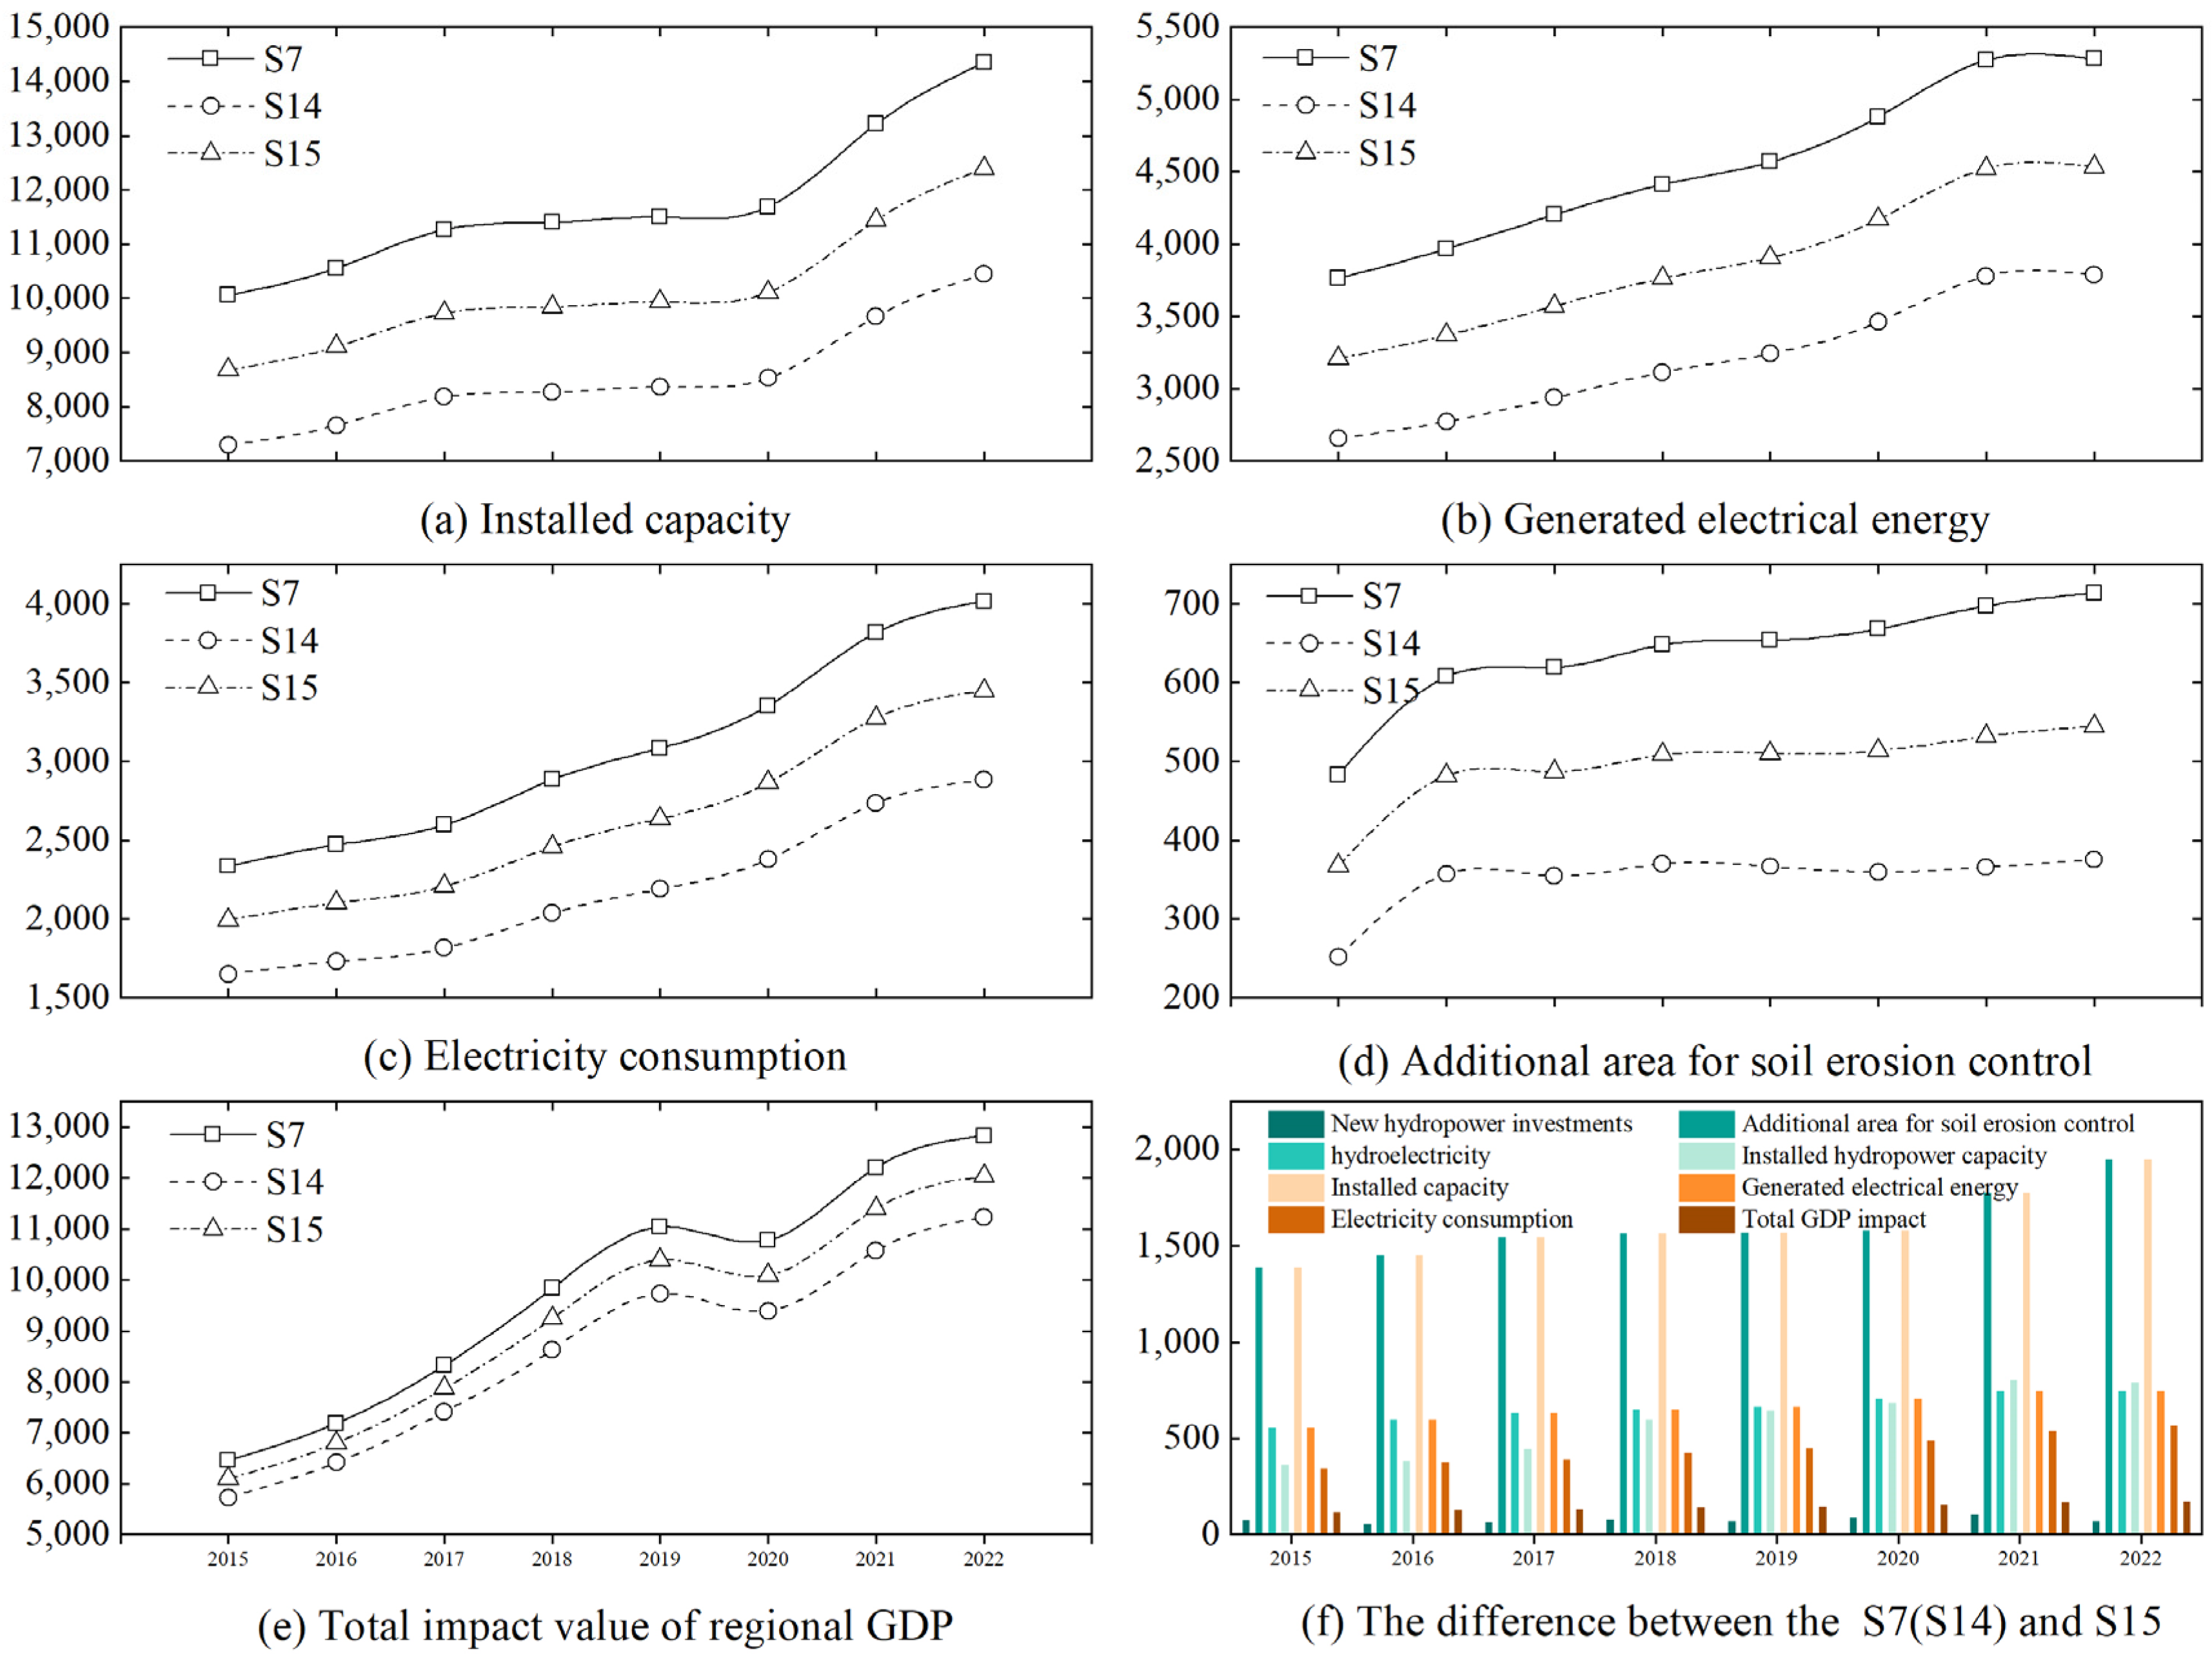
- Macro facilitation
- (2)
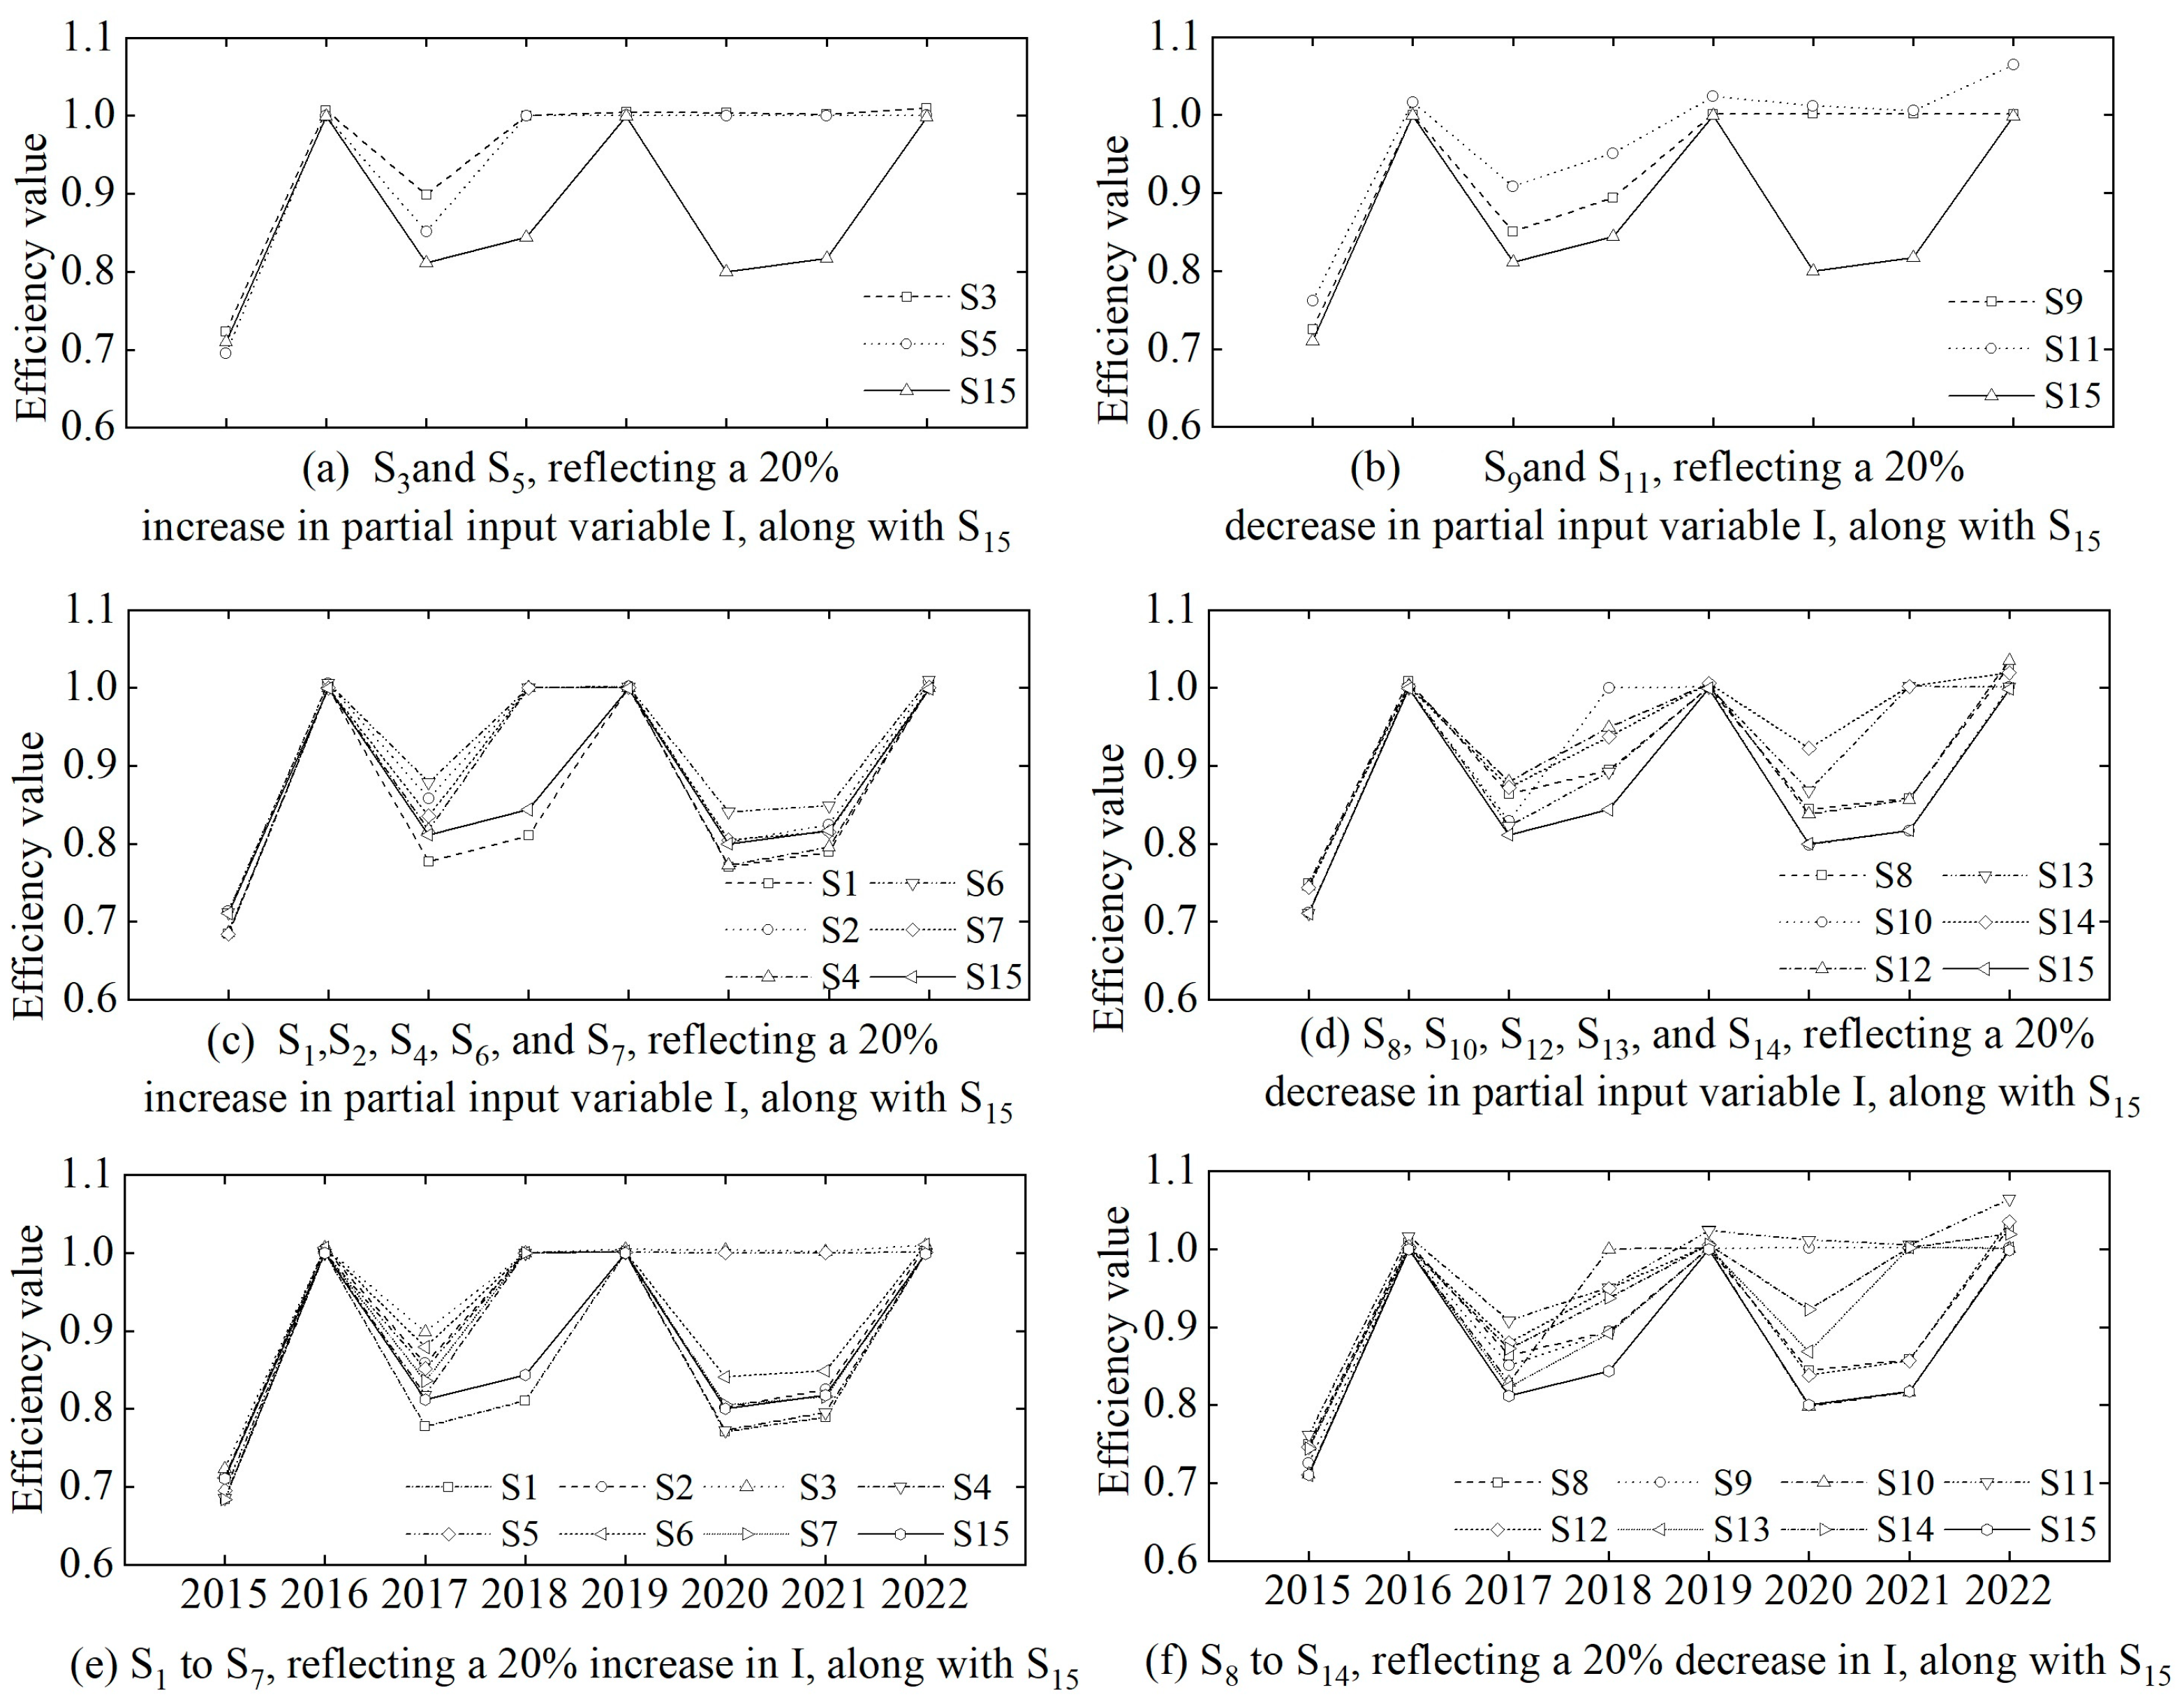
- Efficiency analysis
4. Discussion
5. Conclusions
- (1)
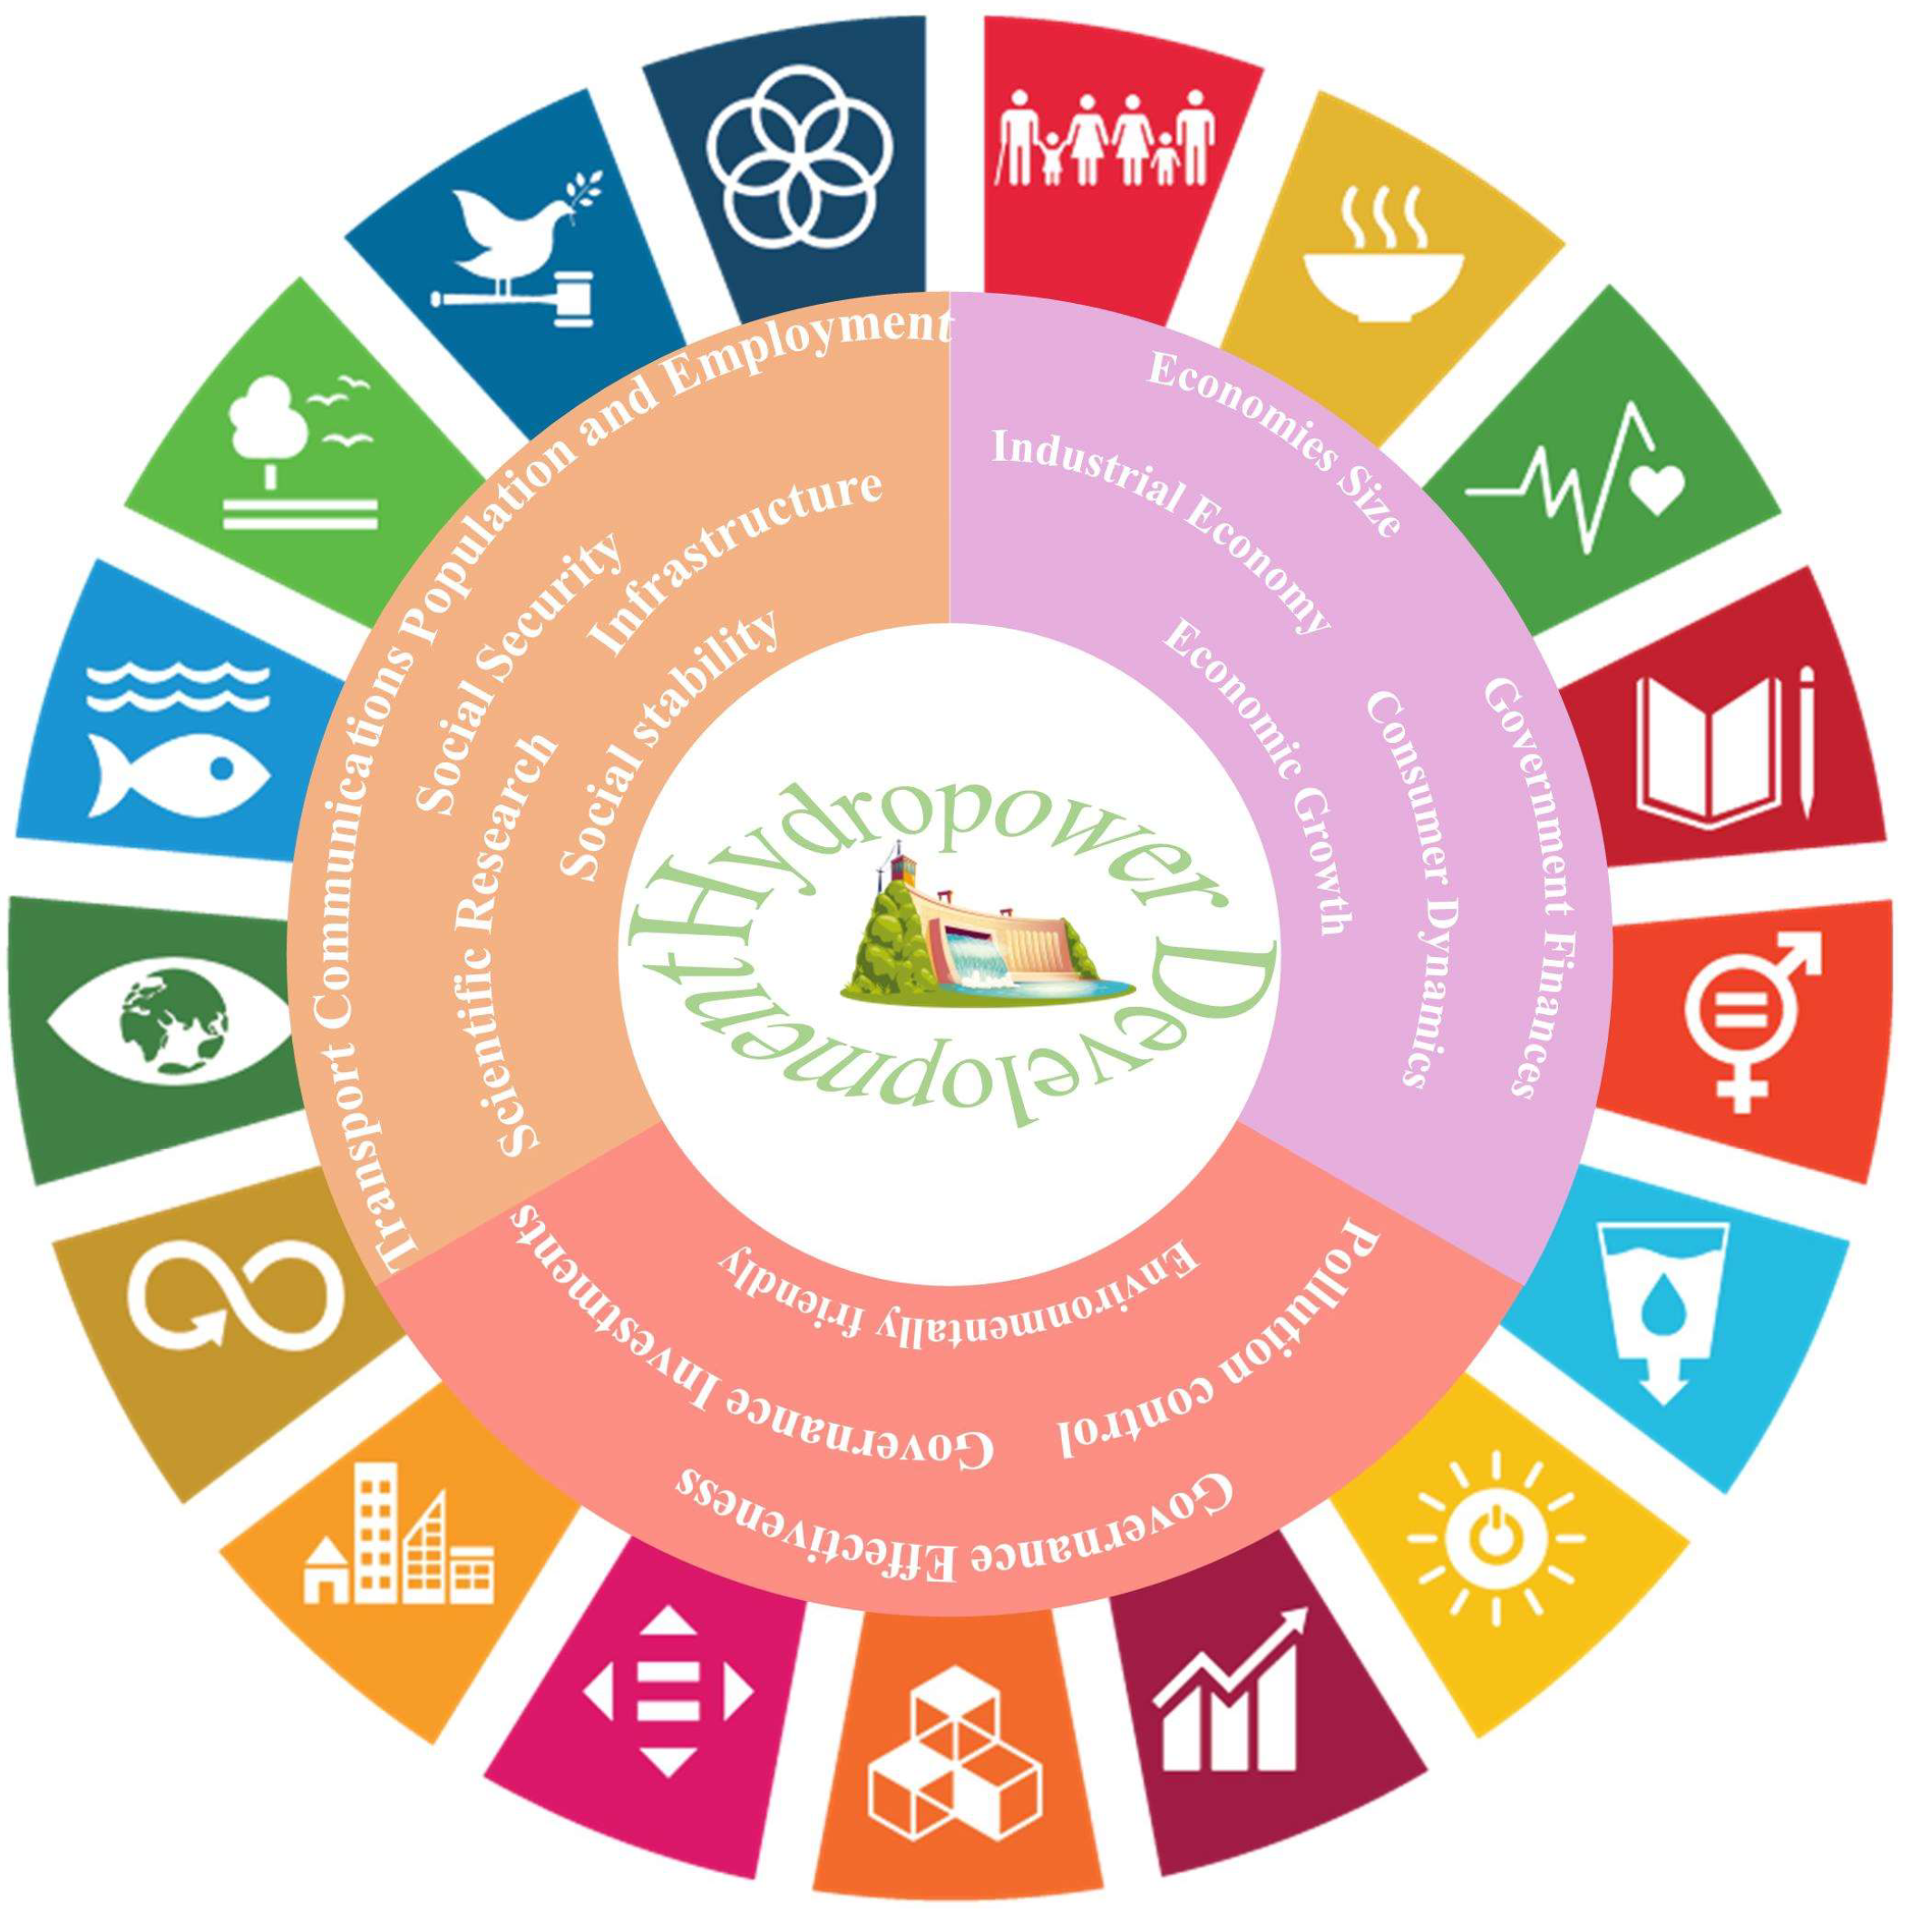
- The SD model emphasizes hydropower development’s influence, link, and role in regional sustainable development.
- (2)
- The influence of hydropower development on regional sustainable development is depicted in the SD model as the correlating impact of hydropower development on economic growth, social stability, environmental friendliness, etc. The findings of the simulation data comparison of different development modes demonstrate that hydropower development has a driving function in regional sustainable development, and it has a sort of complicated non-linear role.
- (3)
- The driving efficiency of hydropower development on regional sustainable development in the province from 2015 to 2022 was variable, and the technical efficiency value was maintained at a high level over 0.7.
- (4)
- Changing the input variables will influence the output variables and, consequently, the technical efficiency. Meanwhile, the province’s hydropower output and new hydropower investment are crucial variables that determine the relative driving efficiency of hydropower development for regional sustainable development.
Author Contributions
Funding
Institutional Review Board Statement
Informed Consent Statement
Data Availability Statement
Acknowledgments
Conflicts of Interest
References
- Naranjo-Silva, S.; Punina-Guerrero, D.; Rivera-Gonzalez, L.; Escobar-Segovia, K.; Barros-Enriquez, J.D.; Almeida-Dominguez, J.A.; Javier Alvarez del, C. Hydropower Scenarios in the Face of Climate Change in Ecuador. Sustainability 2023, 15, 10160. [Google Scholar] [CrossRef]
- Vagnoni, E.; Gezer, D.; Anagnostopoulos, I.; Cavazzini, G.; Doujak, E.; Hočevar, M.; Rudolf, P. The new role of sustainable hydropower in flexible energy systems and its technical evolution through innovation and digitalization. Renew. Energy 2024, 230, 120832. [Google Scholar] [CrossRef]
- Zhao, F.; Bai, F.; Liu, X.; Liu, Z. A Review on Renewable Energy Transition under China’s Carbon Neutrality Target. Sustainability 2022, 14, 15006. [Google Scholar] [CrossRef]
- Dhaubanjar, S.; Lutz, A.F.; Pradhananga, S.; Smolenaars, W.; Khanal, S.; Biemans, H.; Nepal, S.; Ludwig, F.; Shrestha, A.B.; Immerzeel, W.W. From theoretical to sustainable potential for run-of-river hydropower development in the upper Indus basin. Appl. Energy 2024, 357, 122372. [Google Scholar] [CrossRef]
- IHA. 2022 Hydropower Status Report; IHA Central Office: London, UK, 2022; pp. 7–10. [Google Scholar]
- De Faria, F.A.M.; Davis, A.; Severnini, E.; Jaramillo, P. The local socio-economic impacts of large hydropower plant development in a developing country. Energy Econ. 2017, 67, 533–544. [Google Scholar] [CrossRef]
- Guan, Y.; Post, S.; Zhao, D.; Zhang, S.; Becker, S. Overview of the application status and development trends of hydropower and geothermal power in New Zealand. Energy Built Environ. 2024; in press. [Google Scholar] [CrossRef]
- Anfom, K.; Xioyang, X.; Adu, D.; Darko, R.O. The state of energy in sub-Saharan Africa and the urgency for small hydropower development. Energy Rep. 2023, 9, 257–261. [Google Scholar] [CrossRef]
- Tang, S.; Chen, J.; Sun, P.; Li, Y.; Yu, P.; Chen, E. Current and future hydropower development in Southeast Asia countries (Malaysia, Indonesia, Thailand and Myanmar). Energy Policy 2019, 129, 239–249. [Google Scholar] [CrossRef]
- Liu, B.; Yang, Z.; Chen, Y.; Li, L.; Chen, S. A decision-making framework for scheme selection for sustainable hydropower development. Int. J. Green Energy 2021, 18, 951–965. [Google Scholar] [CrossRef]
- Zhang, Y. Accelerating Sustainability by Hydropower Development in China: The Story of HydroLancang. Sustainability 2017, 9, 1305. [Google Scholar] [CrossRef]
- Muhammad Mansur, A.; Abdul Samad, A.-R. Land-Use Change Impacts from Sustainable Hydropower Production in EU28 Region: An Empirical Analysis. Sustainability 2021, 13, 4599. [Google Scholar] [CrossRef]
- Li, G.; Ren, Y.; Jiang, C.; Wang, W.; Guo, Y. Coordinated evolution game of marine supply chain from the perspective of sustainable development based on system dynamics. Ocean. Coast. Manag. 2024, 254, 107195. [Google Scholar] [CrossRef]
- Zhu, J.; Zhang, J.; Wu, H.; Yi, X.; Liu, Y. Sustainability assessment of small hydropower from an ESG perspective: A case study of the Qin-Ba Mountains, China. J. Environ. Manag. 2024, 350, 119523. [Google Scholar] [CrossRef] [PubMed]
- Du, H.; Yang, L.; Wang, W.; Lu, L.; Li, Z. Emergy theory to quantify the sustainability of large cascade hydropower projects in the upper Yangtze. Ecol. Model. 2022, 468, 109954. [Google Scholar] [CrossRef]
- Guo, N.; Wu, F.; Sun, D.; Shi, C.; Gao, X. Mechanisms of resilience in cities at different development phases: A system dynamics approach. Urban Clim. 2024, 53, 101793. [Google Scholar] [CrossRef]
- Liang, Y.; Zhang, X.; Wang, H.; Liu, M. Users’ willingness to adopt Metaverse drawing on flow theory: An empirical study using PLS-SEM and FsQCA. Heliyon 2024, 10, e33394. [Google Scholar] [CrossRef]
- Saha, P.; Idsø, J. New hydropower development in Norway: Municipalities’ attitude, involvement and perceived barriers. Renew. Sustain. Energy Rev. 2016, 61, 235–244. [Google Scholar] [CrossRef]
- Eguchi, S.; Takayabu, H.; Lin, C. Sources of inefficient power generation by coal-fired thermal power plants in China: A metafrontier DEA decomposition approach. Renew. Sustain. Energy Rev. 2021, 138, 110562. [Google Scholar] [CrossRef]
- Wei, X.; Zhao, R. Evaluation and spatial convergence of carbon emission reduction efficiency in China’s power industry: Based on a three-stage DEA model with game cross-efficiency. Sci. Total Environ. 2024, 906, 167851. [Google Scholar] [CrossRef]
- Zhang, R.; Ying, W.; Wu, K.; Sun, H. The impact of innovative human capital agglomeration on urban green development efficiency: Based on panel data of 278 Cities in China. Sustain. Cities Soc. 2024, 111, 105566. [Google Scholar] [CrossRef]
- Tian, N.; Tang, S.; Che, A.; Wu, P. Measuring regional transport sustainability using super-efficiency SBM-DEA with weighting preference. J. Clean. Prod. 2020, 242, 118474. [Google Scholar] [CrossRef]
- Du, J.; Liang, L.; Zhu, J. A slacks-based measure of super-efficiency in data envelopment analysis: A comment. Eur. J. Oper. Res. 2010, 204, 694–697. [Google Scholar] [CrossRef]
- Huang, X.; Liu, M.; Chen, R.; Gao, S.; Xie, Q.; Feng, Q. Evaluation and spatiotemporal characteristics of atmospheric environment efficiency in Shandong province based on super-SBM model. Environ. Res. Commun. 2021, 3, 115002. [Google Scholar] [CrossRef]
- Sun, L.; Niu, D.; Wang, K.; Xu, X. Sustainable development pathways of hydropower in China: Interdisciplinary qualitative analysis and scenario-based system dynamics quantitative modeling. J. Clean. Prod. 2021, 287, 125528. [Google Scholar] [CrossRef]
- Liang, M.; Yang, G.; Zhu, X.; Cheng, H.; Zheng, L.; Liu, H.; Dong, X.; Zhang, Y. AHP-EWM Based Model Selection System for Subsidence Area Research. Sustainability 2023, 15, 7135. [Google Scholar] [CrossRef]
- Wan, L.; Zhang, Y.; Qi, S.; Li, H.; Chen, X.; Zang, S. A study of regional sustainable development based on GIS/RS and SD model—Case of Hadaqi industrial corridor. J. Clean. Prod. 2017, 142, 654–662. [Google Scholar] [CrossRef]
- Cheng, H.; Yu, T.; Zhang, H.; Duan, K.; Zhu, J. Dynamic Estimation of Urban Land Use Efficiency and Sustainability Analysis in China. Sustainability 2022, 14, 13843. [Google Scholar] [CrossRef]
- Tone, K. A slacks-based measure of super-efficiency in data envelopment analysis. Eur. J. Oper. Res. 2002, 143, 32–41. [Google Scholar] [CrossRef]
- Kim, J.; Kim, H. Evaluation of the Efficiency of Maritime Transport Using a Network Slacks-Based Measure (SBM) Approach: A Case Study on the Korean Coastal Ferry Market. Sustainability 2021, 13, 6094. [Google Scholar] [CrossRef]
- Sun, Y.; Yang, F.; Wang, D.; Ang, S. Efficiency evaluation for higher education institutions in China considering unbalanced regional development: A meta-frontier Super-SBM model. Socio-Econ. Plan. Sci. 2023, 88, 101648. [Google Scholar] [CrossRef]
- Yongrong, X.; Zheng, K.; Zhou, Y.; Han, Y.; Tadikamalla, P.R.; Fan, Q. Logistics Efficiency under Carbon Constraints Based on a Super SBM Model with Undesirable Output: Empirical Evidence from China’s Logistics Industry. Sustainability 2022, 14, 5142. [Google Scholar] [CrossRef]
- Shi, Y.; Ge, X.; Yuan, X.; Wang, Q.; Kellett, J.; Li, F.; Ba, K. An Integrated Indicator System and Evaluation Model for Regional Sustainable Development. Sustainability 2019, 11, 2183. [Google Scholar] [CrossRef]
- Liu, Q.; Li, F.; Peng, L.; Dong, S.; Yang, Y.; Cheng, H. Multiple evaluation framework of sustainability development in resource-based cities: A case study of China. Ecol. Indic. 2024, 158, 111338. [Google Scholar] [CrossRef]
- Guariso, D.; Castañeda, G.; Guerrero, O.A. Budgeting for SDGs: Quantitative methods to assess the potential impacts of public expenditure. Dev. Eng. 2023, 8, 100113. [Google Scholar] [CrossRef]
- Sreenivasan, A.; Suresh, M.; Nedungadi, P. Mapping analytical hierarchy process research to sustainable development goals: Bibliometric and social network analysis. Heliyon 2023, 9, e19077. [Google Scholar] [CrossRef]
- Liang, X.; Si, D.; Xu, J. Quantitative Evaluation of the Sustainable Development Capacity of Hydropower in China Based on Information Entropy. Sustainability 2018, 10, 529. [Google Scholar] [CrossRef]
- Brazzini, T.; Lorenzo-Saez, E.; Martínez, V.S.; Pérez, E.L.; Ortega-Reig, M.V.; Palau-Salvador, G. Is small-scale hydropower energy recovery a viable alternative for climate change mitigation and adaptation? The case of the traditional irrigation system in Valencia (Spain). Energy Rep. 2024, 12, 736–749. [Google Scholar] [CrossRef]
- Liu, J.; Zuo, J.; Sun, Z.; Zillante, G.; Chen, X. Sustainability in hydropower development—A case study. Renew. Sustain. Energy Rev. 2013, 19, 230–237. [Google Scholar] [CrossRef]
- Ma, J.; Liu, Y.; Wang, H.; Yan, D.H.; Lv, Y.K.; Yang, Z. Socioeconomic impacts of hydropower development on the Yibin–Chongqing section, upper reaches of the Yangtze River. Phys. Chem. Earth Parts A/B/C 2015, 89–90, 73–78. [Google Scholar] [CrossRef]
- Davies, K.; Hart, E.; Galloway, S. Quantifying impacts of sustainable transport interventions in Scotland: A system dynamics approach. Transp. Res. Part D Transp. Environ. 2024, 133, 104311. [Google Scholar] [CrossRef]
- Zhang, Y.; Zhao, T.; Zhang, Z.; Wan, J.; Feng, X.; Liang, X.; Zhou, A. Modeling and dynamic assessment on sustainable development of drainage enterprise: Application of a coupled system dynamics- comprehensive assessment model. J. Clean. Prod. 2017, 141, 157–167. [Google Scholar] [CrossRef]
- Choi, Y.-S.; Listan Bernal, M.; Tsymzhitov, S.; Yeo, G.-T. Assessing airport efficiency in the Sakha Republic: A DEA-SBM analysis. Asian J. Shipp. Logist. 2024, 40, 103–108. [Google Scholar] [CrossRef]
- Arunyanart, S. Performance evaluation of facility locations using integrated DEA-based techniques. Heliyon 2024, 10, e32430. [Google Scholar] [CrossRef] [PubMed]
- Voltes-Dorta, A.; Britto, R.; Wilson, B. Efficiency of global airlines incorporating sustainability objectives: A Malmquist-DEA approach. J. Air Transp. Manag. 2024, 119, 102634. [Google Scholar] [CrossRef]
- Liu, Y.; Ma, J.; Wang, H.; Yan, D.; Lv, Y.; Deng, W. Multi-dimensional assessment of socioeconomic impacts of hydropower development—A case in the Upper Chuan River. Sci. China Technol. Sci. 2015, 58, 1272–1279. [Google Scholar] [CrossRef]
- Qin, C.; Fu, B.; Zhu, X.; Dunyu, D.; Ciren, B.; Baima, R. Spatial and Temporal Patterns of Hydropower Development on the Qinghai–Tibet Plateau. Sustainability 2023, 15, 6688. [Google Scholar] [CrossRef]
- Kanematsu, S.Y.; Carvalho, N.P.; Martinhon, C.A.; Almeida, M.R. Ranking using η-efficiency and relative size measures based on DEA. Omega 2020, 90, 101984. [Google Scholar] [CrossRef]


| Category | Variables | Code | Unit |
|---|---|---|---|
| Input | New hydropower investment | 100 million CNY | |
| Installed hydropower capacity | 10,000 kW | ||
| Hydropower generation | 100 million kWh | ||
| Output | Total regional GDP impact value | 100 million CNY | |
| Installed capacity | 10,000 kW | ||
| Power generation | 100 million kWh | ||
| Electricity consumption | 100 million kWh | ||
| Area of soil erosion control | thousand hectares |
Disclaimer/Publisher’s Note: The statements, opinions and data contained in all publications are solely those of the individual author(s) and contributor(s) and not of MDPI and/or the editor(s). MDPI and/or the editor(s) disclaim responsibility for any injury to people or property resulting from any ideas, methods, instructions or products referred to in the content. |
© 2024 by the authors. Licensee MDPI, Basel, Switzerland. This article is an open access article distributed under the terms and conditions of the Creative Commons Attribution (CC BY) license (https://creativecommons.org/licenses/by/4.0/).
Share and Cite
Li, G.; Zhang, P.; Wang, W.; Gao, M. Scenario Simulation and Efficiency Study of Hydropower Development to Promote Regional Sustainable Development: An Empirical Analysis of a Province in Southwestern China. Sustainability 2024, 16, 8687. https://doi.org/10.3390/su16198687
Li G, Zhang P, Wang W, Gao M. Scenario Simulation and Efficiency Study of Hydropower Development to Promote Regional Sustainable Development: An Empirical Analysis of a Province in Southwestern China. Sustainability. 2024; 16(19):8687. https://doi.org/10.3390/su16198687
Chicago/Turabian StyleLi, Guofa, Pu Zhang, Weize Wang, and Meng Gao. 2024. "Scenario Simulation and Efficiency Study of Hydropower Development to Promote Regional Sustainable Development: An Empirical Analysis of a Province in Southwestern China" Sustainability 16, no. 19: 8687. https://doi.org/10.3390/su16198687
APA StyleLi, G., Zhang, P., Wang, W., & Gao, M. (2024). Scenario Simulation and Efficiency Study of Hydropower Development to Promote Regional Sustainable Development: An Empirical Analysis of a Province in Southwestern China. Sustainability, 16(19), 8687. https://doi.org/10.3390/su16198687