Abstract
The paper is set within the methodological framework of the Territorial Impact Assessment (TIA) process, which is an instrument designed to facilitate sustainable and cohesive policy-making choices at the European level. The article is developed within the context of a European H2020-RICE cooperative project, which utilises the STeMA (Sustainable Territorial Economic/Environmental Management Approach) TIA methodology to investigate the potential relationship between statistical economic indicators, specifically Gross Domestic Product, and related parameters (metadata), and Earth Observation (EO) data. The objective is to provide evidence of socioeconomic trends during the Coronavirus 2019 pandemic in the Lazio Region (Italy), with a particular focus on the metropolitan area of the Rome capital city Rome. In line with the pertinent European context and the scientific literature on the subject, the paper examines the potential for combining classical and Earth observation indicators to assess macroeconomic dimensions of development, specifically in terms of gross domestic product (GDP). The results of the analysis indicate the presence of certain correlations between grey data and EO information. The STeMA-TIA approach allows for the measurement and correlation of both qualitative and quantitative statistical indicators with typological functional areas (in accordance with European Commission-EC and Committee of Ministers responsible for Spatial/Regional Planning—CEMAT guidance) at the NUTS (Nomenclature des unités territoriales statistiques) 2 and 3 levels. This facilitates the territorialisation of information, enabling the indirect comparison of data with satellite data and economic trends. A time series of data was gathered and organised for the purpose of facilitating comparison between different periods, beginning with 2019 and extending to the present day. In order to measure and monitor the evolution of the selected territorial economies (the Lazio Region), a synthetic index (or composite indicator) was developed in the economic and epidemic dimensions. This index combines single values of indicators according to a specific STeMA methodology. It is important to note that there are some critical observations to be made about the impact on GDP, due to the discrepancy between the indicators in the two fields of observation.
1. Introduction
As highlighted by the Organisation for Economic Co-operation and Development (OECD) in 2020 [1], the implementation of priority measures in response to the Coronavirus Disease 2019 (COVID-19) pandemic, where the primary concern was the preservation of health, has had a considerable impact on businesses, travel and mobility, the financial market, confidence and uncertainty. In other words, the economy.
The estimation of pandemic effects was further complicated due to unforeseen geopolitical events that are influencing a number of key areas, including energy, climate change, demography, global economic competition, accessibility and the geo-economic structure of the EU (in cities, provinces, regions). Concurrently, the European economic paradigm for post-2020 policies is undergoing a shift, evolving from a transition economy to a just transition economy [2,3]. A debate is currently underway regarding the potential for new investments in areas with the greatest potential for sustainable development [4,5,6]. It is the case that regional and urban areas have seen an economic transformation during the pandemic, which has fostered closer cooperation and cohesion to create integrated, resilient zones, particularly in metropolitan and cross-border regions.
There is a divergence of opinion among European researchers and institutions with regard to the appropriate measure of the related impact [7,8]. One perspective posits that conventional indicators, such as Gross Domestic Product (GDP), are insufficient for explicating the economic trend and the distribution of wealth across regions and for fostering cohesion in the 2019–2021 period. As early as 2013, a number of economists, including Stiglitz, Fitoussi and Sen [9], posited the obsolescence of numerical data, which they anticipated would be superseded by the Add Value (AV) indicator; that is, the expansion of the economic system in terms of the introduction of new goods and services into the community for end-use.
Much European literature recommended the following:
- Traditional indicators included in the 8th and 9th Territorial Cohesion reports [10,11] be used. Furthermore, composite indices should be developed to measure regional resilience to the unexpected impacts and benefits of the economy of transition in terms of attractiveness, labour market, and accessibility. It is evident that these factors exert an influence on the GDP traditional trend.
- The concept of a territorial economy can be viewed as a means of achieving sustainable development, with the objective of reducing potential conflicts. It incorporates the financial implications of human health, environmental protection, externalities, economic performance, and the evaluation of policies in relation to equity and solidarity. It is therefore essential to implement the aforementioned approach and utilise indicators for the assessment of policy-decision processes.
Nevertheless, in this framework, the relationship with Earth Observation (EO) is limited to land use, for example through Corinne data or the Copernicus satellite system.
In order to examine the extent to which the integration of data from different sources (statistical, EO and big data information) may facilitate the knowledge of economic trends and the achievement of sustainable economic goals in the context of the pandemic, the paper is divided into five Sections. A review of the relevant literature and the methodological approach referred to (Sustainable Territorial Economic/Environmental Management Approach—STeMA) is presented, after which an application of European parameters to a case study (the Latium Region in Italy) is developed. In this context, it is important to integrate methods, including macro–micro-econometric and geographical contributions, and to draw upon a range of sources. The article concludes with a discussion of the results and a critical analysis.
2. Political and Scientific Materials and Methods Orienting the Study
At the initial stage of the global pandemic, the Territorial Agenda 2030 (TA) [12,13] identified a series of territorial priorities and corresponding performance indicators for measuring the economic development of the European Union (EU) in its regions and cities [14,15,16].
In the context of the global economic and health crisis, the initial promotion of balanced territorial development was temporarily suspended, and the use of European Union funds (mainly those allocated to the Cohesion Policy) for integrated development in urban, rural and specific regional contexts was redirected towards investments in health and social well-being. Moreover, the European Commission (EC) underscored the importance of monitoring and evaluating the efficacy of territorial cohesion initiatives to ensure economic resilience in the face of the impact of health and war, while promoting greater inclusion. This approach was proposed as a viable strategy until at least 2023, particularly in the context of the 2030 perspective. Consequently, the selection of indicators and methodologies for measuring the impact of investments in integrated territorial and urban development represented a pivotal stage in the further development of a place-based approach for the 2021–2027 strategy [3].
The selection of indicators and measurement methods for the impact and results of investments has resulted in a robust attempt to establish a link with Earth Observation (EO) data, which provide information in real time. Moreover, it is essential to acknowledge the disparate temporalities of the information that can be promptly accessed through EO in comparison with conventional statistical data and time series.
Nevertheless, this correlation is unable to demonstrate the economic trend in progress and its impact on GDP, which is a composite index, in an explicit and direct manner. Moreover, this type of correlation is typically confined to a single phenomenon, such as port or mobility flows, air emissions and pollution, and land use, among others.
A review of the European Commission’s implementation of other areas of investigation, including the promotion of integrated spatial data under the umbrella of place evidence [17,18,19] and Earth observation (EO), reveals that the use of EO statistical information and data is well established and widely disseminated (e.g., by CORINE Land Cover or ESA) in issues concerning land use, natural hazards, mobility and analysis of physical phenomena. These issues pertain to sectoral economics that, however, have an effect on the GDP revision, as well as on population and health, society and labour force, agriculture, energy at the national (rarely regional) level, transport and tourism, urban shrinkage, air pollution, climate change, and other matters also at the regional level. The temporal frequency of the statistical information provided is consistently annual, with a tendency towards the production of reports on a quarterly basis, and occasionally on a monthly basis. In this context, the utilisation of EO data demonstrated the significant impact of geographic diversity on the daily impact of the COVID-19 pandemic. For example, the disparate impact on the population of the northern Italian industrialised area in comparison to the southern region or of the EU core was observed [20].
It is not possible to establish a direct correlation between economic variables, such as GDP, and the impact of the pandemic on these variables in the context of an emergency situation. Such evidence can only be derived from comparative studies that used distinct methodologies:
- Firstly, a geographical analysis should be used to construct a socio-economic and territorial context in advance of the event in question.
- Secondly, an ex post evaluation must support a critical reflection on the factors that have contributed to the economic fragility of the contexts in question. The confirmation of economic phenomena related to EO correlation is sought indirectly.
It thus follows that the impact of integrated territorial and urban/rural economic development is currently quantified and assessed using conventional sectoral indicators, such as those measuring the impact of Cohesion Policy. Investments and associated benefits within sectoral policies can provide explanatory examples that demonstrate how the impact of unexpected events is measured in terms of their overall impact on growth and dedicated composite domains.
Moreover, as any impact on the economy is inherently geographically specific and localized; it can be measured indirectly, irrespective of its origin, by reference to the time series 2006, 2011, 2018 and 2021 within the spatial, urban, metropolitan and regional functional typologies and local identity. This is inextricably linked to the behaviour of the territorial socio-economic system in Europe.
2.1. The Setting of the Work
With regard to the H2020-RICE applied research scope—named Economy bY space—EYE, the preliminary step of monitoring and evaluating the cohesive territorial performance represented a crucial aspect of the integration of Earth observation and statistical data. This was performed with the objective of identifying and addressing the social exclusion and territorial cohesion challenges that emerged from 2019 to the present day. In accordance with the European Commission’s recommendation to adopt an oriented approach until 2023, the selection of indicators and methods based on an integrated place-based approach has necessarily excluded the financial impact, which is currently oriented from the Resilience and Recovery Facility plan (RRF) and inflation.
The selection of appropriate indicators and measurement methods for the assessment of the ex ante situation and the impact of events on the economy in this transitional phase, with a particular focus on sustainable, inclusive, and cohesive dimensions, has facilitated a robust connection between the EO data and territorial added value, thereby overcoming the limitations of GDP. Furthermore, it was crucial to consider the varying temporalities of the information. EO data can be integrated with traditional statistical data via the plugin Sentinel Hub QGIS.
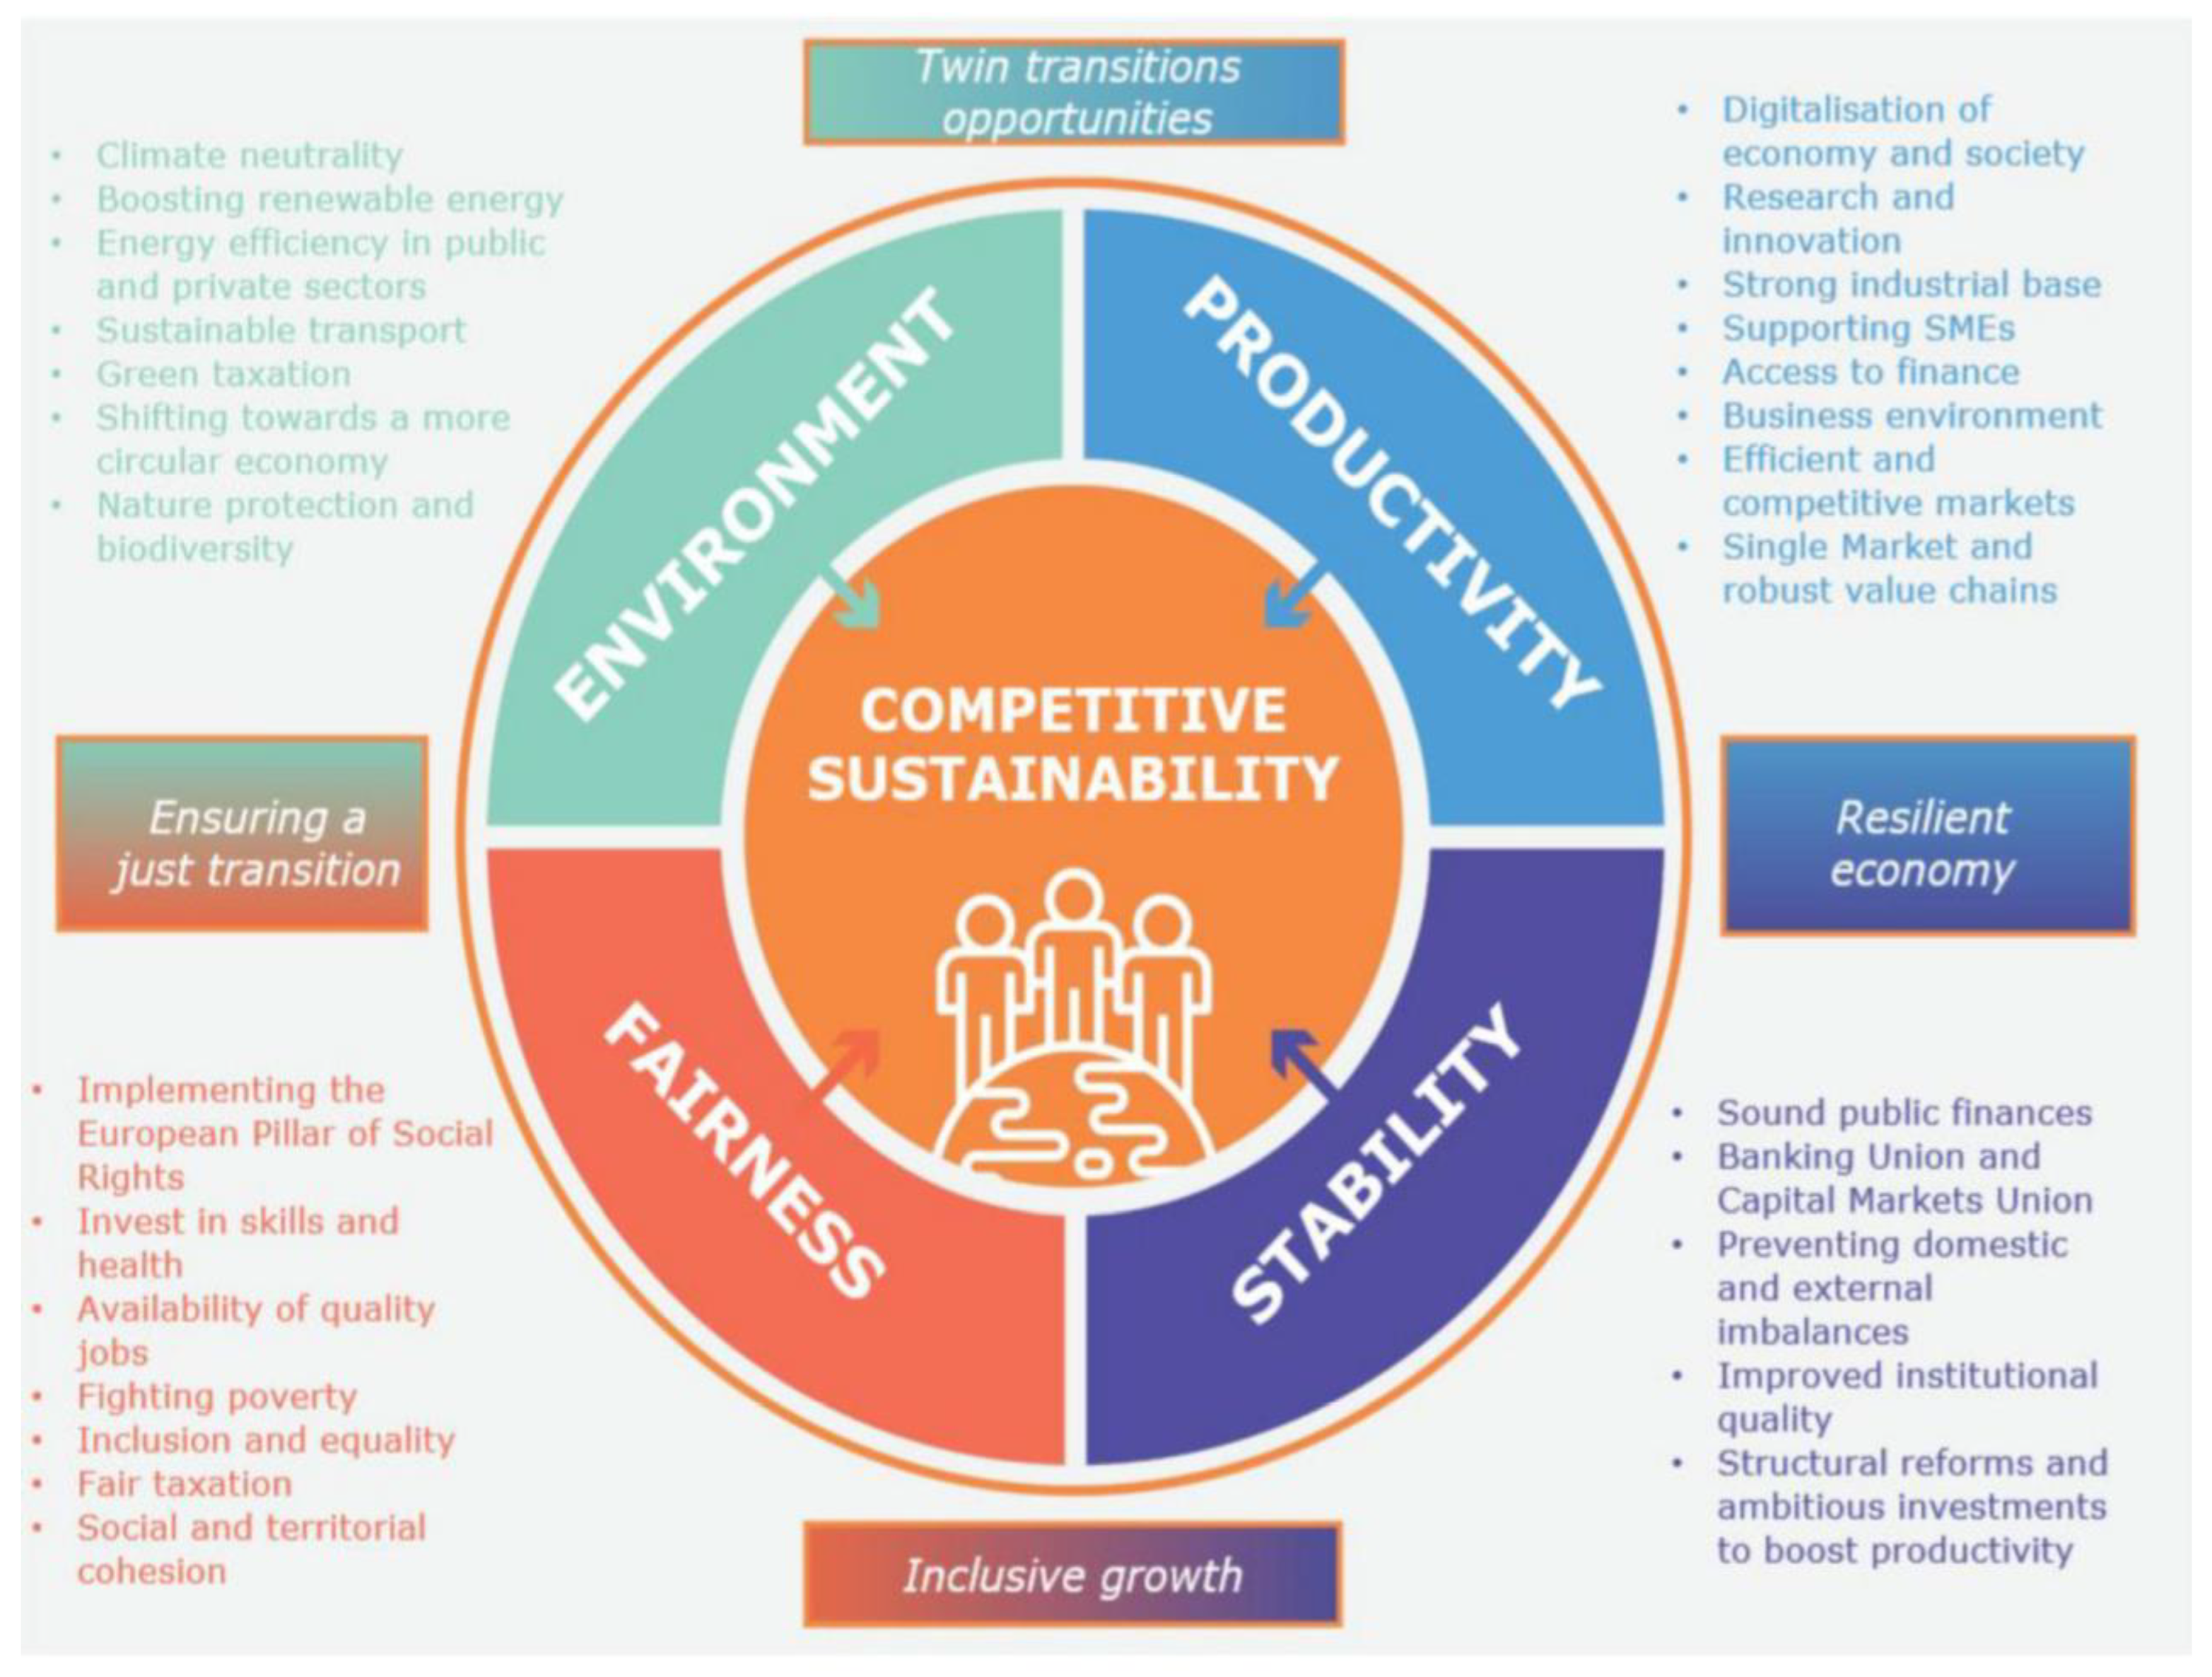
In general, the impact of integrated territorial and urban development was evaluated using conventional sectoral indicators that also assess the impact of investments within sectoral policies (Figure 1).
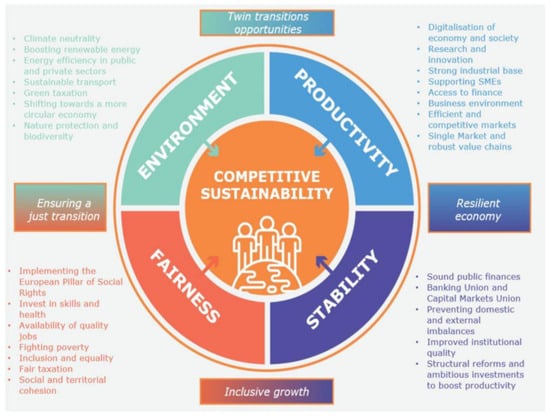
Figure 1.
The four dimensions of sustainability and related measures. Source: ([5], p. 4).
Conversely, it is possible to present examples that illustrate how the impact of the Coronavirus pandemic and other comparable occurrences can be quantified beyond the health sector, in which, the impact is typically measured by the number of individuals who have accessed enhanced general interest health services. To illustrate, in the context of education, the capacity of supported childcare or educational infrastructure represents a key indicator. Similarly, environmental considerations, such as climate change, transport, waste management and so forth, must be taken into account. Among these, energy efficiency is of particular importance, as it is defined as a reduction in the annual primary energy consumption of public buildings.
It can be argued that any of these indicators is, to a greater or lesser extent, directly related to EO and indirectly contributes to the formation of GDP. Although this approach is not inherently erroneous, it is arguably “traditional” in its emphasis on monitoring and evaluation through the measurement of direct outcomes. In certain instances, the focus is narrowed to output indicators by placing undue reliance on the enumeration of direct outputs, such as the length of built roads or the distance from a COVID hospital, the number of houseworkers’ paths in 2019 and 2021, or the number of Internet users during specific hours. In such instances, the relationship with EO is not sufficiently evident to justify the use of such indicators as a means of measuring it.
Nevertheless, this approach is not sufficient for a comprehensive assessment of the impact of the pandemic on the territorial economy. In view of the EU R&R/S4 Plans 2024–2025 [21] and the EU budget for 2027 [22], it is crucial to realign integrated territorial investments with the objective of addressing the novel policy challenges posed by the pandemic. These include the extensive utilisation of digital instruments and the recourse to the “Internet of persons and virtual platforms”.
In this context, a specific list of indicators (Figure 2) was proposed for the measurement of the impact of the pandemic on sustainable economic development.
A particular approach was utilised in the study, in accordance with the assertion made by Stiglitz ([23], p. 6). To conduct a comprehensive study of government and economics, it is essential to employ a diverse range of research techniques, including theoretical analysis, case studies and historical investigation.
The Territorial Impact Assessment (TIA) model, which is named the Sustainable Territorial Environmental/Economic Management Approach (STeMA), was initially adopted (3.0 version 2020) and subsequently revisited (as 3.2 version 2021-24) in order to address the issue [24]. The approach uses a combination of macro- and micro-level approaches, encompassing areas of economics, geography and spatial (and territorial) planning. The objective is to create and integrate a territorial assessment model at the European, cross-border, national and local levels.
The impact of the pandemic was both sanitary and territorial–economic, with regions and cities experiencing the effects to varying degrees. In response, healthcare systems, local public services and local initiatives have begun to implement key indicators within the methodological approaches of STeMA-TIA and resilience evaluation, in accordance with the national Resilience and Recovery Facility plans.
A comprehensive list of key performance indicators was geo-referenced at 1:50,000, 1:25,000 and 1:10,000 geographical scales, collating related information from official databases sourced from a range of sources, including EUROSTAT and the Italian Institute of Statistics (ISTAT) [25,26,27].
In particular, the INSPIRE Directive recommendations and the ISO-19115 metadata standards [28] were taken into account in order to ensure compliance with the relevant European and international standards for spatial referencing and data storage.
Section 3 presents a case study of the Latium Region, which illustrates the application of the aforementioned methodology.
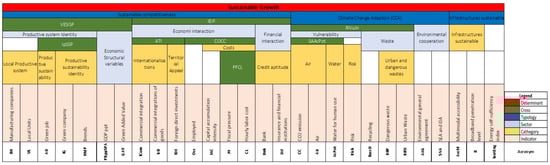
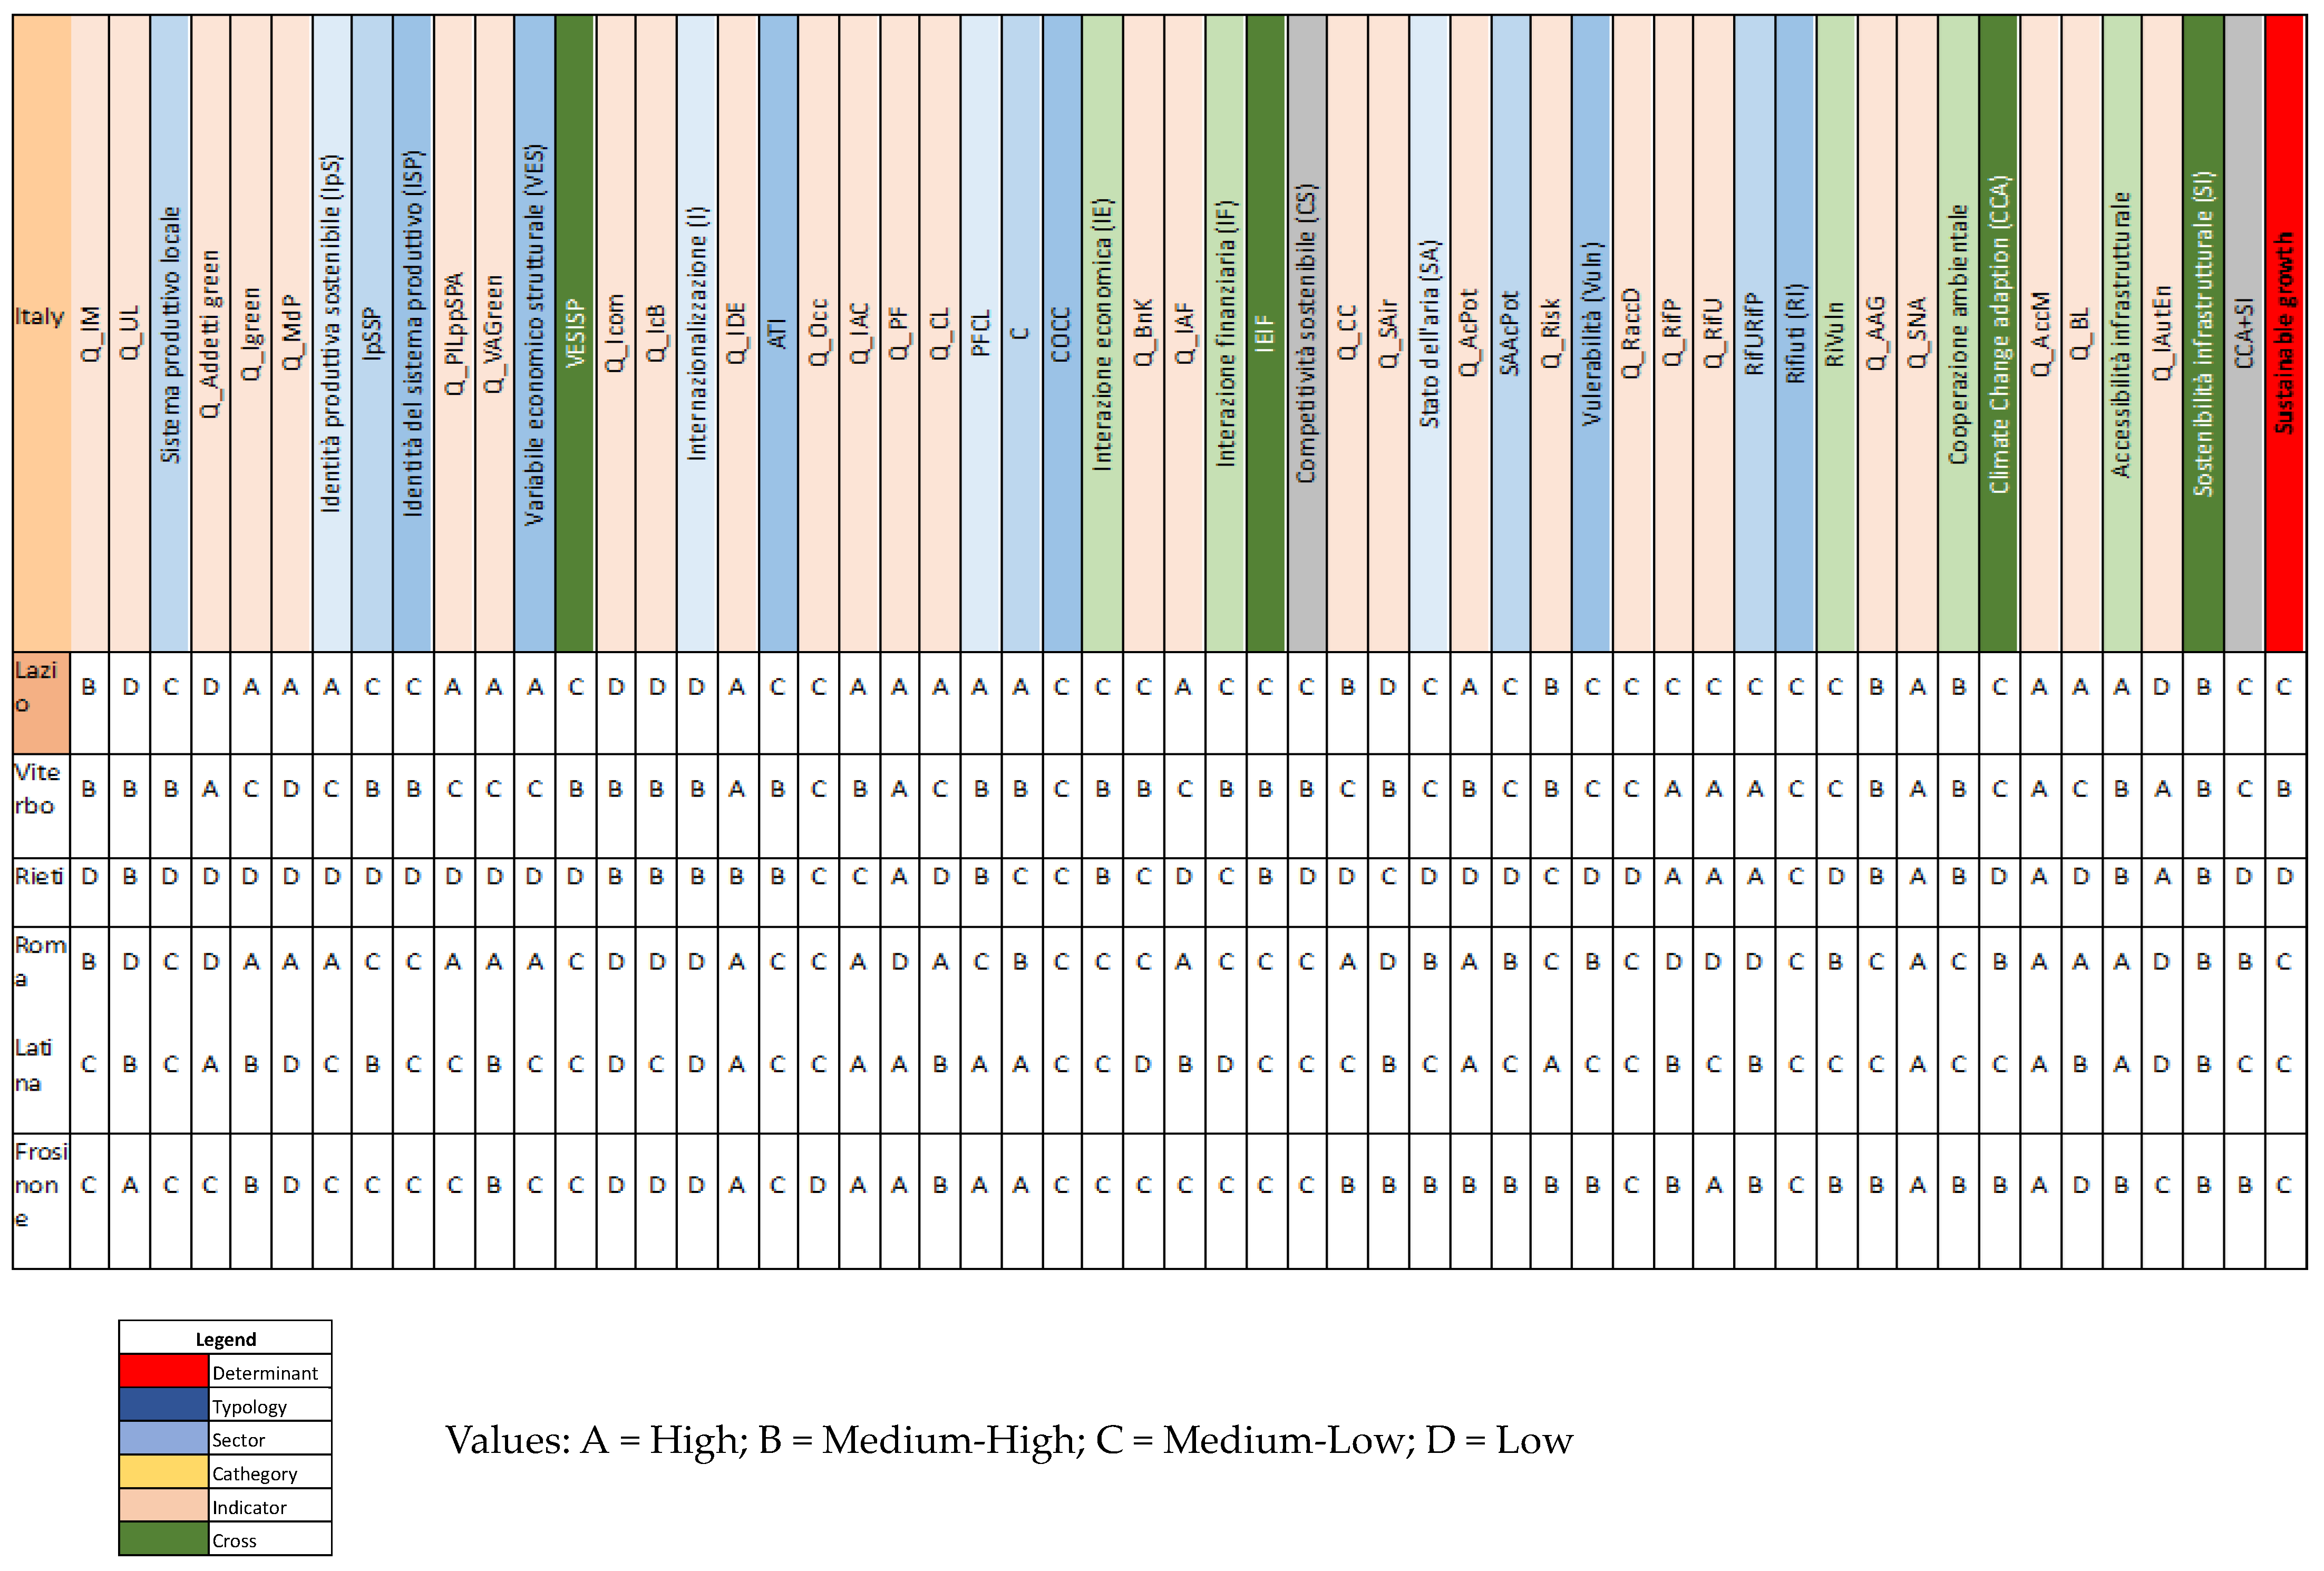
Figure 2.
Indicators and STeMA logical tree of Sustainable Growth Determinant (including climate, energy, mobility competitiveness). Source: [29].
Figure 2.
Indicators and STeMA logical tree of Sustainable Growth Determinant (including climate, energy, mobility competitiveness). Source: [29].
2.2. The Methodology
Before the global pandemic, the evaluation of regional socio-economic performance was already conducted through the Sustainable Territorial Environmental/Economic Management Approach (STeMA) and the related Territorial Impact Assessment (TIA) methodology [24] as quoted in paragrapher 6.
It is not possible to present a comprehensive overview of the entire STeMA TIA methodological process in the present context, as outlined in references [26,27,29]. In any case, to facilitate interpretation and application to the question of the pandemic, it should be noted that the STeMA-TIA 3.0 model correlates 73 representative indicators and 7 systemic functional typologies that territorialise statistical data in accordance with the geographical diversity of regions (NUTS2) and sub-regions (NUTS3). The indicators are organised at different levels into complex matrices, which are used to identify the synthetic value of the main policy scope (e.g., sustainability, economic growth, cohesion, competitiveness and so on) through pairwise comparisons. The model can be utilised for both ex ante and ex post evaluation and monitoring of policy initiatives and projects in relation to the relevant policy addresses.
The technical advantages of TIA have been well documented since the early 2000s, as evidenced by references [30]. TIA has enabled the formulation of a territorially sustainable and cohesive vision of development, as evidenced by the establishment of decision-support frameworks, the implementation of programmes and plans, and the formulation of related governance rules. In other words, it has contributed to the establishment of a process for capacity building in policy and decision-making at the geographical scale, with the objective of reducing randomness.
The geographical approach developed by STeMA allows for the assessment of a strategy’s impact to be extended beyond the scope of a simple ex ante evaluation, encompassing the capacity to accommodate it within a specific territorial scale. To illustrate, the results of the cognitive analysis have constrained the range of permissible actions that may result from the impact of the COVID crisis. Nevertheless, the level of detail provided allows for the correlation of each policy action with the corresponding indicator.
The geographical approach to indicators, as employed by STeMA, enables the analysis of all the necessary elements required to represent the territorial economic trend and to implement it. This approach has revealed the existence of significant geographical disparities and the potential for unintended consequences resulting from an ill-considered policy decision.
The indicators, which may be considered specific aspects of the geographic representation of territorial cohesion and resilience to the pandemic, have been structured in a hierarchical form. This structure may be decomposed and reconstructed into multiple levels of summary, which may be represented as a logical tree.
The tool’s principal strength lies in its flexibility and capacity to integrate a diverse range of indicators pertaining to economic, social, environmental, cultural, organisational and financial domains. This enables an evaluation of TIA in accordance with the initial seven Systemic Territorial Functional Typologies to make data georeferencing. One potential limitation of STeMA-TIA is that, during a pairwise comparison process, identifying indicators such as ‘dominant’ and ‘secondary’ may not always be straightforward. Further developments and applications may facilitate the overcoming of this limitation.
The STeMA-TIA is readily adaptable to a variety of contexts and policy questions. The model is applicable to different geographical areas and scales due to its incorporation of a territorialising process. The STeMA model is capable of promoting any economic policy that is connected to territorial capital. This is achieved by considering both the initial status and the achieved objectives of a territory (i.e., ex ante regional and provincial TIA). This enables the model to ascertain whether the targets of a policy have been met.
In line with the findings of scientific literature and experience, the economic and territorial priorities for economic growth and development in the wake of the initial phase of the global pandemic caused by the virus were the promotion of balanced territorial development, which involved the utilisation of European Union funding for the re-launching of cities, rural areas and specific regions. Concurrently, the EU emphasised the necessity for an enhanced monitoring and evaluation process to assess the efficacy of these territorial initiatives, adopting a results-oriented approach. It was therefore of the utmost importance to select appropriate indicators and methodologies for measuring the impact of investments in integrated territorial and urban development.
The STeMA methodology is designed to integrate a range of different typologies of problems, derived from a variety of sources, in order to provide a comprehensive understanding of the territory and its associated data. The STeMA methodology selected the reference geographical set or survey domain. Each dominium is variable and can be represented through its own coherence parameters and related indicators. Consequently, the STeMA methodology established two distinct processes for integrating disparate datasets, despite their inherent differences.
To be geographically significant, indicators were selected to provide information regarding the qualitative and quantitative content, as well as their value and use. STeMA-TIA combines existing theories to compare the values of the indicators that were distributed according to the quartile methods on the ordinal scales (i.e., A > B > C, etc.). The pairwise comparison assigns a ‘level of importance’ to each indicator in relation to other indicators. Thanks to the progressive indexing process mentioned above, it can be determined to which related geographical scales an indicator belongs (NUTS) [26,27].
The selection of statistical data was based on the ability to explain the relationships between domains in a coherent manner, aligning with both a systemic vision of the territory (environment, economy, society, culture) and the assessment scope, such as the Cohesion Policy, Europe 2020 Strategy pillars, or New Green Deal.
Although indicators are commonly used in the field, they deserve more than an analysis. The selected indicators were chosen to provide a clear representation of the key actors involved in the evaluation of the pandemic, with a focus on sustainable and inclusive growth. This allows for the logical correlation between the indicators to be represented in a way that reflects the reality of the situation, both qualitatively and quantitatively. In order to facilitate analysis, indicators pertaining to a specific spatial or territorial entity were geo-referenced, in this case at NUTS 2 and 3 levels. The metadata tables assist in tracing the methodology used in the selection of pertinent information by the indicators.
3. Results
This Section presents the application of the proposed methodology to the case study of the Latium Region in Italy. The investigation of the available statistical data (including grey information and time series) and satellite information (ESA dataset) is conducted in order to perform an ex ante (2018) and an ex post-pandemic evaluation (2022–2023) using STeMA models (TIA and SEA).
The ex ante evaluation is designed to assess also the situation of the Rome Capital City Region in the context of the wider region at the outset of the study (2018). This entails the analysis of performance indicators selected for the purposes of this research.
In response to the ex ante situation that emerged with the advent of the pandemic, policy-makers opted to modify the Regional Operative Programme (ROP). This resulted in the regional perspective being obstructed, which had previously been oriented towards a substantial investment in pivotal strategic actions. The objective was to facilitate a profound and enduring transformation that would leave a lasting impact on the future. This was encapsulated by the motto, “Invest in the future and determine the change”. In response to the economic crisis and the impact of the pandemic, the Latium Region proposed an alternative model of economic development, emphasising the role of digital society. The proposal entails a shift in focus from the prevailing development models to a more tangible demonstration of the efficacy of the EU’s emergency policy in combating the pandemic.
This Section presents the ex ante and ex post territorial impact assessment of the modified Latium situation in Rome.
The Ex Ante and Ex Post Evaluation of the Province/Metropolitan System in the Framework of the Regional Performance
The political–administrative characteristics and territorial organisation of the Capital City Region of Rome are significantly influenced by the specific weight of the metropolitan area of Rome, given that it constitutes a substantial part of the Latium Region. The NUTS 3 (province) and 4 (metropolitan area) classifications are concurrent, as are the distributions of general economic services and resources. It is notable that the healthcare sector represents a significant exception.
In the 2018–2019 period, the regional economy was primarily based on the service sector, which accounted for 84.6% of the total. The industrial sector contributed a mere 15%, which is below the Italian medium rate of 24.7%. In contrast, the agricultural sector accounted for a mere 1.2% of the total [31]. The region contributed 11% to the Italian gross domestic product (GDP).
In the context of the 2014–2020 period, the utilisation of European Funds (ESIF, ERDF, ESF and RDP-EAFRD funds) has been observed to prioritise certain topics in relation to the pillars of the Europe 2020 Strategy. The following areas were identified as priorities for economic progress based on the findings of the research: innovation and digital growth; economic and social progress reinforced by vocational education and training; social progress and quality of life through integration between social and health policy sectors; an increase in social and territorial cohesion; and the optimisation of regional administration capacity building.
The selection was informed by an analysis of the 600,000 companies in the region, which revealed that 164,000 were engaged in trade, 89,000 in construction, 47,000 in the primary sector, and 39,000 in manufacturing and mining. The regional economy is largely dependent on tertiary non-trade activities, which account for 216 thousand companies, representing approximately 39% of the total. A notable proportion of these enterprises are engaged in public sector activities, including a considerable number of research centres and institutions. These include 218 laboratories, 4 excellence centres, 48 research institutions, 12 or more universities, 3 scientific and technological parks, and 4 technological districts. Collectively, these institutions contribute to the region’s high level of innovative capacity.
The evaluation process yielded five strategic priority axes for the territory.
The following five strategic priority axes were identified as the key areas for action:
- Research, Innovation;
- Digital Latium;
- Competitiveness;
- Sustainable energy and mobility;
- Hydrogeological and seismic risk.
The global pandemic, which originated in 2019 and persisted until 2022, had a considerable effect on economic activities and mobility. The pandemic resulted in the digitalisation of various activities, including teaching and education, theoretical research, administration and others. This was accompanied by a decline in trade, tourism, manufacturing, production and construction, as well as a reduction in access to healthcare facilities and public transport (see Figure 3 and Figure 4). The pandemic had a favourable impact on domestic consumers of primary goods and air pollution (climate change mitigation), but a detrimental impact on domestic waste.
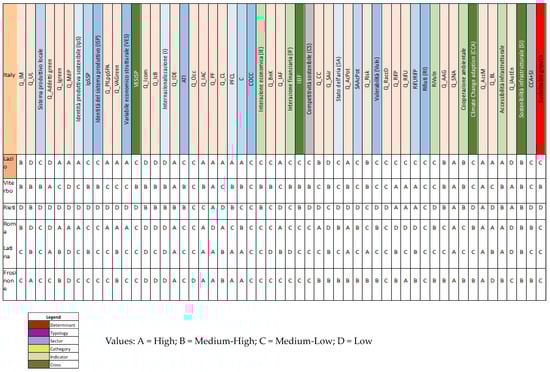
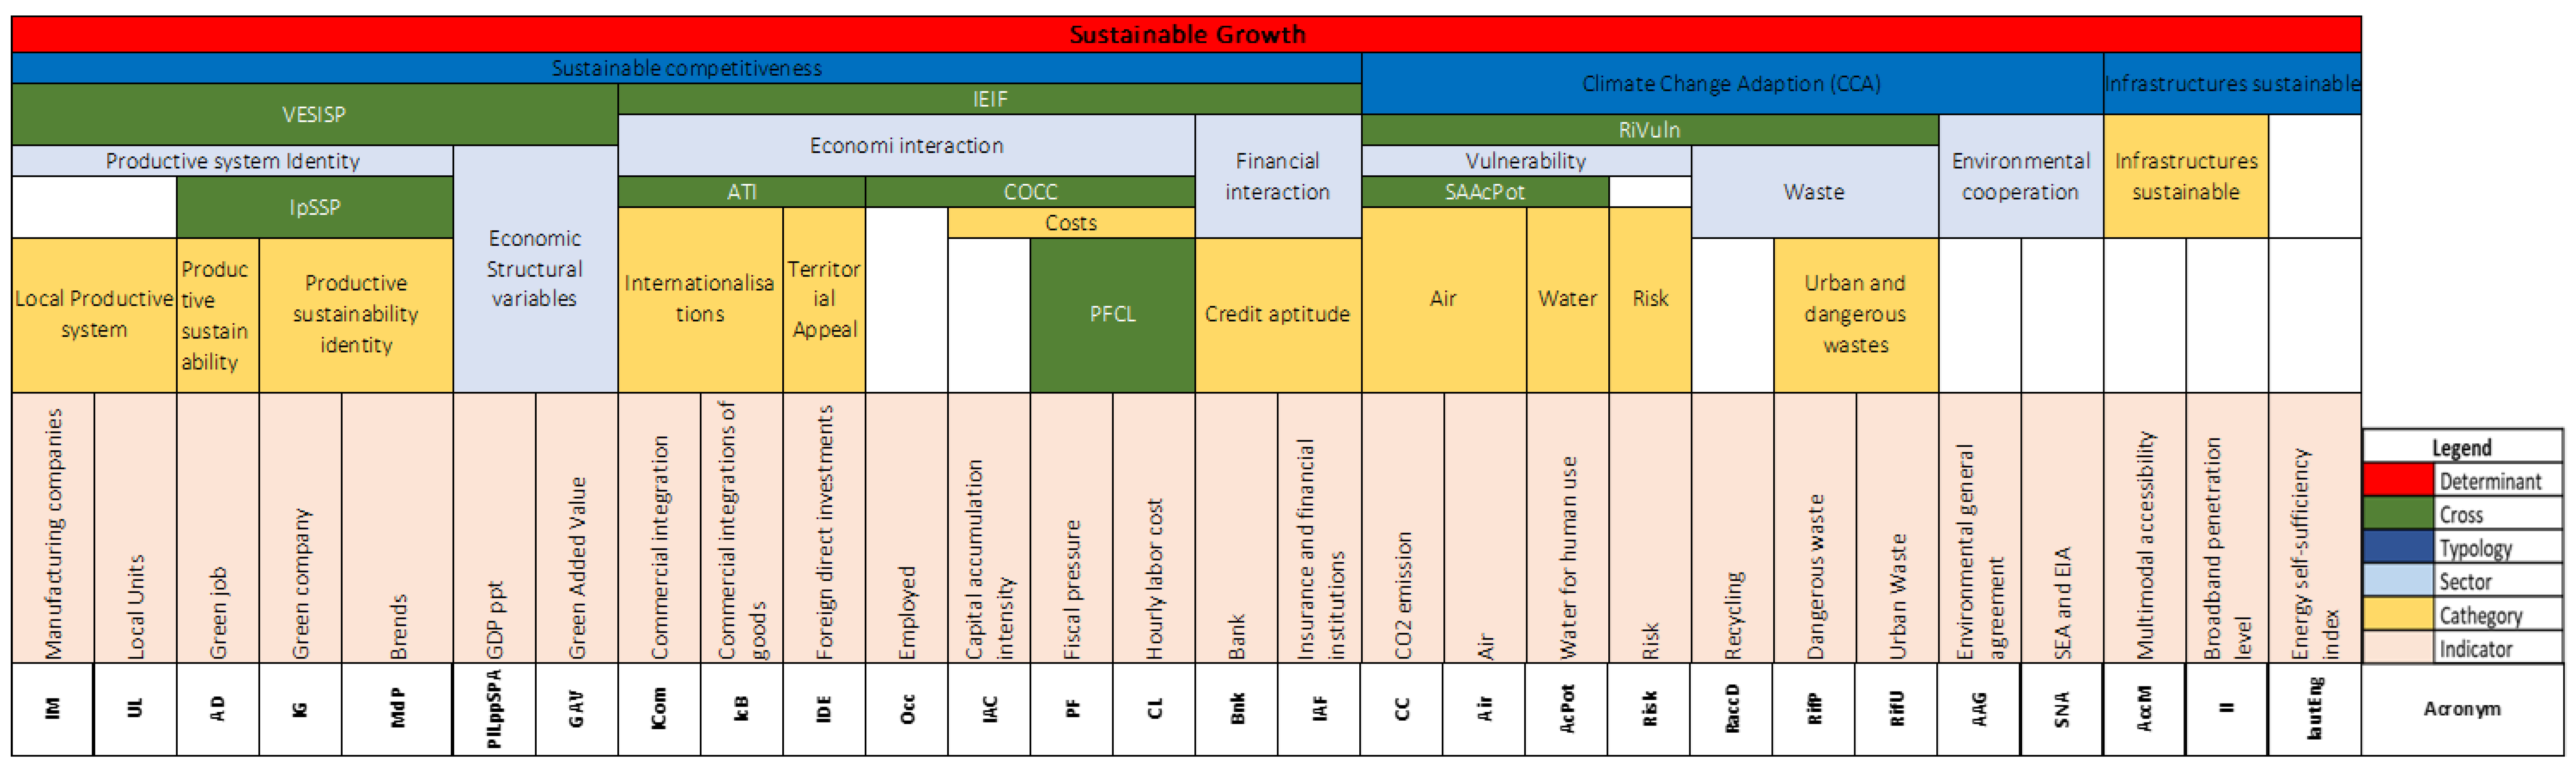
Figure 3.
STeMA ex ante assessment of Latium Region, Determinant Sustainable Growth calculated applying the STeMA logical tree of Sustainable Growth Determinant (including climate, energy, mobility, competitiveness).

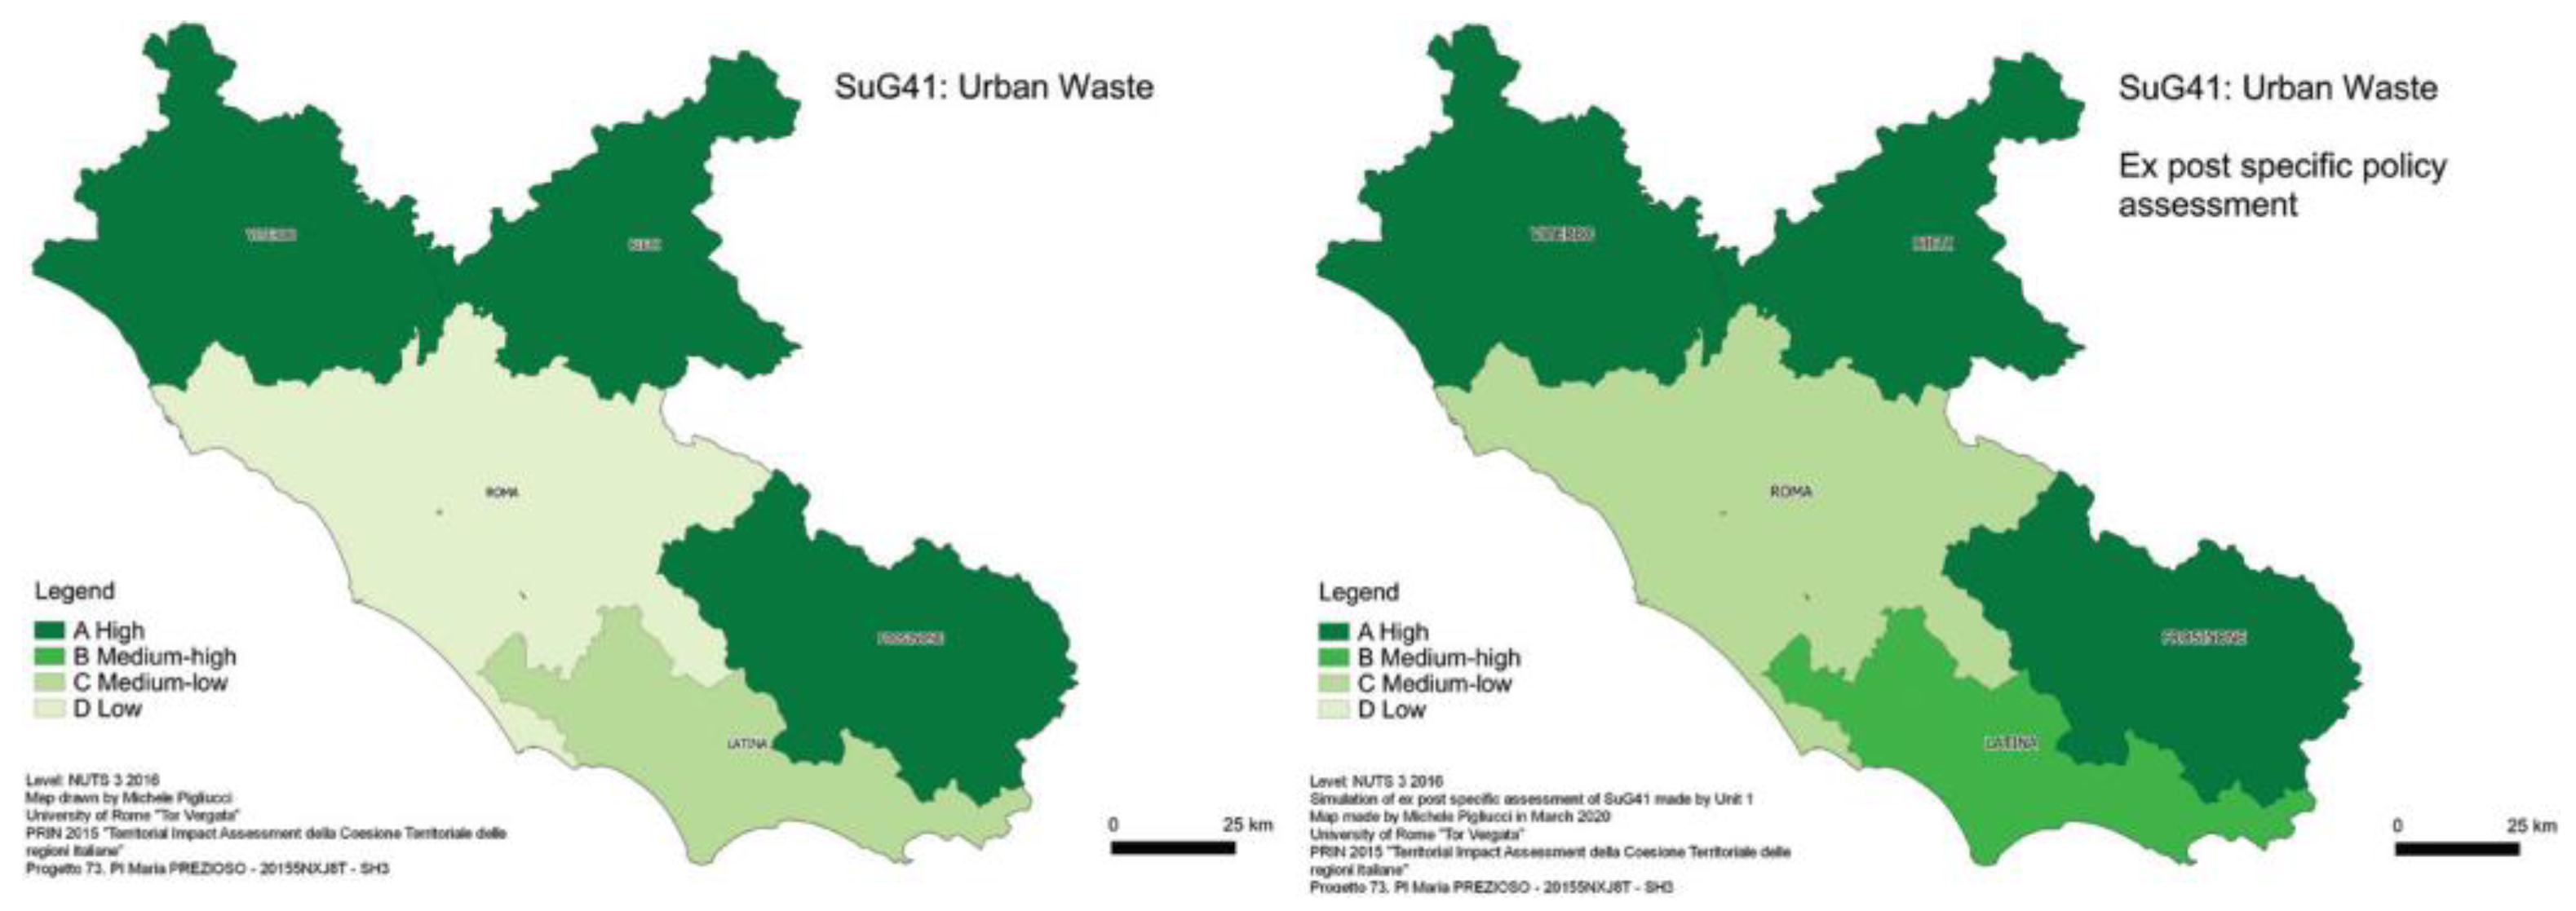
Figure 4.
SuG41 Indicator Urban Waste, ex ante and ex post situation. Source: ([31], p. 420).
In the matter of sustainability, the Latium Region demonstrated a medium–low performance level (C) prior to the advent of the pandemic. No discernible difference was observed between the region and the capital city of Rome. However, an ex ante assessment indicated a territorial disparity, whereby rural territories in metropolitan areas demonstrated a greater potential for competitiveness in sustainability than territories with strong historic industrialisation (East zone of the Metropolitan City).
In contrast, other more rural provinces, such as Viterbo, achieved a medium–high level (B), which is higher than the level achieved by Rome (C). The province of Rome Capital City attained a high level of trade integration of goods (an indicator of “brands”).
In the context of the ongoing pandemic, the Italian province of Rome has evidenced a notable lack of interest in the environmental and climate impacts, particularly in instances where the ex ante performance remains at a relatively high level (A). With regard to the indicator pertaining to urban waste, an improvement in Rome’s performance is evident, designated as medium–low level (C), due to an increase in household consumption (Figure 4).
An additional indicator of financial and economic sustainable growth is the enhancement of productive system identity, which represents a primary objective of the ROP. Nevertheless, this objective has not yielded a significant advancement in Rome and the broader region, with the overall performance level remaining at the medium–high level (B). This is attributable to the repercussions of the contraction and cessation of market activity, along with the halting of production and construction (Figure 5).
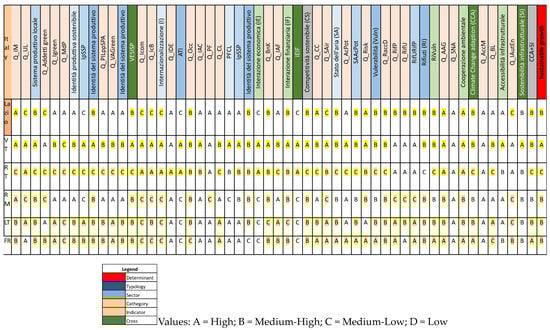
Figure 5.
STeMA ex post assessment of Latium Region ROP policy choices, Determinant Sustainable Growth. In Yellow are values that have changed.
The mapping of the sustainability synthetic composite index produced by STeMA application confirms the fairness of the process (Figure 6).
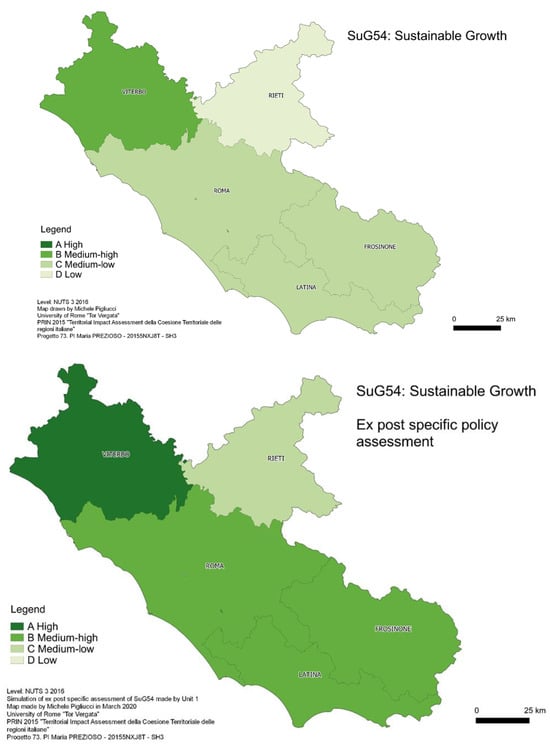
Figure 6.
SuG54 Sustainable Growth synthetic composite index, ex ante and ex post situation. Source: Source: ([31], p. 421).
4. Discussion
The investigation of the impact of the Coronavirus (COVID-19) on regional and metropolitan economies commenced in 2021 as part of the H2020-RISE project entitled EYE (Economy by Space). Methodologically, the quality of the analysis is contingent upon two variables:
- Firstly, the level of disaggregation of the gathered data at regional, metropolitan and provincial levels; and secondly, the extent to which the data are representative of the relevant geographical area.
- It is also essential to consider the updating of data in order to gain a comprehensive understanding of the territory in question prior to the onset of the pandemic.
Prior to the advent of the pandemic, the aggregate regional expenditure was relatively modest. In light of these considerations, territories were encouraged to direct greater attention to expenditures related to quality of life, including youth policies, sport and leisure, and spending on social rights, social policies and the family. Conversely, fewer resources were allocated to economic development, and transport remains a significant challenge to regional competitiveness (Chart 1, Chart 2 and Chart 3).
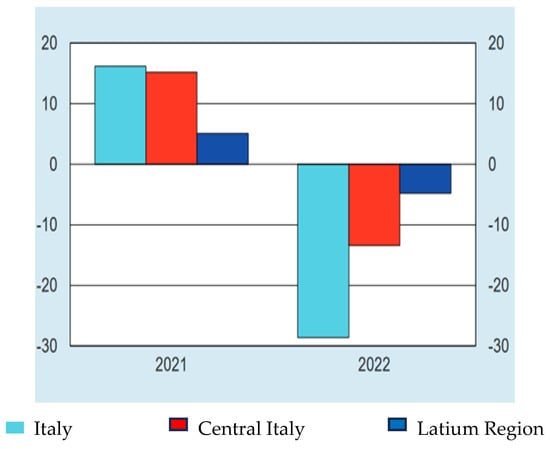
Chart 1.
Trend of Regional Services Source: ([32], p. 12).
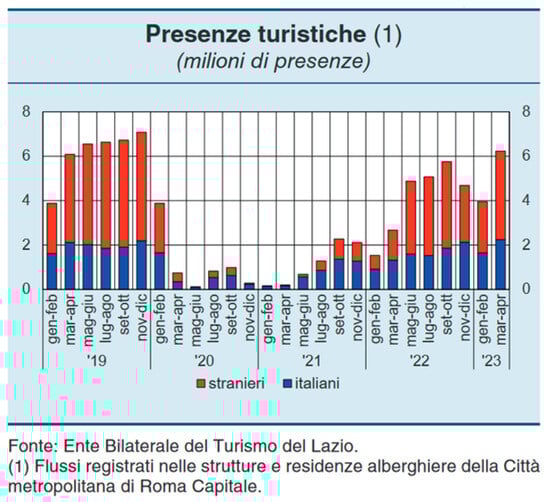
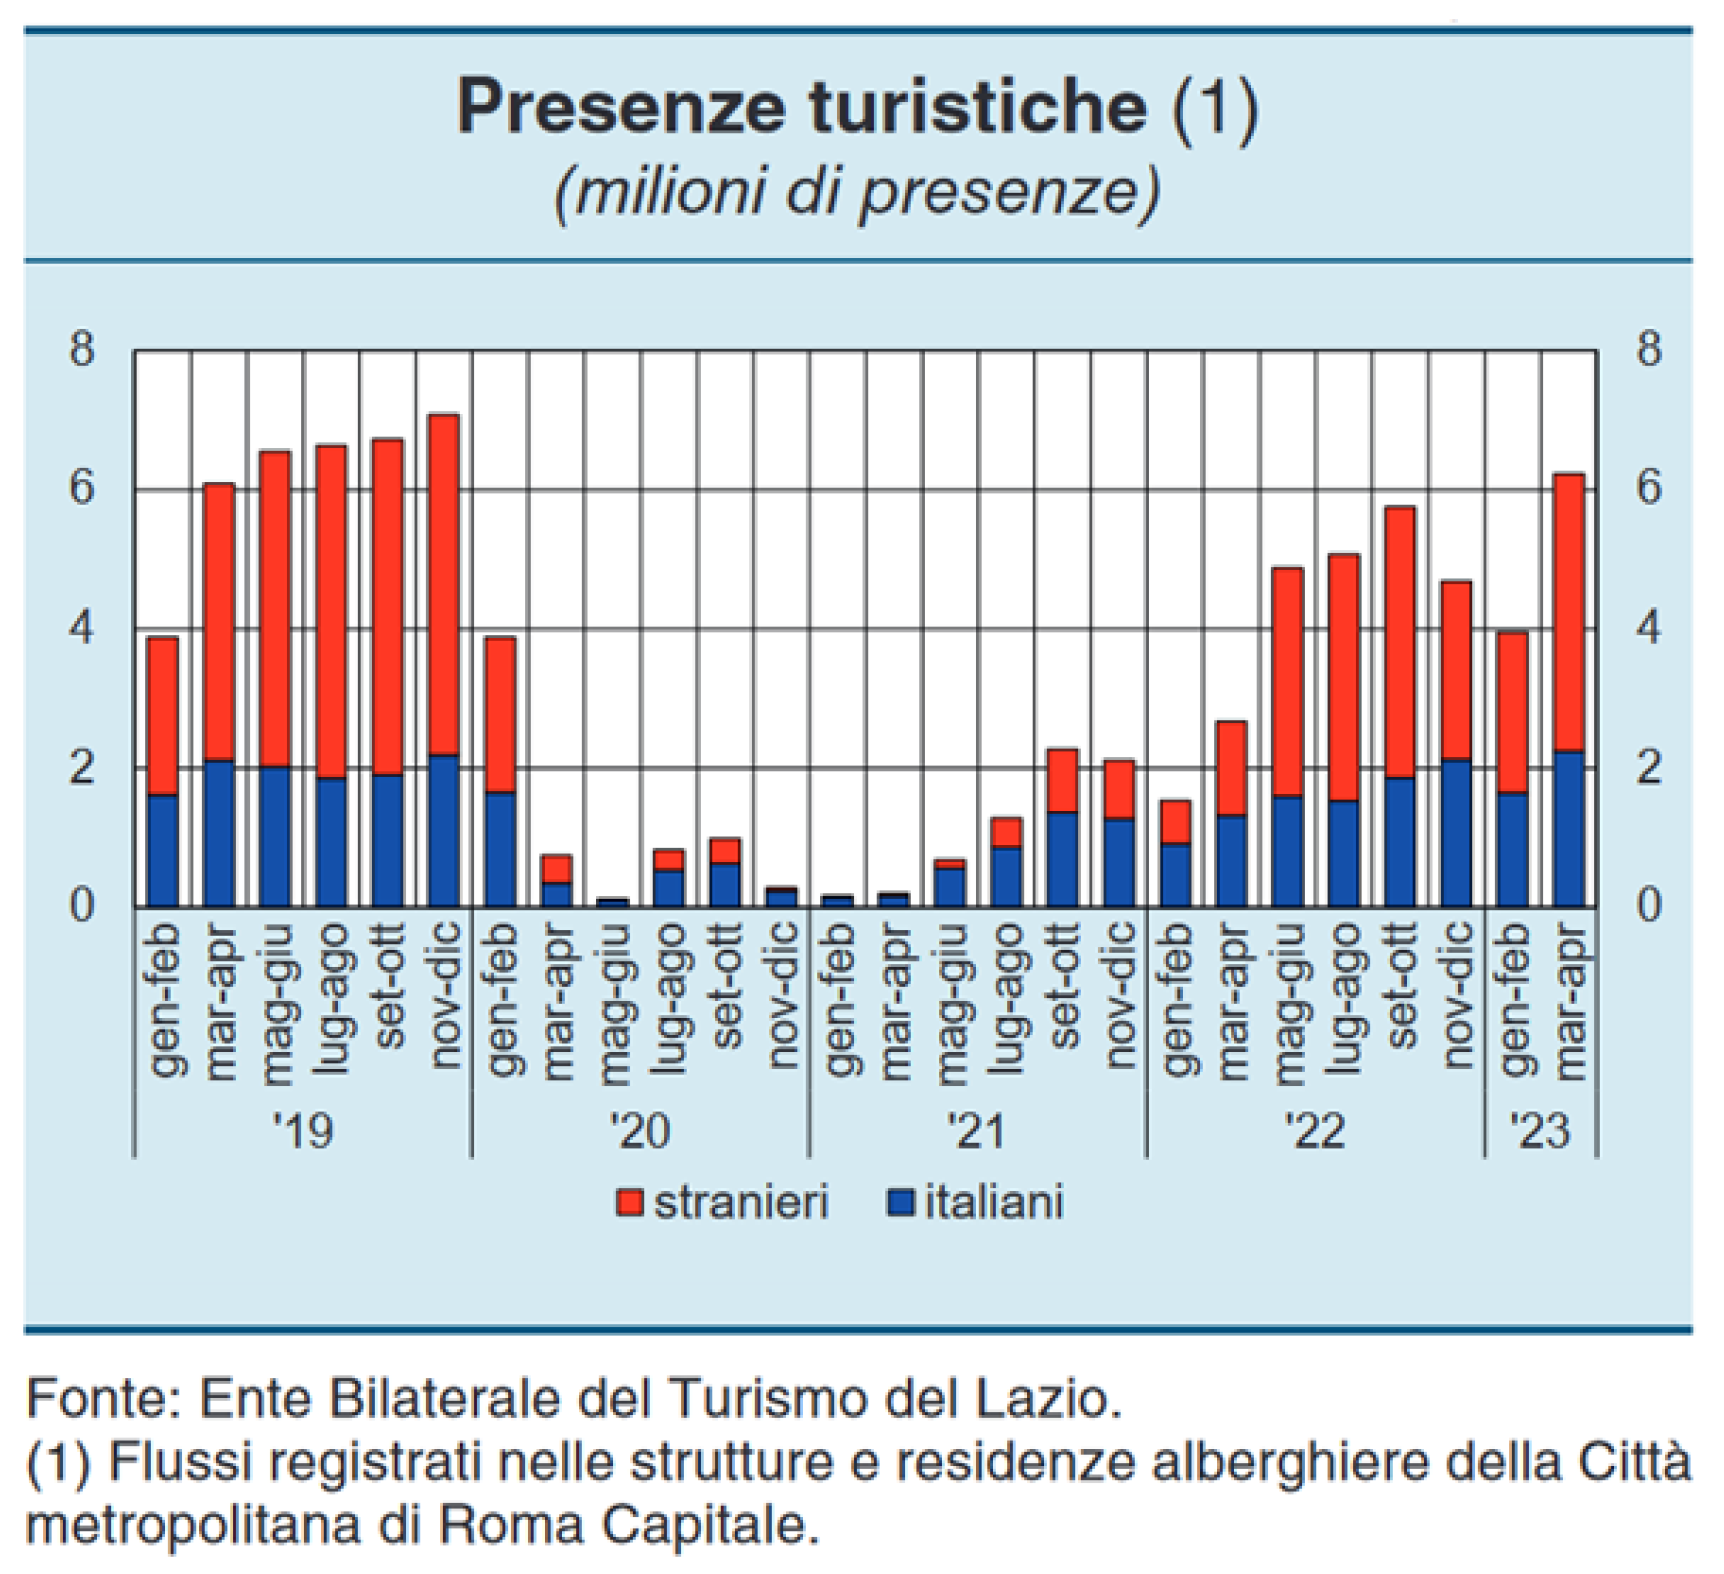
Chart 2.
Regional Tourist inbound Source: ([32], p. 12).
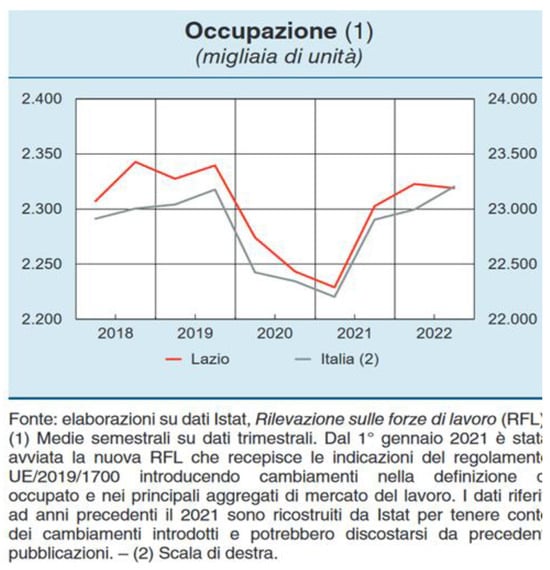
Chart 3.
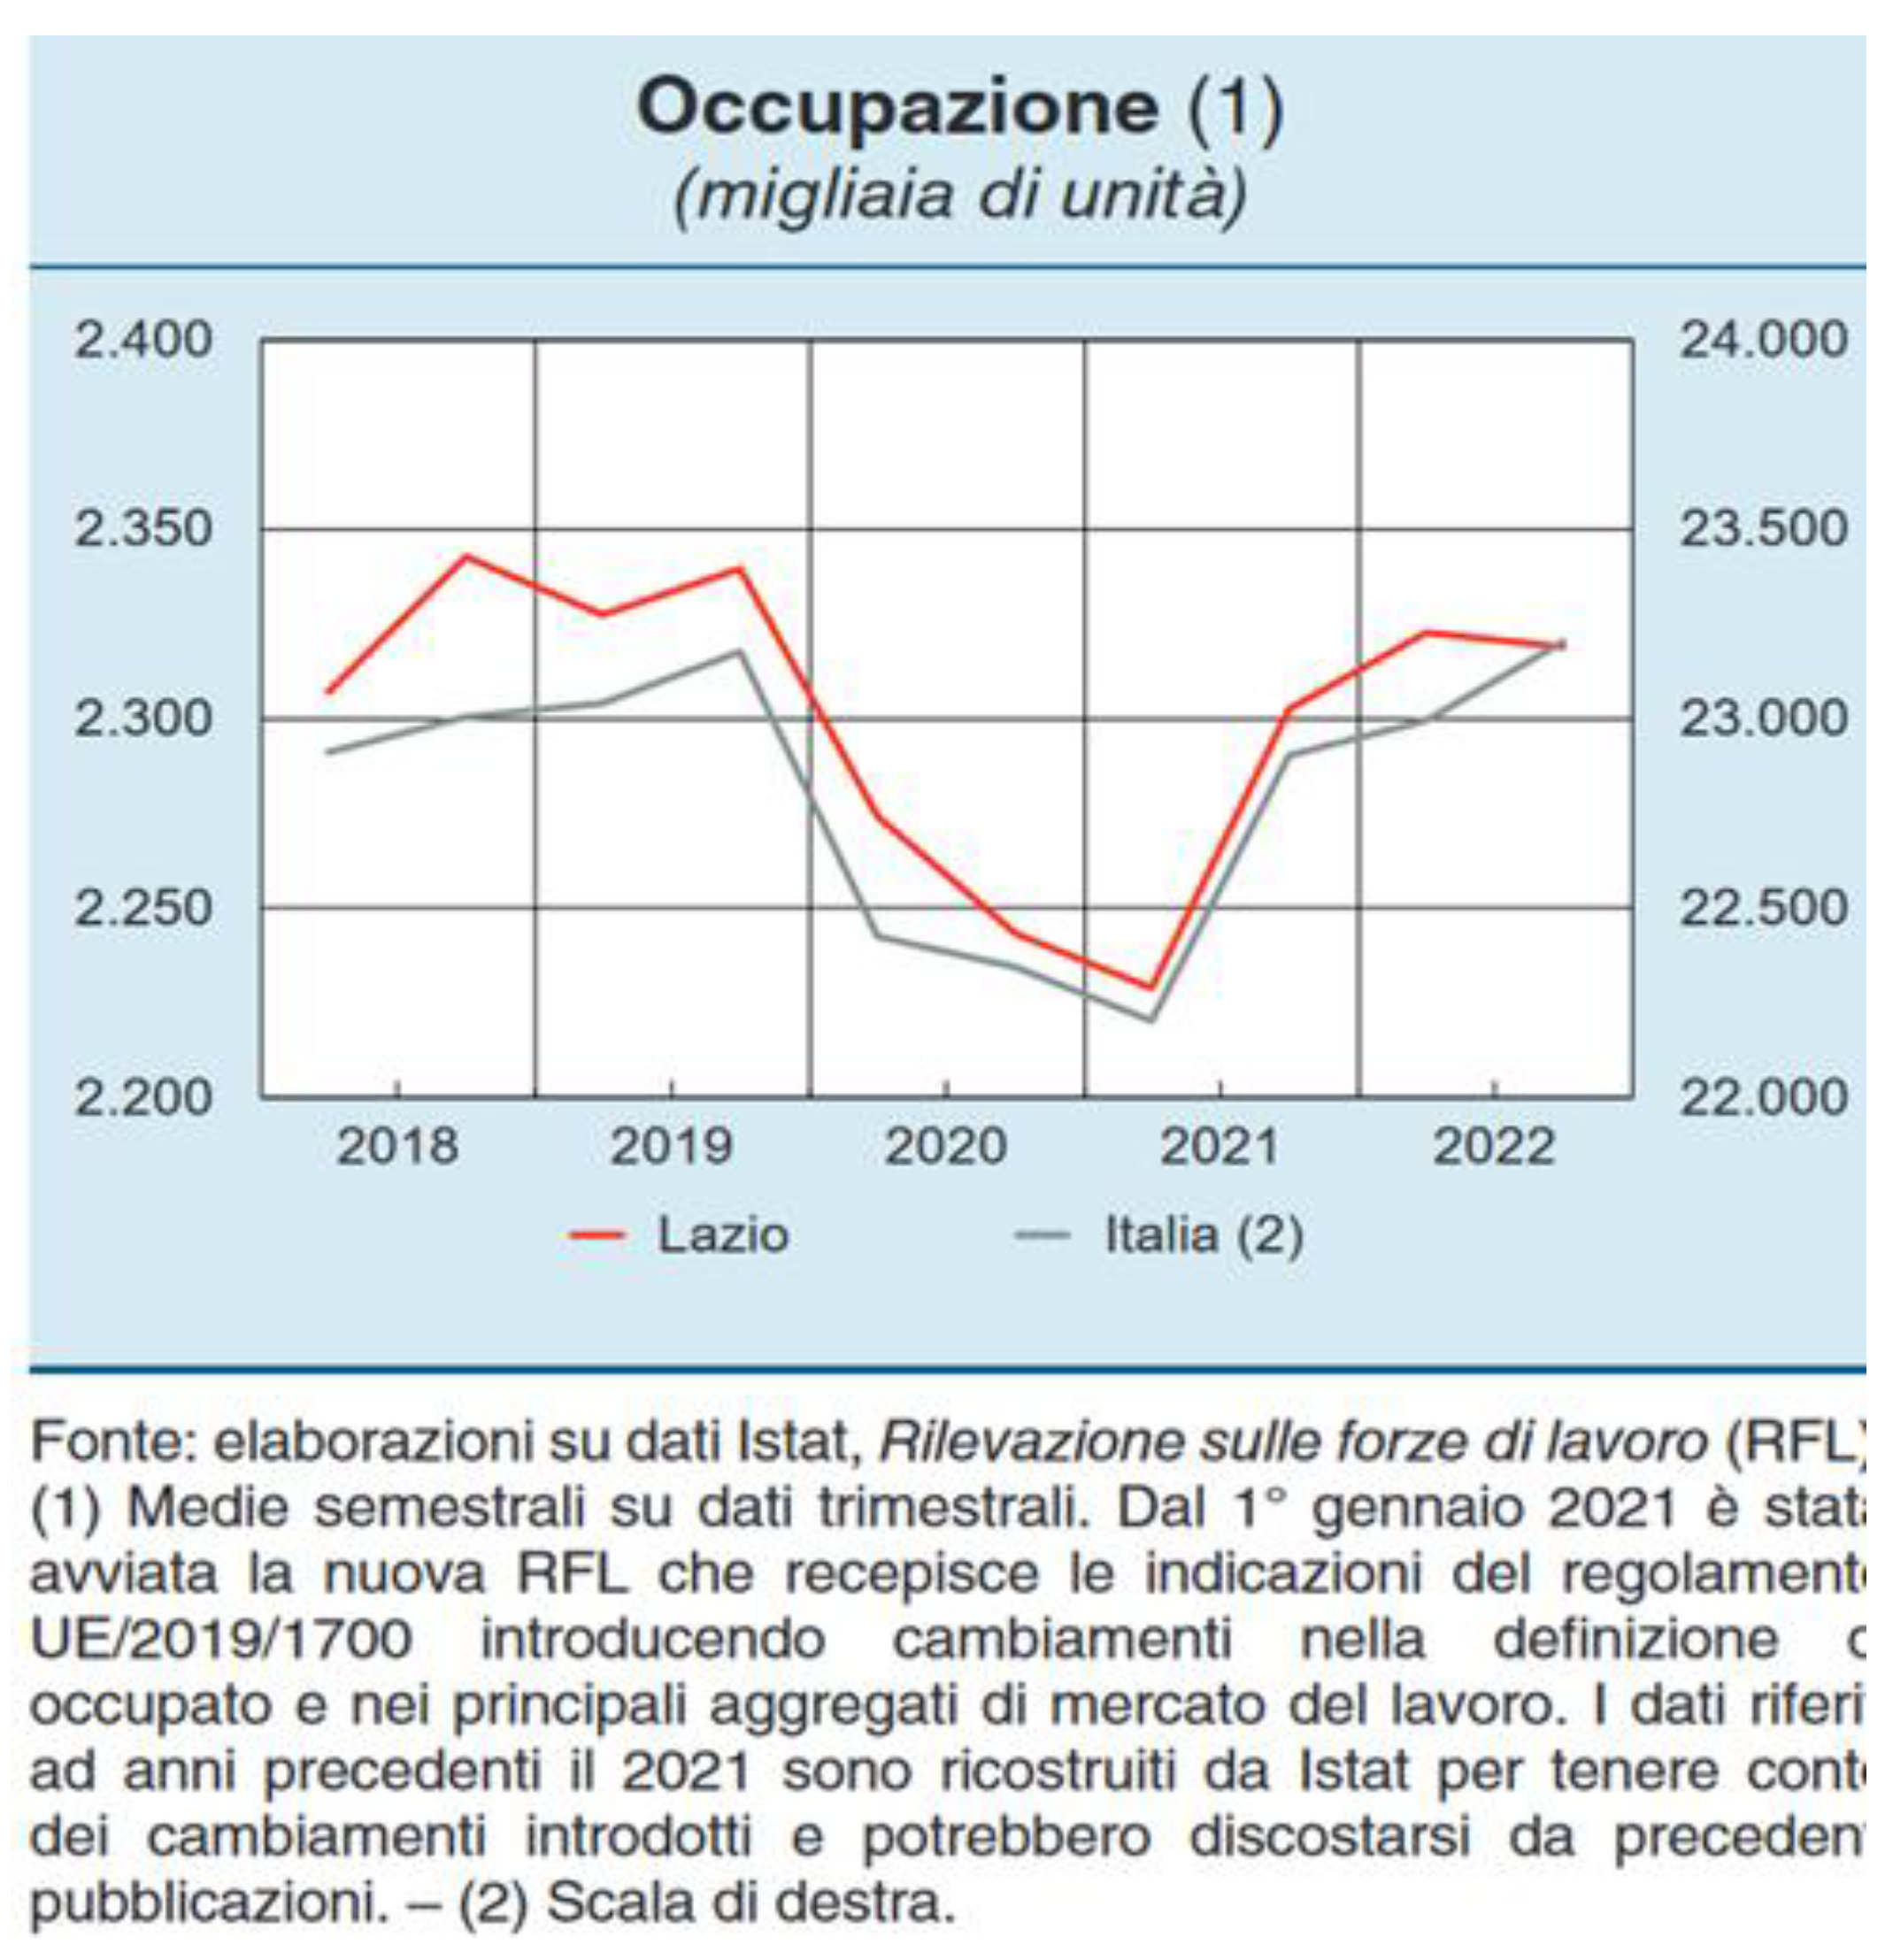
Employment trend in Latium Region 2018–2022 Source: ([32], p. 23).
During this period, Latium demonstrated suboptimal performance with regard to sustainable growth, although it achieved a medium–high level (B) of smart and inclusive growth, characterised by notable disparities among the provinces. The considerable heterogeneity of the other territories, particularly the rural ones, was offset by the considerable urbanisation of the Rome metropolitan area, which exhibited a relatively high level of performance in several key indicators.
A review of the expenditure of funds in financing specific policies devoted to the mitigation of the COVID-19 pandemic reveals that the region’s spending was not characterised by a significant amount of expenditure in Rome, which was at the high level (A). The highest level of expenditure was observed in the Cohesion Fund, which was concentrated in the healthcare system. This encompassed the provision of vaccines, hospital beds and medical infrastructure, the establishment of home care services, the allocation of resources to support low-income families, and the delivery of other public services.
In 2017, the GDP (in ppa) was about EUR 194 million; in 2019, it was EUR 202 million with a GDPpc of EUR 34.300; and in 2020, it was EUR 186 million. Despite a 6.3% increase in 2021, the GDP remained below the national average.
In 2020, there was a 9.1% decline in the GDP. Based on the available projections, it is anticipated that growth will range between 0.9% and 1.4% in 2023.
The services sector (Chart 1) was strongly affected by the pandemic crisis and the sharp drop in tourist flows (Chart 2) and a large part of sectoral companies have seen their turnover halved. During the pandemic period and with respect to 2019, hotel accommodation decreased by 77% in Rome Capital City, which includes almost 90% of the hotels.
Regional employment also decreased on average by 1.4% (Chart 3), mainly in 2020, affecting the trade sector more than the industrial one, the female rather than the male employment.
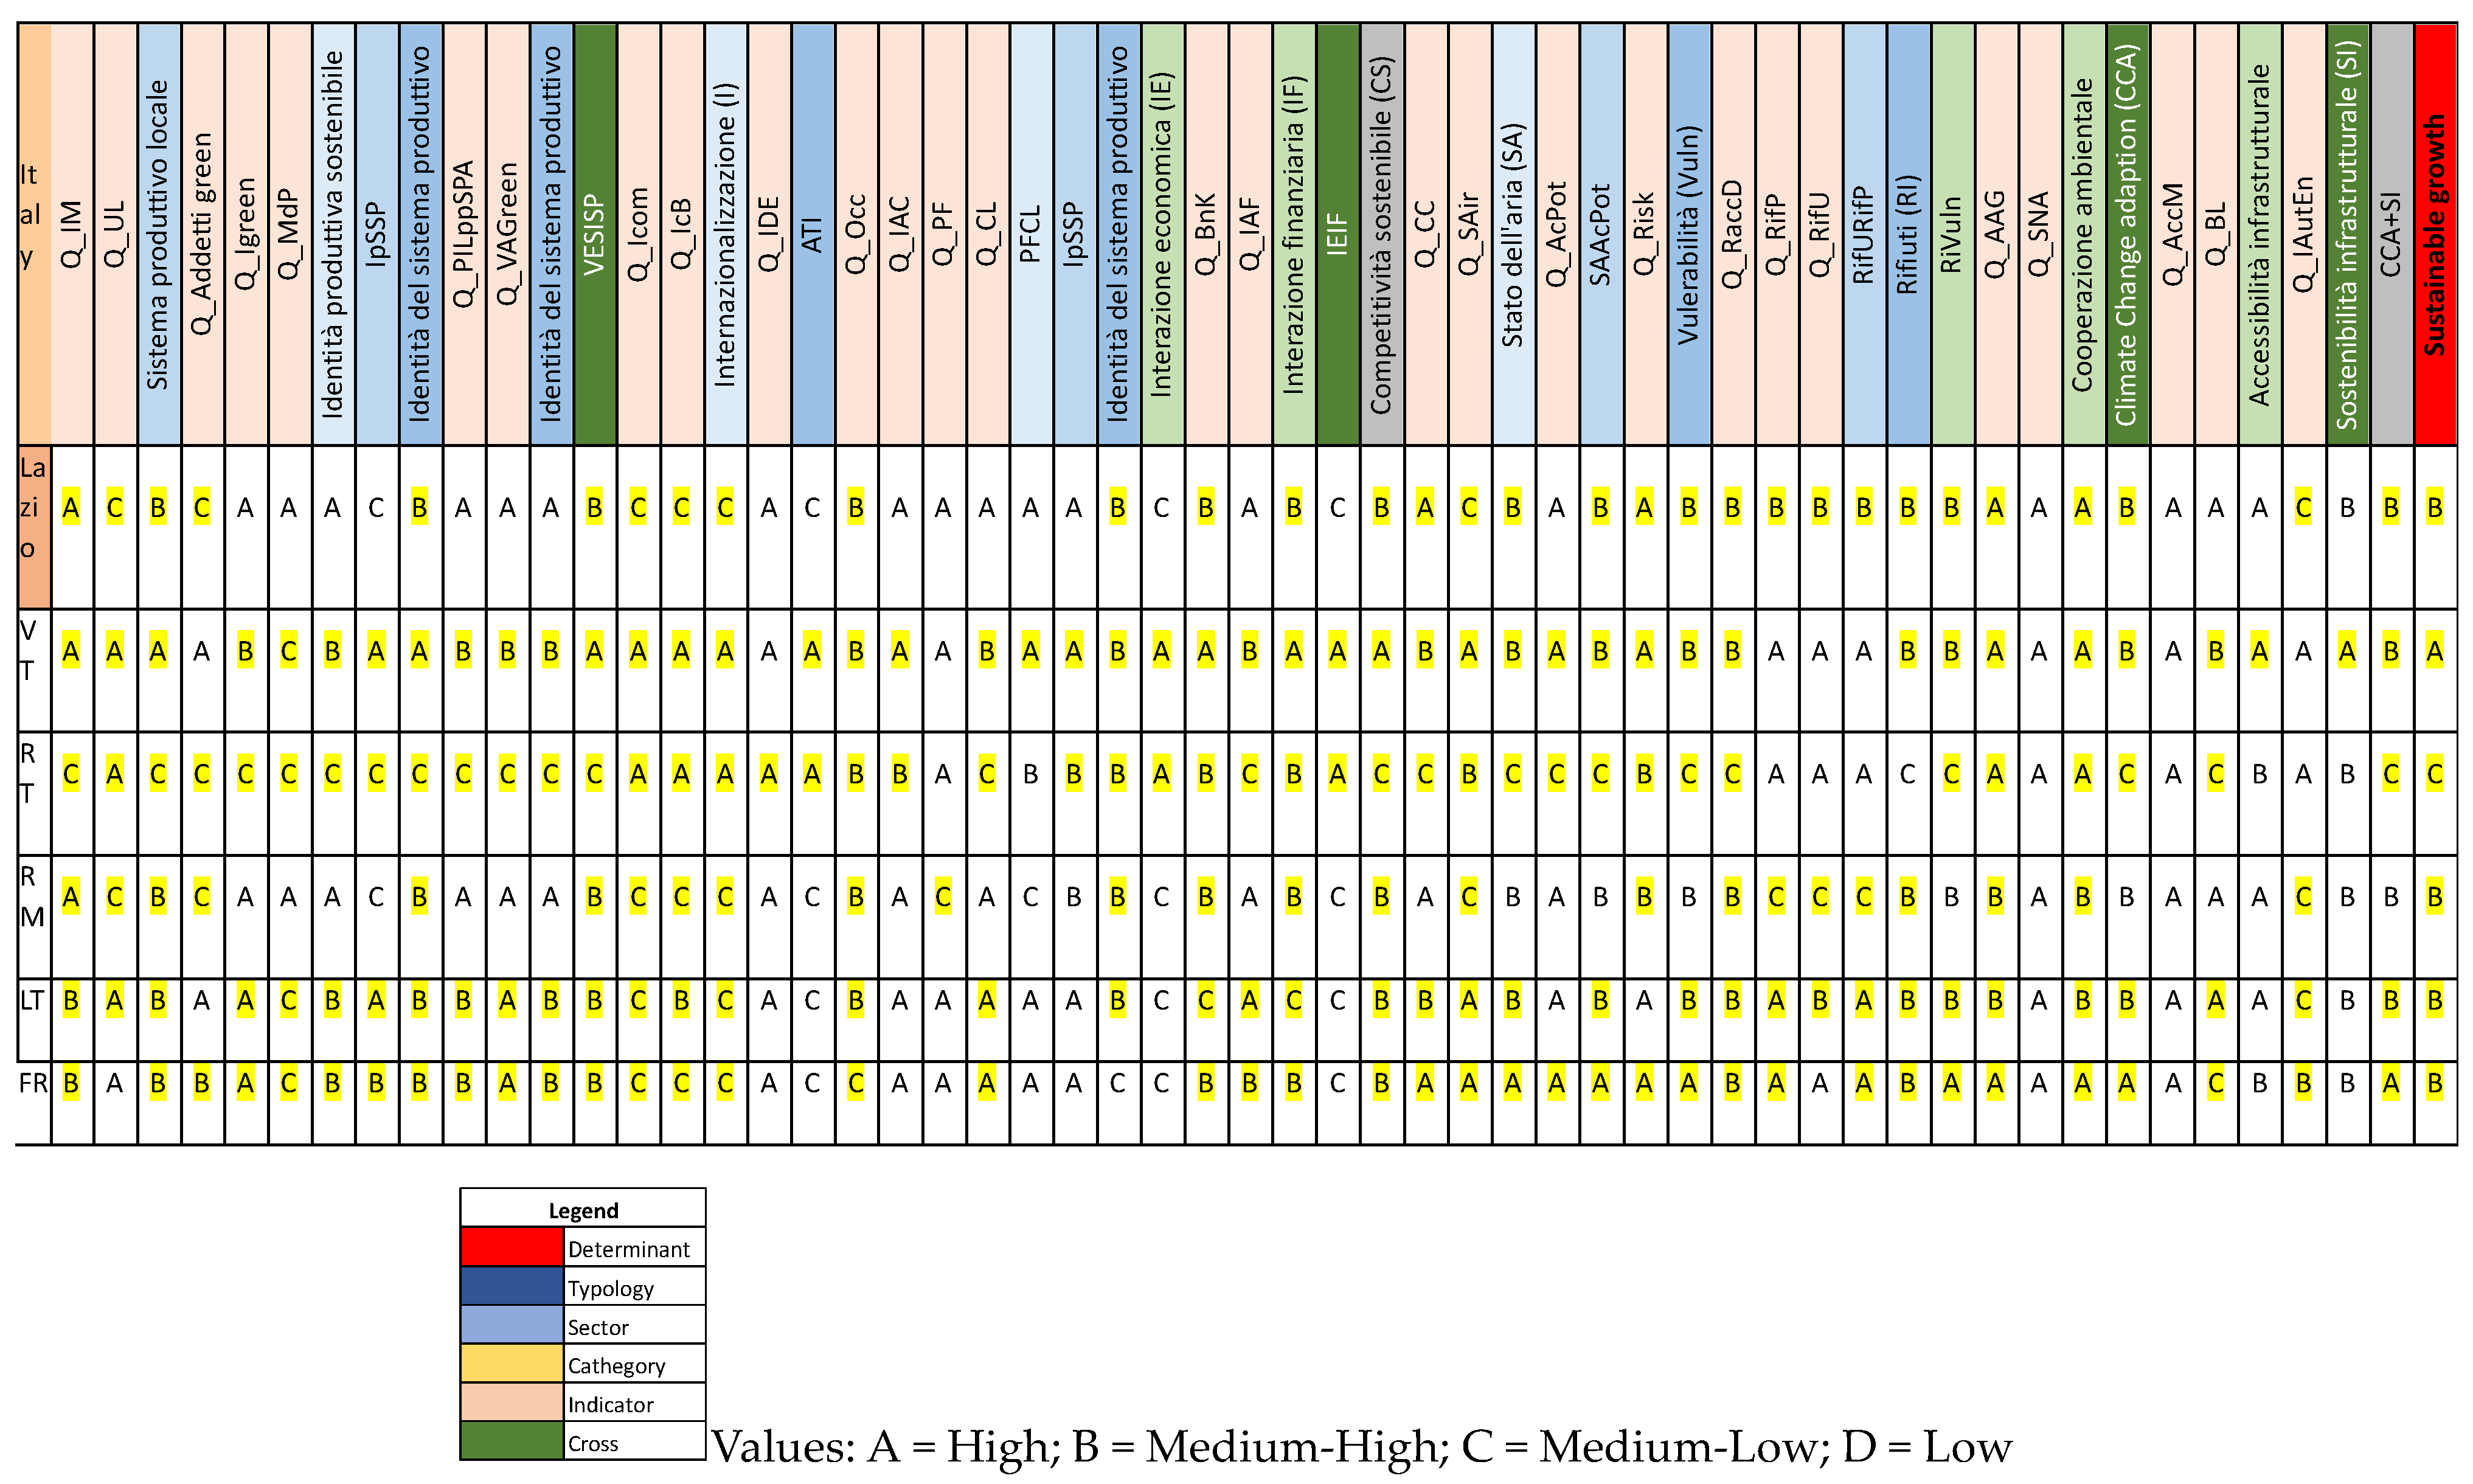
As a result of the assessment analysis, a qualitative evaluation of regional GDP and NUTS3s (provinces) was performed, as detailed in Figure 7.
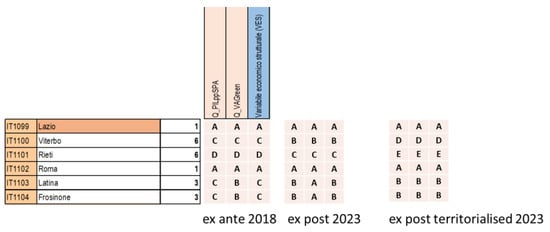
Figure 7.
Impact on GDP and Green Added Value. Source: [29]. Final qualitative evaluation with: A (high value) > B (Medium-High value) > C (Medium-Low value) > D (Low value).
The implementation of a range of policies and investments designed to bolster the local economy, including those pertaining to energy, climate, industry, R&D, infrastructure, technologies for ecological transition and sustainability, and technology transfer, was temporarily halted during the pandemic. This was accompanied by a cessation of access to research and education buildings. It is noteworthy that educational and research activities were conducted via a smart working approach, which facilitated the maintenance of an acceptable level of production. This was made possible by the presence of more than 16 public international research bodies, which provided a place (albeit by means of smart working) for the application and flexible training (soft skills) of level IV (e.g., industrial PhD).
The interdisciplinary innovation promoted by universities and national/international research institutes (CNR, ENEA, INFN, INAF, ASI, etc.) and related collaborative projects enabled a significant portion of activity to be conducted remotely. This decision facilitated the generation of temporary employment opportunities and the implementation of smart working practices in the context of ecological and economic transition (circular collaborative economy, low carbon transition, etc.), thereby enhancing the resilience of metropolitan and local cultural heritage.
Notwithstanding the aforementioned activities, the impact of the Coronavirus Disease 2019 (COVID-19) pandemic has been discernible in ongoing projects spanning the period between 2019 and 2022. Furthermore, this has had an impact on the innovation required for the development of institutional capacity and public research and development structures at the international level.
The planned establishment of an Open Sustainable Innovation City of Knowledge and Sustainable Innovation in Rome has also been hindered. Nevertheless, the advent of a novel model of “cohesive polycentric place-based evidence” has facilitated the consolidation of the collaborative network of the participating national excellence institutions, enabling them to pursue a common objective of attaining a “neutral” 2030 economy. This approach has the dual benefit of minimising the environmental impact and absorbing large volumes of temporary youth employees, virtual users and visitors.
The proportion of the national total represented by education activities remained stable at 27.7% in 2023, as did the contribution of research in the fields of socio-economic sustainability in spatial development and protection, life sciences and biotechnology, renewable energy and ICT, training of specialists, trainers and operators in thematic and cross-sector areas such as aerospace, aggregating the final beneficiaries (national and regional high-tech enterprises), dissemination of knowledge and encouragement of the creation of “knowledge-based” business activities.
It is important to highlight that the STeMA methodology offers a valuable contribution to the t analysis of the economic growth or decline in a projects as the EYE’. The application of STeMA has highlighted in practice that techniques and analytical methods cannot ever select and correlate data useful for achieving economic goals.
Anyway, this methodology works by integrating different typologies of problems, coming from different matters that concur with the interpretation of the territory’s several components and related information (data). In order to be geographically significant, indicators were selected to give information regarding the quali–quantitative content, and their own value and use. At the same time, STeMA selected statistical data able to explain the relations existing among domains, coherently with both a systemic vision of the territory (environment + economy + society + culture) and the assessment of the project scope: promoting analysis of development trends in relation to the territorial economy under COVID impact.
This is particularly evident when considering the interrelationships between different scales of the pandemic impact. This is made possible by the close subsidiarity relation between TIA and Strategic Environmental Assessment (SEA) that is created within the STeMA process. As in the preceding analysis, this one includes both an ex ante and an ex post assessment applied to a sub-metropolitan area. This is in addition to the previous elaboration concerning the metropolitan area of Rome (NUTS 3 and 4).
Regarding the EO of the GDP—Gross Domestic Product per capita in Purchasing Power Standards, it can be evaluated only indirectly, because the rationale for this indicator is to estimate the overall standard of living, and social and environmental welfare. STeMa application made this possible, but, at the same time, spatial implications of this indicator were also considered, mainly in connection with overall territorial cohesion and indirectly with the COVID impact at the NUTS 2 level for the case studies. In general, metropolitan and other large city areas in the West dominate the upper reaches of production per inhabitant.
The current phase of the research project is still underway. The study will conclude in 2024–2025; however, it is possible to speculate that the greatest negative effect of the global pandemic on gross domestic product was due to the reduction in traditional economic activities, including transport, mobility and industry, even at this early stage of the research project. Conversely, the positive effect has been on air quality, which consequently improved as a mitigating result of a reduction in climate change pollutants from services, transport and industry.
It is of the utmost importance to conduct this comprehensive examination of the decisions made by the Latium Region, which has revealed a significant discrepancy in the geographical distribution of impacts and the allocation of aid budgets across provinces. The implementation of a substantial capital injection in Rome has resulted in a considerable distortion of domestic competition.
5. Conclusions
This paper investigated the socio-economic consequences of the pandemic on sustainable growth. In all cases, the impact on GDP is presumed, even if the consequences manifest as disruptive impacts on people’s lives and on the functioning of cities, metropolitan areas and regions. The implementation of containment measures precipitated a precipitous alteration in the manner in which individuals engage in various activities, including work, study, shopping, socialising and travelling, productivity, urban–rural relations, cultural heritage and identity, new forms of exclusion and deprivation, natural assets management, and so on.
Because of the implementation of isolation measures, there has been a reduction in economic flows, employment, learning and income opportunities.
The analysis evaluated the immediate and temporary impact of the crisis on the labour market, which resulted in a sudden and significant decline in employment in 2020 and effects that persisted until 2023. The disparities observed at the territorial level in the Latium Region can be attributed to differences in the structure of the economy and occupational structure, as well as to differences in the support policies implemented by regional governance.
In light of the aforementioned, the following can be concluded:
- In order to address this issue, it is necessary to polarise the indicators by territorialisation and georeferenced data, using a bottom-up approach.
- Some territorial indexes, such as the European Territorial Cohesion Index (ETCI), which measures disparities between regions in the EU, have the potential to serve as a valuable tool for calculating the Added Value. However, the influence of the previous season and subsequent modifications have precluded the observation of crucial dimensions and the presentation of evidence, including demographic data, educational outcomes, employment rates (Graphic 3), health indicators and life expectancy.
- It would appear that territorial indicators for measuring cohesion are highly useful in this context and also to measure the COVID-19 impact. However, they are also complex and require a systemic approach and a method for impact assessment to identify territorial correlation with the EO.
- Time series are fundamental to measuring the territorial status of the economy and progress in this transition phase, for example towards achieving a neutral low-carbon economy by 2030. Nevertheless, it is essential to consider a more comprehensive set of indicators in the calibration with the EO.
While the European Commission has set a target of reducing the number of indicators in the evaluation process, it would be beneficial to include a greater number of indicators in order to gain a more comprehensive understanding of the territorialised economic characteristics. Furthermore, the deployment of innovative methodologies and insights from Territorial Impact Assessment (TIA) requires this approach in order to identify the mechanisms through which pandemic resilience was disseminated at the territorial level.
It is evident that a multiscale approach, as outlined above, is required in addition to the definition of a linkage algorithm based on territorial indicators in order to maintain comparable information regarding territorial diversity.
The creation of operational instruments, such as those designed to assess the territorial impacts of policies, could be utilised to inform the implementation and orientation of new policies. Nevertheless, it is not necessarily the case that these developments are closely related to EO.
6. Patents
STeMA model for drawing up sustainable policies and plans at the NUTS 1-2-3-4-5 level by a dedicated TIA and SEA procedures is an Italian patent STeMA by Maria Prezioso © (all copy reserved SIAE Rome) n°0602007/2006. STeMA Model 3.2 version was developed in 2021–2024 for the project needs.
Funding
This research received no external funding, but it was developed within the H2020-RISE project Economy bY spacE (EYE). Impact of the COVID-19 outbreak on economies (IT-Lead, ES, PL, CY, GR, US).
Institutional Review Board Statement
Not applicable.
Informed Consent Statement
All subjects involved in the study are informed.
Data Availability Statement
https://cordis.europa.eu/project/id/101007638/reporting/it devoted to the H2020-RISE project Economy by spacE (EYE). Impact of the COVID-19 outbreak on economies [last access: 12 September 2024].
Acknowledgments
The Author would like to extend its gratitude to the EYE project partners and the academic colleagues who were involved in the research: Simone Borra, Isabella Carbonaro, Angela D’Orazio, and Maurizio Lancia at the University of Rome Tor Vergata, as well as Michele Pigliucci at the Link-Campus University of Rome.
Conflicts of Interest
The author declares no conflicts of interest.
References
- OECD. Paid Sick Leave to Protect Income, Health and Jobs through the COVID-19 Crisis, OECD Policy Responses to Coronavirus (COVID-19); OECD Publishing: Paris, France, 2020. [Google Scholar]
- European Commission. The Just Transition Mechanism. 2019. Available online: https://commission.europa.eu/strategy-and-policy/priorities-2019-2024/european-green-deal/finance-and-green-deal/just-transition-mechanism_en (accessed on 23 June 2024).
- European Commission. The European Green Deal. Communication of Commission; COM (2019) 640 Final; EC: Brussels, Belgium, 2019. [Google Scholar]
- European Parliament. Regulation 2020/852 on the establishment of a framework to facilitate sustainable investment (DNSH). Official Journal of EU. L 198/13, 2020.
- European Commission. ‘Fit for 55’: Delivering the EU’s 2030 Climate Target on the Way to Climate Neutrality; COM/2021/550 Final; EC: Brussels, Belgium, 2021. [Google Scholar]
- European Commission. Sustainable Finance Taxonomy-Regulation (EU) 2020/852; EC: Brussels, Belgium, 2020; Available online: https://eur-lex.europa.eu/eli/reg/2020/852/oj (accessed on 26 September 2024).
- European Commission. Guidance Document on Monitoring and Evaluation. Concepts and Recommendations; EC: Brussels, Belgium, 2014; Available online: https://op.europa.eu/en/publication-detail/-/publication/0466859a-d08a-11e5-a4b5-01aa75ed71a1/language-en (accessed on 23 June 2024).
- European Commission. The RHOMOLO Impact Assessment of the 2014–2020 Cohesion Policy in the EU Regions. 2022. Available online: https://ec.europa.eu/regional_policy/en/information/publications/working-papers/2022/the-rhomolo-impact-assessment-of-the-2014-2020-cohesion-policy-in-the-eu-regions (accessed on 29 September 2024).
- Stiglitz, J.E.; Fitoussi, J.-P.; Sen, A. Report by the Commission on the Measurement of Economic Performance and Social Progress. 2013. Available online: https://ec.europa.eu/eurostat/documents/8131721/8131772/Stiglitz-Sen-Fitoussi-Commission-report.pdf (accessed on 23 June 2024).
- European Commission. Cohesion in Europe towards 2050. Eight Report on Economic, Social, and Territorial Cohesion; Publications Office of the European Union: Luxembourg; Brussels, Belgium, 2022. [Google Scholar]
- European Commission, Directorate-General for Regional and Urban Policy. Nineth Report on Economic, Social, and Territorial Cohesion; Publications Office of the European Union: Luxembourg; Brussels, Belgium, 2024. [Google Scholar]
- Informal Meeting of Ministers Responsible for Spatial Planning and Territorial Development and/or Territorial Cohesion. Territorial Agenda 2030. A Future for All Places; EU: Berlin, Germany; Brussels, Belgium, 2020. [Google Scholar]
- Federal Institute for Research on Building, Urban Affairs and Spatial Development, ESPON. Atlas for Territorial Agenda 2030. Maps on European Territorial Development; Gmbh&Co.: Frankfurt, Germany, 2020. [Google Scholar]
- EUROSTAT. Sustainable Development in the European Union. Overview of Progress towards the SDGs in an EU Context; EU: Luxembourg, 2022. [Google Scholar]
- ESPON2020. Collecting Experiences and Evidence on Local and Regional Responses to COVID19; ESPON: Luxembourg, 2020; Available online: https://www.espon.eu/covid19 (accessed on 24 June 2024).
- ESPON2020. A Brief Radiography of the Social and Territorial Consequences of Two Years in the COVID-19 Pandemic; Thematic Paper; ESPON: Luxembourg, 2022. [Google Scholar]
- ESPON2020. Indicators for Integrated Territorial and Urban Development; ESPON: Luxembourg, 2018. [Google Scholar]
- ESPON2020. ESPON Database. Available online: https://database.espon.eu/ (accessed on 24 June 2024).
- EUROSTAT. Dataset EUROSTAT COVID19. Available online: https://data.europa.eu/en/publications/datastories/covid-19 (accessed on 24 June 2024).
- Casti, E.; Riggio, A. (Eds.) Atlante COVID-19. Geografie del Contagio in Italia; AGeI: Rome, Italy, 2022. [Google Scholar]
- European Commission. European Data Strategy; EC: Brussels, Belgium; Available online: https://commission.europa.eu/strategy-and-policy/priorities-2019-2024/europe-fit-digital-age/european-data-strategy_en (accessed on 24 June 2024).
- European Commission. The European Green Deal Investment Plan and Just Transition Mechanism Explained; EC: Brussels, Belgium, 2020; Available online: https://ec.europa.eu/commission/presscorner/detail/en/qanda_20_24 (accessed on 24 June 2024).
- Stiglitz, E.J. The proper role of government in the market economy: The case of the post-COVID recovery. J. Gov. Econ. 2021, 1, 100004. [Google Scholar] [CrossRef]
- Prezioso, M. STeMA: A Sustainable Territorial economic/environmental Management Approach. In Territorial Impact Assessment; Medeiros, E., Ed.; Springer: Cham, Switzerland, 2020; pp. 62–85. [Google Scholar]
- ISTAT. 2021 Population and Households Census; Istat: Rome, Italy, 2023. [Google Scholar]
- Carbonaro, I. A system of measure for provincial performance through indicators and composite indexes. In Competitiveness in Sustainability: The Territorial Dimension in the Implementation of Lisbon/Gothenburg Processes in Italian Regions and Provinces; Prezioso, M., Ed.; Pàtron editore: Bologna, Italy, 2011; pp. 53–61. [Google Scholar]
- Carbonaro, I. Statistics vision from the STeMA application: A joint trial. In Territorial Impact Assessment of Italian Regions Territorial Cohesion. Place Evidence Based Model for Policy Assessing towards Green Economy in Inner and Metropolitan Peripheries; Prezioso, M., Ed.; Pàtron Editore: Bologna, Italy, 2020; pp. 53–62. [Google Scholar]
- ISO-19115; Geographic Information—Metadata. International Organization for Standardization: Geneva, Switzerland, 2014.
- H2020-RISE. 2024. Economy bY spacE (EYE) Project. Impact of COVID-19 Outbreak on Economies. Reports. 2022–2024. Available online: https://cordis.europa.eu/project/id/101007638/reporting (accessed on 12 September 2024).
- ESPON. Territorial Dimension of the Lisbon-Gothenburg Process. ESPON 3.3 Project. Aracne: Rome, Italy, ESPON: Luxembourg. 2006. Available online: https://archive.espon.eu/programme/projects/espon-2006/coordinating-cross-thematic-projects/territorial-dimension (accessed on 26 September 2024).
- Pigliucci, M. Territorial cohesion in Latium Region. A STeMA measurement of Regional Operational Programme ERDF 2014–2020. In Territorial Impact Assessment of the National and Regional Territorial Cohesion in Italy. Place Evidence and Policy Orientations towards Green Economy; Prezioso, M., Ed.; Pátron: Bologna, Italy, 2020; pp. 403–426. [Google Scholar]
- Banca d’Italia. L’economia del Lazio; Banca d’Italia: Rome, Italy, 2023. [Google Scholar]


Disclaimer/Publisher’s Note: The statements, opinions and data contained in all publications are solely those of the individual author(s) and contributor(s) and not of MDPI and/or the editor(s). MDPI and/or the editor(s) disclaim responsibility for any injury to people or property resulting from any ideas, methods, instructions or products referred to in the content. |
© 2024 by the author. Licensee MDPI, Basel, Switzerland. This article is an open access article distributed under the terms and conditions of the Creative Commons Attribution (CC BY) license (https://creativecommons.org/licenses/by/4.0/).