Article

Urban Flooding Disaster Risk Assessment Utilizing the MaxEnt Model and Game Theory: A Case Study of Changchun, China

by
Fanfan Huang
1,
Dan Zhu
1,*,
Yichen Zhang
1,
Jiquan Zhang
2,
Ning Wang
3 and
Zhennan Dong
1
1
College of Jilin Emergency Management, Changchun Institute of Technology, Changchun 130012, China
2
Institute of Natural Disaster Research, School of Environment, Northeast Normal University, Changchun 130024, China
3
Jilin Meteorological Observatory, Changchun 130062, China
*
Author to whom correspondence should be addressed.
Sustainability 2024, 16(19), 8696; https://doi.org/10.3390/su16198696
Submission received: 23 August 2024 / Revised: 25 September 2024 / Accepted: 26 September 2024 / Published: 9 October 2024

Abstract

:
This research employs the maximum entropy (MaxEnt) model alongside game theory, integrated with an extensive framework of natural disaster risk management theory, to conduct a thorough analysis of the indicator factors related to urban flooding. This study conducts an assessment of the risks associated with urban flooding disasters using Changchun city as a case study. The validation outcomes pertaining to urban flooding hotspots reveal that 88.66% of the identified flooding sites are situated within areas classified as high-risk and very high-risk. This finding is considered to be more reliable and justifiable when contrasted with the 77.73% assessment results derived from the MaxEnt model. Utilizing the methodology of exploratory spatial data analysis (ESDA), this study applies both global and local spatial autocorrelation to investigate the disparities in the spatial patterns of flood risk within Changchun. This study concludes that urban flooding occurs primarily in the city center of Changchun and shows a significant agglomeration effect. The region is economically developed, with a high concentration of buildings and a high percentage of impervious surfaces. The Receiver Operating Characteristic (ROC) curve demonstrates that the MaxEnt model achieves an accuracy of 90.3%. On this basis, the contribution of each indicator is analyzed and ranked using the MaxEnt model. The primary determinants affecting urban flooding in Changchun are identified as impervious surfaces, population density, drainage density, maximum daily precipitation, and the Normalized Difference Vegetation Index (NDVI), with respective contributions of 20.6%, 18.1%, 13.1%, 9.6%, and 8.5%. This research offers a scientific basis for solving the urban flooding problem in Changchun city, as well as a theoretical reference for early warnings for urban disaster, and is conducive to the realization of sustainable urban development.

1. Introduction

Urban flooding occurs when heavy or continuous precipitation overwhelms a city’s drainage system, leading to accumulated water. This has become a major natural disaster in China [1,2]. With the accelerating process of urbanization, the increasingly severe consequences of urban flooding for the sustainable development of cities are a cause for concern [3,4].
A significant body of both domestic and international research has been undertaken to examine the risks associated with urban flooding. The index system approach, the approach of a coupled analysis of remote sensing images and GIS technology, applying mathematical and statistical methods to historical disasters, the modeling and simulation of hydrology and hydraulics, etc., are some examples of the research methods [5]. Benito, G et al. (2004) conducted an analysis of historical flood disasters using a dataset that encompassed a millennium of data. Their study employed mathematical and statistical techniques to examine past catastrophic events. Furthermore, it integrated multidisciplinary approaches from geology, history, hydrology, and statistics to develop a methodology for assessing the risk of urban flooding [6]. Shuyan Yin and colleagues (2010) performed a statistical examination of flood occurrences in the upper reaches of the Han river in southern Shaanxi over a span of 2200 years, specifically from 189 BC to AD 2008. Their analysis involved a systematic evaluation of the flood frequency at 50-year intervals, which facilitated their assessment of the flood risk in the region [7]. Luino F et al. (2023) explored the role of historical records in identifying past geological, geomorphological, and climatic hazards in order to reduce future risks and suggested the potential of related scientific fields [8]. Zhu D et al., analyzing the total precipitation from May to September from 1961 to 2019, studied the relationship between the inter-decadal spatial and temporal variations in heavy rainfall and sea surface temperature under the Northeast China Cold Vortex (NECV), which revealed an important mechanism of the NECV’s influence on the East Asian monsoon system [9]. This method, based on mathematical statistics on historical disasters, is simple to calculate, but the completeness and accuracy of historical flooding statistics are limited. On the basis of a GIS–remote sensing image coupled analysis method, Xinyu Jiang et al. (2009) employed remote sensing data and socio-economic data to analyze the heavy rainfall flood risk in the main stream of Songhua river and the exposure and vulnerability of the risk-bearer, as well as the regional capacity to prevent and mitigate disasters, and, at the same time, used the GIS to produce zoning maps for their flood disaster risk assessment [10]. Bhatt G.D. et al. (2014) used remote sensing data from 1974 to 2013 in Chamoli district of Uttarakhand, India, for flood risk assessment and combined it with a GIS to classify the risk level [11]. GIS can overlay socio-economic data with spatial natural attribute data to provide important support for flood risk evaluation. With the progress of technology, the use of hydrological and hydraulic modeling and simulation methods based on hydrological and hydraulic modeling is also more and more common in this field. Guoru Huang et al. (2019), taking into account the rainfall, runoff, topography, and drainage system characteristics of Donghaochong basin in Guangzhou city, constructed a simulation model of urban flooding based on InfoWorks ICM and an ArcGIS database of indicators for flood risk assessment and carried out a risk evaluation of flooding based on scenario simulations [12]. Lidong Zhao et al. (2023) used an SWMM for hydrological simulations to construct a conceptual model and complete the simulations based on hydrodynamic principles [13]. This model adopted a systematic way of thinking, making the analysis and the improvement process clearer and more organized and easy to verify and confirm. Xian Zhuxiang et al. constructed a model for assessing the disaster risk under major heavy rainfall processes in Jilin Province on the basis of four risk factors (hazard factor, disaster conception environment, disaster receptor, and capacity to prevent and mitigate disasters) by utilizing precipitation data, disaster data, and remote sensing image data, as well as data on the GDP and population in Jilin Province from 1951 to 2013 [14]. The weights of each potential factor that caused waterlogging were determined by constructing an index system and using a multi-criteria evaluation method, and studying urban flood risk was conducted based on ArcGIS [15], which is an approach that relies more on subjective evaluations.
As computer technology advances, more and more researchers are turning to machine learning techniques, including Random Forest [16], Artificial Neural Networks, Support Vector Machines, and Decision Trees, to assess and predict disasters [17]. Fifi Zhang et al. [18] coupled a pipe flow model with a surface diffuse flow model to establish a hydrodynamic model for flood hazard simulation. Jinping Zhang et al. [19] developed a flood prediction model that combined a BP neural network and an SWMM to assess the regional flood risk in various cities. Their model revealed that the piped drainage system’s performance was insufficient to handle heavy rainfall with high return periods. Jiao Li et al. [20] devised a Bayesian network-based bowtie model for disaster risk analysis to evaluate flood risk disaster and proposed prevention and control strategies for accidents. Jian Chen et al. developed a neural network architecture that integrated CNN and LSTM components [21]. This model was trained to facilitate rapid and precise predictions of the depth of internal flooding. Previous studies have usually randomly selected negative samples in areas that have not experienced disasters. The environmental characteristics of cities are constantly and dynamically changing, especially with the changing climate, and the seriousness of city flooding leads to the emergence of new flooding points, so it is impossible to judge whether flooding will occur in the future at negative samples, and it is difficult to guarantee the absolute precision of a negative sample.
The MaxEnt model is primarily employed to forecast species distributions. By integrating species distribution data with regional environmental variables, it becomes feasible to analyze the key determinants affecting species distribution and to model the prospective distribution patterns [22]. There has been a notable rise in the utilization of the MaxEnt model to evaluate disaster risk, especially concerning events such as forest fires, landslides, and a range of other natural hazards [23]. Jinyao Lin et al. used the MaxEnt and FLUS models to predict future flood-prone areas, confirming that most impervious surfaces will be exposed to significant flooding risks [24]. In this paper, we will take Changchun as an example to investigate the correlation between various spatial drivers and the risk of urban flooding by using the MaxEnt model and game theory and combining them with natural disaster risk management theory [25]. Validation analyses are conducted utilizing an urban flooding hotspot map of Changchun to improve the precision of flood risk assessments within the area. We analyze the urban flood distribution area to derive the rate of contribution of each spatial driver to urban flooding in Changchun and to construct a spatial risk distribution map of flooding in Changchun on the basis of analyzing the law of the influence of these spatial drivers on urban flooding.

2. Materials and Methods
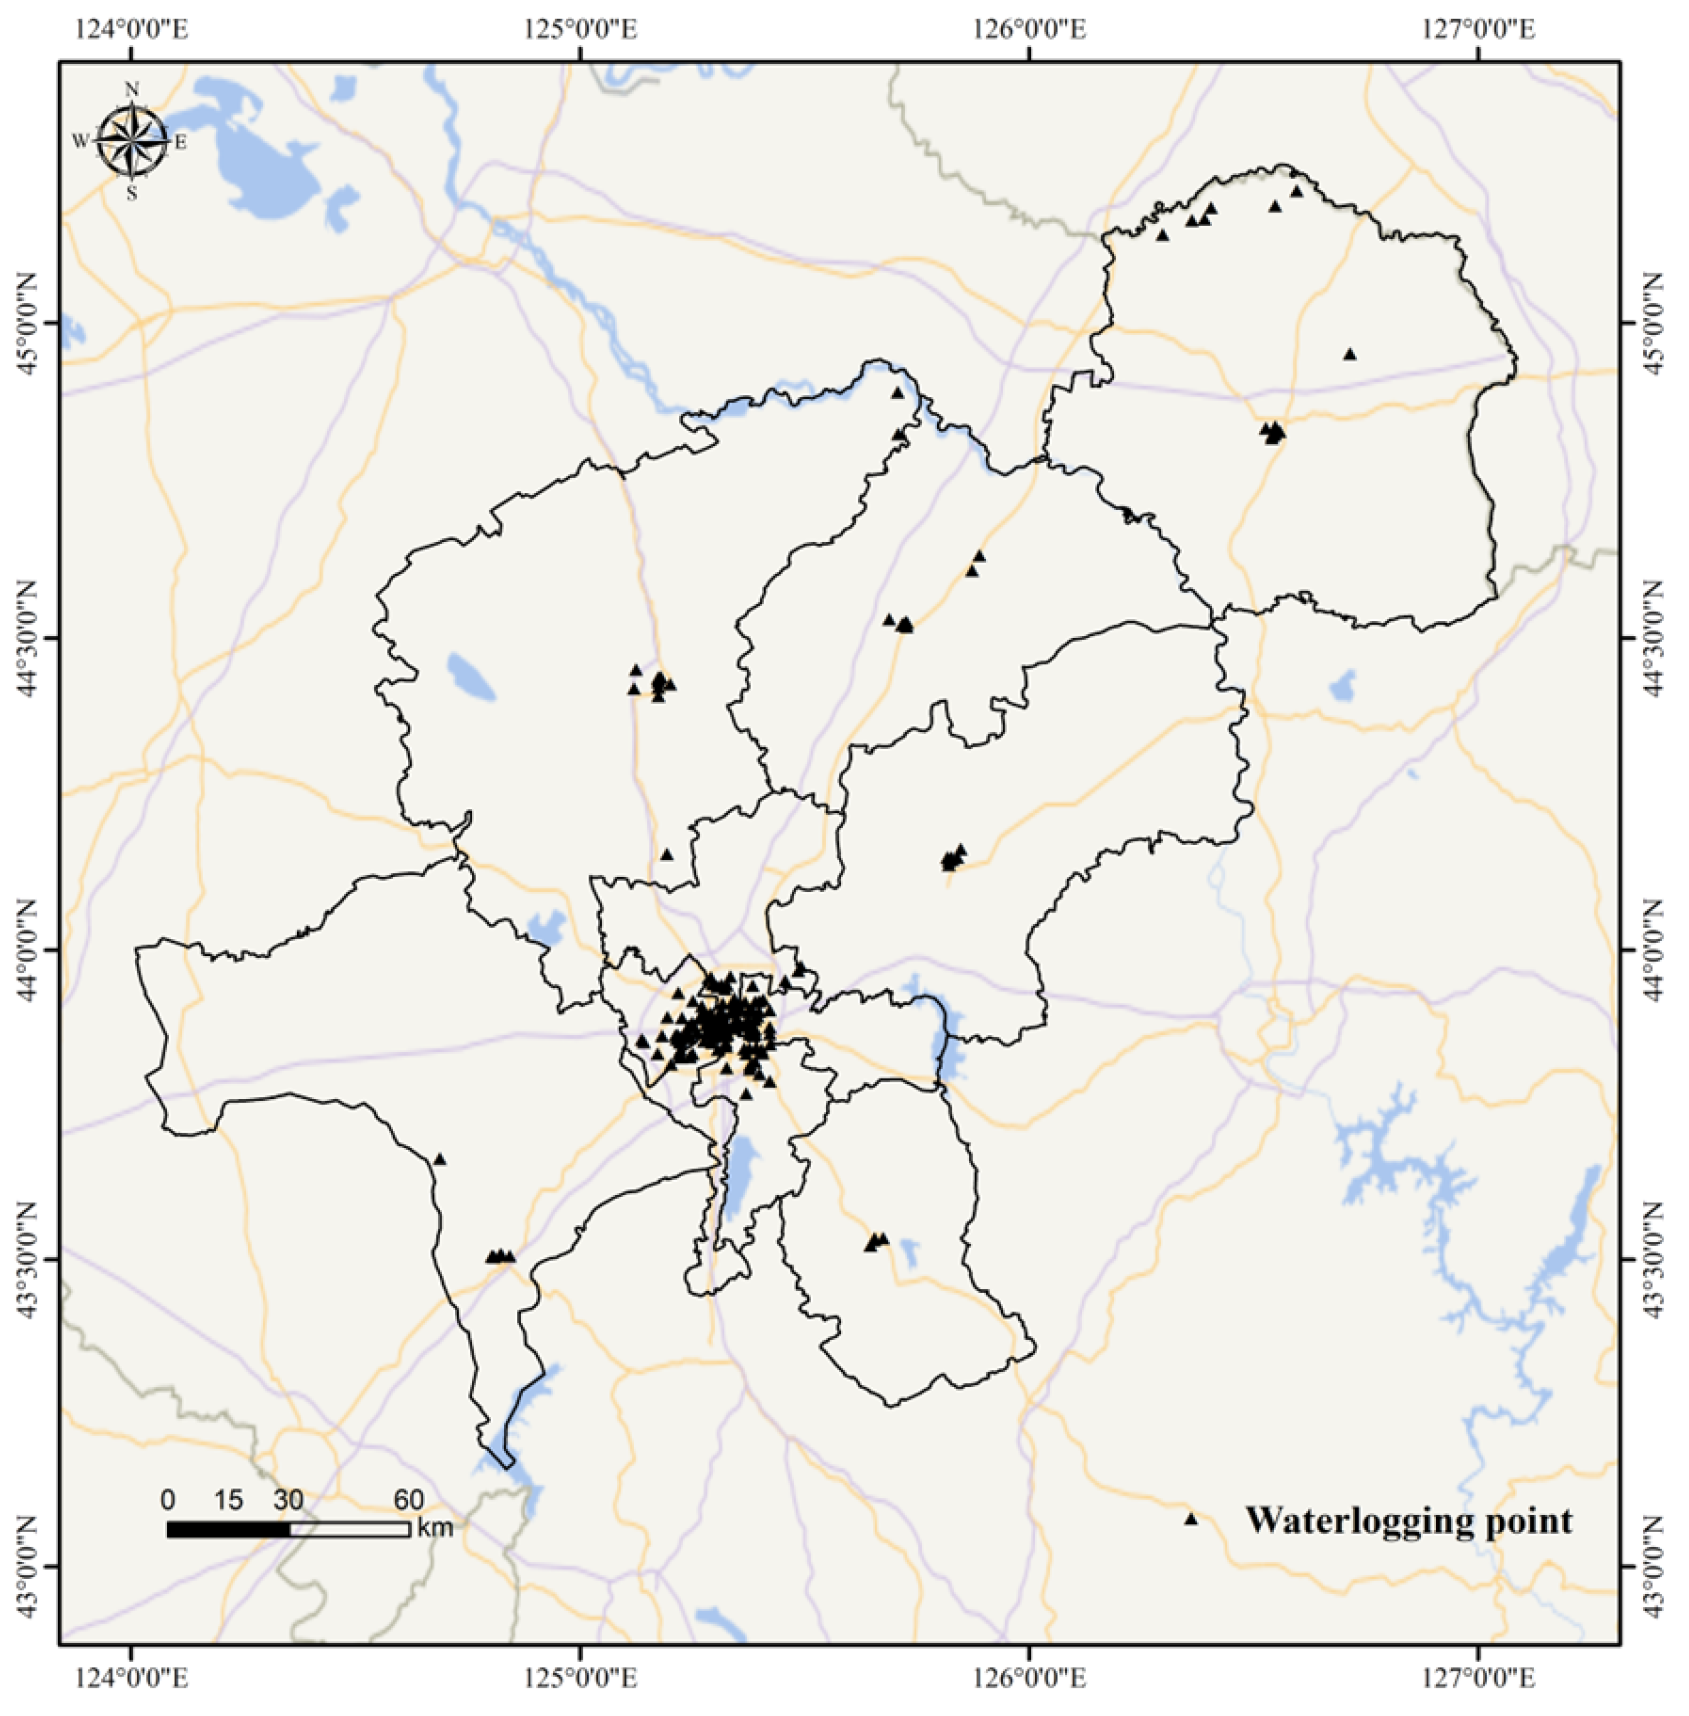
2.1. Study Area

Changchun is a central city in Northeast Asia, situated in the mid-latitude zone of the northern hemisphere and residing at the latitude 43°05′~45°15′ N and longitude 124°18′~127°05′ E, with a temperate, continental, semi-humid, monsoon climate. Precipitation is primarily noted between June and September, characterized by an irregular distribution that shows a gradual increase from the western to the eastern regions. The annual rainfall within this area varies between 600 mm and 800 mm. In recent years, Changchun has undergone rapid urbanization, leading to a rise in impermeable surfaces within the city. This phenomenon has heightened its susceptibility to urban flooding, consequently impacting its swift socio-economic progress [26]. On 1 August 2023, under the combined influence of the residual moisture of Typhoon Doksuri No. 5 moving northward and the shear line behind the sub-high zone, widespread heavy rainfall occurred in the northern part of the Jilin city area in Jilin Province. Nearly 40,000 people were affected, and nearly 4000 hectares of crops were affected in eight townships in the Lalin river basin in Yushu city, Changchun city. Hence, conducting research on the urban flooding risk in Changchun holds significant importance. The location of the study area is shown in Figure 1.

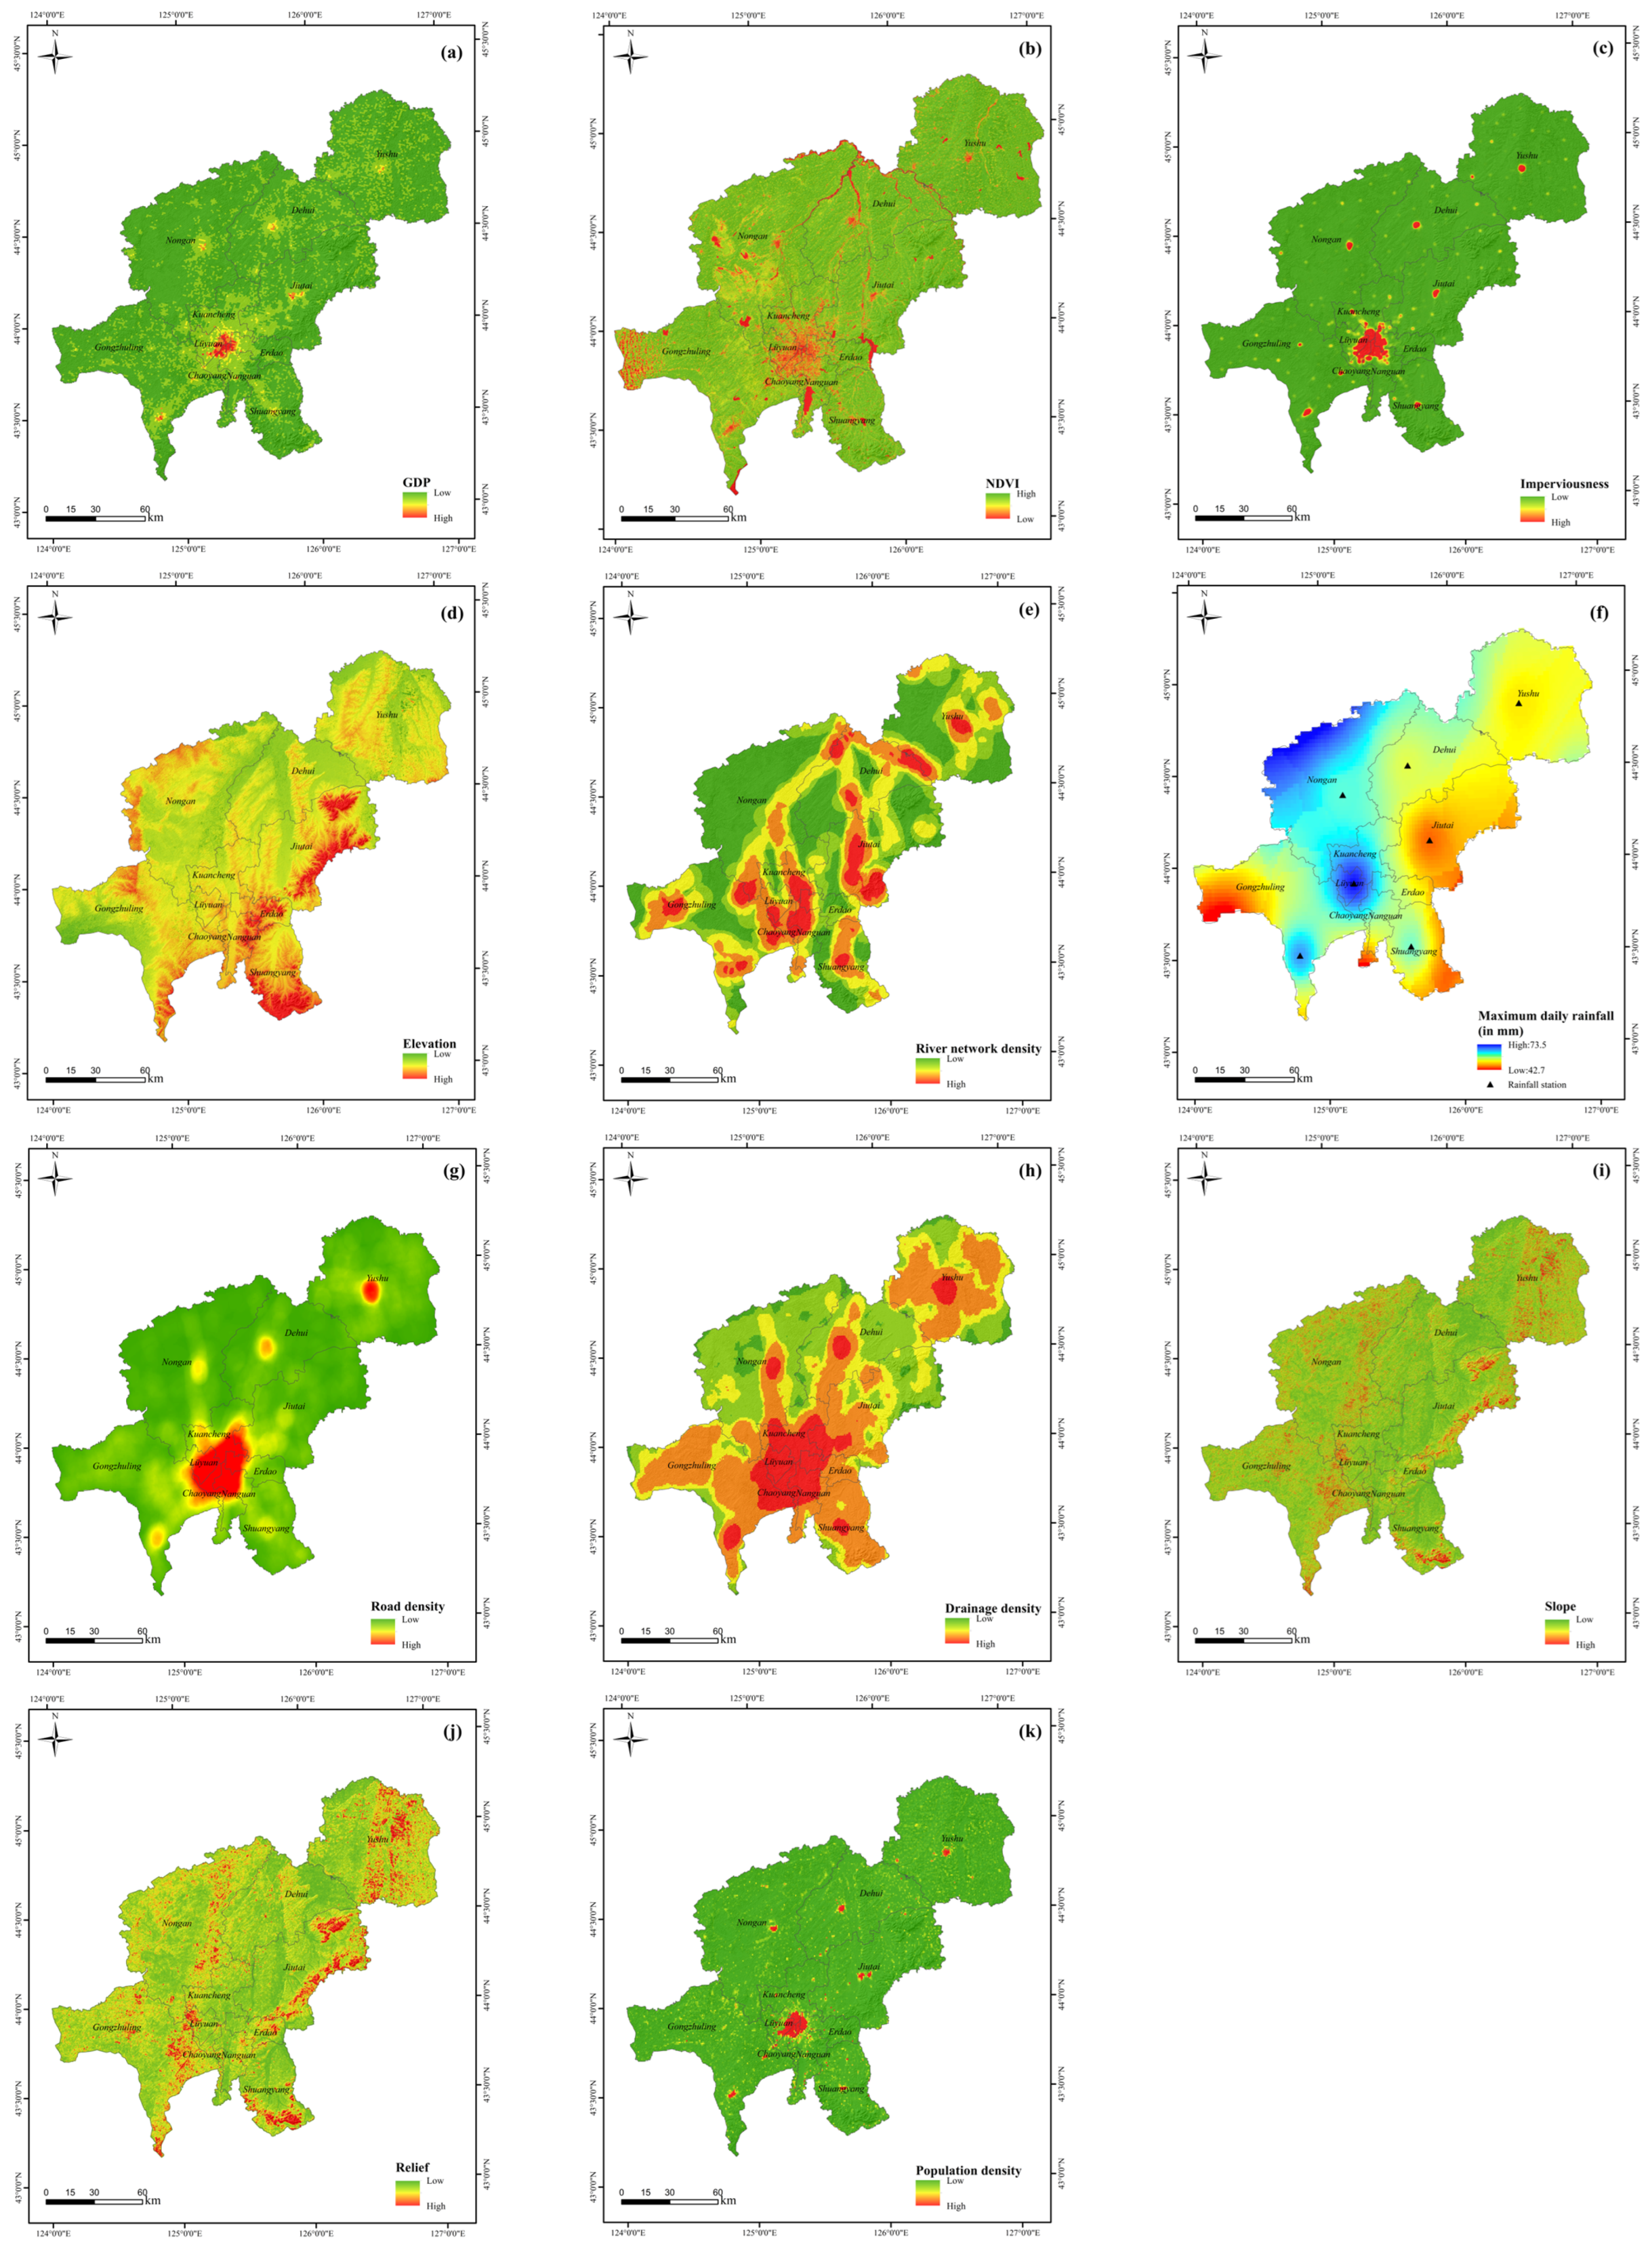
2.2. Index Selection and Data Collection

According to all of the flooding point data published by Changchun Municipal Government, 283 urban waterlogging hotspots in Changchun were obtained (Figure 2). Additionally, a DEM with a resolution of 30 m was acquired to derive topographic features, including elevation, slope, and relief, which are pertinent to the analysis of urban flooding. Our other influences included impervious surface data, precipitation data, Landsat 8 OLI_TIRS remote sensing imagery with a resolution of 30 m, population data, etc. (Table 1).

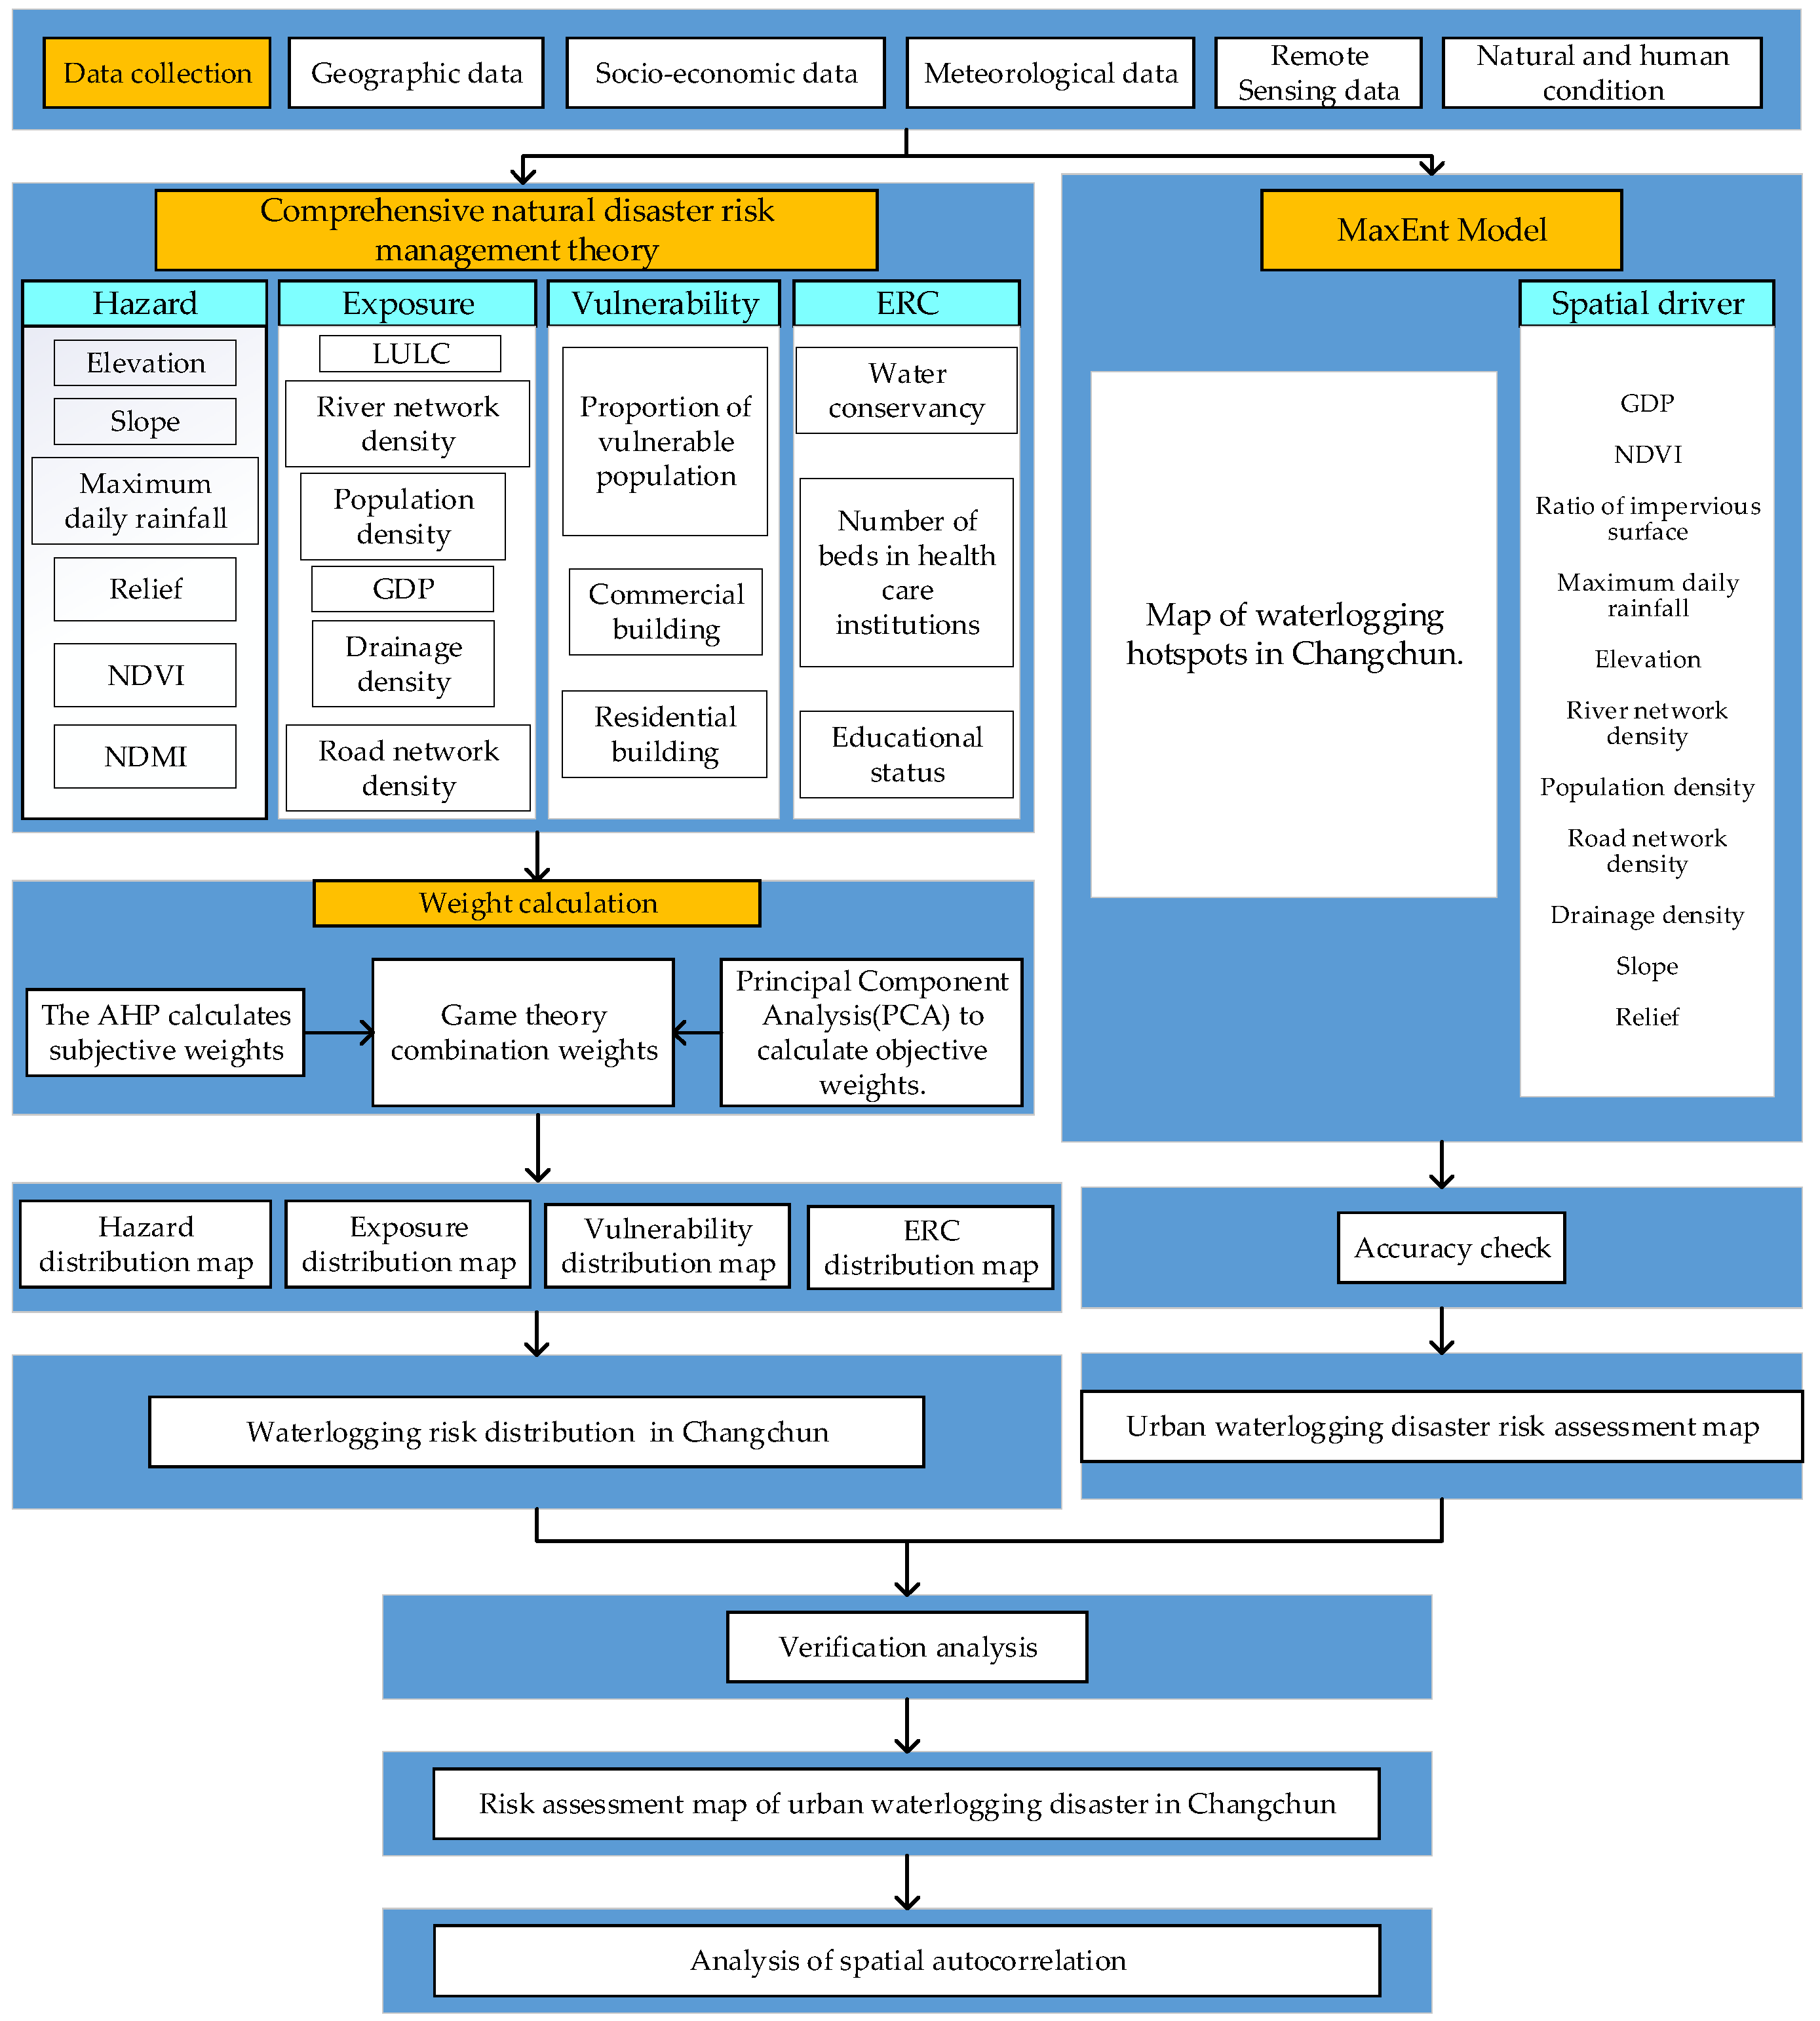
2.3. Research Methods

2.3.1. The MaxEnt Model

The principle of MaxEnt is that among all plausible probability models, the ideal model is the one that has the maximum entropy. Typically, the model characterized by the highest entropy is chosen from a collection of models that adhere to specified constraints. Assuming the probability distribution of a discrete random variable x is denoted as P ( x ) , its entropy can be expressed as
H P = x P x log P x
If we assume that the classification model operates akin to a conditional probability distribution denoted as P ( Y | X ) , where X denotes the input and Y signifies the output, essentially, this model signifies the output Y utilizing the conditional probability P ( Y | X ) based on a specific input X . This is all in the context of a training dataset:
T = x 1 , y 1 , x 2 , y 2 , , x n , y n
The fundamental tenet of MaxEnt is rooted in the concept that the entropy in a probability distribution should be optimized. This is represented by the following equation:
p y x = 1 Z x exp i = 1 n w i f i x , y
The objective of the MaxEnt model is to calculate the weight w i of the training data that maximize the log-likelihood function, i.e., the probability distribution p y x for a given input x .
m a x w x , y ϵ D logp y x C · R w
Given a training set, represented by D ; a regularization constant, denoted as C ; and a regularization term R w , aimed at preventing overfitting, we can observe the interplay between these elements.
The MaxEnt model principle forecasts the likelihood of urban flooding in high-risk areas, and creating the model necessitates the utilization of data from urban flood-prone regions, along with pertinent environmental indicators. This study utilized the MaxEnt software (3.4.4) to develop the maximum entropy model for assessing flooding risk.

2.3.2. The Analytic Hierarchy Process (AHP)

The AHP is a decision-making methodology that deconstructs the fundamental components of decision-making into distinct hierarchical levels, encompassing objectives, criteria, and alternatives. This framework facilitates both qualitative and quantitative assessments being conducted, enabling a thorough analysis of the potential choices. In the early 1970s, T.L. Saaty, an esteemed operations researcher hailing from America and holding the esteemed position of professor at the University of Pittsburgh, devised a thorough evaluation approach to system analysis and decision-making known as the Satie Method [27]. Figure 3 presents the technology roadmap for this study, summarizing the required data and methods.
The AHP serves the purpose of establishing the subjective significance of each indicator [28], with the specific computational procedures outlined as follows: (1) modeling the hierarchy; (2) establishing a judgment matrix (ranking the elements in the indicator layer, the scale 1~9 indicates increasing importance [29]); (3) a consistency test according to Formulas (5) and (6); and (4) deriving the weights and synthesizing the analyses.
C I = λ m a x n n 1
C R = C I R I
C I is nearly 0 and has an acceptable consistency; when C I = 0 , there is perfect consistency. This contradiction is more serious the larger the value of C I . When n is 3, 4, or 5, the R I values are 0.58, 0.90, and 1.24, respectively.

2.3.3. Principal Component Analysis (PCA)

PCA is a statistical method utilized to analyze complex datasets by reducing the number of variables, thereby generating a more concise set of composite variables [30].
The specific computational procedures are outlined as follows:
(1)
Determining the coefficients of the indicators in linear combinations of principal components. Suppose there is an existing set of data with n indicators and m objects to be evaluated. The first p principal components and their corresponding eigenvalues α and eigenvectors β can be obtained using principal component analysis. Then, the coefficients of the corresponding indicators in each principal component are
σ = β α
α is the eigenvalue associated with each principal component; and β is the element corresponding to each indicator in each principal component.
σ i = β i α i = β 1 i α i β 2 i α i β 3 i α i β n i α i Τ
(2)
The contribution to the variance of the eigenvalues of the first p principal components is φ , and the model coefficient of the composite score is γ ( γ corresponds to the composite coefficient of each indicator); then,
γ i = j = 1 n φ 1 σ i j k = 1 p φ k
The composite score model is obtained as
γ i = γ 1 X 1 + γ 2 X 2 + + γ n X n
(3)
We normalize the indicator weights:
w j = γ i i = 1 n γ i

2.3.4. Game Theory Portfolio Weighting

Assume that L methods are applied to assigning weights to the indicators, and derive L sets of indicator weights: W k = W k 1 ,   W k 1 ,   W k 1 ,   W k 1 ,   k = 1 ,   2 ,   ,   L . The amalgamation of the weight vectors is [31]
u = k = 1 L α k u k T
where α k represents a coefficient for linear combination, and u represents one of the potential weights in the weight set. The optimized response model is derived from the fundamental concept of portfolio empowerment in game theory:
m i n j = 1 L α i u j T u i T , i = 1 , 2 , , L
The first-order derivative condition is obtained from the matrix differentiation property as
j = 1 m α j u i u j T = u i u i T , i = 1 , 2 , , L
The set of combination coefficients ( α 1 ,   α 2 ,   ,   α L ) can be calculated from Formula (10) and normalized: α k * = α k k = 1 L α k . The combination weights are obtained as
W * = k = 1 L α k * u k T

2.3.5. Integrated Natural Disaster Risk Management Theory

The evaluation of flood disaster risk necessitates a thorough quantitative analysis that encompasses factors such as hazards, exposure, vulnerability, and emergency recovery capacity [25]. The magnitude of risk index reflects the severity of flood disaster danger. The computation method for the overall risk index for rainstorm flood disasters is detailed below:
I D F R = H ω h × E ω e × V ω v × 1 C ω c
H = i = 1 n ω h X h i
E = i = 1 n ω e X e i
V = i = 1 n ω v X v i
C = i = 1 n ω c X c i
I D F R is the urban waterlogging risk index. H , E , V , and C represent hazards, exposure, vulnerability, and emergency recovery capacity, respectively; n represents individual indicators; i is the i index, where, ω h ,     ω e ,     ω v ,     and   ω c are the composite indicator weights obtained by weighting through the AHP and principal component analysis (PCA). X h i ,     X e i ,     X v i ,     and   X c i represent the respective indices for hazards, exposure, vulnerability, and emergency recovery capacity.

2.3.6. Methods for Analyzing Spatial Autocorrelation

Exploratory spatial data analysis (ESDA) is an important area of spatial econometrics used to explain spatial associations, spatial dependencies, or spatially related phenomena associated with geospatial locations [32]. The global autocorrelation, local autocorrelation, and Moran’s scatterplot employed in ESDA are instrumental to depicting the spatial distribution of the data, identifying the outliers in the spatial data clearly and intuitively, detecting the spatial clustering effect, and revealing its spatial mechanisms. Within the field of disaster risk assessment, the application of exploratory spatial data analysis models is instrumental in examining the geospatial dimensions of risk. These models facilitate the investigation of both spatial and temporal correlation characteristics associated with disaster risk, in addition to the potential evolutionary patterns of such risks.
This study utilizes Moran’s I to analyze the spatial correlation of urban flood disaster risk in Changchun at both global and local levels. Global Moran’s I functions as an extensive measure for evaluating the spatial autocorrelation throughout the entire study region. The formula for calculation is as follows:
I = i = 1 n j = 1 n w i j x i x ¯ x j x ¯ S 2 i = 1 n j = 1 n w i j
In the formula, I is the global Moran’s I, the variable x i is the observed value in region i ; x ¯ = 1 n i = 1 n x i is the mean of the variable; S 2 = 1 n i = 1 n ( x i x ¯ ) is the variance in the variable; and w i j is the spatial weight matrix, which is w i j = 1 when regions i and j are adjacent to each other and w i j = 0 in all other cases. Moran’s I is constrained within the interval of [−1, 1]. A Moran’s I value exceeding 0 signifies the presence of a positive spatial correlation within the study area, with values approaching 1 indicating a stronger degree of positive spatial autocorrelation.
It is important to note that positive spatial correlations may coexist with negative spatial correlations within the broader study area. This necessitates the application of LISA to uncover potential spatial variability [33]. Within the significance level test for Moran’s I value, we can test according to the value of the standardized variable z . The formula for calculation is as follows:
z = I E I V A R I
where E I and V A R I are the expectation for and variance in I , respectively. The z score represents a multiple of the standard deviation, showing a clustered distribution for z > 1.65, a discrete distribution for z < −1.65, and a random distribution (without spatial autocorrelation) for z values between −1.65 and 1.65.

3. Results

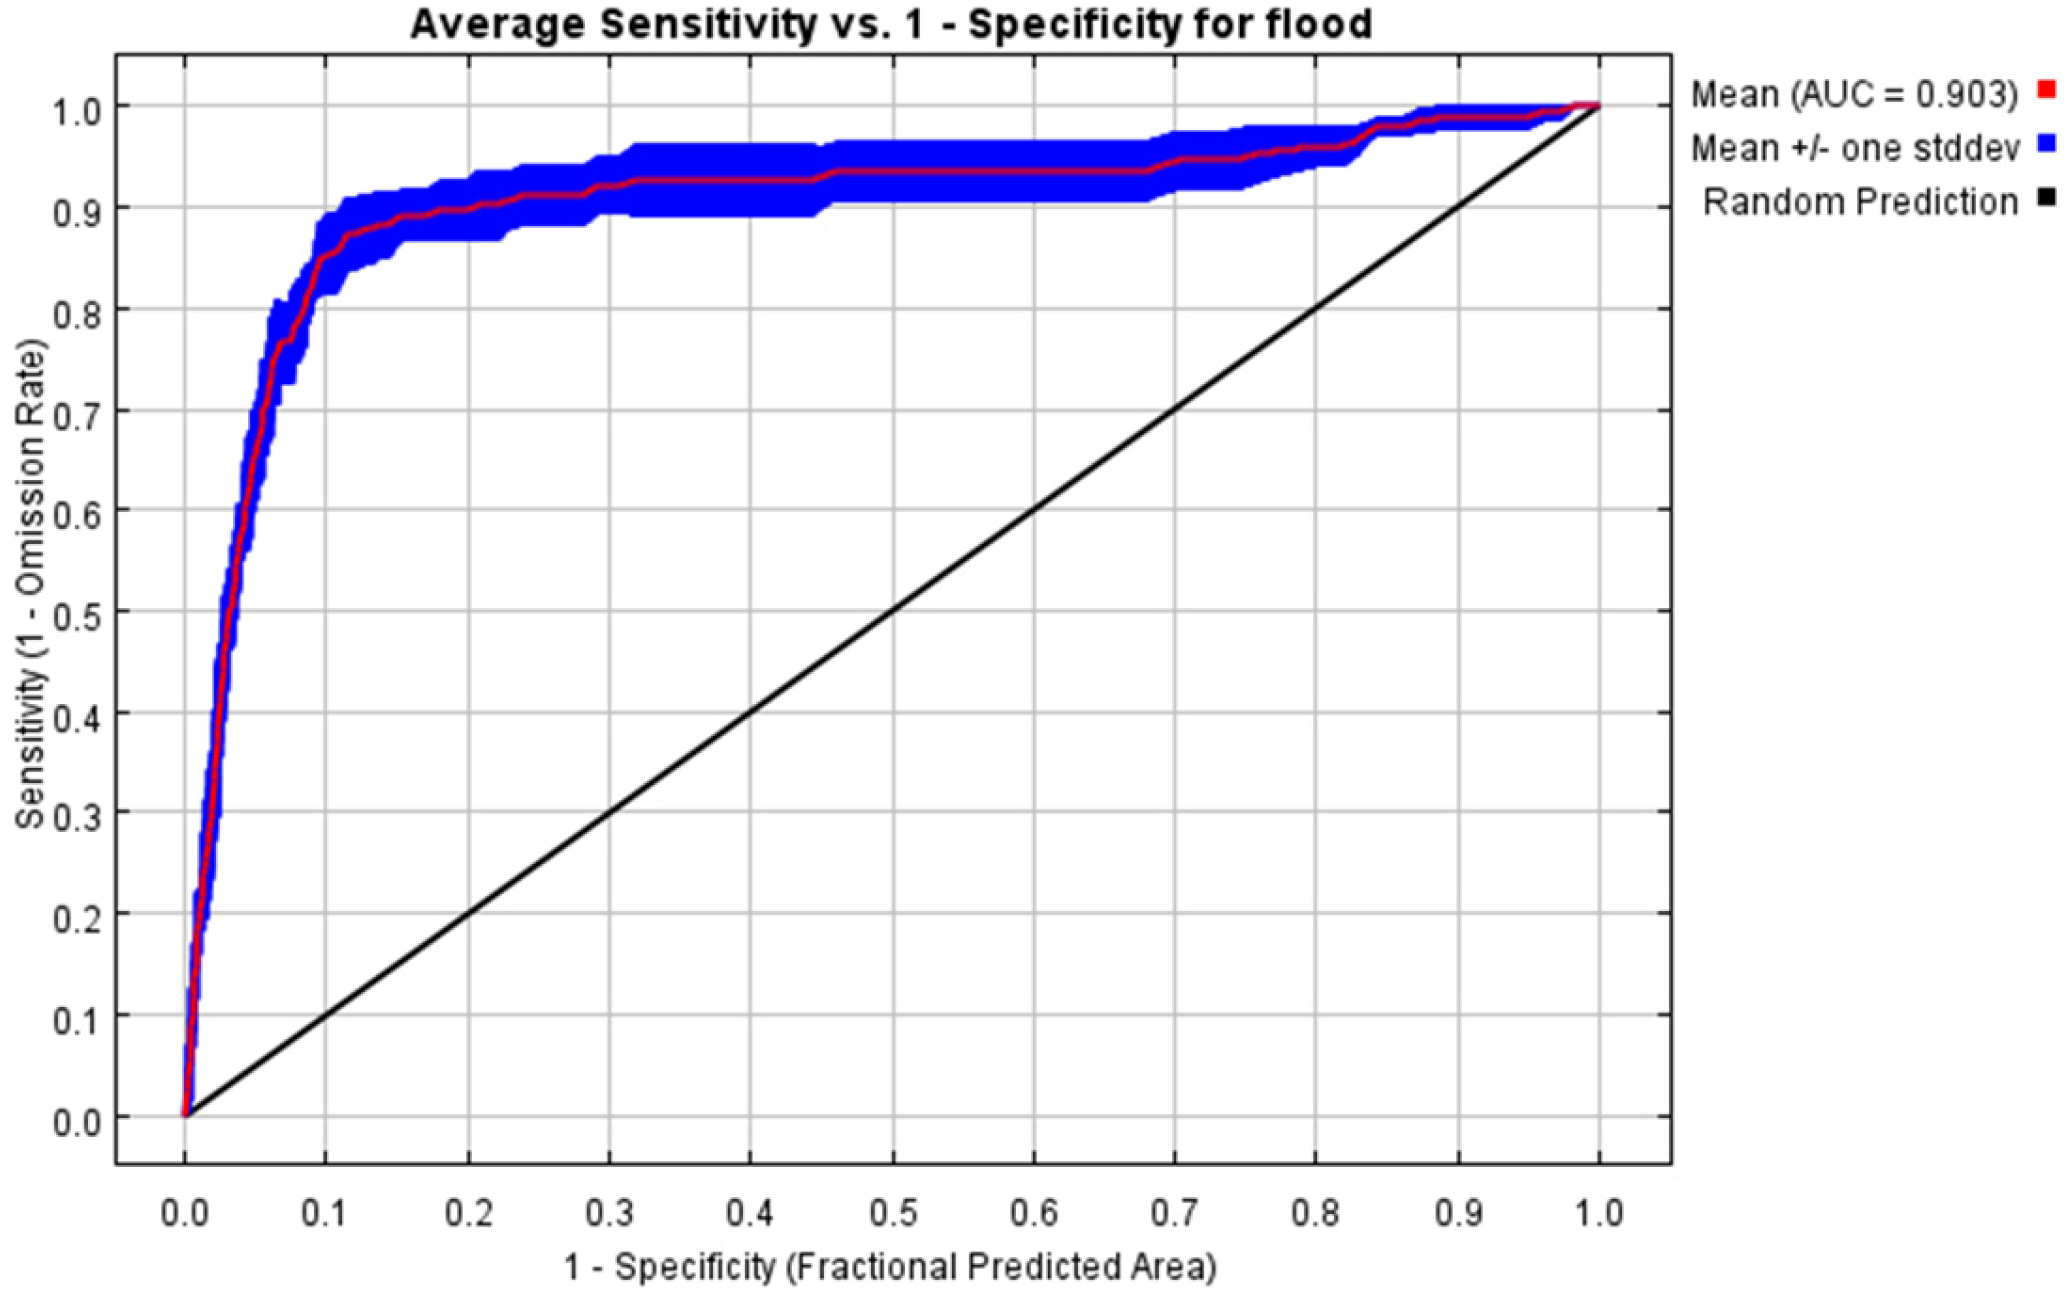
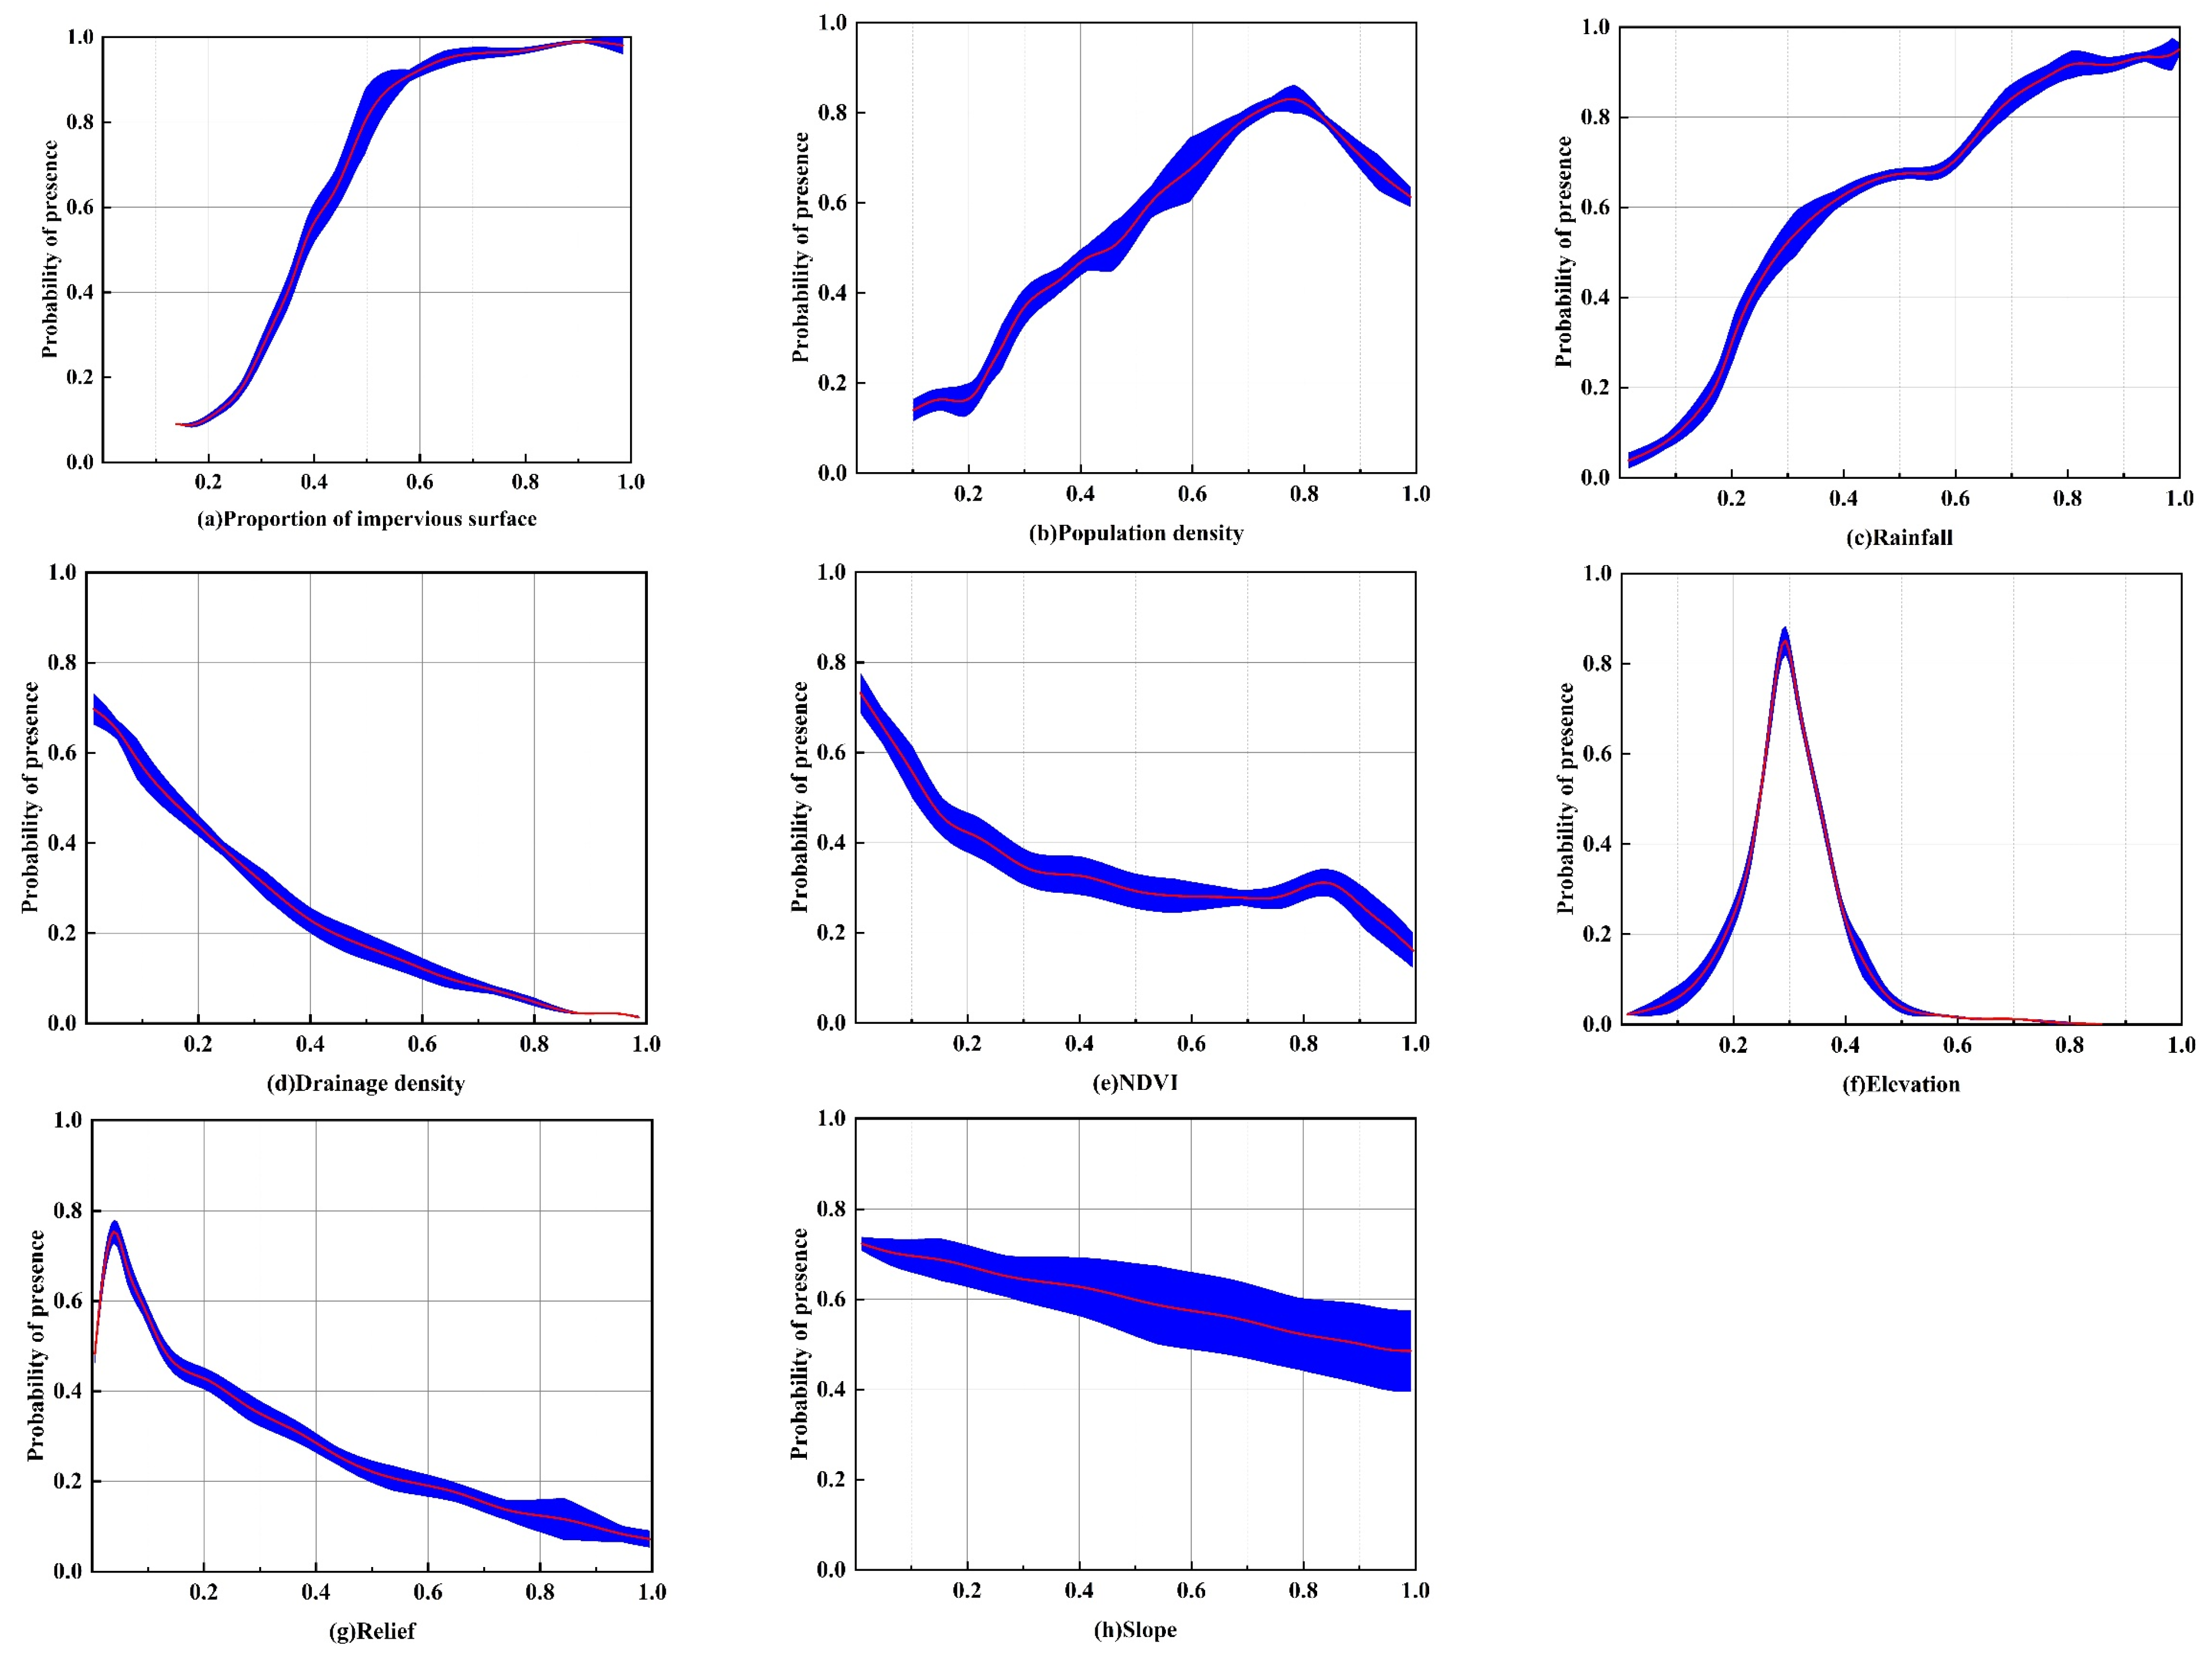
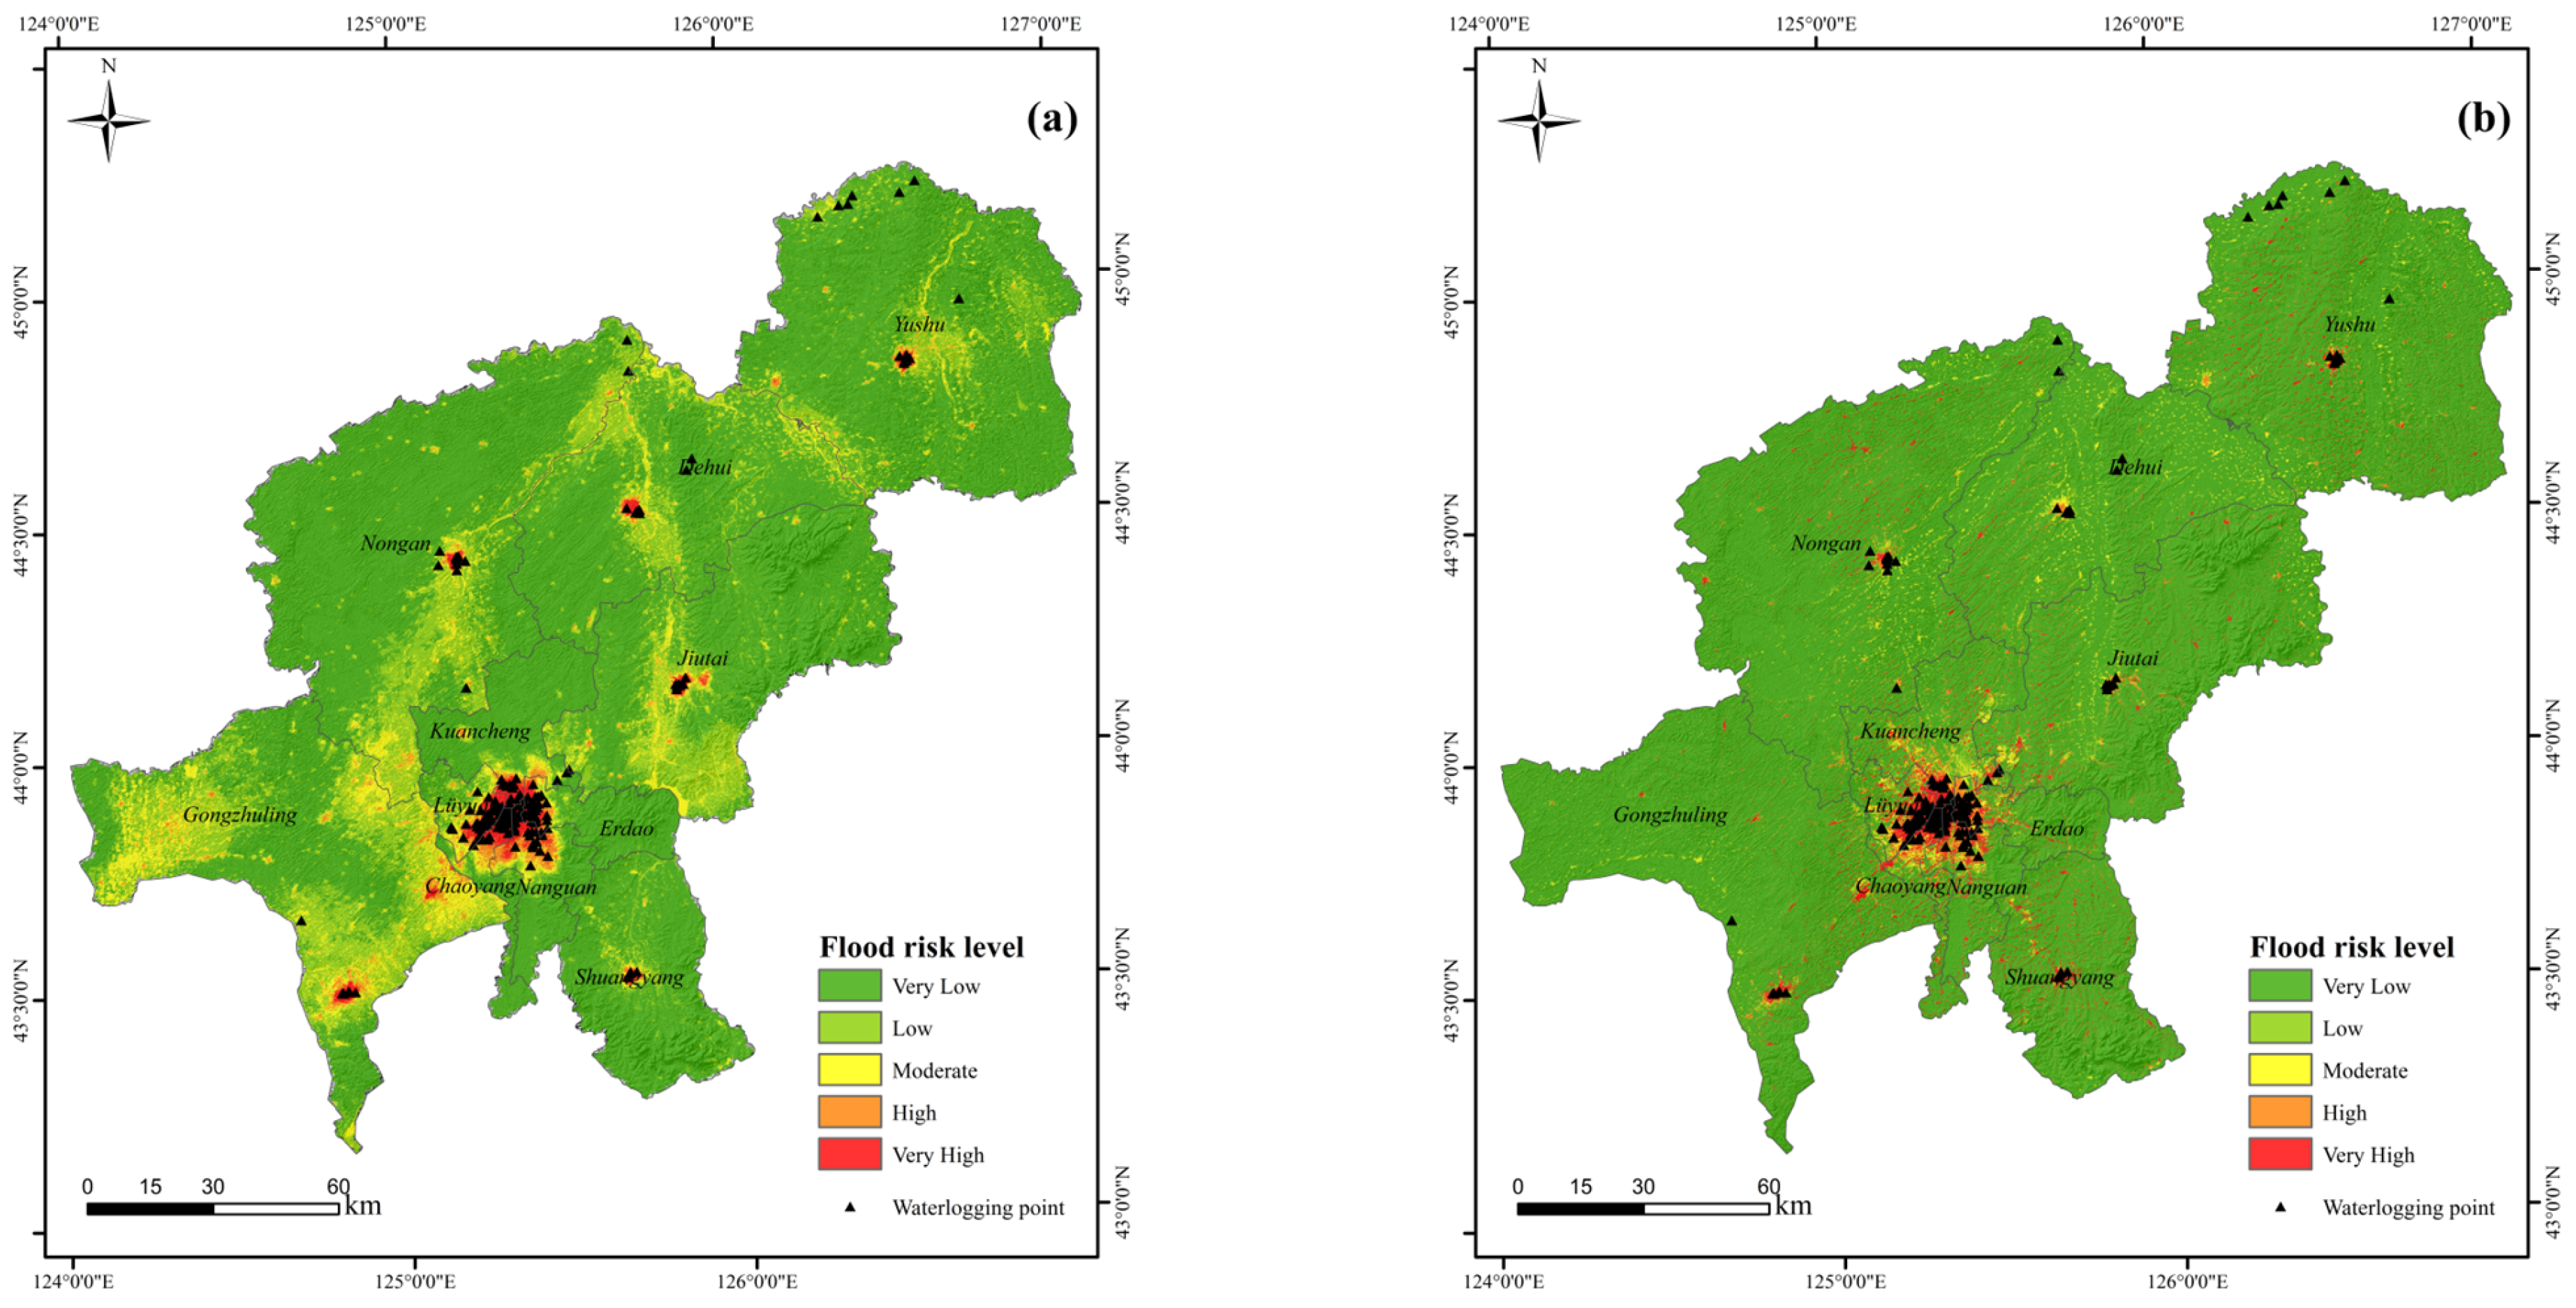
3.1. Urban Flood Risk Assessment Using the MaxEnt Model

The flooding hotspot data for Changchun were incorporated into the species distribution, whereas the spatial driving factors were input into the environmental variable module (Figure 4). A total of 75% of the inundated sites were randomly designated for training purposes, while 25% were selected for testing the model. The area beneath the ROC curve functions as an indicator for assessing the precision of the MaxEnt model. Area under the curve (AUC) values generally fall within the interval of 0 to 1, where values exceeding 0.8 are indicative of superior performance in simulation outcomes [34].
The MaxEnt model underwent ten training iterations, and the average results were subsequently analyzed. Figure 5 presents the ROC curve for the MaxEnt model, demonstrating a mean AUC value of 0.903 derived from the aggregated outcomes of multiple iterations. This indicates the model’s efficacy in evaluating and forecasting the risk zones associated with urban flooding.
Figure 6 depicts the correlation between the response curves for the spatial drivers and the likelihood of urban flooding in Changchun. The probability of urban flooding shows only slight variations in response to most of the spatial drivers (blue sections). An increase in positive indicators correlates with an elevated risk of flooding, whereas an increase in negative indicators is associated with a reduced risk of flooding. The presence of impervious surfaces, the population density, and the occurrence of maximum daily rainfall were found to positively influence the distribution of the flooding locations. This suggests that the likelihood of flooding is heightened by an increase in impervious surfaces, population density, and maximum daily precipitation and a transition in land use from undeveloped to developed areas. The variables of slope, drainage network density, and the NDVI exhibited an inverse relationship with the occurrence of flooding points. This suggests that flooding events are less prevalent in regions characterized by elevated levels of green space and drainage density. The majority of the environmental variables have relatively stable trends across multiple simulations. Consequently, urban flooding occurrences are clearly concentrated in areas with low “green infrastructure” and high levels of urbanization.
By analyzing the importance of each spatial driver to the flooding problem in Changchun city (Table 2), the effects of the indicators on the waterlogging space distribution were observed. Among them, impervious surfaces, population density, drainage density, maximum daily rainfall, and the NDVI have the highest contribution rates, which are 20.6%, 18.1%, 13.1%, 9.6%, and 8.5%, respectively, totaling 69.9%. The proportion of impervious surfaces remains dominant in terms of its impact on the risk of urban flooding. In general, urban flooding is more prevalent in areas characterized by significant urbanization, areas characterized by a high proportion of impervious surfaces, and densely populated areas.
When employing MaxEnt for species distribution forecasting, the resultant range is typically classified into four categories: non-habitat, low-suitability habitat, moderate-suitability habitat, and high-suitability habitat [35]. The flooding risk outcomes derived from MaxEnt have been applied to categorizing the flooding risk areas in Changchun using the natural breakpoint method, resulting in the categorization of regions into very high-, high-, moderate-, low-, and very low-risk areas (Figure 7).
Figure 7 illustrates that the central urban regions of Changchun, Shuangyang, and Gongzhuling are primarily the probable high-risk locations for floods due to their economic development and high building densities. The majority of the moderate-risk areas are located around the main urban regions, Dehui city, and Jiutai district, among others. An examination of the land use patterns reveals that numerous districts and counties situated in areas classified as moderate- to high-risk exhibit a significant prevalence of impervious surfaces. This correlation is attributable to the increased likelihood of flooding events occurring on impermeable surfaces, which consequently contributes to the incidence of urban flooding. Low-risk areas are predominantly characterized by croplands and forests, lower socio-economic development, and fewer built-up areas, making them less susceptible to flooding.

3.2. Analysis of the Results of Integrated Natural Disaster Risk Management Theory

3.2.1. Game Theory Portfolio Weights

The research indicator weights combined subjective and objective weights according to game theory. The subjective weights were calculated by hierarchical analysis and the objective weights by principal component analysis. Table 3 displays the computation outcomes.

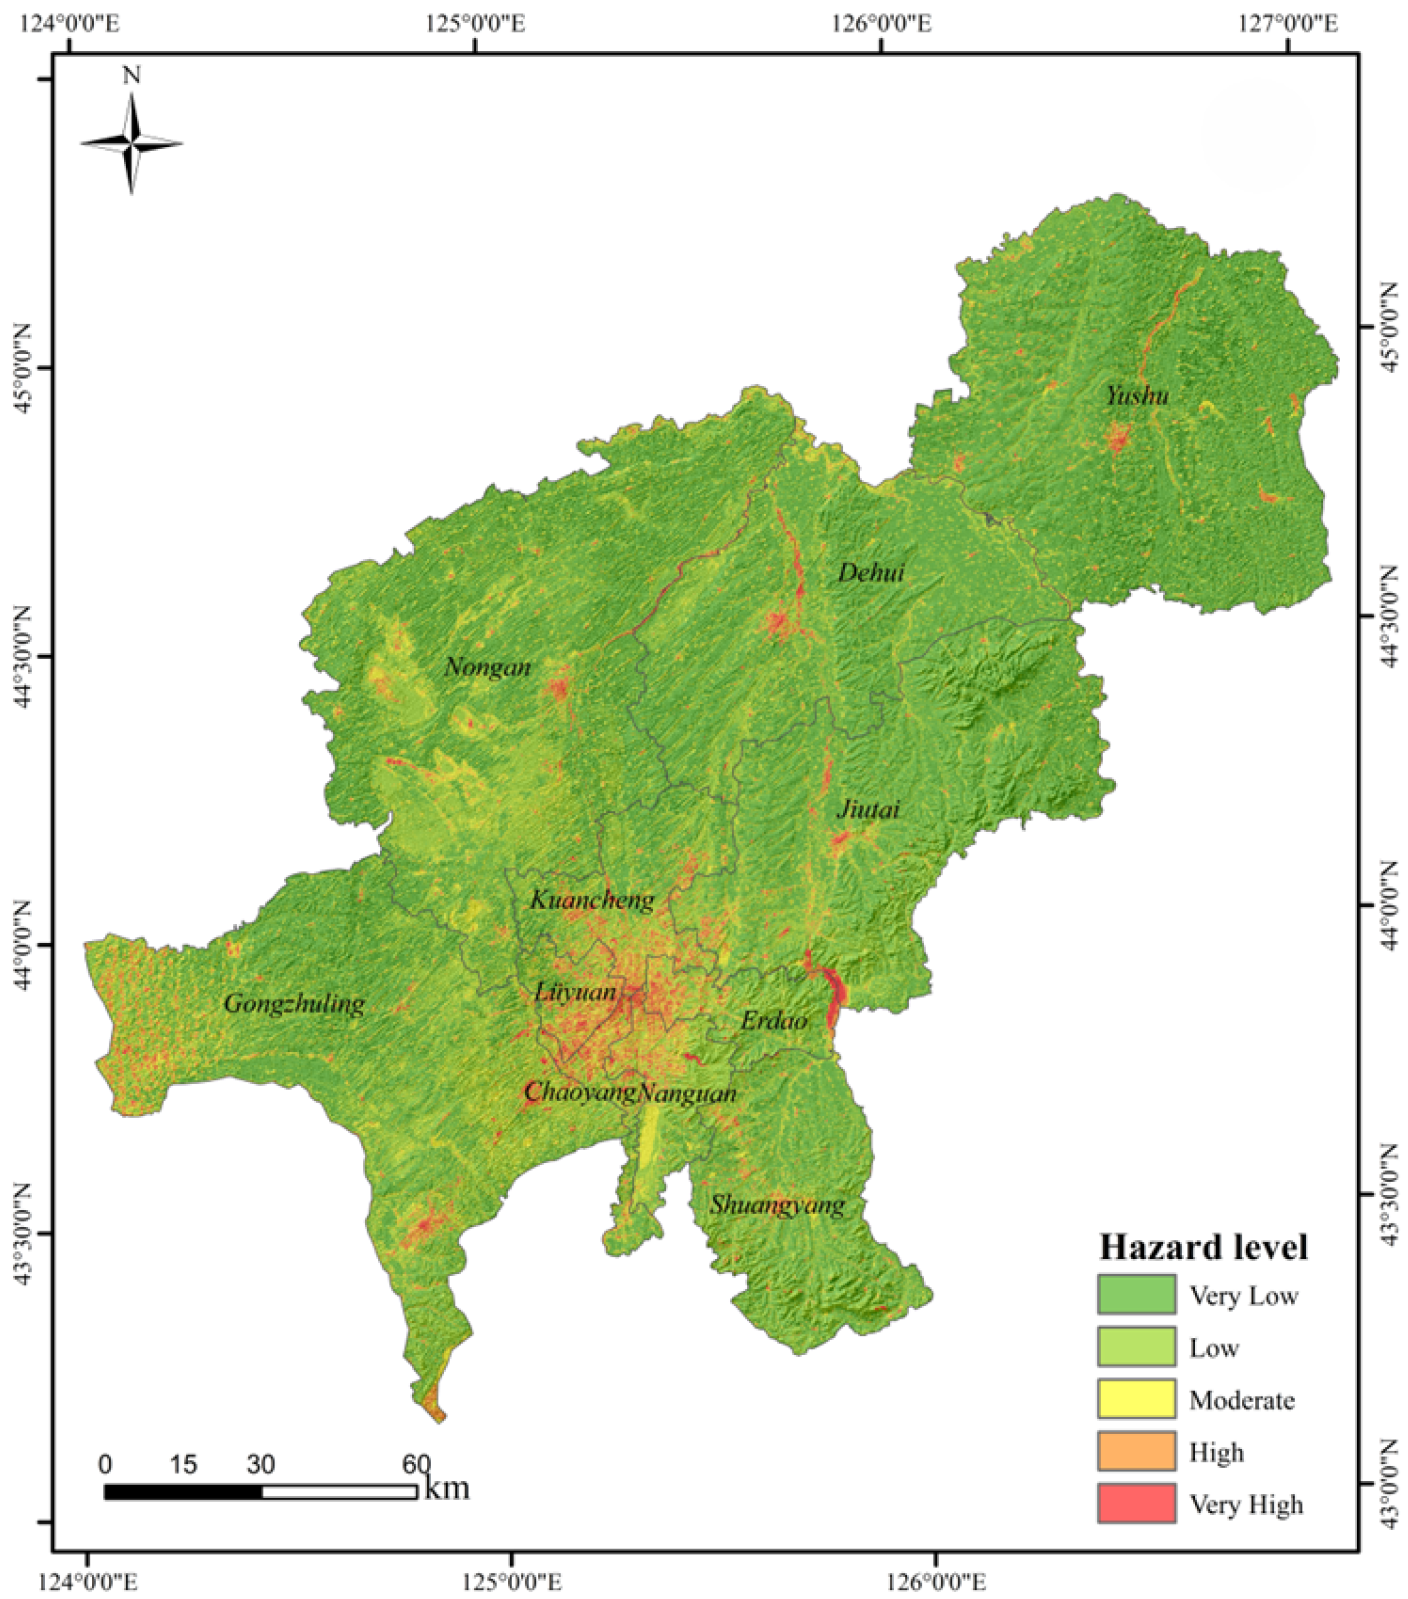
3.2.2. Hazard Analysis

The hazard level is composed of six indicators, including the maximum daily rainfall, N D V I , NDMI, and elevation, slope, and topographic relief. There is a close relationship between the maximum daily rainfall and the severity of flood events. In the event of heavy rainfall, significant inundation occurs in the area initially, resulting in the severe collapse of the drainage system, ultimately leading to widespread flooding in the entire area [36]. Changchun encounters the maximum daily rainfall in its northwestern region and the central urban area. The N D V I is commonly employed to quantify vegetation cover [37], and the data downloaded for this paper are digital products from Landsat 8 OLI_TIRS. The reflectance values for the N I R and red light bands correspond to Band 5 and Band 4, respectively. The formula for calculation is as follows:
N D V I = N I R R e d N I R + R e d
where N I R and R e d denote the reflectance in the near-infrared and infrared bands, respectively. An N D V I value approaching 1 indicates a higher density of vegetation cover.
The central region of Changchun city exhibits a relatively low density of vegetation, whereas the eastern districts and counties demonstrate a significantly higher level of vegetation cover. High vegetation cover contributes to increased retention of precipitation by the surface vegetation, minimizes the impact of flooding on the city through vegetation absorption, and keeps the urban drainage system unimpeded [38]. The city center and eastern counties of Changchun exhibit relatively significant slopes, which are more prone to water accumulation, consequently increasing the probability of urban waterlogging. Altitude plays a crucial role in assessing a city’s flood risk [39], with Changchun’s high-elevation zones predominantly located in the eastern and southern parts. The Normalized Difference Moisture Index (NDMI) values were used to define the soil moisture, as high-humidity areas are prone to waterlogging [40]; the analysis yielded relatively low NDMI values in the central part of Changchun.
According to the results of the indicator weight calculation, analysis of the spatial superposition of the hazard indicators was conducted using the ArcGIS raster calculator (Figure 8). The maximum daily rainfall in Changchun serves as a critical indicator of the environmental conditions. The increased impermeability observed in the central urban area contributes to a markedly elevated hazard level in this region compared to other areas.

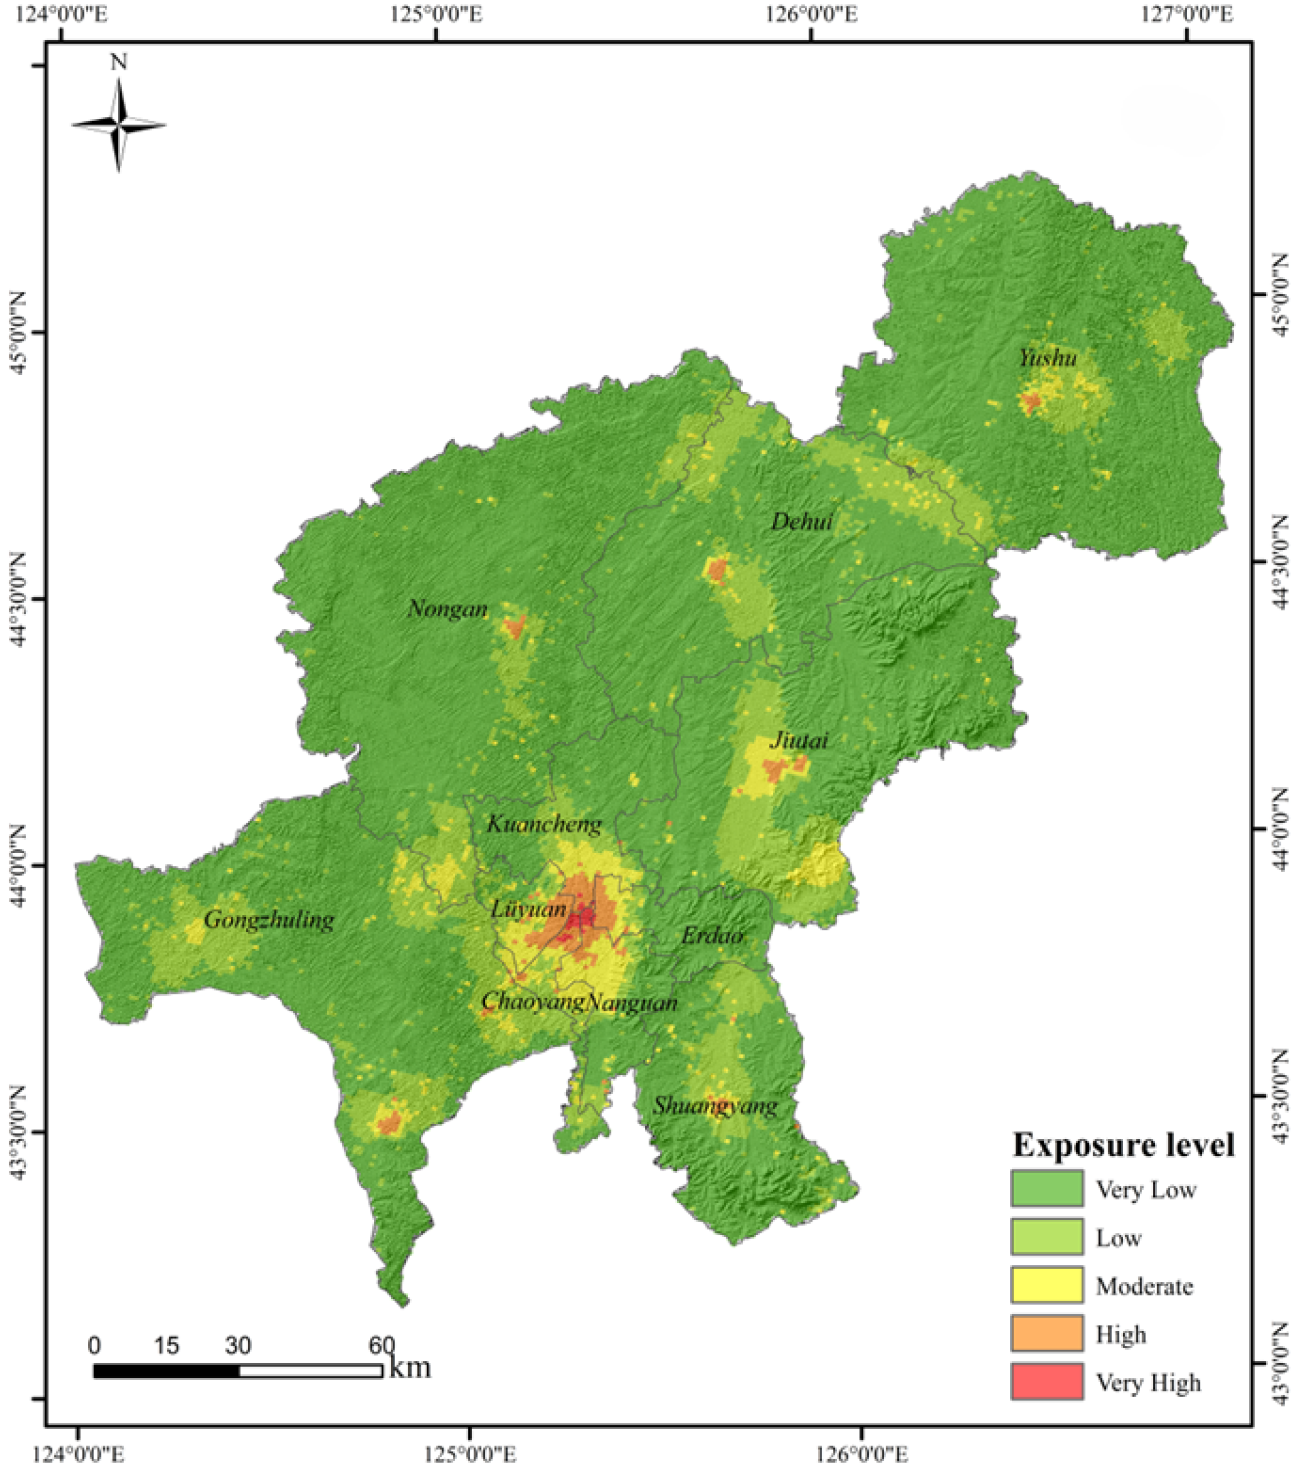
3.2.3. Exposure Analysis

The level of exposure is composed of six indicators—road network density, population density, drainage density, river network density, and LULC—as shown in Figure 9. There is a higher urban density in the main city of Changchun, and the primary focus of both its population and economic activity lies within this central urban hub, so its GDP and population density are higher here, and the other areas are relatively less populated, and the more densely populated an area, the more devastating the impact of a flooding catastrophe [41]. The growth of developed land in Changchun has led to the city center having the highest percentage of impervious surfaces, increasing the likelihood of stagnant water accumulation and its susceptibility to flooding [42]. The central area of Changchun is characterized by a significantly denser road network in comparison to its periphery, indicative of the urban street layout and connectivity, which is closely associated with the city’s drainage infrastructure [43]. When the area receives heavy or prolonged rainfall, regions with a dense network of rivers are more prone to flooding [44]. The main urban area has a significantly higher drainage density compared to other areas, so it can cope better with the urban flooding phenomena brought about by extreme rainfall to a certain extent. Therefore, its high exposure level is primarily focused in the central area of Changchun.

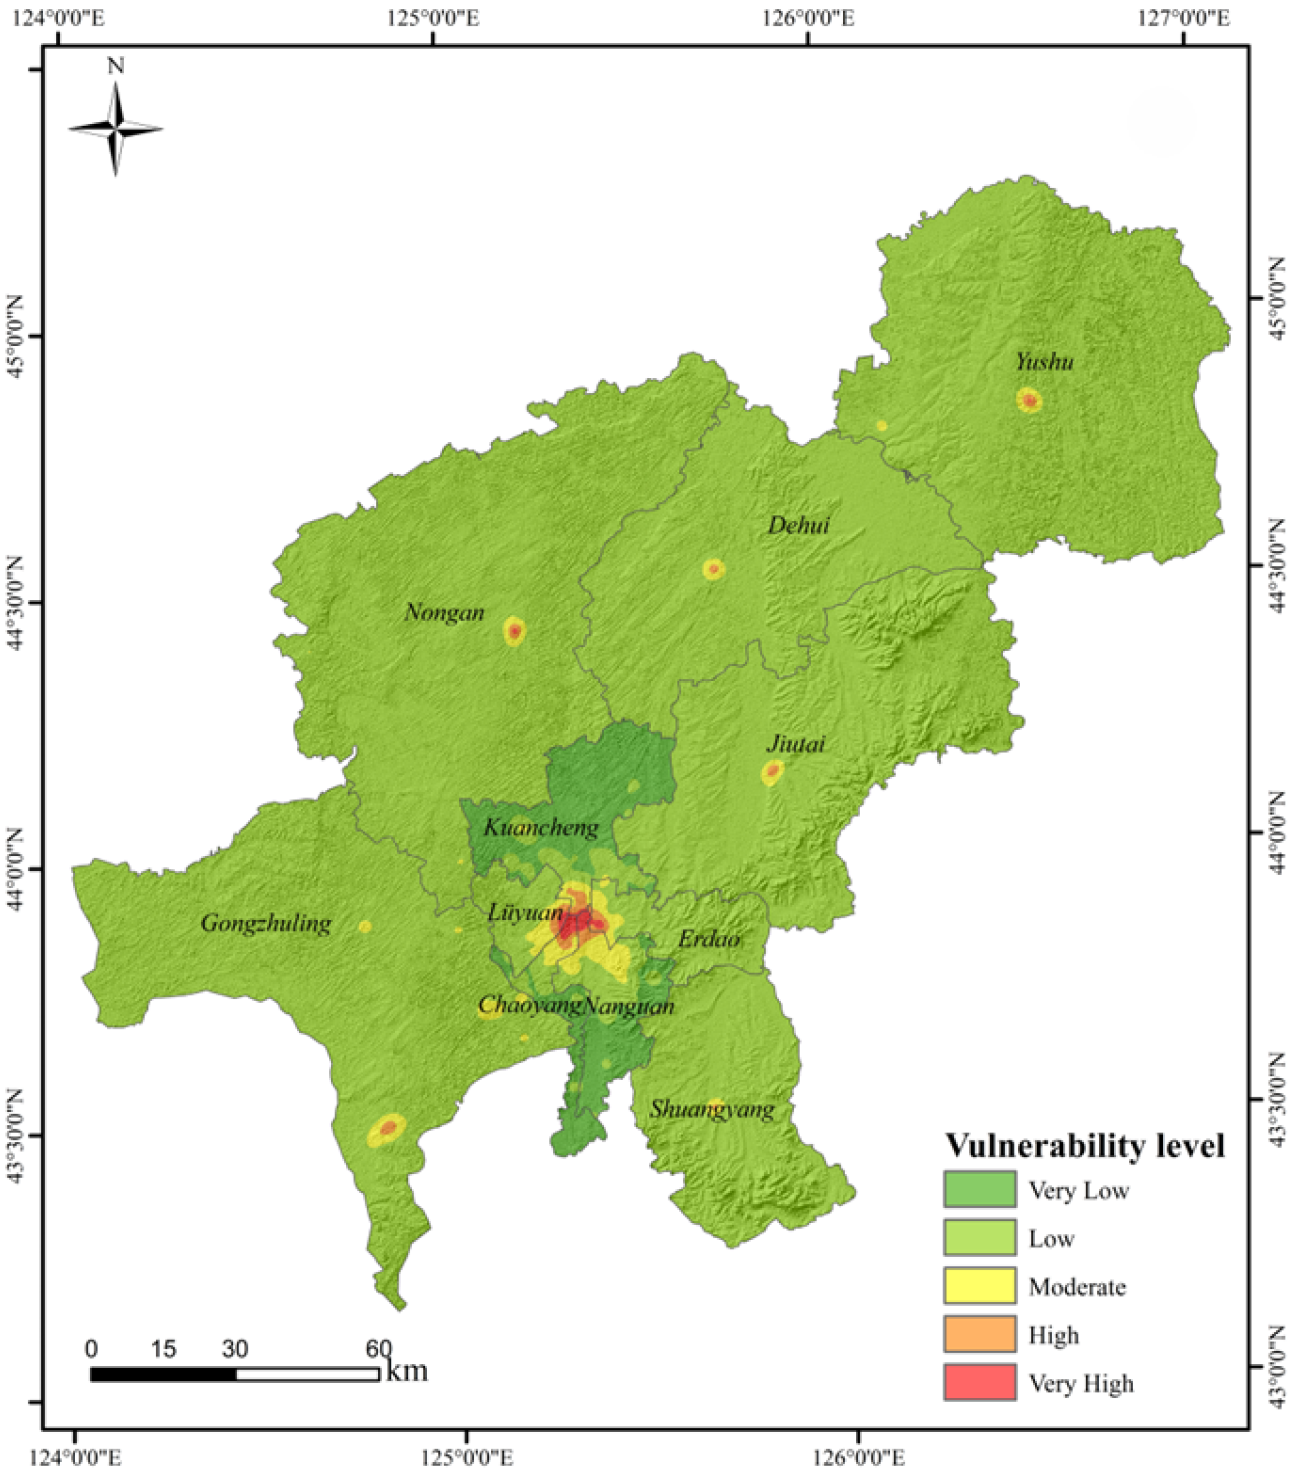
3.2.4. Vulnerability Analysis

The level of vulnerability is made up of two indicators, the proportion of the vulnerable population and the condition of buildings, as illustrated in Figure 10. Kuangcheng, Chaoyang, Erdao, and Nanguan exhibit a relatively low percentage of the vulnerable population, so they have a better resistance to urban flooding [45]; Gongzhuling city, Nong’an County, and Yushu city contain a higher percentage of the vulnerable population, rendering them more susceptible to hazards during urban flooding events. Building density plays a crucial role in urban flooding, with higher densities leading to increased damage from urban flooding [46].

3.2.5. Emergency Response and Recovery Capability Analysis (ERC)

Emergency recovery and capability is assessed through three key indicators, the capacity of health care facilities, the condition of educational institutions, and the percentage of management within the water, environmental, and public facilities sectors, as depicted in Figure 11. The health care institutions in Chaoyang district, Gongzhuling city, and Yushu County possess a higher number of beds, enabling them to provide enhanced relief services during and after flood disasters, thereby improving their rescue and recovery capabilities. In the districts of Chaoyang, Nanguan, Erdao, Kuancheng, and Lvyuan, there is a relatively high level of education and a significant proportion of water conservancy infrastructure. This situation enables a more effective response to flood disasters [47].

3.2.6. Changchun Urban Flooding Risk Assessment

The evaluation of regional flood risk is conducted in accordance with the previously presented equation, Formula (16). Subsequent to this evaluation, the regional flood risk is categorized into five distinct levels employing the natural break point method, as demonstrated in Figure 12. The findings suggest that the areas characterized by a significant risk of flooding are primarily situated within the economically advanced and comparatively densely populated central urban region of Changchun. This is primarily attributed to its very low elevation and significant proportion of impermeable water surfaces, which are more susceptible to water accumulation during periods of intense rainfall. Densely populated urban areas are primarily concentrated in the central region of Changchun. The city’s susceptibility to flooding is significantly increased by the high concentration of people and buildings within it. Parts surrounding the main city area are also flooded easily. In Yushu, Dehui, Nong’an, Jiutai, Shuangyang, Gongzhuling, and other districts and counties in the main urban area, the flood risk is relatively high, while the risk in other regions is lower. Chaoyang district, Erdao, and Lvyuan, located near the city center of Changchun, have strong disaster prevention and reduction capabilities because more energy and funds have been invested in these places.

3.3. Verification Analysis

The distribution map of the assessment results from the MaxEnt model run is validated with the assessment map based on natural disaster risk management theory for the flooding points, as shown in Figure 13. In accordance with the extensive framework of natural disaster risk management, 88.66% of the identified flooding points on the risk map are situated within areas classified as high-risk and very high-risk. From analysis of Figure 14, it is evident that 77.73% of the flood points on the risk map generated from the MaxEnt model are situated within regions classified as high- and very high-risk. Furthermore, 14.29% of the flooding points are located in the very low-risk area. The flood risk assessment map derived from the natural disaster risk management framework demonstrates a greater degree of alignment with actual flooding occurrences compared to the MaxEnt model. Based on the findings of the evaluation, an appropriate emergency program has been developed to effectively address urban flooding.
The assessment of urban flooding risk in Changchun was classified into five separate levels through the application of the natural discontinuity point method. The distribution within the study area showed percentages of 70.85% (very low), 11.56% (low), 7.46% (moderate), 3.78% (high) and, 6.35% (very high). The regions characterized by an elevated risk are primarily located within the urban areas of Changchun, which is primarily attributed to low elevation, conducive to urban flood formation. In addition, this region is economically prosperous and has high vulnerability. The interplay of these factors culminates in a significant risk of flooding within the primary urban region of Changchun. High-risk and medium-risk zones are predominantly located within the central urban areas of several districts and counties, including Yushu, Dehui, Nong’an, Jiutai, Shuangyang, and Gongzhuling.

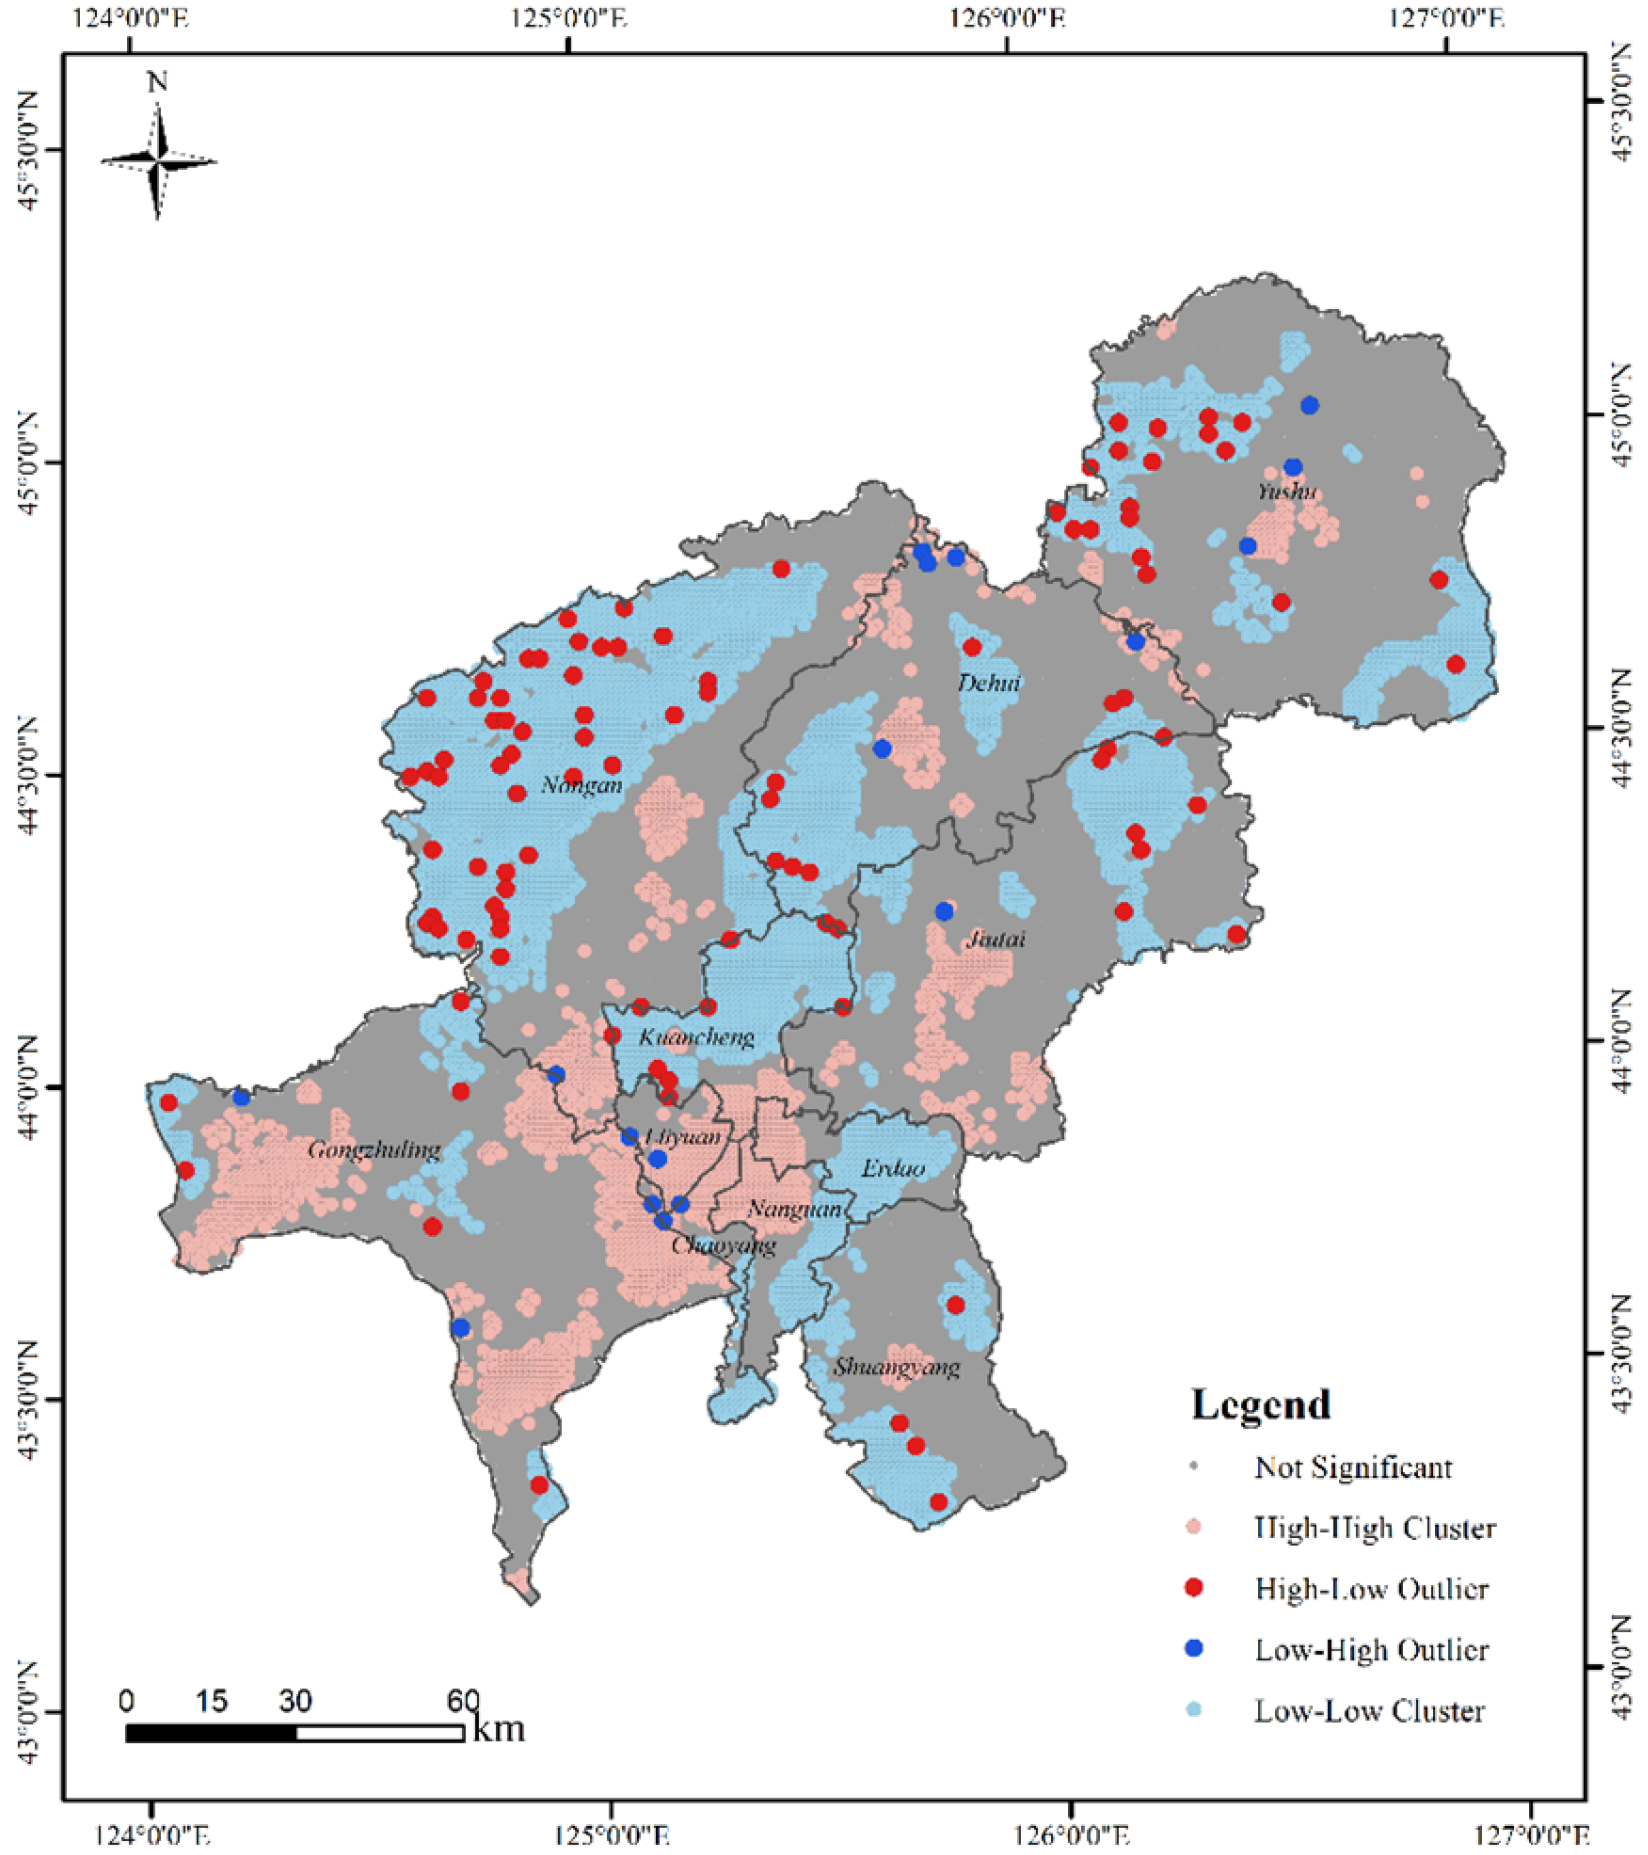
3.4. Analysis of Spatial Autocorrelation

3.4.1. Analysis of Global Spatial Autocorrelation

The ESDA was employed to compute Moran’s I, which evaluated the spatial distribution of flooding risk in Changchun. This analysis was conducted using ArcGIS software (10.8). The computed results indicate that Moran’s I was 0.868, accompanied by a z -score of 192.449. This suggests that the distribution of the flooding risk in Changchun city exhibits a notable pattern of spatial clustering.
GeoDa was developed by Dr. Luc Anselin and his team members, Dr. Li Xun and Dr. Julia Koschinsky [48]. In July 2016, GeoDa development was transferred from the GeoDa Center for Geospatial Analysis and Computation at Arizona State University to the Center for Spatial Data Science at the University of Chicago. The Moran’s scatterplot was subsequently produced utilizing GeoDa software (1.22) (Figure 15e). The first quadrant of the scatterplot represents the high-value catchment (high–high), signifying the presence of high-value catchments both within the designated area and in adjacent regions (Figure 15a). This suggests that the neighboring areas surrounding the region designated as having an increased risk of flooding also demonstrate a comparable level of vulnerability. The third quadrant is characterized as a low-value catchment area (low–low), signifying that both this area and its adjacent regions are classified as low-value catchment zones (Figure 15c). This classification implies that these regions exhibit clusters of minimal risk of inland flooding, with the surrounding areas also demonstrating a low-risk profile. The second quadrant (low–high) and the fourth quadrant (high–low) demonstrate that the values within these regions are elevated and diminished, respectively, in comparison to the values in the adjacent areas (Figure 15b,d). This observation suggests that these regions serve as transitional zones between areas of high and low risk of internal flooding, suggesting that high-risk areas are located near low-risk areas. This may imply that there are significant differences in the risk between these regions. Quadrants one and three exhibit a notable positive spatial correlation with the adjacent areas, suggesting a clustered spatial configuration.

3.4.2. Analysis of Local Spatial Autocorrelation

A local spatial autocorrelation (LISA) cluster map depicting the urban flooding risk in Changchun city was produced utilizing the Anselin Local Moran’s I tool within the ArcGIS software (10.8). This study’s findings indicate that the flood risk in Changchun city displays significant spatial clustering, revealing five distinct spatial clustering patterns (Figure 16). Among these classifications, high–high clusters and low–low clusters represent the predominant proportions. The high–high clusters are primarily situated within the central urban regions of Changchun, encompassing the urban centers of Yushu, Gongzhuling, and Jiutai districts, which exhibit a significant level of urban development and may present risks to the adjacent areas in the occurrence of flooding. Conversely, the low–low clusters are found at the periphery of the urban landscape, specifically in Kuangcheng district, Nong’an County, and Erdao district. Regions identified as low-risk, specifically the northern part of Dehui and the southern part of Jiutai district, are classified as high–high clusters. This classification indicates that these areas may be influenced by the adjacent high-risk regions. With further urbanization and an increasing population concentration, the risk of flooding in these areas will rise significantly. Consequently, this research not only evaluates the present conditions of urban flooding risk but also serves as a significant resource for dynamic early warning systems pertaining to urban flooding. The factors contributing to the concentration of risk within the high–high cluster may be associated with spillover effects originating from the initial flood risk zones, including the migration and expansion of populations into adjacent regions. This phenomenon has resulted in some areas with no recorded historical flooding events tending to be similar in their characteristics to high-risk areas, such as higher population densities, making these areas potentially flood-prone in the future.

4. Discussion

This paper utilizes the MaxEnt model and integrates natural disaster risk management theory to assess urban flooding risk in Changchun. The results of the assessment were validated through urban flooding hotspots in Changchun, and the results were analyzed by spatial autocorrelation.
Compared with traditional methods from the past, this article evaluates the urban flooding disaster risk in Changchun city based on the MaxEnt model in the context of real waterlogging hotspots. In addition to considering the conventional natural conditions, land use, and extreme rainfall as potential factors in waterlogging, innovative indicators such as GDP were also taken into account. The AUC value of the fitting result reached 0.903, indicating the high accuracy of the model evaluation. Obtaining a distribution map of waterlogging risk in Changchun city and analyzing potential high-risk areas using spatial autocorrelation methods can provide a theoretical basis for alleviating urban waterlogging problems and promoting the construction of sponge cities.
This study identifies high-risk areas for flooding risk in Changchun city. These areas are particularly susceptible to waterlogging due to their low topography and inadequate drainage systems. Therefore, there is an urgent need to strengthen the infrastructure and improve the drainage systems in these highly vulnerable areas. In future research, firstly, we need to use more accurate disaster data and consider more factors related to urban waterlogging, especially in the construction of urban pipeline networks. We aim to integrate multidimensional big data analysis of urban waterlogging risk processes and propose optimization strategies for national spatial resources that coexist with the waterlogging risk.
There are still some limitations to this study, as the MaxEnt model only selected some representative influencing factors. However, when complex urban systems have faced flood disasters, indicators related to flood warning capabilities have not been comprehensively considered. The impact of rainwater pipe network facilities has not been considered. This study failed to thoroughly analyze the diversity among the indicators at all levels, and there may be synergistic trade-offs between these indicators. At the same time, the low accuracy of urban flood hotspot data may lead to inaccurate output from the MaxEnt model.
Additionally, it is essential to use artificial intelligence methods to assess the risk of urban flood disasters. Based on deep learning methods, using modern rainstorm and flood simulation technology, from the perspective of image processing, combined with urban hotspot data, the historical flood disaster data and driving factors are regressed during the training period, and a corresponding model is established so as to find a more effective way to assess and predict the disaster risk of urban flood by combining artificial intelligence.

5. Conclusions

A theoretical framework for urban flood disaster risk is developed by identifying and selecting a range of indicators pertinent to urban waterlogging events. An assessment of urban flooding disaster risk in Changchun city was conducted through the application of the maximum entropy (MaxEnt) model, in conjunction with game theory, while also incorporating principles from integrated natural disaster risk management theory.
The validation outcomes demonstrate that 88.66% of the identified flooding points are situated within high-risk and very high-risk areas following an assessment using comprehensive natural disaster risk management theory. This finding is deemed to be more reliable and justifiable in comparison to the MaxEnt model evaluation result of 77.73%. In the study area, the percentage of each risk level is as follows: very low-risk (70.85%), low-risk (11.56%), moderate-risk (7.46%), high-risk (3.78%), and very high-risk (6.35%). The percentage of regions susceptible to urban flooding in Changchun is comparatively minimal; however, it is predominantly aggregated within the central urban area of the city, characterized by economic development and a relatively high population density. The flood risk in several districts and counties in central cities, including Yushu, Dehui, Nong’an, Jiutai, Shuangyang, and Gongzhuling, is also relatively high. At the same time, the spatial autocorrelation method is combined to analyze potential high-risk zones, and these results can provide a theoretical basis for alleviating the urban flooding problem and promoting sustainable development of the city. The ROC curve validated the accuracy of the MaxEnt model as 90.3%. Based on this, the contribution rates of various indicators were analyzed and ranked using the MaxEnt model. These results can provide urban planners and decision-makers with actionable insights, which can help in taking targeted measures to reduce losses in the event of a disaster.

Author Contributions

Conceptualization, F.H.; methodology, F.H. and D.Z.; software, F.H.; formal analysis, F.H. and J.Z.; resources, N.W.; data curation, F.H. and Z.D.; writing—original draft preparation, F.H.; writing—review and editing, D.Z. and Y.Z.; funding acquisition, D.Z. All authors have read and agreed to the published version of the manuscript.

Funding

This research was funded by the Key Scientific and Technology Research and Development Program of Jilin Province (20240304133SF).

Institutional Review Board Statement

Not applicable.

Informed Consent Statement

Not applicable.

Data Availability Statement

The data are available from the original providers—see Table 1. The codes and data for this article are freely available at https://www.gscloud.cn (accessed on 8 December 2023), https://www.databox.store (accessed on 15 November 2023), and http://www.guihuayun.com/ (accessed on 23 October 2023).

Conflicts of Interest

The authors declare no conflicts of interest.

References

  1. Jia, C.; Guo, H.; Wen, C. Towards better flood risk management: Assessing flood risk and investigating the potential mechanism based on machine learning models. J. Environ. Manag. 2021, 293, 112810. [Google Scholar]
  2. Lin, J.; He, X.; Lu, S.; Liu, D.; He, P. Investigating the influence of three-dimensional building configuration on urban pluvial flooding using random forest algorithm. Environ. Res. 2020, 196, 110438. [Google Scholar] [CrossRef]
  3. Zhou, S.; Zhang, D.; Wang, M.; Liu, Z.; Gan, W.; Zhao, Z.; Xue, S.; Müller, B.; Zhou, M.; Ni, X.; et al. Risk-driven composition decoupling analysis for urban flooding prediction in high-density urban areas using Bayesian-Optimized LightGBM. J. Clean. Prod. 2024, 457, 142286. [Google Scholar] [CrossRef]
  4. Yang, J.; Duan, C.; Wang, H.; Chen, B. Spatial supply-demand balance of green space in the context of urban waterlogging hazards and population agglomeration. Resour. Conserv. Recycl. 2023, 188, 106662. [Google Scholar] [CrossRef]
  5. Zang, D.; Yan, D.; Wang, Y.; Lu, C. Research Progress on Risk Assessment and Integrated Strategies for Urban Pluvial Flooding. J. Catastrophol. 2014, 29, 144–149. [Google Scholar]
  6. Benito, G.; Lang, M.; Barriendos, M.; Llasat, M.C.; Francés, F.; Ouarda, T.; Thorndycraft, V.; Enzel, Y.; Bardossy, A.; Coeur, D.; et al. Use of systematic, palaeoflood and historical data for the improvement of flood risk estimation. Review of scientific methods. Nat. Hazards 2004, 31, 623–643. [Google Scholar]
  7. Yin, S.; Wang, H.; Wang, D.; Huang, C. Historical flood disasters and climate change in the upper reaches of Hanjiang River in southern Shaanxi Province. Arid Land Res. 2010, 27, 522–528. [Google Scholar]
  8. Luino, F.; Barriendos, M.; Gizzi, F.T.; Glaser, R.; Gruetzner, C.; Palmieri, W.; Turconi, L. Historical Data for Natural Hazard Risk Mitigation and Land Use Planning. Land 2023, 12, 1777. [Google Scholar] [CrossRef]
  9. Zhu, D.; Zhi, X.; Sein, Z.M.M.; Ji, Y.; Tian, X.; Pan, M. Possible Relationships between the Interdecadal Anomalies of Heavy Rainfall under Northeastern China Cold Vortexes and the Sea Surface Temperature (SST). Atmosphere 2022, 13, 354. [Google Scholar] [CrossRef]
  10. Jing, X.; Fan, J.; Zhang, J.; Tong, Z.; Liu, X. Risk assessment of rainstorm and flood disaster in Songhua River main stream based on GIS. J. Catastrophol. 2009, 24, 51–56. [Google Scholar]
  11. Bhatt, G.D.; Sinha, K.; Deka, P.K.; Kumar, A. Flood Hazard and Risk Assessment in Chamoli District, Uttarakhand Using Satellite Remote Sensing and GIS Techniques. Int. J. Innov. Res. Sci. Eng. Technol. 2014, 3, 15348–15356. [Google Scholar] [CrossRef]
  12. Huang, G.; Luo, H.; Chen, W.; Pan, J. Urban flood disaster scenario simulation and risk assessment in Donghaoyong Basin, Guangzhou. Adv. Water Sci. 2019, 30, 643–652. [Google Scholar]
  13. Zhao, L.; Zhang, T.; Li, J.; Zhang, L.; Feng, P. Numerical simulation study of urban hydrological effects under low impact development with a physical experimental basis. J. Hydrol. 2023, 618, 129191. [Google Scholar] [CrossRef]
  14. Zhu, X.; Chen, Z.; Zhong, L. The risk pre-estimation of the flood casualty loss caused by heavy rainstorm in Jilin Province. J. Glaciol. Geocryol. 2016, 38, 395–401. [Google Scholar]
  15. Zhang, D.; Shi, X.; Xu, H.; Jing, Q.; Pan, X.; Liu, T.; Wang, H.; Hou, H. A GIS-based spatial multi-index model for flood risk assessment in the Yangtze River Basin, China. Environ. Impact Assess. Rev. 2020, 83, 106397. [Google Scholar] [CrossRef]
  16. Wang, C.; Wang, K.; Liu, D.; Zhang, L.; Li, M.; Khan, M.I.; Li, T.; Cui, S. Development and application of a comprehensive assessment method of regional flood disaster risk based on a refined random forest model using beluga whale optimization. J. Hydrol. 2024, 633, 130963. [Google Scholar] [CrossRef]
  17. Gao, J.; Murao, O.; Pei, X.; Dong, Y. Identifying Evacuation Needs and Resources Based on Volunteered Geographic Information: A Case of the Rainstorm in July 2021, Zhengzhou, China. Int. J. Environ. Res. Public Health 2022, 19, 16051. [Google Scholar] [CrossRef]
  18. Zhang, F.; Tan, L.; Zhao, Q.; Wu, Y.; Xu, Y.; Gao, C. Research on urban waterlogging disaster based on hydrodynamic model: A case study of Baihe Community in Ningbo City. J. Nat. Disasters 2021, 30, 209–218. [Google Scholar] [CrossRef]
  19. Zhang, J.; Li, X.; Zhang, H. Research on urban waterlogging risk prediction based on the coupling of the BP neural network and SWMM model. J. Water Clim. Chang. 2023, 14, 3417–3434. [Google Scholar] [CrossRef]
  20. Li, J.; Liu, J.; Wu, T.; Peng, Q.; Cai, C. Risk analysis of waterlogging in a big city based on a bow-tie Bayesian network model, using the megacity of Wuhan as an example. Front. Environ. Sci. 2023, 11, 1258544. [Google Scholar] [CrossRef]
  21. Chen, J.; Li, Y.; Zhang, S. Fast Prediction of Urban Flooding Water Depth Based on CNN−LSTM. Water 2023, 15, 1397. [Google Scholar] [CrossRef]
  22. Phillips, S.J.; Dudík, M. Modeling of species distributions with Maxent: New extensions and a comprehensive evaluation. Ecography 2008, 31, 161–175. [Google Scholar] [CrossRef]
  23. Pourghasemi, H.R.; Pouyan, S.; Bordbar, M.; Golkar, F.; Clague, J.J. Flood, landslides, forest fire, and earthquake susceptibility maps using machine learning techniques and their combination. Nat. Hazards 2023, 116, 3797–3816. [Google Scholar] [CrossRef]
  24. Lin, J.; He, P.; Yang, L.; He, X.; Lu, S.; Liu, D. Predicting future urban waterlogging-prone areas by coupling the maximum entropy and FLUS model. Sustain. Cities Soc. 2022, 80, 103812. [Google Scholar] [CrossRef]
  25. Zhang, J.-Q.; Liang, J.-D.; Liu, X.-P.; Tong, Z.-J. GIS-Based Risk Assessment of Ecological Disasters in Jilin Province, Northeast China. Hum. Ecol. Risk Assess. Int. J. 2009, 15, 727–745. [Google Scholar] [CrossRef]
  26. Dong, Y.; Ren, Z.; Fu, Y.; Miao, Z.; He, X. Recording Urban Land Dynamic and Its Effects during 2000–2019 at 15-m Resolution by Cloud Computing with Landsat Series. Remote Sens. 2020, 12, 2451. [Google Scholar] [CrossRef]
  27. Huang, X.; Li, H.; Zhang, Y.; Yang, X.; Chen, S. Construction of urban waterlogging vulnerability assessment system and vulnerability assessment based on PSR and AHP methods in Xi’an. J. Nat. Disasters 2019, 28, 167–175. [Google Scholar]
  28. Bertilsson, L.; Wiklund, K.; de Moura Tebaldi, I.; Rezende, O.M.; Veról, A.P.; Miguez, M.G. Urban flood resilience—A multi-criteria index to integrate flood resilience into urban planning. J. Hydrol. 2019, 573, 970–982. [Google Scholar] [CrossRef]
  29. Dong, Q.; Cooper, O. An orders-of-magnitude AHP supply chain risk assessment framework. Int. J. Prod. Econ. 2016, 182, 144–156. [Google Scholar] [CrossRef]
  30. Rahman, M.A.T.; Hoque, S.; Saadat, A.H.M. Selection of minimum indicators of hydrologic alteration of the Gorai river, Bangladesh using principal component analysis. Sustain. Water Resour. Manag. 2017, 3, 13–23. [Google Scholar] [CrossRef]
  31. Liu, B.; Huang, J.J.; McBean, E.; Li, Y. Risk assessment of hybrid rain harvesting system and other small drinking water supply systems by game theory and fuzzy logic modeling. Sci. Total Environ. 2020, 708, 134436. [Google Scholar] [CrossRef]
  32. Zhang, X.L. The analysis models of exploratory spatial data. Contemp. Econ. Manag. 2007, 29, 26–29. [Google Scholar]
  33. Moran, P.A. Notes on continuous stochastic phenomena. Biometrika 1950, 37, 17–23. [Google Scholar] [CrossRef]
  34. Yoshimura, N.; Hiura, T. Demand and supply of cultural ecosystem services: Use of geotagged photos to map the aesthetic value of landscapes in Hokkaido. Ecosyst. Serv. 2017, 24, 68–78. [Google Scholar] [CrossRef]
  35. Cao, Q.; Gao, Q.-B.; Guo, W.-J.; Zhang, Y.; Wang, Z.-H.; Ma, X.-L.; Zhang, F.-Q.; Chen, S.-L. Impacts of human activities and environmental factors on potential distribution of Swertia przewalskii Pissjauk., an endemic plant in Qing-Tibetan Plateau, using MaxEnt. Plant Sci. J. 2021, 39, 22–31. [Google Scholar]
  36. Jongman, B. Effective adaptation to rising flood risk. Nat. Commun. 2018, 9, 1986. [Google Scholar] [CrossRef]
  37. Sar, N.; Chatterjee, S.; Das Adhikari, M. Integrated remote sensing and GIS based spatial modelling through analytical hierarchy process (AHP) for water logging hazard, vulnerability and risk assessment in Keleghai river basin, India. Model. Earth Syst. Environ. 2015, 1, 31. [Google Scholar] [CrossRef]
  38. Shrestha, R.; Di, L.; Yu, E.G.; Kang, L.; Shao, Y.-Z.; Bai, Y.-Q. Regression model to estimate flood impact on corn yield using MODIS NDVI and USDA cropland data layer. J. Integr. Agric. 2017, 16, 398–407. [Google Scholar] [CrossRef]
  39. Tayyab, M.; Zhang, J.; Hussain, M.; Ullah, S.; Liu, X.; Khan, S.N.; Baig, M.A.; Hassan, W.; Al-Shaibah, B. Gis-based urban flood resilience assessment using urban flood resilience model: A case study of peshawar city, khyber pakhtunkhwa, pakistan. Remote Sens. 2021, 13, 1864. [Google Scholar] [CrossRef]
  40. Omran, E.-S.E. Evolving waterlogged identification system to assess spatiotemporal impact of the new Suez Canal corridor, Egypt. J. Coast. Conserv. 2017, 21, 849–865. [Google Scholar] [CrossRef]
  41. Ha-Mim, N.M.; Rahman, M.A.; Hossain, M.Z.; Fariha, J.N.; Rahaman, K.R. Employing multi-criteria decision analysis and geospatial techniques to assess flood risks: A study of Barguna district in Bangladesh. Int. J. Disaster Risk Reduct. 2022, 77, 103081. [Google Scholar] [CrossRef]
  42. Szwagrzyk, M.; Kaim, D.; Price, B.; Wypych, A.; Grabska, E.; Kozak, J. Impact of forecasted land use changes on flood risk in the Polish Carpathians. Nat. Hazards 2018, 94, 227–240. [Google Scholar] [CrossRef]
  43. Hu, S.; Cheng, X.; Zhou, D.; Zhang, H. GIS-based flood risk assessment in suburban areas: A case study of the Fangshan District, Beijing. Nat. Hazards 2017, 87, 1525–1543. [Google Scholar] [CrossRef]
  44. De Risi, R.; Jalayer, F.; De Paola, F.; Lindley, S. Delineation of flooding risk hotspots based on digital elevation model, calculated and historical flooding extents: The case of Ouagadougou. Stoch. Environ. Res. Risk Assess. 2017, 32, 1545–1559. [Google Scholar] [CrossRef]
  45. Balica, S.F.; Wright, N.G.; van der Meulen, F. A flood vulnerability index for coastal cities and its use in assessing climate change impacts. Nat. Hazards 2012, 64, 73–105. [Google Scholar] [CrossRef]
  46. Tran, D.; Xu, D.; Dang, V.; Alwah, A.A.Q. Predicting Urban Waterlogging Risks by Regression Models and Internet Open-Data Sources. Water 2020, 12, 879. [Google Scholar] [CrossRef]
  47. Shah, A.A.; Ye, J.; Abid, M.; Khan, J.; Amir, S.M. Flood hazards: Household vulnerability and resilience in disaster-prone districts of Khyber Pakhtunkhwa province, Pakistan. Nat. Hazards 2018, 93, 147–165. [Google Scholar] [CrossRef]
  48. Anselin, L.; Syabri, I.; Kho, Y. Geoda: An introduction to spatial data analysis. Geogr. Anal. 2005, 38, 5–22. [Google Scholar] [CrossRef]
Figure 1. Overview map of the study area.
Sustainability 16 08696 g001
Figure 2. Map of flooding hotspots in Changchun, 2017–2022.
Sustainability 16 08696 g002
Figure 3. Technical flow chart of flooding disaster risk assessment in Changchun.
Sustainability 16 08696 g003
Figure 4. Potential spatial drivers of urban flooding in Changchun city. (a) GDP, (b) NDVI, (c) proportion of impervious surfaces, (d) elevation, (e) river network density, (f) maximum daily rainfall, (g) road network density, (h) drainage density, (i) slope, (j) relief, and (k) population density.
Sustainability 16 08696 g004
Figure 5. ROC curve based on the MaxEnt model.
Sustainability 16 08696 g005
Figure 6. Response curves of individual spatial factors and their correlation with the likelihood of urban flooding in Changchun.
Sustainability 16 08696 g006
Figure 7. Flooding risk distribution map of Changchun by the MaxEnt model.
Sustainability 16 08696 g007
Figure 8. Spatial distribution of hazards for urban flooding risk assessment in Changchun.
Sustainability 16 08696 g008
Figure 9. Spatial distribution of exposure for urban flooding risk assessment in Changchun.
Sustainability 16 08696 g009
Figure 10. Spatial distribution of vulnerability for urban flooding risk assessment in Changchun.
Sustainability 16 08696 g010
Figure 11. Spatial distribution of emergency response and recovery capability for urban flooding risk assessment in Changchun.
Sustainability 16 08696 g011
Figure 12. Changchun urban flooding disaster risk assessment map.
Sustainability 16 08696 g012
Figure 13. Validation of the assessment results based on flooding point data separately. (a) Urban flooding risk assessment in Changchun city based on comprehensive natural hazard risk management Theory. (b) Urban flooding risk assessment in Changchun city using MaxEnt model.
Sustainability 16 08696 g013
Figure 14. Percentage of flooding points categorized by risk levels in the models.
Sustainability 16 08696 g014
Figure 15. Moran’s scatterplot of urban flooding risk distribution in Changchun. (a) High–high clusters, (b) low–high clusters, (c) low–low clusters, (d) high–low clusters, (f) not significant, and (e) overall.
Sustainability 16 08696 g015aSustainability 16 08696 g015b
Figure 16. Localized spatial autocorrelation (LISA) clustering of urban flooding in Changchun.
Sustainability 16 08696 g016
Table 1. Evaluation indicators and data sources.
IndexData TypeData DetailsData Source
ElevationRaster data2023Geospatial data clouds
SlopeRaster data2023Geospatial data clouds
Maximum daily rainfallRaster data2020Jilin Meteorological Service
ReliefRaster data2023Geospatial data clouds
NDMILandsat 8 OLI_TIRS2023Geospatial data clouds
NDVILandsat 8 OLI_TIRS2023Geospatial data clouds
LULCRaster data2022https://www.databox.store
(accessed on 15 November 2023)
River network densityRaster data2023National Data Center for
Meteorological Sciences
Population densityRaster data2023World UN population density dataset
Road network densityRoad network
Shape file
2023Geospatial data clouds
GDPRaster data2022National Bureau of
Statistics
Drainage densityRaster data2023https://www.databox.store
(accessed on 15 November 2023)
Percentage of the vulnerable
population
Attribute data2022Changchun Statistical Yearbook
Commercial buildingsPOI2023http://www.guihuayun.com
(accessed on 23 October 2023)
Residential buildingsPOI2023http://www.guihuayun.com
(accessed on 23 October 2023)
Water conservancyAttribute data2022Changchun Statistical Yearbook
Number of beds in health care
institutions
Attribute data2022Changchun Statistical Yearbook
Educational statusAttribute data2022Changchun Statistical Yearbook
Table 2. The importance of spatial driving factors to waterlogging in Changchun (%).
Proportion of Impervious SurfacesPopulation DensityDrainage DensityMaximum Daily
Rainfall
NDVIElevationReliefSlopeRoad
Network Density
River Network DensityGDP
20.618.113.19.68.57.46.65.34.83.32.7
Table 3. Indicator weights.
Criterion LayerCriterion Layer WeightIndex LevelIndex Layer Weight
Hazard index0.4054Elevation0.2028
Slope0.1748
Maximum daily rainfall0.2381
Relief0.1672
NDMI0.1024
NDVI0.1147
Exposure index0.2041LULC0.2749
River network density0.0950
Population density0.1610
Road network density0.0641
GDP0.2060
Drainage density0.1990
Vulnerability index0.1567Proportion of the vulnerable population0.2200
Commercial buildings0.4800
Residential buildings0.3000
Emergency response and
recovery capacity index
0.2337Water conservancy0.4056
Number of beds in health care institutions0.2472
Educational status0.3472
Disclaimer/Publisher’s Note: The statements, opinions and data contained in all publications are solely those of the individual author(s) and contributor(s) and not of MDPI and/or the editor(s). MDPI and/or the editor(s) disclaim responsibility for any injury to people or property resulting from any ideas, methods, instructions or products referred to in the content.

