Article

Analysis of Industrial Water Use Efficiency Based on SFA–Tobit Panel Model in China

1
State Key Laboratory of Water Resources and Hydropower Engineering Science, Wuhan University, No. 299, Ba Yi Road, Wuhan 430072, China
2
Hydrology and Water Resources Department, Nanjing Hydraulic Research Institute, No. 225, Guangzhou Road, Nanjing 210029, China
*
Author to whom correspondence should be addressed.
Sustainability 2024, 16(19), 8708; https://doi.org/10.3390/su16198708
Submission received: 30 July 2024 / Revised: 15 September 2024 / Accepted: 16 September 2024 / Published: 9 October 2024

Abstract

:
Over the past two decades, the industrial sector of China has experienced rapid development, which has correspondingly led to a significant increase in water resource consumption. To better understand the dynamics of industrial water use, and formulate appropriate water resource conservation and management policies, it is necessary to evaluate the evolution of industrial water use efficiency and its influencing factors in China. Given the high sensitivity and accuracy of the stochastic frontier analysis (SFA) model for efficiency assessment, the Tobit model is more suitable for regression analyses of truncated data. This study employed the SFA–Tobit panel model to evaluate the industrial water use efficiency of provinces in China from 2003 to 2021. The results indicate that national industrial water use efficiency improved from 0.41 to 0.65 during the study period. All provinces showed significant improvements, with developed provinces exhibiting higher industrial water use efficiency than undeveloped provinces. Regionally, the eastern areas demonstrated superior industrial water use efficiency compared to the western regions, with the central regions having the lowest overall water use efficiency. Moreover, the efficiency gap between regions has been narrowing. The national industrial water-saving potential is estimated at 31.306 billion cubic meters, with Jiangsu province having the highest saving potential at 3.709 billion cubic meters. In comparison, Beijing has the lowest at just 32,000 cubic meters. The Tobit regression results reveal that economic development and technological progress positively contribute to increased industrial water use efficiency. In contrast, water use intensity, openness, and urbanization levels negatively impacted the improvement of industrial water use efficiency. Therefore, it is necessary to increase investment in technological innovation, strictly control industrial water intensity, appropriately balance import and export trade with urbanization levels, and promote sustainable economic development. This study can provide effective support for the subsequent green transformation of China’s industry.

1. Introduction

China’s total water resources rank sixth in the world, and it is one of the few countries with relatively abundant total water resources globally [1,2,3,4]. However, due to its large population, its per capita water resources are less than one-third of the world’s average [5,6]. The distribution pattern of water resources exacerbates the severe contradiction between water supply and demand in China [7,8]. Balancing economic development with water resource utilization presents a significant challenge for China’s water resource management [9,10]. Meanwhile, the industrial sector of China has experienced rapid development [11,12,13]. This extensive growth is accompanied by rapid consumption of natural resources, especially water resources [14,15]. With the expansion of industrial production and the increasing complexity of industrial processes, the demand for water resources continues to rise, intensifying the supply–demand relationship [11,16]. Additionally, wastewater generated during industrial production also leads to the deterioration of the water environment, reducing the availability of water resources and damaging water ecosystems, further affecting the sustainable utilization of water resources [17]. Improving industrial water use efficiency and promoting industrial water conservation is vital to addressing the current dilemma of water resource supply and demand [9,18].
Improving industrial water use efficiency can be approached from multiple angles, including the improvement of production processes, enhancement of management levels, cultivation of water-saving awareness, and policy incentives and supervision [19,20,21]. The “Water Conservation Regulations”, passed by the State Council of China in 2024, stipulate that “industrial enterprises should strengthen internal water management and establish water conservation management systems” and “encourage established industrial clusters to undertake green, high-quality transformation and recycling-oriented upgrades focusing on water conservation, and accelerate the construction of water conservation and recycling facilities” as methods to improve industrial water use efficiency. However, how to calculate and evaluate industrial water use efficiency, the relationship between influencing factors and industrial water use efficiency, and how much potential for water savings can be generated under current industrial water use conditions remain questions that need further exploration.
The mainstream methods currently used to calculate water use efficiency include the stochastic frontier analysis (SFA) method and the data envelopment analysis (DEA) method [22,23,24,25,26,27,28]. Current research on industrial water use efficiency primarily uses the DEA method. Zhang et al. [13] used the SBM–DEA model to calculate the industrial water use efficiency of 30 provinces in China from 2011 to 2015 and ranked them. Liang and Zhou [29] used the SBM–DEA model to calculate the industrial water use efficiency of 200 cities in China from 2012 to 2016 and found that the average industrial water use efficiency in the country was around 0.5, indicating a significant potential for improvement. However, as a nonparametric approach, the DEA model is susceptible to data changes in decision-making units on the frontier surface and, due to the lack of distinction between error terms, its results lack stability and credibility [25,30].
In contrast, the SFA model calculates efficiency by selecting an appropriate production function. The model also encompasses a comprehensive statistical testing process from initial setup to result analysis, differentiating between management errors and random errors, resulting in higher stability, applicability, and accuracy [31,32]. Moreover, the above studies have mainly focused on industrial water use efficiency for about a ten-year or shorter period, making it difficult to accurately grasp the evolution patterns and inherent mechanisms influencing industrial water use efficiency in China. Therefore, this study employed the SFA model to investigate the temporal and spatial evolution of provincial industrial water use efficiency in China over a longer period and conducted a comprehensive correlation analysis using potential influencing factors. Based on this, the water-saving potential of each province was determined. This is of great significance for China to conduct targeted industrial water management, improve water resource efficiency, and make more optimal resource allocation.

2. Method and Data

2.1. The Stochastic Frontier Analysis Model

This study employs the translog-SFA model to analyze industrial water use efficiency [33,34,35]. The model inputs include the number of industrial employees in each province, the industrial water consumption, and the net value of fixed assets for industries above a designated size. The output data is the industrial-added value. The model calculation formula is as follows:
lnYit = lnf(xit;β;t) + Vit + Uit, which can be expanded as follows:
lnYit = β0 + βslnSit + βllnLit + βwlnWit + βtstlnSit + βtltlnLit + βtwtlnWit +
βsllnSitlnLit + βswlnSitlnWit + βlwlnLitlnWit + ½βsslnSitlnSit + ½βwwln
WitlnWit + ½βlllnLitlnLit + ½βttT2 + VitUit
WUEit = exp(−Uit)
γ = δu2(δu2 + δv2)
In Equation (1), let Yit denote the industrial-added value for province i in year t; Sit represents the net value of fixed industrial assets for province i in year t; Lit is the number of industrial employees; wit is the industrial water consumption. Let T be the time parameter. The β values are the parameters to be estimated and represent the output elasticity coefficient of the input factor. β0 is the intercept term, representing fixed effects that do not change with the variation in production factors. βL is the elasticity coefficient of the logarithm of labor input on output, indicating that, when other conditions are held constant, output will increase by βL% when labor input increases by 1%. βs is the elasticity coefficient of the logarithm of asset input on output, indicating that, when other conditions are held constant, output will increase by βs% when asset input increases by 1%. βts is the coefficient of the cross-term between the logarithm of asset input and time, measuring the substitution or complementary relationship between capital and time. If βts is positive, it indicates a substitution relationship between the two; if it is negative, it indicates a complementary relationship. Referencing the above explanations, the meanings of the other β values can be inferred based on their subscripts; VitUit is the composite error term, where Vit is the symmetric, unbiased random error term representing observational errors and technical changes, and Uit is the non-negative inefficiency term, indicating the distance of the production unit from the frontier. The translog-SFA model is typically estimated using a maximum likelihood estimation (MLE) and assumes specific distributions for the error term Vit and the inefficiency term Uit. Generally, Vit is considered to follow a normal distribution, while Uit is assumed to follow either a single normal distribution or an exponential distribution. In the Equation (2), WUEit represents the industrial water use efficiency of province i in year t. The parameter γ in Equation (3) reflects the proportion of the inefficiency term in the composite error term. The closer the value γ is to 1, the more reasonable the SFA method is.
The software Frontier 4.1, which is a software specifically designed for stochastic frontier analysis, runs the SFA model and measures industrial water use efficiency. The software is primarily used to handle production function forms that include one output variable and multiple input variables in order to measure technical efficiency. The software is capable of estimating the stochastic frontier cost model and the stochastic frontier production model using the maximum likelihood method.

2.2. Tobit Regression Model

Industrial water use efficiency values range between 0 and 1, which are truncated data. Traditional least squares (OLS) regression models often result in efficiency loss and biased estimates when applied to such data [36,37,38]. The Tobit model, however, is designed explicitly for regression analyses with censored or limited dependent variables [39]. This model estimates parameters using the maximum likelihood estimation method, providing high estimation accuracy and reliability. The model formula is as follows:
y* = β’ixia
yi* = yiif yi*>0
yi* = 0 if yi*≤0
In Equation (4), y* is the latent dependent variable, which is observed only when it is greater than 0, taking the value yi. When it is less than 0, it is censored at 0. xi represents the independent variables, β is the coefficient vector, and the error term ui is independent and normally distributed. The Tobit model has been widely applied in fields such as economics, finance, and biostatistics, mainly when dealing with data that has censoring or truncation issues, such as income, education expenditures, and medical expenditures [40,41,42].

2.3. Data Resource

The inputs for the translog-SFA model include capital, labor, and total industrial water consumption for each province from 2003 to 2021, with the output being industrial-added value. Capital is represented by the annual average net value of fixed assets for enterprises above scale, while the number of employees in these enterprises represents labor. To ensure data uniformity, the net value of fixed assets and industrial-added value were converted to 2000 as the base year. These data were obtained from the China Industrial Economy Statistical Yearbook and the Water Resources Bulletin. Missing data were supplemented from provincial statistical yearbooks. In evaluating the regional differences in industrial water use efficiency, referring to the article of Song et al. [5], the 30 provinces in China are divided into three regions, of which the eastern region includes Beijing, Tianjin, Hebei, Liaoning, Shanghai, Jiangsu, Zhejiang, Fujian, Shandong, Guangdong, Guangxi, and Hainan; the western region includes Chongqing, Sichuan, Guizhou, Yunnan, Shaanxi, Gansu, Qinghai, Ningxia, and Xinjiang; the central region comprises Shanxi, Inner Mongolia, Jilin, Heilongjiang, Anhui, Jiangxi, Henan, Hubei, and Hunan. Tibet was not included in this study due to missing data.
Eight indicators, including economic development, water resource endowment, industrial development level, technological development level, industrial water use intensity, openness level, environmental regulation, and urbanization level, were selected as independent variables for the Tobit model. The dependent variable was industrial water use efficiency, with regression analyses performed using Stata software. Economic development is represented by per capita GDP. Higher economic development indicates advanced industrial technology, which is expected to improve industrial water use efficiency. Water resource endowment was measured by per capita water resources; regions with abundant water resources may have weaker water-saving awareness, potentially negatively affecting industrial water use efficiency. The industrial development level is represented by the ratio of industrial-added value to GDP. The technological development level was measured by internal R&D expenditure. Technological advancement can drive the development of water-saving technologies and equipment, likely positively correlating with industrial water use efficiency. The water consumption per unit of industrial-added value measured industrial water use intensity. Lower values indicate higher water use efficiency. The ratio of total imports and exports to GDP represented openness level. The completed industrial pollution control investment ratio to industrial-added value measured environmental regulation. The urbanization level was represented by the ratio of the urban population to the total population.

3. Result and Discussion

3.1. The SFA Model Validation

The parameter estimation of the translog-SFA function is shown in Table 1. All the quadratic interaction terms are statistically significant at the 1% level, and the likelihood values are high, indicating that the trans-log SFA model is applicable for measuring industrial water efficiency. The results also indicate that the parameter γ is 0.997 with high significance, suggesting that 99.7% of the inefficiency stems from technical inefficiency. This implies that the primary sources of inefficiency in water resource usage are low technological levels and poor management practices. Consequently, there is significant potential for improved industrial water use efficiency nationwide.

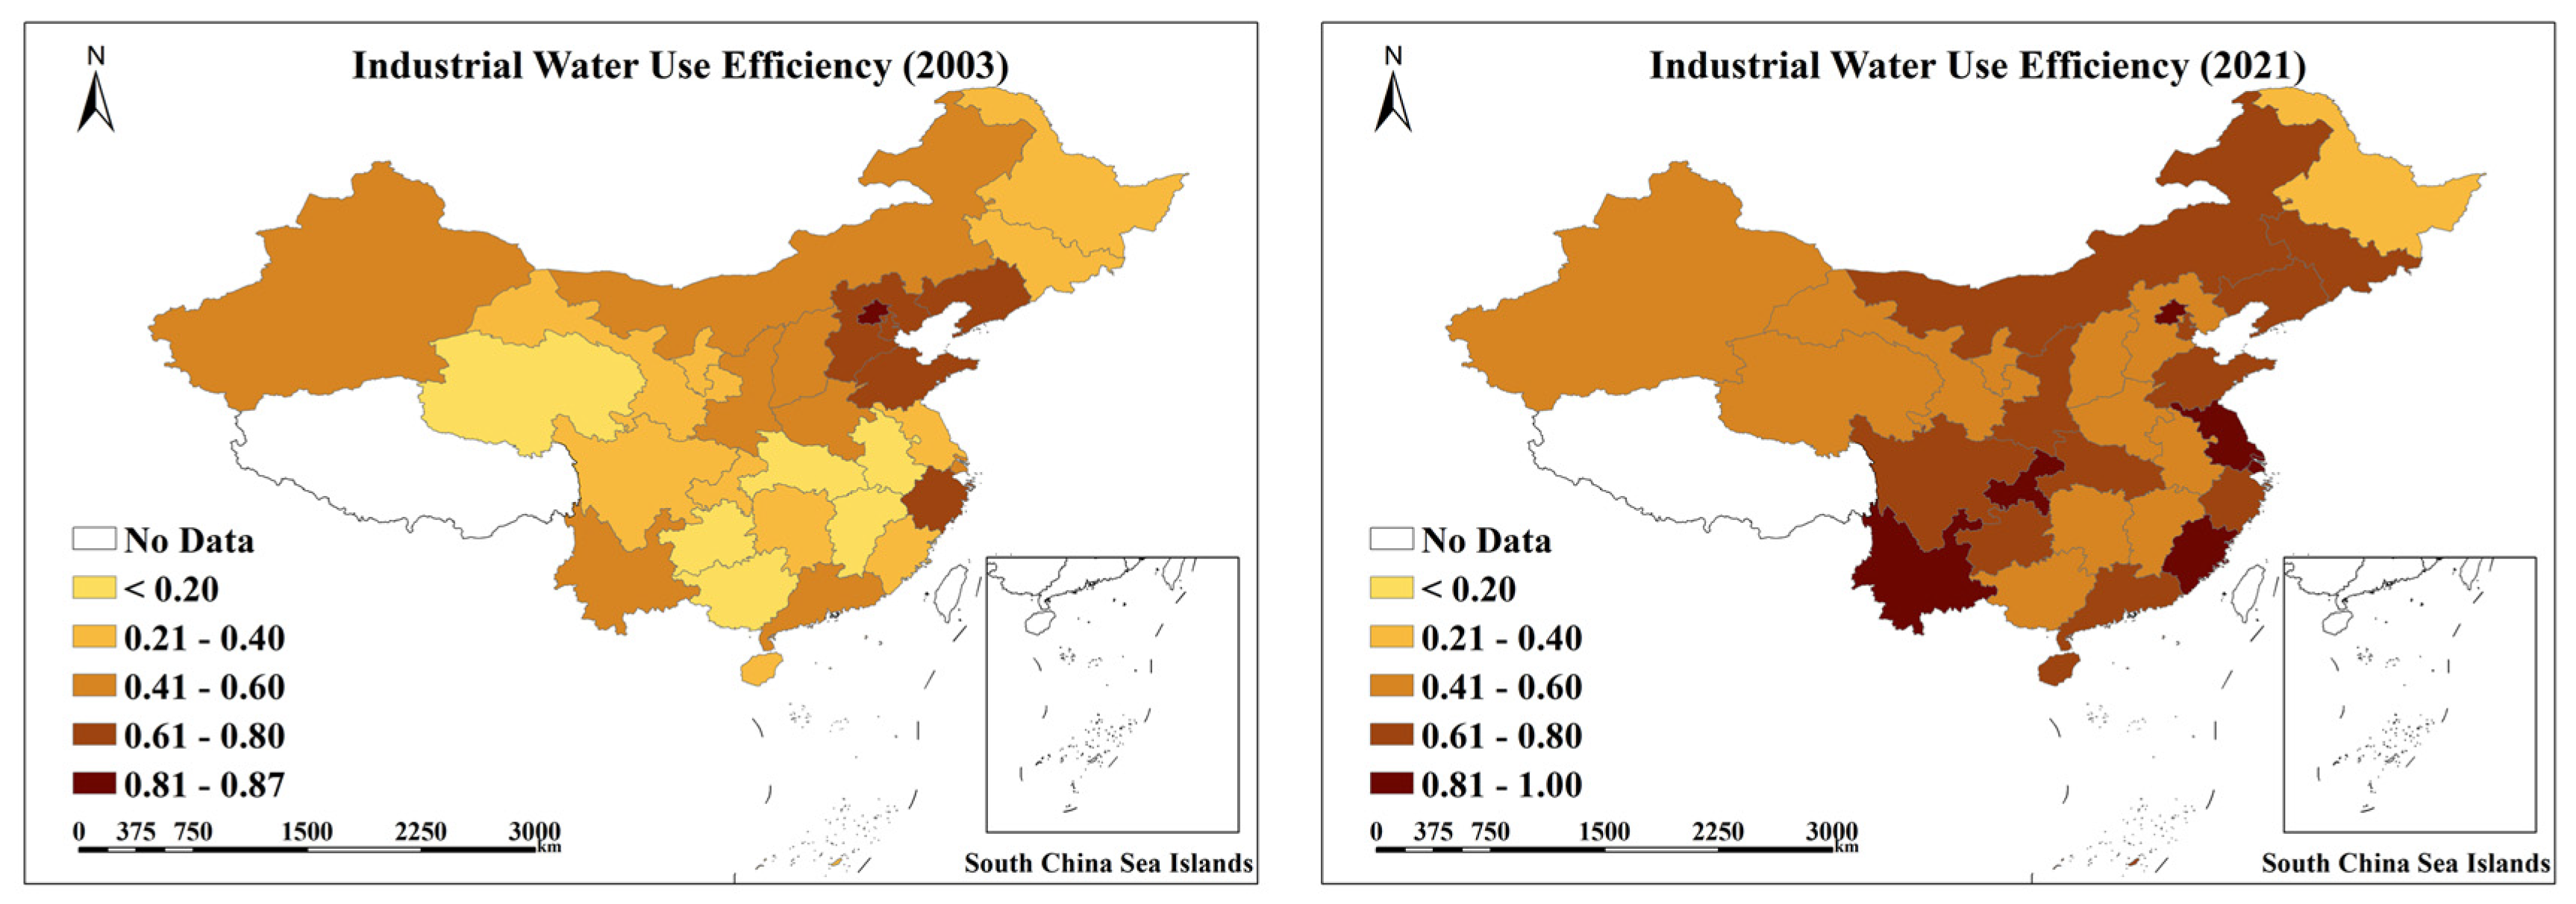
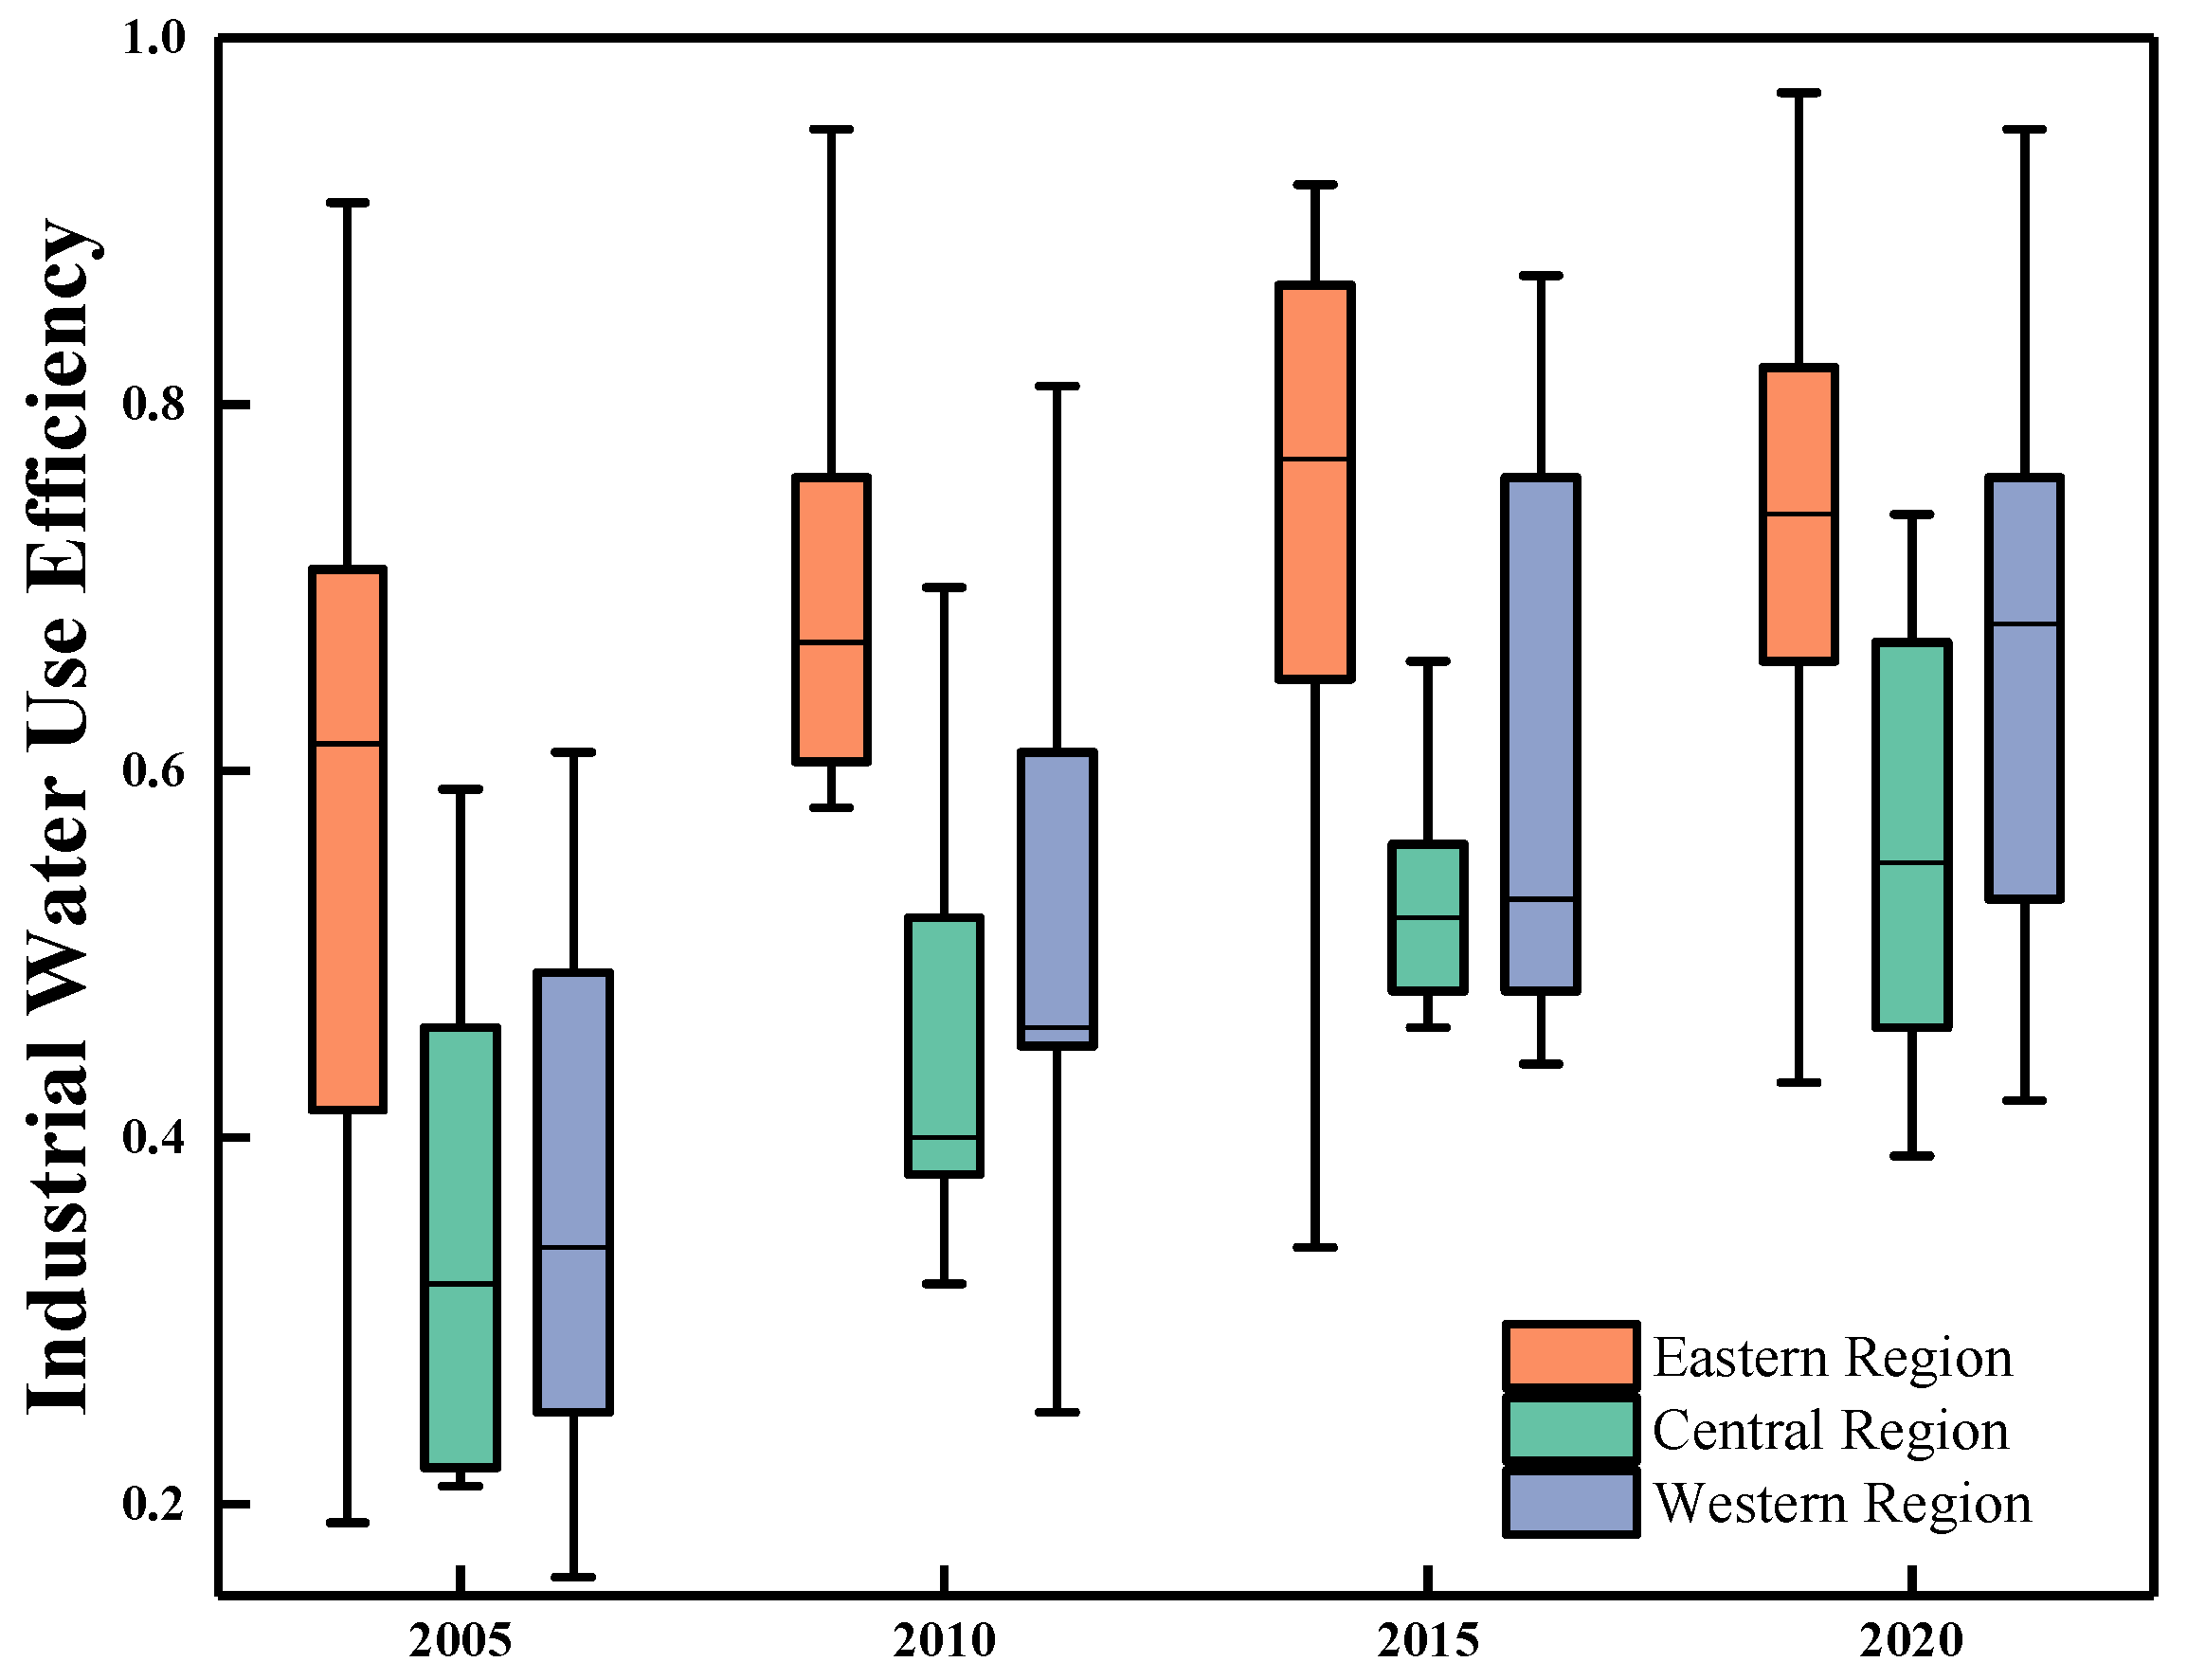
3.2. Industrial Water Use Efficiency Distribution

The multi-year average values of industrial water use efficiency across different provinces are illustrated in Figure 1. The nationwide multi-year average of industrial water use efficiency is 0.575, with most provinces exhibiting low efficiency. Specifically, 34% of provinces have an average industrial water use efficiency below 0.5. Beijing and Tianjin lead the nation in industrial water use efficiency, with values of 0.919 and 0.812, respectively. In contrast, Jiangxi, Qinghai, and Guangxi have the lowest efficiency, with multi-year averages below 0.4. Remarkably, Beijing’s industrial water use efficiency is 2.56 times higher than that of Guangxi. Overall, industrial water use efficiency is higher in developed provinces than in underdeveloped provinces. This disparity is attributed to the more advanced technology and equipment in developed provinces, which are more efficient at conserving water. Additionally, enterprises in developed provinces have more excellent technological innovation and research and development capabilities, further enhancing industrial water use efficiency.
To investigate temporal changes in industrial water use efficiency across various provinces, Figure 2 shows the distribution of industrial water use efficiencies calculated by the SFA model for 2003 and 2021. The corresponding values and changes are listed in Table 2. In 2003, the national average for industrial water use efficiency was 0.41, with 20 provinces having a water use efficiency below 0.5. The eastern region had a water use efficiency of 0.539, which was higher than the western region (0.333) and the central region (0.313). Beijing had the highest water use efficiency (0.87), followed by Liaoning (0.75) and Tianjin (0.73). By 2021, the national average for industrial water use efficiency had significantly increased to 0.65, and the eastern region continued to lead in water use efficiency. The western region saw substantial improvements, with provinces like Chongqing and Guizhou increasing by 0.49 compared to 2003. In the central region, provinces with previously low water use efficiency, such as Hubei, Jilin, and Anhui, also experienced significant improvements by 2021. In contrast, the eastern region, which already had relatively high water use efficiency, saw smaller increases due to the higher baseline. The industrial water use efficiency values for 2003 and 2021, along with their changes, are shown in Table 2.
China generally adopts a five-year cycle for the formulation and implementation of socio-economic development plans, which are known as the Five-Year Plans. The Five-Year Plans are important guiding documents for China’s national economic and social development, covering a wide range of objectives and tasks in areas such as economic development, social undertaking, ecological civilization, and reform and opening up. Therefore, Figure 3 presents box plots of regional industrial water use efficiency at the end of the ninth to twelfth Five-Year Plans. Overall, the industrial water use efficiency across regions has significantly improved over time. The eastern region’s industrial water use efficiency has consistently been much higher than that of the western and central regions, but the disparities between regions have been narrowing. From 2005 to 2015, the central region experienced a rapid increase in industrial water use efficiency, which slowed between 2015 and 2020. In contrast, the western region saw significant efficiency improvements during 2005–2010 and 2015–2020. Some provinces experienced a decline in industrial water use efficiency in 2020 compared to 2015. This decline could be attributed to the COVID-19 pandemic in 2019, which disrupted industrial production and prevented full recovery, thereby affecting the increase in industrial efficiency.
The industrial water efficiency values are grouped so that those less than 0.3 are considered inefficient, those between 0.3 and 0.6 have poor efficiency, those between 0.6 and 0.8 have medium efficiency, and those greater than 0.8 are considered efficient. Figure 4 consists of two subplots that, respectively, display the number of provinces with industrial water use efficiency values in each subgroup and the mean industrial water use efficiency for each group as well as the national average. In 2003, there were twelve provinces with inefficient industrial water use efficiency, eight with poor efficiency, nine with medium efficiency, and only one with high efficiency. The number of provinces with an inefficient industrial water use efficiency in 2011 and the following years was zero, and the water use efficiency of all provinces improved synchronously. The number of poor efficiency provinces increased steadily from 2003 to 2013. This gradually decreased after 2014, indicating that the value of water use efficiency gradually shifted to medium and high efficiency after switching from ineffective to poor efficiency. The number of medium- and high-efficiency provinces first increases steadily and then fluctuates around eight and sixteen, respectively. In 2020, the maximum number of medium-efficiency provinces was 19. In 2019, the maximum number of high-efficiency provinces was nine, and then both declined, a phenomenon related to the unscheduled shutdowns of some enterprises due to the new crown epidemic. The nation’s industrial water use efficiency was at a high rate of improvement between 2003 and 2012, with a growth rate of 0.024/year, and this high rate of growth was related to China’s rapid industrial development. After 2013, the growth rate slowed, reaching 0.008/year in 2019. This is because, in 2012, the 18th party congress, for the first time, prioritized ecological civilization in their “five in one” layout. National policy and construction planning positively responded to this, paying more attention to the protection of the environment and, therefore, to a certain extent, limited the development of the industrial sector, which in turn affected the growth of industrial water efficiency. Among the mean efficiency values of the groups, the mean industrial water use efficiency of the inefficient and low-efficiency groups continues to rise, while the medium and high efficiency groups are mainly reflected in the increase of the provinces, all indicating the overall improvement of China’s industrial water use efficiency.

3.3. Water-Saving Potential and Tobit Regression

Based on the above analysis, it is evident that there is still room for improvement in industrial water use efficiency across various regions, indicating the potential for water savings in the industrial sector. Considering the definition of industrial water use efficiency and referencing Liu et al. [20] for the calculation of water-saving potential, the formula for calculating industrial water-saving potential is as follows:
Wis = Wi*(1 − Ei)
In Formula (5), Wis represents the industrial water-saving potential for province i, Wi denotes the industrial water consumption for province i, and Ei signifies the industrial water use efficiency for province i.
Based on the above formula, the water-saving potential for each province in 2021 was calculated, and the results were depicted in a bar chart, as shown in Figure 5. The total industrial water-saving potential nationwide was 31.306 billion cubic meters. Among the 30 provinces, 27 had a water-saving potential exceeding 100 million cubic meters. Jiangsu, Anhui, and Hunan had the highest water-saving potentials, with 3.709 billion, 3.671 billion, and 2.930 billion cubic meters, respectively. Although Jiangsu’s industrial water use efficiency has significantly improved in recent years, reaching 0.852 in 2021, the total industrial water consumption in Jiangsu was 25.02 billion cubic meters that year. Therefore, despite a relatively high water use efficiency, there is still considerable room for water-saving. Anhui and Hunan had relatively lower industrial water use efficiencies, thus also presenting significant water-saving potentials. Beijing’s water use efficiency reached 0.999 in 2021, resulting in a water-saving potential of only 32,000 cubic meters. Hainan’s industrial water consumption in 2021 was merely 150 million cubic meters, leading to a relatively small water-saving potential of 4.981 million cubic meters.
The above analysis indicates significant spatial and temporal differences in industrial water use efficiency. Therefore, it is necessary to explore influencing factors to make better water-saving management decisions. We performed collinearity analyses on the influencing factors and determined that all influencing factors’ variance inflation factor values were less than 5, with an average value of 2.34, proving no severe collinearity between independent variables. A Tobit model was used for regression analysis; the results are shown in Table 3. Economic development and technological progress passed the 1% significance level test and were positively correlated with industrial water use efficiency. This indicates that these two factors contributed to improving industrial water use efficiency. Economic growth enables enterprises to invest in advanced water-saving technologies and equipment, leading to more reasonable management and, thus, improving water use efficiency. Similar results were found in the study by Liang and Zhou [29]. Technological progress can drive the development of water-saving technologies and equipment, thereby increasing water utilization rates in the industrial production process and reducing ineffective and wasteful water use.
Additionally, technological development can bring more advanced data management and analysis, allowing enterprises to monitor and optimize water resource use more accurately, thereby enhancing water use efficiency. Water resource endowment and environmental regulation negatively correlate with industrial water use efficiency but did not pass the significance test. The relationship between water resource endowment and water use efficiency varies in different studies. For example, in the study by Chen et al. [15], water resource endowment is significantly negatively correlated with water use efficiency. However, in the study by Cheng et al. [43], the negative correlation between water resource endowment and water use efficiency is insignificant in the eastern and central regions, indicating regional heterogeneity. Generally, in regions with abundant water resources, high availability and low water prices may lead to a lack of water-saving awareness among enterprises. Environmental regulations impose constraints on industrial production, negatively impacting water use efficiency. Industrialization level is positively correlated with industrial water use efficiency but did not pass the significance test. The process of industrialization is accompanied by more advanced production technologies and more efficient production processes. However, China still needs to achieve a high degree of industrial concentration, and the industrial layout is relatively dispersed. If the continuous progress of industrialization does not lead to concentration and the formation of a corresponding water resource allocation system, water use efficiency may be affected. Industrial water intensity, urbanization level, and openness are negatively correlated with industrial water use efficiency and are significant at 1%, 1%, and 5%, respectively. Industrial water intensity is measured by water consumption per unit of industrial-added value. This indicator is also a commonly used representation of single-factor productivity. The smaller the value, the higher the industrial water use efficiency, thus showing a negative correlation. Openness might positively promote industrial water use efficiency because it can stimulate economic development and facilitate the introduction of advanced technologies. However, the negative correlation could be due to China’s export-oriented economy, which leans towards water-intensive industries. To meet international market demands, these industries may neglect improvements in water use efficiency. Moreover, to maintain global competitiveness, enterprises might focus more on reducing costs and increasing output rather than investing in water-saving measures, leading to declining water resource efficiency.
Few studies have examined the relationship between urbanization rate and industrial water use efficiency. In the study by Cheng et al. [43], the urbanization rate positively correlated with water resource utilization efficiency. However, this water resource efficiency included production, domestic, and ecological water use efficiency. Generally, urbanization is accompanied by the concentration of industrial activities, and the construction of industrial zones and parks may increase total industrial water use. However, in the short term, water use efficiency may only improve somewhat.

4. Conclusions and Policy Implication

4.1. Conclusions

Efficient water resource utilization is fundamental to the sustainable development of the industrial sector and is the ultimate goal of various water-saving initiatives. To investigate China’s industrial water resource utilization level and analyze its potential water-saving drivers, this study employed a translog-SFA model to calculate the industrial water use efficiency of 30 provinces in China. The findings reveal that the national average industrial water use efficiency increased from 0.41 in 2003 to 0.65 in 2021. The eastern region outperformed the western region regarding water use efficiency, with the central region having the lowest efficiency. However, the western region showed the most significant improvement in overall water use efficiency, and the regional disparities gradually narrowed. Industrial water use efficiency is divided into four groups: inefficient, poor efficiency, medium efficiency, and high efficiency, and was analyzed nationally. The results show that China’s industrial water use efficiency was in a stage of high-speed improvement from 2003 to 2012, and that the increase slowed down after 2013. Inefficient provinces gradually converted to poor efficiency, while the number of poor efficiency provinces also experienced a process of increasing and then decreasing. Finally, medium-efficiency and high-efficiency provinces accounted for the majority of provinces in the country.
Based on the calculated industrial water use efficiency and total industrial water use for each province in 2021, the national water-saving potential is estimated to be 31.306 billion cubic meters. Among the provinces, 27 have a water-saving potential exceeding 1 billion cubic meters, with Jiangsu, Anhui, and Hunan having the highest potential. In contrast, Beijing has the highest industrial water use efficiency, resulting in a minimal water-saving potential of only 32,000 cubic meters. Using a Tobit regression model, the study found that economic development level and technological progress significantly improved industrial water use efficiency. Conversely, water intensity, openness, and urbanization negatively affected industrial water use efficiency. Water resource endowment and environmental regulation were negatively correlated but not significantly, while industrialization level showed a non-significant, positive correlation with industrial water use efficiency.

4.2. Political Implications

China’s industrial WUE increased from 0.41 in 2003 to 0.65 in 2021. This significant upward trend provides multiple insights that can serve as effective references for the sustainable development of industrial water use in China and other developing countries. The results of the Tobit regression indicate that economic development and technological advancement are key drivers for improving WUE. Therefore, future efforts should focus on enhancing economic development, increasing investment in research and development, and adopting new technologies to achieve technological progress. Water intensity negatively impacts WUE, so it is necessary to strictly implement the “Three Red Lines” policy, enforce stringent regulatory measures, and establish strict water resource protection regulations. Additionally, financial incentives should be provided to industries to invest in water-saving technologies and practices. Balancing the proportion of import and export trade with internal economic development is crucial. It is important to reduce the proportion of high water-consuming industries in foreign trade to avoid water use pressure and environmental pollution caused by excessive foreign trade. Differences in industrial water use efficiencies led to significant variations in water-saving potential across different regions. High-potential areas should be identified, and efforts should be concentrated where they can have the most impact. Specific guidance policies and investment decisions should be proposed to address the unique challenges and opportunities of different regions. Moreover, it is recommended to develop benchmarks and indicators for monitoring improvements in industrial water use efficiency and to conduct regular assessments and audits to evaluate the effectiveness of implemented measures and make necessary adjustments.

Author Contributions

H.L. (Han Liu) and H.L. (Heng Liu) conceived and designed the study; H.L. (Han Liu), H.L. (Heng Liu) and L.G. collected the data and carried out the investigation; H.L. (Han Liu) analyzed the data and wrote the paper, with the assistance of H.L. (Heng Liu) and L.G. All authors have read and agreed to the published version of the manuscript.

Funding

This work was supported by the National Key Research and Development Program of China (Grant No. 2022YFC3202401).

Institutional Review Board Statement

Not applicable.

Informed Consent Statement

Not applicable.

Data Availability Statement

Data are available from the First author upon reasonable request.

Conflicts of Interest

The authors declare no conflict of interest.

References

  1. Wang, W.; Ren, L.; Deng, C.; Wang, Q.; Yu, J. The water-saving management contract in China: Current status, existing problems, and countermeasure suggestions. Water 2022, 14, 3116. [Google Scholar] [CrossRef]
  2. Xu, R.; Wu, Y.; Wang, G.; Zhang, X.; Wu, W.; Xu, Z. Evaluation of industrial water use efficiency considering pollutant discharge in China. PLoS ONE 2019, 14, 0221363. [Google Scholar] [CrossRef] [PubMed]
  3. Zhang, W.; Du, X.; Huang, A.; Yin, H. Analysis and comprehensive evaluation of water use efficiency in China. Water 2019, 11, 2620. [Google Scholar] [CrossRef]
  4. Yang, G.; Yang, D. Industrial water-use efficiency in China: Regional heterogeneity and incentives identification. J. Clean. Prod. 2020, 258, 120828. [Google Scholar] [CrossRef]
  5. Song, M.; Wang, R.; Zeng, X. Water resources utilization efficiency and influence factors under environmental restrictions. J. Clean. Prod. 2018, 184, 611–621. [Google Scholar] [CrossRef]
  6. Wu, W.; Zhu, F.; Zeng, W.; Wang, M.; Yang, D.; Chen, W. Green efficiency of water resources in Northwest China: Spatial-temporal heterogeneity and convergence trends. J. Clean. Prod. 2021, 320, 128651. [Google Scholar] [CrossRef]
  7. Deng, M. “Three Water Lines” strategy: Its spatial patterns and effects on water resources allocation in northwest China. Acta Geogr. Sin. 2018, 73, 1189–1203. [Google Scholar] [CrossRef]
  8. Zeng, H.; Zhang, T.; Zhou, Z.; Zhao, Y.; Chen, X. Water disclosure and firm risk: Empirical evidence from highly water-sensitive industries in China. Bus. Strategy Environ. 2020, 29, 17–38. [Google Scholar] [CrossRef]
  9. Chen, Y.; Yin, G.; Liu, K. Regional differences in the industrial water use efficiency of China: The spatial spillover effect and relevant factors. Resour. Conserv. Recycl. 2021, 167, 105239. [Google Scholar] [CrossRef]
  10. Sun, B.; Yang, X.; Zhang, Y.; Chen, X. Evaluation of Water Use Efficiency of 31 Provinces and Municipalities in China Using Multi-Level Entropy Weight Method Synthesized Indexes and Data Envelopment Analysis. Sustainability 2019, 11, 4556. [Google Scholar] [CrossRef]
  11. Cheng, L.; Song, S.; Xie, Y. Evaluation of water resources utilization efficiency in Guangdong Province based on the DEA–Malmquist model. Front. Environ. Sci. 2022, 10, 819693. [Google Scholar] [CrossRef]
  12. Li, N.; Wei, Y.; Wang, L.; Zeng, C.; Ma, X.; Wu, H. Impact of industrialization on water protection in the Huai River Basin within Shandong Province, China. Nat. Hazards 2016, 81, 1193–1207. [Google Scholar] [CrossRef]
  13. Zhang, R.; Lu, C.; Lee, J.; Feng, Y.; Chiu, Y. Dynamic Environmental Efficiency Assessment of Industrial Water Pollution. Sustainability 2019, 11, 3053. [Google Scholar] [CrossRef]
  14. Wang, Q.; Yang, Z. Industrial water pollution, water environment treatment, and health risks in China. Environ. Pollut. 2016, 218, 358–365. [Google Scholar] [CrossRef] [PubMed]
  15. Yang, G.; Yang, D. Investigating industrial water-use efficiency in mainland China: An improved SBM-DEA model. J. Environ. Manag. 2020, 270, 110859. [Google Scholar] [CrossRef]
  16. Ali, H.; Guellil, M.; Mokhtari, F.; Tsabet, A. The effect of subsidies on technical efficiency of Algerian agricultural sector: Using stochastic frontier model (SFA). Discov. Sustain. 2024, 5, 98. [Google Scholar] [CrossRef]
  17. Shi, C.; Miao, X.; Zhang, L.; Chiu, Y.; Zeng, Q.; Zhang, C. Spatial patterns of industrial water efficiency and influencing factors—Based on dynamic two-stage DDF recycling model and geographically weighted regression model. J. Clean. Prod. 2022, 374, 134028. [Google Scholar] [CrossRef]
  18. Dan, S. Theories and Practices of China’s Industrial Green Development: Policy Options for Deepening the Green Development. Contemp. Financ. Econ. 2018, 01, 183. [Google Scholar]
  19. Cai, Z.; Li, H. Spatio-Temporal Differences in Relative Efficiency of Water Resource Utilization in Liaoning Province. Resour. Sci. 2008, 30, 1442–1448. [Google Scholar]
  20. Liu, X.; Peng, D. Green efficiency of industrial water resourece in China and its influencing factors: Empirical evidence from China’s 30 provinces. Appl. Ecol. Environ. Res. 2020, 18, 3057–3072. [Google Scholar] [CrossRef]
  21. Sun, Y.; Liu, N.; Shang, J.; Zhang, J. Sustainable utilization of water resources in China: A system dynamics model. J. Clean. Prod. 2016, 142, 613–625. [Google Scholar] [CrossRef]
  22. Daraio, C.; Léopold, S. Advanced Robust and Nonparametric Methods in Efficiency Analysis; Springer: Berlin/Heidelberg, Germany, 2007. [Google Scholar]
  23. Geng, Q.; Ren, Q.; Nolan, R.; Wu, P.; Yu, Q. Assessing China’s agricultural water use efficiency in a green-blue water perspective: A study based on data envelopment analysis. Ecol. Indic. 2019, 96, 329–335. [Google Scholar] [CrossRef]
  24. Hjalmarsson, L.; Kumbhakar, S.; Heshmati, A. DEA, DFA and SFA: A comparison. J. Product. Anal. 1996, 7, 303–327. [Google Scholar] [CrossRef]
  25. Lampe, H.; Hilgers, D. Trajectories of efficiency measurement: A bibliometric analysis of DEA and SFA. Eur. J. Oper. Res. 2015, 240, 1–21. [Google Scholar] [CrossRef]
  26. Moutinho, V.; Madaleno, M.; Macedo, P.; Robaina, M.; Marques, C. Efficiency in the European agricultural sector: Environment and resources. Environ. Sci. Pollut. Res. 2018, 25, 17927–17941. [Google Scholar] [CrossRef]
  27. Xu, R.; Cai, Y.; Wang, X.; Li, C.; Liu, Q.; Yang, Z. Agricultural nitrogen flow in a reservoir watershed and its implications for water pollution mitigation. J. Clean. Prod. 2020, 267, 9–10. [Google Scholar] [CrossRef]
  28. Yu, S.; Lu, H. An integrated model of water resources optimization allocation based on projection pursuit model—Grey Wolf Optimization method in a transboundary river basin. J. Hydrol. 2018, 559, 156–165. [Google Scholar] [CrossRef]
  29. Liang, X.; Zhou, Z. Technical efficiency measurement of urban industrial water: A case study of cities in China. Manag. Environ. Qual. 2022, 33, 1046–1060. [Google Scholar] [CrossRef]
  30. Suarez-Fernandez, S.; Quiroga-Garcia, R.; Manzano-Perez, I. A Comparison of DEA and SFA Approaches: Application to the US Non-Life Insurance Market. Appl. Econ. J. 2021, 28, 107–127. [Google Scholar] [CrossRef]
  31. Battese, G.; Coelli, T. Frontier production functions, technical efficiency and panel data: With application to paddy farmers in India. J. Product. Anal. 1992, 3, 153–169. [Google Scholar] [CrossRef]
  32. Xiong, L.; Wang, F.; Cheng, B.; Wu, C. Identifying factors influencing the forestry production efficiency in Northwest China. Resour. Conserv. Recycl. 2018, 130, 12–19. [Google Scholar] [CrossRef]
  33. Battese, G.; Coelli, T. A model for technical inefficiency effects in a stochastic frontier production function for panel data. Empir. Econ. 1995, 20, 325–332. [Google Scholar] [CrossRef]
  34. Battese, G.; Corra, G. Estimation of a production frontier model: With application to the pastoral zone of eastern Australia. Aust. J. Agric. Econ. 2012, 21, 169–179. [Google Scholar] [CrossRef]
  35. Krljan, T.; Grbi, A.; Hess, S.; Grubisic, N. The Stochastic Frontier Model for Technical Efficiency Estimation of Interconnected Container Terminals. J. Mar. Sci. Eng. 2021, 9, 515. [Google Scholar] [CrossRef]
  36. Craven, B.; Islam, S. Ordinary least-squares regression. In The SAGE Dictionary of Quantitative Management Research, 1st ed.; Sage Publications: New York, NY, USA, 2011; pp. 224–228. [Google Scholar]
  37. Dempster, A.; Schatzoff, M.; Wermuth, N. A simulation study of alternatives to ordinary least squares. J. Am. Stat. Assoc. 1977, 72, 77–91. [Google Scholar] [CrossRef]
  38. Vinod, H. A survey of ridge regression and related techniques for improvements over ordinary least squares. Rev. Econ. Stat. 1978, 60, 121–131. [Google Scholar] [CrossRef]
  39. Chib, S. Bayes inference in the Tobit censored regression model. J. Econom. 1992, 51, 79–99. [Google Scholar] [CrossRef]
  40. Kirjavainen, T.; Loikkanent, H. Efficiency Differences of Finnish Senior Secondary Schools: An Application of DEA and Tobit Analysis. Econ. Educ. Rev. 1996, 17, 377–394. [Google Scholar] [CrossRef]
  41. Masuda, K. Trade Policy and the Marshall–Lerner Condition: Application of the Tobit Model. SocArXiv 2021. [Google Scholar] [CrossRef]
  42. Yue, Y. Bayesian Tobit quantile regression model for medical expenditure panel survey data. Stat. Model. Appl. Contemp. Issues 2012, 12, 323–346. [Google Scholar] [CrossRef]
  43. Cheng, Z.; He, J.; Liu, Y.; Zhang, Q.; Deng, Y. Exploring the spatial structure and impact factors of water use efficiency in China. Environ. Impact Assess. Rev. 2023, 103, 107258. [Google Scholar] [CrossRef]
Figure 1. Distribution of average industrial water use efficiency.
Sustainability 16 08708 g001
Figure 2. Distribution of industrial water use efficiency in 2003 and 2021.
Sustainability 16 08708 g002
Figure 3. A box diagram of regional industrial water use efficiency.
Sustainability 16 08708 g003
Figure 4. The left subplot shows the number of provinces in each group, and the right subplot depicts the mean industrial water use efficiency within each group.
Sustainability 16 08708 g004
Figure 5. Industrial water-saving potential of each province in 2021.
Sustainability 16 08708 g005
Table 1. Parameter estimates of the translog-SFA production function.
VariableCoefficientStd ErrVariableCoefficientStd Err
β013.1 ***1.004βsl−0.540 ***0.063
βs−11.430 ***0.638βsw0.152 ***0.038
βl13.849 ***0.880βtw−0.550 ***0.052
βw−5.898 ***0.778βss0.609 ***0.067
βt0.974 ***0.132βww0.483 ***0.039
βts−0.035 ***0.008βll0.871 ***0.088
βtl0.054 ***0.007βtt0.004 ***0.001
βtw−0.037 ***0.003γ0.997 ***0.005
δ20.01940.0018LR−test620.32
Log-likelihood352.17
Note: *** represent significance levels at 1%.
Table 2. Industrial water use efficiency and its relative change between 2003 and 2021.
ProvinceMean20032021ChangeProvinceMean20032021Change
Beijing/BJ0.9190.8700.9990.129Henan/HA0.5940.5260.487−0.039
Tianjin/TJ0.8120.7270.7750.048Hubei/HB0.4940.1930.6980.505
Hebei/HB0.7050.6260.587−0.039Hunan/HN0.4130.2080.5280.320
Shanxi/SX0.5140.4570.441−0.016Guangdong/GD0.7720.5230.7420.218
Inner Mongolia IM/NM0.5830.4870.7270.240Guangxi/GX0.3060.1960.4460.250
Liaoning/LN0.6660.7520.611−0.141Hainan/HI0.6090.2630.6680.405
Jilin/JL0.4770.2690.7100.441Chongqing/CQ0.5910.3370.8250.488
Heilongjiang/HL0.3780.3240.3870.063Sichuan/SC0.6260.2880.7300.442
Shanghai/SH0.7250.4040.9400.536Guizhou/GZ0.3870.1630.6570.495
Jiangsu/JS0.6110.3850.8520.466Yunnan/YN0.6820.4850.9670.482
Zhejiang/ZJ0.7510.6460.623−0.023Shaanxi/SX0.7690.5130.7040.191
Anhui/AH0.3930.1810.5530.372Gansu/GS0.4420.2290.5220.294
Fujian/FJ0.6630.3460.8410.495Qinghai/QH0.3710.1760.5120.335
Jiangxi/JX0.3740.1730.4860.313Ningxia/NX0.4260.2690.4340.165
Shangdong/SD0.7060.7240.7240.000Xinjiang/XJ0.5030.5350.444−0.092
Table 3. The regression results of the Tobit panel model.
VariableCoefficientStd ErrT Valuep Value
Constant0.629 ***0.07009.030.000
Economic Development Level0.000 ***0.00005.010.000
Water Resource Endowment0.0000.0000−1.150.250
Industrialization Level0.0770.09200.840.399
Technology Progress Level2.934 ***1.07362.770.006
Water Use Intensity−0.001 ***0.0001−16.130.000
Openness Level−0.084 ***0.0284−2.940.003
Environmental Regulation−1.3771.1888−1.160.247
Urbanization Level−0.203 **0.0971−2.090.036
Log-likelihood629.978
Note: ***, ** represent significance levels at 1%, 5% respectively.
Disclaimer/Publisher’s Note: The statements, opinions and data contained in all publications are solely those of the individual author(s) and contributor(s) and not of MDPI and/or the editor(s). MDPI and/or the editor(s) disclaim responsibility for any injury to people or property resulting from any ideas, methods, instructions or products referred to in the content.

