Article

Internalizing External Accident Costs in Safety Investment Evaluation Using Cost–Benefit Analysis

by
Christina Nikolova
Department of Economics of Transport and Energy, Faculty of Economics of Infrastructure, University of National and World Economy, 1700 Sofia, Bulgaria
Sustainability 2024, 16(19), 8717; https://doi.org/10.3390/su16198717
Submission received: 11 August 2024 / Revised: 7 October 2024 / Accepted: 8 October 2024 / Published: 9 October 2024
(This article belongs to the Collection Sustainable Transport Economics, Behaviour and Policy)

Abstract

:
The primary objectives of transportation system development in European countries include improving transport efficiency, enhancing national economic competitiveness, and promoting sustainable mobility. A key aspect of achieving these goals is the evaluation of transport externalities, particularly external accident costs, which is critical for ensuring the economic and social sustainability of road transport development. This study comprehensively evaluates external road accident costs and proposes an innovative approach to internalizing these costs through a cost–benefit analysis (CBA). By integrating these external costs into CBA, policymakers can better understand the societal impact of road safety investments, allowing for more informed decisions regarding measures to reduce road accidents and fatalities. This paper also explores the role of specific safety investments, such as installing vehicle restrain systems (VRS), buffers, and terminals on the national road network, as well as installing speed cameras, in reducing accidents and mitigating external costs. The findings highlight road safety measures’ importance in enhancing economic efficiency and social well-being, providing a solid foundation for the sustainable and efficient development of transportation systems.

1. Introduction

Road safety is of utmost importance and significantly impacts people’s daily lives. Swift action is necessary to minimize traffic accidents and prevent loss of life. Achieving this objective requires comprehensively examining the situation and implementing policies prioritizing safe roads. Integral to this analysis is evaluating the socio-economic effects of road accidents on society [1]. By internalizing the external costs stemming from road traffic accidents (RTAs), society can gain insight into the expenses incurred due to the current state of road safety [2]. This understanding justifies the need for effective measures to reduce accidents and fatalities, leading to the sustainable and efficient development of the transport system.
Developing transportation infrastructure initiatives is vital for fostering sustainable growth and enhancing regional connectivity. However, it is crucial to carefully weigh the merits and drawbacks of such projects, particularly concerning road safety and environmental preservation. To underscore the societal benefits, carrying out an economic assessment of the impact of road safety investments in constructing and maintaining road infrastructure is essential [3].
While many countries, especially in the OECD, have developed methodologies for estimating road accident costs, this study offers new insights by reflecting recent changes in economic parameters, inflation, or the cost of healthcare that have not been factored into previous estimates. So, it provides updated estimates that reflect the current economic context. Furthermore, advances in econometrics allow for more accurate estimation of accident costs, and this study highlights how these new techniques refine previous estimates by using cost–benefit analysis. On the other hand, traditional studies often focus on direct costs (medical costs, vehicle repair, etc.) [4,5]. Still, these studies emphasize indirect costs (loss of productivity, long-term disability, etc.) or intangible costs (pain, suffering, loss of quality of life).
Internalizing external costs involves integrating these costs into the decision-making process, such that they are reflected in the pricing of goods and services. Based on that, this study provides a novel approach by applying cost–benefit analysis to evaluate safety investments in a more granular or region-specific context [6]. It shows how internalizing these costs could lead to different decisions than those made under current policies. The study assesses how internalizing costs might affect different socioeconomic groups, potentially advocating for policies that balance efficiency with fairness. Furthermore, it accentuates the long-term effects of internalizing accident costs, such as the impact on overall economic growth and transport investment planning.
This article emphasizes the importance of economic evaluation of the external costs caused by road accidents. It highlights the need to identify the benefits of investing in projects to improve road safety and reduce accidents. This article stresses the importance of using cost–benefit analysis to determine whether such initiatives are feasible. By doing so, it aims to encourage policymakers to take a more proactive approach toward road safety and prioritize investments that benefit society [7]. Investing in road safety can yield substantial economic and social benefits. It is essential to developing a sustainable transport strategy and achieving multiple objectives [8]. Improving road safety can reduce the expenses linked with road accidents and external transportation costs. Furthermore, it can foster greater collaboration and coordination in road safety initiatives.
This article is structured as follows: Section 2 provides a detailed review of the existing literature on external accident costs and the theoretical framework for their evaluation. It highlights key studies and methodologies that form the basis of the current research. Section 3 outlines the methodology used in this study, including the data sources, the process of estimating external accident costs, and the rationale behind selecting specific parameters and indices. Section 4 presents the results of the analysis, with a focus on the marginal external accident costs by vehicle type and the adjustments made for national differences using PPP GDP per capita and HICP indices. Section 5 discusses the implications of these findings for road safety investments, with particular attention to the cost–benefit analysis of installing vehicle restraint systems, speed cameras, and other safety measures. Finally, Section 6 concludes the paper by summarizing the study’s main contributions and offering policy recommendations for internalizing external accident costs in transport investment decisions.

2. Objectives and Cost Categories in Road Safety Impact Assessment

The road safety assessment considers transportation’s economic and social implications, particularly road transport, in achieving the Sustainable Development Goals [9]. These goals include the following:
  • Safety and personal security: it is crucial to assess the impact of transport on people’s quality of life in terms of their safety and security.
  • Accessibility for persons with disabilities: this goal aims to ensure that people with disabilities can access various activities and services, leading to their personal satisfaction and well-being.
  • Impact on human health: this goal evaluates the effect of transport on people’s quality of life and health.
  • Social inclusion: transport can reduce social inequalities and provide access to work, education, healthcare, and other public services.
  • Equal opportunities and fair treatment of customers and staff: administrative authorities and transport operators should treat customers equally and avoid discrimination against their staff.
Assessing road safety’s economic and social impacts on society involves using indicators organized by specific impact areas [10]. These areas include access to goods and services, with indicators measuring transportation safety, security, and comfort. Improved transport services ensure personal safety, reduce transport accidents, and minimize threats to public health. They also protect passengers’ rights, ensure access to transportation for remote areas, and provide convenient transportation solutions for individuals with reduced mobility. Transport infrastructure is about guaranteeing equal access for all road users.
On the other hand, the promotion of public transport, cycling, and walking focuses on providing a safer and more secure urban and suburban environment. It aims to reduce congestion and transportation emissions and ensure a positive impact on people’s lives, health, and well-being. The economic assessment of transportation impacts, particularly road safety, necessitates using appropriate methodologies.
Road safety entails two categories of costs. The first involves costs associated with injuries and fatalities from road accidents, such as medical costs, loss of productivity, and the financial impact on affected families. The second set includes property damage, administrative expenses, and other costs that are not covered by insurance but are funded by society through budgetary allocations. It is, therefore, crucial to identify and define the relevant costs of road traffic accidents for a comprehensive economic evaluation of road safety’s external costs.
The costs related to loss of life and disability include the following categories:
  • Medical expenses: this covers emergency care, transportation to the hospital, first aid, hospital treatment, outpatient procedures, rehabilitation, assistive devices, and other medical costs.
  • Loss of output to society: this includes the costs of lost production, non-market activities, and frictional costs such as hiring and training replacement workers.
  • Costs related to loss of life and injuries in traffic accidents: this encompasses the loss of quality of life in severe injuries, as well as expenses for the families of the victims.
The second set of external accident costs accounts for the following cost categories:
  • Material costs refer to expenses for property damage compensation, vehicle repair and purchase, road repair, and compensation for damaged property.
  • Administrative costs: this includes expenses for traffic police activities, fire safety and road accident assistance, insurance claims, and legal and administrative expenses.
  • Other costs: this category covers time losses in traffic jams due to accidents, vehicle replacement costs, travel expenses for hospital visits, and costs related to adapting the home for the specific needs of the victims.
The extensive research carried out as part of the Safety Cube project at the European level [11] reveals that only a portion of the costs associated with traffic accidents is covered through insurance premiums. The remaining costs are borne by society, leading to budgetary and personal expenses across different societal systems. The societal external costs resulting from traffic accidents are as follows: 50% of the medical expenses for treating accident victims, 55% of the lost productive output due to accidents, 100% of the impact on the lives of the victim’s families and relatives, 30% of administrative costs such as those incurred by the police, fire protection, insurance, legal, and administrative expenses related to traffic accidents. Material costs are expected to be covered by third-party liability and third-party insurance. Other costs, such as those of induced congestion, are assessed separately under another category of external costs.

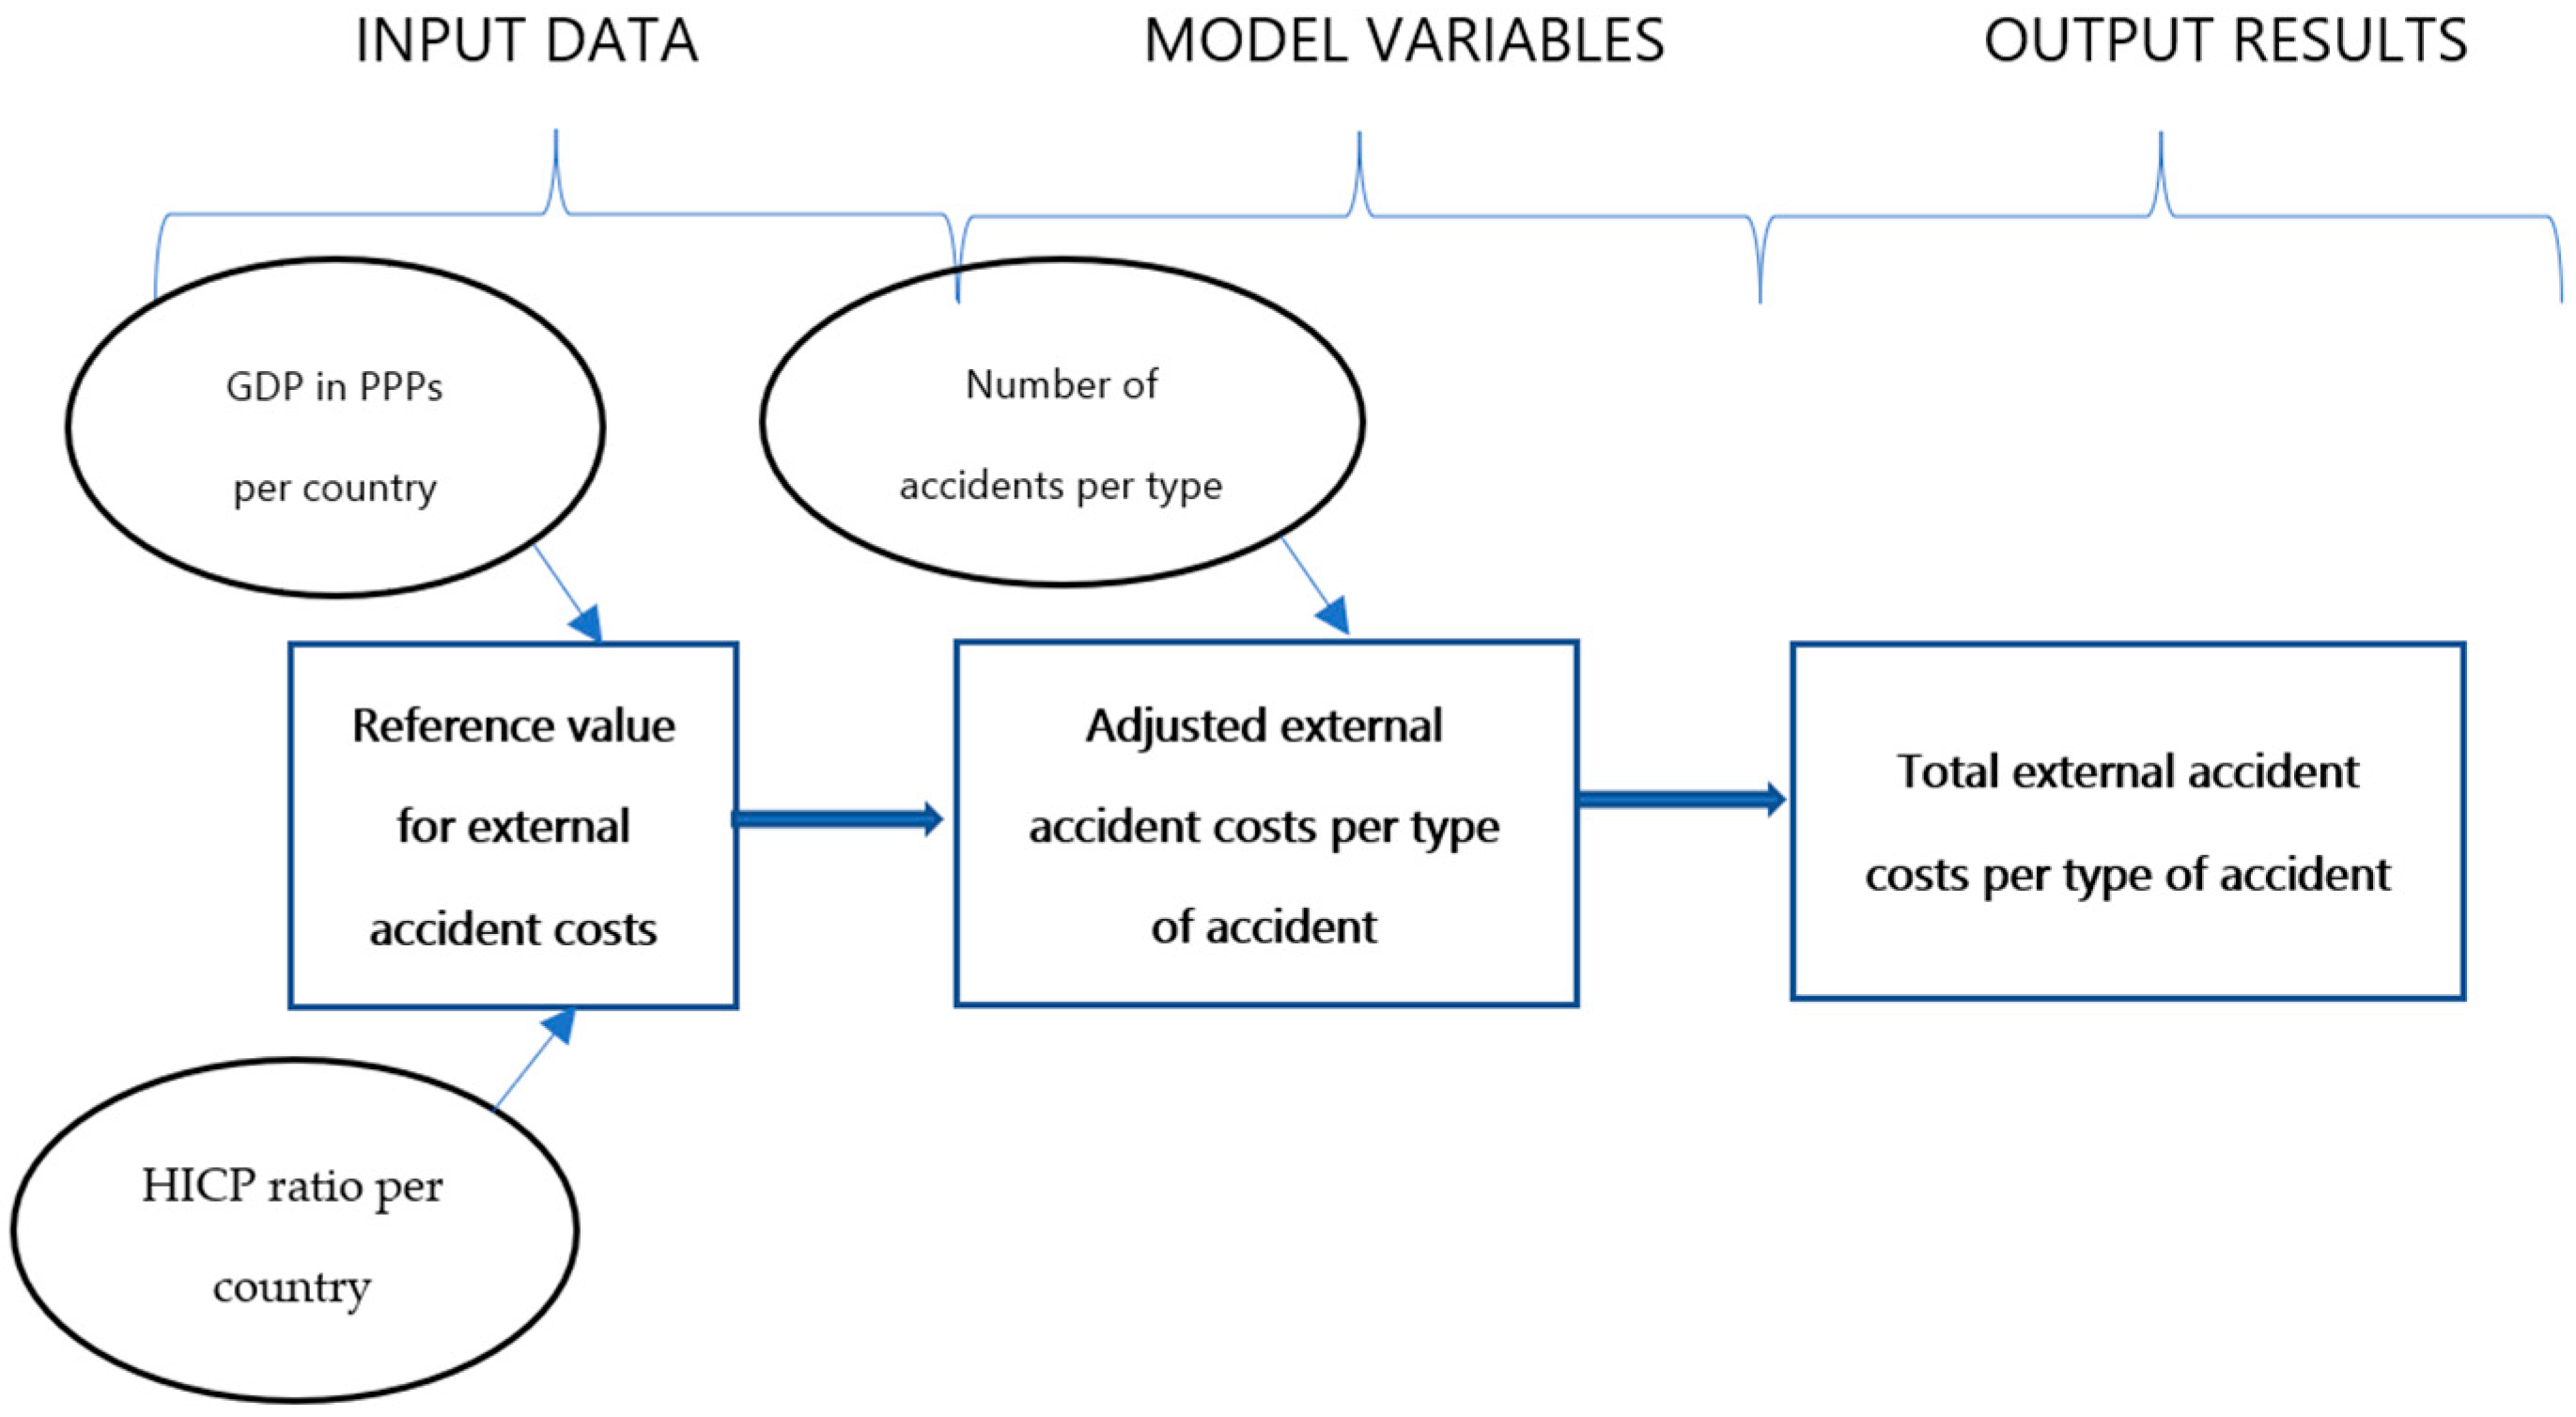
3. Evaluating the External Accident Costs in Bulgaria

The costs of accidents are a significant concern in the transportation industry [10]. These costs can vary greatly depending on the number of people killed or injured in accidents, as well as the cost of human life and property damage. The value of human life is typically assessed using human capital calculations to determine the losses or reduced production resulting from the damage caused. Additionally, it is possible to evaluate the willingness of people to pay extra for transportation in situations with greater risk. When calculating accident costs, we need to consider the value of human life, damage to people and property, and production losses due to employee absence. The cost of damage covers direct (medical expenses, victim transport, etc.), indirect (loss of production), and subjective (pain and suffering) costs. It is difficult to determine how much of these costs are covered by transport insurance [11]. Additionally, these external costs are influenced by traffic volume, vehicle flow, and driving speeds.
The total external costs of accidents can be calculated using a transferring tool based on econometric studies as recommended in the Handbook on the External Costs of Transport [12]. However, it is essential to consider detailed data on various indicators for specific types of accidents. The obtained reference values should not be directly applied. Instead, they should be adjusted based on the year of calculation and respective economic indicators accounting for the change in economic conditions. The overall workflow of the model, including input data, model variables, and output, is presented in Figure 1 below.
To evaluate the economic impact of the national-level road safety, a step-by-step approach is used to calculate the economic impact of road safety on the national level, as follows:
(1)
To determine the average external costs of road safety in Bulgaria, the number of individuals killed or injured in road accidents across the country must be considered. This information is presented in Figure 2, Figure 3 and Figure 4 and follows the approaches developed at a European level.
(2)
Based on existing research at the European level and the recommendations of the Handbook for the Assessment of External Costs in Transport, with the latest update in 2019 [12], the following assumptions are applied when assessing the external costs of road safety in the country:
  • The average value of human life (VHL) in Bulgaria is estimated at EUR 1.55 million (as of 2016);
  • the average value of the damage caused by severe injuries—13% of the VHL;
  • average value of damages for minor injuries—1% of the VHL;
  • average of direct and indirect costs (medical costs, productivity losses, administrative costs, etc.)—10% of the VHL
These assumptions form the basis of the cost estimate of the external accident costs in Bulgaria. The harmonized consumer price index is considered to account for changes in these costs over time by using the following formula:
T C a c c = R V × K H I C P   2023 H I C P   2016
where TCacc represents the total average external accident costs per type of accident, RV—reference values for the respective accident costs chosen from the Handbook on the external costs of transport (recommended on the European level for 2016), K H I C P   2023 H I C P   2016 —the coefficient for harmonized indices of consumer prices (HICP) for 2023 relative to 2016.
The calculations provide values for estimating the external costs incurred per injured person and type of accident, as presented in Table 1.
(3)
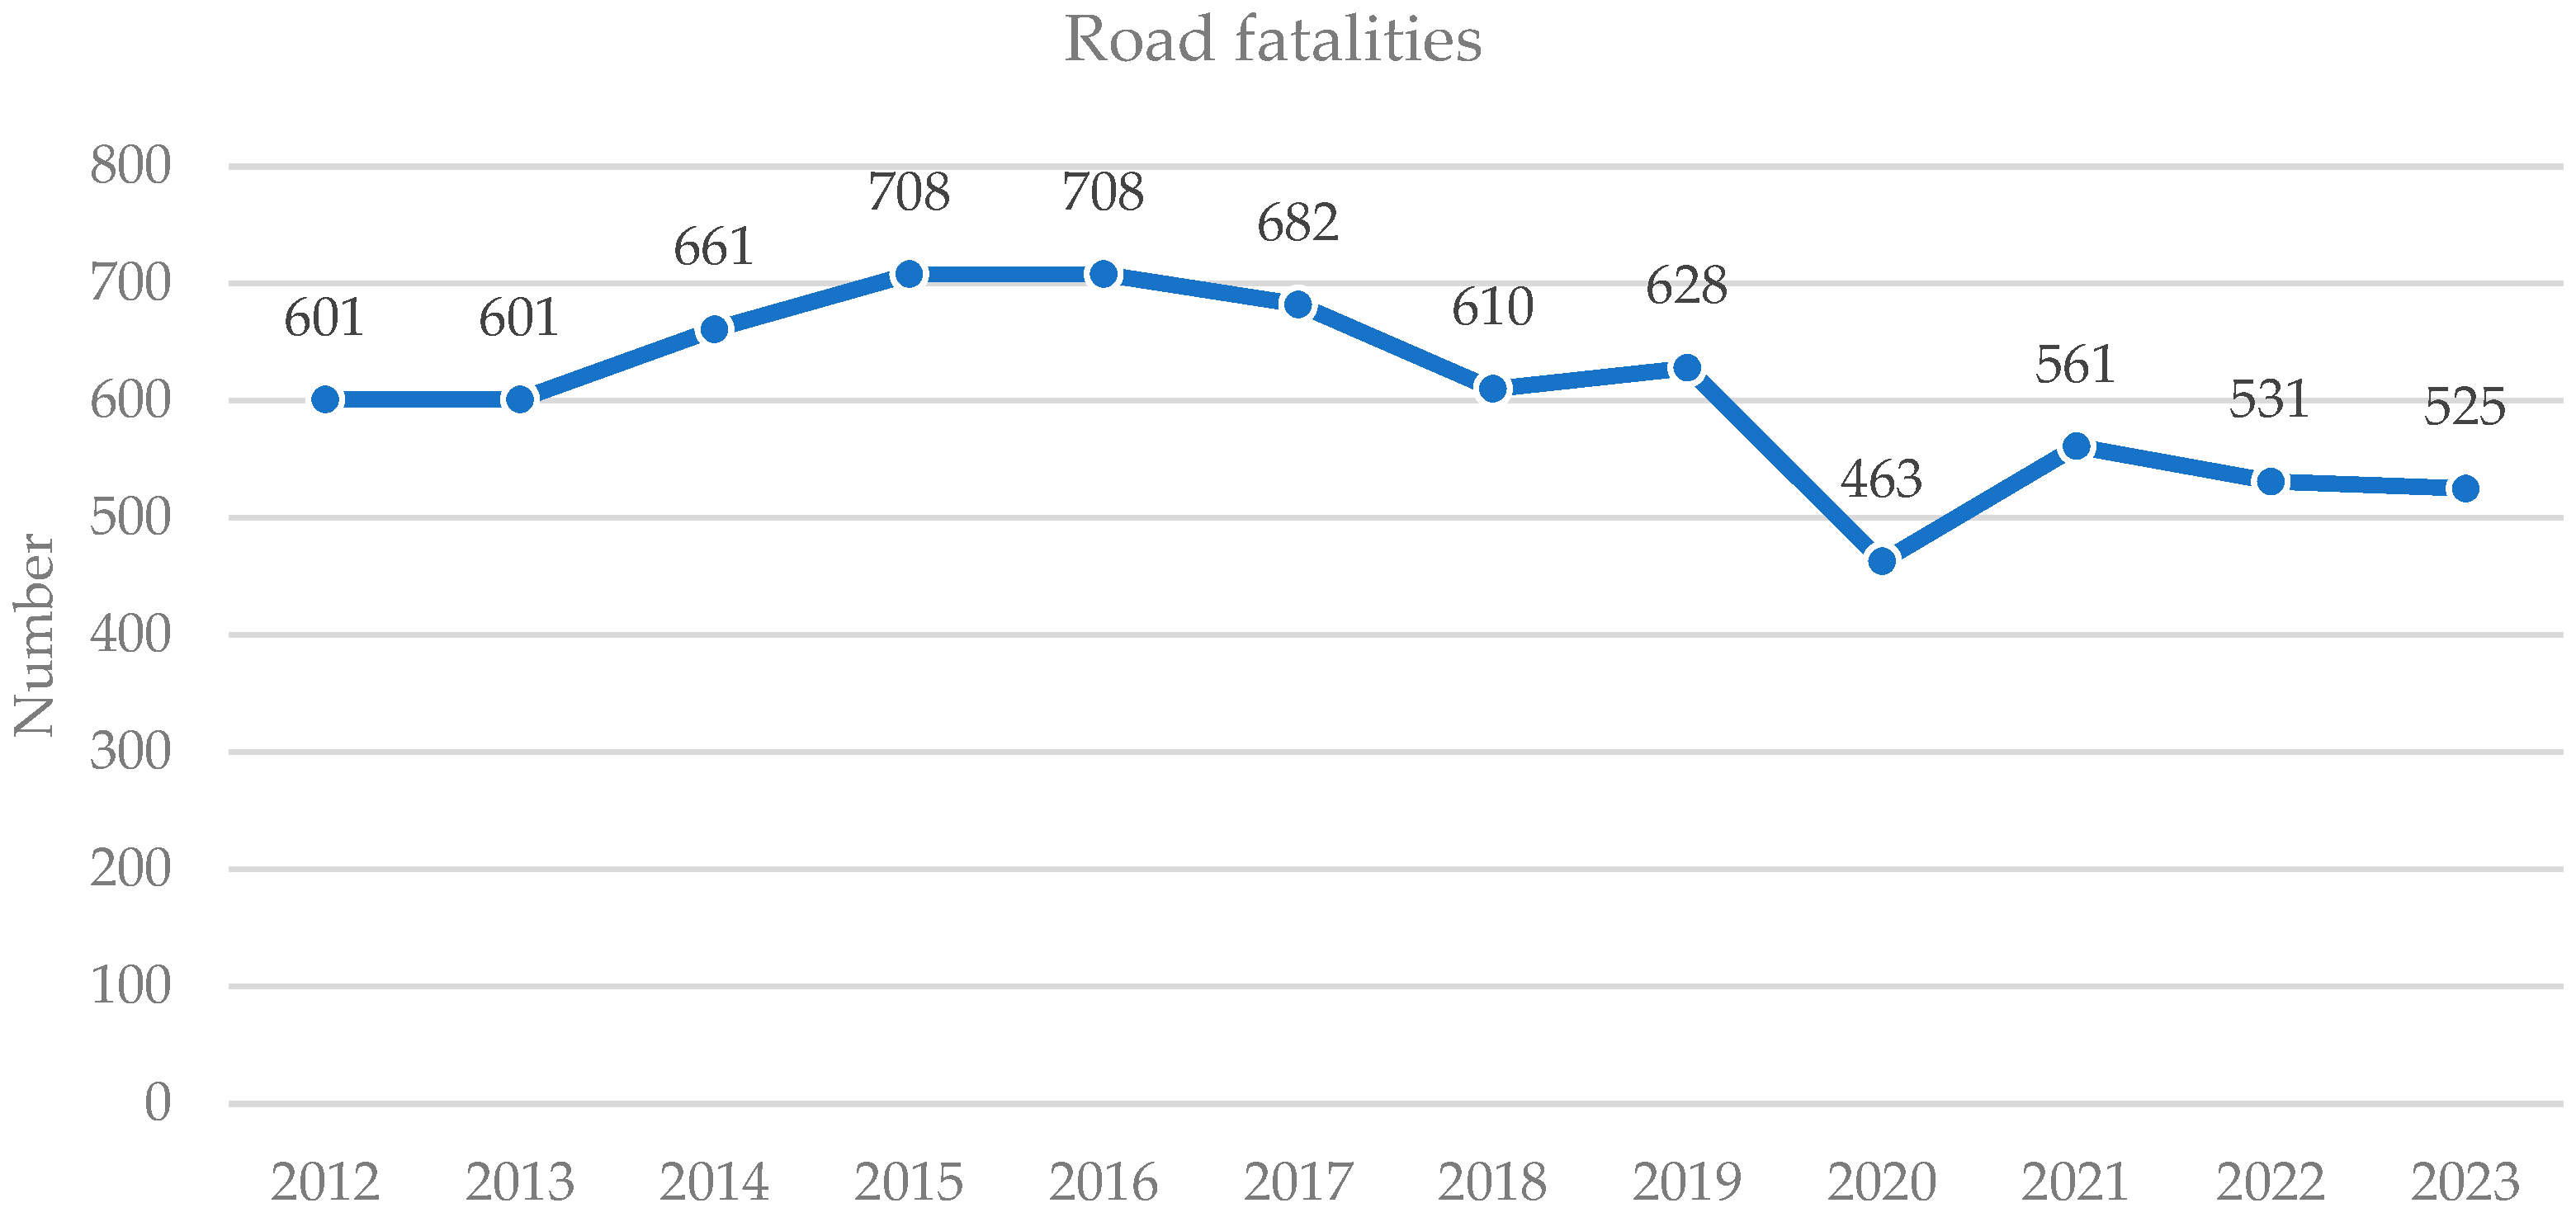
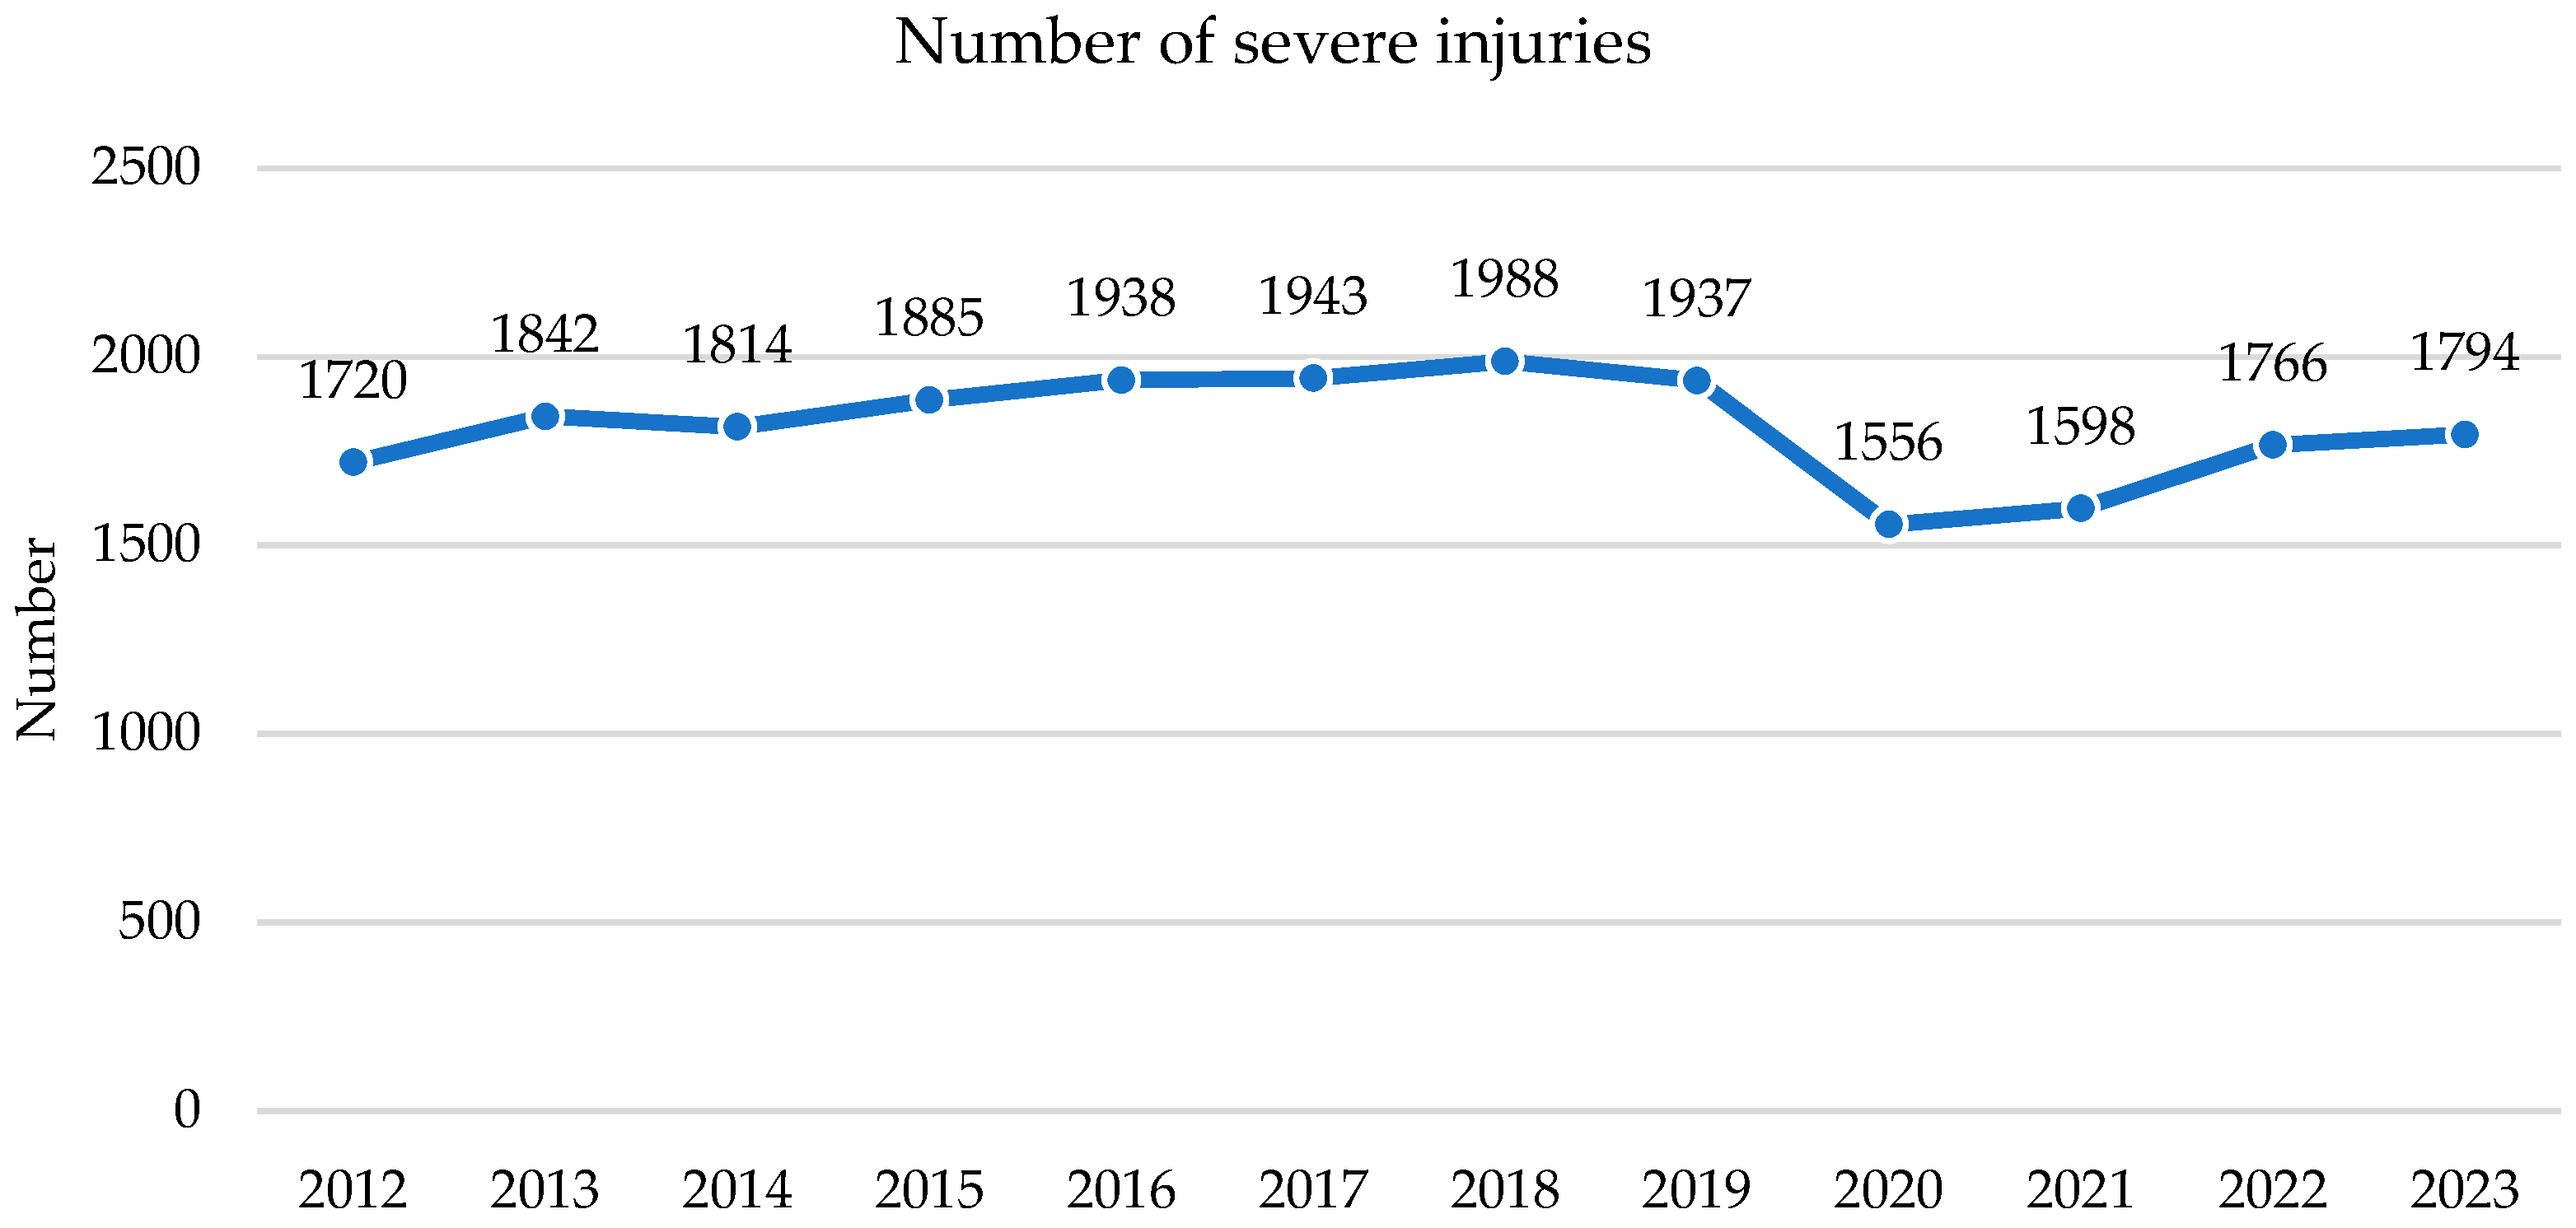
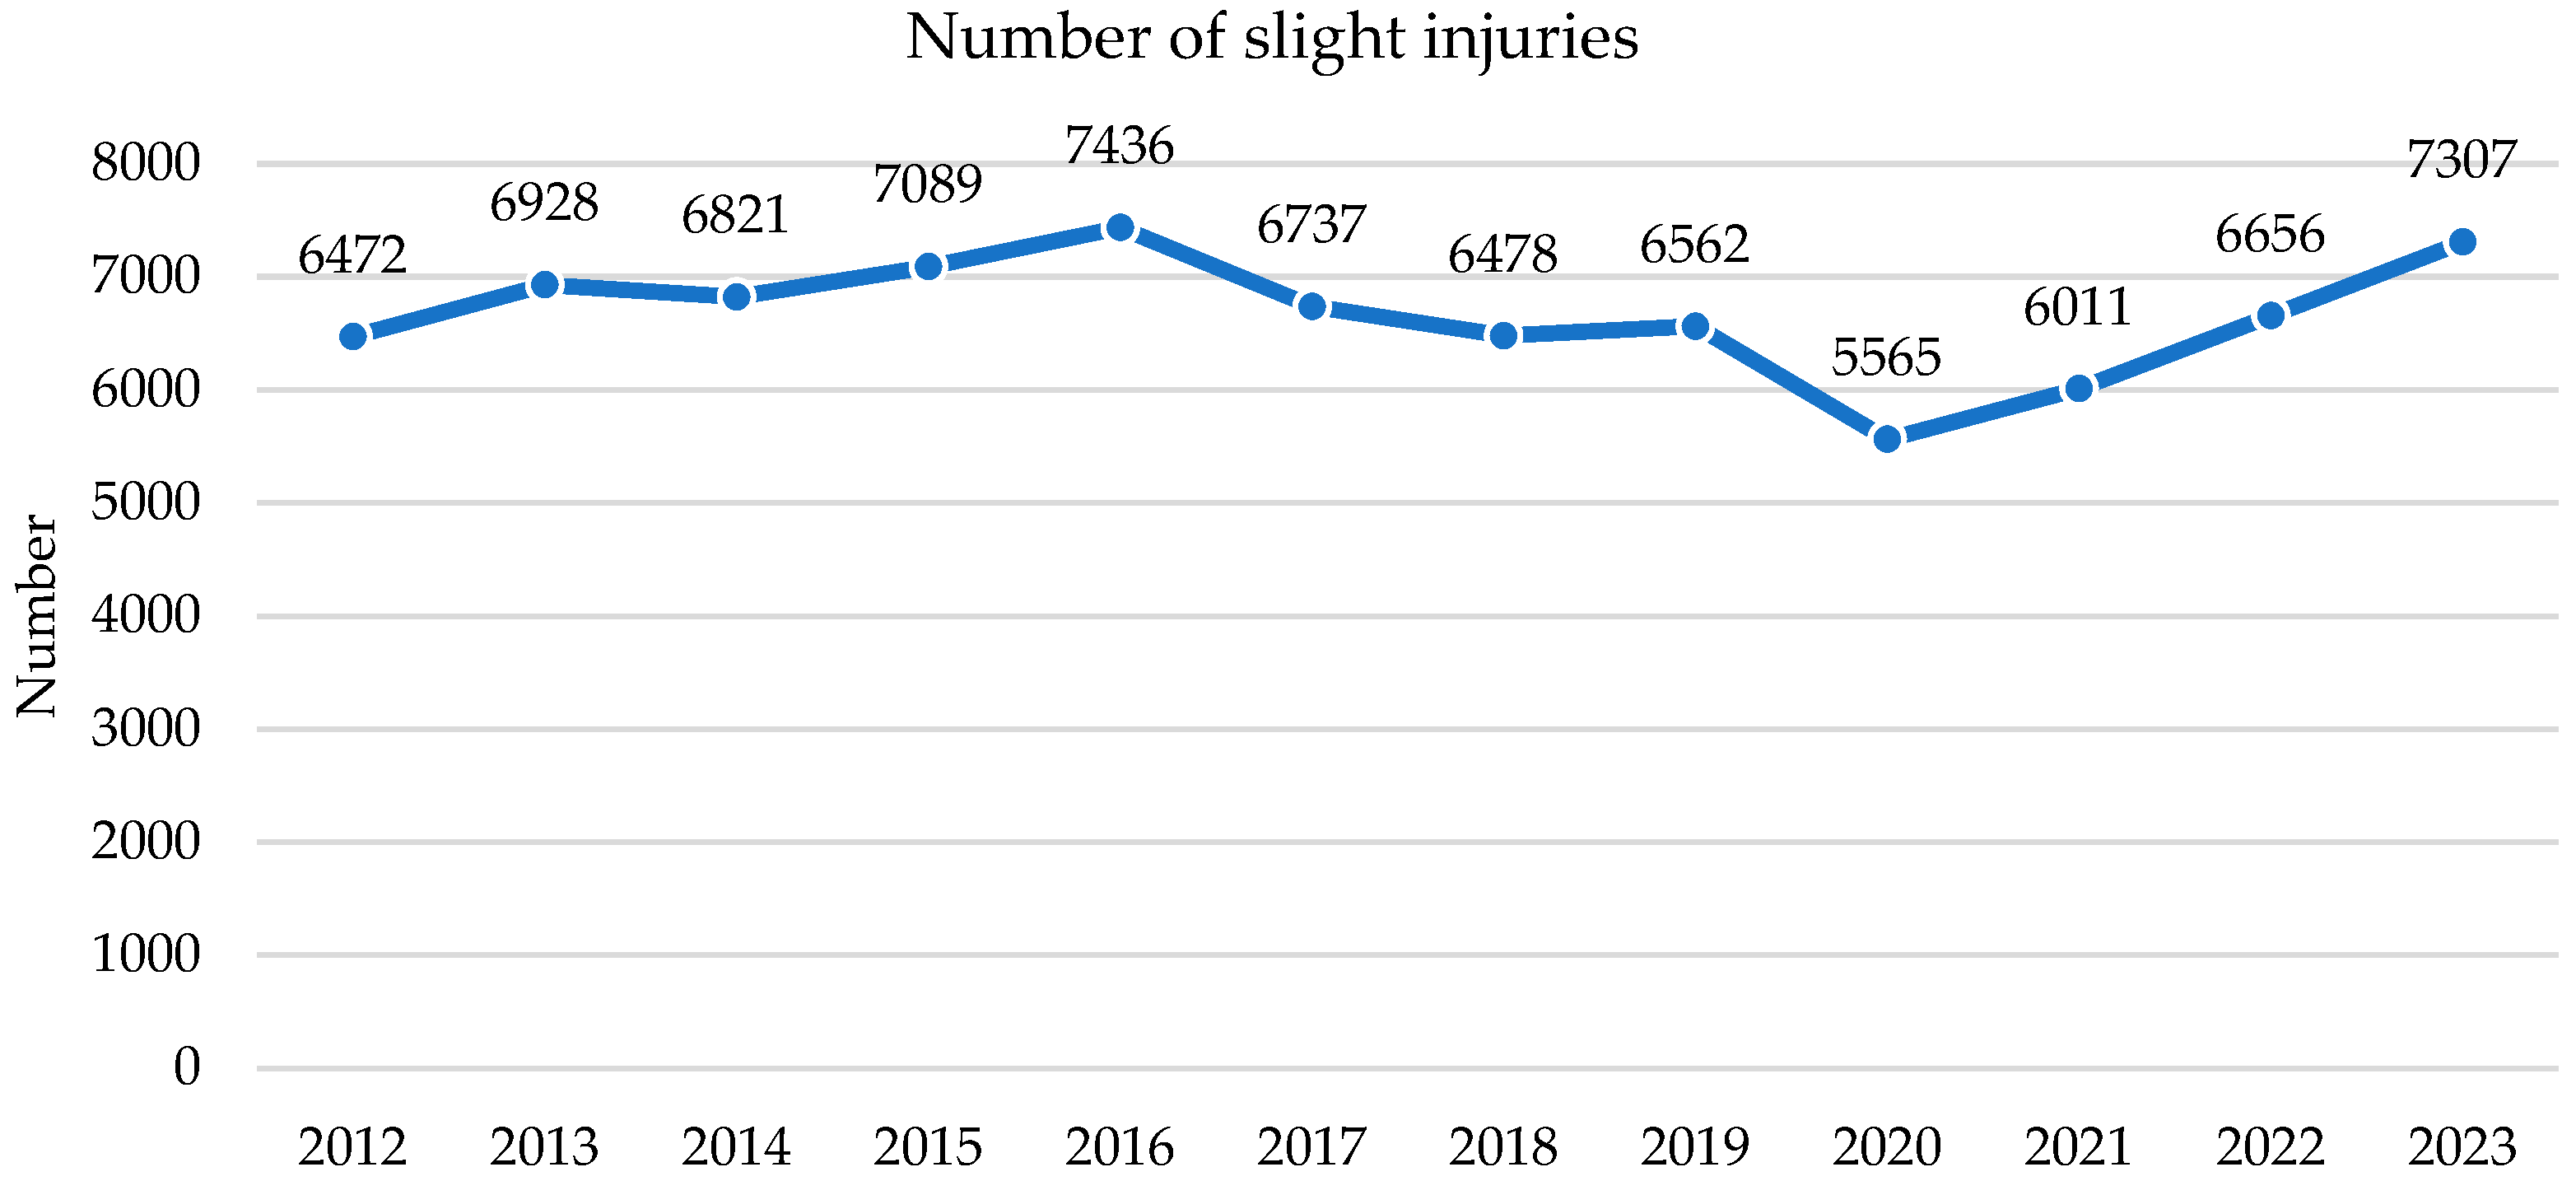
Based on the methodology explained earlier, the total external costs resulting from severe and slight injuries in road traffic accidents amount to EUR 5.756 billion and EUR 2.049 billion, respectively, from 2012 to 2023. Furthermore, the total external cost caused by loss of life in road traffic accidents during the same period is EUR 12.861 billion, as shown in Figure 5. Therefore, the overall external costs of road traffic accidents during this period amount to EUR 20.666 billion.
(4)
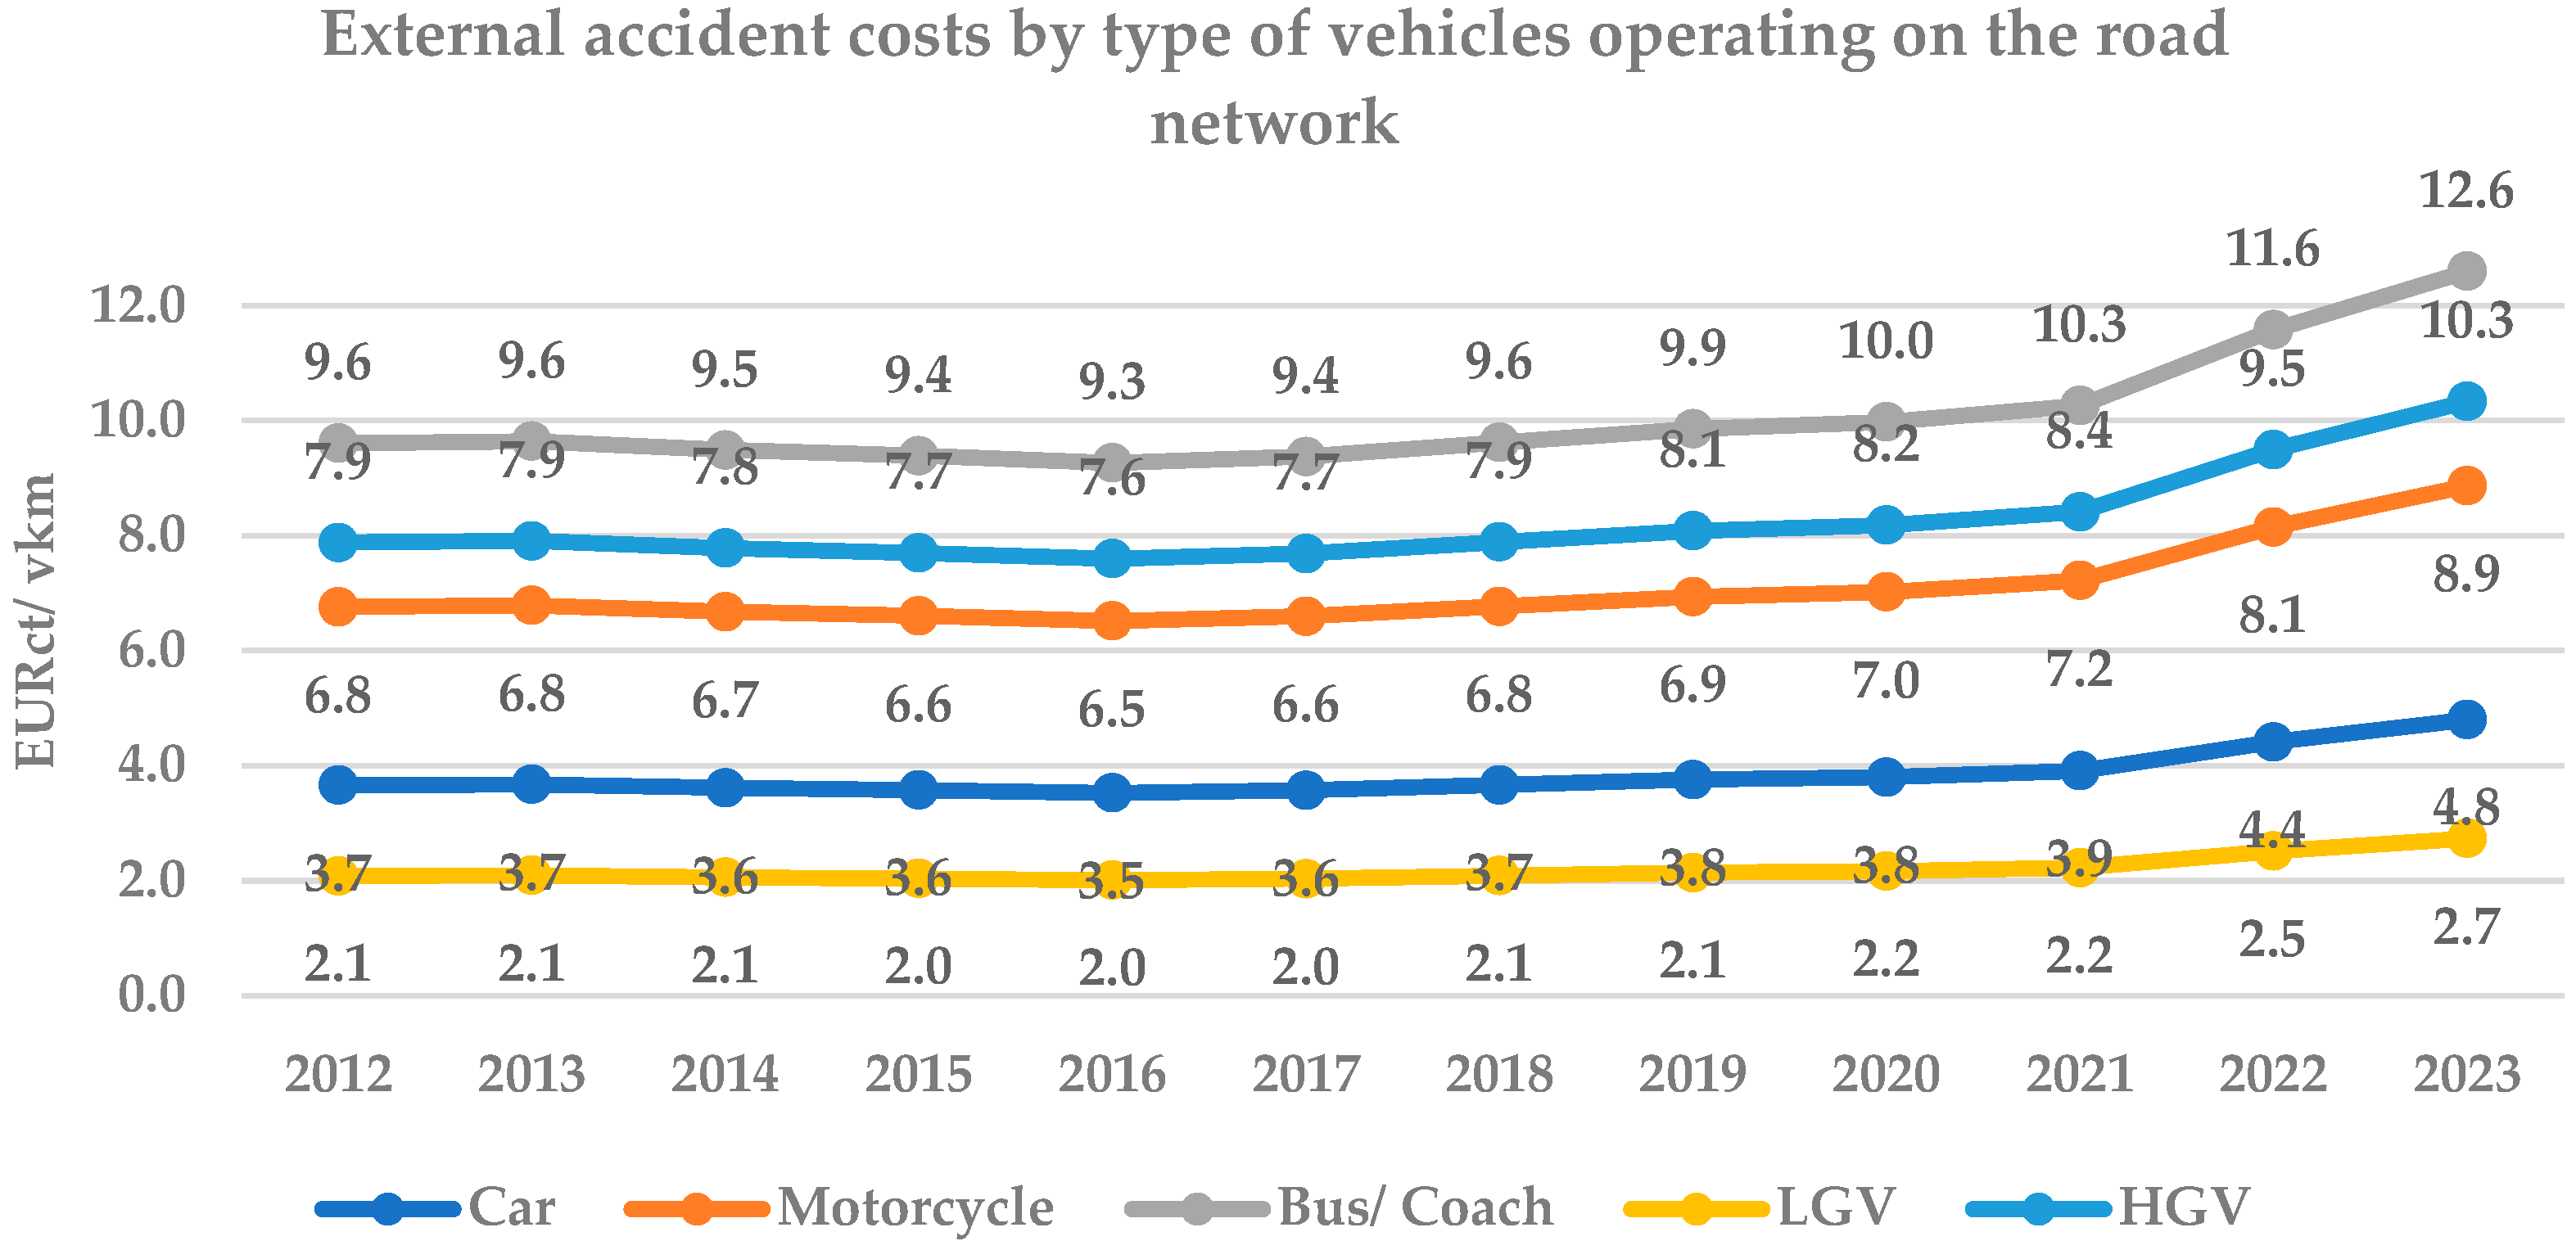
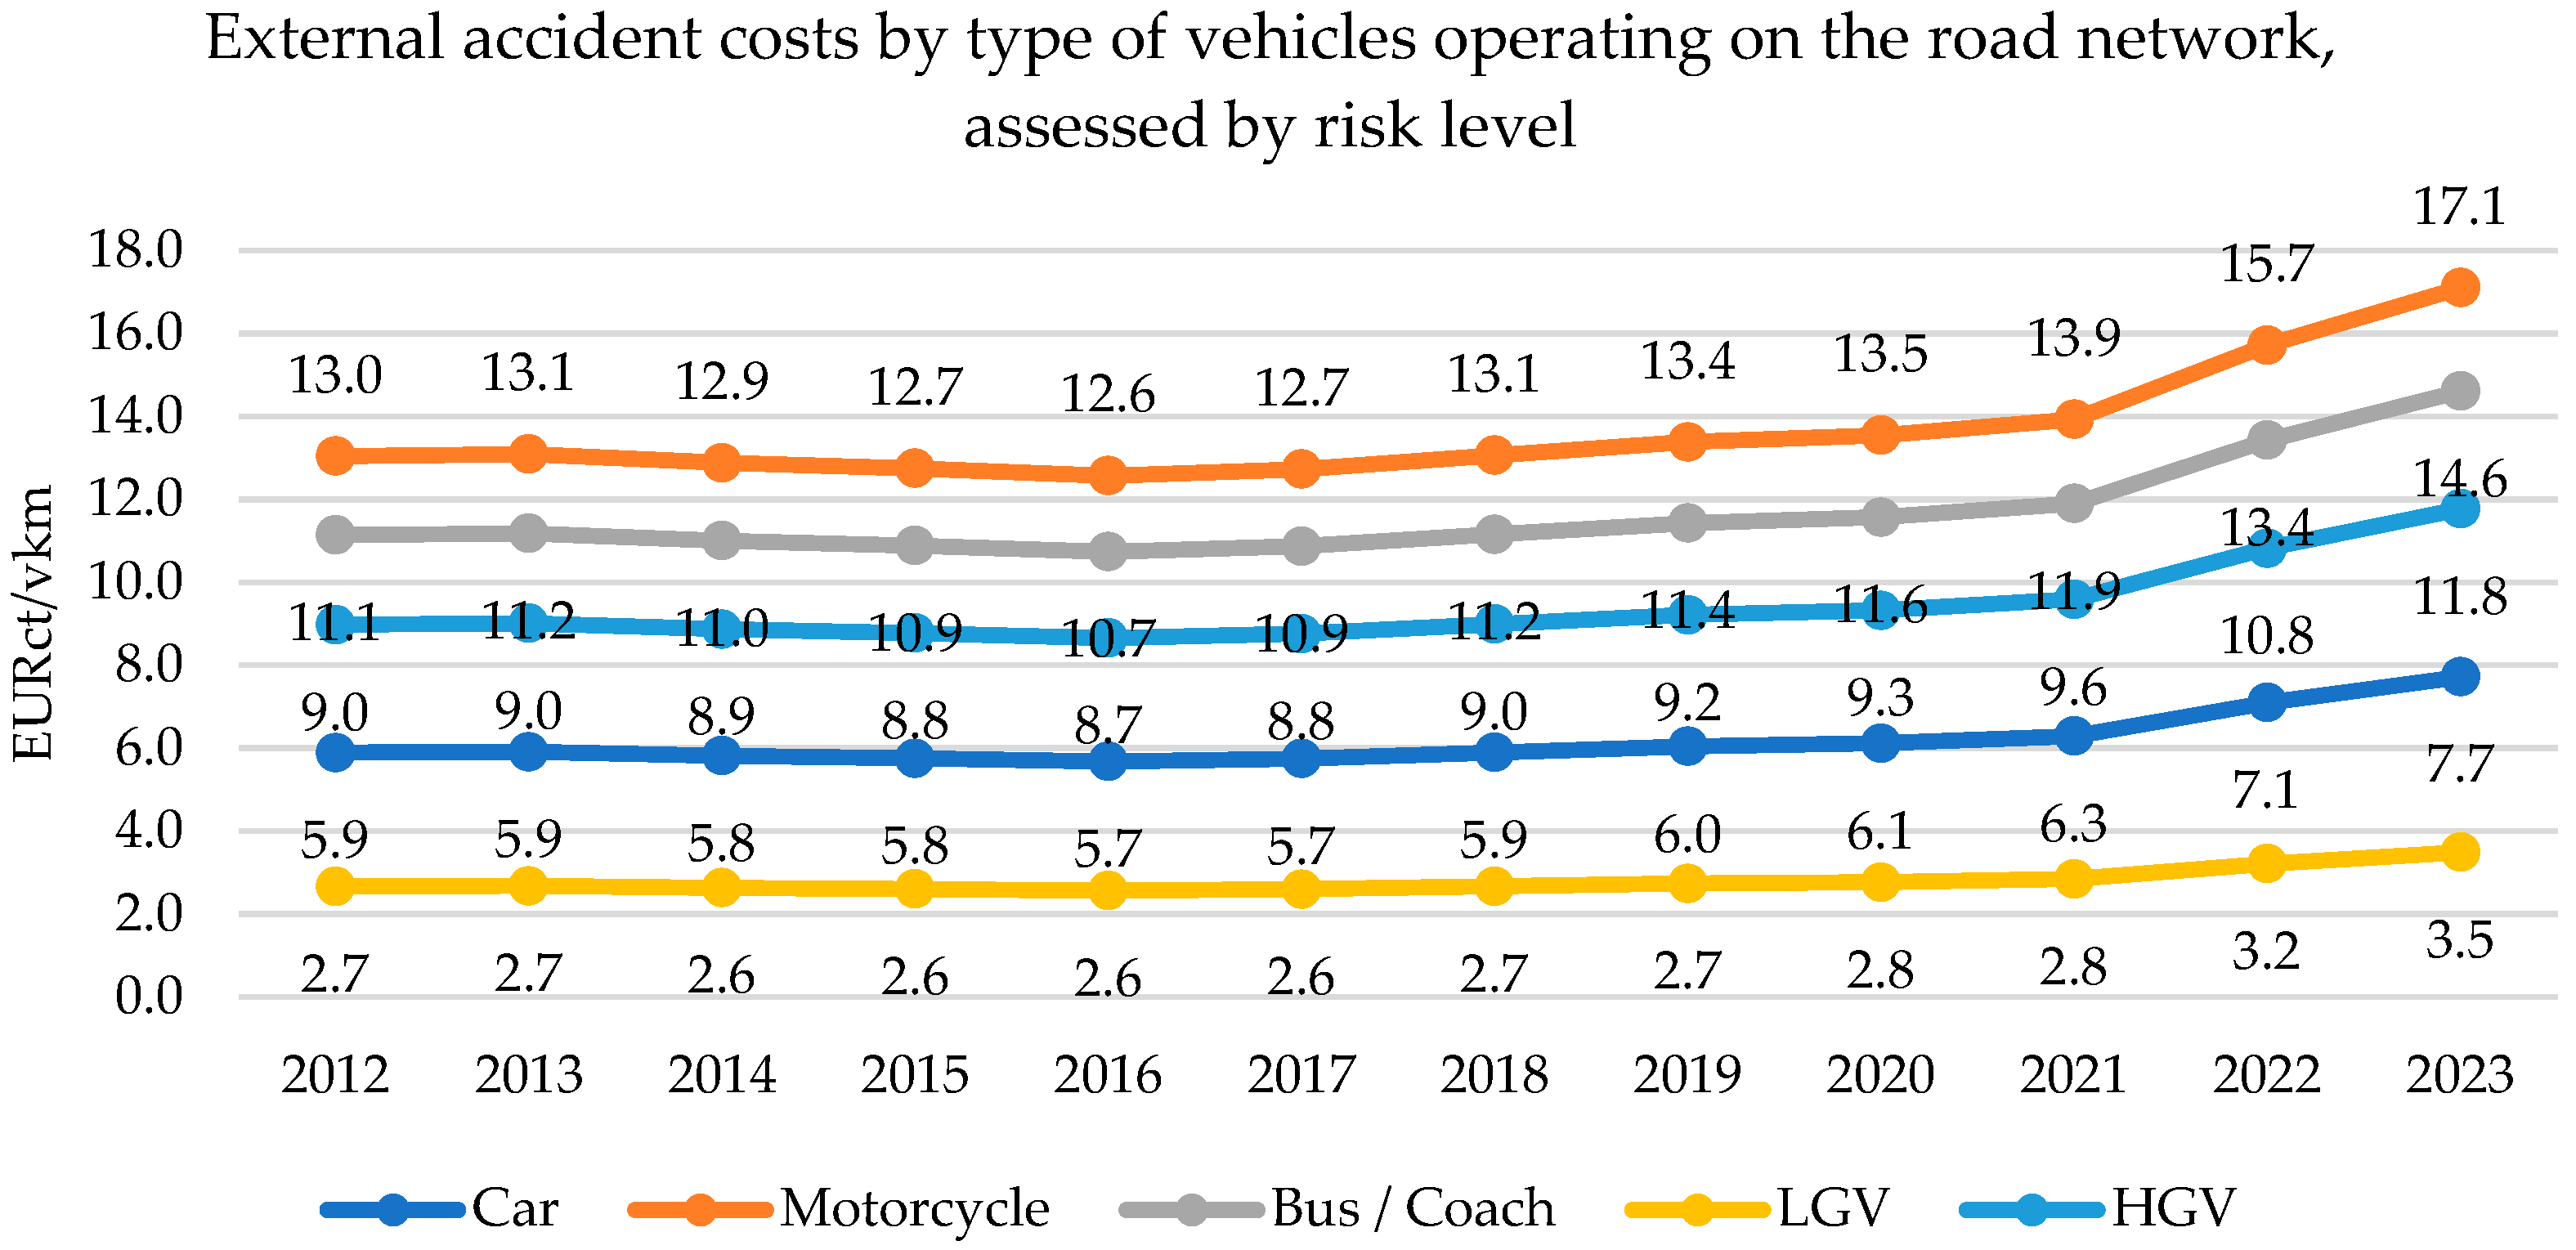
Road safety’s economic impact could be further demonstrated by evaluating the external accident costs caused by specific vehicles. The external accident costs for a single vehicle on particular routes (marginal costs) are calculated following the recommendations in the External Cost Assessment Manual (tables 8–12, pages 45–49) and Annex 2: General Guidelines for the Calculation of External Costs [13].
Calculating marginal external costs by vehicle type for specific routes represents the total marginal external costs incurred by a vehicle traveling along the road. This creates the possibility to compare costs for different routes. However, it should be noted that estimating the value of these costs for various EU countries is sensitive to national and local specifications and is only conducted because no national studies are available. Therefore, the corresponding results represent only rough estimates. The costs are determined using reference values per type of vehicle on the road network. These values are presented in the 2019 Handbook on the Estimation of the External Costs of Transport as EU averages, measured in euro cents per vehicle. They are then adjusted using the 2016 PPP GDP per capita ratio by country and the corresponding ratio linked to the Harmonized Indices of Consumer Prices (HICPs) for the current year (2023) compared to the base year (2016) with 2020 index = 100, as shown in Table 2. The selection of these indices is crucial for ensuring the estimates accurately reflect both economic output and price changes over time. The PPP GDP per capita ratio was chosen because it provides a standardized measure of economic productivity and purchasing power across countries, allowing for meaningful cross-country comparisons of external costs. Similarly, the HICP adjusts for inflationary changes, capturing shifts in consumer prices and cost structures between 2016 and 2022. By using these indices to update the 2016 reference values, the analysis accounts for variations in economic conditions and inflation, ensuring that the estimated external accident costs are representative of current economic realities and can be reliably compared across different EU countries.
The reference values have been updated to reflect the country’s current and evolving economic conditions using the following formula:
E C a c c = R V × K G D P   i n   P P P   2016   × K H I C P P   2023 . H I C P P   2016
where ECacc represents the external accident costs per type of accident and type of vehicle, RV—reference values for the respective marginal external accident costs chosen from the Handbook on the External Costs of Transport (recommended on the European level for 2016), KGDP in PPP 2016—GDP per capita in PPP coefficient for 2016 for Bulgaria, K H I C P P   2023 . H I C P P   2016 —the coefficient for harmonized indices of consumer prices (HICP) for 2023 relative to 2016.
Figure 6 shows the adjustment results and the values of external marginal costs per type of vehicle. These adjustments help determine the marginal external accident costs per vehicle traveling on the National Road Network (NRN).
A similar method is used to calculate external accident costs per type of vehicle and risk level (Figure 7).
Based on the estimated total external accident costs per kilometer and vehicle type, we can calculate the mark-ups that should be applied to the additional charges for using high-risk road infrastructure. The findings indicate that the extra fees vary depending on the type of vehicle, with motorcycles and buses incurring the highest surcharges due to their elevated risk of causing accidents. It should be noted that it is impossible to directly compare the respective costs for the different routes, as the traffic and the number of vehicles traveling in each section are distinct [14]. However, if traffic data are available (e.g., the number and type of vehicles traveling on each route), it would be possible to estimate the total external road safety costs of using each route over a period of time [15].
Evaluating external accident costs is a critical first step in understanding the full societal impact of road accidents. These external costs, including medical expenses, emergency services, lost productivity, and the emotional toll on families and communities, represent significant burdens not covered by those directly involved in the accident. Accurately assessing these costs is essential to capturing the broader consequences of road accidents. Once these externalities are identified and quantified, they can be effectively internalized into a cost–benefit analysis (CBA), providing a more holistic view of the benefits of road safety investments. This approach ensures that decision-makers consider not only the direct costs of infrastructure improvements but also the significant societal savings, leading to more informed and efficient resource allocation aimed at maximizing public safety.

4. Assessing the Costs and Benefits of Road Safety Investments

The economic impact assessment of safer road infrastructure investment projects aims to quantify the effects (internal and external) of implementing these projects. A given project can be categorized according to its location in urban or suburban areas or its regional importance—local, regional, or national. In this way, the impact of the project concerned is assessed proportionally at the local, regional, and national levels.
The step-by-step approach for evaluating the costs and benefits of various safety-related projects by internalizing the external accident costs includes the following stages:
  • The impact assessment methodology is required as a first step to collect the necessary statistical information at the city (local), regional, or national level.
  • The second step is to define the main impacts or benefits resulting from the reduction in PTP. Since not all impacts can be captured and quantified, possible impacts are described in advance in the general evaluation methodology [13]. Accordingly, the effects of each project are identified. These are assessed as percentage reductions or increases in various road traffic injuries and relate to indicators defined in the collected statistics. This way, the project’s impact on road safety and the country’s national economy can be assessed. Summarized elements of the expected impacts will be described in the following stages of the approach.
  • Using the described sequence and after multiplying the statistical data for the relevant indicators (number of road traffic deaths, number of seriously injured, and number of slightly injured) and the expected percentage impact of the implemented project on them, the impact of the respective infrastructure project on road safety is quantified [15].
  • For the cost–benefit analysis, the private or internal costs (project construction and deployment costs; operational costs for maintaining the facilities) and external costs (for road accidents) are identified [16].
  • The benefits of project implementation are also identified (reduction in the number of road accidents by type).
At the European level and in Bulgaria, the recent developments in external cost evaluation techniques allow the correct identification and evaluation of these costs and benefits, allowing a reliable assessment of the cost-effectiveness of road safety improvement projects and break-event points of the respective projects [17].
  • The results obtained from the previous stages are used to prepare a financial forecast for the project’s yearly operating costs and the expected economic benefits and savings from the site’s proceeds.
  • The benefit–cost ratio (BCR) is finally calculated by comparing the total benefits identified for a specific period to the estimated total costs for project implementation. This evaluation helps understand the project’s effectiveness and impact on road safety.
Evaluating the economic impact of road safety improvement projects is essential for making decisions about targeted transportation policies and measures to enhance road safety and reduce accidents. It is vital to conduct thorough analyses and impact assessments to improve coordination of methods used. However, some societal impacts and benefits may be challenging to measure [18]. Moreover, existing methods for evaluating the economic implications of safer road projects may not capture all their effects [19]. Still, they allow estimation of expected improvements in road safety and societal benefits in terms of decreasing external accident costs.
Utilizing the proposed approach for internalizing external accident costs through cost–benefit analysis techniques will help justify the inclusion of specific improvement projects, measures, and activities in road safety policy. It will also ensure that an assessment of the full public costs and benefits of these projects is presented clearly. This will inform the public about the overall economic impact of the proposed projects, and there will be a high degree of transparency in developing the country’s sectoral road safety strategy.

5. Impact Assessment and Results of the Cost–Benefit Analysis of Projects to Improve Road Safety in Bulgaria

The impact assessment and cost–benefit analysis were conducted for two case studies within the framework of projects initiated by the Ministry of Regional Development and Public Works (MRDP) and the Traffic Police. For this purpose, the authors utilized reports and guidelines from the MRDP to ensure alignment with national road safety policies and regulations. The MRDP is a reputable source for understanding governmental investment strategies and priorities in road safety. On the other hand, data from the Traffic Police regarding accident statistics, injury severity, and road conditions were incorporated to provide empirical evidence of the existing safety issues that the VRS and buffers, as well as speed cameras, aim to address.
These studies aimed to evaluate the impacts of project investments on road safety and society’s costs. All the values are calculated in EUR (1 BGN = 1.95583 EUR).

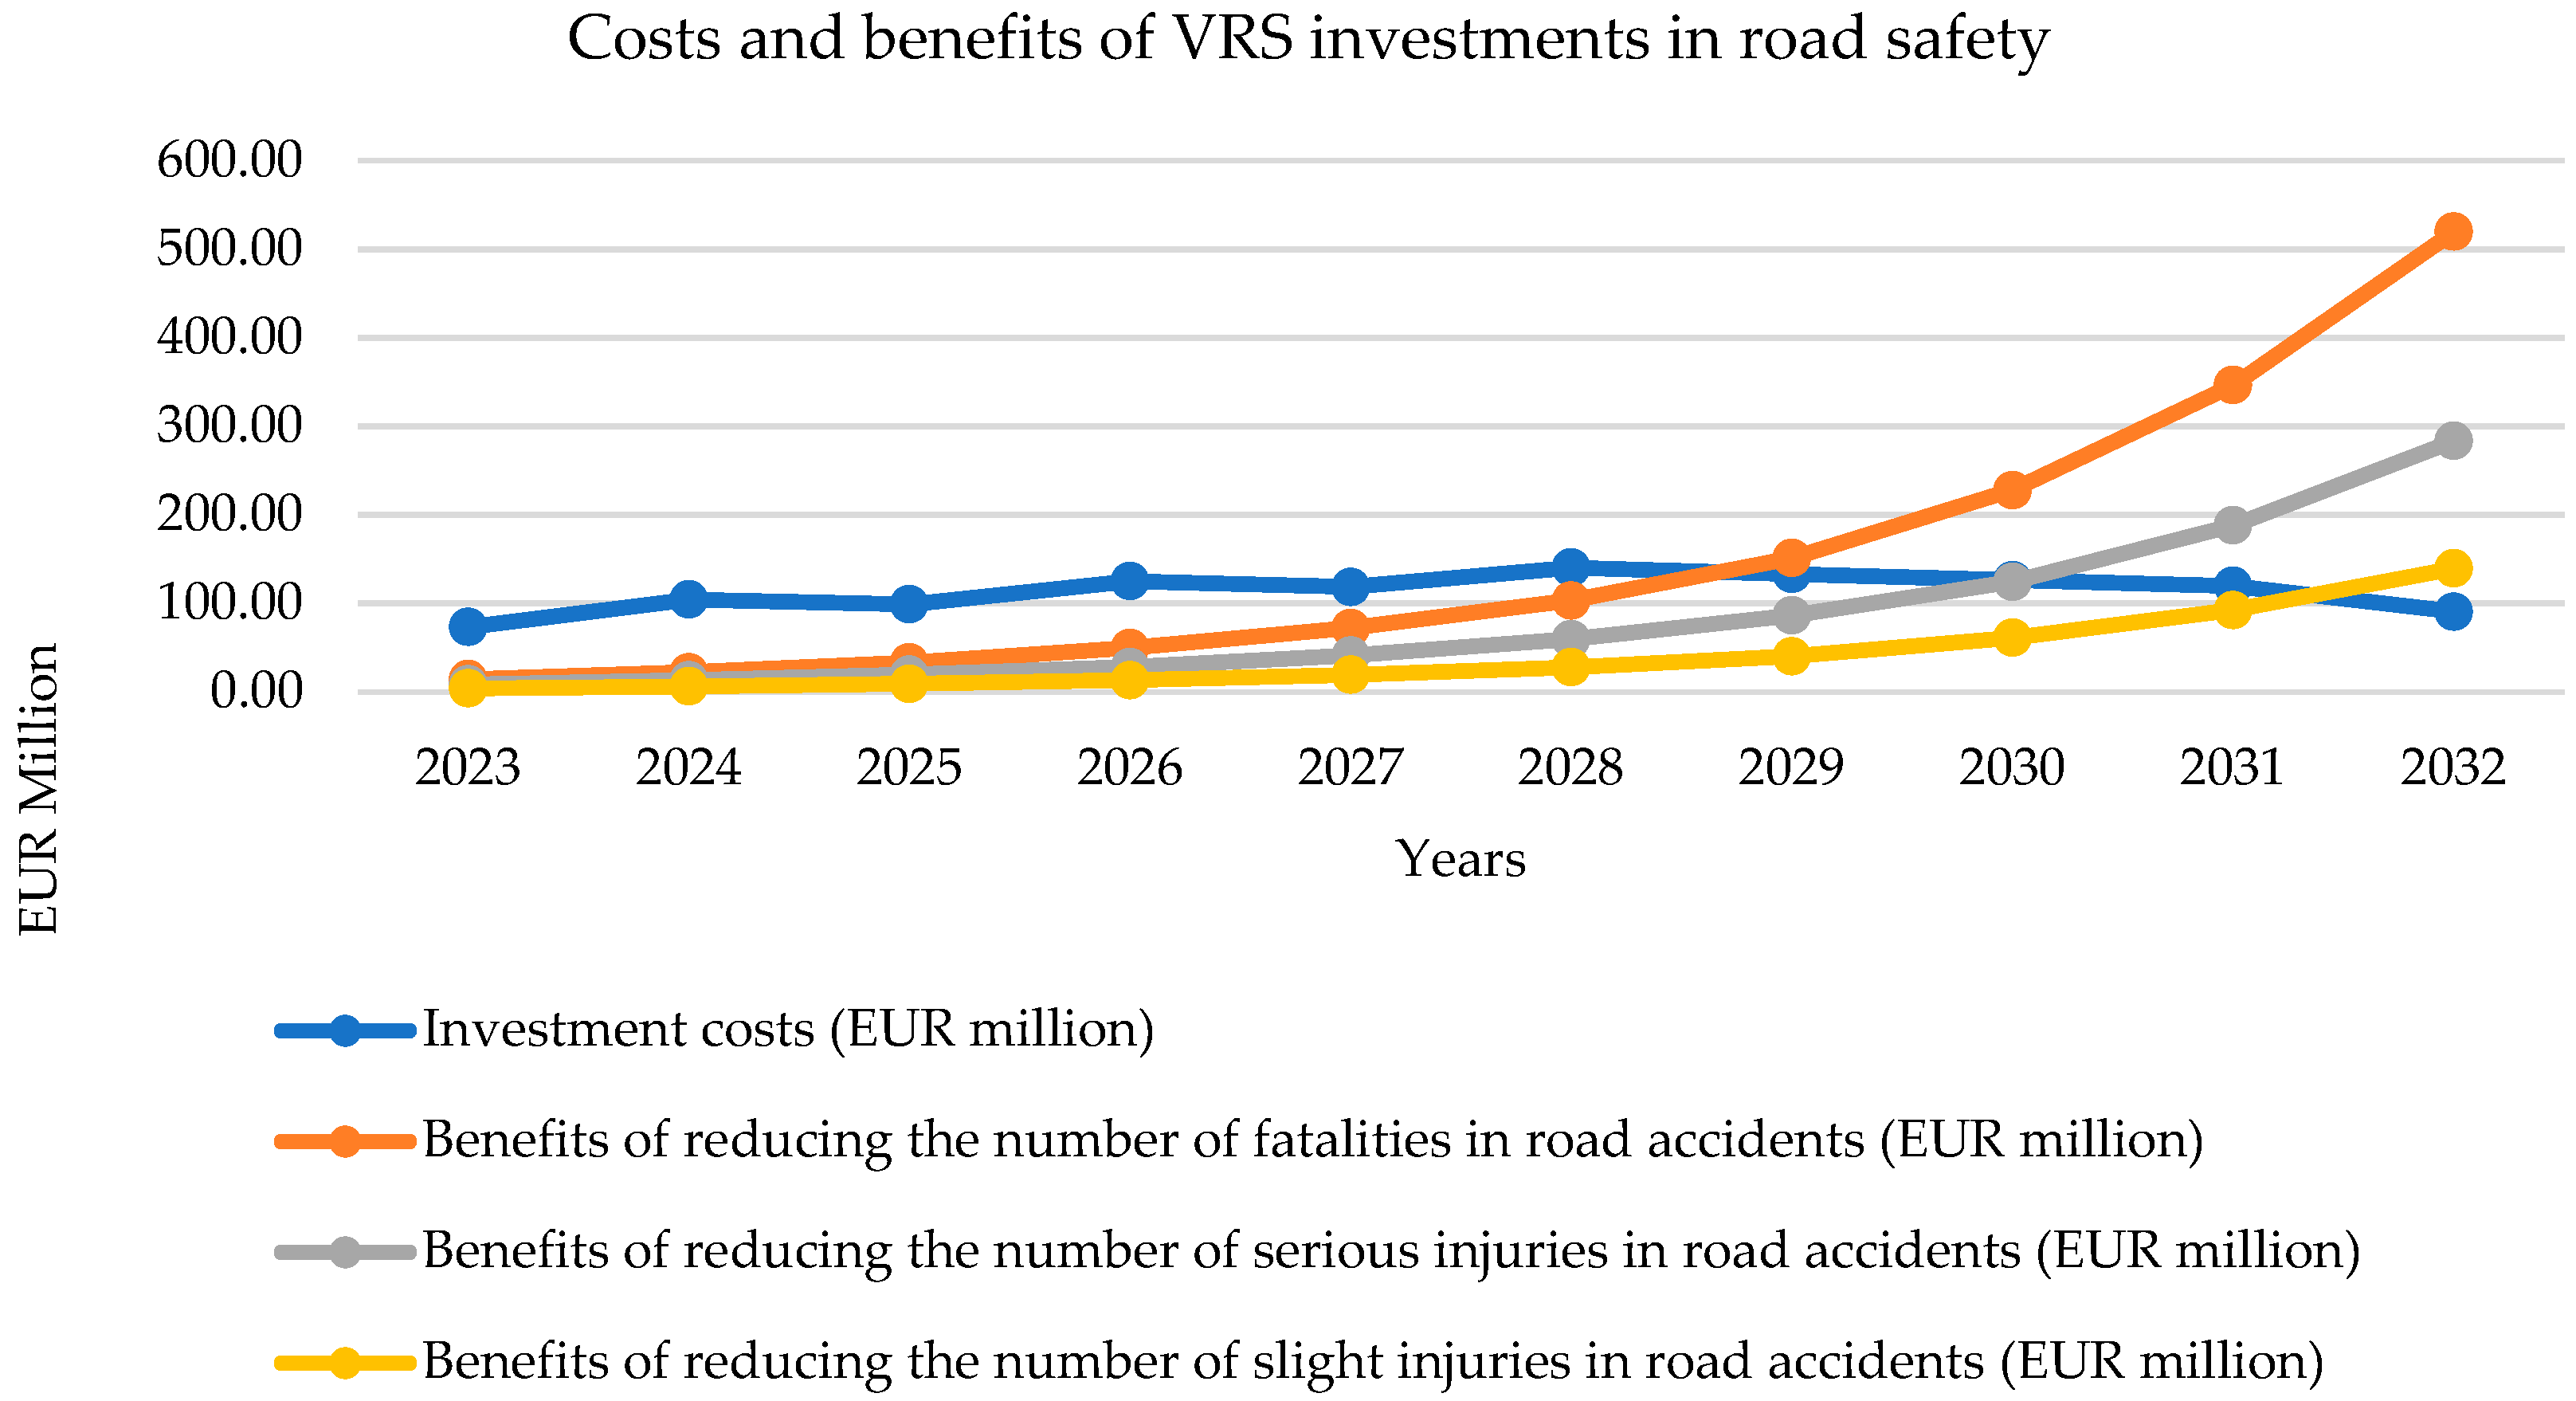
5.1. Case Study 1: Implementing Measures for Renewing and Installing New Vehicle Restrain Systems (VRS) and Buffers and Terminals on the National Road Network (NRN)

The Ministry of Regional Development has calculated the indicative annual values of the investments per year as presented in the motives of the Ordinance on the conditions and procedure for using vehicle restraint systems (VRS) and their requirements [20]. The costs for installing vehicle restraint systems were derived from recent procurement records and project budgets from the MRDP, ensuring that values reflect current market conditions and actual expenditures for similar projects in Bulgaria. This document identifies the need for investments based on the length of the VRS that needs replacement or new installation (see Table 3).
Effectiveness rates were based on empirical studies from the literature, indicating the percentage reduction in accidents and injuries associated with the implementation of VRS. This evidence was cross-referenced with international studies documenting the impact of such measures in similar road networks [21]. Data on traffic volume and vehicle types on the NRN were obtained from national traffic surveys conducted by the Traffic Police, providing a realistic context for estimating potential benefits and cost savings from reduced accidents. This case study specifically addresses the unique characteristics of the Bulgarian road network, including high accident rates and a need for improved safety measures. The chosen interventions (VRS and buffers) are tailored to the types of incidents prevalent in the region, ensuring that the analysis is grounded in the local context.
The economic analysis accounts for local socio-economic factors, such as the cost of road traffic injuries to society and the economic burden of accidents, which are critical for understanding the broader impact of road safety investments in Bulgaria.
The advantages of improved transport safety are not considered as a fixed-cost component of transport services. The expenses related to addressing the outcomes of transport accidents are regarded as a distinct category resulting from the operation of the transport system. The reduction in costs stemming from these incidents due to the execution of the project is estimated using standard values per accident or per human life lost. The actual benefits are computed by multiplying the decrease in the estimated number of accidents (by injury rate) by the standard value per accident. According to expert assessments from the MRDP, anticipated benefits from the decrease in accident rates range between 30 and 60% for the entire NRN [20]. A cautious approach has been taken in estimating the anticipated benefits of the project’s implementation, with a gradual 30% reduction in road traffic accidents anticipated by the end of the investment implementation period.
The project’s impact forecast used the corresponding cash flows for VRS investments with a discount factor of 5.5%.
The total investment costs are calculated by using the following formula:
T I C = 10 i + 1 P V I C i
where TIC represents the total discounted investment costs per installation of new vehicle restrain systems (VRS) and the installation of buffers and terminals on the national road network for ten years, and PVICi represents the present (discounted) values of the annual investment costs.
The yearly benefits are expressed through the reductions in external accident costs for fatalities and severe and slight injuries. The calculations are made using the following formula:
A B = N F × C F f × k f + N S I × C F s i × k s i + N L I × C F l i × k l i
where AB is the sum of annual benefits from reduced external accident costs;
NF—decreased number of fatalities due to the implementation of the project;
CFf—cost factor (external costs) per fatality;
kf—correction factor for underreporting fatalities;
NSI—reduction in the number of serious injuries;
CFSI—cost factor (external costs) per severe injury;
kSI—correction factor for underreporting severe injuries;
NLI—decreased number of slight injuries;
CFLI—cost factor (external costs) per slight injury;
kLI—correction factor for underreporting slight injuries.
Respectively, the total benefits for the project implementation are calculated using the following formula:
T B = 10 i + 1 P V B i
where TB represents the total discounted benefits in external costs per installation of new vehicle restrain systems (VRS) and the installation of buffers and terminals on the national road network for ten years, and PVBi represents the discounted values for the annual benefits of fewer accidents.
The costs and benefits of the specific project are converted into present values before the benefit–cost ratio is calculated for project evaluation. The base year for this assessment is 2023. All past investment costs have been adjusted to present values based on the country’s inflation rate. Similarly, all future costs and benefits beyond 2023 have also been converted to present values using the standard present value formula as follows:
PV = FV/(1 + r)N
where PV is the present value;
FV—the future value of the benefits or costs involved;
r—discount rate (for transport projects at EU level, a rate of 5.5% has been set); and
N—years of project use (10 years).
The results of the cost–benefit analysis for the project are outlined in Table 4.
The benefit–cost ratio (BCR) indicates the value of the benefits derived from reducing the number of road accidents by type due to the project’s implementation compared to the project’s cost. A higher ratio signifies that the project investment yields more significant benefits. An assessment of the benefits and costs over 10 years of project implementation reveals a savings of 2.48 EUR in external accident costs for each 1 EUR of the investment costs.
Analyzing the different types of traffic accidents and the associated injuries can help determine the cost-effectiveness of investing in road safety. This will help determine for how long the investment will be recouped.
The data in Figure 8 show that, in terms of the cost of loss of life, the investment cost will be fully recovered by the seventh year of the project. Correspondingly, external costs for severely injured and slightly injured are expected to be covered by the beginning of the eighth and ninth years of the investment.

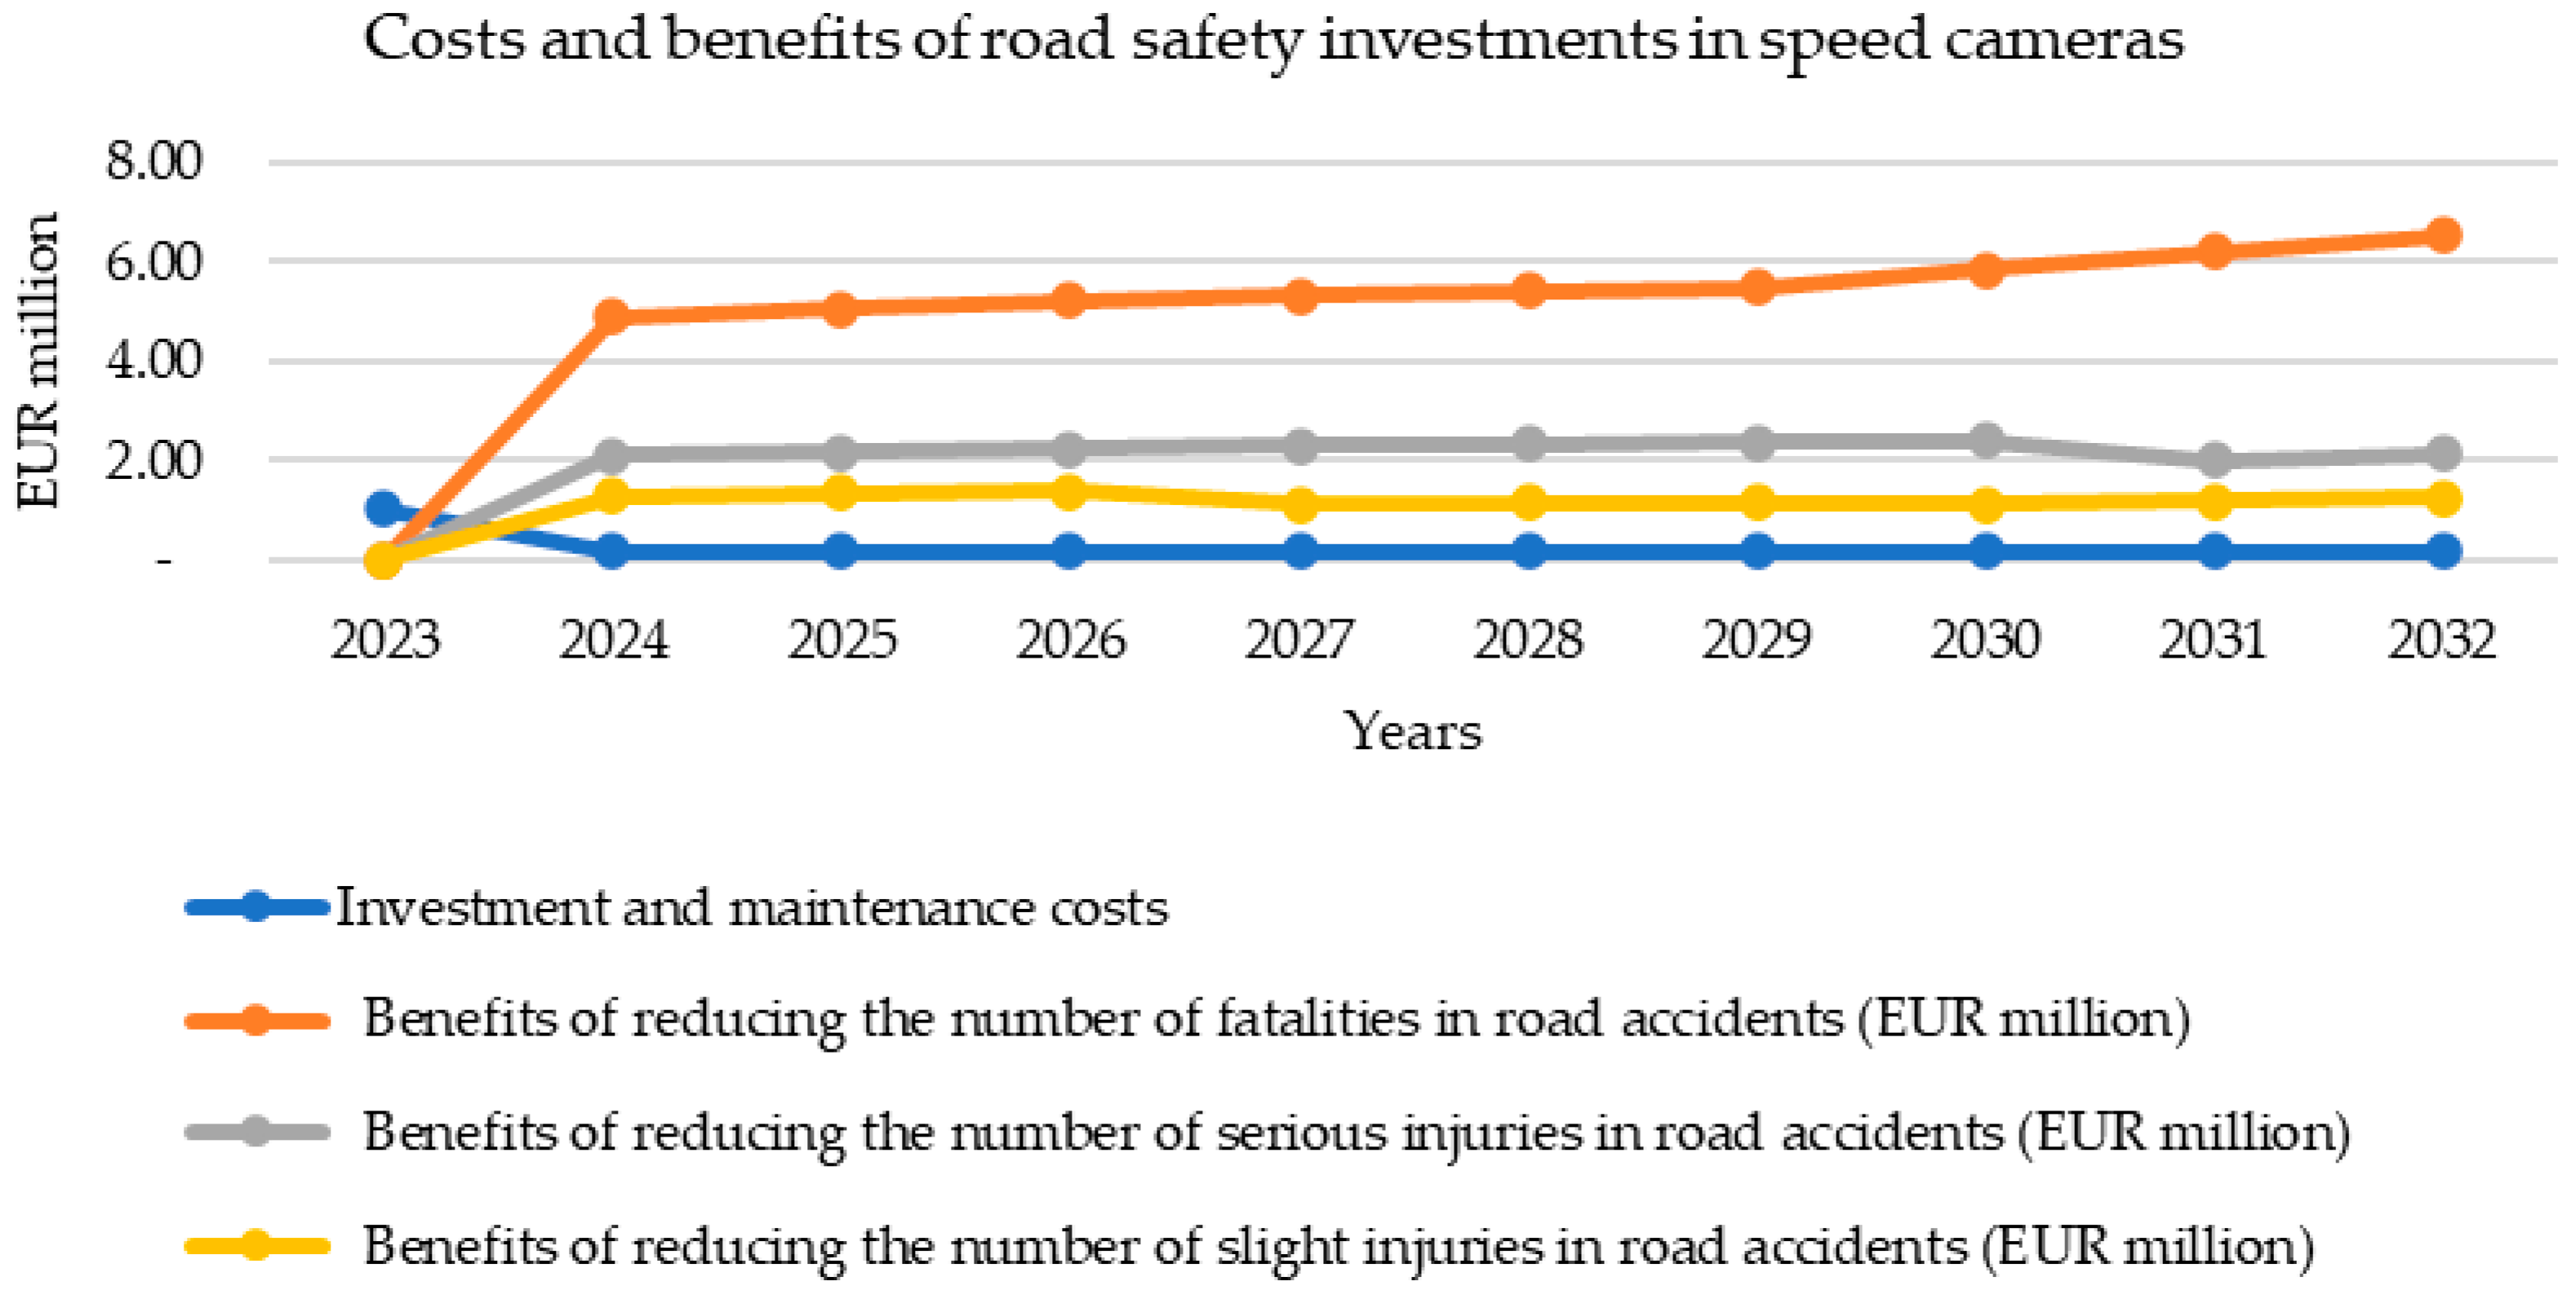
5.2. Case Study 2: Deployment of Twenty New (Additional) Speed Cameras along the NRN

This case study is specifically designed to address the context of Bulgaria’s road safety challenges. By implementing speed cameras along the NRN, the project targets areas with historically high rates of severe accidents, making deploying these cameras a pertinent response to the identified issues. The project’s benefits are contextualized within the broader framework of national road safety strategies and the commitment to reducing traffic fatalities and injuries, thus enhancing its relevance and importance.
The project involves purchasing 20 speed cameras, that will be deployed nationally along the NRN to support the existing speed detection cameras’ network monitoring national roads. Based on recent procurement contracts and market analysis, each camera was priced at BGN 100,000 (EUR 51,129). This figure includes investment in purchasing and installing new cameras, ensuring that it accurately reflects the investment needed for the project. The annual maintenance costs (including operation, cloud services, and technical maintenance) are reported to be EUR 9500 for each camera for 2024. The projected reduction in severe injuries and fatalities (5–10%) is supported by a review of empirical data from other regions where speed cameras have been implemented. This aligns with findings from various studies that demonstrate the effectiveness of speed enforcement in reducing accident severity. The conservative estimate of a 0.25–0.5% reduction in all traffic accidents nationally is based on the limited number of cameras deployed and the wide distribution across the NRN. This cautious approach acknowledges the variability in traffic enforcement outcomes and aligns with standard practices in cost–benefit analysis [22].
Data on the effectiveness of speed cameras in reducing traffic accidents and fatalities were sourced from traffic safety reports published by the Traffic Police and the Ministry of Regional Development and Public Works (MRDP). These reports provide insights into the historical impact of speed enforcement measures in Bulgaria and similar contexts [23]. Relevant studies from international road safety literature [24] were reviewed to gather evidence on the average percentage reduction in severe injuries and fatalities attributable to speed camera deployments. This helped establish a credible basis for the expected outcomes of the new camera network.
For the purpose of cost–benefit analysis, the project cost includes the initial investment and the cameras’ yearly maintenance expenses. The future costs of these expenses have been estimated in the next stage.
The approach and formulas described above have been used to assess the costs and benefits of this project implementation (Table 5). A comparison of the benefits and costs over ten years following the project’s implementation demonstrates savings of 32.06 EUR in external accident costs per 1 EUR of investment.
In evaluating the cost-effectiveness of investing in this project, it is evident that it provides significant benefits in terms of societal cost savings from road traffic accidents, even with minimal impact—saving just one life (Figure 9). The data show that the investment in speed cameras will be recovered at the beginning of the investment project.
It is important to note that the cost–benefit model used to estimate the costs of the two projects does not include savings from other external costs, such as those related to removing congestion caused by traffic accidents, material costs of compensation for damaged property, etc. [25]. Additionally, the model does not consider the potential additional revenues generated by using speed cameras to impose fines and penalties on drivers breaking road traffic laws and not complying with speed limits. When these factors are considered, the benefits to society of investing in road safety projects increase significantly [26]. This demonstrates that investment in road safety improvement projects greatly benefits society and improves its economic and social well-being [27].

6. Conclusions

The presented approach for estimating the external costs of road traffic accidents provides a robust framework for assessing road safety projects’ economic and social impacts. This methodology not only allows for a precise evaluation of road safety interventions but also addresses a critical research gap in understanding the nuanced financial implications of such measures within the Bulgarian context.
Investing in road safety is essential for reducing accidents and the associated societal losses and delivering significant economic benefits. Our findings indicate that the returns on investment in road safety measures are substantial, with projected savings from reduced casualties, lower healthcare costs, and diminished property damage far exceeding the initial expenditures. This highlights the effectiveness of internalizing the external accident costs through cost–benefit analysis as a vital tool for evaluating the impacts of investments in road safety infrastructure [28]. Furthermore, this analysis encompasses a range of benefits, including reduced travel times, improved road conditions, and lower transportation costs.
Incorporating road safety considerations into national strategies is crucial for fostering a socially sustainable transport system and advancing broader societal objectives [29]. Our study underscores the necessity for a national road safety strategy to integrate road safety measures into the sustainable development of the economy and society. By prioritizing these considerations, we can better support long-term economic growth and enhance road safety.
Ultimately, this research contributes to the growing body of literature on road safety by providing empirical evidence and actionable insights that can guide policymakers in making informed decisions. Future studies should continue to explore the long-term impacts of road safety investments and consider the potential for further integrating innovative technologies to enhance road safety measures’ effectiveness.

Funding

This research was funded by the Bulgarian National Scientific Research Fund, grant number KP-06-N55/15 of 22.11.2021.

Institutional Review Board Statement

Not applicable.

Informed Consent Statement

Not applicable.

Data Availability Statement

Data are contained within the article, and the sources of information are cited correspondingly.

Conflicts of Interest

The author declares no conflict of interest.

References

  1. Nankunda, C.; Evdorides, H. A Systematic Review of the Application of Road Safety Valuation Methods in Assessing the Economic Impact of Road Traffic Injuries. Futur. Transp. 2023, 3, 1253–1271. [Google Scholar] [CrossRef]
  2. Steinhauser, R.; Lancsar, E.; Bourke, S.; Munira, L.; Breunig, R.; Gruen, R.; Dobes, L.; Bulfone, L.; Glass, K.; Gordon, C.; et al. The Social Costs of Road Crashes: Report for the Bureau of Infrastructure and Transport Research Economics; The Australian National University: Sydney, Australia, 2022. [Google Scholar]
  3. Andersson, H. The Value of a Statistical Life. Adv. Transp. Policy Plan. 2020, 6, 75–99. [Google Scholar]
  4. Elvik, R. The Power Model of the Relationship Between Speed and Road Safety: Update and New Analyses; Institute of Transport Economics: Oslo, Norway, 2009. [Google Scholar]
  5. Hofbauer, F.; Putz, L.-M. External Costs in Inland Waterway Transport: An Analysis of External Cost Categories and Calculation Methods. Sustainability 2020, 12, 5874. [Google Scholar] [CrossRef]
  6. Wijnen, W.; Wesemann, P.; de Blaeij, A. Valuation of Road Safety Effects in Cost–Benefit Analysis. Eval. Program Plan. 2009, 32, 326–331. [Google Scholar] [CrossRef] [PubMed]
  7. Rodríguez-Sanz, Á.; Andrada, L.R. Cost–Benefit Analysis of Investments in Air Traffic Management Infrastructures: A Behavioral Economics Approach. Aerospace 2023, 10, 383. [Google Scholar] [CrossRef]
  8. Pietrzak, K.; Pietrzak, O.; Montwill, A. A Study on the Effects of Applying Cargo Delivery Systems to Support Energy Transition in Agglomeration Areas—An Example of the Szszecin Agglomeration, Poland. Energies 2023, 16, 7943. [Google Scholar] [CrossRef]
  9. Schnieder, M. Can Cost Effective Transportation Be Sustainable (Reducing Emmissions and External Costs)? Environments 2023, 10, 11. [Google Scholar] [CrossRef]
  10. Van Wijngaarden, L.; Schroten, A.; van Huib, E.; Sutter, D.; Andrew, E. Sustainable Transport Infrastructure Charging and Internalisation of Transport Externalities—Executive Summary; Publication Office: Brussels, Belgium, 2019. [Google Scholar]
  11. Schoeters, A.; Wijnen, W.; Carnis, L.; Weijermars, W.; Elvik, R.; Johannsen, H.; van den Berghe, W.; Filtness, A.; Daniels, S. Costs Related to Serious Injuries, D7.3 of the H2020 Project SafetyCube; Loughborough University: Loughborough, UK, 2020. [Google Scholar]
  12. Van Essen, H.; Van Wijngaarden, L.; Schroten, A.; Sutter, D.; Bieler, C.; Maffii, S.; Brambilla, M.; Fiorello, D.; Fermi, F.; Riccardo, P.; et al. Handbook on the External Costs of Transport—Version 2019—1.1; Publications Office: Brussels, Belgium, 2020. [Google Scholar]
  13. ADB and Green Transport. External Costs of Transport in ADB Area: Lessons Learnt, Deliverable 6.1; Institute of Traffic and Transport, ADB and Green Transport: Ljubljana, Slovenia, 2013. [Google Scholar]
  14. Horlemann, J.; Heidinger, M.; Wenner, F.; Thierstein, A. Introducing a Novel Framework for the Analysis and Assessment of Transport Projects in City Regions. Sustainability 2024, 16, 2349. [Google Scholar] [CrossRef]
  15. European Commission. Transport Accident Costs: A Comprehensive Methodology for Estimating External Costs of Road Accidents. Report from the Expert Group on Infrastructure Charging; European Commission: Brussels, Belgium, 2021. [Google Scholar]
  16. Nikolova, C. Deliverable 7.1. Cost-Benefit Analysis Report for the Deployment of ITS in Bulgaria; SEE-ITS Project: Sofia, Bulgaria, 2015. [Google Scholar]
  17. European Road Safety Observatory. Cost-Benefit Analysis Brussels; European Road Safety Observatory: Brussels, Belgium, 2018. [Google Scholar]
  18. Miola, A.; Paccagnan, V.; Turvani, M.; Andreoni, V.; Massarutto, A.; Perujo, A. Review of the Measurement of External Costs of Transportation in Theory and Practice; Maritime transport—Report 1; European Union: Publications Office: Ispra, Italy, 2008. [Google Scholar]
  19. Baranyai, D.; Sipos, T. Black-Spot Analysis in Hungary Based on Kernel Density Estimation. Sustainability 2022, 14, 8335. [Google Scholar] [CrossRef]
  20. Ministry of Regional Development and Public Works. Draft-Ordinance on the Conditions and Procedure for Using Road Restraint Systems and Their Requirements; Ministry of Regional Development and Public Works: Sofia, Bulgaria, 2022. [Google Scholar]
  21. Doll, C.; Jansson, J.O. User costs and benefits in Measuring the Marginal Social Costs of Transport. Res. Transp. Econ. 2005, 14, 125–154. [Google Scholar] [CrossRef]
  22. Sánchez-Cambronero, S.; Álvarez-Bazo, F.; Rivas, A.; Gallego, I. Dynamic Route Flow Estimation in Road Networks Using Data from Automatic Number of Plate Recognition Sensors. Sustainability 2021, 13, 4430. [Google Scholar] [CrossRef]
  23. Traffic Police. Stationary Automated Technical Means for Speed Control; Ministry of Internal Affairs: Sofia, Bulgaria, 2024. [Google Scholar]
  24. European Road Safety Observatory. Road Safety Thematic Report—Speed; European Road Safety Observatory: Brussels, Belgium, 2021. [Google Scholar]
  25. Becker, U.; Becker, T.; Gerlach, J. The True Costs of Automobility: External Costs of Cars—Overview on Existing Estimates in EU-27; Institute of Transport Planning and Road Traffic: Dresden, Germany, 2012. [Google Scholar]
  26. Shokry, S.; Tanaka, S.; Wahaballa, A. Cost-Benefit Analysis of Unconventional Aerial Intersection Designs: Cairo as a Case Study. Sustainability 2022, 14, 17016. [Google Scholar] [CrossRef]
  27. Venezia, E. Cost–Benefit Analysis in High-Speed Railway Projects: Appraisal of Methodological Approaches and an Initial Social Equity Evaluation, A Case Study. Sustainability 2023, 15, 11344. [Google Scholar] [CrossRef]
  28. Gössling, S.; Kees, J.; Litman, T. The lifetime cost of driving a car. Ecol. Econ. 2022, 194, 107335. [Google Scholar] [CrossRef]
  29. Brooks, L.; Liscow, Z. Infrastructure Costs. Am. Econ. J. Appl. Econ. 2023, 15, 1–30. [Google Scholar] [CrossRef]
Figure 1. Model workflow from data input to output results.
Sustainability 16 08717 g001
Figure 2. Number of road traffic deaths in Bulgaria between 2012 and 2023. Source: Traffic police, 2024.
Sustainability 16 08717 g002
Figure 3. Number of severe injuries in the country’s road accidents between 2012 and 2023. Source: Traffic police, 2024.
Sustainability 16 08717 g003
Figure 4. Number of slight injuries in the country’s road accidents between 2012 and 2023. Source: Traffic police, 2024.
Sustainability 16 08717 g004
Figure 5. Total external accident costs per type of accident between 2012 and 2023. Source: Author’s calculations.
Sustainability 16 08717 g005
Figure 6. Marginal external accident costs per vehicle on the road network. Source: Author’s calculations.
Sustainability 16 08717 g006
Figure 7. Marginal external accident costs per type of vehicle by risk level. Source: Author’s calculations.
Sustainability 16 08717 g007
Figure 8. Break-even point of VRS investment. Source: Authors own calculations.
Sustainability 16 08717 g008
Figure 9. Break-even point of investment in 20 new speed cameras. Source: Authors own calculations.
Sustainability 16 08717 g009
Table 1. External costs caused per one accident (2023).
Types of Traffic AccidentsCost of Loss of Capacity to Work and Loss of Life, EURLoss of Production, EuroMedical Expenses, EURAdministrative Costs, EURTotal External Costs per Person Injured in Traffic Accidents, EUR
Fatalities2,112,551234,219176512372,349,772
Severe injuries307,29215,5915432851329,166
Slight injuries23,63895446836625,426
Source: The Handbook of External Cost Estimation in Transport, 2019 and author’s calculations.
Table 2. Adjustment factors for average and marginal external accident costs (2023).
Adjustment FactorsValues
GDP per capita by PPP (2016)0.49
HICP 2022 vs. 20161.36
Source: Eurostat, 2024.
Table 3. Identified needs for investment based on VRS length.
Class RoadMotorwaysClass IClass IIClass IIIRoad JunctionsTotal
Length of VRS in km required for replacement or new installation102823063215946915216,171
Length of VRS in meters required for replacement or new installation1,028,3812,306,0573,215,3089,469,325152,14116,171,211
Value in EUR, excluding VAT89,386,451200,441,580279,473,349823,070,11113,224,0551,405,595,547
Source: Ministry of Regional Development and Public Works, Motives to the Draft Ordinance on the Terms and Conditions for the Use of Vehicle Restraint Systems for Roads and the Requirements for Them, 2023.
Table 4. Results of the cost–benefit analysis of VRS project implementation by year.
Costs
Investment costs
Year2023202420252026202720282029203020312032
Investment costs (EUR million)77.31115.96115.96154.61154.61193.27193.27193.27193.27154.61
Discounted value (EUR million)73.28104.1998.76124.81118.30140.17132.86125.94119.3790.52
Benefits
Year2023202420252026202720282029203020312032
Decrease in the number of fatalities69131927385578112159
Cost factor (EUR/fatality)2,416,0762,665,5072,914,9373,164,3683,413,7993,663,2303,912,6614,162,0914,411,5224,660,953
Correction factor (Kf)1.021.021.021.021.021.021.021.021.021.02
Benefits of reducing the number of fatalities in road accidents (EUR million)14.7924.4738.6561.3294.02141.99219.50331.14503.97755.91
Discounted values (EUR million)14.0121.9932.9249.5071.93102.97150.89227.64346.45519.64
Reduction in the number of serious injuries2131446289127182260371530
Cost factor (EUR/serious injury)340,544375,701410,858446,015481,172516,330551,487586,644621,801656,958
Correction factor (kSI)1.251.251.251.251.251.251.251.251.251.25
Benefits of reducing the number of serious injuries in road accidents (EUR million)8.9414.5622.6034.5753.5381.97125.46190.66288.36435.23
Discounted values (EUR million)8.4713.0819.2527.9040.9659.4586.25124.23187.89283.60
Reduction in the number of slight injuries8111516423533647968597813981997
Cost factor (EUR/ slight injury)26,27528,98731,70034,41237,12439,83742,55045,26247,97550,687
Correction factor (kLI)2.002.002.002.002.002.002.002.002.002.00
Benefits of reducing the number of slight injuries in road accidents (EUR million)4.256.6710.4016.1724.9538.1658.2988.54134.14202.45
Discounted values (EUR million)4.035.998.8613.0519.0927.6840.0860.8692.21139.17
Overall benefits of reducing the number of deaths and injuries in road accidents26.5940.9060.8490.50131.91190.20277.12>412.61626.33942.31
Total costs (EUR million)1128.18
Total benefits (EUR million)2800.04
BCR2.48
Source: Author’s calculations.
Table 5. Results of cost–benefit analysis of speed camera project implementation by year.
Costs
Investment costs
Year2023202420252026202720282029203020312032
Investment costs (EUR million)1.02---------
Maintenance costs (EUR million)-0.190.200.210.220.230.240.250.270.28
Discounted value (EUR million)1.020.170.170.170.170.170.170.170.170.16
Benefits
Year2023202420252026202720282029203020312032
Decrease in the number of fatalities-222222222
Cost factor (EUR/fatality)2,416,0762,665,5072,914,9373,164,3683,413,7993,663,2303,912,6614,162,0914,411,5224,660,953
Correction factor (Kf)1.021.021.021.021.021.021.021.021.021.02
Benefits of reducing the number of fatalities in road accidents (EUR million)-5.445.956.466.967.487.988.499.009.51
Discounted values (EUR million)-4.895.065.215.335.425.495.846.196.53
Reduction in the number of serious injuries-5.005.005.005.005.005.005.004.004.00
Cost factor (EUR/serious injury)340,544375,701410,858446,015481,172516,330551,487586,644621,801656,958
Correction factor (KSI)1.251.251.251.251.251.251.251.251.251.25
Benefits of reducing the number of serious injuries in road accidents (EUR million)-2.352.572.793.013.233.453.673.113.28
Discounted values (EUR million)-2.112.192.252.302.342.372.392.022.14
Reduction in the number of slight injuries-252525202020181818
Cost factor (EUR/ slight injury)26,27528,98731,70034,41237,12539,83742,55045,26247,97550,687
Correction factor (KLI)2.002.002.002.002.002.002.002.002.002.00
Benefits of reducing the number of slight injuries in road accidents (EUR million)-1.451.591.721.481.601.701.631.731.83
Discounted values (EUR million)-1.301.351.391.141.161.171.121.191.25
Overall benefits of reducing the number of deaths and injuries in road accidents-8.308.608.858.768.929.029.359.409.93
Total costs (EUR million)2.52
Total benefits (EUR million)81.13
BCR32.06
Source: Author’s calculations.
Disclaimer/Publisher’s Note: The statements, opinions and data contained in all publications are solely those of the individual author(s) and contributor(s) and not of MDPI and/or the editor(s). MDPI and/or the editor(s) disclaim responsibility for any injury to people or property resulting from any ideas, methods, instructions or products referred to in the content.

