Abstract
With the continuous opening of low-altitude airspace and the development of aircraft such as electric vertical takeoff and landing (eVTOL) vehicles, urban air traffic has become a sustainable and green development direction for future transportation. Air route networks, as a mainstream design scheme for air traffic, are able to provide prerequisites for eVTOL and other green aircraft to enter urban airspace for safe operation, among which air route planning is a fundamental component of air route network design. Currently, most of the research on aircraft path planning is performed in free airspace, lacking the analysis and processing for the complex operation environment, which has led to the high risk and large operation cost of path planning results, failing to meet the demand for safe and efficient development in the future. Aiming at the above problems, eVTOL-oriented air route planning research was carried out. Firstly, the urban low-altitude airspace structure was planned, and the operational levels of eVTOL were clarified; this was followed by introducing the urban dynamic air–ground risk factors and constructing a dynamic risk assessment model containing risk level information; finally, the improved A* algorithm based on the risk cost was employed to plan the eVTOL air route network, which finally realized the purpose of short path length and low total risk. The simulation results showed that the route generated by the improved A* algorithm could reduce the risk cost by at least 30% with a relatively small path cost, which ensured the operation efficiency and safety of eVTOLs and laid the foundation for the further sustainable and green development of urban airspace in the future.
1. Introduction
Green and sustainable development is the tendency and target of future transportation development. With the progress of society and the increase in traffic demand, the growth rate of urban population and vehicular transport rises by year, but urban ground transportation tends to be saturated, and its gradually difficult to match the planning and construction rate to the requirement. Meanwhile, the increase in ground transportation congestion time and rate have easily lead to the obstruction of mobility, which to a large extent impedes the process of urban development, and as a result, the aspirations of the people for a safe, efficient, and novel mode of air traffic. Furthermore, social demands for the utilization and planning of urban low-altitude airspace have made urban air traffic become an inevitable trend in the future development of transportation [1].
As the technology related to electric vertical takeoff and landing (eVTOL) vehicles develops rapidly and ripens, eVTOL has become a focus of future urban transportation initiatives and has gradually entered the field of livelihood. At present, eVTOL products such as JAS4-2 from Joby Aviation, VoloConnect from Volocopeter, E20 from Timetech, and X2 from Xiaopeng have been successfully test-flown and, in addition, institutions such as MIT, BUAA, NWIT, and Xihua University have all launched eVTOL research and development programs.
In terms of regulations, many countries have successively issued related regulations, proposals, or plans on air traffic construction and facilitation of eVTOL operation with a view of adapting to the development of modern transportation, as shown in Table 1.

Table 1.
Regulations related to air traffic construction.
In particular, EASA published the world’s first draft rules for urban air traffic in March 2020, laying the foundation for the development of the corresponding services; in May of the same year, EASA published a proposed conformity assessment methodology for eVTOL airworthiness certification, providing detailed guidance on how to demonstrate the safety of eVTOLs; in May 2023, the FAA published the “Urban Air Traffic (UAM) Operation Concept 2.0” to construct a new version of the blueprint for airspace and procedure changes for future air-taxis and other advanced air traffic (AAM) operations; in July of the same year, the FAA formally released the “Advanced Air Traffic (AAM) Implementation Program V1.0”, which plans to achieve large-scale operation of eVTOLs by 2028; China’s Ministry of Transportation and Ministry of Science and Technology jointly issued an “Outline of Medium- and Long-Term Development Plan for Science, Technology and Innovation in the Field of Transportation (2021–2035)”, deploying the research and development of flying cars; and the State Council of China promulgated the “Interim Regulations on the Administration of Flight of Unmanned Aerial Vehicles” in April 2023, which pointed out the direction of the control over aircrafts in the low-altitude airspace. In addition, countries such as Japan, Korea, Canada, and Singapore have also introduced corresponding laws and regulations aimed at strengthening the control of urban airspace while regulating the operation and management of civil UAVs. Thus, it is evident that the focus of urban transportation planning has gradually shifted to air traffic.
Currently, “air route” is an important operation mode of urban air traffic, which could improve the safety and efficiency of aircraft as eVTOLs, facilitate the management of air traffic, and thus guarantee the safe operation of aircraft in the urban airspace. In recent years, many breakthrough studies have been conducted in fields such as urban air traffic, risk assessment, and air route planning. In terms of air traffic design, Li [1] and Quan [2] systematically elaborated the management methods of urban air traffic from two different aspects, i.e., airspace structure delineation and aerial–ground traffic integration, respectively. Wang [3] proposed a linear dynamical system (LDS)-based traffic assignment method to reduce the complexity of air traffic in accordance with the design of UAM corridors. Bharadwaj [4] presented a UAM architecture based on vertical hub hierarchical and decentralized management. Qu [5] constructed a UAM traffic rule system from the perspectives of single-aircraft eVTOL, specific routes, and critical control areas. In terms of risk assessment, Goncalves [6] modeled the UAV safety assessment process through Petri Nets to analyze the failure conditions under which crashes occurred. Stefano [7] linked spatially discrete factors affecting the flight of UAVs to the cost of risk for risk quantification. Zhang [8] and Han [9] analyzed the probability of UAV accidents and failure cause data, respectively, and proposed methods for calculating the crash impact area, ground impact accident, and intermediate event probabilities under different operating conditions. Pang [10] and Hu [11] contributed to the quantification of the risk costs of flight influences that incorporated fatality risk, property damage risk, and noise, as well as risk categories such as people, vehicles, and manned aircraft. In terms of path planning, Zhang [12] and Lin [13] analyzed the risk impact caused by UAV flight and introduced risk factors into the path planning problem to reduce the risk cost. Li [14] and Wu [15] proposed various improvement methods for eVTOL path planning from the perspectives of shortening the path length and generating random collision-free paths, respectively. Wang [16] proposed a desensitized optimal control (DOC) methodology to improve the robustness of eVTOL flight trajectories based on the thermal effects and battery inhomogeneity on flight performance. And, to accommodate the development of air traffic and support dense aerial operation, the research trend is gradually concentrating on the exploration of route network planning techniques. Hildemann [17] proposed a multi-criteria optimization method to improve urban routes under multiple conflicting objectives. He [18] introduced a route (pipeline) planning method for complex urban environments based on air corridor structure, decoupling the difficult network planning into a single-path planning problem so as to design a dense and aligned route mesh structure within the network. Tang [19] presented a low-altitude management system (LAMS), which automatically generated a route network with obstacle avoidance capability in low-altitude airspace according to operational requirements such as departure, destination, and flight time. Shao [20] constructed an integrated model based on path planning and distributed sequencing to solve the problem of cooperative scheduling of incoming and outgoing flights by considering dynamics constraints and prioritization. Neto [21] proposed a trajectory-based urban aerial-maneuvering simulate platform capable of evaluating generated paths from the perspective of efficiency and safety.
The aforementioned studies have explored the technical direction for the development of urban air traffic, but there are still some remaining problems. For example, the granularity of urban airspace structure is too coarse and unfavorable to the management of various types of aircraft; the risk assessment of urban airspace does not take into account the entire elements of space and time, which easily leads to imprecise risk cost; and the planning of air route network is mostly based on free airspace, with the goal of attaining the shortest path, but the risk factors of the urban airspace are taken into account less, which results in a large cost of air route at risk, and a poor adaptive ability of the air route network. In the meantime, due to the fact that the urban low-altitude airspace environment is extremely complex on both temporal and spatial scales, and given that the requirements for travel efficiency and safety are highly stringent, which make the planning of the urban air route network for eVTOL and other aircrafts more difficult, the demand for the ability of the air route network’s self-adaptation under the complex urban low-altitude airspace environment is becoming increasingly severe.
To address the problems of a low rate of airspace utilization, weak robustness, and the adaptive adjustment ability of traditional aircraft path planning under complex urban low-altitude airspace environment, this research implemented the delineation of eVTOL operational airspace by studying the mission requirements of various types of urban aircrafts and constructed a urban dynamic risk assessment model from spatial–temporal perspectives by introducing dynamical risk factors such as meteorological threats. On this basis, considering that the A* algorithm features high search efficiency, strong global planning ability, and excellent capability in solving the shortest path, it is thus consistent with the demand for establishing the eVTOL air route network of higher efficiency and shorter paths as studied. Therefore, the A* algorithm was adopted as the basic planning algorithm and was improved by incorporating the risk cost and penalty factors, so as to construct a safe and efficient urban air traffic route network for eVTOLs. The research framework is shown in Figure 1, and the specific work and conclusions are as follows:
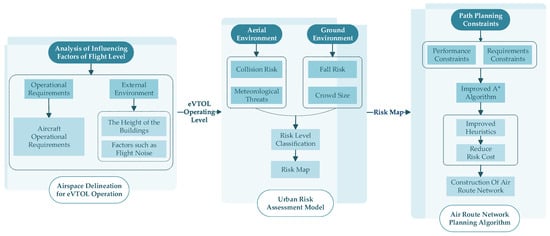
Figure 1.
Research framework of eVTOL air route network based on improved A* algorithm.
- To establish an operational airspace structure model for eVTOLs by delineating the levels of vertical structure of urban low-altitude airspace based on the classification of aircraft and operational tasks, so as to facilitate the subsequent risk assessment and analysis of the main operational levels of eVTOLs;
- To construct a visualized dynamic risk raster map. By rasterizing the delineated vertical levels and incorporating various types of dynamic and static risk factors and other airspace situational characteristics, an urban low-altitude risk assessment model was developed, based on which the risk values of raster cells were calculated, and thus regional risk level indicators were designated, providing risk evaluation criteria for the subsequent planning of air route networks;
- To propose an improved A* algorithm combining risk and cost, which adopts a repetitive path penalty factor strategy to obtain multiple dynamic optimized paths between the takeoff and landing points to ensure a balance between flight cost and route similarity, thereby obtaining a set of paths with lower risk and better performance to satisfy the operational requirements of eVTOLs, which guarantee operational efficiency and safety and lay a foundation for the further effective opening of the urban airspace in the future.
The proposed method for planning eVTOL air route networks in urban airspace based on the improved A* algorithm innovatively incorporates dynamic risk maps and penalty factors, considering urban risk variables in path planning and extending the traditional single-path planning to air route network design. The network planned based on this basis could rationally deploy resources according to the dynamic variations in airspace situational characteristics and intelligently plan air routes, ensuring the operation safety and travel efficiency of air traffic.
2. Strategies for Delineating the Structure of Urban Low-Altitude Airspace
Urban low-altitude airspace generally refers to the atmospheric space above the ground and below 1000 m in altitude that can be exploited by aircraft. Currently, problems exist in such airspace where multiple aircraft missions are performed but the boundaries of the demanded airspace are not clear, and where the relevant regulations have not yet made a detailed plan for the airspace. Since the autonomous collision avoidance capability of aircraft is not enough to support free flight in the airspace at the current stage, a reasonable delineation could better guide the safe flight of the eVTOL and other vehicles, reduce the probability of flight conflicts, effectively manage the flight tasks, and improve flight efficiency.
To achieve the vertical level structure delineation in urban low-altitude airspace, a strategy based on aircraft types and operational tasks was adopted in conjunction with the future development needs, and the operational airspace structure model of eVTOL was established to determine the main operational altitude of eVTOL. During our research, it was found that the existing airspace management related regulations and studies, all of which take altitude as the standard for airspace boundary delineation, namely, by integrating the current aircraft performance, operational safety needs, and airspace capacity and considering from the perspective of reducing the operational conflicts of various types of aircraft, use an altitude layered structure with higher benefits in terms of safety, efficiency, and noise, which was employed for the delineation of the current urban low-altitude airspace [22].
According to FAA’s “Advanced Air Traffic Implementation Plan V1.0”, the future AAM is expected to operate at an altitude of 1200 m, and thus the urban low-altitude airspace below 1000 m was defined in a vertically inverted hierarchical manner. By defining the airspace structure in levels, restrictions were imposed on the flight altitude, direction, and speed of various types of aircraft, thereby reducing the complexity of the airspace structure and improving the utilization rate, capacity, and operational efficiency. To guarantee flight safety, buffer layers were set up above and below some altitude layers prone to flight conflicts [23] to reduce the risk as well as to serve as an emergency operation area reserved for special cases.
The airspace structure model required reference to the local building heights. In Chengdu, Sichuan Province, China, for example, most of the buildings in the main region of the city, such as shopping malls, aged communities, and functional buildings, are lower than 15 floors (about 50 m); most of the high-rise buildings in the central regions of the city, such as newly developed communities, office towers, and landmarks, are more than 25 floors (about 80 m) [1], of which there are about 30 high-rise buildings over 200 m and about 5 over 300 m. The specific airspace structure model is shown in Figure 2, and the specific delineation strategy is as follows:
Figure 2.
Dynamic risk assessment model for the urban low-altitude airspace structure.
- 1.
- According to the type of aircraft and the property of the mission, 120 m of urban low-altitude airspace was taken as the demarcation layer, with lower than 120 m for the operation of light and small-sized aircraft, 120–150 m was set as the buffer layer, and 150 m or above was for the operation of medium and large-sized aircraft.
- 2.
- Below 120 m:
- Below 50 m was the main area for recreational aerial photographic and private civil UAV flights, except for special declarations, as a way to better ensure safety and privacy issues;
- 50–60 m was a buffer layer to avoid interference of civil UAVs with those executing public duties;
- 60–90 m was the level for public duties performed by small UAVs, and according to the nature of inspection tasks such as ground transportation, bridges, houses, etc., UAVs could accomplish most of the tasks in such level;
- 90–120 m was the main operation level for logistics UAVs, and due to the high takeoff and landing frequency of such UAVs, the operation safety and noise problems are relatively serious. Considering the heights of urban buildings and noise impacts, such a level was applicable for logistics UAVs operation;
- Other types of UAVs were flown at the appropriate levels, primarily based on the mission requirements.
- 3.
- From 120 to 150 m as a buffer layer.
- 4.
- 150 m or above:
- 150–270 m as main operation level for medium- and large-sized UAVs for mapping, firefighting, and rescue, and helicopters for aerial photography and emergency rescue as well. Such a level should be fully considered for the integration of operation rules of manned and unmanned aircraft;
- 270–300 m as a buffer layer;
- The airspace above 300 m served as the main levels for eVTOL operation, starting from 300 m and setting one level every 90 m upwards, with a 30 m buffer layer between every two adjacent levels, and a course angle of 0–45° for each level [24]. In addition, the buffer layers also served as buffer spacing belts, emergency avoidance layer areas, and also as emergency accesses for special mission aircraft, etc.
With the rapid development of municipalities, there are many aerial risk factors (e.g., weather, third-party aircraft) and ground risk factors (e.g., aircraft impact threat to crowds) in the urban low-altitude airspace, which pose potential flight risks to aircraft. How to assess the impact of risk costs of the above factors on the flight path planning of aircraft was a key element in the research.
On the basis of delineating low-altitude airspace structure, the urban airspace environment was rasterized, and the influences of air situations such as meteorological conditions and ground environments such as crowd density were analyzed in depth to establish a dynamic risk assessment model and set up risk assessment indexes. The risk level was classified based on these risk assessment indexes, and thus a real-time risk raster map was generated in response to the environmental changes in real time.
The parameters involved in the risk assessment models and corresponding implications are shown in Table 2.
Table 2.
Parameters related to risk assessment models.
2.1. Urban Risk Assessment Model
Airspace risk assessment refers to analyzing and evaluating the various risks that may arise when aircraft such as eVTOLs operate in urban airspace. Three-dimensional rasterized modeling was adopted to classify the eVTOL operational levels, and the aerial and ground risks faced by each raster cell were subsequently investigated. The risk cost of eVTOL operation in urban airspace was assessed by aerial risk RS [25] and ground risk RG, and the following risk assessment, i.e., risk cost model, was established as
The larger the risk cost C is, the more the operation is less safe or more hazardous. According to the related works [7,26], population density 2 × 10⁴/km2 was taken as the demarcation line between densely populated area and general area.
2.1.1. Aerial Risk Assessment
The operation of eVTOL in urban airspace is subject to the impacts of conflicting collisions with other aircraft as well as changes in the weather environment. The two impacts were defined as collision risk and meteorological threats, and an aerial risk assessment model was established accordingly as follows:
RS(t) = CA(t) + γ1 MET.
- Collision Risk
According to the Reich collision model and the circular sphere collision template [27,28,29,30], the distance [31,32] between eVTOL i and other flying object j relative to the circular sphere at moment t was denoted as:
and when Di,j(t) > , eVTOL i and object j are conflict-free at moment t. The longer the distance between the two, the smaller the degree of conflict risk. Therefore, the spatial proximity rate was obtained as:
where Di,j(t − 1) was the distance between eVTOL i at moment t − 1 and flying object j at moment t relative to the sphere. When was larger than 0, eVTOL i was in a state of away from object j, and vice versa in a state of approach. Thus, the risk relationship between the temporal and spatial proximity of eVTOL i and object j was given by [33]
The total cost of aerial collision risk between eVTOL i and flying object j in the time period from t − 1 to t was
- 2.
- Meteorological Threats
The meteorological threats to the operation of eVTOL in low-altitude airspace mainly originate from winds and rains of a certain intensity. Due to the dynamically changing nature of meteorological factors, a BP neural network prediction model was developed to analyze the meteorological threats, predicting the 19th hour of weather data based on the previous 18 h data of the real-time coordinate o(x,y,z) of the eVTOL. Meanwhile, by using activation function Relu to process the output of each neuron, as
The vertical level of eVTOL at moment t was chosen, and 50 × 50 = 2500 (x = 1, 2, 3, ⋯, 50; y = 1, 2, 3, ⋯, 50) grid points were selected for weather prediction in subsequent simulations, and the rest of the levels were consistent with the prediction method. For the coordinate (x,y,z) of each point, the corresponding values of wind speed z and rainfall intensity ra over a 24 h period were calculated, and the meteorological threats model was thus expressed as follows:
MET = MET1 + MET2.
The correspondence between wind speed, rainfall intensity, and meteorological threats is shown in Table 3.
Table 3.
Correspondence between wind speed, rainfall intensity, and meteorological threats.
2.1.2. Ground Risk Assessment
The urban ground environment, such as the gathering of people in the area, ground shelter, etc., influences the damage situation and the degree of danger of eVTOL accidents in the area. For the event of eVTOL endangering the urban ground population, the ground impact risk RG of the area at a certain moment was denoted as [34]:
RG = P S=γ3 DS M.
When the eVTOL fell from urban airspace, the fall risk DS was defined as:
DS = λ·L·I.
Considering the ground shelter and the kinetic energy of the eVTOL crash impact [35], the probability L of casualty of a pedestrian struck by an eVTOL could be expressed as follows:
where f was proportional to the cushioning effect [26]; the expression for the kinetic energy of impact E, was
where vx and vy were [36]
and t was denoted as:
The casualty rate of personnel affected by impact is related to the sheltering effect of the environment. When the vegetation and the low buildings in the area are denser, the sheltering effect is better, the impact buffer effect is stronger, and therefore the casualty rate will be lower. The range of values of ground sheltering coefficient f is (0,1] [37], and the values are shown in Table 4.
Table 4.
Configuration of ground sheltering coefficient f.
Measuring the severity of personnel injuries corresponding to different injury types and the required impact energy thresholds [38], the injury level coefficients I for pedestrians subjected to eVTOL impacts were obtained as shown in Table 5.
Table 5.
Correspondence between the degree of injury to pedestrians from eVTOL impacts.
When an urban low-altitude eVTOL crash occurred, define the number of people M in the area who collided with an eVTOL as
M = A ρ.
The ground impact area A was related to factors such as the geometry of the falling eVTOL, the sliding angle, and the height of the person on the ground [39].
A = 2 × (r + rb + rp) × d + π (r + rb + rp)2.
Ground-based crowd density possesses both spatial and temporal attributes [40], and it varies in different raster cells and time periods. Therefore, a crowd density prediction model CNN-LSTM based on past crowd density data was established by utilizing convolutional neural network (CNN) and long–short-term memory network (LSTM) [41], and the ground population density ρ in the area at moment t could be obtained by joint training of the models.
2.2. Establishment of Risk Map
According to the establishment process of the risk assessment model, it is known that the risk level of eVTOL in the urban low-altitude airspace is mainly related to the flight speed of eVTOL, the ground shelter coefficient, the population density, the meteorological threats, and the proximity rate to other flying objects, etc. Therefore, a high risk can be regarded when a high-speed eVTOL passes through the area with a low shelter coefficient, a dense population, poor meteorological conditions, and a low proximity rate, whereas a low risk is recognized when a low-speed eVTOL passes through an area with a high shelter coefficient, a sparse population, good meteorological conditions, and a high proximity rate. Therefore, the following judgment indicators were established to classify the risk level as shown in Table 6.
Table 6.
Risk level classification indicators.
Based on the dynamic risk assessment model, the total risk value (i.e., the sum of the aerial risk plus ground risk) for each raster cell in the selected level was analyzed and computed individually to construct a three-dimensional risk assessment matrix of n × m × k, where the risk matrix Ck for the Kth level was expressed as
3. Improvement of A* Algorithm for eVTOL Air Route Network Planning
Based on the above strategies of urban low-altitude airspace structure designation, the study focused on how to efficiently establish a safe and reasonable aerial three-dimensional transportation network suitable for eVTOL operation under the premise of adapting to the complicated and dynamically changing situations and guaranteeing the utilization rate of the airspace.
Parameters involved in the eVTOL route network planning and corresponding implications are shown in Table 7.
Table 7.
Parameters involved in the eVTOL route network planning and corresponding implications.
3.1. eVTOL Path Planning Constraints
The route of eVTOL flight in urban airspace should not only avoid urban buildings and other operating aircraft, but also meet the requirements of relevant laws and regulations and the limitations of its own performance. The section mainly focused on the analysis of eVTOL’s flyable altitude and maximum allowable range.
3.1.1. Flight Altitude Constraints
According to Section 1, under the constraint of flight mission, the operational vertical level of eVTOL was planned at 300–1000 m. Moreover, the actual flight altitude of eVTOL should fully consider the number of buildings at such a level and the impact of flight noise on the residents to ensure that the cost of path planning and the influence are minimized. Set the eVTOL operation level to be [hmin,hmax], and the flight altitude of eVTOL should satisfy
hmin ≤ he ≤ hmax.
- Number of High-rise Buildings
The high density of modern urban structures and the number of high-rise buildings can pose a safety threat to the operation of aircraft such as eVTOL, so the impact of urban building heights needs to be a key consideration in the path planning for eVTOL. For example, in Chengdu, Sichuan Province, China, there are about 30 high-rise buildings over 200 m and 5 over 300 m, and according to relevant regulations, the construction of buildings over 250 m in height is strictly controlled. It can be seen that in the future, the airspace above 250 m in Chengdu will be less affected by buildings, and the space available for eVTOL operation is relatively broad.
- 2.
- Noise Impact
An eVTOL is supposed to operate in airspace that does not interfere with residential life [42]. Currently, the noise of eVTOL varies by model, and since the eVTOL manufacturers do not disclose the situation of noise emission, the Uber Elevate target noise level (i.e., a maximum noise of 62 dB at an altitude of 160 m above the ground) was adopted for the analysis, and the noise pressure was specifically taken to be 100 dB at a reference distance of 1 m. The equation of the sound pressure at ground level was expressed as [17]
Lp = Lm − 20 log10(l/lm).
To guarantee the living quality of the residents in the newly developed neighborhood (i.e., building height of about 80 m), the flight altitude of the eVTOL should be higher than 125 m when satisfying the acceptable noise intensity of 67 db for urban air traffic, as calculated by the ground sound pressure formula [43].
The planned eVTOL flight level of 300–1000 m in Section 1 was consistent with the operational requirements described above, and therefore the subsequent path planning was developed based on the risk maps for such level.
3.1.2. Maximum Range Constraints
Maximum range Lmax is the furthest distance that eVTOL can reach to ensure a safe landing under full fuel or full power. eVTOL should complete the mission before energy exhaustion, so the path planning of eVTOL has to complete the search within the maximum range distance, i.e., the length of the planned path cannot exceed the limit of Lmax. The total flight length of eVTOL consists of small path segments between each neighboring raster node of the pathway. Suppose that the length of each small path segment had Euclidean distances between the two nodes, then the length of the flight path of eVTOL from the takeoff point A, via node Oi, and finally arriving at the landing point B was
and the maximum range constraint was denoted as
L ≤ Lmax.
3.2. A* Algorithm and Improvements
3.2.1. Principles of A* Algorithm
The A* algorithm is one of the most widely adopted algorithms for path planning problems in deterministic environments, with a favorable global path planning effect, which is simple and direct way to plan a shortest path between the takeoff and landing points. The A* algorithm was applied by introducing a cost estimation f(n) as a heuristic function, denoted as
where n indicated a node or state during the process of searching. By comprehensively evaluating the distance g(n) to the start position and the distance h(n) to the target position of the nodes to be expanded around the current search node and selecting the search node with the minimum generation value for expansion until it expanded to the target node or the search failed, the A* algorithm makes the whole process of expansion more targeted and purposeful due to the introduction of the heuristic function, which reduces the number of expanding nodes and improves the efficiency of path planning and has the advantages of low computational overhead as well [44]. The A* algorithm created two lists, Openlist and Closelist, during the process of running, where Openlist was used to store the nodes that have been searched but not expanded, and Closelist was utilized to store the nodes that have been expanded. The implementation flow of the algorithm is shown in Figure 3.
f(n) = g(n) + h(n),
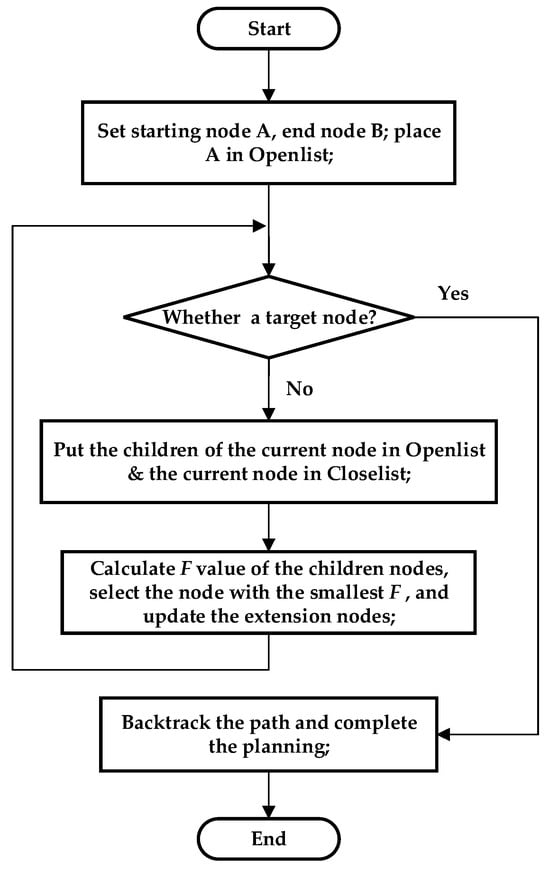
Figure 3.
Flowchart of traditional A* algorithm.
3.2.2. Improvements to A* Algorithm
The heuristic function of the conventional A* algorithm only accounts for the distance cost, while eVTOL, in actual operation, not only needs to consider the distance cost, but should also consider the risk cost caused by eVTOL to the ground crowd, buildings, etc. Meanwhile, the traditional A* algorithm can generally only search a single optimized path in a single time, while the air route network needs to establish multiple paths, which does not satisfy the demand of multi-flight vehicle missions. To address the above problems, the traditional A* algorithm was improved through two aspects: (1) the introduction of the risk cost, which improved the heuristic term; (2) the definition of the penalty factor, which was applied to updating the flight cost. The introduction of the risk cost enabled the A* algorithm to combine with the dynamic risk map to adaptively adjust the flight paths according to the real-time risk changes, so as to obtain flight paths with lower risk cost; while by defining penalty factors, multiple paths could be planned between the takeoff and landing points, thereby constructing a route network consisting of multiple optimized paths with lower cost and lower risk to enhance the robustness of eVTOL operation and ultimately achieve a safe and reasonable air route network.
- 1.
- Introducing Risk Cost
To reduce the risk cost of planning paths, combined with the risk assessment model, the heuristic function expression was defined as
f(n) = g(n) + h(n) + C(n).
Suppose the eVTOL flight takeoff point is A(x0,y0), the flight to-be-expanded node is B(xi,yi), and the flight landing point is C(xj,yj). The distance h(n) from the to-be-expanded node to the target location was comprehensively evaluated by the Euclidean distance:
where C(n) = r(Oi,j,k), i.e., the risk value of the risk map corresponding to the raster cell where this node was located, i = 1, 2, 3…, j = 1, 2, 3…, k = 1, 2, 3, …, l.
- 2.
- Defining Penalty Factors
After planning an optimized path, a penalty factor was defined to adjust the path distance cost of the raster cells through which the path traveled, i.e.,
The flight cost and path similarity were controllable by setting the values of Smax and φ. When Smax = 1.0, it was an invalid penalty factor, and the number of optimized paths planned in such case was 1. When Smax < 1.0, the penalty factor functioned, and multiple optimized paths could be obtained.
The heuristic function after introducing the penalty factor was denoted as
where f(n)x referred to the heuristic function for the xth flight path planning. The improved heuristic function aims at “short distance and low risk” and is able to plan multiple flight paths with similar distance and risk cost for the same set of takeoff and landing points.
- 3.
- Implementation Steps for the Improved Algorithm
Define the takeoff and landing points of a mission area as Ac and Bd, respectively, where c and d is the number of the takeoff and landing points in the area, c = 1, 2, 3, …, d = 1, 2, 3, …; i refers to the number of paths expected to be searched for a pair of takeoff and landing points, and j refers to the number of paths that had been searched for so far; Pn refers to the nth flight path from the takeoff point Ac to the landing point Bd, and Ln is the total length of the flight path of Pn; Cmn refers to the degree of overlap between two flight paths of Pm and Pn, i.e., the total length of the area where two paths repeated, n = m − 1, m − 2, …, 1; and Smn refers to the similarity of the mth optimized flight path to the nth one, Smn = (Cmn/Lm), 0 < Smn < 1.0. The specific steps of the improved algorithm are as follows:
Step1: Set the values of maximum similarity Smax, positive coefficient φ, and expected number of search paths i according to the requirements, and at such moment the number of searched paths is j = 0. Input the risk map of the kth level and read the risk cost value, thus obtaining the information on environmental obstacles and risk cost.
Step2: Search for paths corresponding to takeoff point Ac and landing point Bd. Input the locations of the takeoff point A1 and landing point B2 and plan a path from A1 to B2 utilizing the improved heuristic function f(n)1 as (23). Once planned, backtrack, output the flight path notated as P1, and preserve the raster cells the path traveled through and save the flight cost. The specific flow of such step was:
- Define a raster cell in the selected risk map as a search node. Create two lists, Openlist and Closelist, where Openlist was used to store the nodes that had been searched but not expanded, and Closelist was used to store the nodes that had been expanded;
- Search the path from the takeoff point A1 to the landing point B2, and put A1 in the Openlist;
- Determine whether the takeoff point was the goal point and, if so, end the search; otherwise, visit the nodes near A1, while putting the non-obstacle points in Openlist, then calculate the cost valuation by Equation (23), and finally put A1 in Closelist;
- Select the extension node with the lowest cost valuation, remove it from Openlist and place it in Closelist, and if it was the specified target point, the path planning was completed and the algorithm was ended. Otherwise, proceed to the next step;
- Take node Oi as the current node, visit the surrounding nodes of which, and for the nodes that were not in Closelist, add them to Openlist for cost calculation;
- Return to the selection until the extension reached the target point;
- Save the extended nodes and the f-value of each node, backtrack, and save the path.
Step3: Judge whether the expected number of paths to be searched was reached. j = j + 1, if j ≥ i and the flight path search for the pair of takeoff and landing points terminated, and so go to Step6; if j < i, the search is to be continued, so go to Step4.
Step4: Input the flight cost of the raster cells traveled by the flight path P1 saved by Step2, when the raster cell was traversed during the search process, multiply the flight cost of the cell by the penalty factor δ; according to (26), obtain the adjusted heuristic function as f(n)2 and plan the flight path. Once planned, backtrack, and output the flight path notated as P2, preserve the raster cells the path traveled through, and save the flight cost.
Step5: Input the duplicated path length in flight paths P1 and P2, calculate the path similarity between P1 and P2, and if S21 > Smax, at end of the path search for the pair of takeoff and landing points, then go to Step6; otherwise, go back to Step3.
Step6: Plan the flight paths between remaining takeoff and landing points. When the path search of a certain pair of points is finished, search the path of another pair until all pre-planning of the search completed.
Step7: End of the algorithm, save the map, backtrack the paths, and output the planned paths with corresponding path costs and risk costs in the risk map.
The specific algorithm flow is shown in Figure 4.
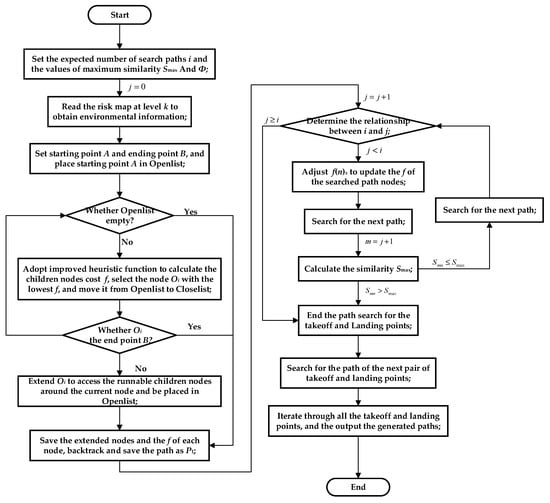
Figure 4.
Implementation steps of the improved A* algorithm.
With the improved A* algorithm, multiple optimized routes can be obtained for the same set of takeoff and landing points. Then, traversing the loop based on the risk map for different points, respectively, the set of multi-paths optimized routes for multiple pairs of takeoff and landing points can be acquired and the air traffic route network can ultimately be formulated.
4. Simulation and Analysis
4.1. Environment and Parameters of Simulation Experiment
MATLAB was utilized for simulation verification. A flight path was planned for an eVTOL located in the airspace of an urban area of Chengdu City, Sichuan Province, China, at 19:00 on a given day. According to the airspace structure model, the true height of 300 m was taken as the flight level, and a 10 km × 10 km urban area of Chengdu was selected on the level for simulation. The area was rasterized to 200 m × 200 m to form a 50 × 50 with 2500 total pieces of raster cells. The airspace rasterization modeling is shown in Figure 5. Within the chosen area, there was a diverse population distribution with high, medium, and low densities, i.e., high-density population regions, such as commercial avenues and offices, medium-density population regions, such as residential neighborhoods and community centers, and low-density population regions, such as suburban districts and agricultural lands. In addition, a portion of buildings exceeding 300 m in height were present in the area, as well as partial no-fly zones, such as schools and museums, which were also included. Furthermore, there were forests and parks in such areas, and therefore it was common to encounter magpies flying up to 300 m in airspace, which might affect the safety of eVTOL flights. In terms of weather, extreme conditions with high rainfall were considered, which could likewise affect the operation of the eVTOLs. To summarize, the diversity and complexity of the urban environment, including population density, building heights, no-fly zones, bird activity, and extreme weather, etc., were comprehensively addressed in the chosen area to assess the sophistication and applicability of the improved A* algorithm.
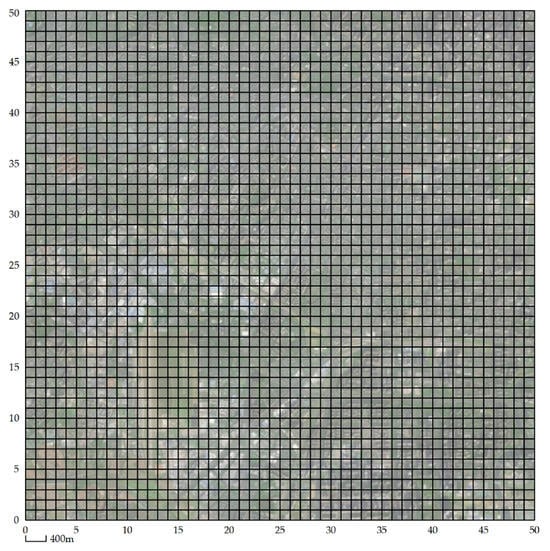
Figure 5.
Airspace rasterization modeling.
Set the takeoff point coordinates of eVTOL as A1(1,1), A2(24,1), the landing point as B1(50,50), B2(1,50), the flight altitude as he = 300 m, and the length of the planning path as LAB Lmax. Take EH216-S from EHang, which obtained the world’s first eVTOL type certificate, as a reference object, of which detailed parameters are shown in Table 8.
Table 8.
Detailed parameters of EH216-S.
The meteorological conditions in the experimental area on such day from 0:00 are shown in Table 9.
Table 9.
Record of meteorological conditions.
The parameters for determining the risk level classification are shown in Table 10.
Table 10.
Parameterization of risk level classification.
Other relevant parameters as shown in Table 11.
Table 11.
Parameterization of risk assessment examples.
4.2. Improved A* Algorithm Simulation Results and Analysis
4.2.1. Initial Modeling of The Risk Raster cells
Through fieldwork, the area was far away from the airport and without buildings with a height greater than 300 m, i.e., no obstacle raster cells, but contained no-fly zone raster cells such as schools and museums. The initial risk raster map of the airspace is shown in Figure 6, where the white areas are expandable raster cells and the black areas are non-expandable ones.
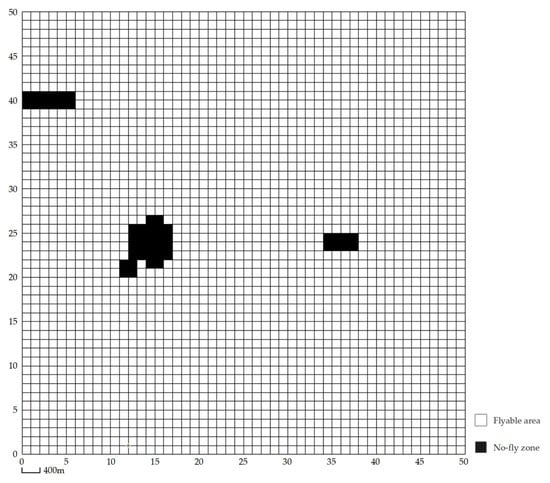
Figure 6.
Preliminary risk raster map.
4.2.2. Generation of Risk Maps of Urban Airspace
- Aerial Risk Analysis
For the aerial risk in the area, the impact brought by flying birds on the operation of eVTOL is mainly discussed. Birds in the city primarily live within the vegetation cover, so the degree of greenery in the area was taken as the basis for bird activities, as shown in Figure 7. The common birds in the area that could reach a flight height of 300 m were magpies, whose flight speed was 14 m/s, so the probability statistics in the raster cells were based on this to randomly generate the magpie’s appearance position. When defining the position, the probabilities of magpies appearing in areas with high, general, and low degrees of greenery were defined as 70%, 60%, and 30%, respectively.
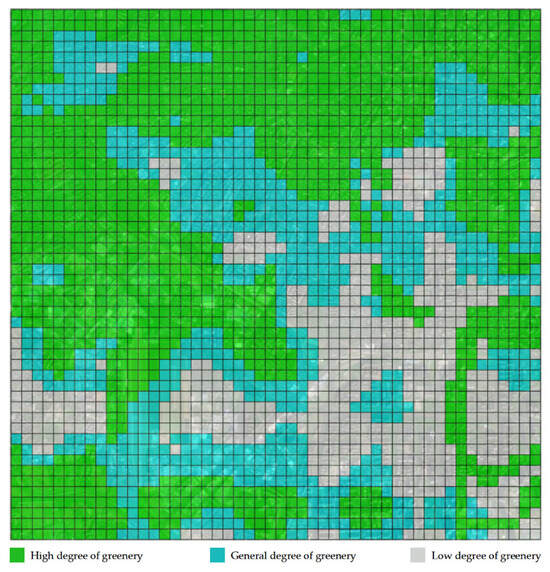
Figure 7.
Regional greening.
The meteorological data in Table 9 were fed into the BP neural network model, and the number of neurons in the input layer was set to be 18, 15% of the test set, with 17 hidden layers, and the learning times of the neural network were 500, with the initial weights and bias terms within twice the standard deviation of the standard normal distribution and the expected error of 1.1, according to the meteorological threats risk model (8). With reference to the correspondence between the value of the wind speed, the intensity of the precipitation and the meteorological threat (Table 3) and the meteorological threat situation in the airspace at the moment was finally obtained as shown in Table 12.
Table 12.
BP neural network model meteorological threats prediction results.
We classified the aerial risk according to the requirements of risk indicators and calculated the risk of eVTOL in the area at 19:00 on the same day based on the quantification Formula (2). The evaluation indicators of aerial collision risk level are shown in Table 13, and the risk raster map is shown in Figure 8.
Table 13.
Indicators for evaluating the air collision risk level.
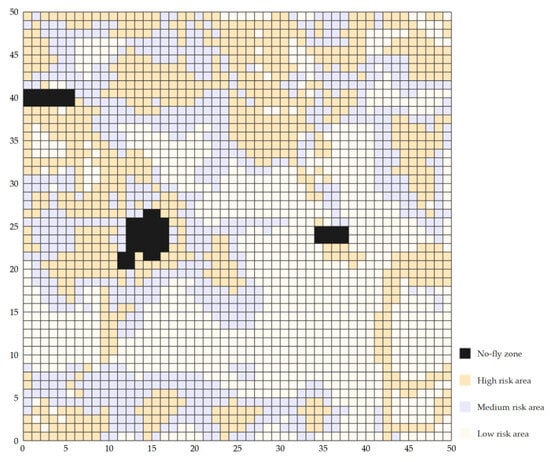
Figure 8.
Raster map of aerial collision risk.
- 2.
- Ground Risk Analysis
The population spatial distribution data of the real-time people activity heat map of the area for 7 consecutive days were taken as the dataset and input into the CNN-LSTM sub-model for training, defining the number of learning times as 1000 and the learning rate to be 0.001, to obtain the prediction of the population density of the area at 19:00 on the day of experimentation, as shown in Figure 9.
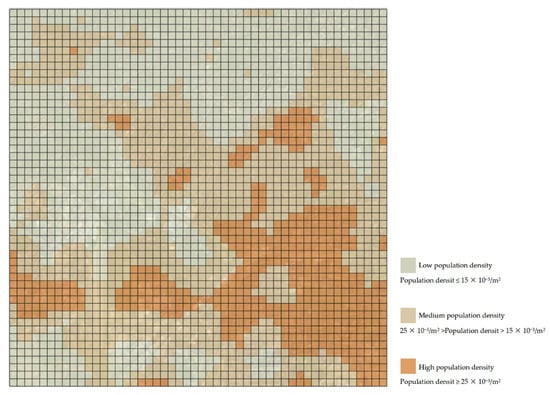
Figure 9.
Visualization of population density.
Classify the ground risk level according to the risk indicators and calculate them based on the quantification Formula (9) to obtain the ground risk of eVTOL in the area at 19:00 on the same day. The evaluation indicators of ground collision risk level is shown in Table 14, and the risk raster map is shown in Figure 10.
Table 14.
Indicators for evaluating the risk level of ground collisions.
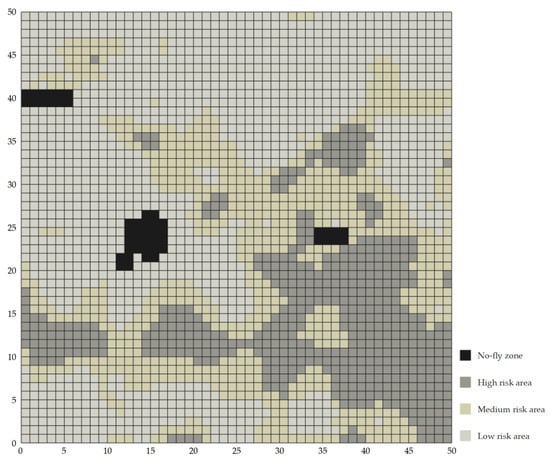
Figure 10.
Ground risk raster map.
- 3.
- Risk Level Evaluation Indicators
Calculations based on (1) an Table 10 and Table 6 were carried out to yield the evaluation indicators for the risk level of the area at the 300 m level at 19:00 on the day of the experiment as shown in Table 15.
Table 15.
Risk level classification results.
- 4.
- Risk Raster Map of Selected Area
Based on the risk matrix model (17), the results of aerial and ground risk calculations in the selected area were substituted into (1) to obtain the risk cost matrix for the 300 m level in the area. Finally, based on the risk cost matrix and the evaluation indicators, each raster cell in the area was classified, and the risk map of the area at 19:00 on the day of the experiment was generated, as shown in Figure 11.
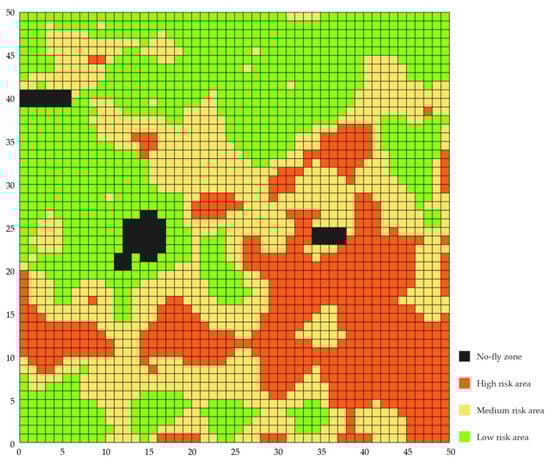
Figure 11.
Risk raster map of selected areas.
As a result, at such a flight altitude where the eVTOL was located, the number of third-party aircraft was low and the presence of birds was a probabilistic concern, so the total risk cost was less affected by the aerial risk factors; in addition, it was clear that the safety of the ground population was the main influence on the total risk cost when the eVTOL flew in urban environments.
4.2.3. Path Simulation Results of Improved A* Algorithm
The improved A* algorithm with the introduction of a penalty factor was utilized to perform multipath simulation in a map containing risk cost information for two sets of takeoff points (A1, A2) and ending points (B1, B2), yielding the flight paths of eVTOL. The initial parameters include the maximum similarity of the flight path as Smax = 0.8, the expected search path as i = 3, and the positive coefficient φ = 1.2. The air route network planning result is shown in Figure 12, with the path parameters listed in Table 16. The simulation results showed that the improved A* algorithm was capable of planning multiple paths with low risk cost for multiple sets of takeoff and landing points and avoiding high-risk-cost areas such as ground crowds, buildings, etc. to the maximum extent; when high-risk areas could practically not be avoided, the improved A* algorithm could make the risk cost even smaller.
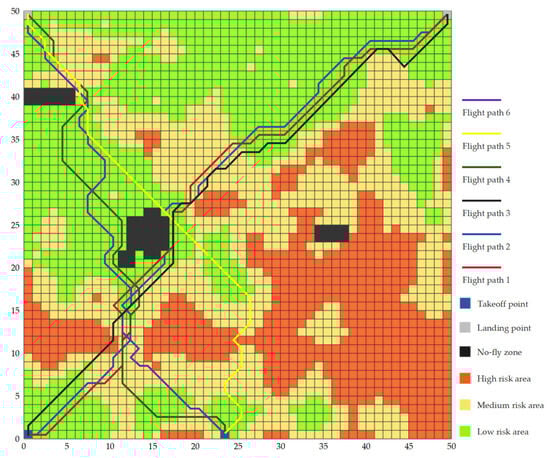
Figure 12.
Multi-path planning with multiple takeoff and landing points.
Table 16.
Parameters of multi-path planning with multiple takeoff and landing points.
The path lengths planned by the improved A* algorithm all satisfied the maximum range constraint. In the analysis of the individual flight paths in the two sets of takeoff and landing points, the path cost of flight path 1 (A1, B1) was 78.91, with a risk cost of 176.95; whereas the path cost of flight path 4 (A2, B2) was 67.01, with a risk cost of 154.63, which fulfilled the requirements. It was found that the improved A* algorithm with increased risk cost was feasible and effective.
The three flight paths planned for each pair of takeoff and landing points shared similar path and risk costs, and the similarity was less than 80%. The similar paths and risk costs of each flight path indicated that the total path costs were basically the same. At the same time, the similarity of each flight path complied with the maximum similarity requirement, which suggested that multiple flight paths with the same pair of takeoff and landing points shared a low degree of overlap and therefore were not prone to flight conflict events. From a different perspective, paths could be rationally selected based on needs such as flight distance, time, and safety.
On the basis of the aforementioned study, 9 locations were selected as the takeoff and landing points of eVTOL within the area, and 11 flight paths were planned in between, thus initially establishing the structure of the air route network, along with the calculation of the path and risk cost of the network. The result of the flight path network planning is shown in Figure 13, and the path parameters are shown in Table 17.
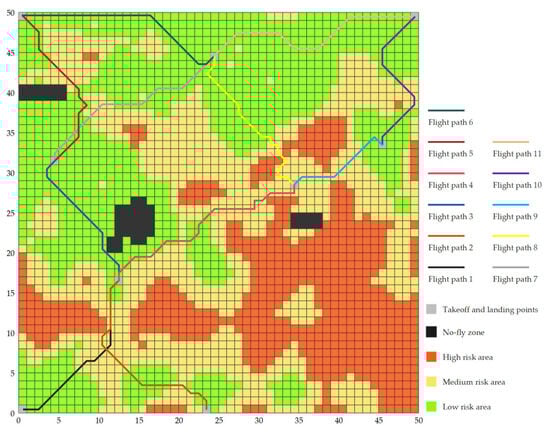
Figure 13.
Results of air route network planning with multiple takeoff and landing points.
Table 17.
Costs of flight paths in air route network.
The results indicated that the improved A* algorithm was able to plan flight paths for multiple takeoff and landing points, ultimately leading to the formation of an air route network. Each path within the network was able to avoid high-risk areas while ensuring relatively small cost.
4.2.4. Comparison of Improved Algorithms
By setting up three takeoff points A1(1,1), A2(24,1), A3(25,45) and three landing points B1(50,50), B2(1,50), B3(47,30), while keeping the simulation environment and parameters consistent, the traditional A* algorithm, ant colony optimization (ACO) algorithm, and the improved A* algorithm were, respectively, applied to path planning for a total of 9 pairs of takeoff and landing points to conduct a comparative analysis for further verifying the feasibility and effectiveness of the improved method. Since the traditional A* algorithm and ACO algorithm only support single path planning, the single path result of the proposed algorithm was thus selected for comparison. The planning results are shown in Figure 14, and the path parameters are listed in Table 18, where the risk cost-per-unit path is the outcome of dividing the risk cost by the path cost.
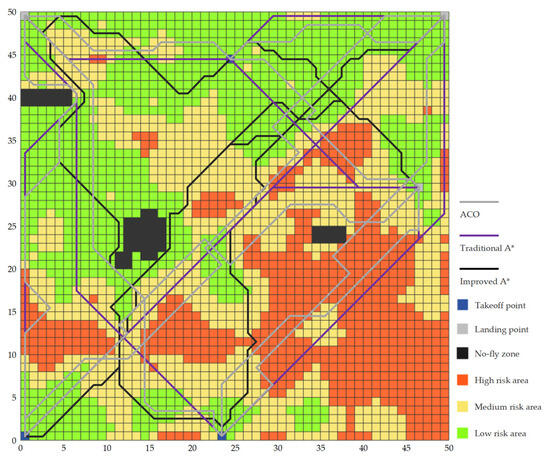
Figure 14.
Comparison of three algorithms for path planning.
Table 18.
Parameter comparison of paths for multiple algorithms.
From Figure 14, it is clear that the traditional A* algorithm directly planned a shortest path between the takeoff and landing points without considering the risk and the ACO algorithm planned paths with inferior outcomes, whereas the improved A* algorithm was able to avoid the high-risk areas or select the areas with a smaller risk value for path planning. As indicated in Table 18, in terms of flight cost, the average path costs of the improved A* algorithm, the traditional A* algorithm, and the ACO algorithm were 57.81, 46.61, and 50.71, while the average risk costs were 135.02, 214.01, and 212.93, with average risk cost per unit paths of 2.24, 4.32, and 4.10, respectively. It is evident that the improved A* algorithm resulted in a small increase in the path cost in comparison, but the risk cost was substantially reduced, and the risk cost per unit path was also lower, since the risk cost per unit path of the traditional A* algorithm and the ACO algorithm increased by 92.86% and 83.04% compared to the improved A* algorithm, which demonstrates that the improved A* algorithm is capable of planning paths with a higher level of safety. In terms of planning time, the average planning times of the improved A* algorithm, the traditional A* algorithm, and the ACO algorithm were 8.12 s, 6.90 s and 33.91 s, respectively. The improved A* algorithm was able to complete the path planning at a relatively high rate, which increased by an average of only 1.22 s (17.68%) compared to the traditional A* algorithm, in addition to the fact that the planning time was much smaller than that of the ACO algorithm. Although the improved A* algorithm increased the complexity of the algorithm to a certain extent, the search efficiency was remained high and the increased time was within the acceptable range. Therefore, the improved A* algorithm features high efficiency and practicality in path planning.
Among the paths planned by the three algorithms for each pair of takeoff and landing points, the path cost and risk cost of the improved A* algorithm were, respectively, taken as bases for the “path-risk” coordinate, while the path cost and risk cost of the other two algorithms were normalized in Table 18, as shown in Figure 15. The modulus values of the “path-risk” point from the origin of the traditional A* algorithm and ACO algorithm were larger than that of the normalized point from the origin of the improved A* algorithm and, therefore, it is clear that the comprehensive cost of the path planned by the improved A* algorithm was smaller. In summary, the improved A* algorithm is capable of paying a smaller path cost and search efficiency in exchange for a path with lower risk cost, which is conducive to improving the safety of eVTOL operation in complex urban airspace.
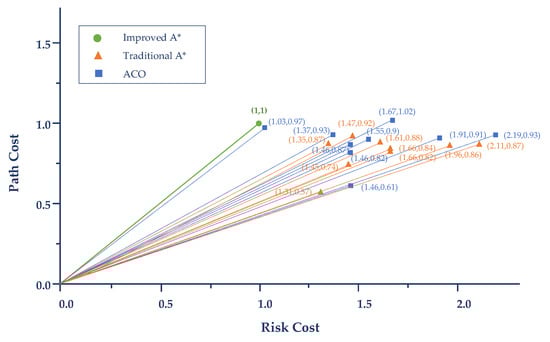
Figure 15.
Normalization results of flight costs for the three algorithms.
4.2.5. Robustness Test
To validate the robustness of the improved A* algorithm and the planning ability in different circumstances, a more complicated operating environment was set up, and the improved algorithm was employed to perform path planning, with specific planning results shown in Figure 16. Similarly, the results indicated that the paths planned by the improved A* algorithm under such conditions were still able to avoid high-risk areas, reduce the risk cost of the flight paths, and ultimately achieved the air route network planning. Hence, the proposed algorithm features better robustness in adapting to environmental variations.
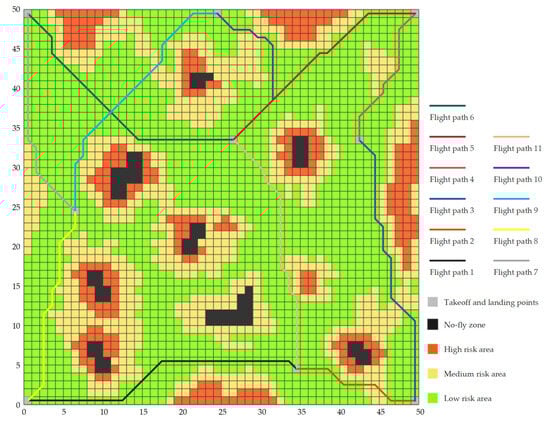
Figure 16.
Improved A* algorithm for air route network planning under different environments.
5. Conclusions
Urban three-dimensional transportation will be further developed in green and sustainable directions, and as an important operation mode for future air traffic, the air route network could improve the operation safety of eVTOL and other aircraft to facilitate air traffic management. In this study, an air route network planning method based on an improved A* algorithm was proposed in response to the problems of complexity and variability in urban low-altitude airspace, the low airspace utilization rate of traditional path planning methods, and weak robustness and adaptive adjustment ability, etc. By analyzing the operational airspace of eVTOLs, an urban airspace delineation and risk assessment model was studied, effectively combining the urban environment with the path planning technology to establish an urban air traffic route network oriented to eVTOLs. The simulation results showed that the proposed method could effectively reduce the risk cost of flight paths and build an air route network system that balanced the path and risk costs to improve the safety of eVTOL operation in the complex urban airspace in the future.
The proposed method features certain superiority, but its deficiencies should also be recognized, such as that the risk factors considered are not comprehensive enough and that the generalizability of the algorithm needs to be further enhanced. In subsequent research, the current problems or deficiencies can be improved, such as by incorporating more influential variables, i.e., factors and constraints such as the actual performance of eVTOLs and time of flight, into the risk assessment process, and conducting further studies on issues such as the conflict and integration of multi-routes and the convergence nodes of the route network as well. The proposed method focuses on eVTOLs and may also be extended to other approaches for the path planning of low-altitude aircraft in urban airspace, which involves only reasonable adjustment of the corresponding impact factors combined with the actual situation of the aircraft concerned during the risk assessment phase. In the future, with the growing intelligence of aircraft, the airspace structure will be more liberalized, and the air routes will likely evolve in a freer orientation. The proposed air route network planning idea may also be further combined with aircraft situational awareness technology to provide multi-path real-time planning capability in free and open airspace to ensure that the aircraft can fulfill the flight tasks more autonomously and flexibly under the premise of safe operation, ultimately fueling green and sustainable transportation.
Supplementary Materials
The following supporting information can be downloaded at: https://www.mdpi.com/article/10.3390/su16020561/s1.
Author Contributions
M.Y. and J.Z. contributed equally to the manuscript. Conceptualization, M.Y. and J.Z.; methodology, M.Y. and J.Z.; validation, Q.G.; formal analysis, M.Y. and J.Z.; writing—original draft preparation, M.Y. and Q.G.; writing—review and editing, J.Z.; visualization, M.Y. and J.Z.; supervision, X.Z. All authors have read and agreed to the published version of the manuscript.
Funding
This research was funded by Open-ended Research Project of Engineering Research Center of Ministry of Education for Intelligent Air-Ground Integration Vehicles and Control, grant number ZNKD2023-004, and Talent Introduction Program of Xihua University, Grant No. Z231020.
Institutional Review Board Statement
Not applicable.
Informed Consent Statement
Not applicable.
Data Availability Statement
Data are contained within the article and Supplementary Materials.
Conflicts of Interest
The authors declare no conflicts of interest.
References
- Li, C.; Qu, W.; Li, Y.; Huang, L. Overview of traffic management of urban air mobility (UAM) with eVTOL aircraft. J. Traffic Transp. Eng. 2020, 20, 35–54. [Google Scholar]
- Quan, Q.; Li, G.; Bal, Y.; Fu, R.; Li, M.; Ke, C.; Cai, K. Low altitude UAV traffic management: An introductory overview and proposal. Acta Aeronaut. Astronaut. Sin. 2020, 41, 023238. [Google Scholar]
- Wang, Z.; Delahaye, D.; Farges, J.-L.; Alam, S. Air traffic assignment for intensive urban air mobility operations. J. Aerosp. Inf. Syst. 2021, 18, 860–875. [Google Scholar] [CrossRef]
- Bharadwaj, S.; Carr, S.; Neogi, N.; Topcu, U. Decentralized control synthesis for air traffic management in urban air mobility. IEEE Trans. Control Netw. Syst. 2021, 8, 598–608. [Google Scholar] [CrossRef]
- Qu, W.; Xu, C.; Tan, X.; Tang, A.; He, H.; Liao, X. Preliminary Concept of Urban Air Mobility Traffic Rules. Drones 2023, 7, 54. [Google Scholar] [CrossRef]
- Goncalves, P.; Sobral, J.; Ferreira, L.A. Unmanned aerial vehicle safety assessment modelling through petri Nets. Reliab. Eng. Syst. Saf. 2017, 167, 383–393. [Google Scholar] [CrossRef]
- Primatesta, S.; Guglieri, G.; Rizzo, A. A risk-aware path planning strategy for UAVs in urban environments. J. Intell. Robot. Syst. 2019, 95, 629–643. [Google Scholar] [CrossRef]
- Zhang, H.; Gan, X.; Liu, Y.; Wu, Y.; Sun, J.; Tong, L.; Yang, F. Risk assessment framework for low-altitude UAV traffic management. J. Intell. Fuzzy Syst. 2022, 42, 2775–2792. [Google Scholar]
- Han, P.; Yang, X.; Zhao, Y.; Guan, X.; Wang, S. Quantitative ground risk assessment for urban logistical unmanned aerial vehicle (UAV) based on Bayesian network. Sustainability 2022, 14, 5733. [Google Scholar] [CrossRef]
- Pang, B.; Hu, X.; Dai, W.; Low, K.H. UAV path optimization with an integrated cost assessment model considering third-party risks in metropolitan environments. Reliab. Eng. Syst. Saf. 2022, 222, 108399. [Google Scholar] [CrossRef]
- Hu, X.; Pang, B.; Dai, F.; Low, K.H. Risk assessment model for UAV cost-effective path planning in urban environments. IEEE Access 2020, 8, 150162–150173. [Google Scholar] [CrossRef]
- Zhang, H.; Gan, X.; Li, S.; Chen, Z. UAV safe route planning based on PSO-BAS algorithm. J. Syst. Eng. Electron. 2022, 33, 1151–1160. [Google Scholar] [CrossRef]
- Lin, C.E.; Shao, P.-C. Failure analysis for an unmanned aerial vehicle using safe path planning. J. Aerosp. Inf. Syst. 2020, 17, 358–369. [Google Scholar] [CrossRef]
- Li, Y.; Liu, M. Path planning of electric VTOL UAV considering minimum energy consumption in urban areas. Sustainability 2022, 14, 13421. [Google Scholar] [CrossRef]
- Wu, P.; Xie, J.; Liu, Y.; Chen, J. Risk-bounded and fairness-aware path planning for urban air mobility operations under uncertainty. Aerosp. Sci. Technol. 2022, 127, 107738. [Google Scholar] [CrossRef]
- Wang, M.; Luiz, S.O.D.; Zhang, S.; Lima, A.M.N. Desensitized optimal control of electric aircraft subject to electrical–thermal constraints. IEEE Trans. Transp. Electrif. 2022, 8, 4190–4204. [Google Scholar] [CrossRef]
- Hildemann, M.; Verstegen, J.A. 3D-flight route optimization for air-taxis in urban areas with Evolutionary Algorithms and GIS. J. Air Transp. Manag. 2023, 107, 102356. [Google Scholar] [CrossRef]
- He, X.; He, F.; Li, L.; Zhang, L.; Xiao, G. A route network planning method for urban air delivery. Transp. Res. Part E-Logist. Transp. Rev. 2022, 166, 102872. [Google Scholar] [CrossRef]
- Tang, H.; Zhang, Y.; Mohmoodian, V.; Charkhgard, H. Automated flight planning of high-density urban air mobility. Transp. Res. Part C-Emerg. Technol. 2021, 131, 103324. [Google Scholar] [CrossRef]
- Shao, Q.; Shao, M.; Lu, Y. Terminal area control rules and eVTOL adaptive scheduling model for multi-vertiport system in urban air Mobility. Transp. Res. Part C-Emerg. Technol. 2021, 132, 103385. [Google Scholar] [CrossRef]
- Pinto Neto, E.C.; Baum, D.M.; de Almeida, J.R., Jr.; Camargo, J.B., Jr.; Cugnasca, P.S. A trajectory evaluation platform for urban air mobility (UAM). IEEE Trans. Intell. Transp. Syst. 2022, 23, 9136–9145. [Google Scholar] [CrossRef]
- Zhang, H.; Zou, Y.; Zhang, Q.; Liu, H. Future urban air mobility management: Review. Acta Aeronaut. Astronaut. Sin. 2021, 42, 82–106. [Google Scholar]
- Revising the Airspace Model for the Safe Integration of Small Unmanned Aircraft Systems. 2015. Available online: https://images-na.ssl-images-amazon.com/images/G/01/112715/download/Amazon_Revising_the_Airspace_Model_for_the_Safe_Integration_of_sUAS.pdf (accessed on 30 July 2015).
- Bauranov, A.; Rakas, J. Designing airspace for urban air mobility: A review of concepts and approaches. Prog. Aerosp. Sci. 2021, 125, 100726. [Google Scholar] [CrossRef]
- Hu, X.; Dai, F. Risk assessment model for UAV operation considering safety of ground pedestrians in urban areas. China Saf. Sci. J. 2020, 30, 137–142. [Google Scholar]
- Primatesta, S.; Rizzo, A.; la Cour-Harbo, A. Ground risk map for unmanned aircraft in urban environments. J. Intell. Robot. Syst. 2020, 97, 489–509. [Google Scholar] [CrossRef]
- Reich, P.G. Analysis of long-range air traffic systems: Separation standards—I. J. Navig. 1966, 19, 88–98. [Google Scholar] [CrossRef]
- Reich, P.G. Analysis of long-range air traffic systems: Separation standards—II. J. Navig. 1966, 19, 169–186. [Google Scholar] [CrossRef]
- Reich, P.G. Analysis of long-range air traffic systems: Separation standards—III. J. Navig. 1966, 19, 331–347. [Google Scholar] [CrossRef]
- Li, J.; Zhong, G.; Zhang, X. Research on calculation method of aerial collision risk of urban low-altitude UAV. Mod. Transp. Metall. Mater. 2022, 2, 20–30. [Google Scholar]
- Braven, W.D. Analysis of Aircraft/Air Traffic Control System Performance; Technical Report AIAA-95-3363-CP; AlAA: Reston, VA, USA, 1993; p. 3363. [Google Scholar]
- Wang, C. Research on Evaluation Theory and Simulation Application of Flight Procedure Operation. Ph.D. Thesis, Nanjing University of Aeronautics and Astronautics, Nanjing, China, 2012. [Google Scholar]
- Wang, H.; Wen, R. Research on assessment of risk in air traffic situation based on complex network. China Saf. Sci. J. 2018, 28, 172–178. [Google Scholar]
- Safety Management Manual (SMM); International Civil Aviation Organization: Montreal, QC, Canada, 2009.
- Dalamagkidis, K.; Valavanis, K.P.; Piegl, L.A. Evaluating the risk of unmanned aircraft ground impacts. In Proceedings of the 16th Mediterranean Conference on Control and Automation, Ajaccio, France, 19 August 2008. [Google Scholar]
- Wang, W.; Gan, X.; Wu, Y. Low-altitude UAV operation risk assessment method considering the uncertainty. Mod. Def. Technol. 2022, 50, 14–21. [Google Scholar]
- Zhang, H.; Gan, X.; Li, S. UAV route planning considering regional risk assessment under complex low altitude environment. Chin. J. Sci. Instrum. 2021, 42, 257–266. [Google Scholar]
- Shelley, A.V. A model of human harm from a falling unmanned aircraft: Implications for UAS regulation. Int. J. Aviat. Aeronaut. Aerosp. 2016, 3, 3–28. [Google Scholar] [CrossRef]
- Zhang, X.; Liu, Y.; Zhang, Y. Safety assessment and risk estimation for unmanned aerial vehicles operating in national airspace system. J. Adv. Transp. 2018, 2018, 4731585. [Google Scholar] [CrossRef]
- Liao, X. Advance of geographic sciences and new technology applications. Prog. Geogr. 2020, 39, 709–715. [Google Scholar] [CrossRef]
- Jiao, Q.; Chen, X.; Zheng, Z.; Bai, Y.; Liu, Y.; Zhang, Z.; Sun, L. Dynamic path planning of unmanned aerial vehicle based on crowd density prediction. Prog. Geogr. 2021, 40, 1516–1527. [Google Scholar] [CrossRef]
- Cao, C.; Wei, C.; Liao, Y.; Zhang, Y.; Li, J. On novel trajectory tracking control of quadrotor UAV: A finite-time guaranteed performance approach. J. Frankl. Inst. 2022, 39, 8454–8483. [Google Scholar] [CrossRef]
- Arntzen, M.; Aalmoes, R.; Bussink FJLSunil, E.; Hoekstra, J. Noise Computation for Future Urban Air Traffic Systems; Technical Report NLR-TP-2015-289; National Aerospace Laboratory NLR: Amsterdam, The Netherlands, 2015. [Google Scholar]
- Feng, Y. The Research of UAV Intelligent Path Planning Strategy in 3D Dynamic Environments. Ph.D. Thesis of Engineering, Beijing University of Posts and Telecommunications, Beijing, China, 2020. [Google Scholar]
Disclaimer/Publisher’s Note: The statements, opinions and data contained in all publications are solely those of the individual author(s) and contributor(s) and not of MDPI and/or the editor(s). MDPI and/or the editor(s) disclaim responsibility for any injury to people or property resulting from any ideas, methods, instructions or products referred to in the content. |
© 2024 by the authors. Licensee MDPI, Basel, Switzerland. This article is an open access article distributed under the terms and conditions of the Creative Commons Attribution (CC BY) license (https://creativecommons.org/licenses/by/4.0/).