Article

Improving the Door-To-Door Customer Journey for a National Public Transport Company

1
Iarnród Éireann: Irish Rail, Connolly Station, D01 V6V6 Dublin, Ireland
2
DesignCORE, Humanities, South East Technological University, R93 V960 Carlow, Ireland
*
Authors to whom correspondence should be addressed.
Sustainability 2024, 16(20), 8741; https://doi.org/10.3390/su16208741
Submission received: 23 August 2024 / Revised: 30 September 2024 / Accepted: 6 October 2024 / Published: 10 October 2024

Abstract

:
(1) Background: Public transport has a vital role to play in creating sustainable, accessible societies. Accessible and inclusive, door-to-door public transport systems with low barriers to use benefit everyone, increasing the mobility of citizens and improving independence. As the industry strives towards multi-modal and Mobility as a Service (MaaS) concepts, there is a need to delve deep into the needs and perceptions of transport user’s door-to-door journeys to find ways to improve. Accordingly, in order to increase the sustainability of MaaS, improving accessibility and understanding service user perceptions are of utmost importance. However, there is a scarcity of research within national transport services to determine unmet user needs to increase the accessibility and autonomy of door-to-door journeys. This research aims to investigate if it is possible to improve the door-to-door journey experience for public transport travellers, increasing the accessibility and the perception of autonomy via technology, and by doing so, providing a more sustainable alternative to road transport. It focuses on understanding service users of Ireland’s National Rail service, Irish Rail, to create key improvements in interactive systems. (2) Methods: The study applies a user-centred mixed-methods methodology using surveys (N = 316) and co-design workshops (four workshops N = 15). The research collected deep insights into the mindsets and needs of service users, showing the potential to improve this door-to-the-door customer journey. Key improvements for interactive systems were outlined. Experience maps were designed, leading to a Conceptual Design for a travel assistant to aid the service user throughout the door-to-door journey. (3) Results: Travellers’ autonomy and the sense of freedom they experience can be improved, mainly if their needs across the complete door-to-door customer journey are supported. Highlighted areas for action include information, accessibility, personal security, ticketing, comfort, facilities, and anxiety. (4) Conclusions: This research reiterates the need for national transport and MaaS providers to prioritise service users’ perspectives when developing sustainable services. Co-designing is recommended as a means of achieving this.

1. Introduction

In Europe, social and economic policies depend on the availability of efficient and effective transportation systems. Public transport has a vital role to play in countering problems such as climate change, energy independence and creating accessible and independent societies. Social and economic policies, sustainable transport, energy and climate change policies depend on the availability of efficient and effective transportation systems [1]. Public transport also has a vital role to play in creating accessible and independent societies, increasing the mobility of citizens and improving their independence [2].
The success of an efficient, multi-modal, Mobility as a Service (MaaS) will often depend on the level of uptake by the population in the area they operate. This uptake can be influenced by many factors, including the quality of the passenger experience and the provision of systems that are accessible to everyone [3]. Accessible, high-quality transit systems with low barriers to use benefit everyone and are likely to contribute to a modal switch whereby private vehicle owners reduce their dependency and increase their utilisation of public transportation [4]. Consequently, to achieve sustainability in a MaaS, improved accessibility and understanding service user perceptions are of utmost importance, which includes low cognitive accessibility and autonomy throughout journeys focusing on holistic door-to-door experience [5]. As outlined by Enoch and Potter, MaaS potentially offers a paradigm shift from transport being provider-led to being a more user-led system; however, it is far from certain as to how it will evolve and scale up in in future [6]. Therefore, for its future development, MaaS providers are recommended to prioritise and closely consider users’ perspectives [7].
As stated by Witlox et al., travellers do not travel from station to station but from door to door; therefore, they seek a positive integrated travel experience [7]. Users’ understanding of this complete door-to-door experience will be vital for the success of MaaS, as the simple integration of various transport services into a single, comprehensive mobility service may not prove sufficient in itself to generate significant uptake in usage. Developing “door-to-door” services is a crucial measure to enhance the attractiveness of public transport systems, boosting sustainable development [8]. However public transport use is continuously declining globally [9,10,11] posing a threat to the operational sustainability of public transport systems.
Public transport services play a vital role in mobility and independence. As asserted by Stjernborg, they can ensure an individual’s involvement in larger society or community, and physical limitations in combination with environmental barriers to public transport can shrink individual possibilities for movement [12]. Different community members have differing profiles of needs and distinct characteristics that may make it more complicated for them to utilise public services [13]. Persons with physical disabilities may have problems accessing the transport infrastructure or the vehicles, or they may have difficulties hearing or reading information. Barriers to public transport can extend to a person’s economic status or geographic location, for example, affordability for low-income groups or language barriers for tourists and immigrants. People in rural areas may have greater difficulty accessing transport services than urban dwellers. Each of these different user types compounds the complexity of a journey even further as each group may have particular and distinct needs, and these groups need understanding and careful analysis to optimise their travel experience.
To understand complex user needs in public transport, Susilo and Cats summarise different passenger groups and the diversity of their most essential characteristics. These include punctuality, reliability, cost, flexibility, safety, tolerant staff, accessibility, and onboard space [14]. Considering this diversity of characteristics, the importance of understanding the ‘complete journey’ that a public transport user experiences should not be underestimated. When delving into the literature on users’ complete journey experiences, accessibility, and accessibility to information continually come to the fore. As suggested by Friman et al., service quality in public transport is a key determinant of perceived accessibility and autonomy, with low service quality being a barrier to use, decreasing the ease of participating in daily activities [15]. Research from Balcombe et al. [16] and Stradling et al. [17] observes that the quality of travel information could substantially influence the level of satisfaction with public transport, mainly whether this information is static or real-time and provided in advance, wayside or enroute. Research by Cluett et al. [18], Kenyon et al. [19], and Hine and Scott [20] describes the factors influencing the usability of the information as the design, condition and timeliness of the data. They consider that the whole journey experience depends on multimodal information to enable full planning and ease of transfer to ‘…minimise the effort for the user in acquiring information on mode choice options and can expose the user to information on such options’ [19].
The availability and advancement of smartphone technology in the last 20 years has enabled the evolution of MaaS, allowing it to achieve progress in the integration of the public transport door-to-door travel journey [5]. A main emphasis for many public transport operator smartphone applications relates to commercial transactions, i.e., selling tickets or reservations and providing timetables with real-time updates on the location of services. These are essential activities for the core parts of the customer journey. However, when we reflect on the actions that take place before a transport user leaves home through to entering one’s final destination, we see there are many other activities, stages and modes in the complete door-to-door journey [21]. In addition, there is ample potential for further development, for example, per Torabi K et al., integrating emerging future modes of transport into door-to-door journeys, as currently a limited set of modes are being used [22].
Research has been ongoing into understanding and designing door-to-door experiences, but more detailed work needs to be undertaken. This is primarily the case as MaaS as a concept is still in is relative infancy, together with integrating multimodal transportation on digital mobile technology [3].
A commencement point in this design research was seen in the 1990s, when design consultancy IDEO worked with train operating company Amtrak (USA) to help them provide a better passenger experience for the new high-speed train service, ‘Acela’ [23]. They believed that if the Acela service were to be successful, a complete door-to-door journey would need to be considered [21]. The two teams concluded that from the customers’ perspective, a train journey started well in advance of the actual train trip and extended for some time after they had alighted from the train. Both concluded that to successfully provide users with the type of service they were seeking, a considerably broader perspective of the customers’ journey would need to be considered as a whole. To help understand the different stages within this expansive Amtrak user journey, IDEO proposed a customer journey map of ten stages, as shown in Figure 1.
In 2014, the ‘METPEX’ research team developed a standardised tool to measure passenger experience and benchmark services, in this work, they mostly agreed with IDEO’s observations on the complete door-to-door customer journey [24]. This METPEX study was a major EU-funded public transport research project involving academics and professionals from over a dozen countries across Europe [25]. They proposed that the key to improvement lies in the understanding of the entire journey to gain a deep insight into people’s travel behaviour and, ultimately, their needs. Essentially, to deliver a service that ‘met or exceeded the users’ needs’, the train service would need to be designed for all the steps in the journey, not simply the actual travelling on the train itself [24]. METPEX stressed the need to take a systematic approach to the whole journey experience as each portion of the customer journey might contribute negatively or positively to the journey experience as a whole [25].
There are also many essential reasons why transport companies should improve the experience, accessibility and autonomy of rail services, and these include many legal obligations and directives. For example, Ireland’s National Disability Authority (NDA) advises on legal obligations regarding the accessibility of information and services in the public sector under which public transport is included. Examples include the Equal Status Acts, 2000 to 2004, the Disability Act 2005 and the EU directive (EU) 2016/2102 and S.I. No. 358/2020 [13].
In a study seeking to improve autonomy in public transport, the design researchers ‘Latitude Research’ explored whether new technologies and information could improve public transport and encourage people to make more sustainable transport choices. This research tasked car users to give up their cars for a week and rely on other forms of transport [26]. Results showed that providing good information could equalise transport mode choices [26]. They concluded that easily accessed information is an excellent democratiser of products and services and suggested that transportation companies ‘make it easy for people to be good’ and move away from an ‘all or nothing approach’ [27]. By enabling people to make spontaneous decisions to use public services, people could be encouraged to make incremental changes towards public transport. They also note that people do not want any barriers to interoperating with different travel modes, and this requires greater collaboration between transport authorities, competitors, and the local community [27].
Numerous studies show the advantages of providing Real-time Transport Information (RTI). Dziekan and Kottenhoff describe the main effects of RTI to be reduced ‘perceived’ wait time, and more efficient travelling. The impact of a ‘reduced perceived wait time’ is a straightforward metric in the passenger’s experience of just how long they believe that they have waited for their service [28]. Dziekan and Kottenhoff note that the real-time availability of this type of information influences travel behaviour. This is primarily due to passengers adapting to environmental conditions and changes. Stradling states that real-time information affords increased ease of use which can be both physical and cognitive [17], and the availability of this information was found to be trustworthy and contributed to a more straightforward journey [29].
At a national level, there is a scarcity of research in transport services to determine gaps, and unmet customer needs to increase accessibility and the perception of autonomy. The Transport Research Centre in Madrid researched how adopting real-time passenger information systems can affect the punctuality and quality of service and users’ perception of public bus networks in Madrid (Spain) and Bremerhaven (Germany). Their research from both cities shows a higher perceived service quality when the bus stops and buses are equipped with information devices [30]. Crucially, however, they state that the accuracy of real-time train information is critical, noting that ‘inaccurate real-time information would have an aggravated negative impact on the quality of the rail transport system’ [30]. The travellers ‘trust in RTI depended, to a large extent, on the accuracy and timeliness of the information [31].
Summary Points:
The following is a summary of the main points from the literature discussed above.
  • Public transport services play a vital role in sustainability, mobility and independence.
  • Accessible, door-to-door transit systems with low barriers to use benefit everyone.
  • To achieve sustainability in a MaaS, improved accessibility and understanding service user perceptions are of utmost importance.
  • In creating a positive door-to-door journey experience, accessibility, and accessibility to information continually come to the fore.
  • Travellers’ needs are diverse, and they themselves are also diverse.
  • The availability and advancement of smartphone technology in the last 25 years has facilitated MaaS, allowing it to achieve progress in the integration of the public transport door-to-door travel journey; however, MaaS as a concept is still in its relative infancy.
Summary: Research Gap
The following is a summary of points identifying research gaps.
  • To improve the whole concept of MaaS, it is important to understanding the ‘complete journey’ door to door that different public transport users experience.
  • There is a scarcity of research in transport services to determine gaps and unmet customer needs that would increase accessibility and the perception of autonomy.
Case Study of Irish Rail: Improving the Door-to-Door Journey of National Rail
As the Republic of Ireland’s national railway operator, Irish Rail (Iarnród Eireann) traces its history back to the early 1830s under different company names such as Great Southern and Western Railways and Córas Iompair Éireann (Córas Iompair Éireann) [32]. Irish Rail operates freight and passenger services to over 140 stations and carries more than 50 million passengers per annum [33].
As a company with a strong customer focus, Irish Rail was chosen for this research as it is keen to maximise its customer base and provide a sustainable alternative to road transport. This paper examines the customer door-to-door journey for Irish Rail travellers, seeking, through the use of co-design and information technology, to improve their experience and to see if there is the potential to improve the travellers’ accessibility and autonomy. By enhancing this experience, Irish Rail could potentially increase sustainability and passenger numbers.
This study is the first of its kind in Irish Rail, previously, via their customer-facing information technology; they have had a primary focus on ticket sales and timetables. However, this study takes a broader look at the potential to support customers’ more expansive range of needs. Specifically, it seeks to determine gaps and unmet customer needs to increase accessibility and the perception of autonomy for its service. This research, though in the context of Ireland, should equally apply to other national public transport companies, especially as part of any MaaS strategy. As public transit systems are evolving from singular modes (e.g., bus-based) to mixed structured [10] and the increasing importance of network connectivity [8], this research can and should be applicable to bus operators and other modes of public transport.

2. Methods

The overall objectives of this study are to inform Irish Rail of potential improvements for interactive systems for travellers and to increase accessibility and the perception of autonomy of its service, in doing so, providing a sustainable alternative to road transport. It aims to achieve this through a user-centred design process, involving travellers/service users to closely understand and consider their user perspectives. The research question for this study is as follows: What interactive systems should be designed to improve the experience, accessibility and autonomy of Irish Rail’s customers’ door-to-door journey?
To answer this question, the study applies a mixed-methods research methodology (Figure 2). This methodology was chosen to obtain both quantitative and qualitative research so that a wide understanding of travellers’ experiences (Research Gap 1) could be recorded and quantified initially before delving deeper into these experiences through a series of workshops designed from the initial results (Research Gap 2).
Throughout the methodology, we follow the guidance of Irish Standard I.S. EN 17161:2019 Design for All, in which a central aspect is to involve end users in service improvement and design [13]. In this research, we include Irish Rail travellers in a user-centred design process to improve the door-to-the-door customer journey.
Sample Recruitment and Representativeness
For the survey, when recruiting sample participants, most of Ireland’s workforce was working remotely due to COVID-19 restrictions. However, with Irish Rail’s extensive social media presence of over 180,000 followers, the survey reached over 18,000 people. With a 100% completion rate, the study received 316 responses. The sample size was determined using the following formula [34]:
s a m p l e   s i z e = z 2   ×   p 1     p e 2 1 + z 2   ×   p 1     p e 2 N
While the population of Ireland exceeds 5 million, the available market for public transport is significantly less due to the geographical layout of the railway network and an absence of services sufficiently proximate to the full population. Thus, the study of the full population (N) p is the sample proportion (p = 0.5) with a margin of error (e) of 10% and a confidence level of 99% (z = 2.58) would require a minimum sample size of 167. Participants of the co-design workshops were purposefully recruited to ensure a diverse sample of participants by looking at their responses in the survey. A total of 114 participants provided their contact email address for further contact, and these people were considered for an invitation to the co-design workshops. The final sample of participants included commuters, long-distance leisure travellers; the staff, including both front line and senior managers; fellow students; and the researcher’s design peers. The sufficient representation and balance of genders was considered at this stage, with females and males being invited, and it was planned that workshops would run until a representative sample was reached, as shown in Table 1 below.
Research Stages
Designing the Survey
In designing the survey, the key stages of the IDEO/Amtrak customer journey and several key findings in the METPEX research were compiled in a mind map. The survey was designed to ensure both the depth and breadth of responses. To achieve this, qualitative and quantitative questions were formulated to take both a broad view of the customer journey and dig deeper to reveal the thoughts and feelings experienced by the travellers as they travelled from door to door. The survey commenced with a strong quantitative orientation but with some qualitative questions to yield a richer data set to inform the next phase. The survey needed to be conducted online for COVID-19 restrictions and social distancing reasons. It was conducted on a professional-tier SurveyMonkey account and was analysed through descriptive statistics using statistical tools in Excel 2019 MSO 360.
Quantitative questions were asked for almost every stage of the customer journey. To gain a fuller understanding of the thoughts and feelings of the participants, the survey included numerous qualitative questions, e.g., ‘Can you briefly describe what is on your mind when setting out on a journey?’ These questions were purposely open, and the participants could mention anything they wished to. Some questions were designed in the survey to gauge the number of people who had some form of accessibility needs and also, in general terms, how satisfied or otherwise people were with Irish Rail. Due to the time involved in completing the survey, the option for participants to skip any questions was provided in case they felt they were not relevant or too busy to answer fully, bearing in mind that the participants would give up this estimated 10 min of their time.
Table 2 shows the survey questions generated, showing how they relate to the different stages of the journey. It includes further questions to learn more about the research question and the data quality. The survey is primarily quantitative, but with qualitative questions to gain deeper insights into crucial parts of the journey. No personal information would be mandatory, and no demographic information would be solicited in this survey. The study needed to be open to everyone, and there was no attempt to block children or any vulnerable adults from completing the survey.
Designing for Co-Design Workshops
As seen in Figure 3 and Table 3, six main themes emerged from the survey. Timetables and ticketing are areas that transport operating companies are already familiar with. Further research on facilities and comfort will likely fall outside the general ‘technology’ scope addressed in this research. Accordingly, the themes of information, security and accessibility were subjected to further research in the next stage of the study.
At this stage, a means to 1. validate and any negate bias of the survey findings and 2. dig deeper into the travellers’ needs and underlying thoughts on information, security, and accessibility was required. As this study aims to inform future service design for Irish Rail, it is important to choose a user-centred design framework that will support both the company and their diverse users and needs. Thus, the approach undertaken in the study needed to be genuinely user-centred, collaborative, and suitable for interdisciplinary teams. The process and methods employed by a methodology known as ‘co-design’ allow this to happen.
Steen et al. notes that co-designing is advantageous when working with teams, as it has been proven to lead to more long-term success and more support and enthusiasm for change and can generate solutions that improve day-to-day experiences [35].
This ‘enthusiasm for change’ and ‘generating of solutions’ fitted the study, and the mindset of ‘leading to long-term success’ fitted the aspiration that this study would influence further research [35] collated a matrix from numerous researchers on the benefits of co-design in projects for organisations, as seen in Table 3.
Co-designing also assists when researchers are faced with limitations in reaching participants, e.g., during the COVID-19 pandemic. White et al. [36] and Zallio et al. [37] adapted design research to facilitate remote working across interdisciplinary teams to a successful conclusion. These researchers noted a need for ‘a platform whereby the voice and ideas of the researchers could be expressed ’ and proposed a process of ‘Co-designing’ as it allowed ‘a wide range of people to make a creative contribution to the formulation of solutions’ [36]. In terms of defining what co-design is, McKercher describes it as ‘designing with, not for, people’ [38]. With an emphasis on the ‘with’, this co-designing framework involves groups of people with lived experience in the design process. The insights of both Steen et al. [35] and McKercher [38] make a compelling case for why co-design will fit both this study and subsequent research.
The social distancing requirements for COVID-19 meant this research would need an alternative approach. Virtual whiteboard software application Miro™ was chosen as the tool to use with Microsoft Teams for video conferencing as it has been successful in other similar co-design workshops [37]. The online co-design workshops were a maximum of one hour in duration.
Co-designing is a visual and inclusive process; to facilitate this, whiteboards, as seen in Figure 4, needed to be designed in a format in which the participants would easily understand the co-design process. A facilitator facilitated the workshops, together with a supervisory team, who acted as assistants offering mentorship and peer debriefing after each workshop. During the workshop, the facilitator brought participants through the different stages of the workshop, asking questions about personal experiences of rail travel. Each participant documented experiences, ideas, and thoughts on individual notes. The facilitator aimed to give the participants complete freedom to contribute without anyone interpreting their views and recording on the board on their behalf, that is, if they so wished. The facilitator also wanted to create an inclusive environment and did not want anyone to feel their opinions were superior or inferior to others, or if one voice biased the study. Ultimately, the co-design workshops comprised an equal mix of frequent and non-frequent travellers, one quarter of them voluntarily mentioned their own cognitive or physical disability, and 40% of were female.
Analysis
The survey had both quantitative and qualitative responses to be analysed. The Co-design workshops had just qualitative responses. For the analysis of the quantitative responses of the survey, the built-in functionality in the survey software SurveyMonkey (https://www.surveymonkey.com/) was used to provide totals and percentages. The qualitative responses from both the survey and the co-design workshops, however, would require a deeper analysis to understand the thoughts and views of service users. However, with such qualitative work and with such a large amount of data, an organising system would be necessary for a researcher to be consistent and ‘tease out the layers of meaning’ [39]. Accordingly, Tesch’s Eight Steps [40] was used.
As the survey was carried out online, the respondents completed all the text input and dialogue box options; therefore, no audio or video recordings needed to be transcribed. The online survey was conducted unsupervised, so no additional notes were recorded, which would ordinarily need to be compiled and transcribed. With the survey closed, the research was initially organised, disassembling the data captured. This involved manually compiling parts of it into chunks and generating tags or labels known as ‘coding’. Coding via the Tesch’s Eight Steps method first involved reading through all the responses to obtain a broad sense of the data. The coding process then comprised finding words and phrases, which were clustered in a single question response or seen throughout all the data; the code names tended to be the participant’s descriptive terms. Some individual responses were then selected, and the general substance of these was reflected on, considering the author’s context. Following this, all the responses were reviewed with brief note-taking [40]. With some notes from the overall survey and some individual responses, lists of themes emerged, which were graded by the frequency with which they were mentioned. This coding process was drawn from similar studies [41,42,43].
From the survey, the three themes of information, security, and accessibility were taken forward for deeper understanding in the co-design workshops. Manual coding was conducted for the co-design workshops through the whiteboard software application Miro™ 0.7. 37 version. To code the data on the co-design workshop board, text within individual participants’ notes was read and re-read line by line and interpreted for meaning. Concurrent to this, each note was placed into a theme [44,45]. Once the analysis of both the survey and codesign was complete these were manually coded into a list of key improvements vis-à-vis primary stakeholders. Experience maps and a conceptual design for a travel assistant were then designed to visualise findings; these were created through an iterative process of sketching to generate means to visualise outcomes. Finally, to mitigate bias and to validate outcomes, these were then peer-reviewed by two external reviewers [43].

3. Results

Results from the Survey
The results, themes and key insights of the survey are outlined in Table 4. The themes of information, accessibility, personal security, ticketing, comfort, facilities, and anxiety were highlighted as areas for action.
Results from the Co-Design Workshops
The results of the four co-design workshops with 15 participants are aggregated in the following results.
Safety
Information
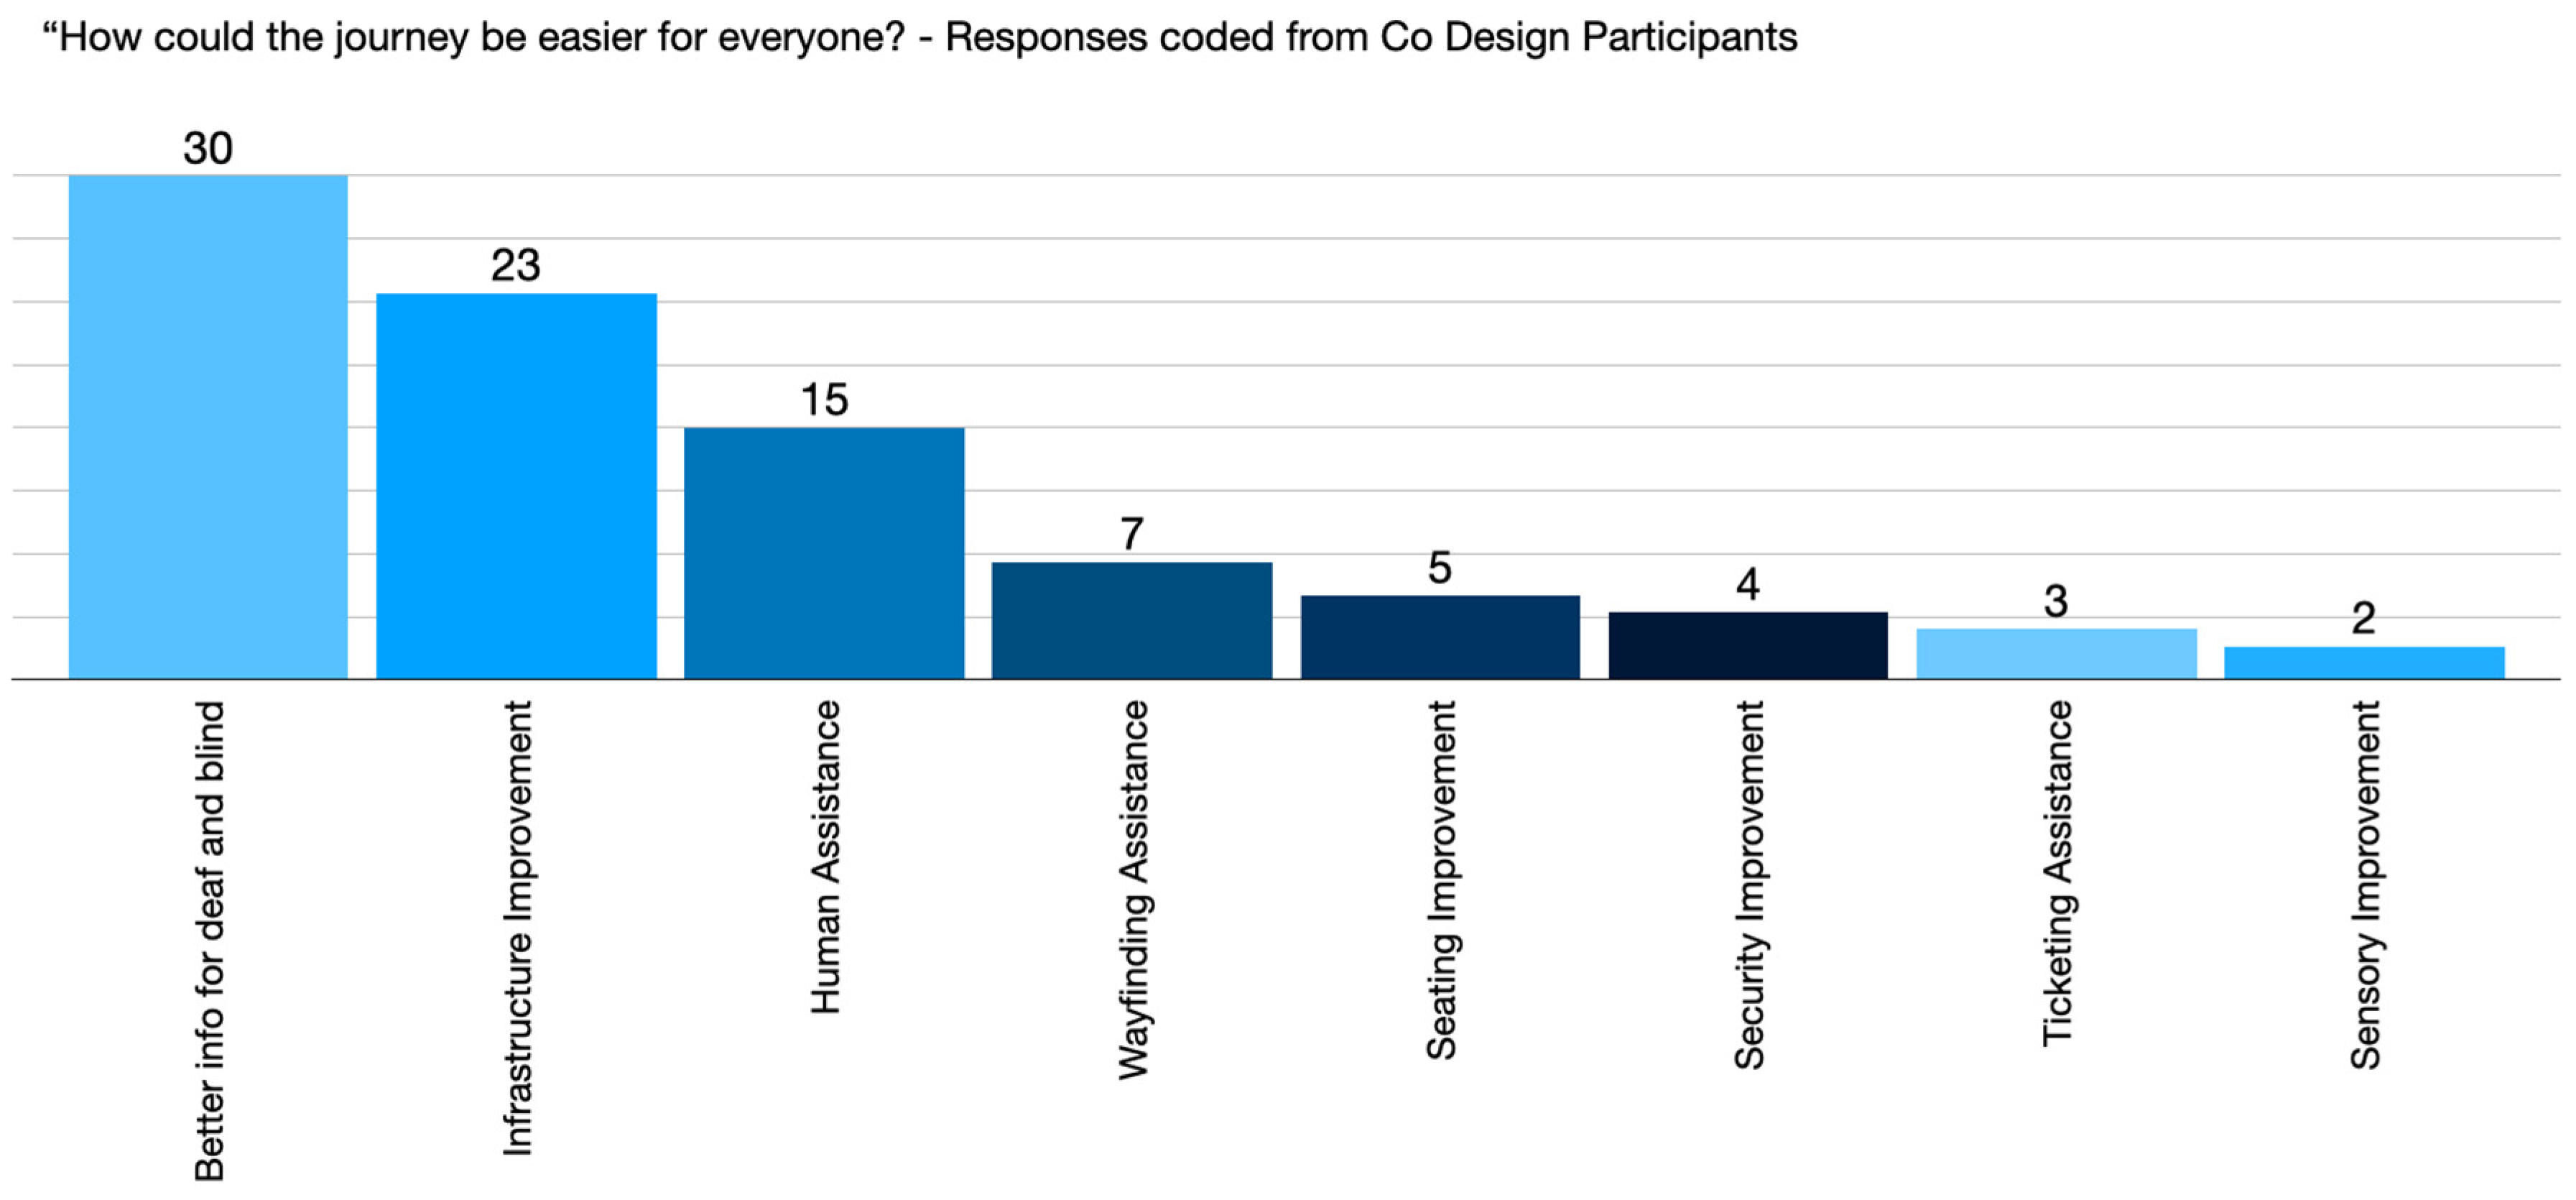
  • The top requirement is for simpler info (Figure 9).
  • Travellers need more accurate info on delays, and platform numbers (Figure 9).
  • All information needs to be accessible (Figure 9).
  • Capacity information is quite important (Figure 9).
  • Travellers need to know if there will be staff around or not (Figure 9).
  • ‘Nice to have’ info includes refreshments, weather and storage info (Figure 10).
Accessibility
  • No stage of the journey is completely accessible (Figure 11).
  • Travelling on board is the most accessible, but there are problems with announcements and the next stop notification (Figure 11 and Figure 12).
  • A lack of ramps and lifts that are out of order cause problems (Figure 11).
  • Difficulties outside railway network starting and continuing show the wider problem in society (Figure 11).
  • Strong need for better info for deaf and visually impaired (Figure 12 and Figure 13).
  • Human assistance is crucial (Figure 13).
Autonomy
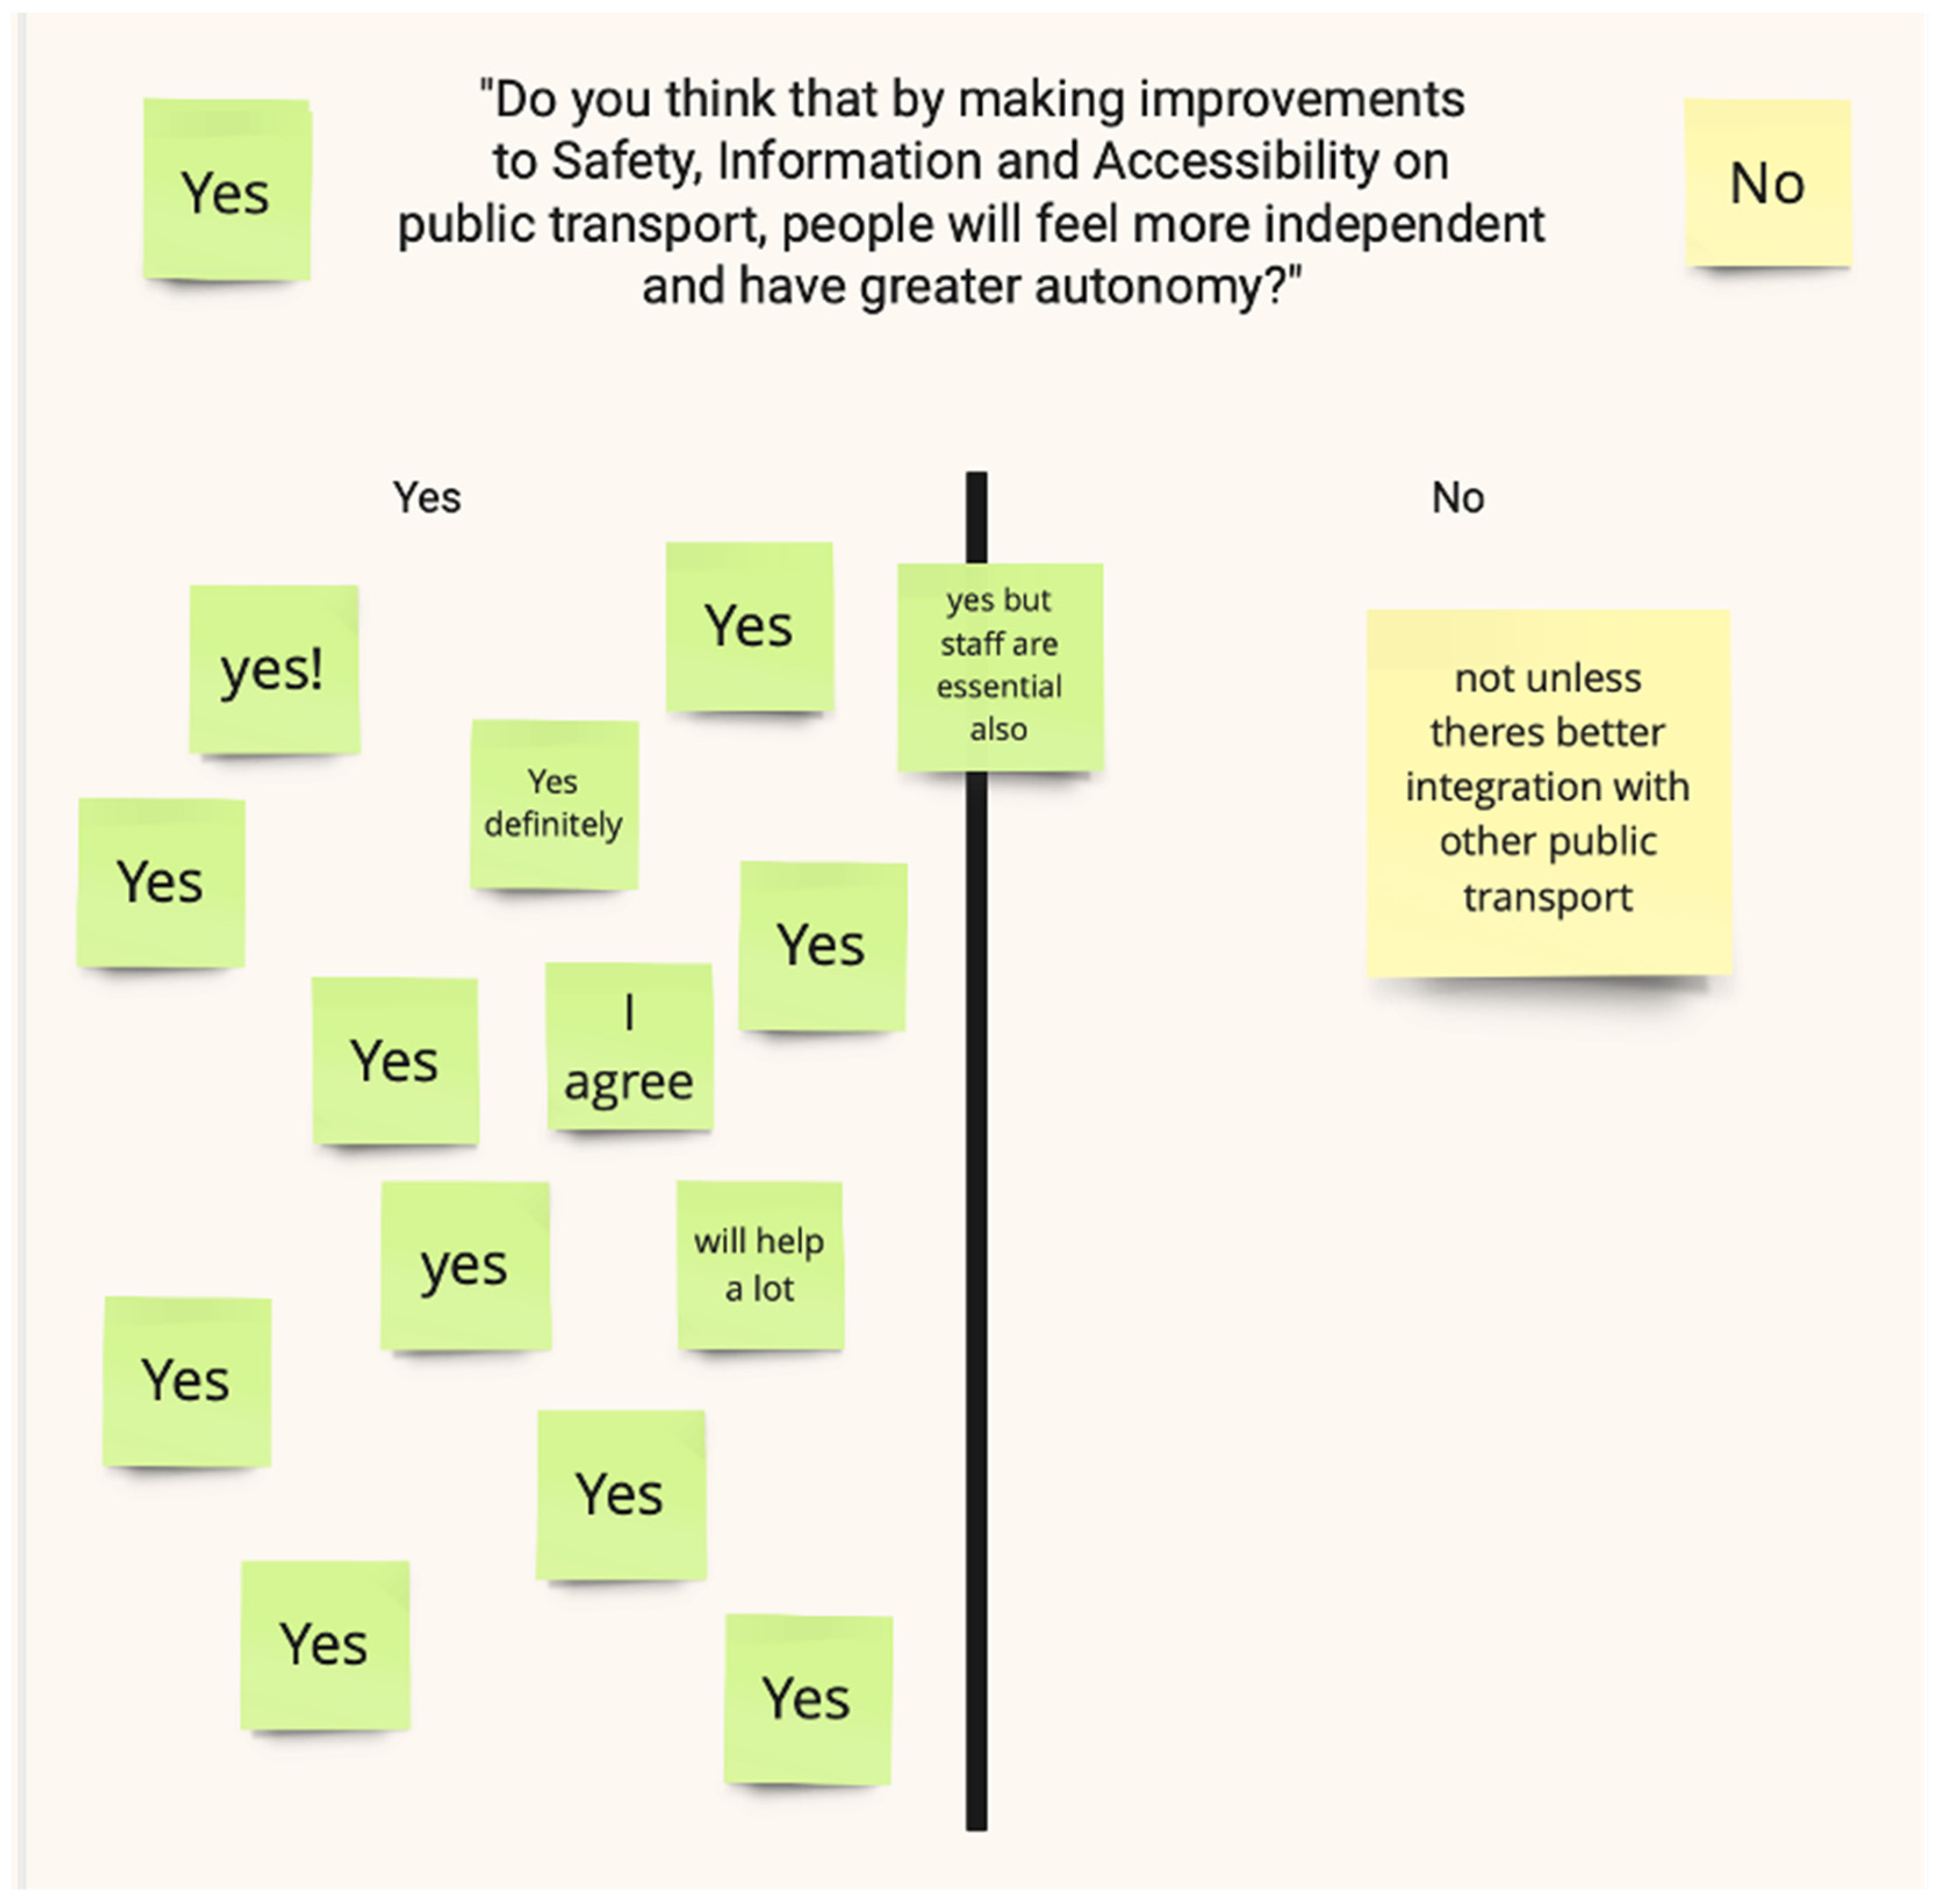
  • It is possible to improve autonomy by improving the door-to-door journey, especially in the areas of accessibility, safety and the provision of accurate information (Figure 14).
  • Employees are still an essential element for many customers (Figure 14).
  • Improved integration with other travel modes is important (Figure 14).
Key Improvements vis-a-vis Stakeholders
Users’ needs identified during the study are graded against the primary stakeholders involved and assessed in the context of a potential information technology solution. These are outlined in Table 5.
Designing the Experience Maps and Conceptual Design for a Travel Assistant
As a quantity of quantitative and qualitative data were collected in this study, the process of synthesising these data into critical high-level insights that could be actioned by Irish Rail was important. To obtain a high-level view or ‘ecology map’ of these findings, they were visualised in experience maps [46]. Patterns, relationships, categories and codes from the qualitative data and analysis were collated and triangulated with the most important statistics from the quantitative research into visual form.
As the research question addresses the door-to-door customer journey for Irish Rail, an experience map (Figure 15) was developed, showing the ten stages of the customer journey. This map describes each stage and includes a sample of one of the primary thoughts or insights that have been simplified to show the parts of the journey that cause concerns to travellers. Gaps for information needs raised during the surveys and co-design workshop were then noted. Finally, the main opportunities for Irish Rail to improve the customer experience journey are summarised from reviewing the survey results, notes, and comments from the co-design workshop and from re-reading all relevant individual comments throughout the study that were triangulated with the research question. Similar to previous stages, to mitigate bias and to validate, outcomes these were again peer-reviewed by two external reviewers [43].
A visualised thematic analysis has also been generated (Figure 16), merging the emergent themes from the survey and co-design workshops, capturing close to 5000 comments. These themes are mapped to the customer journey stages to visualise how Irish Rail and the other stakeholders can support the traveller at every stage. This thematic analysis shows how some potential improvements in the public transport sector can assist the traveller across many different stages, while others just focus on a single stage.
Finally, a conceptual design is produced based on the needs and gaps of the traveller in a visual format to communicate the underlying ideas behind improving the door-to-door customer journey at the centre of the research (Figure 17). In this conceptual design, a process of iterative design is applied to visualise an ‘ideal’ scenario. The travellers’ needs have been grouped and categorised, and critical areas to support the traveller are proposed, e.g., discovery, planning, ticketing and travel assistant, taking the first steps towards finding a solution to the traveller’s needs.

4. Discussion and Implications of Results

In this research, we seek to understand and improve door-to-door journeys of public transport customers, adding to the key studies, i.e., METPEX, Latitude Research, and IDEO. We deeply consider what Woodcock and Tovey describe as a service ‘designed for all the steps in the journey, not simply the actual travelling on the train itself’ [24]. We were mindful of what METPEX stressed as the need to take a systematic approach to the whole journey experience, as each portion of the customer journey might contribute negatively or positively to the overall experience [25].
In the literature, it was identified that for its future development, MaaS providers are recommended to prioritise and closely consider service users perspectives [7]. In creating a positive door-to-door journey experience, accessibility and accessibility to information continually come to the fore. Focusing on research at a national level, it was identified that there is a scarcity of research in transport services to determine gaps and unmet customer needs to increase accessibility and the perception of autonomy.
This research explored two gaps in the literature in order to consider what interactive systems could be designed for travellers.
  • Understanding the ‘complete journey’ door to door that different public transport users experience.
  • Determining the gaps and unmet customer needs that would increase accessibility and the perception of autonomy.
During the research, key insights on information, accessibility, personal security, ticketing, comfort, facilities, and anxiety were highlighted as areas for action. Through co-designing, these were explored with service users to understand perspectives. Key improvements were outlined; experience maps were designed, leading to a conceptual design for a new interactive Travel Assistant which could aid the service user.
The findings of this study will act as a plan to implement improvements to Ireland’s National Rail Service. This paper also acts as a case study for the development of other national transport services and MaaS providers in the future, considering service users’ perspectives.

Limitations of the Study

Research was conducted during the COVID-19 pandemic, a period when many travellers were working from home. Many Irish Rail services themselves were curtailed by the authorities managing the pandemic. The survey was undertaken during these restrictions, which may have restricted data collection. It is also possible that some travellers did not participate because they were not actively commuting. As social media was used to recruit participants, it is also possible that regular followers were less connected with these digital channels and unaware of the research during this period.
The co-design workshops also took place during the COVID-19 pandemic and restrictions. Instead, they took place online via video conference (Microsoft Teams) and virtual whiteboard (MIRO). Some of the invitees who accepted the invitation to the co-design workshops did not join online, possibly due to technical troubles or last-minute issues.

5. Conclusions

This research aimed to investigate if it was possible to improve the door-to-door customer journey experience for public transport travellers, increasing accessibility and the perception of autonomy and, in doing so, providing a sustainable alternative to road transport. It focused on understanding service users of Ireland’s national rail service, Irish Rail, and understanding the needs of key improvements in interactive systems.
From this research, we conclude
  • That it is possible to improve the door-to-door experience and at the same time improve the sense of autonomy.
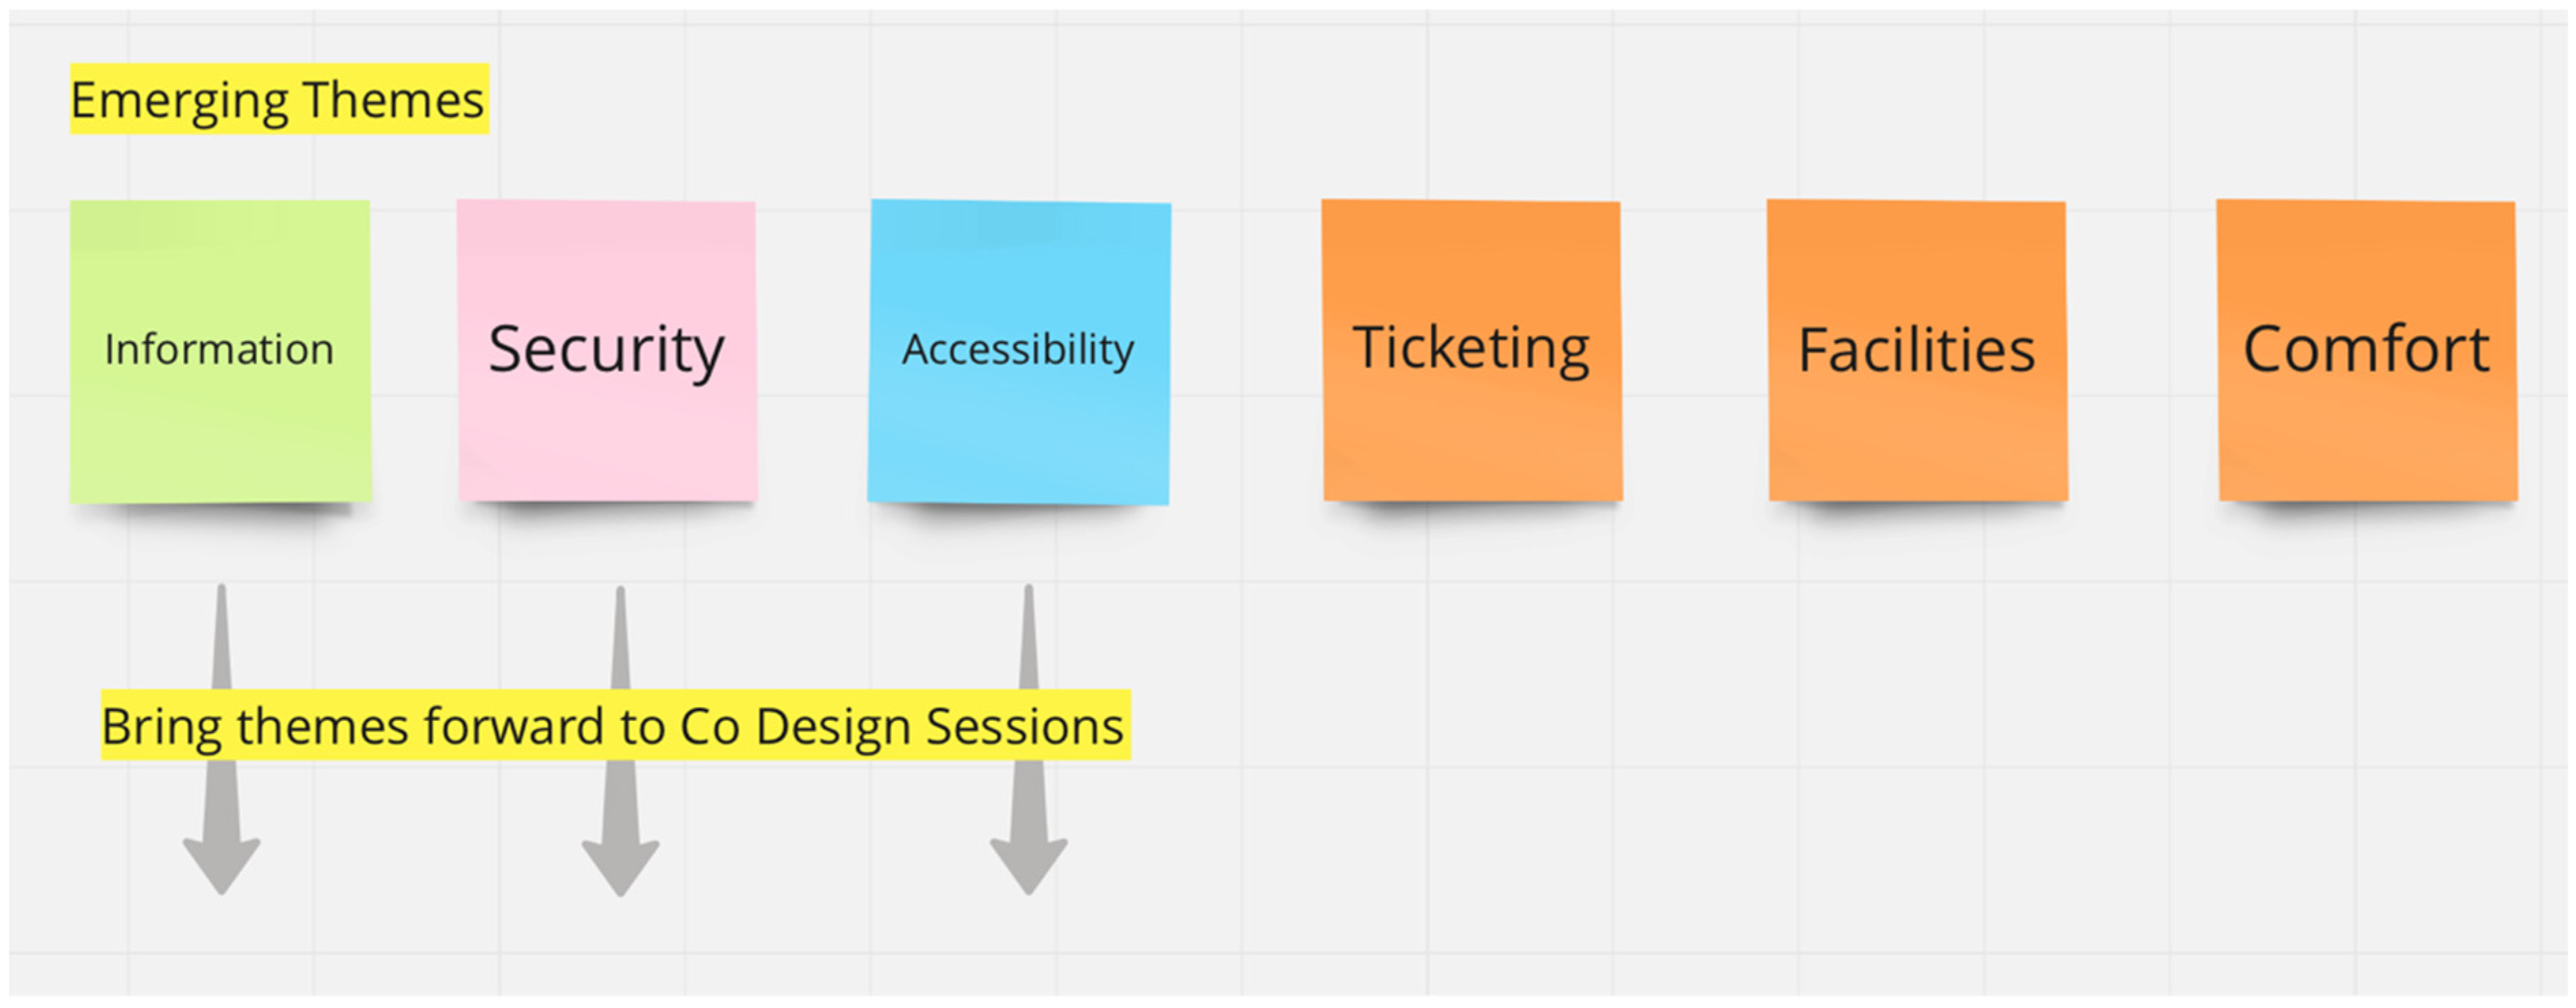
  • That areas highlighted for action include information, accessibility, personal security, ticketing, comfort, facilities, and anxiety.
  • That, as outlined in other literature, this research reiterates the need for national transport and MaaS providers to prioritise and closely consider service users’ perspectives. We recommend co-designing a means of achieving this.
The research took a holistic viewpoint of the entire customer journey and observed a high level of generally positive customer satisfaction. However, there are many gaps that Irish Rail and national public transport companies need to fill to improve the experience, such as
  • Personal safety, which is a significant issue that has affected most travellers.
  • The necessity for the transport network to be accessible, and information on its accessibility be provided on.
  • The necessity for all information to be easy to understand and be fully accessible.
  • The fact that travellers need much more information for decision-making and it must be accurate and timely.
Potential improvements are found in this study showing many ways to support the passenger throughout the door-to-door customer journey. By focusing on accessibility, personal safety, and improved information, Irish Rail could aid travellers’ decision-making to reduce stress and uncertainty.
The findings of this study will act as a plan to implement improvements in Ireland’s National Rail service. Further research will now be conducted with service users to ensure these improvements are implemented in a user-centric manner. In-person co-designing will now progress outside the limitations present during COVID-19 restrictions.
To conclude, there are many ways in which Irish Rail can use technology to improve travellers’ door-to-door experience. By drawing on the travellers’ lived experience through co-designing with them, Irish Rail can simplify and transform the door-to-door customer journey and introduce changes that will benefit everyone.

Author Contributions

F.K.: Investigation, Data Collection, Methodology, Conceptualisation, Data Curation, Analysis, Validation, Visualisation, Writing—Original Draft Preparation, Writing—Review Editing. P.J.W.: Supervision, Methodology, Conceptualisation, Validation, Writing—Original Draft Preparation, Writing—Review Editing. H.D.: Supervision, Methodology, Conceptualisation, Validation, Writing—Review Editing. All authors have read and agreed to the published version of the manuscript.

Funding

This study received funding from Iarnród Éireann: Irish Rail.

Institutional Review Board Statement

The study was conducted in accordance with the following: Ethics Committee Name: Ethical Approval Committee, Institute of Technology Carlow Approval Code: 285.

Informed Consent Statement

Informed consent was obtained from all subjects involved in the study.

Data Availability Statement

Data is contained within the article: The original contributions presented in the study are included in the article, further inquiries can be directed to the corresponding author.

Acknowledgments

The authors warmly thank all participants of this research, including participants who completed the survey and those who provided valuable contributions to the co-design workshops.

Conflicts of Interest

The authors declare no conflicts of interest.

References

  1. European Commission. Sustainable Transport. 2022. Available online: https://transport.ec.europa.eu/transport-themes/sustainable-transport_en (accessed on 2 February 2024).
  2. European Parliament. Social Inclusion in EU Public Transport, Completed in March 2015 ed.; EDC collection; European Parliament: Strasbourg, France, 2015. [Google Scholar] [CrossRef]
  3. Alyavina, E.; Nikitas, A.; Tchouamou Njoya, E. Mobility as a service and sustainable travel behaviour: A thematic analysis study. Transp. Res. Part F Traffic Psychol. Behav. 2020, 73, 362–381. [Google Scholar] [CrossRef]
  4. Doyle, M.; Gilbert, A.; Morgan, H. Future of Transport: User Study; NatCen Social Research: London, UK, 2020. Available online: https://assets.publishing.service.gov.uk/media/5fbd16e2e90e077ee32ea0cd/Future-of-Transport-User-Study-accessible.pdf (accessed on 4 February 2024).
  5. Lyons, G.; Hammond, P.; Mackay, K. The importance of user perspective in the evolution of MaaS. Transp. Res. Part A Policy Pract. 2019, 121, 22–36. [Google Scholar] [CrossRef]
  6. Enoch, M.; Potter, S. MaaS (Mobility as a Service) market futures explored. Transp. Policy 2023, 134, 31–40. [Google Scholar] [CrossRef]
  7. Witlox, F.; Zwanikken, T.; Jehee, L.; Donners, B.; Veeneman, W. Changing tracks: Identifying and tackling bottlenecks in European rail passenger transport. Eur. Transp. Res. Rev. 2022, 14, 7. [Google Scholar] [CrossRef] [PubMed]
  8. Ingvardson, J.B.; Nielsen, O.A. How urban density, network topology and socio-economy influence public transport ridership: Empirical evidence from 48 European metropolitan areas. J. Transp. Geogr. 2018, 72, 50–63. [Google Scholar] [CrossRef]
  9. Yu, C.; Dong, W.; Liu, Y.; Yang, C.; Yuan, Q. Rethinking bus ridership dynamics: Examining nonlinear effects of determinants on bus ridership changes using city-level panel data from 2010 to 2019. Transp. Policy 2024, 151, 85–100. [Google Scholar] [CrossRef]
  10. Yang, C.; Yu, C.; Dong, W.; Yuan, Q. Substitutes or complements? Examining effects of urban rail transit on bus ridership using longitudinal city-level data. Transp. Res. Part A Policy Pract. 2023, 174, 103728. [Google Scholar] [CrossRef]
  11. Dong, X. Investigating changes in longitudinal associations between declining bus ridership, bus service, and neighborhood characteristics. J. Public Transp. 2022, 24, 100011. [Google Scholar] [CrossRef]
  12. Stjernborg, V. Accessibility for All in Public Transport and the Overlooked (Social) Dimension—A Case Study of Stockholm. Sustainability 2019, 11, 4902. [Google Scholar] [CrossRef]
  13. EN 17161:2019; Design for All. Accessibility Following a Design for All Approach in Products, Goods and Services. NSAI: Dublin, Ireland, 2019.
  14. Susilo, Y.O.; Cats, O. Exploring key determinants of travel satisfaction for multi-modal trips by different traveler groups. Transp. Res. Part A Policy Pract. 2014, 67, 366–380. [Google Scholar] [CrossRef]
  15. Friman, M.; Lättman, K.; Olsson, L.E. Public Transport Quality, Safety, and Perceived Accessibility. Sustainability 2020, 12, 3563. [Google Scholar] [CrossRef]
  16. Balcombe, R.; Mackett, R.; Paulley, N.; Preston, J.; Shires, J.; Titheridge, H.; Wardman, M.; White, P. The Demand for Public Transport: A Practical Guide. 2004. Available online: https://discovery.ucl.ac.uk/id/eprint/1349/1/2004_42.pdf (accessed on 20 March 2024).
  17. Stradling, S.; Hine, J.; Wardman, M. Physical, cognitive and affective effort in travel mode choices. In Proceedings of the International Conference On Traffic And Transport Psychology-ICTTP, Berne, Switzerland, 4–7 September 2000. [Google Scholar]
  18. Cluett, C.; Bregman, S.; Richman, J. Customer Preferences for Transit ATIS: Research Report; Federal Transit Administration: Washington, DC, USA, 2003. Available online: https://rosap.ntl.bts.gov/view/dot/4138 (accessed on 22 April 2024).
  19. Kenyon, S.; Rafferty, J.; Lyons, G. Social Exclusion and Transport in the UK: A Role for Virtual Accessibility in the Alleviation of Mobility-Related Social Exclusion? J. Soc. Policy 2003, 32, 317–338. [Google Scholar] [CrossRef]
  20. Hine, J.; Scott, J. Seamless, accessible travel: Users’ views of the public transport journey and interchange. Transp. Policy 2000, 7, 217–226. [Google Scholar] [CrossRef]
  21. Myerson, J. Ideo: Masters of Innovation; Laurence King: Hachette, UK, 2001. [Google Scholar]
  22. Torabi, K.F.; Araghi, Y.; van Oort, N.; Hoogendoorn, S. Passengers preferences for using emerging modes as first/last mile transport to and from a multimodal hub case study Delft Campus railway station. Case Stud. Transp. Policy 2022, 10, 300–314. [Google Scholar] [CrossRef]
  23. Brown, T. Change by Design—How Design Thinking Transforms Organizations and Inspires Innovation; Harper Collins: New York, NY, USA, 2009. [Google Scholar]
  24. Woodcock, A.; Tovey, M. Designing Whole Journey, Multimodal Transport Provision. Des. J. 2020, 23, 91–112. [Google Scholar] [CrossRef]
  25. Tovey, M.; Woodcock, A.; Osmond, J. Designing Mobility and Transport Services: Developing Traveller Experience Tools; Taylor & Francis: Abingdon, UK, 2016. [Google Scholar]
  26. Gosselin, K. Study Finds Access to Real-Time Mobile Information Could Raise the Status of Public Transit. 2011. Available online: https://urbantoronto.ca/forum/threads/study-finds-access-to-mobile-information-could-raise-the-status-of-public-transit.16249/ (accessed on 21 August 2024).
  27. Latitude Research. Tech for Transit: Designing a Future System. 2011. Available online: https://www.infrastructureusa.org/wp-content/uploads/2011/03/tech-for-transit-summary.pdf (accessed on 21 August 2024).
  28. Dziekan, K.; Kottenhoff, K. Dynamic at-stop real-time information displays for public transport: Effects on customers. Transp. Res. Part A Policy Pract. 2007, 41, 489–501. [Google Scholar] [CrossRef]
  29. Dziekan, K.; Vermeulen, A.J. The Added Value of Real-Time Information and Effects to Customer Behaviour—A before-after Study of the Implementation of a New Real-Time Information System; KTH: Stokholm, Sweden; HTM: Hague, The Netherlands, 2004. [Google Scholar]
  30. Rezapour, M.; Ferraro, F.R. Rail Transport Delay and Its Effects on the Perceived Importance of a Real-Time Information. Front. Psychol. 2021, 12, 619308. [Google Scholar] [CrossRef] [PubMed]
  31. Yajuan, D.; Mingli, C. Impacts of Real-Time Transit Information on Bus Passengers’ Travel Choices Based on Travel Behaviour Survey. Promet—Traffic Transp. 2021, 33, 539–550. [Google Scholar] [CrossRef]
  32. Córas Iompair Éireann (CIÉ). History of CIÉ Córas Iompair Éireann. Available online: https://www.cie.ie/en-ie/Who-we-are/History-of-CIE (accessed on 20 June 2024).
  33. Iarnród Éireann. Iarnród Éireann Annual Report 2022; The Route to Sustainabilty. Dublin, 2022. Available online: https://www.irishrail.ie/Admin/getmedia/aed78e9f-a811-4c3b-a8d4-7609b912e62c/22-IE-Annual-Report-English.pdf (accessed on 21 June 2024).
  34. Menezes, T.J.T.; Gomes, C.F.S. Pharmaceutical industrial equipment qualification in Brazil: A strategic test proposal for vaccine secondary material packaging lines. Health Technol. 2020, 10, 1181–1194. [Google Scholar] [CrossRef]
  35. Steen, M.; Manschot, M.; De Koning, N. Benefits of co-design in service design projects. Int. J. Des. 2011, 5, 53–60. Available online: https://www.ijdesign.org/index.php/IJDesign/article/view/890/346 (accessed on 22 January 2024).
  36. White, P.J.; Alders, G.; Patocs, A.; Raina, P. COVID-19 and interdisciplinary research: What are the needs of researchers on aging? Tuning J. High. Educ. 2021, 9, 239–263. [Google Scholar] [CrossRef]
  37. Zallio, M.; Grey, T.; Boland, P.; Kelly, H.; White, P.J.; O’Ferrall, E. Online - based participatory design. A Case Study of Developing International Standards During a Pandemic. Strateg. Des. Res. J. 2022, 15, 39–51. [Google Scholar] [CrossRef]
  38. McKercher, K.A. Beyond Sticky Notes: Co-Design for Real: Mindsets, Methods and Movements; Beyond Sticky Notes; Inscope Books: Cammeraygal Country, Australia, 2020. [Google Scholar]
  39. Bell, J.; Waters, S. Doing Your Research Project: A Guide for First Time Researchers, 7th ed.; McGraw-Hill Education: New York, NY, USA, 2018. [Google Scholar]
  40. Tesch, R. Qualitative Research: Analysis Types and Software Tools; Falmer Press: London, UK, 1990. [Google Scholar]
  41. White, P.J.; Devitt, F. Creating Personas from Design Ethnography and Grounded Theory. J. Usability Stud. 2021, 16. Available online: https://uxpajournal.org/personas-ethnography-grounded-theory/ (accessed on 3 May 2024).
  42. White, P.J.; Devitt, F. The Design and Development of Novel Cooking and Heating Products for Irish Older Adults- a Real Health Need. Des. Princ. Pract. Int. J. 2011, 5, 13. [Google Scholar] [CrossRef]
  43. Creswell, J.W.; Creswell, J.D. Research Design: Qualitative, Quantitative, and Mixed Methods Approaches; SAGE: Los Angeles, CA, USA, 2018. [Google Scholar]
  44. White, P.J.; Okello, D.; Casey, B.P.; Najjuuko, C.; Lukanga, R. Co-designing with engineers for community engagement in rural Uganda. Des. Sci. 2023, 9, e12. [Google Scholar] [CrossRef]
  45. White, P.J.; Casey, B.P.; Cleary, O.; Finn, E.; O’Connor, K.; Coen, N. Co-design with Integrated Care Teams: Establishing Information Needs. Int. J. Integr. Care 2023, 23, 7. [Google Scholar] [CrossRef]
  46. Gaynor, L.; Dempsey, H.; White, P.J. How Design Thinking Offers Strategic Value to Micro-Enterprises. In Proceedings of the Design as a Catalyst for Change—DRS International Conference, Limerick, Ireland, 25–28 June 2018; Storni, C., Leahy, K., McMahon, M., Lloyd, P., Bohemia, E., Eds.; Design Research Society: London, UK, 2018; Volume 7, pp. 2974–2986. [Google Scholar] [CrossRef]
Figure 1. The ‘Door-to-Door’ journey as described by IDEO for Amtrak (USA).
Sustainability 16 08741 g001
Figure 2. Mixed methods research methodology used in the study.
Sustainability 16 08741 g002
Figure 3. Emerging themes from the survey, three of which were brought forward for further research.
Sustainability 16 08741 g003
Figure 4. Co-design workshop virtual whiteboard showing the activities designed for the participants.
Sustainability 16 08741 g004
Figure 5. Screenshot superimposing all the workshop participants’ whiteboard activity on personal safety at every stage of the journey.
Sustainability 16 08741 g005
Figure 6. Responses from the co-design workshop participants on ‘what parts of the journey feel safe or unsafe?’
Sustainability 16 08741 g006
Figure 7. Sample of some sticky notes completed by the participants themselves during one of the online co-design sessions.
Sustainability 16 08741 g007
Figure 8. Coded aggregation of workshop participants’ responses during the activity, ‘What travellers are afraid of?’
Sustainability 16 08741 g008
Figure 9. Coded aggregation of workshop participants’ responses during the activity ‘What are the essential types of info you need?’
Sustainability 16 08741 g009
Figure 10. Coded aggregation of workshop participants’ responses during the activity ‘What are the nice to have types of info you need?’ which they considered ‘nice to have’.
Sustainability 16 08741 g010
Figure 11. Screenshot superimposing all the workshop participants’ whiteboard activity on accessibility at every stage of the journey.
Sustainability 16 08741 g011
Figure 12. Percentages of how ‘Accessible’ the participants felt each stage of the journey was.
Sustainability 16 08741 g012
Figure 13. Suggestions from workshop participants on ways the journey can be easier for everyone.
Sustainability 16 08741 g013
Figure 14. Collated responses from all the workshops on the key question if autonomy can be improved.
Sustainability 16 08741 g014
Figure 15. Experience map for Irish Rail.
Sustainability 16 08741 g015
Figure 16. Thematic analysis visual synthesis of five thousand responses from travellers on their needs, which are mapped to the door-to-door customer journey.
Sustainability 16 08741 g016
Figure 17. Conceptual design, an idealised system derived from user’s needs to communicate the first steps towards finding solutions for improving discovery and planning and assisting people when travelling.
Sustainability 16 08741 g017
Table 1. Representativeness of sample participants.
ParticipantGenderTraveller TypeDisability
AMaleNon-FrequentNo
BMaleFrequentYes
CFemaleFrequentNo
DMaleNon-FrequentNo
EMaleFrequentNo
FFemaleNon-FrequentNo
GMaleNon-FrequentYes
HFemaleNon-FrequentNo
IFemaleFrequentNo
JMaleFrequentNo
KMaleNon-FrequentNo
LFemaleFrequentYes
MMaleNon-FrequentYes
NMaleFrequentNo
SummaryMale = 9
Female = 5
Frequent = 7
Non-Frequent = 7
Yes = 4
No = 10
Table 2. Survey questions mapped to the stages of the door-to-door journey.
Quantitative QuestionsQualitative Questions
LearningGenerally speaking, do you think most people in Ireland know about Irish Rail?
Do you think information on Irish Rail is easily obtained?
Do you think it is easy to compare advantages or disadvantages of train travel with other modes of travel?
PlanningHow do you find out about train timetables and prices? Tick all that apply.
When planning a new trip, do you check if there is a train service near your destination?
StartingDo you feel that you have all the information that you need before setting out?Can you briefly describe what is on your mind when setting out on a journey?
EnteringWhen you arrive at the station, is it easy to access and navigate?What is on your mind when entering the station.
Is it easy to park your bike, scooter, car etc.?
TicketingHow do you usually purchase your ticket?Why did you choose this method? (Purchasing ticket)
Do you find purchasing tickets easy?
WaitingIs your safety and security a concern as you wait?What is on your mind when waiting for the train to arrive?
How do you keep informed about the train as you wait?Is there anything that would make waiting in the station better for you?
BoardingDo you feel confident when boarding?As your train arrives what is on your mind?
Is there anything that would make boarding easier for you?
TravellingIs your safety and security a concern while travelling?What is on your mind as you travel?
If delays occur, do you feel sufficiently informed?Is there anything that would make travelling more enjoyable?
If train A was slightly quicker but very busy and train B was slightly slower but very quiet, generally speaking which would you take?
Arriving What is on your mind as you near the end of the train trip?
ContinuingTypically, what are your next steps? Tick all that apply.What is on your mind as you arrive at your final destination?
Research QuestionGenerally speaking, do you feel sufficiently independent in your mobility options and freedom to travel?Is there anything that would improve your general mobility and freedom?
Are you comfortable using smartphone and apps?
Which of the following often feature in your door to door trip? Tick all that apply.
AccessibilityDo you have any physical restrictions with regard to your mobility on public transport?
Do you encounter any sensory or communication restrictions when using public transport?
Customer Satisfaction Generally speaking, are you satisfied with your whole journey?
Data QualityHow often would you make trips on Irish Rail (in normal times pre COVID)?
Table 3. Benefits of co-design, collated by Steen et al. [35].
Benefits for the ProjectBenefits for the UsersBenefits for the Organization
Improving Idea GenerationBetter ideas, better knowledge about customers’ needs. Improved creativity and focus on customers. Improved interdisciplinary cooperation.
Improving the serviceImproved service definition, higher quality and more successful innovations.Better fit of service and needs, contributing to a better experience and higher quality.
Improving Project ManagementBetter project management, decision making, lower development cost, reduced development time and continuous improvement.
Improving longer term effects Higher satisfaction, loyalty and more educated users.More successful innovation and more support for change. Improved relationships and public relations.
Table 4. Result themes from the survey including description of key insights.
ThemeKey Insights
InformationWhen delays happen, 57% do not feel sufficiently informed.
The majority of travellers (57%) feel it is difficult to compare the advantages of train travel with other modes of travel.
When planning a new trip, 24% of travellers do not check if there is a train service serving it.
Fourteen percent of travellers do not have all the information they need before setting out to travel.
AccessibilitySix percent of travellers do not feel independent enough.
Four percent have some physical restrictions on their mobility to travel on public transport.
Ten percent of travellers encounter sensory or communication restrictions when travelling on public transport.
At the station, 14% do not find it easy to access and navigate it.
Accessibility is a concern for travellers at all stages of the complete customer journey.
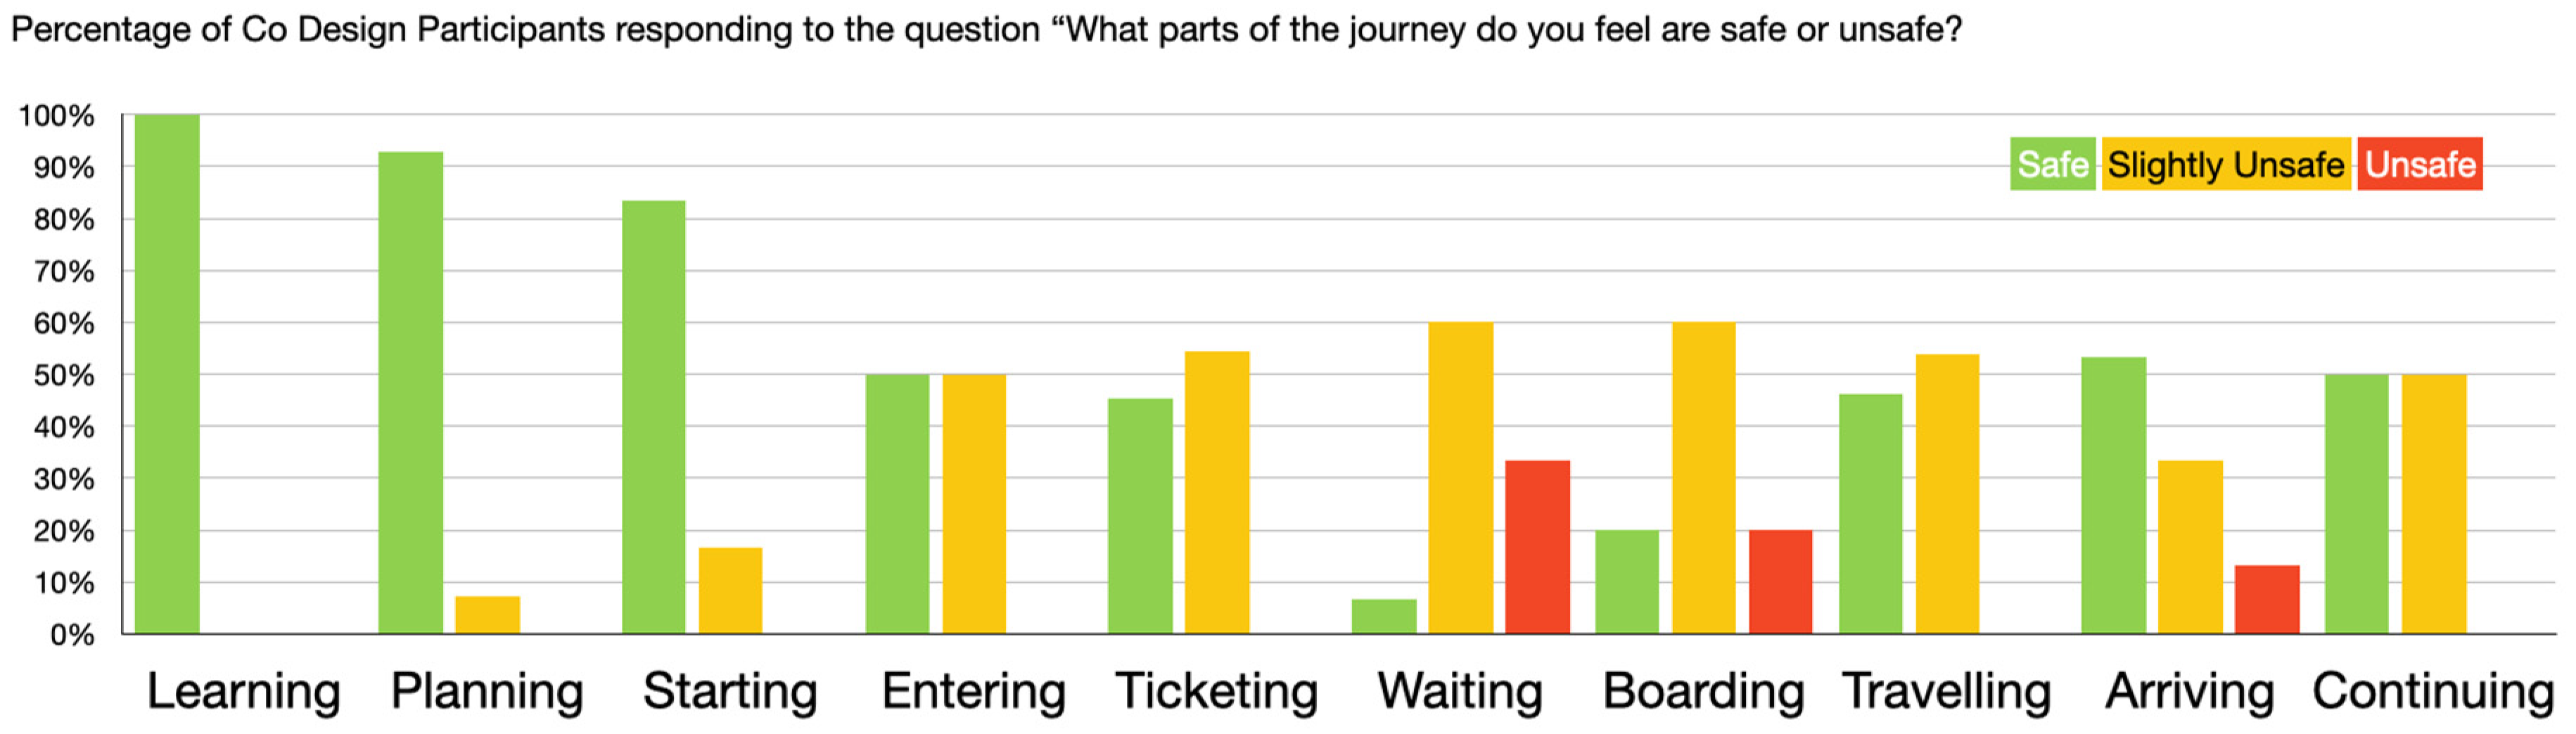
Personal SecurityFifty-five percent have experienced safety and security concerns.
Personal safety is a concern at all stages of the complete customer journey.
While the train is in motion, 47% of travellers continue to be concerned with safety and security.
TicketingClose to one-fifth of people purchase their tickets offline.
The decision of whether to buy online/ticket office/ticket machine, etc., is mainly influenced by the perceived convenience and the cheapest price.
ComfortSixty-seven percent of travellers might prefer a quieter train even if it is slower.
FacilitiesAlmost half the travellers that need to park (car, bike, scooter) find it difficult.
AnxietyAs the train arrives, there are several things in the mind of travellers that may give rise to anxiety, such as lateness, getting a seat, their safety, if they are on the correct train, and if they will be able to get on safely.
As the train arrives at the destination, there are many thoughts that can give rise to anxiety, e.g., getting off, personal belongings, unruly passengers, making connections, getting out of the station, etc.
Table 5. Users’ needs mapped to stakeholder and potential IT solution.
Description of User NeedPrimary
Stakeholders
Potential
IT Solution
Network and destination guidesIrish RailYes
Reporting anti-social behaviour and calling for helpIrish Rail/Gardai (Irish Police)Yes
Better integration with other travel modesIrish Rail/National Transport AuthorityPartially
Carbon calculatorIrish RailYes
Communicating delays in real time and accuratelyIrish RailYes
Easier exiting at end of journeyIrish RailPartially
Comparison of travel modesIrish RailYes
Providing real-time platform info including notifications if sudden changesIrish RailYes
Info on facilities availableIrish RailYes
Quiet areas in trains and stationsIrish RailPartially
Way-finding inside train to seat reserved for bikes/wheelchair spaceIrish RailPartially
Way-finding out of station and onwardIrish RailYes
Detailed accessibility infoIrish RailYes
Way-finding to station and inside itIrish RailPartially
Cheaper fares and mobile ticketing.Irish Rail/National Transport AuthorityPartially
Improved reliabilityIrish RailNo
Comparing trains quick vs. quiet, etc.Irish RailYes
Highly accurate: train position/delay/next stop/lift status/capacityIrish RailYes
Capacity predictionIrish RailYes
More and improved ticket vending machinesIrish RailPartially
Improved capacity for people bikes and propriety passengersIrish Rail/National Transport AuthorityNo
Improved facilities in stationIrish RailNo
More car and bike parking spaces.CIE Property/Local AuthoritiesNo
Info on refreshments and orderingIrish RailYes
Human assistanceIrish RailPartially
Wi-Fi and chargingIrish RailNo
Stations and trains to be designed better so they are more accessible and easier to use, brighter, more comfortable and weather protected.Irish RailNo
Safer environment with means to request help/assistance and more CCTV.Irish RailPartially
Ability to report faults such as lifts out of order etc. and also to report dirty areas and suggest improvements Irish RailYes
Simpler and accessible information, better signage and way-finding. Irish RailYes
Larger railway network, more trains, multi modal.Irish Rail/National Transport AuthorityPartially
Disclaimer/Publisher’s Note: The statements, opinions and data contained in all publications are solely those of the individual author(s) and contributor(s) and not of MDPI and/or the editor(s). MDPI and/or the editor(s) disclaim responsibility for any injury to people or property resulting from any ideas, methods, instructions or products referred to in the content.

