Article

Sustainable Modernization of Wastewater Treatment Plants

Research and Education Centre “Water Supply and Wastewater Treatment”, Moscow State University of Civil Engineering, 26, Yaroslaskoye Highway, 129337 Moscow, Russia
*
Author to whom correspondence should be addressed.
Sustainability 2024, 16(20), 8757; https://doi.org/10.3390/su16208757
Submission received: 29 August 2024 / Revised: 3 October 2024 / Accepted: 8 October 2024 / Published: 10 October 2024
(This article belongs to the Special Issue Advances in Urban Wastewater Treatment Using Membrane Processes)

Abstract

:
This analytical study was conducted on the basis of statistical data from the Russian Federation and technological requirements for WWTP operation. As a case study, a virtual WWTP, which serves a residential area of 31,500 PE (personal equivalent), was considered to solve a task of their potential upgrade. According to the initial data, within modernization, the existing infrastructure of the WWTP should be considered in order to receive wastewater with a reduced flow rate and increased values of pollutant concentrations. Within the analysis, treatment efficiency should correspond to current regulations. Special focus was put on secondary treatment facilities, as they ensure the removal of major contaminants (organic pollution) and nutrients (nitrogen and phosphorus). The results showed that even in the case of a lower flow rate, higher pollutant concentrations demanded a doubled volume of activated sludge reactor to provide the required efficiency. An increase in oxidizing capacity may be ensured through the growth of mixed liquor suspended solids (MLSS) value with simultaneous transition from gravity to membrane sludge separation. A study revealed that an MLSS raised from 3 to 8 g/L allows treatment in the existing tanks to be performed with necessary efficiency. In this case, significant costs for the purchase of membranes are offset by the need for zero additional construction. On the other hand, such a transition leads to an increase in operating costs of 60% (from EUR 0.078 to EUR 0.12/(m3/d)).

1. Introduction

Wastewater treatment plants (WWTPs) are an integral part of the life support systems of cities worldwide. Achieving the necessary treatment efficiency is a prerequisite for the comfortable functioning of human habitations as well as for maintaining a stable environmental situation [1,2]. The technological cycle usually implies the discharge of wastewater after WWTPs into water bodies. Thus, if the limits for pollutant concentrations in discharged wastewater are exceeded for one or more pollution indicators, this can lead to serious environmental damage. If a water body is also used for water supply, a failure in WWTPs’ operation can also pose a significant threat to public health and safety [3].
Urban WWTPs are usually embedded into centralized wastewater disposal systems, which implies a single complex of facilities and structures for collecting, transporting, pumping, and treating wastewater [4]. WWTPs receive wastewater from areas of residence and stays of people, as well as from industrial enterprises (including after pre-treatment) [5,6]. The construction and development of WWTPs accompanied the development of cities, which was actively underway in the 20th century, and most of them were built at that time and, more specifically, from 1950 to 1990 [7,8,9].
In most cases, this means that a municipal WWTP already exists; it has been in operation for at least 30–35 years. Since this period usually exceeds the service life of the equipment, the treatment facilities most likely require modernization [10]. As a rule, the wastewater disposal system of a settlement implies the presence of one WWTP. Only large cities and megacities usually have several WWTPs. Thus, it is necessary to perform modernization without overhauling the operation of the entire WWTP. In the case of a significant extension of the city, another WWTP can be built, but this requires significant costs, and such cases are not frequent [11,12].
Before WWTP modernization is initiated, it is essential to analyze the current background. Among the reasons that force an upgrade, the following can be distinguished: a flow rate increase accepted by the WWTP; wear of existing facilities (tanks, equipment, etc.); inefficiency of treatment; stricter requirements for the quality of treatment. As a rule, modernization is a complex process of measures and actions that are required due to a combination of the above reasons [7,13,14].
In most cases, poor infrastructure conditions result in WWTPs failing to ensure the required quality of discharged of wastewater. The capacity increase may often not be required within an upgrade; moreover, the demanded capacity may even decrease. This is usually the result of water conservation measures and an increase in the cost of water resources, as well as the increasing environmental awareness of societies, especially in Europe, where there is a high so-called water stress index [15,16].
Alterations in water legislation are a worldwide process, which usually mean the application of stricter requirements for the content of pollutants in treated wastewater or the extension of the list of indicators under control [17,18,19]. In many countries, until about 2000, the treatment quality was mainly assessed on biochemical oxygen demand (BOD) and/or chemical oxygen demand (COD) and total suspended solids (TSS) [20]. Now, as a rule, removal of nitrogen and phosphorus compounds (both called nutrients) is required [21]. This means that design approaches cannot ignore current standards. Taking into account the wear and tear, it may be difficult to ensure the earlier designed treatment efficiency, not to mention more stringent requirements. Thus, the reasons for upgrading WWTPs may be different, but they are almost always interrelated. At the same time, modern approaches require compliance with the principles of sustainable development: reducing the environmental impact of treated water and ensuring a minimally reasonable cost to the life cycle of wastewater treatment plants. The latter condition usually implies energy-efficient solutions and best technological practices [22,23,24].
According to statistics, about 9000 municipal WWTPs are currently in operation in Russia. The annual inflow is approximately 9 × 10⁹ m3. At the same time, on average, only 45% of influent wastewater can be treated to the required parameters [25]. In WWTPs with higher capacity, it is usually easier to achieve the required wastewater treatment efficiency. Respectively, the share of WWTPs providing the required quality is probably less than the specified value of 45%. In other words, at least 2/3 of WWTPs (6000 out of 9000) require modernization, at least due to their low treatment efficiency. Most likely, other reasons for modernization are also present at these stations.
Conventionally, the WWTP upgrade implies significant investments in the form of capital expenditure (CAPEX), which may lead to an increase in tariffs for wastewater disposal. Since WWTPs are the objects of socially important infrastructure, technological solutions should be chosen responsibly [26,27]. This also means forecasting of possible operation costs (OPEX) that arise at the operational stage.
This article presents an analytical study of the directions of WWTP modernization which is aimed at providing sustainable development for an entire urban environment. This research is based on the available statistical information for cases in the Russian Federation with the following analysis of the best technological solutions.

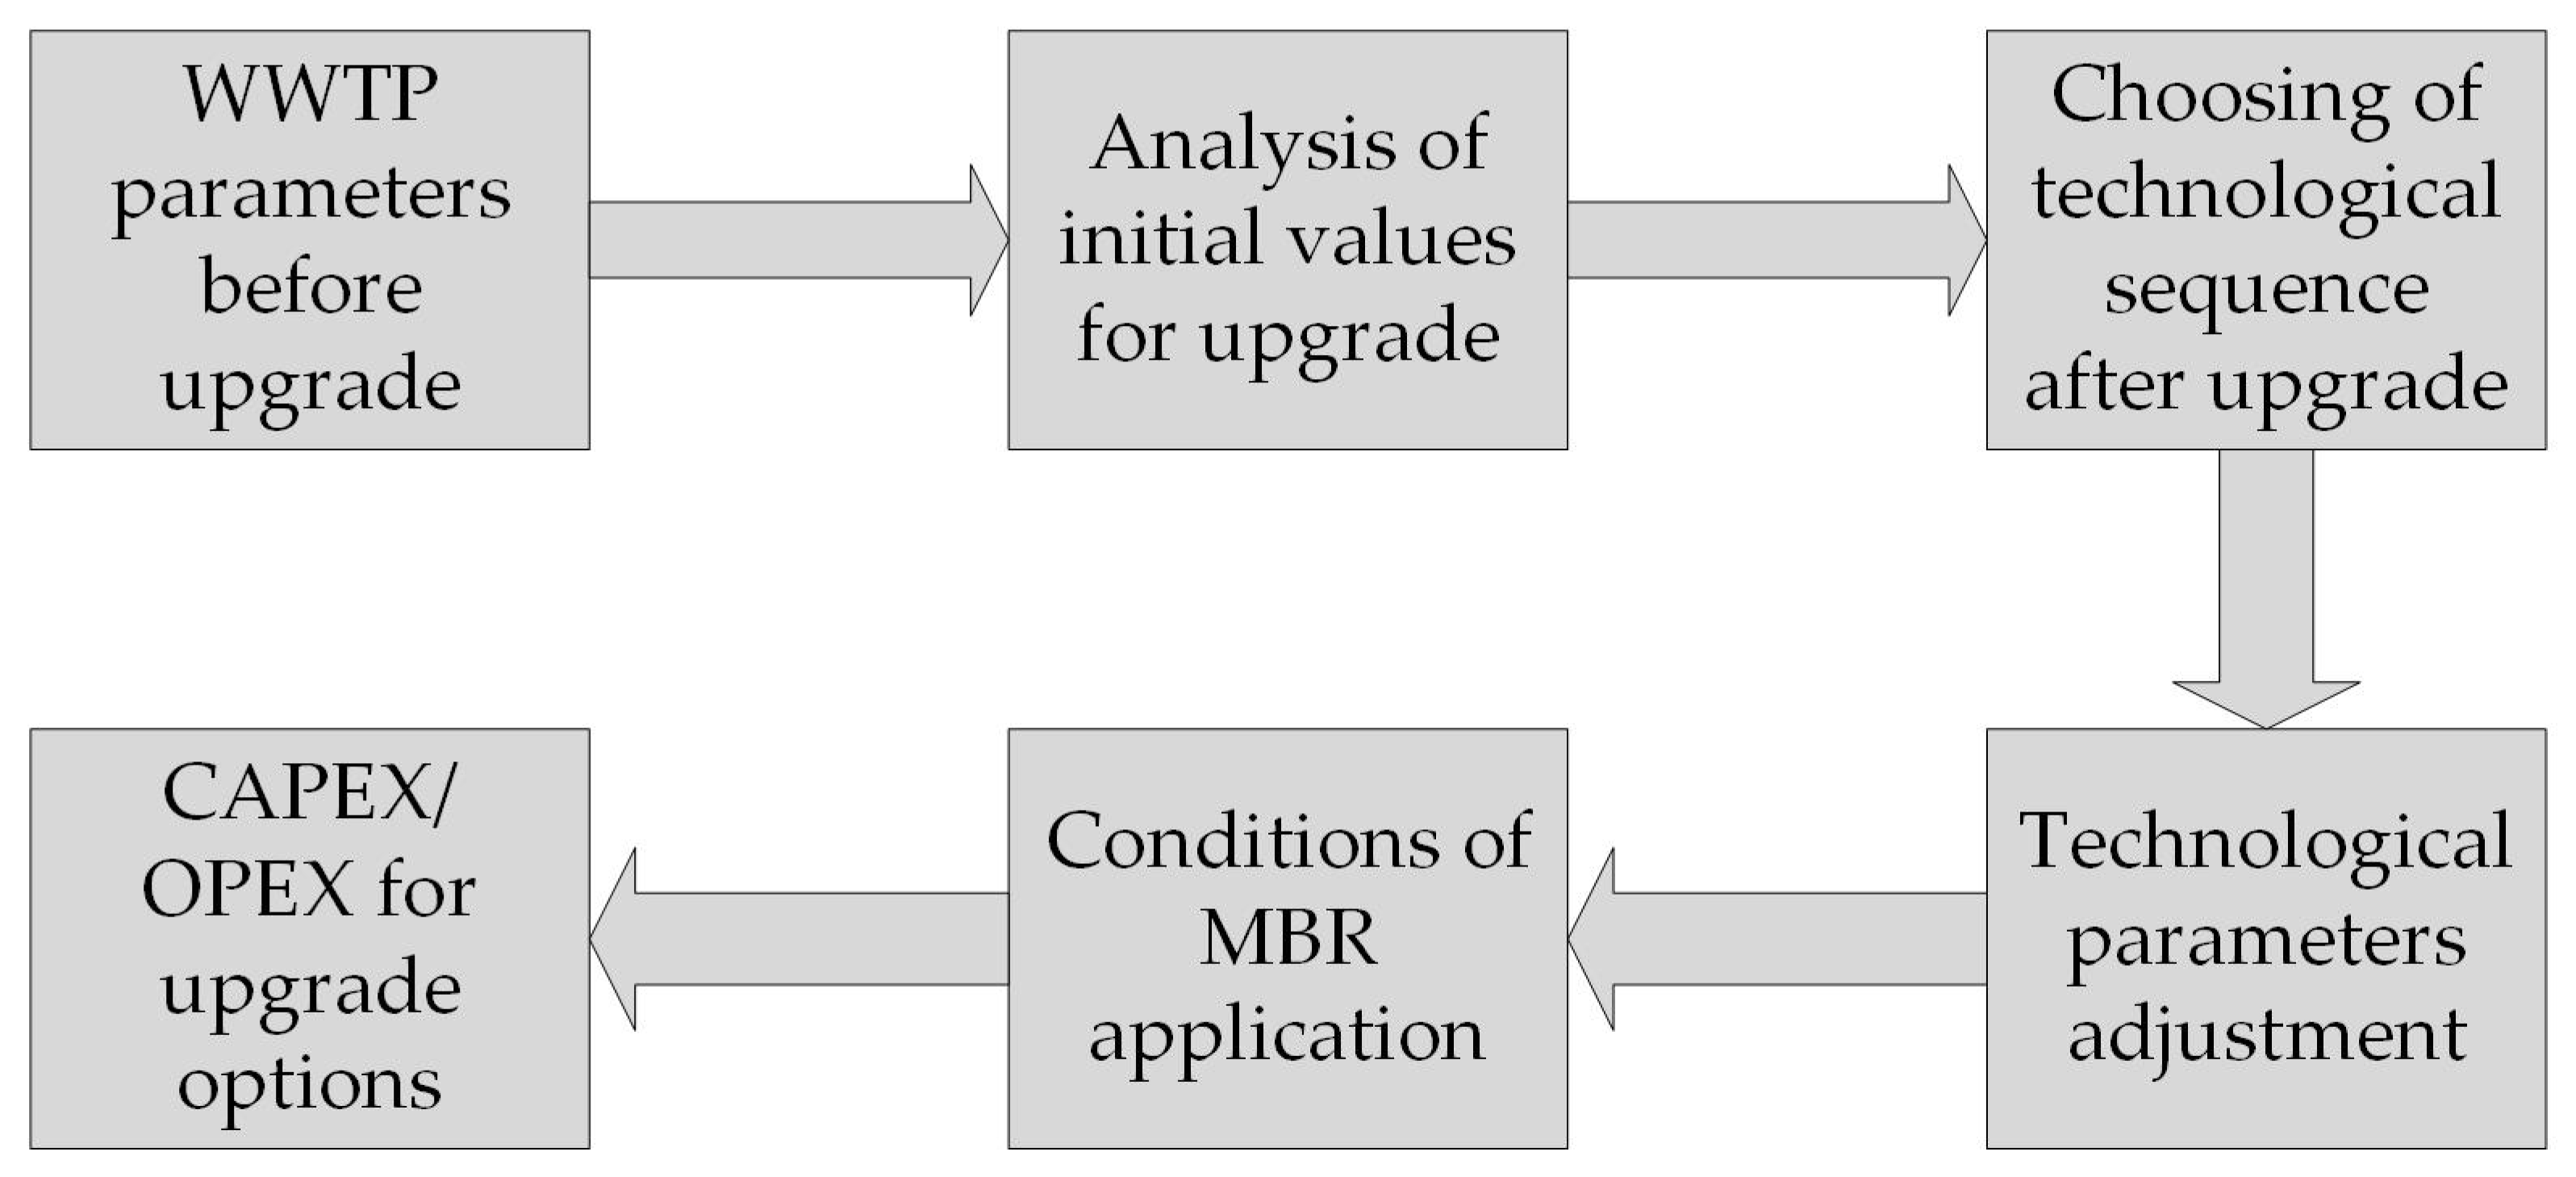
2. Materials and Methods

Different calculation methods and specialized software can be used as research tools. Previously, it was found that two methods provide a sufficiently high convergence of results; respectively, they can be used with the same accuracy relative to each other [28]. They mostly consider the physical dimensions of the facilities or tanks. Automated cost calculation is limited to the embedded equipment libraries, which are not flexible.
According to statistics, there are approximately 16,900 settlements in Russia, of which approximately 14,600 belong to rural settlements, another 1177 are urban settlements, and 1177 are cities. As a rule, cities and urban settlements imply the presence of centralized sanitation systems, while sanitation in rural settlements (depending on the population) can be centralized and decentralized [29]. Thus, centralized systems of cities and urban settlements are of the greatest interest. The distribution of the number of cities by population is shown in Figure 1.
This study is based on a comparison of initial WWTP performance and calculated indicators after the application of various upgrade solutions. To conduct a study, it is necessary to determine the intended object of the study. Figure 1 shows that the largest number of cities have a population in the range of 20 to 50 thousand people. With a total population of 10.73 million for this category, the average population of the city is about 31,500 people. For subsequent calculations, we use this value as the initial data.
If the sewage treatment plants were built 30–35 years ago, the calculation was usually made based on data presented in [30]. The estimated daily rate of sanitation per inhabitant at the time of construction was in the range of 350 L to 500 L. For the current study, a value which is slightly higher than minimum (380 L) will be applied. Based on this value, the wastewater flow from a settlement equal to 31,500 PE (people equivalent) is approximately 11,970 cubic meters per day. There are no separate statistics on the performance of wastewater treatment plants, so it can be assumed that urban WWTPs with an inflow of 10 to 15 thousand cubic meters per day are the most common.
In addition to the flow rate, it is necessary to determine the concentrations of pollutants contained in the influent wastewater to carry out a full-fledged calculation. At existing WWTPs, pollution concentrations can be obtained from quantitative chemical analyses of wastewater samples, which should be carried out on a regular basis. If such information is unavailable or if the results of the analyses are not systematic, concentrations can be defined by calculation. The following calculation is based on the value of the mass of pollutants per capita, attributed to the wastewater flow rate per capita:
C X X . b m = 1000 · M P C Q P C
where CXX.bm is a calculated concentration of a certain pollutant in the influent wastewater [mg/L] before modernization;
MPC is the mass of pollutants per capita [g/d] (see Table 1);
QPC.bm is the daily wastewater flow rate per capita [L/d]; before modernization, QPC = 380 L/d per capita.
Thus, according to the specified methodology, the concentrations of pollutants will be what is shown in Table 1.
Within current modernization, the calculation sequence should be altered; since the guidelines in [30] are no longer in action, calculations should be made based on the requirements of valid documents.
According to [31], a typical value of the wastewater flow rate is currently equal to 180 L/d (0.18 m3/d) per capita, which is 50% less than the previous basic value. Such a significant decrease is explained by the introduction of devices for measuring water consumption in households, which allows more precise estimation. Moreover, reduction in water consumption is the result of the introduction of water-saving measures in general. Thus, in this case, the average water consumption can be the following:
Q m i d . d = Q P C × N h a b = 0.18 × 31,500 = 5670   m 3 d
Overall, this is confirmed by the statistics obtained during the survey of existing WWTPs. The data demonstrate that most WWTPs are currently underloaded, and the real flow is lower than initially calculated [32].
Nevertheless, the value of 5670 m3/d is not final. According to [33], additional correction factors should be applied within the flow calculation of existing WWTPs:
K1 = 6–12%: the amount of wastewater from local industry (trade, services, catering, etc.);
K2 = 4–8%: unaccounted expenses, including water received from subscribers who have illegal tie-ins, underestimated water consumption, have unaccounted artesian wells, etc.;
K3 = 4–8%: unorganized inflow (surface and drainage waters).
Considering that in an existing city the influence of the factors above can change dynamically, the maximum recommended values will be taken within this research. Then, the average daily wastewater flow entering the WWTP will be calculated as follows:
Q m i d . d = Q P C · N h a b · K 1 · K 2 · K 3 = 0.18 · 31,500 · 1.12 · 1.08 · 1.08 = 7407   m 3 d
Even despite the increasing coefficients, this average daily flow remains significantly less (by about 40%) than previously accepted. However, despite the reduced value of the wastewater flow rate per capita in the current regulatory documents, the values of the mass of pollutants per capita remained close to the previous ones. In current conditions, Equation (1) would not be entirely correct due to the introduction of additional coefficients in Equation (3). It would be more correct to determine the total mass of pollutants and attribute it to the value of Qmid.d (Equation (4)):
C X X . a m = N h a b · M P C . r e v Q m i d . d
where CXX.am is a concentration of a specific pollutant in the influent wastewater [mg/L] after modernization;
MPC.rev is the revised values of the mass of pollutants per capita [g/d] (see Table 2);
In this case, the following values can be obtained (Table 2).
Based on the initial values obtained, this study analyzed ways to modernize wastewater treatment plants using various technological solutions. The research proposes the following sequence (Figure 2).

3. Results

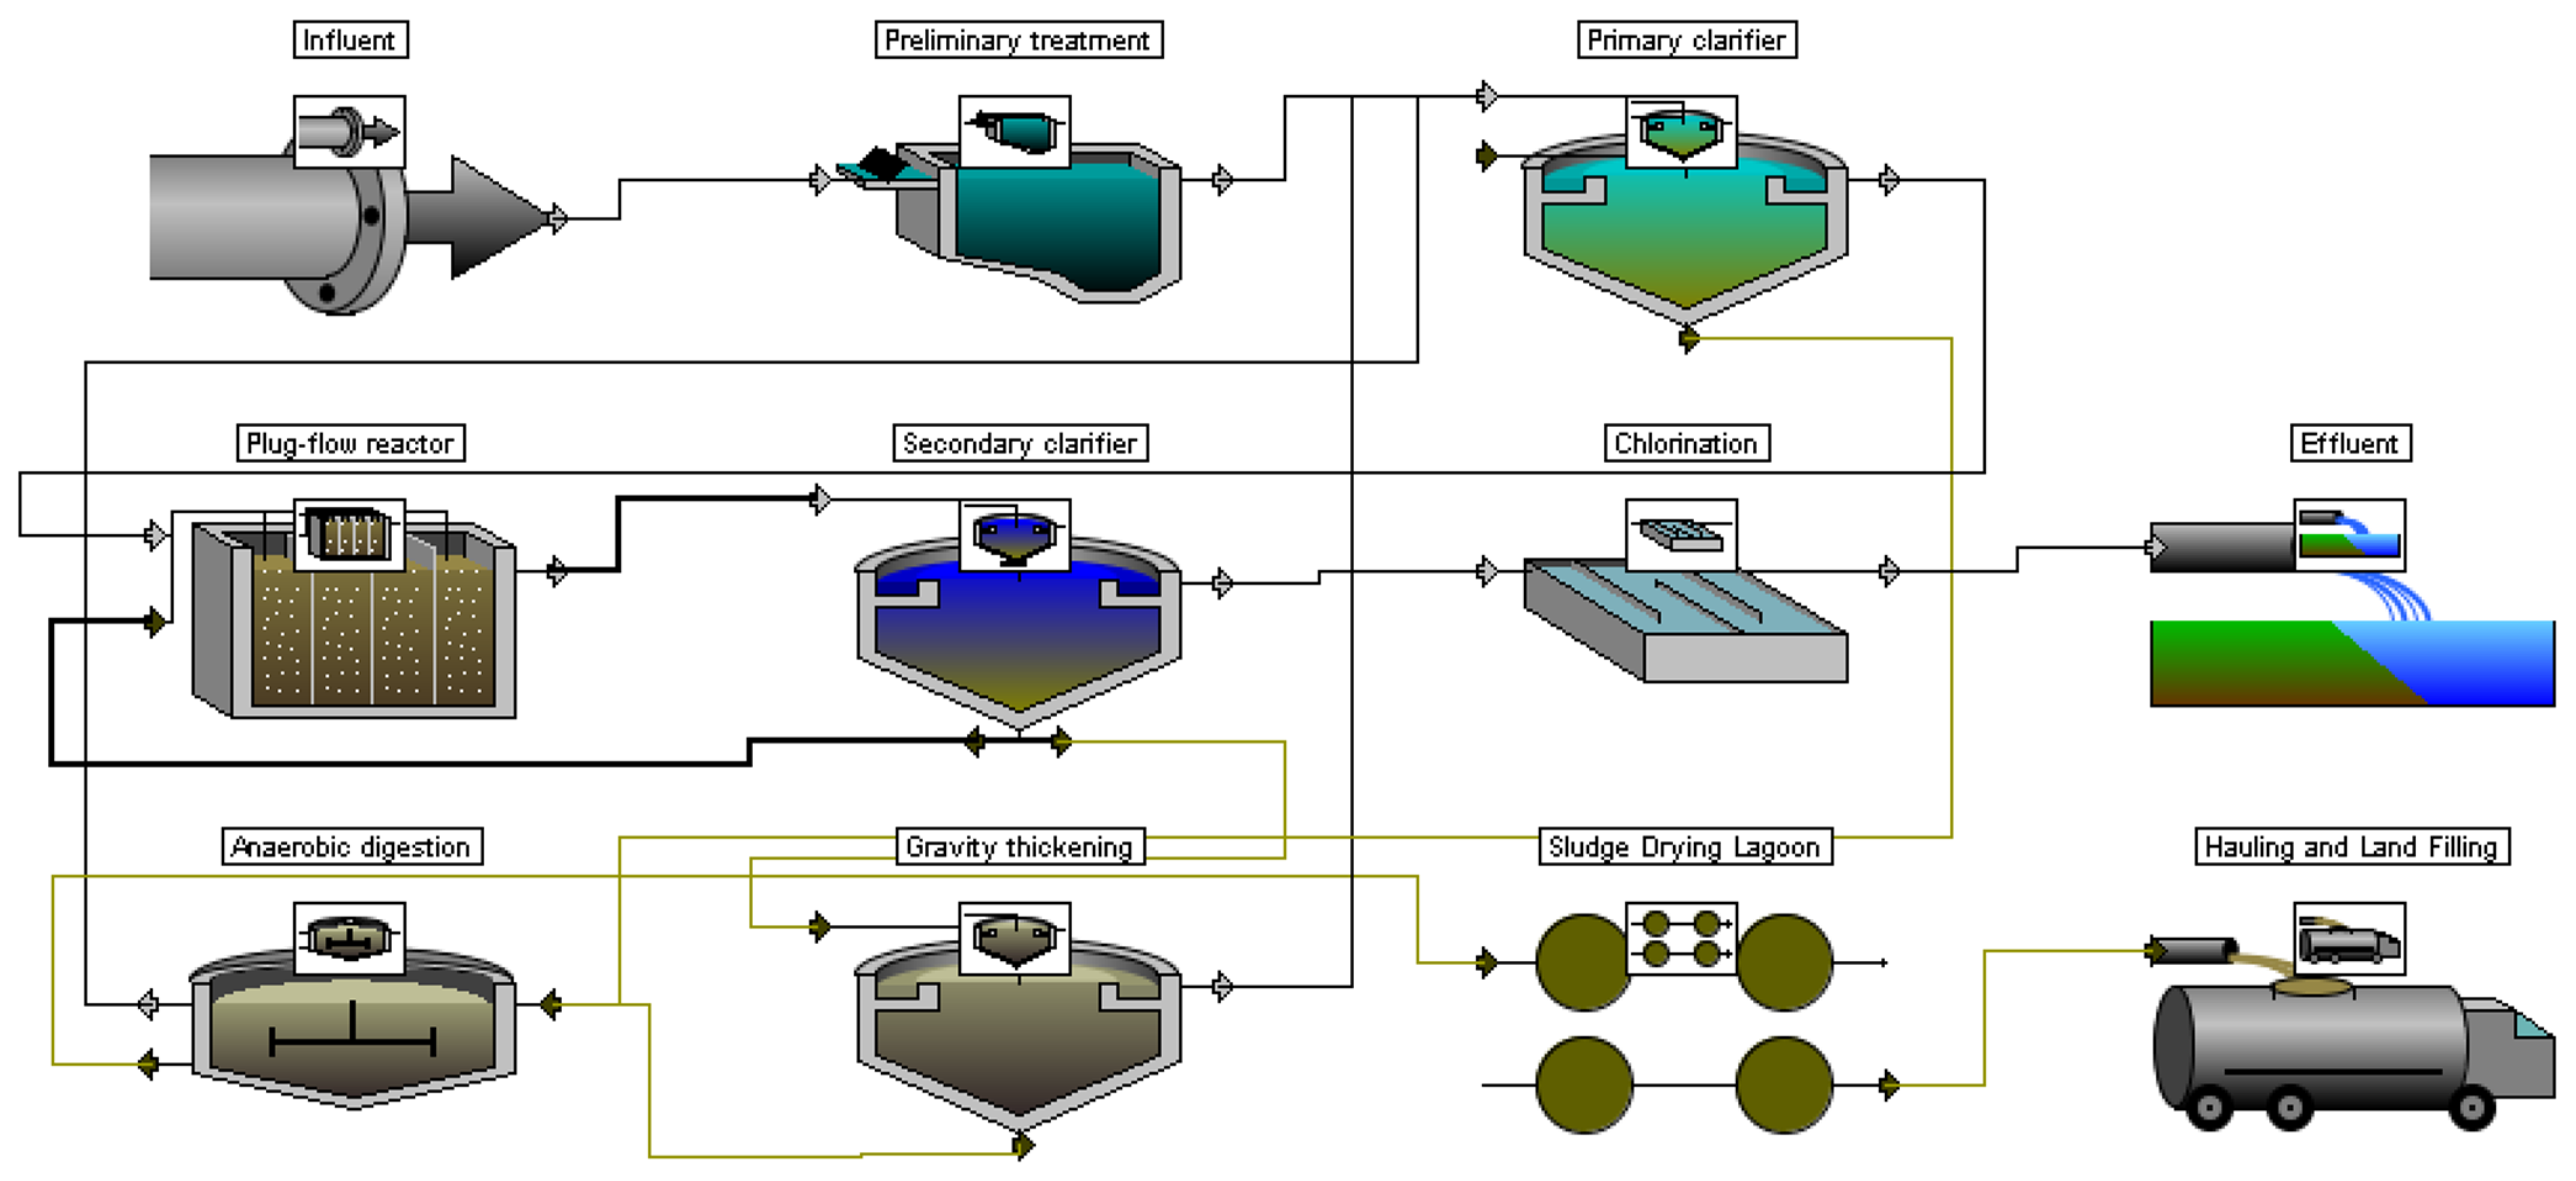
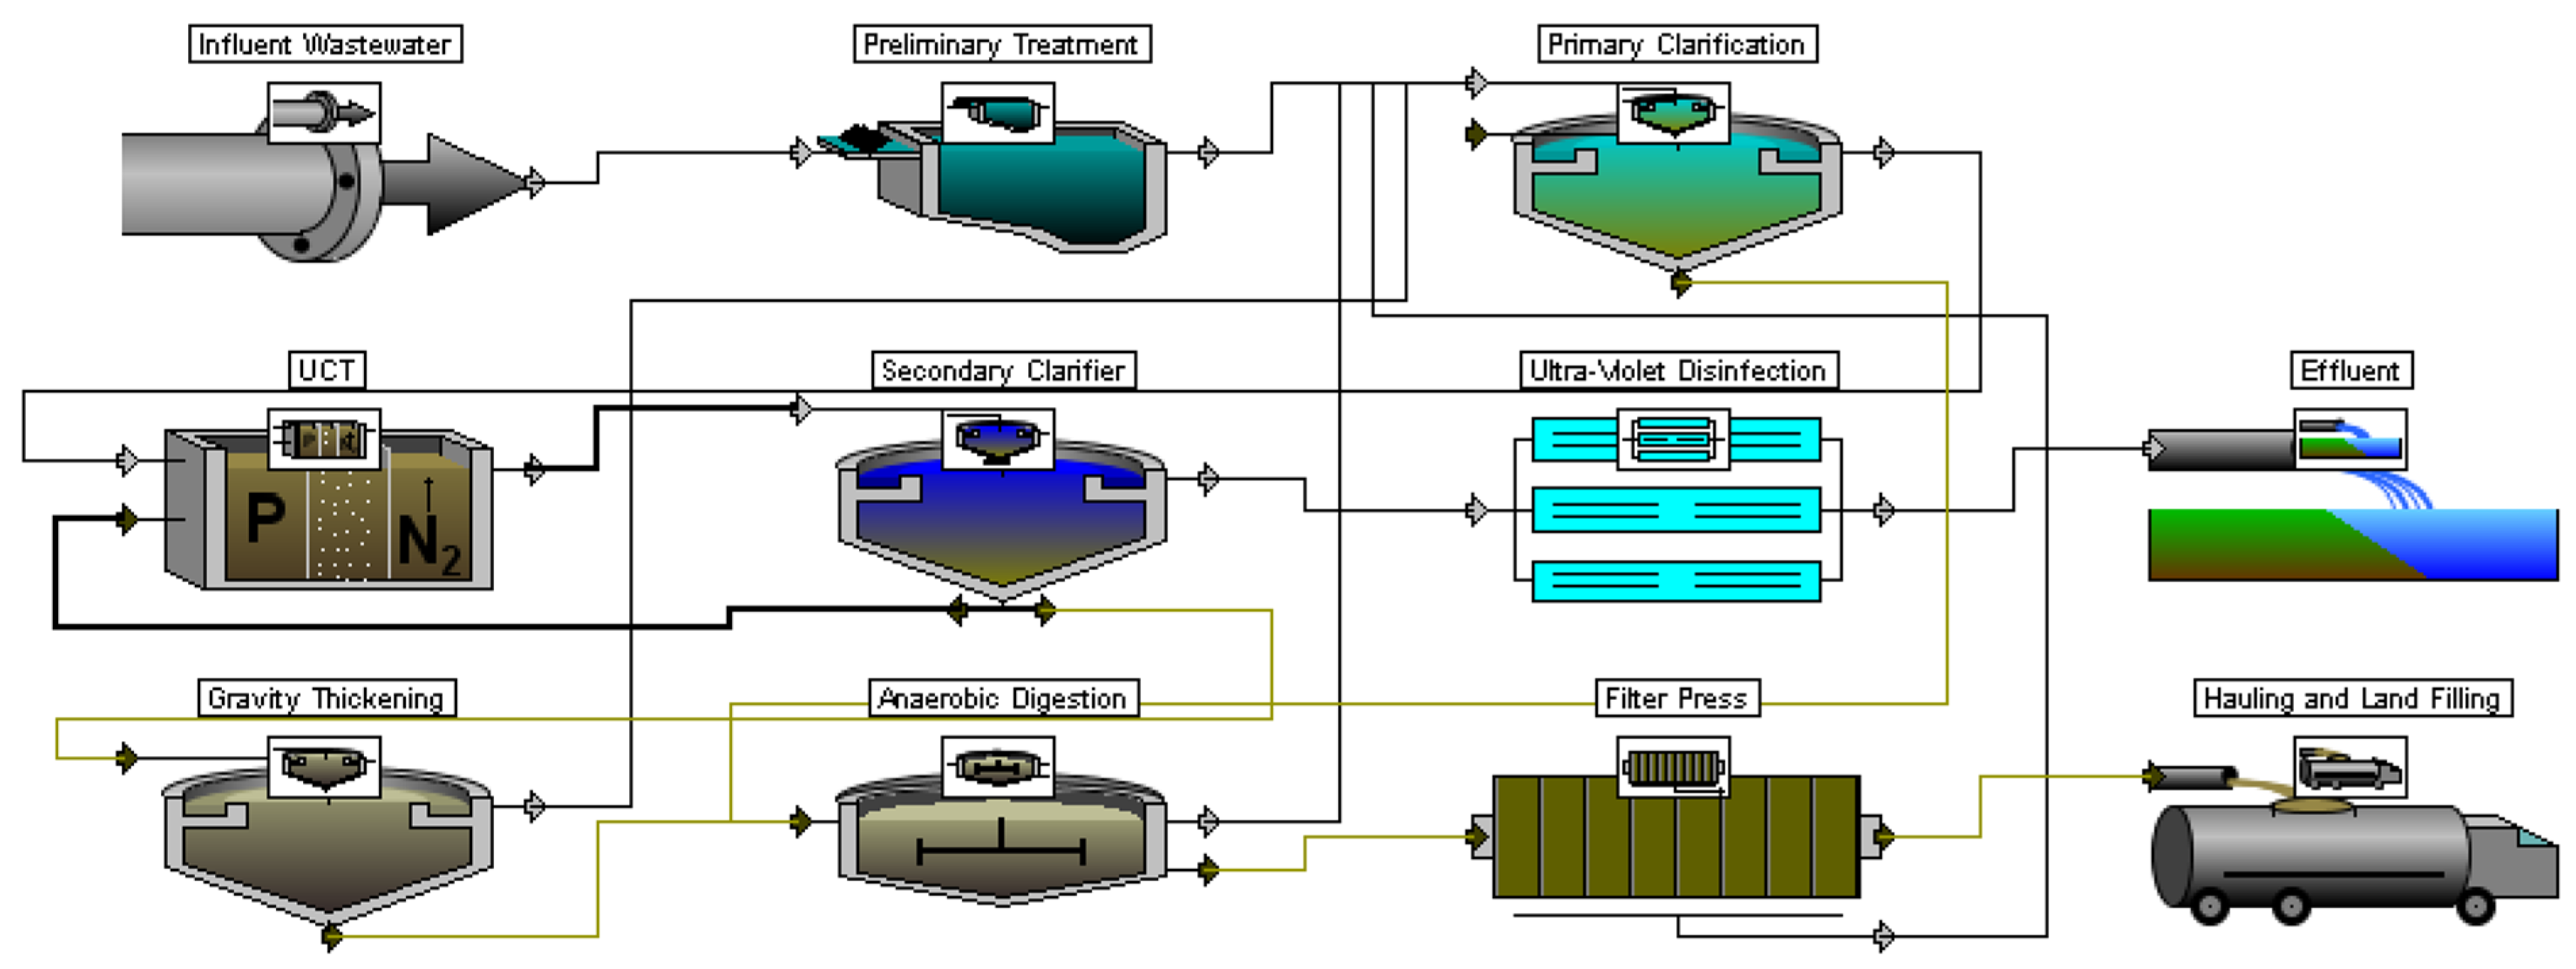
3.1. Treatment Efficiency

As already mentioned, one WWTP normally accepts the wastewater of one residential area. Therefore, during modernization, WWTPs cannot be completely out of operation. Accordingly, a WWTP upgrade may be carried out gradually due to decreased inflow. The sequence of modernization normally includes the following:
  • Inspection of structures with determination of their condition and degree of wear;
  • Determination of the technological efficiency of existing facilities (verification calculation);
  • Development of the modernization project;
  • Construction and installation works;
  • Launch of the upgraded WWTP into service.
Thus, during modernization, the existing treatment scheme should be initially estimated. As a rule, urban WWTPs have the following stages of wastewater treatment:
  • Preliminary treatment: removal of solid impurities (screens and sand traps);
  • Primary treatment: removal of suspended solids (primary settling tanks);
  • Secondary treatment: removal of dissolved pollutants (in 95 cases out of 100, treatment goes into activated sludge reactors (ASRs), which are accompanied by the facilities for separation of sludge and treated wastewater);
  • Tertiary treatment: additional removal of pollutants (optional stage, usually filters);
  • Disinfection: removal of pathogenic microorganisms (chlorination, UV radiation);
  • Sludge treatment.
The removal of contaminants (BOD, COD, N, P, etc.) mainly occurs within secondary treatment due to chemical and biological transformations. These processes carry on through the interaction of wastewater pollutants with the so-called activated sludge—colonies of biological microorganisms that decompose pollutants of various origins. Depending on the types of reactions, treatment can take place under anaerobic, anoxic, or aerobic conditions. A combination of them is also possible. Because of their purpose, secondary treatment facilities are the main stage of treatment at WWTPs with the longest hydraulic retention time (HRT) and, respectively, the largest volume and area. Accordingly, the highest capital costs are required for their installation (tanks, equipment, piping, etc.), and the operation of secondary treatment facilities implies high costs, majorly due to significant and energy-consuming demands for air supply [34,35].
As a rule, a plug-flow reactor is the typical reactor containing activated sludge, the entire circuit of which functions under aerobic conditions. The use of such a technological scheme was aimed at the removal of organic pollutants and suspended solids from the water to concentrations of both indicators at the level of 10–15 mg/L. In the terminology adopted in Russia and some neighboring countries, this was called complete biological purification. The nutrient removal was a concomitant process with an efficiency not exceeding 5–10% [36]. Figure 3 shows the conventional technological scheme of treatment, which was frequently applied in WWTPs before 2000. As a result, this scheme, or its close variations, serves as the basis for modernization.
At the initial stage of modernization, WWTP parameters (flow rate, pollutant concentrations, etc.) and facility dimensions are normally known. The current study requires an approximate determination of the volume of tanks and technological parameters of operation (air consumption, hydraulic retention time (HRT), dissolved oxygen (DO), concentration of mixed liquid suspended solids (MLSS), and some others). The typical values of technological parameters were used within the calculation [30]. The method of calculation is based on the theory of enzyme kinetics; however, only BOD values are used as the initial data, allowing the volume of a single aerobic zone to be obtained. The values of these parameters are presented in Table 3.
During modernization, the specified information can be obtained after the visual inspection and analysis of documentation, while these data may differ from the initial project. However, this does not affect the overall sequence of actions.
This study is analytical, and the focus is on the stage of development of the modernization project, that is, the calculated justification of the applied technological solutions. Since modernization is usually carried out under certain restrictions (WWTP area, capacity, and available resources), available equipment and capacities are used whenever possible. Currently, the requirements for pollution concentrations in discharged wastewater depend on the water body category (Table 4).
As can be seen, three groups of values reveal the potential sensitivity of the water body, where the FWB category corresponds to the highest level of requirements. A lower discharge pollutants value means that the use of advanced technological solutions is required to remove not only BOD and TSS but also nitrogen and phosphorus. However, removal of the main pollutants (organic pollutants, N, P) can still be carried out at the ASR, which in turn requires an improved treatment sequence. As a rule, organic pollutants and nitrogen compounds can be easily removed at this stage, while the phosphorus decomposition by biochemical processes is limited. In this case, the use of chemical phosphorus removal processes is required. One of the possible solutions in terms of phosphorus removal is the use of technology from the University of Cape Town (UCT). This technological sequence allows for the removal of organic pollutants and nutrients. For this purpose, the ASR is divided into anaerobic, anoxic, and aerobic zones, respectively. The scheme is shown in Figure 4. According to the previous scheme (Figure 3), the ASR has only a single aerobic zone, so the biochemical conversions of pollutants were limited due to conditions.
Besides the ASR, Figure 4 shows some other differences compared to Figure 3. In addition to the secondary treatment, UV disinfection was applied, and the technological scheme of sludge treatment was modified. For the modified scheme, three steps of calculation were carried out to meet the requirements of FWB, Cat. A, and Cat. B (Table 4). Within the first iteration of calculation, ASR operation parameters (MLSS, DO, see Table 3) remained unchanged. However, the calculation sequence was changed to the methodology described by Stepanov [39]. In previous studies, it was found that this method allowed results to be obtained, which showed good convergence to the well-known ASM method of calculation [28,35]. The calculation was performed three times, since three possible concentrations of pollutants in treated wastewater are allowed. The calculation results are presented in Figure 5.
Despite the decrease in flow, the required volumes increased for all three cases studied. This was due to an increase in the concentration of pollutants in the influent wastewater and a larger list of variable parameters that is required when calculating a more complicated treatment technology.
The results of the calculation showed that, with the accepted technological parameters, two additional batteries of ASR are required to reach effluent quality for discharge wastewater into FWB, and one battery is required if treated water is discharged to Cat. A/B. In the case of a limited area of WWTP, additional tank construction is not always affordable on an existing site. In this situation, alteration of the technological parameters (MLSS, DO, etc.) to intensify the treatment process may be considered. When using gravity sludge separation in secondary clarifiers, the MLSS value is not recommended to exceed 5 g/L. Thus, the calculation was repeated for MLSS values of 4 and 5 g/L, respectively (Figure 6). It is worth noting that the tank volumes for treatment and the requirements of Cat. A and Cat. B were almost similar. Due to this, the values were united as Cat. A/B.
When treatment to the Cat. A/B requirements is required, MLSS values increase up to 5 g/L in ASR, leading to a reduction in the demanded volume almost to the existing value (+7%). At the same time, if treated wastewater discharge into FWB is considered, the additional tank volume decreases from 100% to 30%. The intermediate results of the calculation, however, demonstrated that the transition to a new efficiency of wastewater treatment usually requires the extension of existing facilities, even if the overall hydraulic capacity of the facilities is reduced, that is, higher pollutant concentrations have a greater impact on the parameters of facilities than wastewater flow and a longer HRT (and larger tank volumes, respectively) is required to provide improved treatment efficiency after modernization. However, this is not always possible due to the limited area of some WWTPs. At the same time, performance intensification cannot always be implemented by only changing the technological parameters.

3.2. Application of Membrane Treatment

Increasing MLSS allows for reducing tank volumes, since the possible load and oxidizing ability of the facility also increase. However, the limiting factor is the efficiency of the secondary sedimentation. When the MLSS is above 5 g/L, increased output of suspended particles from the secondary clarifier may be observed, which will result in the excessive concentration of suspended solids in the treated water. In this case, the installation of tertiary treatment facilities may be required. At the same time, the increased output of suspended solids may simultaneously lead to the output of other contaminants, which will complicate the work of tertiary treatment. The practice of WWTP operation shows that the output of suspended solids can also occur at MLSS values in the ASR in the range of 4–5 g/L, which does not exceed the recommended values. This, in turn, can lead to unstable wastewater treatment quality. Thus, at MLSS values near the maximum recommended values, the controllability of wastewater treatment plants may decrease.
One of the solutions with a growing range of applications is the application of membrane separation of water and sludge. Membranes act as a physical barrier that detains flakes of activated sludge and pollution but allows water to pass through. Membrane reactors (MRs) are the most common solution in municipal WWTPs when membrane application is required. The combination of MR and ASR is also called a membrane bioreactor (MBR). One of the major MBR advantages is increased MLSS values: numerous studies have shown that the optimal efficiency of membrane sludge separation can be achieved with MLSS in the range of 7 to 12 g/L, that is, the MLSS is 1.4–4 times higher than in a conventional ASR. However, the MBR implementation is also associated with certain limitations:
  • Despite the overall reduction in the cost of membranes, the installation of membranes still requires high capital costs;
  • An increased MLSS value in MBR leads to physical and chemical fouling of membranes, which complicates and increases the cost of operation due to regular washing and cleaning as well as constant aeration of membrane modules;
  • The service life of the membranes is limited to 7–10 years, so during operation of the WWTP, the membranes can be completely renewed several times.
Based on the above information, the next step of calculation of secondary treatment facilities can be made, provided that an MR is used for sludge separation. The calculation will continue with MLSS = 7 g/L as the lowest reasonable value for MBR application. The calculation results are shown in the table and in Figure 7.
If the MR is implemented, the required tank volume for the Cat. A/B requirement drops to 3000 m3, which is 500 m3 less than the existing volume of the ASR. The free volume can be used for membrane modules (cassettes) installation.
However, for the FWB requirements, the volume is still slightly higher than the existing tank (+10%). The further increase in MLSS value to 8 g/L compensates this gap, provided that the calculated ASR volume is now less than the existing tank. In addition, there is also a free volume of the reactor, which can be used for the placement of membranes.
According to the results above and the specifics of the modernization of secondary treatment facilities, the following key factors of influence can be identified:
  • The concentration of pollutants in the influent wastewater;
  • Treatment quality requirements (concentrations of pollutants in discharged wastewater);
  • Availability of free space within the WWTP area to locate additional tanks;
  • Cost comparison of the various technological solutions.
The first two factors influence the choice of technological solutions. As part of this study, the concentrations of pollutants in the influent wastewater were obtained by calculation. However, in most cases, the calculated values may exceed the concentrations of pollutants actually entering the treatment facilities. This means that this study considers the most unfavorable modernization scenario, in which significant costs may be required. The same applies to the requirements for treated water. As can be seen, when discharged into Cat. A/B, the required volumes may be 20–25% less than for FWB, which actually means a significant difference in capital and operating costs.
The third and fourth factors will be considered, taking into account the influence of wastewater composition on them. The potential costs of modernization will be determined for the most critical scenario, when it is necessary to purify wastewater to the requirements of a reservoir of fishery importance. To maintain an MLSS value of 3 g/L, two additional batteries of the ASR should be constructed. With an increase in the MLSS to 4.5 g/L (+1.5 g/L to the initial value), one additional battery is needed; however, in this case, an additional secondary clarifier will be required. The existing volume could remain only by increasing the MLSS to 8 g/L (+5 g/L to the initial value) and, as a result, the use of membrane sludge separation.

3.3. Cost Analysis

After technological calculations, a cost assessment for modernization was conducted. There are several previous cost identification studies, but it is necessary to clarify costs by taking into account relevant factors [40,41].
Since the current study is analytical, the calculations may contain some degree of approximation. Cases that potentially require the highest costs will be estimated. The first calculation case (Case 1) demands additional construction of the largest additional tank volume, that is, ASR at MLSS = 3 g/L and wastewater discharge into FWB. In the second calculation case (Case 2), high costs appear due to membrane implementation (ASR + MR at MLSS = 8 g/L and discharge into FWB).
Before modernization, the volume of the ASR was about 3500 m3 (two batteries; two trains; train dimensions (length, width, and depth, respectively) were 48 × 4.5 × 4 m). During the calculation for Case 1, it was estimated that the new required volume of the ASR should be about 6500 m3. Then, the most rational solution seems to be to build two additional batteries of similar dimensions to ensure a uniform flow distribution to both tanks. The specific cost of construction (SCTC) is EUR 307 per 1 m3 of tank. Then, the cost of constructing the tank can be calculated (Equation (5)) as follows:
CTC = WT × SCTC = 3500 × 307 = EUR 1,074,500
In Case 2, no construction of an additional tank is required.
During modernization, existing tanks may require certain repairs, if wear has occurred. In addition, regardless of wear and tear, construction works will be required during technological improvement of the ASR. The repair costs will be assumed as EUR 80 per 1 m3 of the tank. These costs (Equation (6)) will arise for both cases under consideration and will amount to the following:
CRep = WT × SCRep = 3500 × 80 = 280,000 EUR
As was mentioned, Case 2 involves membrane costs, which are quite significant. According to Table 3, the calculated membrane area is 28,000 m2 (Amembr). The membrane costs can be defined according to the size and number of membrane units.
For the calculation, a membrane unit with a length, width, and height of 1.52 × 3.42 × 2.8 m and an area (Aunit) of installed membranes of 2400 m2 was used.
A number of units are required (Equation (7)):
n m . u n i t = A m e m b r A u n i t = 28,000 2400 = 11.66 12
The accepted number of 12 membrane units includes the area of 28,800 m2 and a total volume of 175 m3. The membrane specific cost is approximately EUR 40/m2, which results in an overall cost of EUR 1,152,000.
In cases of modernization, various equipment has to be replaced. In this calculation, it is assumed that the aeration system, as well as the air supply equipment, requires complete replacement. For Case 1, the required amount of air is 3800 m3/h. Air supply in such quantity can be provided, for example, by installing two (Nair) compressors (Lutos DT 70/202) with a capacity of 2000 m3/h and an engine with a power of 30 kW (Pair). Moreover, an additional compressor is required to provide the necessary power reserve. With the cost of one compressor being EUR 13,800, the total purchase costs will be EUR 41,400.
For a complete replacement of the aeration system, aerators with a capacity of 4 m3/h will be applied. This means that installation of 976 aeration units (Figure 8a) will be required in the ASR. The cost of one aerator, including related materials (pipelines, fittings), is EUR 55. Then, the cost of all the aerators will be EUR 53,350.
For Case 2, the total air supply implies the air supplied to the bioreactor (1800 m3/h) and the air required for aeration of the membrane modules. The specific air consumption for membrane aeration is 0.2 m3/m2h, which means overall membrane aeration of 5760 m3/h. Then, the total air consumption will be 7560 m3/h.
Despite the similar task, a separate air supply for the ASR and MR by two groups of compressors is a preferable solution, which provides independent air control for both processes. For aeration in an ASR, two (Nair) compressors (Lutos DT 65/102) may be installed with a capacity of 1365 m3/h and an engine with a power of 23.5 kW (Pair) each. These two compressors will provide the air supply demanded and an additional reserve capacity. The cost of one unit is EUR 9300, and for two units it is EUR 18,600, respectively. For membrane aeration, three compressors (Lutos DT 70/302) with a capacity of 2770 m3/h and an engine power of 37 kW each can be used to cover the necessary supply and potential reserve. The cost is EUR 15,200 for one unit and EUR 45,600 for three units, correspondingly. The overall purchase costs for five compressors will be EUR 64,200.
In Case 2, 452 aeration units (of a similar type to Case 1) will be required for ASR (Figure 8b) with an overall cost of EUR 24,750.
Mixing devices are required to maintain the activated sludge in a suspended state in the anaerobic and anoxic zones. For calculation, we accept the same type of S-mix agitators with an engine power of 2 kW.
Case 1 provides a total of four anaerobic zones and four anoxic zones. Then, one mixer (four in total) must be installed in each of the four anaerobic zones and two mixers (eight in total) in each anoxic zone. For Case 2, one mixer is installed in each aerobic zone (two in total) and each anoxic zone (two in total). The shorter length of the zone explains there being one mixer instead of two in the anoxic zone. Thus, at the cost of one mixer being EUR 12,900, the mixer costs for Cases 1 and 2 will be EUR 154,800 and EUR 51,600, respectively.
After capital costs, the operating costs (OPEX) of secondary treatment facilities will be considered. For Case 1, OPEX will be combined with the electricity costs for aeration in the ASR and the operation of the mixers.
With a cost of 1 kWh of energy at the level of EUR 0.29 (SCkWh), the annual energy costs (Equation (8) for aeration will be as follows:
C a i r 1 = 365 · 24 · P a i r · N a i r · S C k W h = 365 · 24 · 30 · 2 · 0.29 = 152,425   EUR year
The annual energy consumption (Equation (9) for the operation of the mixers will be as follows:
C m i x 1 = 365 · 24 · P m i x · N m i x · S C k W h = 365 · 24 · 2 · 12 · 0.29 = 60,970   EUR year
For Case 2, the OPEX will consist of the cost of electricity for aeration in the ASR and MR, the operation of mixers, and costs for reagents for the chemical cleaning of membranes (chemical costs).
The annual electricity costs for aeration in ASR (Equation (10) will be as follows:
C a i r 2 = 365 · 24 · P a i r · N a i r · S C k W h = 365 · 24 · 23.5 · 2 · 0.29 = 119,400   EUR year
Then, the annual electricity costs for aeration in a membrane reactor (Equation (11) will be the following:
C a i r . M R = 365 · 24 · P a i r · N a i r · S C k W h = 365 · 24 · 37 · 2 · 0.29 = 188,000   EUR year
The annual cost of electricity consumption for mixers operation will be (Equation (12) the following:
C m i x 2 = 365 · 24 · P m i x · N m i x · S C k W h = 365 · 24 · 2 · 6 · 0.29 = 30,385   EUR year
Chemical costs can be estimated under the following conditions: sodium hypochlorite (NaClO) is commonly used as a chemical reagent for cleaning MBR systems, since membrane contamination is mainly caused by organic substances.
Within long-term operation, the pollution caused by inorganic substances gradually increases, so acid membrane cleaning is demanded. Typically, two types of chemical cleaning (NaClO and/or citric acid) are used to maintain the MBR operation:
(1)
Maintenance chemical cleaning (NaClO);
(2)
Recovery chemical cleaning (NaClO and citric acid).
Typically, system performance is maintained through a combination of maintenance flushing (weekly) and recovery flushing (every 3 months).
The cost calculation will be based on the following values of chemical demand.
For maintenance cleaning, 2 L (0.002 m3) of NaClO (VNaClO) with an active chlorine concentration (CCl.MC) of 500 mg/L (0.5 g/L or 0.5 kg/m3) is required per 1 m2 of the membrane area. For recovery cleaning, 2 L (0.002 m3) of NaClO with an active chlorine concentration (CCl.RC) of 1000 mg/L (1 g/L or 1 kg/m3) and 2 L (VCA) of 1% (CCA = 10 g/L= 10 kg/m3) citric acid solution are required per 1 m2 of the membrane area. The above-mentioned values may have slight differences depending on the membrane manufacturer; however, they all lay within a close range of values [41,42].
The annual (52 maintenance cleanings (NMC) and 4 recovery cleanings (NRC)) mass of active chlorine (MCl) demanded for cleaning will be (Equation (13) the following:
M C l = V N a C l O · A m · ( C C l . M C · N M C + C C l . R C · N R C )                   M C l = 0.002 · 28,800 · 0.5 · 52 + 1 · 4 = 1728   kg year
The cost of 19% NaClO solution is EUR 0.5/kg, and then the cost of purchasing the required amount of NaClO will be EUR 4548/year.
The annual (four recovery cleanings (NRC)) mass of citric acid (MCA) demanded for cleaning will be (Equation (14) the following:
M C A = V C A · A m · C C A · N R C     M C A = 0.002 · 28,800 · 10 · 4 = 2304   kg year
With a citric acid cost of EUR 1.3/kg, the annual cost will be EUR 2973/year.
The calculated costs are summarized in Table 5.
Table 5 shows that the capital costs for the cases studied have similar values. The purchase of membranes, a major cost component in Case 2, is compensated for by zero volume of additional tank construction and reduced costs for aeration units and mixers.
However, service life is limited to 7–10 years; thus, throughout the WWTP life cycle, the cost of purchasing membranes will require repetition [43]. From this point of view, it will be more correct to distribute membrane costs through their life cycle and to consider them as operational costs. Considering a lifetime of 10 years, specific membrane costs related to the WWTP daily capacity will be (Equation (15) as follows:
S C m = C m L T m · Q m i d . d · 365 = 1,152,000 10 · 7407 · 365 = 0.043   EUR m 3
The obtained value (Equation (15) may be considered close to the research conducted by Echevarria et al. [44], which showed a specific cost of EUR 0.036/m3. The difference in values can be explained by an increase in the cost of purchasing membrane modules.
Despite the close values of CAPEX for both cases, OPEX in Case 2 is 1.6 times higher in comparison to Case 1. Majorly, this is due to the significant energy consumption for membrane aeration, which is almost 90% of the overall operational costs for Case 1. Since secondary treatment facilities are the main energy consumer within the entire WWTP, they also present a major part of the overall WWTP costs. However, such significant costs cannot be avoided; otherwise, MBR operation will rapidly halt due to clogging of membrane modules. Figure 9 shows the OPEX components related to the daily capacity of WWTPs (7407 m3/d).
Figure 9 demonstrates that, for Case 1 and 2, the specific OPEX values are about EUR 0.079/(m3/d) and EUR 0.127/(m3/d), respectively. However, if membrane costs are included in OPEX, they will contribute approximately 1/3 to the previously calculated OPEX (or 25% of the combined OPEX). Accordingly, the OPEX ratio between Case 2 and Case 1 grows from 1.6 to 2.16. It is worth noting that membrane costs have a fixed value, which is distributed throughout their lifetime of 10 years. Energy costs, however, may have different trends throughout this period. For instance, average electricity prices in Europe grew from EUR 0.21 to 0.29/kWh (+38%) in the interval between 2020 and 2023. This means that within the overall OPEX value, a share of single components may change within operation. For instance, [44], which was published in 2019, demonstrated energy consumption of EUR 0.065/(m3/d), which corresponds to the growth of electricity prices.

4. Conclusions

Based on the results of the calculations carried out, the following conclusions can be drawn:
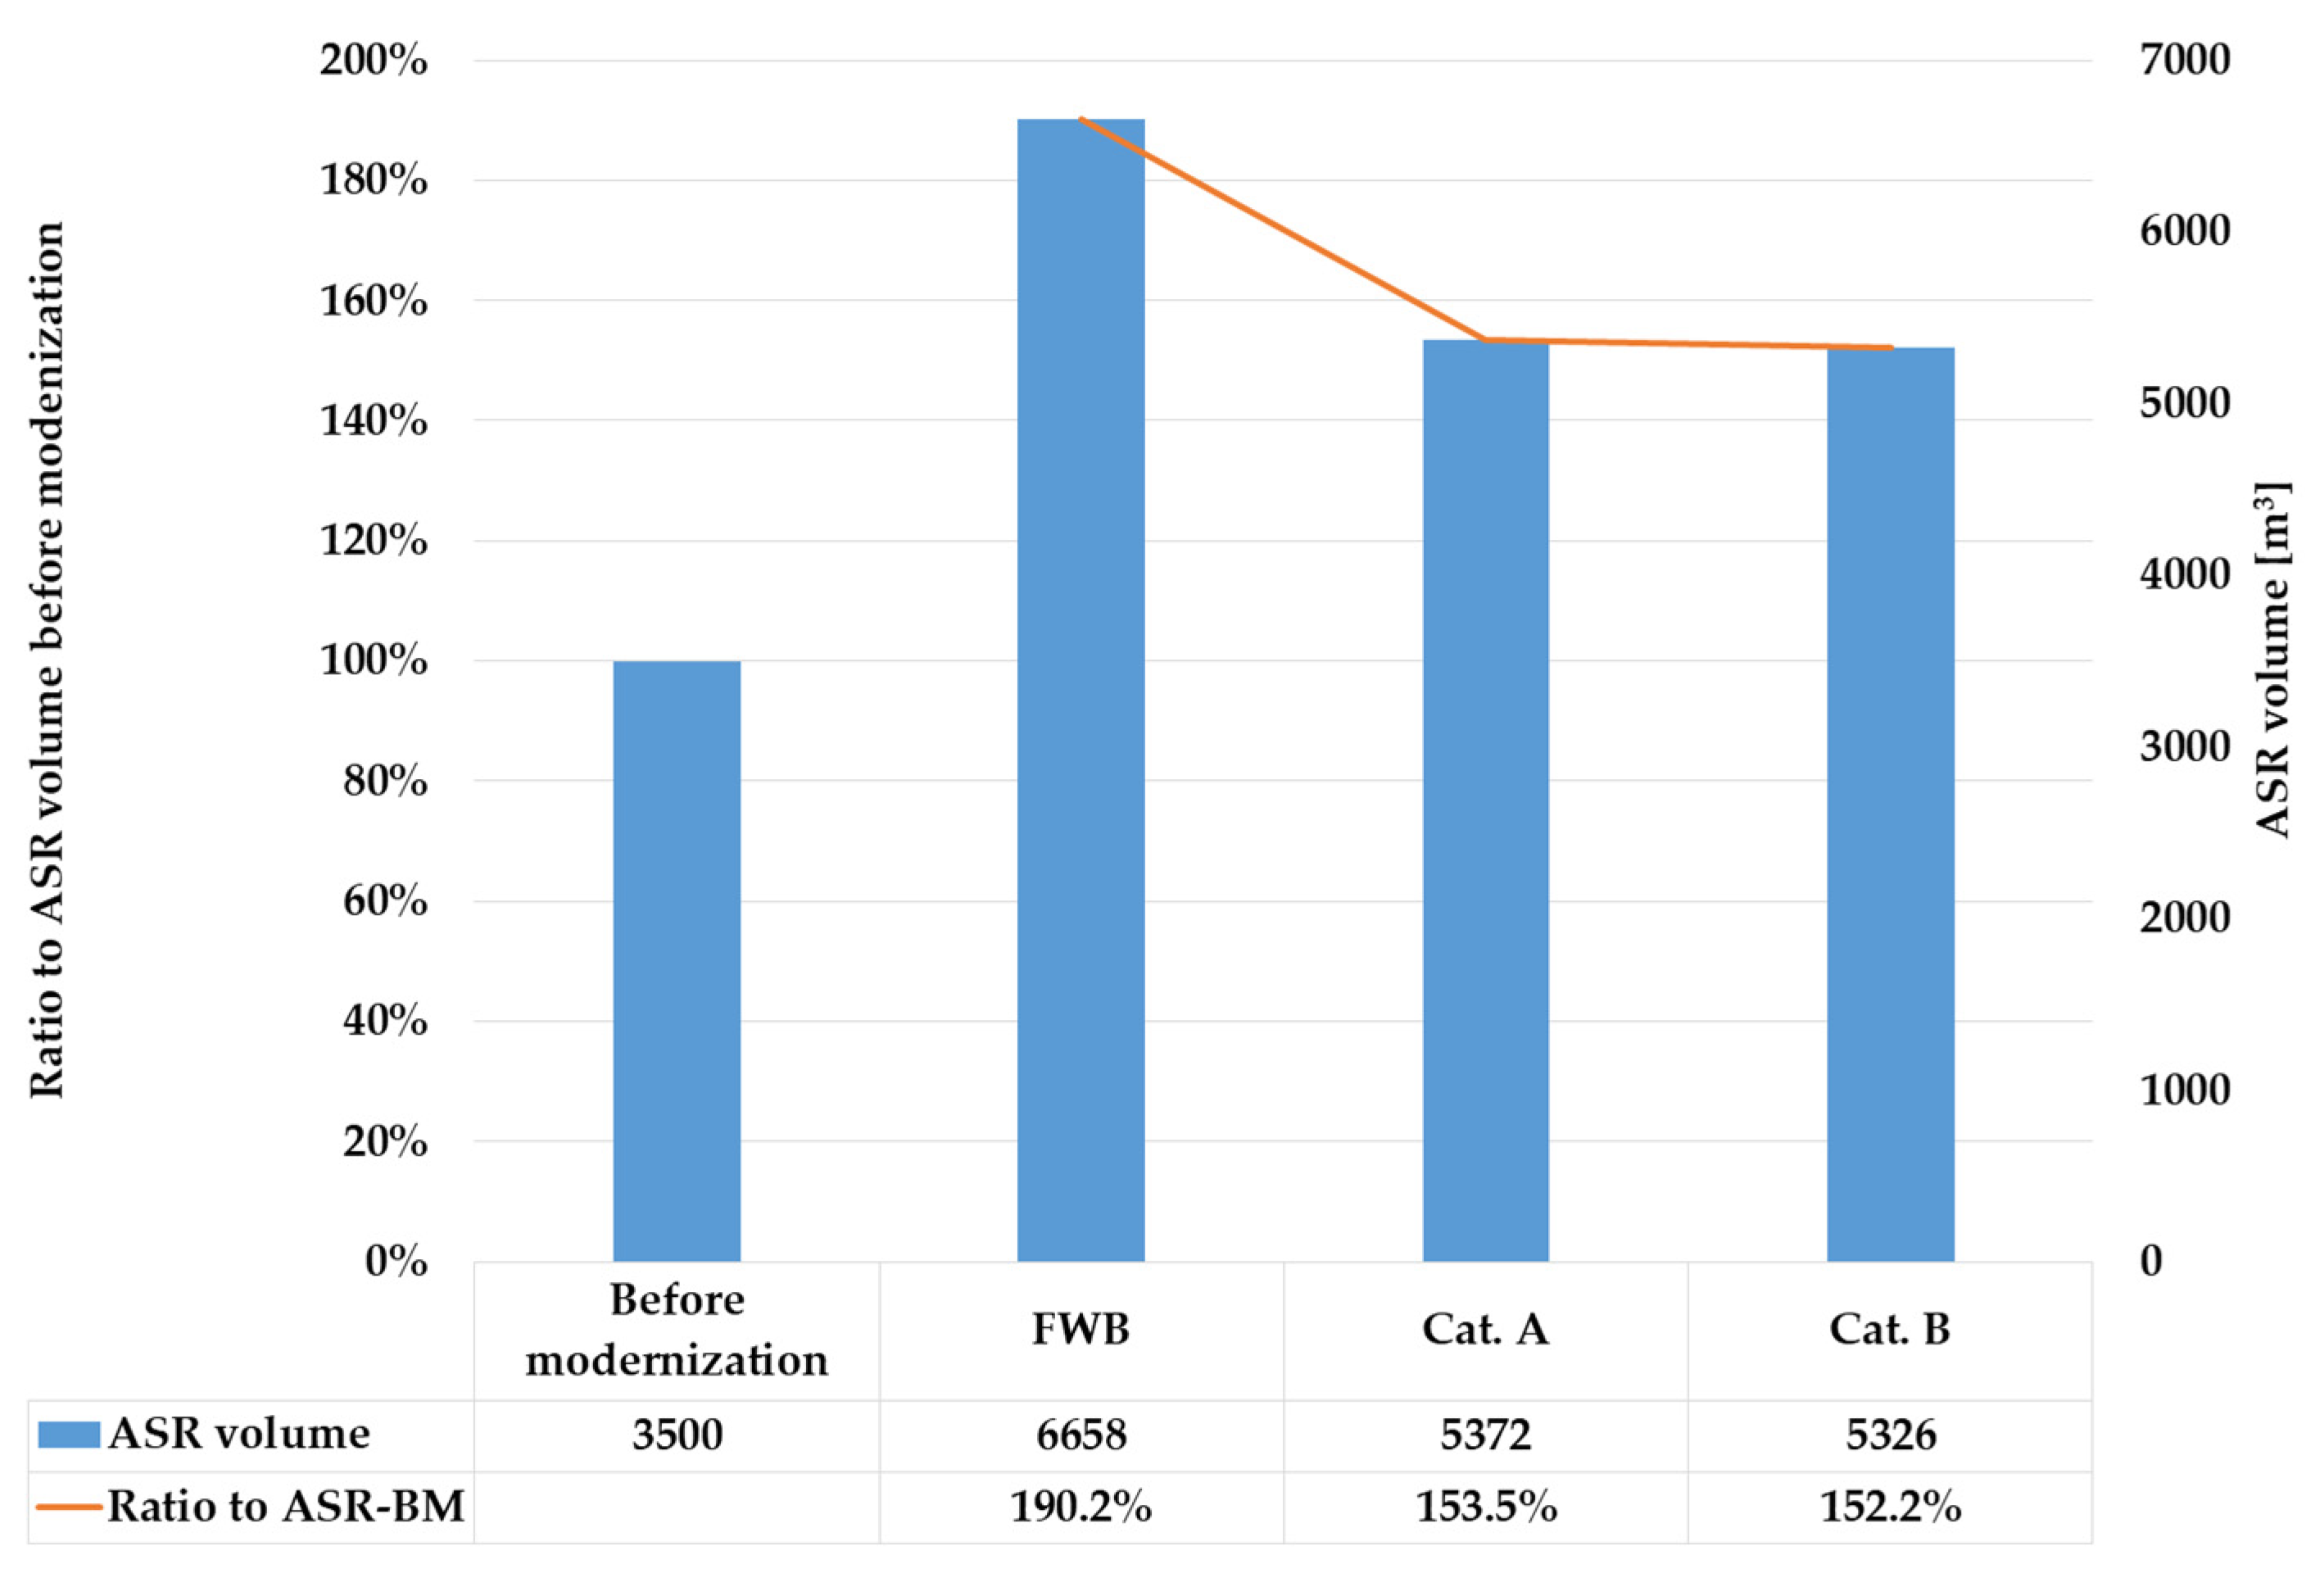
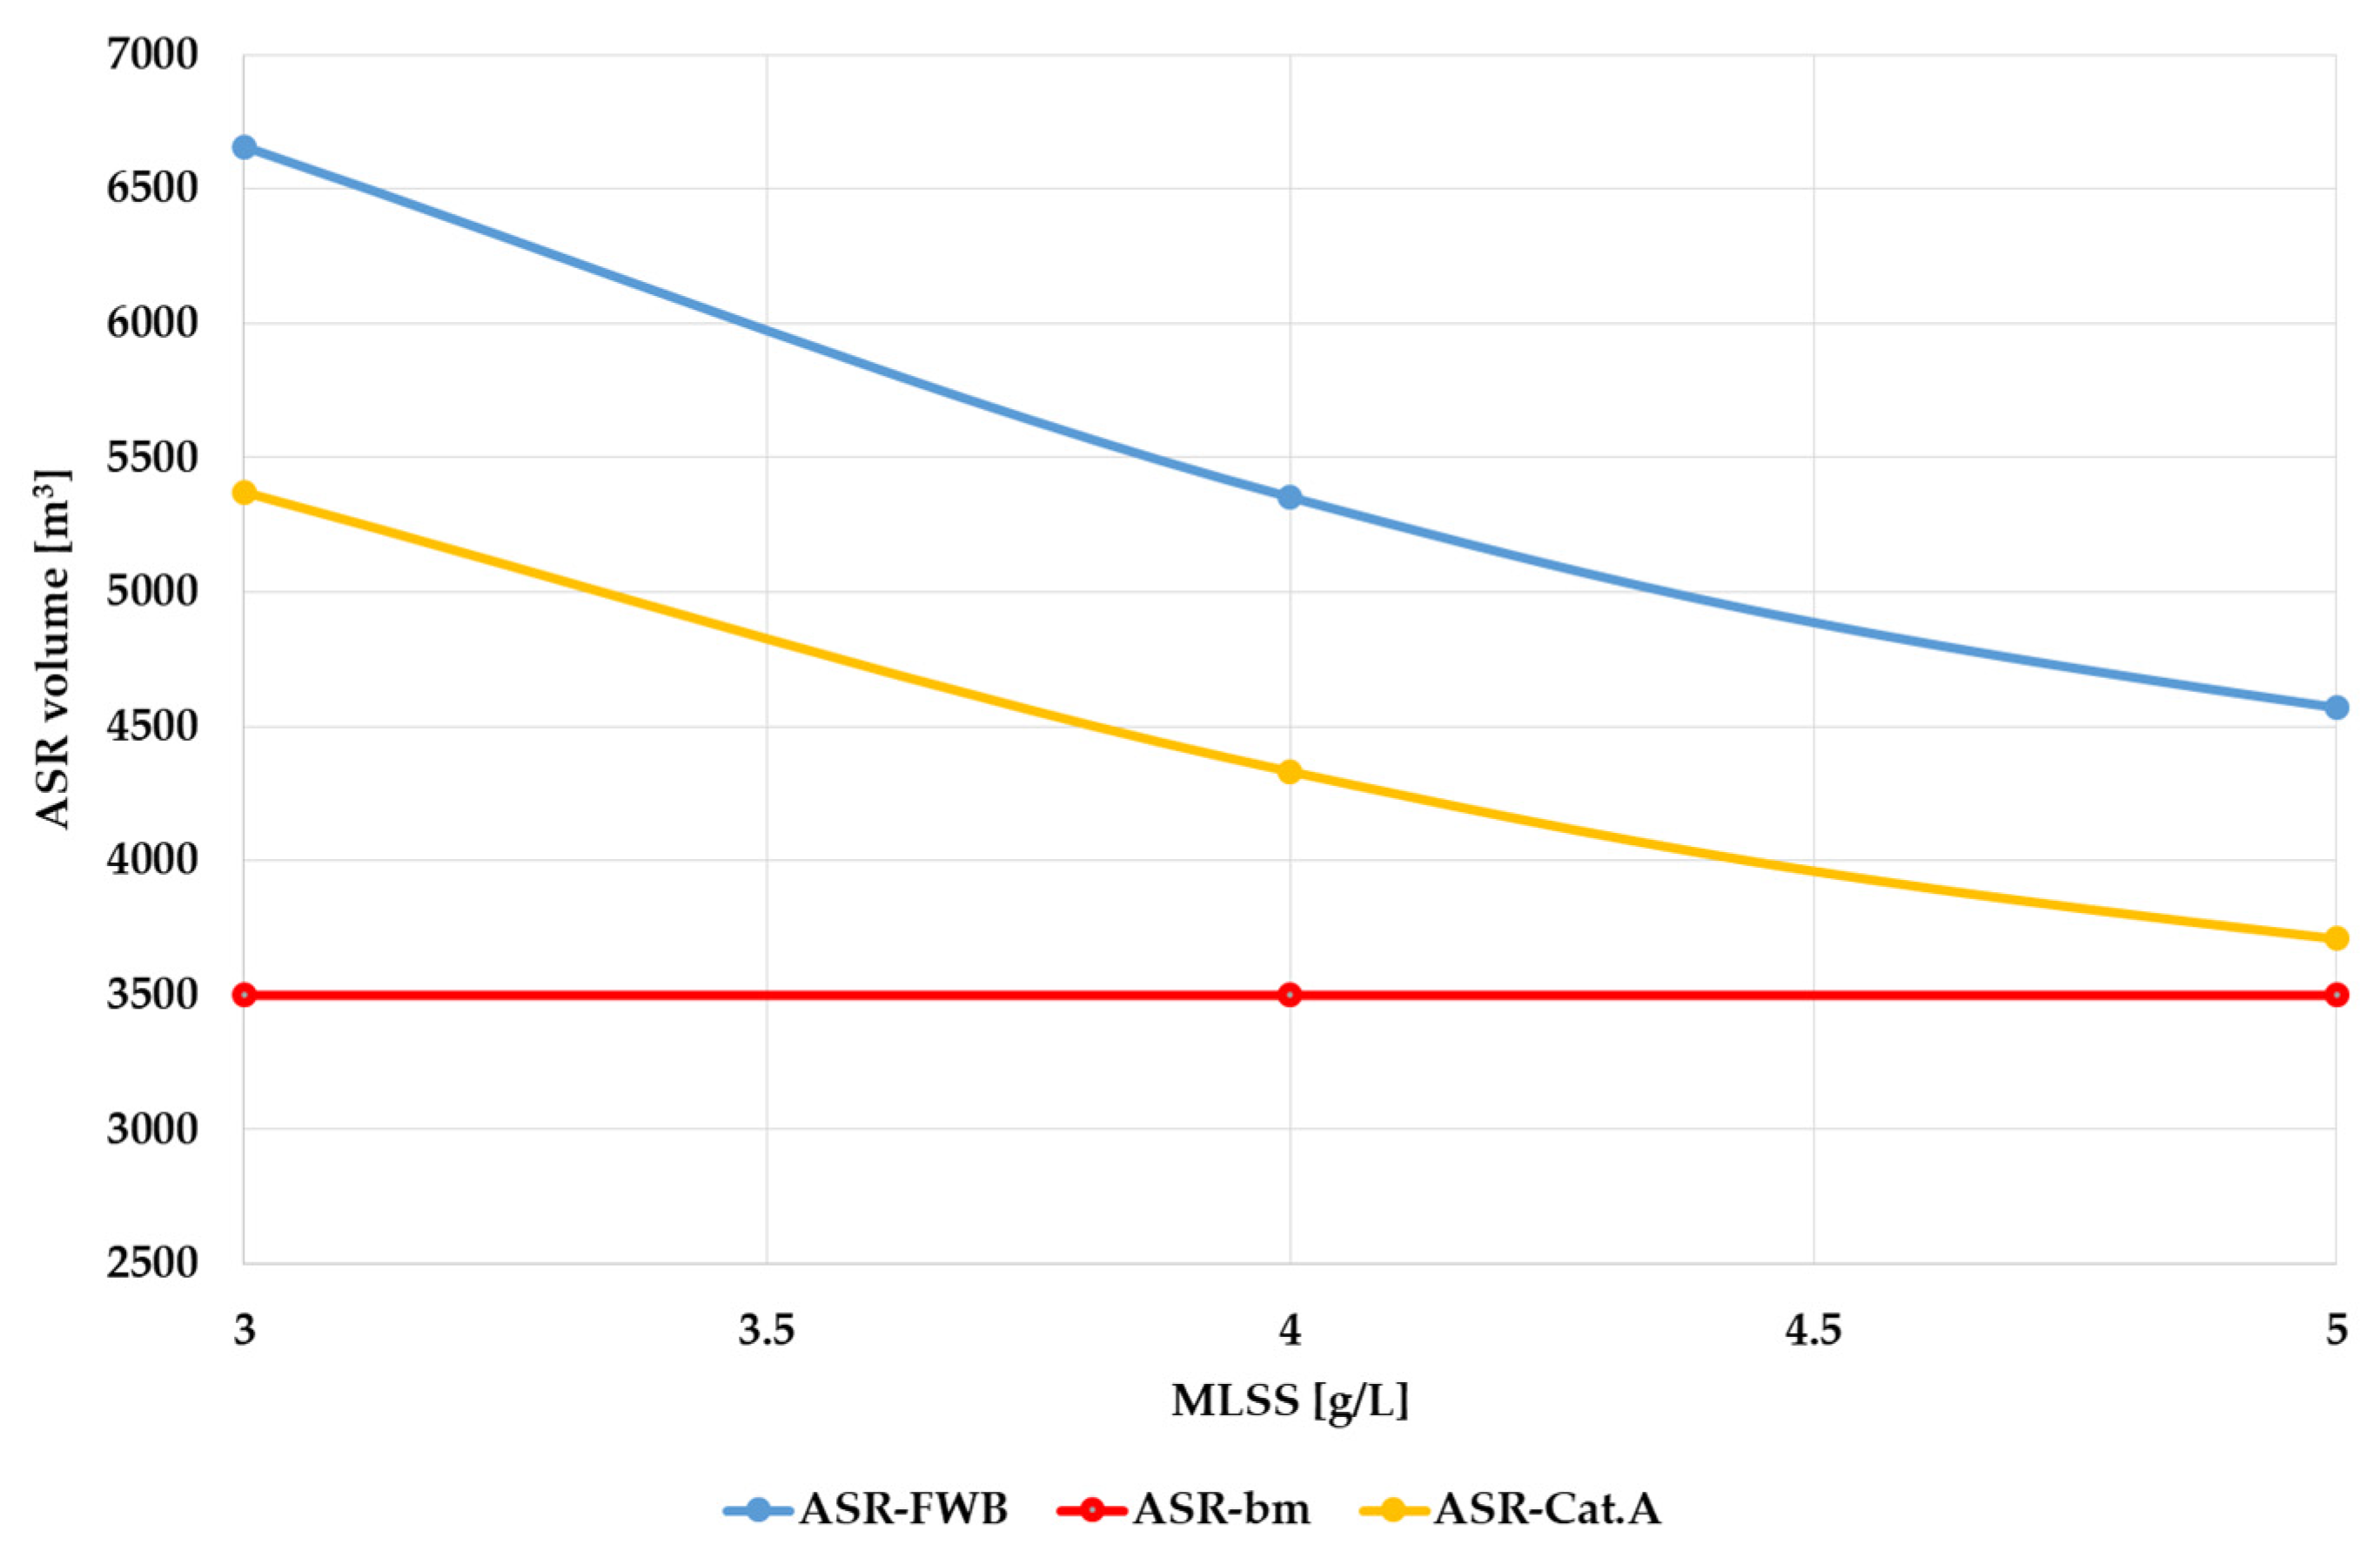
  • The research presented the technical evaluation and cost analysis of WWTP modernization of a typical settlement in the Russian Federation. If the treatment efficiency for the needs of fishery water bodies is considered, the volume of an activated sludge reactor can be reduced twice due to the application of membrane sludge separation in comparison to conventional gravity sludge separation.
  • As long as the extra volume of the tank is not required, the capital costs for equipment (mixers, aeration units) are also reduced proportionally.
  • Within the case study, the cost for additional construction was comparable to the cost of membrane purchase, which gave an overall cost parity for the two estimated cases.
  • Despite a double reduction in air supply for ASR aeration (1800 m3/h vs. 3800 m3/h), when a membrane is applied, a significant air demand is required for membrane aeration to mitigate fouling. The overall OPEX in cases of membrane application grew by 60% (EUR 0.127/(m3/d) vs. EUR 0.078/(m3/d)).
  • If membrane application is considered as an operation cost (due to their relatively short lifetime), an extra 33% is added to the overall OPEX value up to EUR 0.17/(m3/d).
Despite the fact that this research is primarily theoretical and based on statistical data, the results obtained are close to the data already known. However, further research is required for the real WWTP parameters (flow rate, wastewater composition, tanks, equipment, etc.). Currently, MBRs at municipal wastewater treatment plants are uncommon in Russia; this is mainly due to their high cost, but detailed and reasonable calculations are often not available. However, as local membrane manufacturers appear (and their prices decrease in the future), and taking into account the relatively low cost of electricity, the scope of MBR application can be expanded. At the same time, the results obtained within the current study can serve as initial data for the analysis of practical applications. Within further research, special attention should be paid to the operation of membranes, which may have a significant influence on membranes’ lifetime.

Author Contributions

Conceptualization, N.M. and I.G.; methodology, N.M. and I.G.; software, N.M. and I.G.; validation, N.M. and I.G.; formal analysis, N.M. and I.G.; investigation, N.M. and I.G.; resources, N.M. and I.G.; data curation, N.M. and I.G.; writing—original draft preparation, I.G.; writing—review and editing, N.M.; visualization, N.M. and I.G.; supervision, N.M. and I.G.; project administration, N.M.; funding acquisition, N.M. All authors have read and agreed to the published version of the manuscript.

Funding

This research was funded by the National Research Moscow State University of Civil Engineering (grant for fundamental and applied scientific research, project No. 16-392/130).

Institutional Review Board Statement

Not applicable.

Informed Consent Statement

Not applicable.

Data Availability Statement

Data are contained within the article.

Conflicts of Interest

The author declares no conflicts of interest.

References

  1. Poupyrev, E.I. Solution of problems of energy efficient water treatment facilities design. Constr. Reconstr. 2015, 4, 173–182. [Google Scholar]
  2. Ghimire, U.; Sarpong, G.; Gude, V.G. Transitioning Wastewater Treatment Plants toward Circular Economy and Energy Sustainability. ACS Omega 2021, 6, 11794–11803. [Google Scholar] [CrossRef]
  3. Meng, X.; Huang, Z.; Ge, G. Upgrade and reconstruction of biological processes in municipal wastewater treatment plants. Desalination Water Treat. 2024, 317, 100299. [Google Scholar] [CrossRef]
  4. Gogina, E.; Gulshin, I. Characteristics of low-oxygen oxidation ditch with improved nitrogen removal. Water 2021, 13, 3603. [Google Scholar] [CrossRef]
  5. Wang, Y.; Yuan, Y.; Xue, H.; Yu, Y.; Shi, Y.; Wen, H.; Xu, M. Analysis on Operation and Water Quality Characteristics of Centralized Wastewater Treatment Plants of Industrial Parks in Yellow River Basin, China. Water 2024, 16, 806. [Google Scholar] [CrossRef]
  6. Guryeva, A.A. Wastewater treatment plants and requirements for their safety. Bull. State Expert. 2022, 3, 56–61. [Google Scholar]
  7. Ponomarenko, A.M.; Vlasov, D.Y.; Belov, N.A.; Ganin, A.V.; Zinchenko, A.V. Innovative directions of development of lyu-bertsy wastewater treatment plants. Water Supply Sanit. Tech. 2021, 1, 36–48. [Google Scholar] [CrossRef]
  8. Phillips, H.M.; Sahlstedt, K.E.; Frank, K.; Bratby, J.; Brennan, W.; Rogowski, S.; Pier, D.; Anderson, W.; Mulas, M.; Copp, J.B.; et al. Wastewater treatment modelling in practice: A collaborative discussion of the state of the art. Water Sci. Technol. 2009, 59, 695–704. [Google Scholar] [CrossRef]
  9. Ezzahraoui, F.-Z.; Hamza, R. Optimized process intensification through dynamic performance simulation and evaluation of treatment alternatives for a wastewater treatment plant in Toronto. Results Eng. 2024, 22, 102047. [Google Scholar] [CrossRef]
  10. Pires, A.; Morato, J.; Peixoto, H.; Botero, V.; Zuluaga, L.; Figueroa, A. Sustainability Assessment of Indicators for Integrated Water Resources Management. Sci. Total Environ. 2017, 578, 139–147. [Google Scholar] [CrossRef]
  11. Chonova, T.; Keck, F.; Labanowski, J.; Montuelle, B.; Rimet, F.; Bouchez, A. Separate Treatment of Hospital and Urban Wastewaters: A Real Scale Comparison of Effluents and Their Effect on Microbial Communities. Sci. Total Environ. 2016, 542, 965–975. [Google Scholar] [CrossRef]
  12. Kharkina, O.V. The main technological errors in the reconstruction of treatment facilities. Ecol. Ind. 2023, 7, 96–105. [Google Scholar] [CrossRef]
  13. Egorova, Y.A.; Levin, D.I.; Lyushina, L.F.; Petropavlovskiy, S.A.; Bazhenov, V.I.; Danilovich, D.A.; Noskova, I.A. Complex reconstruction of urban sewage treatment facilities in Samara. Water Supply Sanit. Tech. 2016, 8, 80–88. [Google Scholar]
  14. Rai, H.S. Wastewater treatment optimization—Culling the devil in the details. Lect. Notes Civ. Eng. 2019, 21, 22–34. [Google Scholar] [CrossRef]
  15. Gikas, P. Towards Energy Positive Wastewater Treatment Plants. J. Environ. Manag. 2017, 203, 621–629. [Google Scholar] [CrossRef]
  16. Bolorinos, J.; Mauter, M.S.; Rajagopal, R. Integrated Energy Flexibility Management at Wastewater Treatment Facilities. Environ. Sci. Technol. 2023, 57, 18362–18371. [Google Scholar] [CrossRef]
  17. Yu, Y.; Zou, Z.; Wang, S. Statistical Regression Modeling for Energy Consumption in Wastewater Treatment. J. Environ. Sci. 2019, 75, 201–208. [Google Scholar] [CrossRef]
  18. Li, X.; Bao, D.; Zhang, Y.; Xu, W.; Zhang, C.; Yang, H.; Ru, Q.; Wang, Y.-F.; Ma, H.; Zhu, E.; et al. Development and Application of Membrane Aerated Biofilm Reactor (MABR)—A Review. Water 2023, 15, 436. [Google Scholar] [CrossRef]
  19. Atkinson, S. ZeeLung technology shows its ability to quickly, easily and cost-effectively upgrade existing WWTPs. Membr. Tech. 2020, 11, 5. [Google Scholar] [CrossRef]
  20. Kevbrina, M.V.; Gavrilin, A.M.; Pronin, A.A. Introduction of Modern Technologies in the Construction and Reconstruction of Treatment Facilities of Mosvodokanal JSC. Water Supply Sanit. Tech. 2021, 6, 36–45. [Google Scholar] [CrossRef]
  21. Bunse, P.; Orschler, L.; Agrawal, S.; Lackner, S. Membrane aerated biofilm reactors for mainstream partial nitritation/anammox: Experiences using real municipal wastewater. Water Res. X 2020, 9, 100066. [Google Scholar] [CrossRef]
  22. Makisha, N. Advanced Research on Polymer Floating Carrier Application in Activated Sludge Reactors. Polymers 2022, 14, 2604. [Google Scholar] [CrossRef] [PubMed]
  23. Siriweera, W.B.S.; Lee, Y.-J.; Masumi, K.; Visvanathan, C. Organic matter and total nitrogen removal from wastewater using a pilot-scale membrane-aerated biofilm reactor. Bioresour. Technol. Rep. 2021, 15, 100817. [Google Scholar] [CrossRef]
  24. Kuzmin, V.A.; Lominoga, O.A.; Koloskova, E.G. Introduction of membrane technologies at the WWTP of the village Molodezhnoe. Water Supply Sanit. Tech. 2021, 3, 26–32. [Google Scholar] [CrossRef]
  25. Federal State Statistics Service. Availability of Wastewater Treatment Plants and Installed Production Capacity of Wastewater Treatment Plants for 2021. Available online: https://rosstat.gov.ru/storage/mediabank/Kom_knlz_21.xls (accessed on 30 July 2024).
  26. Streltsov, S.A.; Belov, N.A.; Zaborovsky, S.V.; Kazakova, E.A. Reconstruction of Small Treatment Facilities of Tinao with the Use of Modern Technologies. Water Supply Sanit. Tech. 2021, 6, 43–48. [Google Scholar]
  27. Yang, J.; Chen, B. Energy efficiency evaluation of wastewater treatment plants (WWTPs) based on data envelopment analysis. Appl. Energ. 2021, 289, 116680. [Google Scholar] [CrossRef]
  28. Makisha, N. Assessment of Wastewater Treatment Plant Upgrading with MBR Implementation. Membranes 2023, 13, 746. [Google Scholar] [CrossRef]
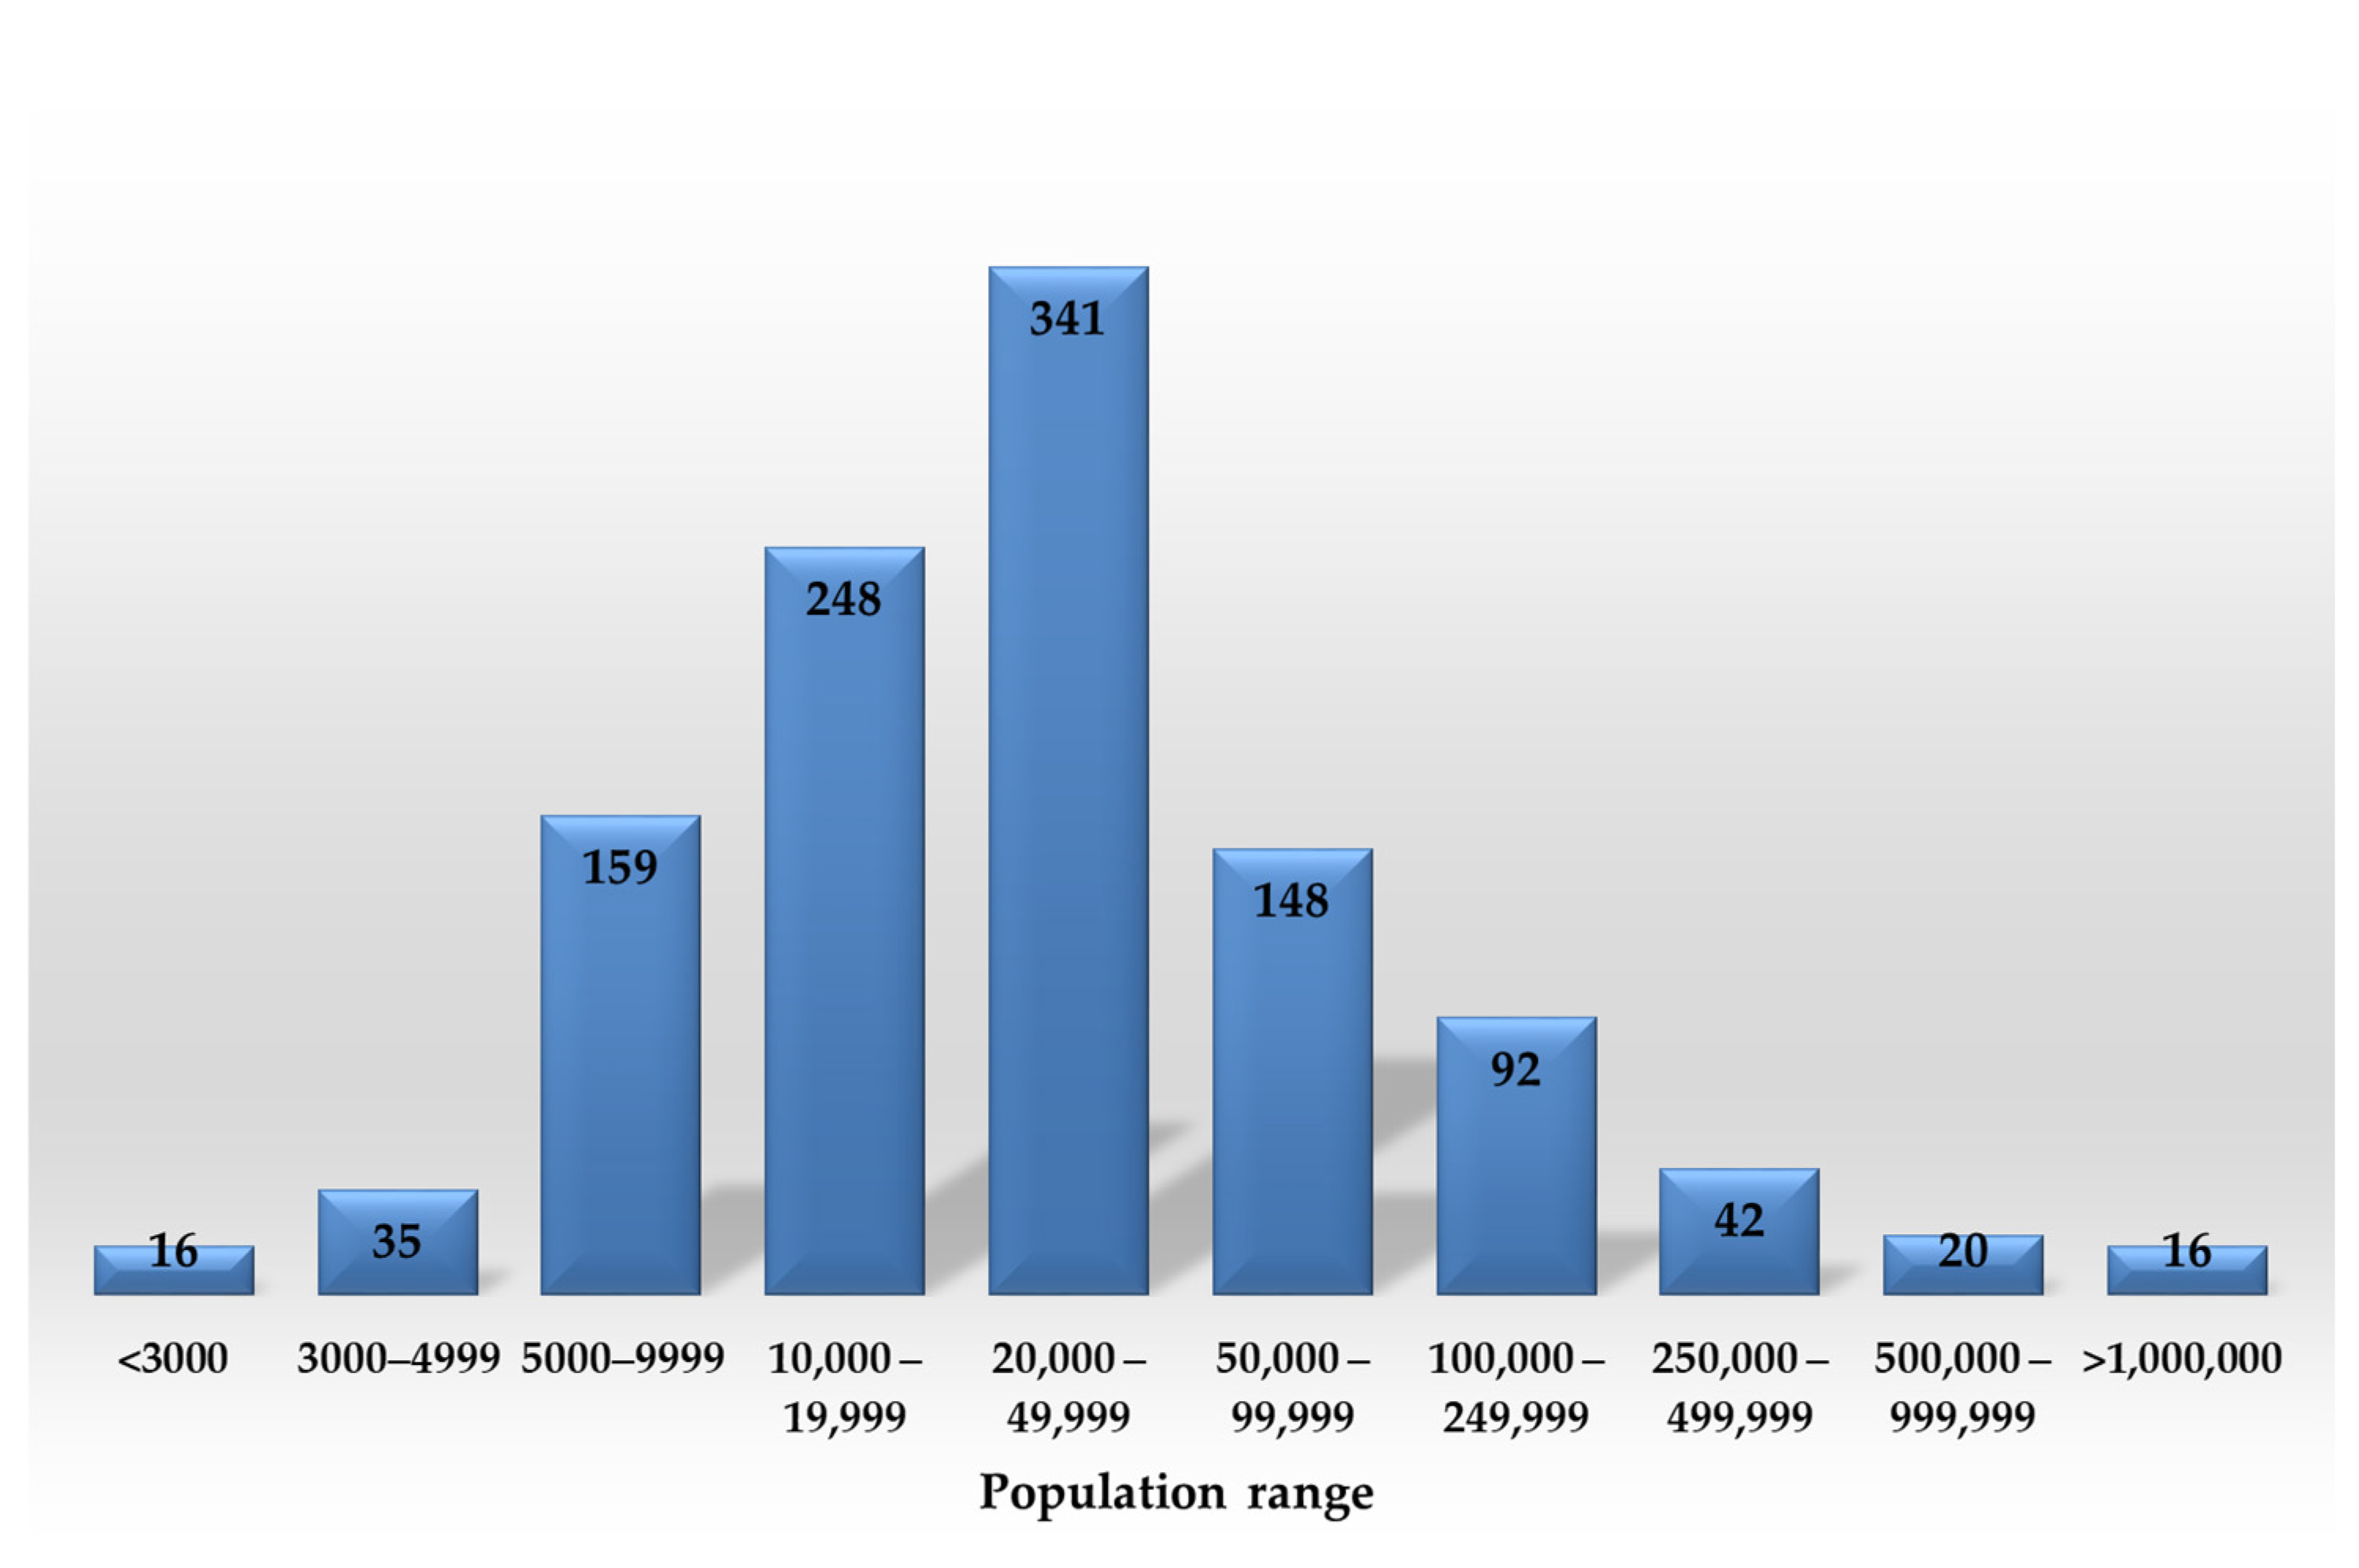
  29. Federal State Statistics Service. The Population of the Russian Federation as of January 1, 2020. Grouping the Number of Cities by the Number of People Living in Them as of January 1, 2020. Available online: https://rosstat.gov.ru/storage/mediabank/CcG8qBhP/mun_obr2020.rar (accessed on 30 July 2024).
  30. Construction Norms and Rules “SNiP 2.04.03-85 Sewerage. Pipelines and Wastewater Treatment Plants”. Available online: https://docs.cntd.ru/document/5200017?marker=7D20K3 (accessed on 25 July 2024).
  31. Construction Code of Russian Federation “SP 30.13330.2020. Internal Water Supply and Sewerage of Buildings”. Available online: https://docs.cntd.ru/document/573741260 (accessed on 25 July 2024).
  32. Danilovich, D.A. State standard GOST 70953-2023 on basic technical solutions—A new tool for improving the quality of projects of wastewater treatment plants. Water Supply Sanit. Tech. 2023, 12, 4. [Google Scholar] [CrossRef]
  33. Construction Code of Russian Federation “SP 32.13330.2018. Sewerage. Pipelines and Wastewater Treatment Plants”. Available online: https://docs.cntd.ru/document/554820821 (accessed on 25 July 2024).
  34. Makisha, N.A. Simulation of reconstruction of sewage treatment plants using membrane bioreactors. Ecol. Urban Terr. 2020, 2, 88–93. [Google Scholar] [CrossRef]
  35. Makisha, N. Preliminary Design Analysis of Membrane Bioreactors Application in Treatment Sequences for Modernization of Wastewater Treatment Plants. Membranes 2022, 12, 819. [Google Scholar] [CrossRef]
  36. Khan, M.T.; Ahmad, R.; Liu, G.; Zhang, L.; Santagata, R.; Lega, M.; Casazza, M. Potential Environmental Impacts of a Hospital Wastewater Treatment Plant in a Developing Country. Sustainability 2024, 16, 2233. [Google Scholar] [CrossRef]
  37. Order of the Ministry of Agriculture of Russian Federation No. 552 Dated December 13, 2016 “On Approval of Water Quality Standards for Water Bodies for Fishery, Including Standards for Maximum Permissible Concentrations of Harmful Substances in the Waters of Water Bodies for Fishery”. Available online: https://docs.cntd.ru/document/420389120 (accessed on 25 July 2024).
  38. Decree of the Government of the Russian Federation No. 1430 Dated September 15, 2020 “On Approval of Technological Indicators of the Best Available Technologies in the Field of Wastewater Treatment Using Centralized Wastewater Disposal Systems of Settlements or Urban Districts”. Available online: https://docs.cntd.ru/document/565798086 (accessed on 25 July 2024).
  39. Stepanov, S.V. Technological Calculation of Activated Sludge Reactors and Membrane Bioreactors; ASV Publishing House: Moscow, Russia, 2020; 224p. [Google Scholar]
  40. Werkneh, A. Application of membrane-aerated biofilm reactor in removing water and wastewater pollutants: Current advances, knowledge gaps and research needs—A review. Environ. Chall. 2022, 8, 100529. [Google Scholar] [CrossRef]
  41. Wang, S.; Zou, L.; Li, H.; Zheng, K.; Wang, Y.; Zheng, G.; Li, J. Full-scale membrane bioreactor process WWTPs in East Taihu basin: Wastewater characteristics, energy consumption and sustainability. Sci. Tot. Environ. 2020, 723, 137983. [Google Scholar] [CrossRef] [PubMed]
  42. Sabia, G.; Petta, L.; Avolio, F.; Caporossi, E. Energy saving in wastewater treatment plants: A methodology based on common key performance indicators for the evaluation of plant energy performance, classification and benchmarking. Energy Convers. Manag. 2020, 220, 113067. [Google Scholar] [CrossRef]
  43. Gil, J.A.; Túa, L.; Rueda, A.; Montaño, B.; Rodríguez, M.; Prats, D. Monitoring and analysis of the energy cost of an MBR. Desalination 2010, 250, 997–1001. [Google Scholar] [CrossRef]
  44. Echevarría, C.; Valderrama, C.; Cortina, J.L.; Martín, I.; Arnaldos, M.; Bernat, X.; De la Cal, A.; Boleda, M.R.; Vega, A.; Teuler, A.; et al. Techno-economic evaluation and comparison of PAC-MBR and ozonation-UV revamping for organic micro-pollutants removal from urban reclaimed wastewater. Sci. Total Environ. 2019, 671, 288–298. [Google Scholar] [CrossRef]
Figure 1. Distribution of population of towns and cities in Russia.
Sustainability 16 08757 g001
Figure 2. Research sequence.
Sustainability 16 08757 g002
Figure 3. Typical scheme of treatment (before modernization).
Sustainability 16 08757 g003
Figure 4. Improved treatment scheme (after modernization).
Sustainability 16 08757 g004
Figure 5. Required ASR volumes before and after modernization.
Sustainability 16 08757 g005
Figure 6. Required ASR volumes alterations within growth of MLSS (after modernization).
Sustainability 16 08757 g006
Figure 7. ASR volumes decrease within growth of MLSS from 3 to 8 g/L (after modernization).
Sustainability 16 08757 g007
Figure 8. Placement of mixers and aeration units in one battery of ASR for Case 1 (a) and Case 2 (b): (1) anaerobic zone; (2) anoxic zone; (3) aerobic zone; (4) mixers; (5) aeration units.
Sustainability 16 08757 g008
Figure 9. Specific operation costs for considered cases.
Sustainability 16 08757 g009
Table 1. Calculated concentrations of pollutants.
PollutantMPC [g/d]
[30]
CXX.bm [mg/L]Effluent Limits [mg/L] *
TSS6518610–15
BODFULL 7521410–15
CODn/dn/dN/A
N-NH4823N/A
P-РО43.39.4N/A
Note: * typical values for WWTPs constructed before 2000; N/A—not available.
Table 2. Calculated concentrations of pollutants (after modernization).
PollutantMPC.rev [g/d]
[33]
CXX.am [mg/L]
TSS67285
BODFULL 72306
COD120510
N-NH48.837.4
P-РО41.04.3
Table 3. Calculated parameters of WWTPs before modernization.
FacilityParameterValue
Primary clarifierShape Rectangular
Amount2
Volume [m3]500
Depth [m]3.1
Train area [m2]19 × 4.5
TSS removal efficiency50%
BOD removal efficiency20%
ASRTypePlug-flow reactor
Volume [m3]3456
Length [m]48
Width of train [m]4.5
Depth [m]4.0
Number of trains2
Number of batteries2
Air consumption [m3/h]3300
DO [mg/L]2.0
MLSS [g/L]3.0
HRT [h]5.26
Secondary clarifierShape Rectangular
Number of trains4
Volume [m3]1116
Depth [m]3.1
Train area [m2]19 × 4.5
Table 4. Requirement for pollution concentrations in discharged wastewater.
PollutantLimits for Pollutant Concentrations [mg/L]
FWB [37]Cat. A [38]Cat. B [38]
TSS+0.25 mg/L to TSS value in water body5.010
BODFULL 33.69.6
CODN/A4080
N-NH40.41.01.0
N-NO20.020.10.1
N-NO39.09.09.0
P-РО40.20.50.7
Note: FWB is the fishery water body; Cat. A is the water body of category A; Cat. B is the water body of category B; N/A—not available
Table 5. Cost summary.
Cost TypeCase 1Case 2
CAPEX [EUR]Tank repair280,000280,000
Tank construction1,074,5000
Compressor units41,40064,200
Aerator units51,61223,903
Mixers154,80077,400
Membranes01,152,000
Overall1,602,3121,597,503
OPEX [EUR/year]Energy for ASR aeration152,425119,400
Energy for MBR aeration0188,000
Energy for mixers60,97030,485
Chemicals07521
Overall213,394345,406
Disclaimer/Publisher’s Note: The statements, opinions and data contained in all publications are solely those of the individual author(s) and contributor(s) and not of MDPI and/or the editor(s). MDPI and/or the editor(s) disclaim responsibility for any injury to people or property resulting from any ideas, methods, instructions or products referred to in the content.

