Abstract
The intensifying urban heat island (UHI) effect presents a growing challenge for urban environments, yet there is a lack of comprehensive strategies that account for how multiple factors influence tree-cooling effectiveness throughout the year. While most studies focus on the effects of individual factors, such as tree shading or transpiration, over specific time periods, fewer studies address the combined impact of various factors—such as seasonal variations, building shading, transpiration rates, tree placement, and spacing—on tree cooling across different seasons. This study fills this gap by investigating the thermal environment in downtown Los Angeles through ENVI-met simulations. A novel tree-planting strategy was developed to enhance cooling performance by adjusting tree positions based on these key factors. The results show that the new strategy reduces Universal Thermal Climate Index (UTCI) temperatures by 2.2 °C on the hottest day, 0.97 °C on the coldest day, and 1.52 °C annually. The study also evaluates the negative cooling effects in colder months, demonstrating that, in cities with climates similar to Los Angeles, the benefits of tree cooling in hot weather outweigh the drawbacks during winter. These findings provide a new method for optimizing tree placement in urban planning, contributing to more effective UHI mitigation strategies.
1. Introduction
The urban heat island (UHI) effect, where urban areas experience higher temperatures than their rural surroundings, is a growing concern in densely populated cities. This phenomenon is expected to intensify with global warming, particularly in cities like Los Angeles, one of the most urbanized areas in the United States [1]. The city’s Mediterranean climate and extensive development lead to temperature differentials of 5 to 10 degrees Fahrenheit between downtown and suburban areas during summer [2].
The UHI effect increases energy consumption due to higher demand for cooling systems, leading to elevated greenhouse gas emissions and energy costs. Moreover, the UHI effect leads to increased energy consumption, which in turn places additional economic pressure on infrastructure systems [3]. It also poses significant public health risks, especially for vulnerable populations, by increasing heat-related illnesses [4]. Additionally, environmental impacts include accelerated ground-level ozone formation and degraded aquatic ecosystems due to warmer urban runoff [5,6].
In Los Angeles, the UHI effect is exacerbated by the replacement of vegetation with heat-absorbing materials like concrete and asphalt [7]. To mitigate the UHI effect, implementing effective cooling strategies is essential, with urban tree planting standing out as a particularly promising approach. Trees provide shade, enhance evapotranspiration, and improve air circulation, thereby reducing ambient temperatures [8].
Research indicates that trees can reduce near-surface air temperatures in American cities by approximately 3.06 °C, with shading being more effective at night than during the day. However, the effectiveness of trees in cooling urban areas also depends on factors such as tree characteristics, spatial conditions, and local climate [8].
In assessing the characteristics of a tree, key factors that influence its cooling effectiveness include leaf density, canopy size and shape, and tree height. Higher leaf density boosts transpiration, larger canopies provide more substantial shade, and taller trees extend cooling effects over a broader area [9,10,11]. However, shadows cast by buildings can limit direct sunlight from reaching the tree’s canopy, thus diminishing its cooling efficiency [12]. The location and arrangement of trees are also vital considerations [13]; strategically planting trees on the south and west sides of buildings can enhance their ability to block direct sunlight, thereby reducing ambient temperatures [14]. Furthermore, ensuring proper tree spacing is crucial to maximize shading while preventing canopy overlap [15].
Climate factors such as humidity, air temperature, and wind speed significantly influence tree’s transpiration cooling effects. In drier climates, transpiration becomes more effective, with higher air temperatures further enhancing its efficiency [16].
Finally, street tree coverage plays a crucial role in cooling. A 10% increase in coverage can lower pedestrian-perceived temperature by 0.22 °C, but when the increase in vegetation coverage is less than 5%, it has no impact on pedestrian comfort [17]. The optimal tree arrangement varies by city; some cities benefit from closely spaced trees, while others see better results with more scattered placements [18]. In shallow street canyons, daytime temperatures can be reduced by 0.2–0.6 °C due to street trees, with the greatest cooling observed during heat waves. In contrast, in deep canyons with tall buildings, the cooling effect is diminished because the tree shade is obstructed [19].
Despite the growing recognition of urban tree planting as a cooling strategy, the current literature reveals a lack of clear methods and approaches for optimizing tree placement throughout the year. Existing studies often focus on individual factors, such as shading or transpiration, within specific timeframes, without addressing how these factors interact across different seasons. The purpose of this study is to investigate how strategic urban tree placement can optimize cooling effects in downtown Los Angeles. By analyzing tree characteristics, spatial conditions, and local climate, this research aims to develop a tree-planting scheme that effectively reduces outdoor temperatures and mitigates the UHI effect. This study will also quantify and compare the year-round cooling benefits of strategically placed trees, evaluating the positive effects during hot months against the potential adverse impacts during colder periods. Distinct from most existing research, which primarily emphasizes the benefits of tree cooling at specific moments in hot conditions, this study provides a more holistic understanding of the cooling effects of trees across all seasons. The findings will offer critical insights for optimizing street tree planting and urban planning in Los Angeles and other urban environments.
2. Materials and Methods
A methodology was established to study a specific site in Los Angeles, involving establishing a base urban model, preliminary study, developing two techniques for simulation result analysis, and conducting a full-site study.
2.1. Establish a Base Urban Model
2.1.1. Build the Modeling in ENVI-met
The study area, located in downtown Los Angeles and bounded by South Hope St. to the east, West Olympic Blvd. to the south, Flower St. to the west, and West 9th St. to the north, was selected for its diverse tree species and abundant arrangement options (Figure 1). The urban model was developed using ENVI-met, a microclimate modeling software well-suited for simulating urban thermal environments, particularly in the context of thermal environment analysis related to trees.
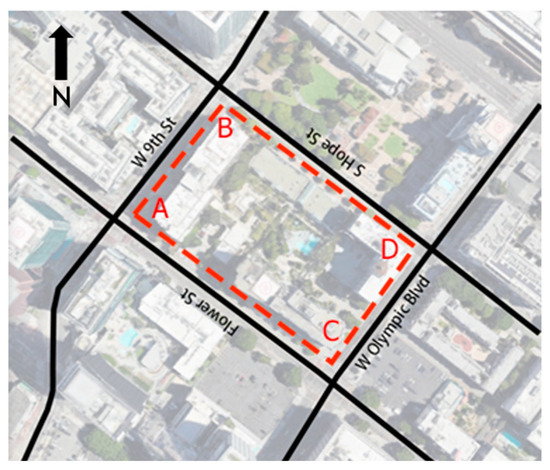
Figure 1.
The range of research area. The red dashed box formed by ABCD represents the study area for this research.
The height of the buildings and trees within the study area was determined through Google Earth 3D mapping and integrated into ENVI-met. The building and pavement materials were modeled based on field observations. The comprehensive details on the model construction and material input specifications are provided in Appendix A, Figure A1 and Figure A2.
2.1.2. Input Climate Data into ENVI-met
Five types of climate data are required for ENVI-met simulations. Hourly air temperature, humidity, wind speed, and wind direction for downtown Los Angeles in 2022 were sourced from the National Weather Service and input into ENVI-met (Figure 2). However, since cloud coefficient data are unavailable from historical sources online, this study excluded its influence. Notably, many studies have similarly set the cloud coefficient to 0 to simulate clear weather conditions, and this approach was adopted in all simulations in this study to eliminate the impact of cloud variation on the results. The hottest (4 September) and coldest (24 February) days of the year, along with an average climate day for each month, were selected to minimize the number of simulations required while maintaining accuracy. These climate profiles were used to generate ENVI-met simulation files for subsequent analysis. Appendix A Figure A3 and Figure A4 outline the procedure for creating the ENVI-met climate file for the hottest and coldest days, while Appendix A Figure A5 provides the monthly climate data.
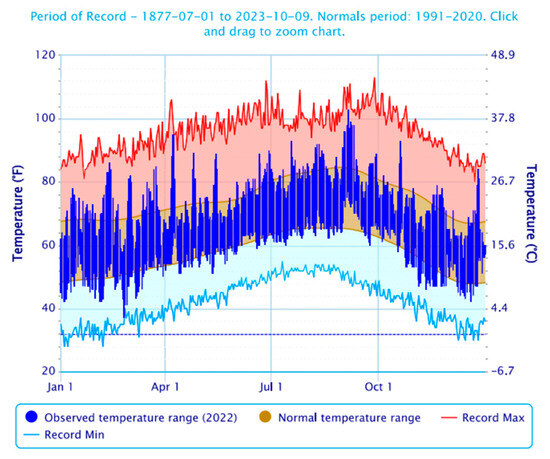
Figure 2.
Daily temperature data of downtown Los Angeles in 2022.
2.1.3. Research Questions
The full-site analysis primarily investigates the following two research questions:
- Research question 1: Analyze how much the new tree scheme cools the average UTCI of a sidewalk area compared to existing conditions in study area by adjusting the tree positions while keeping the number and species unchanged (Table 1).
 Table 1. Species of trees in the full-site study area.
 - Research question 2: Identify the months when trees provide greater or smaller benefits in terms of cooling effect, as well as the times when they potentially exert a negative impact.
The Universal Thermal Climate Index (UTCI) is a human biometeorology parameter used to assess the relationship between the outdoor environment and human well-being. It describes how the human body experiences atmospheric conditions like air temperature, humidity, wind, and radiation [20]. The relationship between UTCI values and different types of thermal stress is as follows and can be used for evaluating the thermal environment on sidewalk areas under the new tree scheme and the existing tree scheme (Table 2) [21].
Table 2.
UTCI thermal comfort standard.
2.2. ENVI-met Accuracy Verification
A study compared ENVI-met simulations with field measurements in Port Said, Egypt, and found high accuracy for outdoor thermal comfort indicators. The agreement index (IA) ranged from 0.81 to 0.95, showing that ENVI-met reliably simulates conditions like PET (Physiological Equivalent Temperature). Despite some limitations with air velocity, the software was effective in hot–humid environments for urban design applications [22].
Another study conducted in El Obour City, Egypt, validated ENVI-met by comparing its simulated data for air temperature, humidity, and wind speed with field measurements. The deviations were minimal, with differences of 0.35 to 0.65 °C for temperature, 0 to 1% for humidity, and 0.08 to 0.58 m/s for wind speed. The study confirmed ENVI-met’s reliability for urban climate simulations, particularly in evaluating thermal comfort in urban planning [23].
2.3. Preliminary Study
The five variables affecting the tree-cooling capacity in the preliminary study are as follows: date, building shade, transpiration, tree location, and spacing. The date variable will be simulated with average monthly climate data to determine which months show a more obvious cooling effect. The other four factors will be analyzed just using simulations from the hottest and coldest days of the year to evaluate their impact on tree cooling during extreme weather.
2.3.1. Date Analysis
Date analysis will simulate a blank field and a single tree to determine the effect of a tree’s cooling ability on its surroundings when only the date changes (Figure 3).
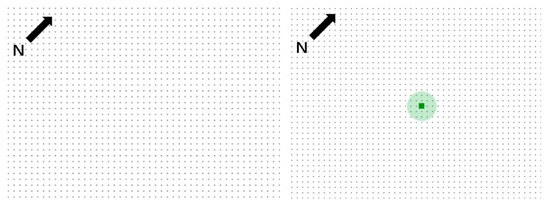
Figure 3.
With or without tree in date comparison diagram. The green area indicates the locations of trees in the simulation.
2.3.2. Building Shade Analysis
The building shade simulation will compare the impact of a tree on surrounding temperatures in an area fully covered by building shadow throughout the day to evaluate the proportion by which the building’s complete shading reduces the tree’s cooling capacity (Figure 4).

Figure 4.
Tree under the shade of building’s simulation diagram. The green area indicates the locations of trees in the simulation. The gray area represents the locations of buildings in the simulation.
2.3.3. Transpiration Analysis
Transpiration analysis will use the same scenario as the building shade analysis to determine if tree transpiration significantly influences its cooling after excluding the tree’s shade effect (Figure 4).
2.3.4. Tree Location Analysis
Tree location analysis simulates the cooling effect of trees positioned in 8 directions around a building: east, south, west, north, southeast, northeast, southwest, and northwest (Figure 5). Meanwhile, the spacing between each tree is sufficiently large to ensure that the shadows and cooling areas of individual trees do not interfere with each other.
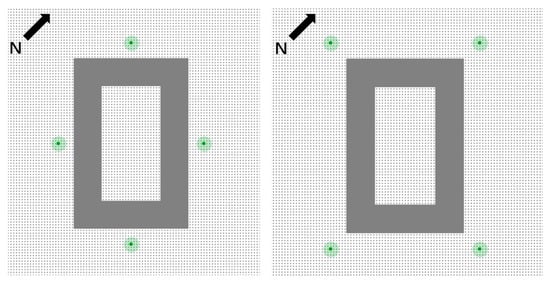
Figure 5.
Tree’s eight location’s simulation diagram. The green area indicates the locations of trees in the simulation. The gray area represents the locations of buildings in the simulation.
2.3.5. Tree Spacing Analysis
Three scenarios—trees’ canopies separated by 15 feet, touching canopies, and overlapping canopies—will be used to analyze the impact of tree spacing on canopy shading ability (Figure 6, Figure 7 and Figure 8).
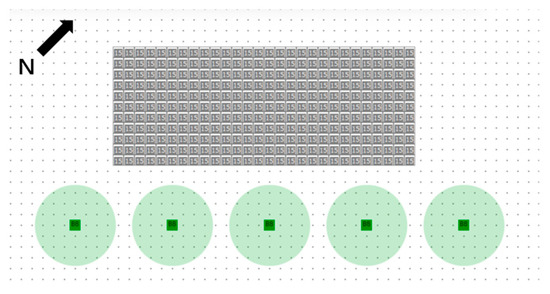
Figure 6.
Trees’ canopies separated by 15-feet diagram. The green area indicates the locations of trees in the simulation. The gray area represents the locations of buildings in the simulation.
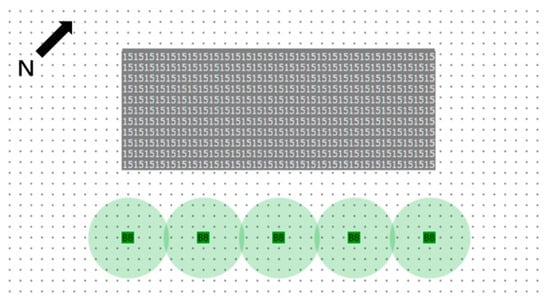
Figure 7.
Trees touching canopies diagram. The green area indicates the locations of trees in the simulation. The gray area represents the locations of buildings in the simulation.
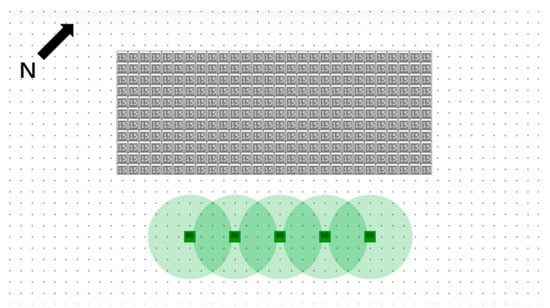
Figure 8.
Overlapping trees’ canopies diagram. The green area indicates the locations of trees in the simulation. The gray area represents the locations of buildings in the simulation.
2.4. Numeric Techniques
2.4.1. Monthly Average Climate Day Method
Given the time-consuming nature of ENVI-met simulations, a monthly average climate day method was employed. This involves averaging the hourly climate data of each day in a month to create an “average climate day” for that month, thereby reducing simulation time with minimal data error. The detailed calculation procedure of the method is thoroughly discussed in the Appendix A Figure A6, Figure A7 and Figure A8.
2.4.2. Pixel-Counting Method
The pixel-counting method was applied for studying the average temperature of the sidewalk in the full-site analysis. This approach involves analyzing the pixel distribution of different colors that represent various UTCI values in the sidewalk area. These values are then used to calculate the average UTCI, providing an assessment of the site’s thermal comfort level. The detailed calculation procedure of the method is thoroughly discussed in the Appendix A Figure A9 and Figure A10 and Table A1.
2.5. Full-Site Study
The full-site study simulates an entire block under three tree-planting scenarios—no trees, existing trees, and proposed trees—across the coldest, hottest, and monthly average climate days at the 1.4 m level in sidewalk areas at 12 pm This focus on the 1.4 m plane at noon is due to pedestrians’ highest usage of street areas during the daytime and their sensitivity to temperature variations at this height. These scenarios will be used to calculate the average sidewalk UTCI, allowing for an analysis of the monthly cooling performance of existing and proposed tree schemes to determine which months the proposed scheme outperforms, thereby assessing its potential to provide enhanced thermal comfort throughout the year.
3. Results (Preliminary Studies)
The preliminary studies use ENVI-met to investigate the cooling capacity of trees by comparing UTCI indices at a height of 1.4 m.
3.1. Date Comparison (No Tree Compared with One Tree)
This section compares UTCI data in the simulated area under three conditions—the hottest and coldest days of the year (at 10 a.m., 12 p.m., and 2 p.m.), and the average climate date of each month—using a simulation with only one tree (Figure 9). Since the cooling capacity of trees benefits hot weather but has negative effects in cold weather [24], the aim is to determine if the cooling effect of trees is more beneficial in hot weather than it is harmful in cold weather.
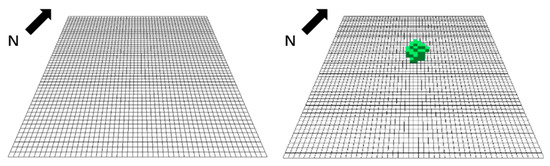
Figure 9.
No tree and one tree modeling in ENVI-met.
3.1.1. Hottest Day Comparison by Date Factor
On the hottest days, the UTCI at the tree’s center decreased by 9–10 °C and in the shaded area by 2.5–3 °C, with the tree’s shade extending about 15 feet (Figure 10).
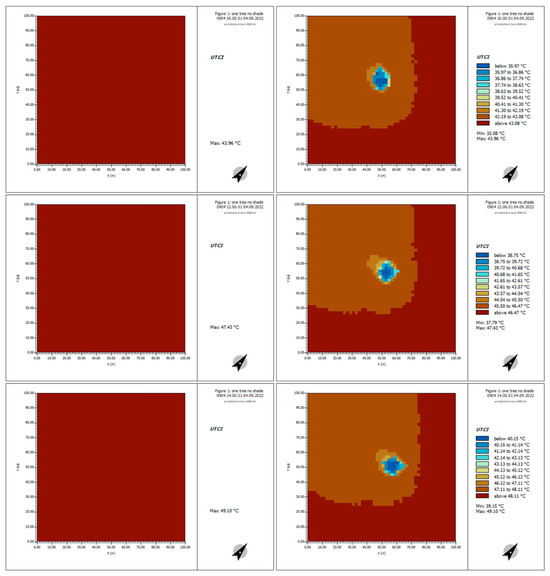
Figure 10.
Hottest day UTCI diagram comparison by date factor at 10 a.m., 12 p.m., and 2 p.m.
3.1.2. Coldest Day Comparison by Date Factor
On the coldest days, the UTCI in the tree’s center decreased by 10–11 °C, slightly more than on the hottest days. The UTCI in the shaded area dropped by about 2 °C, slightly less than on the hottest day (Figure 11). However, the influence area of the tree’s shade on the surrounding UTCI is significantly smaller on the coldest day compared to the hottest day.
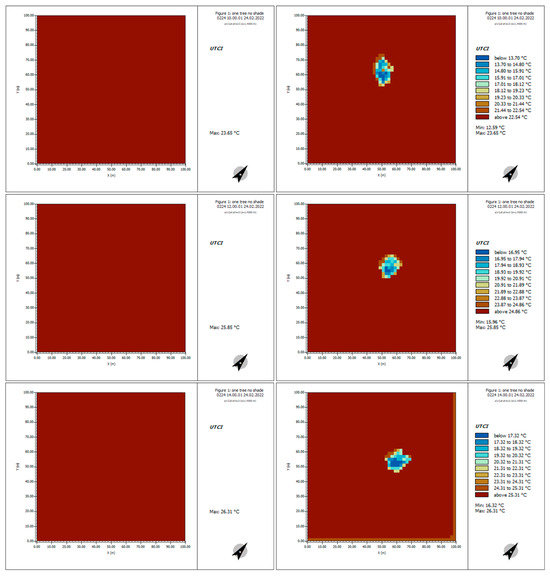
Figure 11.
Coldest day UTCI diagram comparison by date factor at 10 a.m., 12 p.m., and 2 p.m.
3.1.3. Graph of Hottest and Coldest Day Comparison
On the hottest day, when the maximum air temperature is higher, the tree’s cooling ability is stronger, but this phenomenon is not evident on the coldest days (Figure 12 and Figure 13). Although the central area’s cooling effect is stronger on the coldest day, the tree’s cooling impact area is much larger on the hottest day, leading to a greater reduction in average UTCI. This indicates that the positive cooling benefits on hot days outweigh the side effects on cold days, making the overall benefit of the tree greater than its harm.
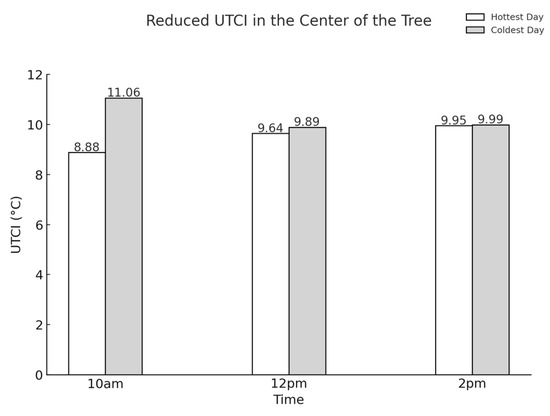
Figure 12.
Hottest and coldest days reduced UTCI comparison (center of the tree).
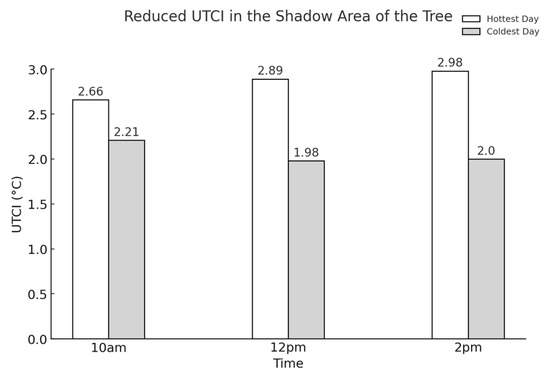
Figure 13.
Hottest and coldest days reduced UTCI comparison (shadow area of the tree).
3.1.4. Graph of Each Month Comparison
The cooling effect at the tree center remained stable across all months, while the cooling in the surrounding area exhibited significant variation. Enhanced cooling within ten feet of the tree was observed during periods of higher average temperatures, particularly between May and September (Figure 14).
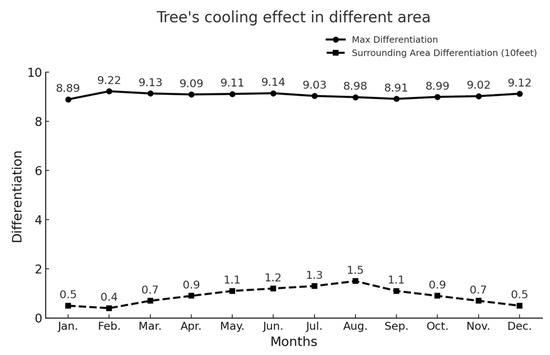
Figure 14.
Each month reduced UTCI comparison.
3.2. Building Shade Comparison
This section analyzes the relationship between a tree’s cooling capacity and building shade. It simulates the tree’s cooling effect at 10 a.m., 12 p.m., and 2 p.m. on the hottest and coldest days of 2022 when the tree is entirely within the building’s shade (Figure 15).
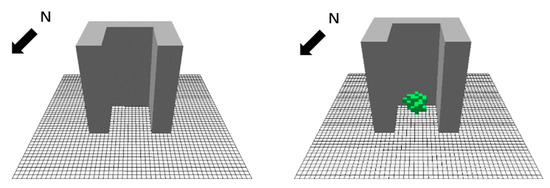
Figure 15.
Building shade without a tree and with a tree.
3.2.1. Hottest Day Comparison by Building Shade Factor
When the tree is completely shaded by a building, its ability to reduce the surrounding UTCI weakens significantly. The UTCI difference between the tree’s center and the surrounding area from 10 a.m. to 2 p.m. is about 0.8 to 1.6 °C, much lower than the 9.49 °C difference when the tree is fully exposed to the sun. This indicates that the tree’s cooling ability decreases significantly when its shading effect is blocked by the building shadow (Figure 16).
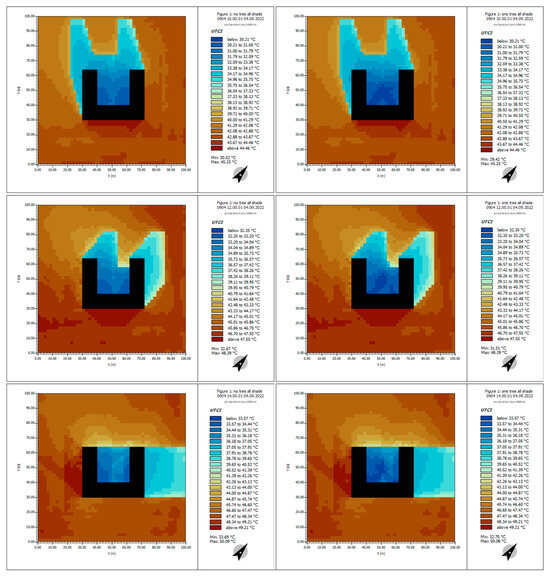
Figure 16.
Hottest day UTCI diagram comparison by building shade factor at 10 a.m., 12 p.m., and 2 p.m.
These simulations show that on the hottest day of the year, when the tree is entirely in the building’s shadow, the UTCI reduction drops from about 9.75 °C to 1.3 °C, resulting in an 87% decrease in the tree’s cooling capacity.
3.2.2. Coldest Day Comparison by Building Shade Factor
On the coldest days, when the tree is fully shaded by the building, its ability to reduce the surrounding UTCI weakens significantly. The UTCI values at the tree’s center and surrounding areas are close to each other, much lower than the 10.5 °C difference observed when the tree is fully exposed to the sun. This indicates a significant decrease in cooling ability when the tree’s shading effect is blocked, with the reduction in cooling being even greater than on the hottest day. The detailed UTCI diagram comparison of the coldest day at 10 a.m., 12 p.m., and 2 p.m. is introduced in Appendix A Figure A11.
These simulations reveal that on the coldest day of the year, when the tree is entirely in the building’s shadow, the UTCI reduction drops from about 10.5 °C to 0.7 °C, resulting in a 94% decrease in the tree’s cooling capacity.
3.2.3. Graph of Cooling Ability Reduction Comparison
The tree’s cooling ability varies greatly between full sun exposure and complete building shade. Building shadows significantly reduce the tree’s cooling effect, indicating that shade is the primary mechanism for lowering surrounding temperatures. In cold weather, the reduction in cooling ability is more pronounced, suggesting that trees rely more on their own shade to cool in colder conditions, with less contribution from other cooling methods compared to hot weather (Figure 17).
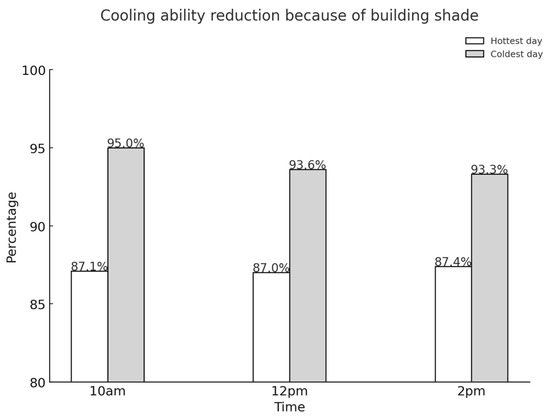
Figure 17.
Cooling ability reduction comparison.
3.3. Transpiration
This section focuses on the impact of transpiration on a tree’s cooling ability. Trees cool primarily through canopy shading and transpiration [25]. By excluding the shading effect, the influence of transpiration on the surrounding environment can be isolated. In the previous section, the simulations excluded the effect of tree shading. Therefore, the results from that section can be directly used to analyze the transpiration effect (Figure 18).
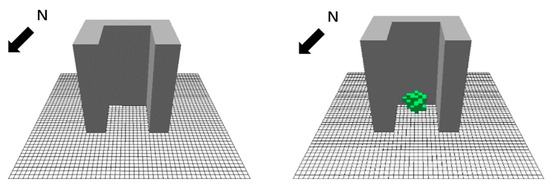
Figure 18.
Building shade without a tree and with a tree for transpiration analysis.
3.3.1. Hottest Day Comparison by Transpiration Factor
The temperature at the center of the tree is 1.1 °C lower than the UTCI without the tree, even though the tree is fully shaded by the building (Figure 19). This reduction is not due to shading, so it must be attributed to other reasons, primarily the tree’s transpiration.
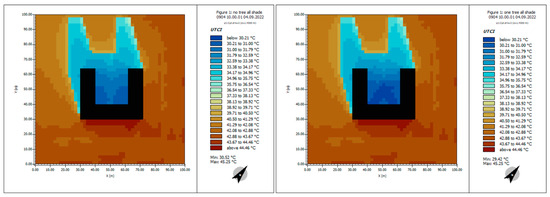
Figure 19.
Hottest day UTCI diagram comparison by transpiration factor at 10 a.m.
For the same reasons, the analysis in the previous section shows that on the hottest day of the year, the tree’s cooling capacity in its central area is 1.1 °C at 10 a.m, 1.16 °C at 12 p.m, and 0.99 °C at 2 p.m.
3.3.2. Coldest Day Comparison by Transpiration Factor
However, comparative analysis reveals that in winter, the presence of a tree in the shadow of buildings has very little impact on the surrounding temperature (Figure 20). The cooling effect of tree transpiration in winter is minimal, around 0.4 °C, indicating that tree transpiration is significantly weaker in cold weather than in hot weather.
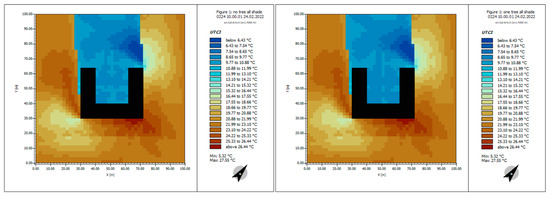
Figure 20.
Coldest day UTCI diagram comparison by transpiration factor at 10 a.m.
3.3.3. Transpiration Effect Comparison
It is evident that transpiration obviously reduces temperature in hot weather but has minimal cooling effect in cold weather (Figure 21). Given that cooling in cold weather is a negative effect, the results show that transpiration’s positive impact far outweighs its negative effect.
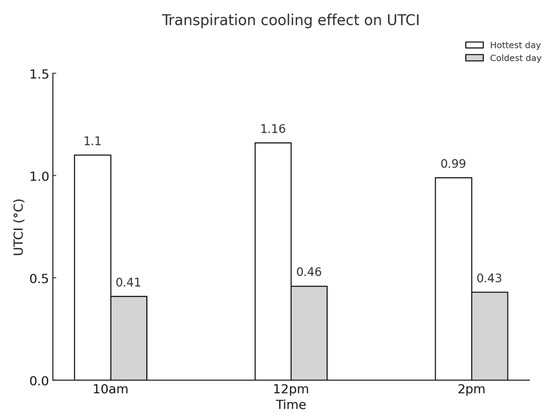
Figure 21.
Transpiration cooling effect on UTCI comparison.
The threshold for most people to detect temperature change is around 0.5 to 1 °C. The cooling effect of tree transpiration on surrounding UTCI during the hottest and coldest days is very close to this range. This means the body can barely perceive the influence, but it cannot significantly alter a person’s assessment of thermal comfort in the environment.
3.4. Tree Location Comparison
This section will simulate the cooling effect of trees on UTCI at eight locations around a building (east, south, west, north, northeast, southeast, northwest, and southwest) at sunrise, 12 pm, and sunset on the hottest and coldest days of the year (Figure 22). By analyzing the building’s shadow, the tree’s cooling benefits throughout the year can be assessed. Since shade is the primary cooling mechanism, determining whether trees in different locations can provide more shade during daylight will be key to evaluating their effectiveness in reducing UTCI.
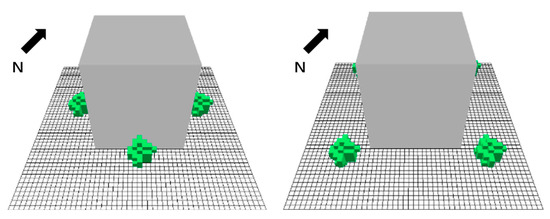
Figure 22.
Trees in different eight locations surrounding a building diagram.
3.4.1. Hottest Day Comparison by Location Factor
At sunrise, trees on the west, north, and northwest sides of the building are entirely within the building’s shadow, resulting in a weaker cooling effect. Trees on the southwest and northeast sides provide more shade, leading to better cooling. At noon, trees on the north, east, and northeast sides are in the building’s shadow, so their cooling effect is poor. Trees in the other five positions are unaffected by the shadow and show similar cooling abilities, reducing UTCI by about 4–4.5 °C. At sunset, trees on the south, east, and southeast sides are shaded and have less cooling capacity, while those on the southwest and northeast sides provide more shade and thus have a better cooling effect (Figure 23).
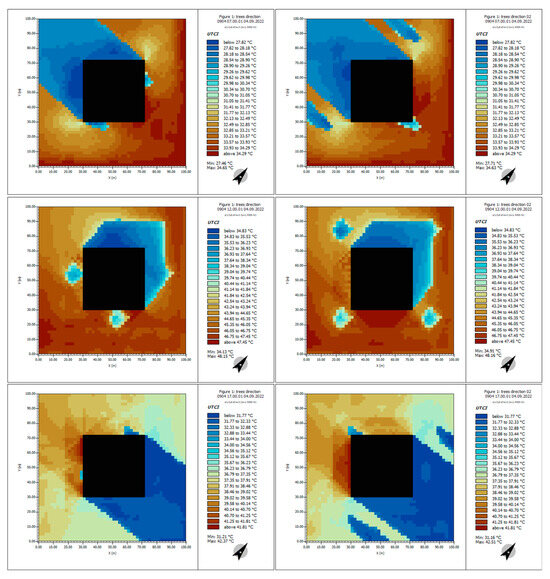
Figure 23.
Hottest day sunrise, noon, and sunset time UTCI comparison (8 a.m., 12 p.m., and 5 p.m.).
After analyzing the building shadow on the hottest day, the tree at point E, located on the southwest side, was not affected by the shadow all day and had the best cooling effect. The tree on the northeast side had the longest exposure to the shadow and the poorest cooling effect. Points A and D, near point E, were also unaffected during peak sunshine and had the second-best cooling capacity, with point A slightly outperforming point D due to less shadow influence when temperatures were higher. Similarly, points F and H performed better than points B and C, with F slightly better than H and B slightly better than C (Figure 24).
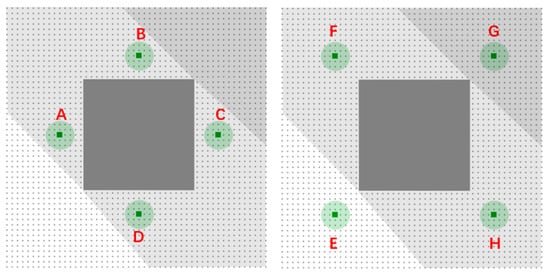
Figure 24.
Hottest day building shadow analysis. The green area indicates the locations of trees in the simulation. The dark gray area represents the locations of buildings in the simulation. The shaded area represents the extent of building shadow coverage. The darker the shade, the longer the duration of the building’s shadow coverage.
3.4.2. Coldest Day Comparison by Location Factor
At sunrise, trees on the west, north, and northwest sides of the building are fully shaded by the building, resulting in less cooling. Trees on the southwest and northeast sides provide more shade and thus cool better. At noon, trees on the north, east, and northeast sides are shaded by the building, leading to poor cooling, while those in the other five positions have similar cooling abilities, reducing UTCI by about 5–5.5 °C. At sunset, trees on the south, east, and southeast sides are shaded and have less cooling capacity, while the tree on the southwest side provides more shade and thus cools better. The detailed UTCI diagram comparison of the coldest day at 8 a.m., 12 p.m., 5 p.m. is introduced in Appendix A Figure A12.
The tree’s cooling effect on the coldest day is similar to that on the hottest day. The cooling capacity ranked from strongest to weakest is E, A, D, F, H, B, C, and G (Figure 25).
Figure 25.
Coldest day building shadow analysis. The green area indicates the locations of trees in the simulation. The dark gray area represents the locations of buildings in the simulation. The shaded area represents the extent of building shadow coverage. The darker the shade, the longer the duration of the building’s shadow coverage.
Despite a larger temperature difference on the coldest day, trees on the hottest day cool a larger area due to being provided with more shade area. Thus, the positive cooling effect of trees in Los Angeles during hot weather outweighs the negative effect in cold weather.
3.4.3. Whole-Year Comparison
The analysis of building shade and tree positions throughout the year yielded similar results to those on the coldest and hottest days. The cooling capacity of trees is ranked from strongest to weakest as E, A, D, F, H, B, C, and G (Figure 26).
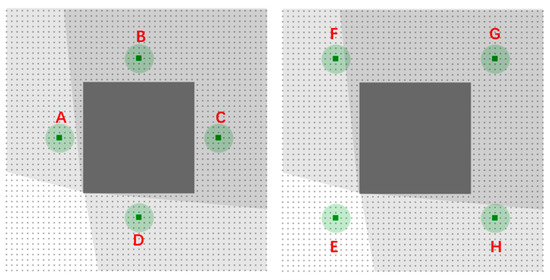
Figure 26.
Whole-year building shadow analysis. The green area indicates the locations of trees in the simulation. The dark gray area represents the locations of buildings in the simulation. The shaded area represents the extent of building shadow coverage. The darker the shade, the longer the duration of the building’s shadow coverage.
Given that cooling trees has more positive benefits than harm, and that Los Angeles spends more time in hot weather than cold weather throughout the year, the best locations for trees around buildings in downtown Los Angeles are ranked from best to worst as E, A, D, F, H, B, C, and G (Figure 27).
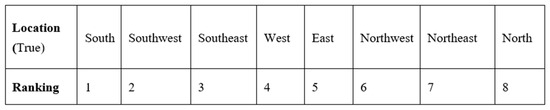
Figure 27.
Trees’ best cooling location ranking.
3.5. Trees’ Spacing Analysis
This section compares the UTCI of tree species with medium trunks, medium height, medium crown size, and dense leaf density at 12 pm on the hottest day under three conditions: canopies separated by 15 feet, touching canopies, and overlapping canopies to analyze how tree density and arrangement can maximize cooling effectiveness.
Simulations found that the average UTCI temperature around trees was lowest when canopies did not overlap, slightly higher when canopies were close, and highest when canopies overlapped. Proper spacing maximizes the shaded area, while large overlaps waste trees’ shading, reducing the cooling effect of trees (Figure 28).
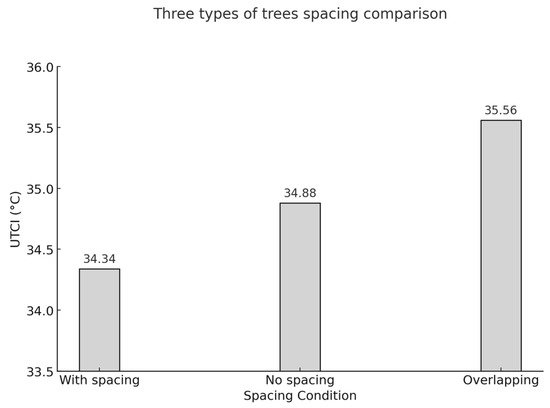
Figure 28.
Three types of trees’ spacing UTCI comparison at 12 pm (hottest day).
3.6. Proposed Tree Layout
Based on the analysis of factors affecting the tree-cooling capacity, the original tree distribution can be redesigned to enhance cooling. The new planting scheme focuses on the thermal comfort of the sidewalk area, so only the trees around the building and sidewalk are relocated, while trees in the middle of the block remain unchanged as they have minimal impact on the sidewalk’s thermal environment.
First, trees with broad canopies and tall heights are placed in the lower left corner of the building to provide maximum shade, following the priority order from the previous study. Medium-crowned trees with moderate shade capacity are then positioned on the left and lower sides of the site. Smaller landscape trees with the least shade capacity are placed on the upper and right sides, where they are more likely to be fully covered by the building’s shade. Additionally, tree spacing should be moderate—close enough to maximize shade without excessive overlap and not too far apart to avoid wasting prime cooling locations. Meanwhile, it is ensured that all areas of the sidewalk are covered by trees to meet the needs of pedestrians and residents for green space (Figure 29). The 2D map of the new scheme of trees can be found in the Appendix A Figure A13.
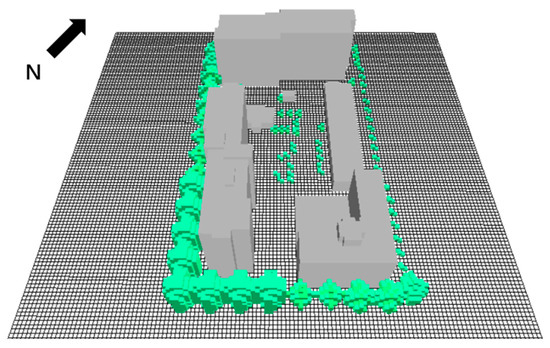
Figure 29.
New trees’ layout 3D map.
3.7. Summary of Preliminary Studies
The five conclusions that can improve the cooling ability of trees through several preliminary simulations are as follows:
- Time Factor: Trees provide more shade and have greater cooling ability in summer compared to winter.
- Shading: Trees primarily cool through canopy shading, but building shadows can significantly reduce this effect. It is important to maximize tree shade while minimizing overlap with building shadows.
- Transpiration: Tree transpiration also contributes to cooling and is not affected by building shadows. Transpiration effect is more effective during hot weather, but its cooling effect is much weaker than shading and has minimal impact on the thermal environment and human comfort.
- Location: Trees on the south side of a building have the best cooling effect, while those closer to the north side are less effective.
- Canopy Spacing: Trees cool best when their canopies are spaced apart without overlapping.
4. Results (Full-Site Research)
This chapter presents the simulation and analysis results for three scenarios: no trees, existing trees, and the new-tree-planting plan proposed in the last section. These scenarios are examined at different times on the hottest (4 September) and coldest (24 February) days of 2022, as well as under average monthly climate conditions (Figure 30). The UTCI values are compared to evaluate the enhancement in thermal comfort provided by the new-tree-planting scheme, relative to the existing scheme, across each month of the year. The model of no trees and existing trees is introduced in the Appendix A Figure A14 and Figure A15.
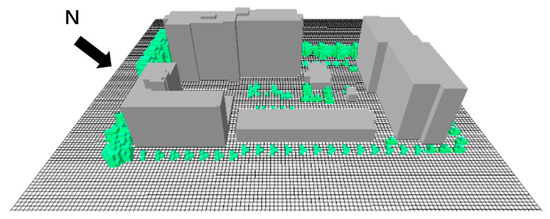
Figure 30.
Full-site new trees’ 3D model in ENVI-met.
4.1. No Trees vs. Existing Trees vs. New Trees (Hottest Day)
This section compares the full-site UTCI diagrams and analyzes the average UTCI of the pedestrian area under three conditions to determine if the new scheme improves UTCI more effectively than the existing scheme at the full-site level.
4.1.1. Three Conditions UTCI Comparisons
After the simulation, UTCI diagrams were obtained for 12 pm on 4 September, the hottest day in Los Angeles in 2022, under the three conditions: no trees, existing trees, and new trees (Figure 31, Figure 32 and Figure 33).
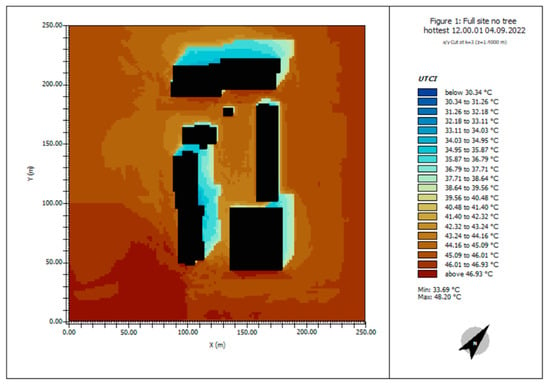
Figure 31.
Full-site no trees’ UTCI diagram.
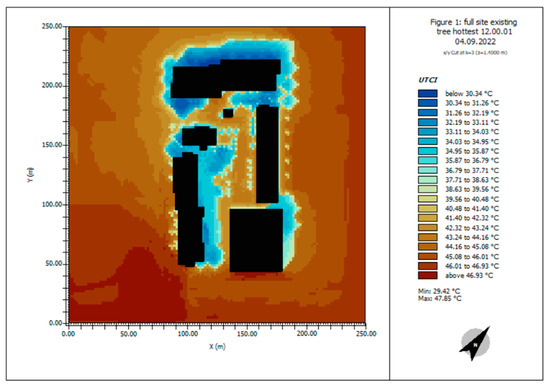
Figure 32.
Full-site existing trees’ UTCI diagram.
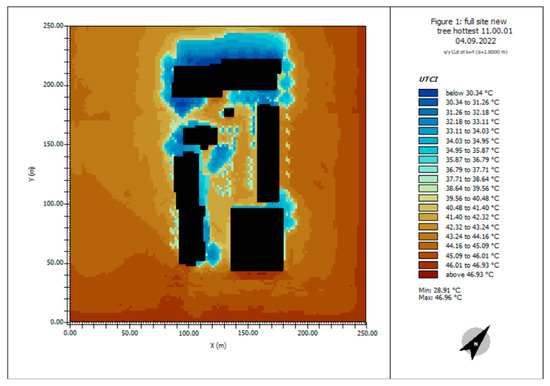
Figure 33.
Full-site new trees’ UTCI diagram.
4.1.2. Pedestrian Area Average Temperature Analysis (12 pm)
At 12 noon on the hottest day of the year, the UTCI at 1.4 m in the sidewalk area was 43.22 °C with no trees, 40.71 °C with existing trees, and 38.51 °C with the new tree plan. This shows that relocating trees without changing their number or species reduces the UTCI by 2.2 °C. All three conditions fall under the very strong heat stress level. The detailed calculation of the average UTCI under tree conditions, using the pixel-counting method, is thoroughly presented in Appendix A Table A2, Table A3 and Table A4.
4.2. No Trees vs. Existing Trees vs. New Trees (Coldest Day)
On the coldest days of the year, the average UTCI in the full-site sidewalk area is 23.42 °C with no trees, 20.51 °C with existing trees, and 19.54 °C with the new tree plan. The new scheme cools the area 0.97 °C more than the existing one. Comparing the results from the hottest and coldest days, the simulations show that the new tree plan’s positive summer effects outweigh its negative winter effects (Figure 34). All three conditions fall within the no thermal stress level. The detailed UTCI comparisons of three trees conditions are introduced in the Appendix A Figure A16, Figure A17 and Figure A18.
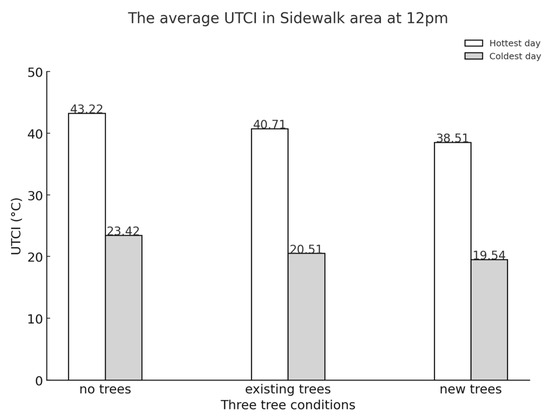
Figure 34.
Full-site pedestrian area UTCI comparisons at 12 p.m.
4.3. Existing Trees vs. New Trees (Full-Site Monthly Comparison)
This section compares the average UTCI value of the sidewalk area at 12 noon each month under existing trees and new trees, identifying the months when the new trees significantly impact the thermal environment and those when the effect is less noticeable. Only the results are discussed here, excluding the UTCI diagrams and calculation process.
The new tree scheme can lower the average temperature of the sidewalk area but cannot completely change the thermal stress level. In downtown Los Angeles, all months except January and February experience varying levels of thermal stress, so the cooling ability of trees is crucial for this climate. The detailed comparison of the UTCI diagrams for each month is presented in Appendix A Figure A19, Figure A20, Figure A21, Figure A22, Figure A23, Figure A24, Figure A25, Figure A26, Figure A27, Figure A28, Figure A29 and Figure A30.
4.4. Reduced UTCI Comparisons
The analysis shows that the new tree scheme reduces the UTCI value each month compared to the existing trees (Figure 35). The new trees have a significant cooling effect from August to October, and with higher average temperatures, the benefits are clear. However, the scheme also shows a noticeable negative cooling effect during the coldest months, January and February. Overall, the annual data confirm that the positive impact of the new trees outweighs the negative effects, aligning with previous expectations.
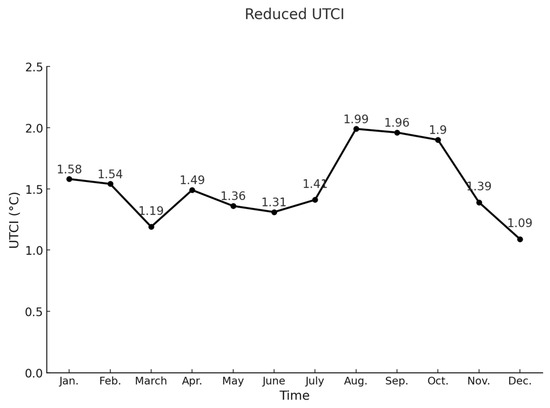
Figure 35.
Reduced UTCI for each month (new scheme).
4.5. Summary
The new scheme, based on a strategic planting approach, effectively reduces the annual UTCI and lowers the average air temperature by 1.5 °C. The cooling effect is stronger in summer than in winter, showing that the positive benefits outweigh the negative. While a small number of trees may not drastically change thermal comfort, their temperature impact is noticeable to pedestrians (Table 3).
Table 3.
Full-site all-year-round simulation result.
5. Discussion
5.1. Comparison with Previous Studies
Wang et al. [8] found that trees in American cities reduce near-surface air temperatures by approximately 3.06 °C, with nighttime shading being more effective than daytime shading. They also indicated that trees provide the most cooling in autumn, followed by winter, with the least effect in spring. However, our findings suggest that in downtown Los Angeles, trees are most effective in summer due to increased shading, with an overall annual cooling capacity of about 1.5 °C and a peak reduction of 2.2 °C on the hottest day. This variability in tree-cooling benefits across different seasons and environments highlights the influence of local climate and urban density.
Consistent with prior studies, we found that shading is the primary cooling mechanism, with transpiration playing a secondary role, particularly during warmer seasons. Furthermore, this study found that building shadows reduced tree-cooling effectiveness by up to 95%, consistent with other research showing that building shade can significantly diminish the cooling capacity of trees. Similarly, the greatest cooling effect was observed from trees on the south side of buildings, followed by those on the west, aligning with findings from other studies. Proper canopy spacing in this study enhanced cooling by 0.5 °C to 1.2 °C, while other research found cooling reductions of 1 °C to 3 °C in areas with less dense tree cover, with both results showing not too much variation [15]. Our study found that the cooling impact of tree transpiration was 50% greater on the hottest day compared to the coldest, demonstrating how higher temperatures enhance transpiration-driven cooling. Additionally, other research indicates that temperature increases can raise tree transpiration rates by up to 25%, further supporting the conclusion that rising temperatures amplify the cooling effect of tree transpiration [16].
5.2. Implications of the Findings
The findings of this study emphasize the importance of integrating tree characteristics, spatial conditions, and local climate into urban greening strategies. Urban planners should prioritize species with dense canopies, ensure optimal placement to maximize shading, and consider proper spacing and orientation to achieve significant cooling benefits. By understanding how local climate interacts with tree characteristics, cities like Los Angeles can enhance thermal comfort and mitigate the urban heat island effect throughout the year [26]. This provides practical guidance for urban planners, highlighting the need for tailored tree placement strategies that account for seasonal variations and local environmental conditions.
5.3. Limitations of the Study
- The analysis is entirely based on data obtained from ENVI-met simulations, without conducting field measurements under the same climatic conditions as the simulations. This does not fully account for potential discrepancies between real-world environments and the simulation results.
- The study exclusively used evergreen species and did not analyze the impact of deciduous trees, particularly in areas where they are the primary street trees, and how their leaf loss during winter affects shading. This could limit the applicability of the results to different tree species.
- Some of the findings are only applicable to areas with climates similar to that of Los Angeles and may not be suitable for cities or regions with significantly different climatic conditions.
5.4. Future Research Directions
Future research should incorporate wind and cloud coefficient analysis and explore different climate zones to refine tree placement strategies [27]. On-site temperature measurements will enhance the applicability of these findings across diverse urban contexts, helping to generalize the study’s conclusions [28]. The Sky-View Factor (SVF) is also a key factor for subsequent research, aiming to explore the relationship between the cooling capacity of trees and the height of surrounding buildings along streets [29,30]. Expanding the scope of research is also a direction for deepening the study, such as exploring how many city blocks need to have their tree-planting schemes altered to achieve a temperature reduction of over 1.5 °C in the downtown area of Los Angeles [31,32].
6. Conclusions
This study highlights the significant cooling potential of urban trees, emphasizing the importance of tree characteristics, spatial conditions, and local climate in optimizing urban greening strategies. Unlike many other studies that focus on specific time points, this research provides a more comprehensive understanding of tree-cooling patterns by examining their effects throughout all months of the year. This approach allows for a deeper and more thorough understanding of the cooling capacity of trees. Additionally, this study considers the potential drawbacks of tree cooling during winter and quantifies these against the positive cooling effects, offering a more balanced and complete assessment of trees’ impact on thermal comfort in the surrounding environment. The findings indicate that a well-designed tree-planting scheme can reduce the surrounding area’s temperature by an additional 1.5 °C throughout the year. In downtown Los Angeles, the positive cooling effects of trees during hot weather significantly outweigh the negative impacts during colder periods. By strategically placing trees to maximize shading and considering seasonal variations, cities like Los Angeles can effectively enhance thermal comfort and mitigate the urban heat island effect. The proposed tree-planting strategies offer practical guidance for urban planners and are broadly applicable, providing valuable insights for cities beyond Los Angeles.
Author Contributions
Conceptualization, Y.Z. and K.M.K.; methodology, Y.Z.; software, Y.Z.; validation, Y.Z.; formal analysis, Y.Z.; investigation, Y.Z.; resources, Y.Z. and K.M.K.; writing—original draft preparation, Y.Z.; writing—review and editing, K.M.K.; supervision, K.M.K. All authors have read and agreed to the published version of the manuscript.
Funding
This research received no external funding.
Institutional Review Board Statement
Not applicable.
Informed Consent Statement
Not applicable.
Data Availability Statement
All newly generated data are included in the article and its appendices.
Acknowledgments
I would like to sincerely thank Professor Karen Kensek for her invaluable guidance and support. She provided critical insights into my research questions, methodology, the design of control experiments, and the overall structure and language of this paper. The UHI-related papers she shared also greatly influenced and inspired my subsequent research. I would also like to express my appreciation for the ChatGPT-4 model. Since my initial draft far exceeded the journal’s recommended length, especially in the Introduction, ChatGPT-4 offered helpful suggestions on how to focus on the most relevant literature while streamlining less-pertinent reviews. It also provided useful advice on which simulation diagrams and illustrations could be moved to the Appendix A, which significantly reduced the length of the main text.
Conflicts of Interest
The authors declare no conflict of interest.
Appendix A

Figure A1.
Research area 3D model in ENVI-met.
Figure A1.
Research area 3D model in ENVI-met.


Figure A2.
Assigned materials for building façade and road surface in ENVI-met.
Figure A2.
Assigned materials for building façade and road surface in ENVI-met.


Figure A3.
Climate file setting in ENVI-met (hottest day).
Figure A3.
Climate file setting in ENVI-met (hottest day).


Figure A4.
Climate file setting in ENVI-met (coldest day).
Figure A4.
Climate file setting in ENVI-met (coldest day).


Figure A5.
Daily climate data of each month in downtown Los Angeles.
Figure A5.
Daily climate data of each month in downtown Los Angeles.


Figure A6.
February average climate data calculation.
Figure A6.
February average climate data calculation.


Figure A7.
February air-temperature average data calculation (part).
Figure A7.
February air-temperature average data calculation (part).


Figure A8.
February average climate data file in ENVI-met.
Figure A8.
February average climate data file in ENVI-met.


Figure A9.
Preliminary simulation UTCI diagram.
Figure A9.
Preliminary simulation UTCI diagram.


Figure A10.
Sidewalk area pixel-count image.
Figure A10.
Sidewalk area pixel-count image.

Table A1.
Sidewalk area average UTCI calculation.
Table A1.
Sidewalk area average UTCI calculation.
| Temperature (°C) | Number of Pixels | Percentage of the Pixels | Weight Temperature (°C) |
|---|---|---|---|
| 48.16 | 672 | 1.87% | 0.9 |
| 45.93 | 4933 | 13.74% | 6.31 |
| 43.69 | 4278 | 11.92% | 5.21 |
| 42.2 | 1405 | 3.91% | 1.65 |
| 40.71 | 3232 | 9.00% | 3.67 |
| 39.22 | 3632 | 10.12% | 3.97 |
| 37.73 | 662 | 1.84% | 0.7 |
| 36.24 | 7604 | 21.18% | 7.68 |
| 34.75 | 9477 | 26.40% | 9.17 |
| 35,895 | 100.00% | 39.25 |

Figure A11.
Coldest day UTCI diagram comparison by building shade factor at 10 a.m., 12 p.m., and 2 p.m.
Figure A11.
Coldest day UTCI diagram comparison by building shade factor at 10 a.m., 12 p.m., and 2 p.m.


Figure A12.
Coldest day sunrise, noon, and sunset time UTCI comparison (8 a.m., 12 p.m., and 5 p.m.).
Figure A12.
Coldest day sunrise, noon, and sunset time UTCI comparison (8 a.m., 12 p.m., and 5 p.m.).


Figure A13.
New tree scheme layout 2D map.
Figure A13.
New tree scheme layout 2D map.


Figure A14.
Full-site no tree 3D model in ENVI-met.
Figure A14.
Full-site no tree 3D model in ENVI-met.


Figure A15.
Full-site existing trees’ 3D model in ENVI-met.
Figure A15.
Full-site existing trees’ 3D model in ENVI-met.

Table A2.
Full-site no trees’ average temperature at 12 p.m.
Table A2.
Full-site no trees’ average temperature at 12 p.m.
| Temperature (°C) | Number of Pixels | Percentage of the Pixels | Weight Temperature (°C) |
|---|---|---|---|
| 47.1 | 5830 | 16.87% | 7.95 |
| 46 | 560 | 1.62% | 0.75 |
| 45.2 | 15,587 | 45.10% | 20.39 |
| 43.3 | 3370 | 9.75% | 4.22 |
| 41.4 | 259 | 0.75% | 0.31 |
| 40.5 | 150 | 0.43% | 0.18 |
| 39.6 | 1379 | 3.99% | 1.58 |
| 37.7 | 3093 | 8.95% | 3.37 |
| 36.8 | 127 | 0.37% | 0.14 |
| 35.9 | 3752 | 10.86% | 3.37 |
| 34 | 453 | 1.31% | 0.45 |
| 32.2 | 0 | 0.00% | 0 |
| 30.4 | 0 | 0.00% | 0 |
| 29.4 | 0 | 0.00% | 0 |
| 34,560 | 100.00% | 43.22 |
Table A3.
Full-site existing trees’ average temperature at 12 p.m.
Table A3.
Full-site existing trees’ average temperature at 12 p.m.
| Temperature (°C) | Number of Pixels | Percentage of the Pixels | Weight Temperature (°C) |
|---|---|---|---|
| 47.1 | 4576 | 13.17% | 6.2 |
| 46 | 344 | 0.99% | 0.46 |
| 45.2 | 7693 | 22.14% | 10.01 |
| 43.3 | 5212 | 15.00% | 6.5 |
| 41.4 | 2220 | 6.39% | 2.65 |
| 40.5 | 420 | 1.21% | 0.49 |
| 39.6 | 1360 | 3.91% | 1.55 |
| 37.7 | 2544 | 7.32% | 2.76 |
| 36.8 | 241 | 0.69% | 0.17 |
| 35.9 | 3791 | 10.91% | 3.92 |
| 34 | 2440 | 7.02% | 2.39 |
| 32.2 | 2439 | 7.02% | 2.39 |
| 30.4 | 1407 | 4.05% | 1.23 |
| 29.4 | 57 | 0.16% | 0.05 |
| 34,744 | 100.00% | 40.71 |
Table A4.
Full-site new trees’ average temperature at 12 p.m.
Table A4.
Full-site new trees’ average temperature at 12 p.m.
| Temperature (°C) | Number of Pixels | Percentage of the Pixels | Weight Temperature (°C) |
|---|---|---|---|
| 47.1 | 3330 | 8.45% | 3.98 |
| 46 | 560 | 1.42% | 0.65 |
| 45.2 | 6687 | 16.97% | 7.67 |
| 43.3 | 2770 | 7.03% | 3.04 |
| 41.4 | 259 | 0.66% | 0.27 |
| 40.5 | 150 | 0.38% | 0.12 |
| 39.6 | 3569 | 9.06% | 3.59 |
| 37.7 | 4360 | 11.57% | 4.36 |
| 36.8 | 127 | 0.32% | 0.12 |
| 35.9 | 4577 | 11.61% | 4.49 |
| 34 | 5679 | 14.41% | 4.9 |
| 32.2 | 3456 | 8.77% | 2.82 |
| 30.4 | 1345 | 3.41% | 1.05 |
| 29.4 | 2345 | 5.95% | 1.39 |
| 39,414 | 100.00% | 38.51 |

Figure A16.
Full-site no trees’ coldest day at 12 p.m.
Figure A16.
Full-site no trees’ coldest day at 12 p.m.


Figure A17.
Full-site existing trees coldest day at 12 p.m.
Figure A17.
Full-site existing trees coldest day at 12 p.m.


Figure A18.
Full-site new trees’ coldest day at 12 p.m.
Figure A18.
Full-site new trees’ coldest day at 12 p.m.


Figure A19.
Existing trees’ and new trees’ UTCI diagram at 12 p.m. (January).
Figure A19.
Existing trees’ and new trees’ UTCI diagram at 12 p.m. (January).


Figure A20.
Existing trees’ and new trees’ UTCI diagram at 12 p.m. (February).
Figure A20.
Existing trees’ and new trees’ UTCI diagram at 12 p.m. (February).


Figure A21.
Existing trees’ and new trees’ UTCI diagram at 12 p.m. (March).
Figure A21.
Existing trees’ and new trees’ UTCI diagram at 12 p.m. (March).


Figure A22.
Existing trees’ and new trees’ UTCI diagram at 12 p.m. (April).
Figure A22.
Existing trees’ and new trees’ UTCI diagram at 12 p.m. (April).


Figure A23.
Existing trees’ and new trees’ UTCI diagram at 12 p.m. (May).
Figure A23.
Existing trees’ and new trees’ UTCI diagram at 12 p.m. (May).


Figure A24.
Existing trees’ and new trees’ UTCI diagram at 12 p.m. (June).
Figure A24.
Existing trees’ and new trees’ UTCI diagram at 12 p.m. (June).


Figure A25.
Existing trees’ and new trees’ UTCI diagram 12 p.m. (July).
Figure A25.
Existing trees’ and new trees’ UTCI diagram 12 p.m. (July).


Figure A26.
Existing trees’ and new trees’ UTCI diagram at 12 p.m. (August).
Figure A26.
Existing trees’ and new trees’ UTCI diagram at 12 p.m. (August).


Figure A27.
Existing trees’ and new trees’ UTCI diagram at 12 p.m. (September).
Figure A27.
Existing trees’ and new trees’ UTCI diagram at 12 p.m. (September).


Figure A28.
Existing trees’ and new trees’ UTCI diagram at 12 p.m. (October).
Figure A28.
Existing trees’ and new trees’ UTCI diagram at 12 p.m. (October).


Figure A29.
Existing trees’ and new trees’ UTCI diagram at 12 p.m. (November).
Figure A29.
Existing trees’ and new trees’ UTCI diagram at 12 p.m. (November).


Figure A30.
Existing trees’ and new trees’ UTCI diagram at 12 p.m. (December).
Figure A30.
Existing trees’ and new trees’ UTCI diagram at 12 p.m. (December).

References
- LaDochy, S.; Torres, T.; Hsu, Y.F. Los Angeles’ Urban Heat Island Continues to Grow: Urbanization, Land Use Change Influences. J. Urban Environ. Eng. 2021, 15, 103–116. [Google Scholar] [CrossRef]
- Wikipedia. Climate of Los Angeles. Available online: https://en.wikipedia.org/wiki/Climate_of_Los_Angeles (accessed on 21 January 2024).
- De Azevedo, J.A. Urban Heat and Energy Demand: Application of an Urban Meteorological Network. Ph.D. Thesis, University of Birmingham, Birmingham, UK, 2016. [Google Scholar]
- Chan, E.Y.; Kim, J.H.; Lee, P.; Lin, C. Analysis of Health Risk Perception and Behavior Changes during Elevated Temperatures for an Urban Chinese Population. Prehosp. Disaster Med. 2011, 26, s23–s24. [Google Scholar] [CrossRef]
- Kang, H.; Zhu, B.; de Leeuw, G.; Yu, B.; van der A, R.J.; Lu, W. Impact of Urban Heat Island on Inorganic Aerosol in the Lower Free Troposphere: A Case Study in Hangzhou, China. Atmos. Chem. Phys. 2022, 22, 12345–12367. [Google Scholar] [CrossRef]
- Li, L.; Yu, Q.; Gao, L.; Yu, B.; Lu, Z. The Effect of Urban Land-Use Change on Runoff Water Quality: A Case Study in Hangzhou City. Int. J. Environ. Res. Public Health 2021, 18, 10748. [Google Scholar] [CrossRef]
- Ko, J.; Schlaerth, H.; Bruce, A.; Sanders, K.; Ban-Weiss, G. Measuring the Impacts of a Real-World Neighborhood-Scale Cool Pavement Deployment on Albedo and Temperatures in Los Angeles. Environ. Res. Lett. 2022, 17, 044027. [Google Scholar] [CrossRef]
- Wang, C.; Wang, Z.H.; Yang, J. Cooling Effect of Urban Trees on the Built Environment of Contiguous United States. Earth’s Future 2018, 6, 1066–1081. [Google Scholar] [CrossRef]
- Ngao, J.; Cárdenas, M.L.; Améglio, T.; Colin, J.; Saudreau, M. Implications of Urban Land Management on the Cooling Properties of Urban Trees: Citizen Science and Laboratory Analysis. Sustainability 2021, 13, 13656. [Google Scholar] [CrossRef]
- Yun, S.H.; Park, C.Y.; Kim, E.S.; Lee, D.K. A Multi-Layer Model for Transpiration of Urban Trees Considering Vertical Structure. Forests 2020, 11, 1164. [Google Scholar] [CrossRef]
- Zhang, R.; Zhao, Z. Giant Trees Exhibited Great Cooling Effect in Residential Area Southwest of China. Forests 2022, 13, 1516. [Google Scholar] [CrossRef]
- Vo, T.T.; Hu, L. Diurnal Evolution of Urban Tree Temperature at a City Scale. Sci. Rep. 2021, 11, 10491. [Google Scholar] [CrossRef]
- Yan, S.; Zhang, T.; Wu, Y.; Lv, C.; Qi, F.; Chen, Y.; Wu, X.; Shen, Y. Cooling Effect of Trees with Different Attributes and Layouts on the Surface Heat Island of Urban Street Canyons in Summer. Atmosphere 2023, 14, 857. [Google Scholar] [CrossRef]
- Heat Island Effect. Available online: https://www.epa.gov/heatislands/ (accessed on 21 January 2024).
- Zhao, Q.; Wentz, E.A.; Murray, A.T. Tree Shade Coverage Optimization in an Urban Residential Environment. Build. Environ. 2017, 115, 269–280. [Google Scholar] [CrossRef]
- Winbourne, J.B.; Jones, T.S.; Garvey, S.M.; Harrison, J.L.; Wang, L.; Li, D.; Hutyra, L.R. Tree Transpiration and Urban Temperatures: Current Understanding, Implications, and Future Research Directions. BioScience 2020, 70, 576–588. [Google Scholar] [CrossRef]
- Wu, Z.; Chen, L.-D. Optimizing the Spatial Arrangement of Trees in Residential Neighborhoods for Better Cooling Effects: Integrating Modeling with In-Situ Measurements. Landsc. Urban Plan. 2017, 167, 463–472. [Google Scholar] [CrossRef]
- He, C.; Zhou, L.; Yao, Y.; Ma, W.; Kinney, P.L. Cooling Effect of Urban Trees and Its Spatiotemporal Characteristics: A Comparative Study. Build. Environ. 2021, 204, 108103. [Google Scholar] [CrossRef]
- Coutts, A.M.; White, E.C.; Tapper, N.J.; Beringer, J.; Livesley, S.J. Temperature and Human Thermal Comfort Effects of Street Trees across Three Contrasting Street Canyon Environments. Theor. Appl. Climatol. 2016, 124, 55–68. [Google Scholar] [CrossRef]
- Thermal Comfort Indices. Available online: https://climate-adapt.eea.europa.eu/en/metadata/indicators/thermal-comfort-indices-universal-thermal-climate-index-1979-2019 (accessed on 21 January 2024).
- Błażejczyk, K.; Matzarakis, A.; Baranowski, J. Geoecological Evaluation of Local Surroundings for the Purposes of Recreational Tourism. Misc. Geogr. 2014, 18, 5–12. [Google Scholar]
- Ouyang, W.; Sinsel, T.; Simon, H.; Morakinyo, T.E.; Liu, H.; Ng, E. Evaluating the thermal-radiative performance of ENVI-met model for green infrastructure typologies: Experience from a subtropical climate. Buildings 2022, 207, 108427. [Google Scholar] [CrossRef]
- Ayyad, Y.; Sharples, S. Envi-MET Validation and Sensitivity Analysis Using Field Measurements in a Hot Arid Climate. IOP Conf. Ser. Earth Environ. Sci. 2019, 329, 012040. [Google Scholar] [CrossRef]
- Donovan, G.H.; Butry, D.T. The Value of Shade: Estimating the Effect of Urban Trees on Summertime Electricity Use. Energy Build. 2009, 41, 662–668. [Google Scholar] [CrossRef]
- Yin, Y.; Li, S.; Xing, X.; Zhou, X.; Kang, Y.; Hu, Q.; Li, Y. Cooling Benefits of Urban Tree Canopy: A Systematic Review. Sustainability 2024, 16, 4955. [Google Scholar] [CrossRef]
- Gill, S.E.; Handley, J.F.; Ennos, A.R.; Pauleit, S. Adapting Cities for Climate Change: The Role of the Green Infrastructure. Built Environ. 2007, 33, 115–133. [Google Scholar] [CrossRef]
- Morakinyo, T.E.; Kong, L.; Lau, K.K.-L.; Yuan, C.; Ng, E. Urban Tree Design Approaches for Mitigating Daytime Urban Heat Island Effects in a High-Density Urban Environment. Energy Build. 2017, 114, 379–386. [Google Scholar]
- Rahman, M.A.; Moser, A.; Gold, A.; Rötzer, T.; Pauleit, S. Vertical Air Temperature Gradients under the Shade of Two Contrasting Urban Tree Species during Different Types of Summer Days. Sci. Total Environ. 2017, 633, 100–111. [Google Scholar] [CrossRef] [PubMed]
- Morakinyo, T.E.; Lam, Y.F.; Ng, E. Right Tree, Right Place (Urban Canyon): Tree Species Selection Approach for Optimum Urban Heat Mitigation—Development and Evaluation. Urban For. Urban Green. 2018, 34, 251–262. [Google Scholar] [CrossRef]
- Morakinyo, T.E.; Kong, L.; Lau, K.K.-L.; Yuan, C.; Ng, E. A Study on the Impact of Shadow-Cast and Tree Species on In-Canyon and Neighborhood’s Thermal Comfort. Build. Environ. 2016, 115, 1–17. [Google Scholar] [CrossRef]
- Zhang, Y.; Murray, A.T.; Turner, B.L. Optimizing Green Space Locations to Reduce Daytime and Nighttime Urban Heat Island Effects in Phoenix, Arizona. Landsc. Urban Plan. 2017, 165, 162–171. [Google Scholar] [CrossRef]
- Ng, E.; Chen, L.; Wang, Y.; Yuan, C. A Study on the Cooling Effects of Greening in a High-Density City: An Experience from Hong Kong. Build. Environ. 2012, 47, 256–271. [Google Scholar] [CrossRef]


Disclaimer/Publisher’s Note: The statements, opinions and data contained in all publications are solely those of the individual author(s) and contributor(s) and not of MDPI and/or the editor(s). MDPI and/or the editor(s) disclaim responsibility for any injury to people or property resulting from any ideas, methods, instructions or products referred to in the content. |
© 2024 by the authors. Licensee MDPI, Basel, Switzerland. This article is an open access article distributed under the terms and conditions of the Creative Commons Attribution (CC BY) license (https://creativecommons.org/licenses/by/4.0/).