Article

Integrated Pricing and Inventory Decisions for Product Quality-Driven Extended Warranty Services

by
Wendi Zha
1,
Zhenyong Wu
1,*,
Jianxin Tan
1,
Yiming Chen
1,
Yaping Fu
2 and
Zhitao Xu
3
1
School of Management Science and Engineering, Nanjing University of Information Science & Technology, Nanjing 210044, China
2
School of Business, Qingdao University, Qingdao 266071, China
3
College of Economics and Management, Nanjing University of Aeronautics and Astronautics, Nanjing 211106, China
*
Author to whom correspondence should be addressed.
Sustainability 2024, 16(20), 8769; https://doi.org/10.3390/su16208769
Submission received: 22 August 2024 / Revised: 30 September 2024 / Accepted: 7 October 2024 / Published: 11 October 2024
(This article belongs to the Special Issue Sustainable Supply Chain Management in Industry 4.0)

Abstract

:
Extended warranty services have become increasingly important for both manufacturers and retailers, offering avenues for new profit sources and growth opportunities. Focusing on the multiple effects of product quality, this study develops a two-period supply chain decision model to analyze the effects of product quality, pricing, and inventory management in the context of extended warranty services. Using a Stackelberg dynamic game model, this study examines the interaction between a manufacturer and a dominant retailer who provides extended warranties. The results indicate significant differences in optimal decisions between centralized and decentralized supply chains, especially concerning pricing and inventory control. Introducing a “quality cost-sharing” contract enhances product quality and improves coordination, leading to increased profits for both the manufacturer and the retailer. Numerical simulations confirm that the cost-sharing contract effectively balances product quality improvements with supply chain profitability.

1. Introduction

In the era of electronic information and big data, competition in the market is intensifying. Consumers today not only demand high product quality but also value comprehensive after-sales services. As a result, the “product + service” model is being promoted to better meet these evolving consumer expectations [1]. Among after-sales services, both basic warranty services and extended warranty services play a crucial role. Extended warranty services, which provide coverage beyond the standard warranty period, have become particularly important in certain industries, such as home appliances and automobiles, and their adoption is expanding into other fields [2].
Extended warranty services not only enhance customer satisfaction but also increase the added value of products, offering enterprises a competitive edge [3]. For manufacturers and retailers, the ability to provide extended warranties has created new market opportunities, as more consumers are willing to pay additional fees for higher value and prolonged product protection [4]. However, this has also introduced challenges related to pricing and coordination among supply chain members, as extended warranty services come with risks of adverse selection and moral hazard due to information asymmetry [5]. The literature on extended warranty services and pricing is extensive. However, relatively few studies address the joint pricing of products and extended warranties in the context of supply chain coordination. Prior research highlights the need for collaboration between manufacturers and retailers to optimize pricing strategies and inventory management [6,7]. In this study, we address this gap by examining the joint pricing and inventory strategies for products and extended warranty services within a two-period supply chain system.
The objective of this study is to develop a decision-making framework that maximizes the profits of both manufacturers and retailers by coordinating product pricing and extended warranty service pricing. Specifically, we aim to answer the following questions: (1) How does product quality affect the pricing and profitability of extended warranties? (2) How can manufacturers and retailers optimize their pricing strategies to achieve better coordination in the supply chain? By analyzing these questions, we provide practical insights for enterprises seeking to improve their market competitiveness through optimized pricing and coordination strategies.
This paper is structured accordingly. Section 2 contains a review of the extant literature. A two-period supply chain decision model for product extended warranty service is provided in Section 3. Section 4 discusses the supply chain coordination contract model based on extended warranty service. In Section 5, the numerical simulation and analysis are design and developed. Finally, in Section 6, this paper presents our conclusions and suggestions for future research.

2. Literature Review

With the rapid growth of the extended warranty market, numerous studies have focused on analyzing extended warranty services, particularly within supply chains comprising manufacturers and retailers. These studies have examined how extended warranty pricing interacts with factors such as product quality, warranty duration, and consumer behavior. To address these topics, researchers have often employed game theory and modeling techniques to derive optimal decision-making strategies.

2.1. Product Extended Warranty

Extended warranty services have been adopted by sales agencies as a marketing strategy to attract consumers and boost sales. Recently, these services have been extensively promoted in various sectors, such as home appliances and automobiles. Day et al. conducted some of the earliest research on extended warranties abroad, defining them as parts and labor services provided by the manufacturer after the standard warranty period. They categorized service providers into three groups: suppliers, retailers, and third-party organizations [1,2]. Kim et al. suggest that offering extended warranties before the purchase decision can be an effective way to increase warranty sales [3]. Chen et al. explore decision-making issues within the supply chain under various information environments and power structures, proposing a backward induction algorithm to achieve optimal results [4]. Wu et al. and Zheng et al. provide a numerical example to demonstrate the effectiveness of their approach, along with a graphical representation to support practical maintenance implementation [5,6]. Their findings indicate that retailers can achieve similar profit levels by enhancing customer satisfaction and product sustainability through repair actions [7]. Liu et al. find that a retailer’s extended warranty does not necessarily harm the manufacturer’s profit and that there is an optimal extended warranty length that maximizes the manufacturer’s profit [8]. Li et al. propose that both the platform and manufacturer can achieve a win–win situation by offering extended warranties simultaneously, but only if the potential market size is sufficiently large [9]. Cui et al. suggest that e-commerce platforms are unlikely to offer extended warranties if the manufacturer’s base warranty period is long [10]. Zhang et al. show that manufacturers prefer to offer transferable extended warranties when the service cost is low and non-transferable warranties when the cost is high [11]. Wang et al. develop a dynamic integration model to determine optimal product and two-dimensional extended warranty prices in a multi-stage dynamic market environment, aiming to maximize the dealer’s expected discounted profit throughout the product life cycle [12,13]. He et al. construct three game-theoretic models to compare retail prices, supply chain profits, and customer-perceived service quality of extended warranties [14].

2.2. Extended Warranty Pricing Strategy

To enhance the market impact of extended warranty services, numerous scholars have investigated pricing strategies. Salmasnia et al. propose an optimized after-sales model that includes four factors: the basic warranty period, extended warranty period, preventive maintenance level, and preventive maintenance issues. They consider both manufacturer and buyer satisfaction to compare the optimization results of these factors [15,16]. Zheng et al. find that there is no absolute difference between traditional and flexible extended warranties; the effectiveness depends on the manufacturer’s warranty cost efficiency and the total warranty period [17]. Ai et al. examine the direct sale of extended warranty services by manufacturers to consumers, achieving Pareto improvements through quantity discount contracts for retailers, whether in competitive environments or not [18]. Zhang et al. explore pricing and warranty decisions in a dual-channel supply chain from the perspective of product quality signals, analyzing how the proportion of direct sales channel buyers and online review quality signals affect supply chain entities [19]. Ma et al. develop a model involving the three largest online direct retailers to study the impact of extended warranty services on product pricing, creating both a single-period static game model and a dynamic game model with two delays [20]. Gupta et al. design a new price curve for optimal extended warranty policies, addressing perfect, minimal, and imperfect repairs for both one-dimensional and two-dimensional problems [21]. Qu et al. propose a reference budget model to determine a feasible budget range [22]. Liu et al. introduce a new trend in warranty policies, the complementary extended warranty, which offers customers a free extended warranty if they register online before the base warranty expires [23]. Vafaeinejad et al. demonstrate that optimal warranty length and trade-in price depend on factors, such as production costs, failure distributions, innovation, and strategy levels [24]. Zhu et al. investigate the impact of limited maintenance capacity and explore the joint optimization of capacity investment and marketing strategy [25]. Zhang et al. present a systematic warranty–reliability–price combination decision model for repairable products with a two-dimensional free replacement–repair warranty [26]. Taleizadeh et al. emphasize the importance of considering the covariance among different model claims when offering optimal warranty policies and pricing strategies in online channels [27]. Liang et al. focus on SHapley Additive exPlanations value, which was performed to explain the impact of variables in the model on the incidence. [28]. Cui et al. focus on fixed point theory which is used to analyze properties of the CNO's optimal charging pricing problem. [29].

2.3. Coordination Contract

A supply chain contract refers to the relevant clauses that ensure coordination between buyers and sellers, optimizing sales channel performance through appropriate information and incentives. It primarily addresses two issues affecting overall supply chain efficiency: the double marginalization resulting from members pursuing self-interest maximization and the bullwhip effect caused by information asymmetry. Pasternack was the first to propose optimal wholesale prices and return policies for perishable goods [30]. Zhang et al. develop a side-payment self-enforcing contract aimed at reducing the green innovation risk faced by risk-averse manufacturers, acknowledging the inefficiencies of decentralized models under risk aversion [31]. Yu et al. introduce contracts, such as the altruistic preference joint two-part tariff contract and the altruistic preference joint profit-sharing contract, which can effectively coordinate poverty alleviation supply chains [32]. Both Zhang et al. and Yu et al. examine how a manufacturer can implement a reward contract to achieve supply chain coordination when a retailer’s service effort has a showrooming effect. Peng et al. introduce a side-payment self-enforcing contract which is designed to reduce the green innovation risk of risk-averse manufacturers [33]. Zhang et al. demonstrate that the manufacturer's reward contract increases retail prices and benefits the retailer but may hurt the manufacturer [34]. Luo et al. suggest that adjusting contract and financing parameters only alters profit distribution among members without affecting overall system coordination, particularly in the context of empty container leasing decisions and the coordination challenges of dual-channel container transportation services under stochastic demand and financial constraints on carriers [35]. Liang et al. construct a multi-objective integer programming model to reach the comprehensive sustainability and global optimization of disassembling multiple end-of-life products [36]. Zhu et al. highlight the significant impact of channel power structures, remanufacturing cost savings, and dual price sensitivity on supply chains and corporate profits [37]. Pnina propose a practical coordinating contract that modifies the current industry standard to protect restaurant margins by ensuring a minimum revenue per delivery order, allowing flexible revenue allocation between the restaurant and the platform [38]. Bo et al. explore optimal two-period coordination and ordering through options and wholesale contracts within the supply chain [39]. Fu et al. formulate a stochastic multiobjective hybrid open shop scheduling problem that consists of open shop and parallel-machine models [40]. Ma et al. analyze the fuel economy improvement levels and the production of traditional internal combustion engine vehicles versus new engine vehicles using a game-theoretic approach [41]. Wang et al. indicate that altruistic preferences could enhance profits and system efficiency for small and medium-sized manufacturers but may reduce retailer profits [42]. Lin et al. construct five Stackelberg game models based on the differences of supply chain information transparency and power structure [43].

2.4. Analysis of Current Research Status

While significant advancements have been made in understanding extended warranties, gaps remain in addressing joint pricing and inventory strategies within the product extended warranty context. Most studies have focused on pricing strategies or product quality independently, but few have explored how these factors interact with inventory management over multiple periods. This paper establishes a decision-making framework to maximize the profits of manufacturers and retailers by coordinating product pricing and extended warranty service pricing. It mainly studies the impact of product quality on the pricing and profitability of extended warranty, optimizes the pricing strategies of manufacturers and retailers to achieve better supply chain coordination, and improves market competitiveness by optimizing pricing and coordination strategies.
This paper contributes to the literature by developing a two-period supply chain model that incorporates both product quality and inventory considerations, using a Stackelberg game to derive optimal strategies. The model also introduces a cost-sharing coordination contract to evaluate performance improvements after coordination, offering insights into optimal pricing and inventory management strategies in the extended warranty context.

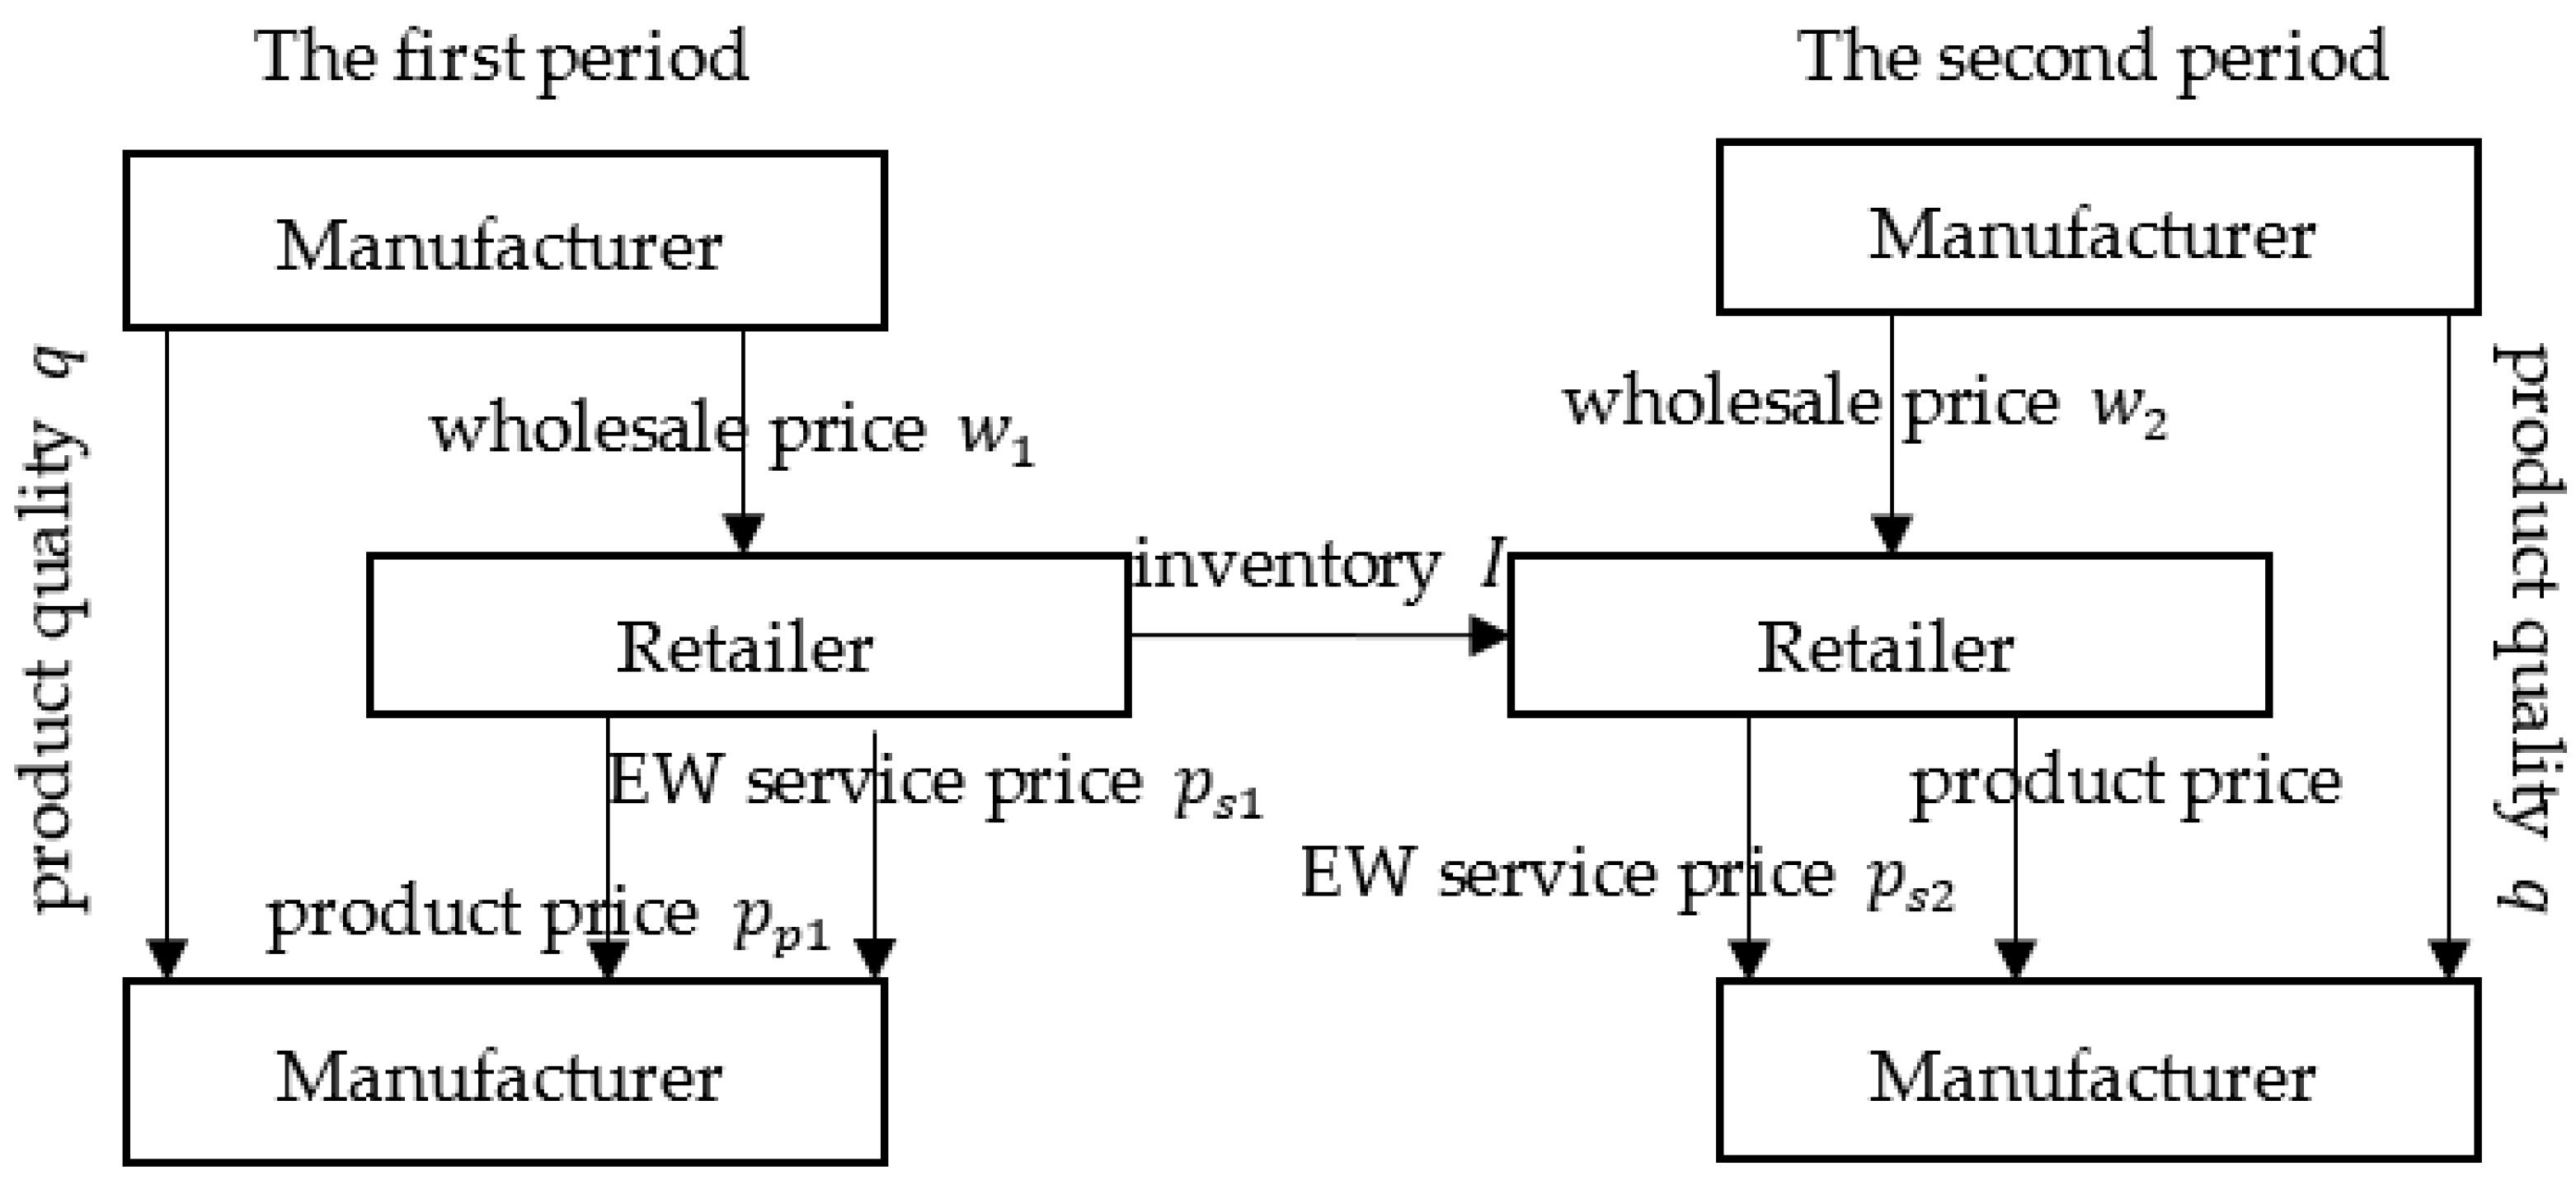
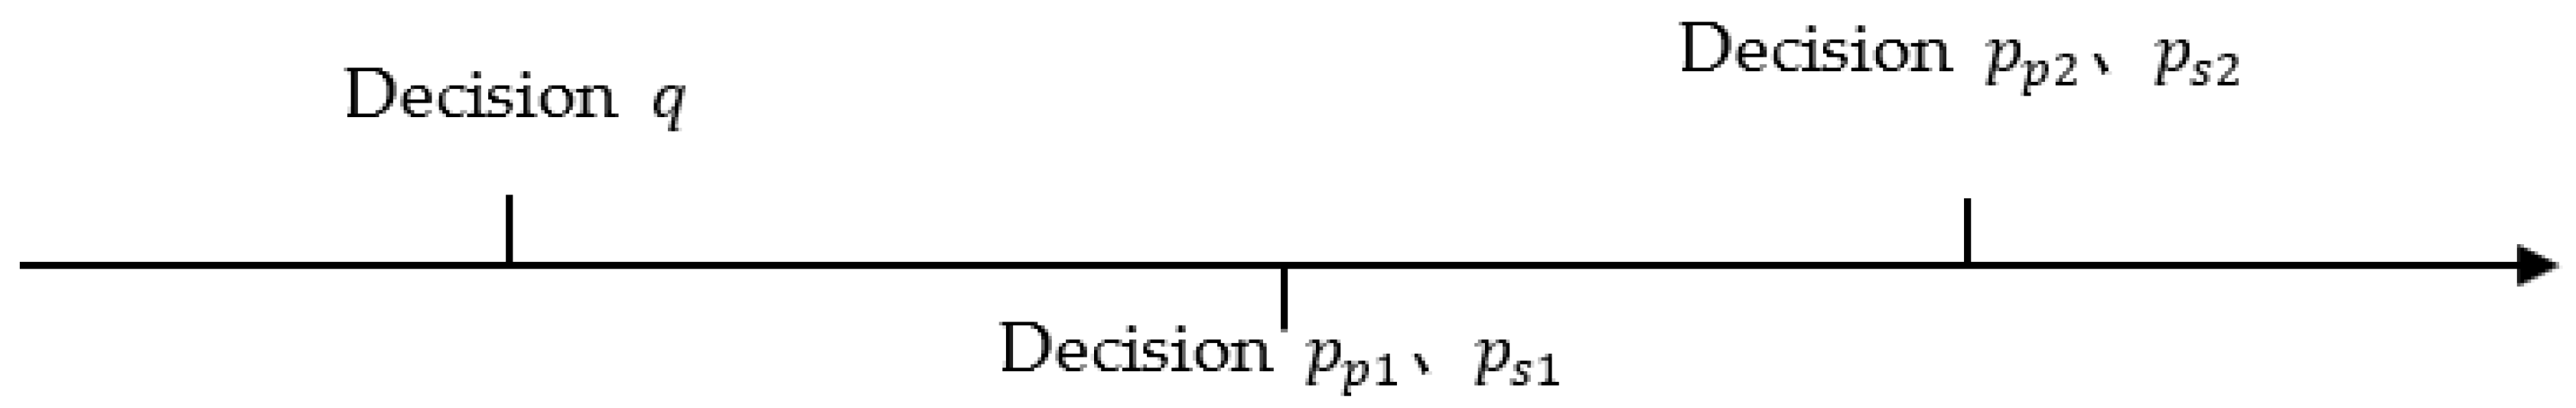
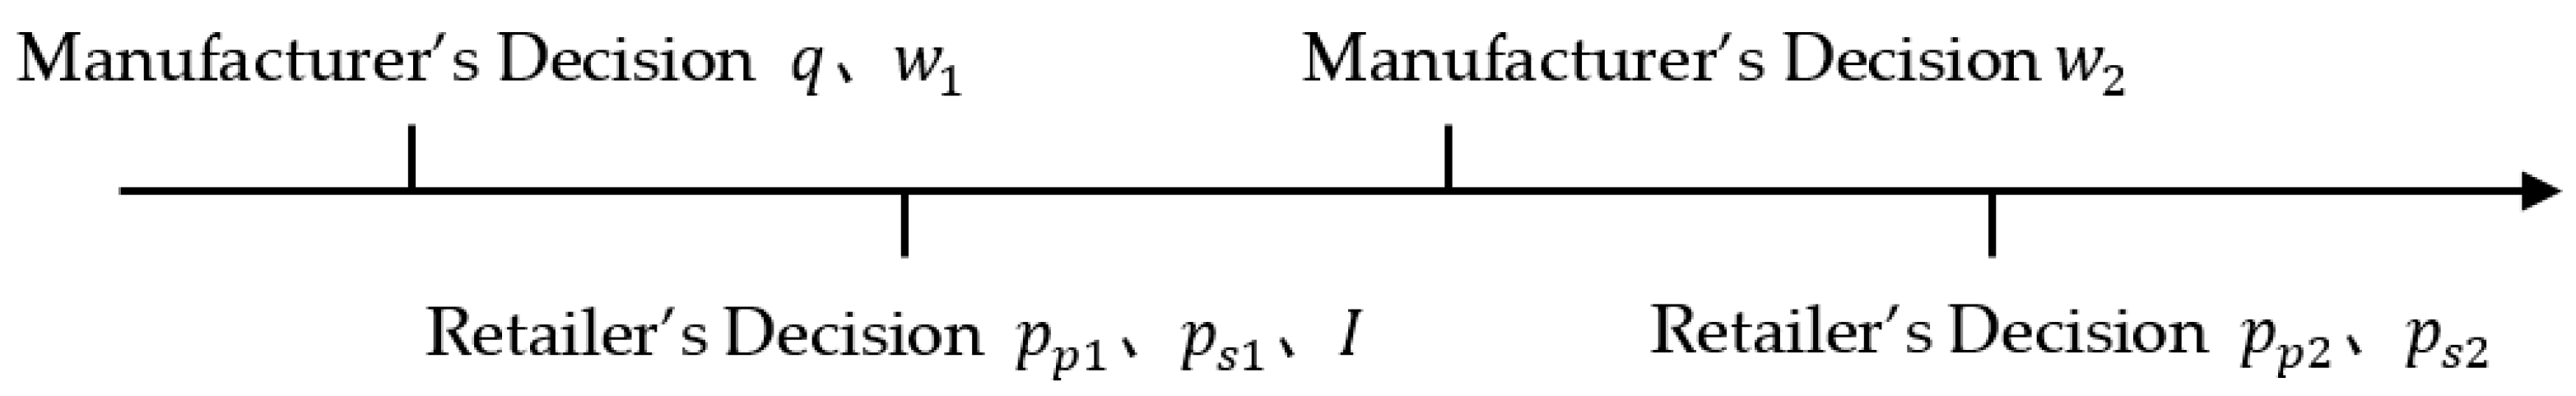
3. Supply Chain Decision Model for Two-Period Product Extended Warranty Service

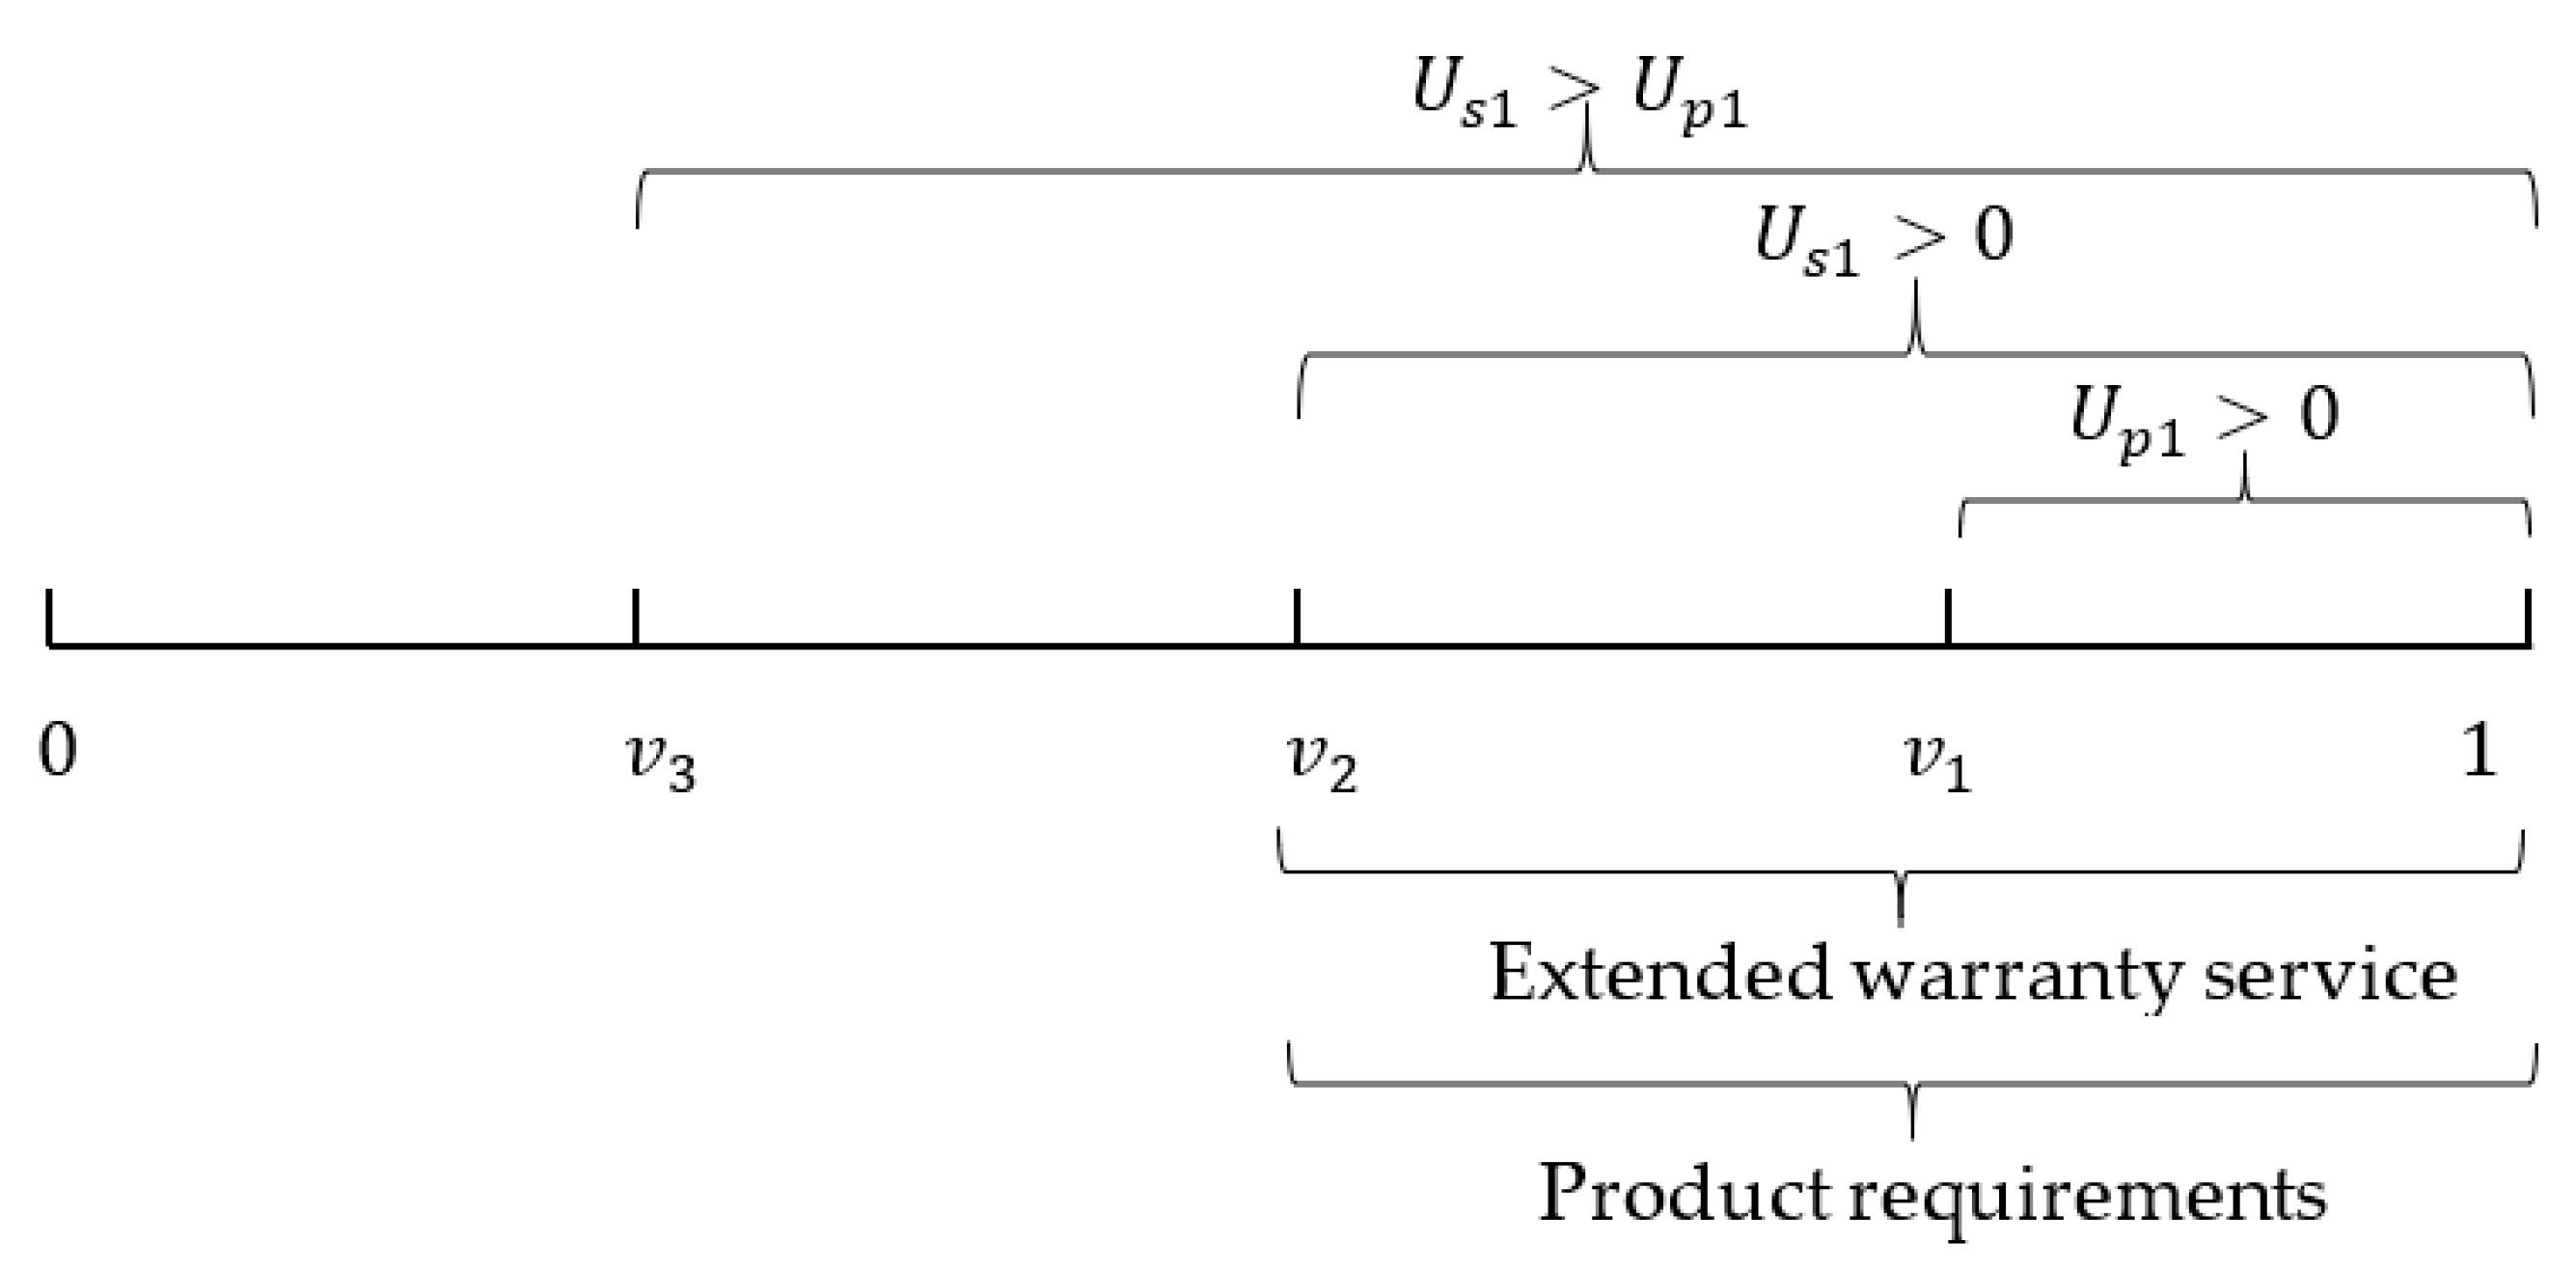
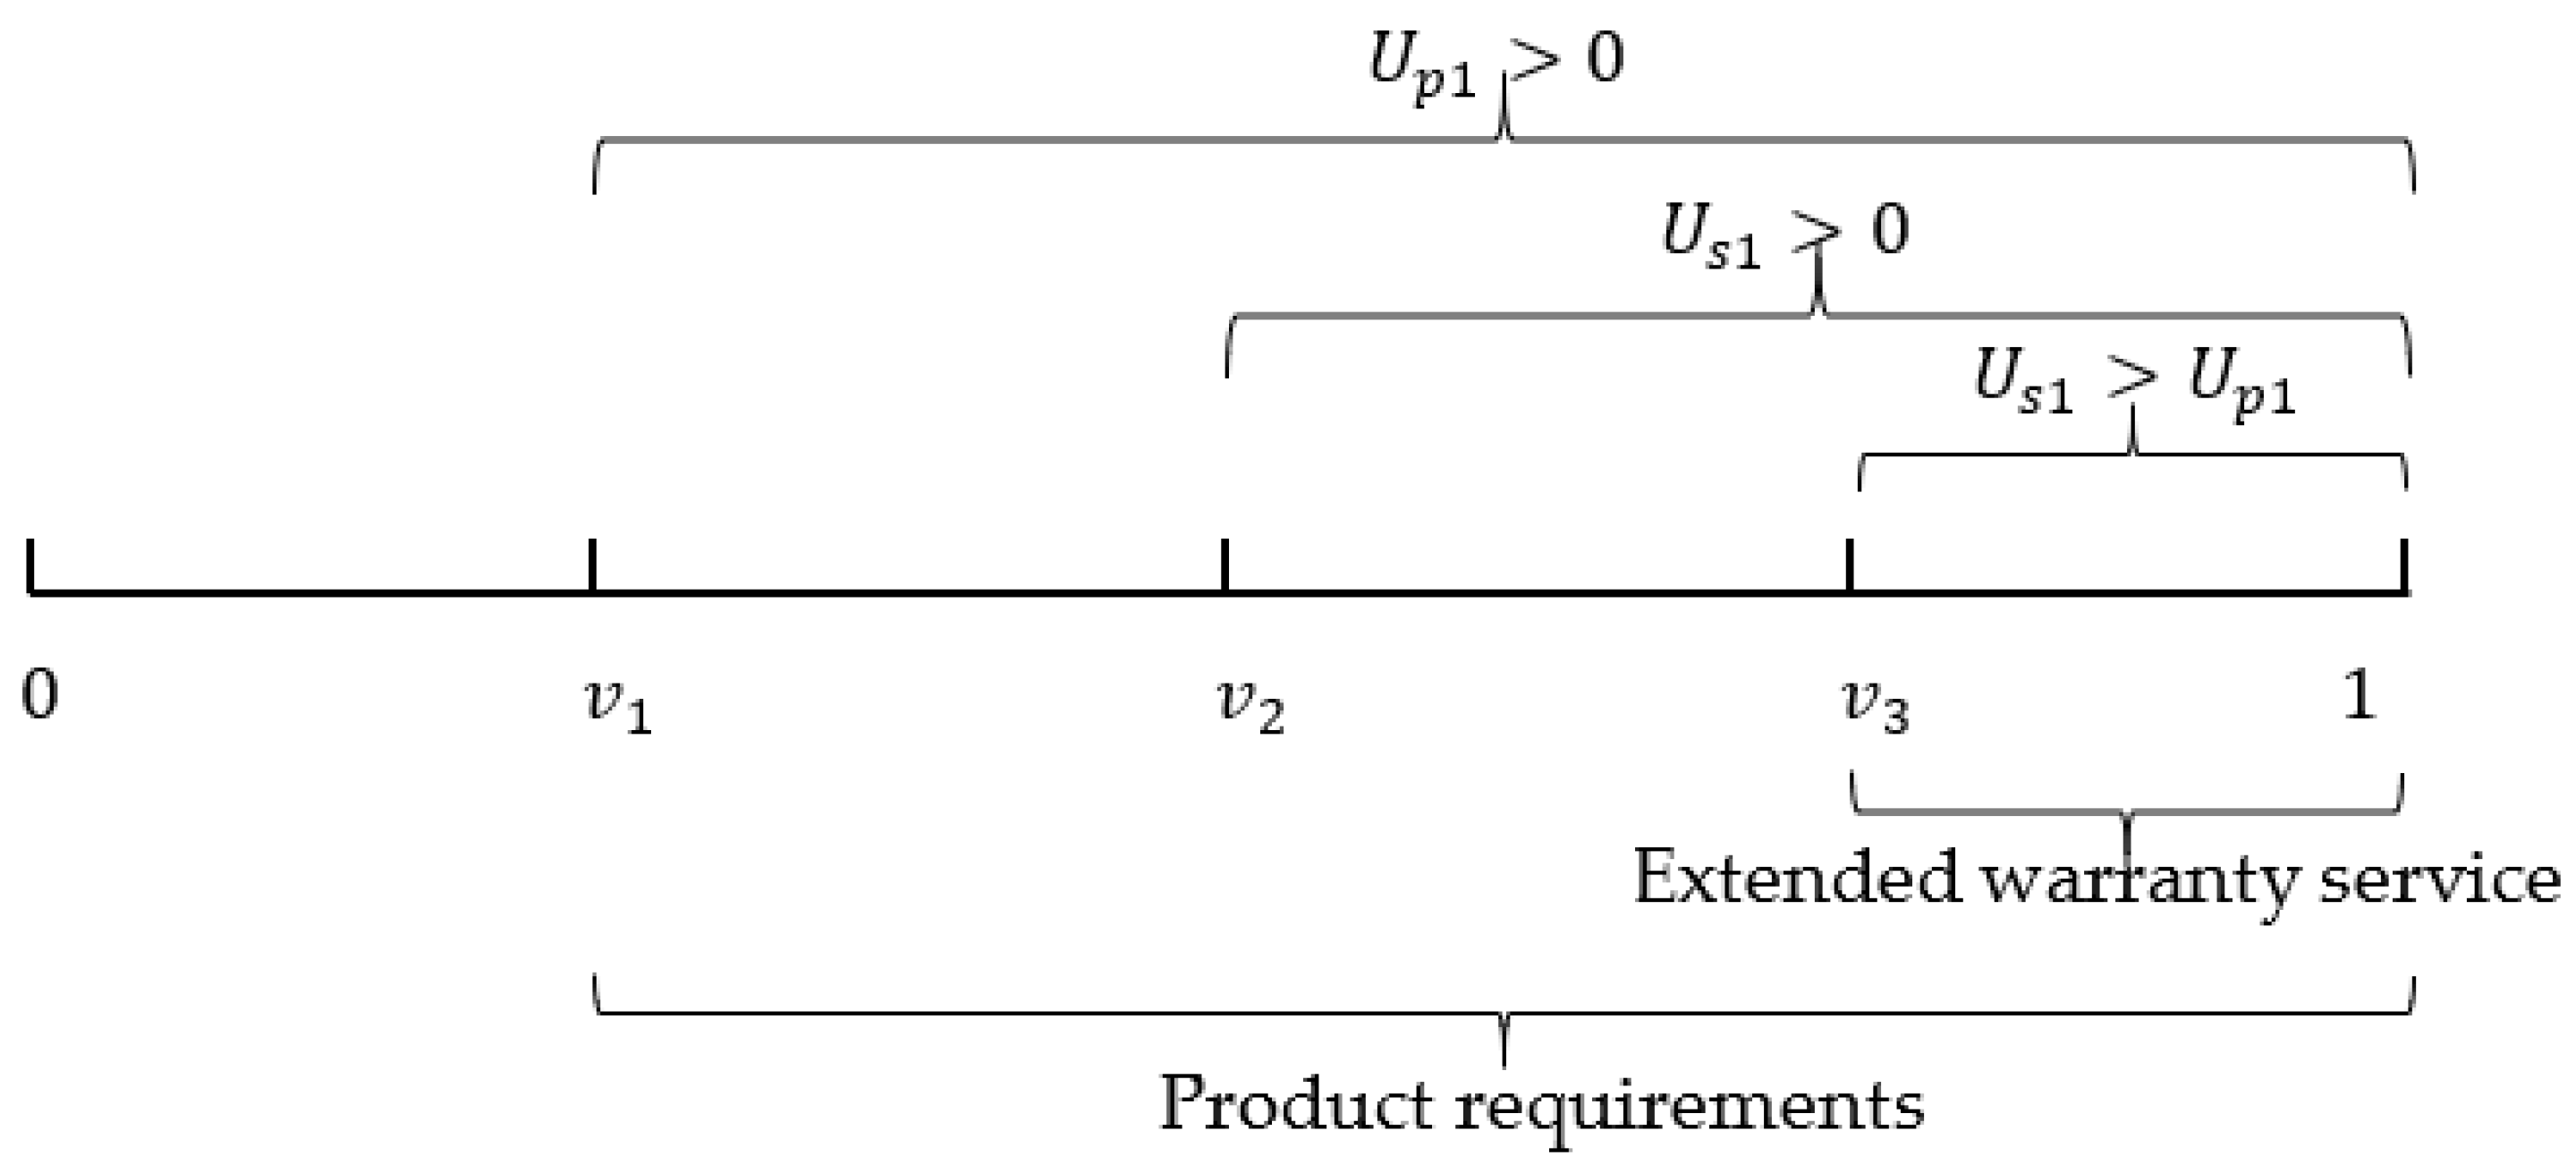
3.1. Core Assumptions

This paper considers a two-period product service supply chain in which manufacturers produce products and wholesale them to retailers, and retailers provide products and extended warranty services to consumers, in which each enterprise aims to maximize its own interests. The manufacturer produces and provides products with a product cost of c and a product quality level of q .
In this model, the product involves two period of sales. In the first sales period, the manufacturer first provides the product to the retailer at a wholesale price of w 1 . The quantity of product purchased by the retailer is Q , which is determined by the product demand D p 1 and the inventory I to be sold in the second period. After that, the retailer sells the product to the consumer, where the product price is p p 1 and the extended warranty service price is p s 1 . The unit product inventory cost is h . In the second sales period, the manufacturer determines the wholesale price w 2 based on the decision made in the first sales period, and the retailer determines the product price p p 2 and the extended warranty service price p s 2 in the second period. Assume that the product quality is continuous and its quality increases with the increase in the improvement cost of the input, as shown in Figure 1, assuming c w 1 p p 1 ,   c w 2 p p 2 .
Retailers provide extended warranty services to consumers during both sales periods, and consumers can choose product services on their own. If the extended warranty service is purchased and the product fails, the unit product extended warranty service cost of the required repair and maintenance is c s , which is borne by the retailer.
Assume that consumers only purchase one product at most in a sales period and have only one opportunity to purchase the extended warranty service. D s 1 and D s 2 are the extended warranty service demands in the first and second periods, respectively. D s 1 δ and D s 2 δ represent the number of products that fail in the period and can enjoy extended warranty service, respectively, where δ represents the product failure rate. Assume that there is a linear relationship between product failure rate and product quality, expressed as δ = 1 η q , where η represents the failure coefficient. Assume that the cost of improving the product quality for the manufacturer is C q , C q = 1 2 k q 2 , where k is the manufacturer’s quality cost coefficient, and when k > 0 , the product quality is observable.
Assume that if in regular use, consumers can experience the product value as v . Since consumers have different degrees of product use, it is assumed that v follows a uniform distribution of 0,1 . In the second period, since the product has gone through a sales period, consumers will have a new cognitive evaluation of the product. If the evaluation of the product changes by a coefficient of a , the product value follows a uniform distribution of 0 , a in the second period.
In the first period, if the product works normally, the utility it brings to the consumer is v ; if the product fails, it will cause the consumer to lose utility v . Consumers who purchase extended warranty services will receive repair services once the product fails, thus avoiding the utility loss caused by the failure. The utility obtained by consumers is affected by the normal use value of the product and the monetary value paid for purchasing the product and the extended warranty service.
In the first period, the utility of the consumer purchasing only the product is as follows:
U p 1 = v δ v p p 1
The utility of consumers purchasing both the product and the extended warranty service is as follows:
U s 1 = v p p 1 p s 1
Consumers are then faced with three choices: when M a x U p 1 , U s 1 , 0 = U p 1 M, only purchase the product; when M a x U p 1 , U s 1 , 0 = U s 1 , purchase both the product and the extended warranty service; when M a x U p 1 , U s 1 , 0 = 0 , choose not to purchase the product or the extended warranty service.
From U p 1 0 , v v 1 = p p 1 1 δ
From U s 1 0 , v v 2 = p p 1 + p s 1
From U s 1 U p 1 , v v 3 = p s 1 δ
When   δ p p 1 + p s 1 p s 1 , as shown in the Figure 2, there exists v 1 v 2 v 3 .
When v > v 2 , consumers purchase both the product and its extended warranty service, so the product demand is equal to the extended warranty service demand, we can obtain the following:
D p 1 = D s 1 = 1 p p 1 p s 1
It can be seen from the function that it has nothing to do with the product failure rate, which is one of the necessary factors to consider when purchasing a product. The function does not conform to reality and is discarded.
When δ p p 1 + p s 1 < p s 1 , as shown in the Figure 3, there exists v 1 < v 2 < v 3 .
When v > v 3 , consumers choose to buy both products and extended warranty services; when v 1 v v 3 , consumers only choose to buy products. It can be concluded that the demand functions of products and extended warranty services are as follows:
D p 1 = 1 p p 1 1 δ
D s 1 = 1 p s 1 δ
Similarly, the demand functions for products and extended warranty services in the second period are as follows:
D p 2 = a p p 2 1 δ
D s 2 = a p s 2 δ
In this paper, the subscript “ m ” represents the manufacturer, the subscript “ r “ represents the retailer, the superscript “ C ” represents the centralized supply chain, and the superscript “ D ” represents the decentralized supply chain. The superscript “ * ” represents the optimal.

3.2. Model Construction and Solving

3.2.1. Centralized Decision-Making Model

Under the centralized decision-making model, manufacturers and retailers make corresponding decisions as a single entity, jointly determining the prices p p 1 , p s 1 , p p 2 , and p s 2 of products and their extended warranty services in the first and second periods, as well as the product quality q . Accordingly, the profit function of the second period under this model is as follows:
π 2 C = p p 2 c D p 2 + p s 2 c s δ D s 2
The profit function of the entire sales process is as follows:
π 1 C = p p 1 c D p 1 + p s 1 c s δ D s 1 1 2 k q 2 + π 2 C
Under centralized decision-making, the manufacturer first confirms the product quality, and then the retailer determines the product price and extended warranty service price based on the manufacturer’s decision. Both parties make decisions in turn, and the same operation is performed in the second period, with the goal of maximizing overall profits. The overall decision-making sequence is shown in Figure 4.
The reverse induction method is used to find the optimal solution for each price. First, by solving the profit function (1) of the second period of the entire supply chain, the optimal product price p p 2 C * and the optimal extended warranty service price p s 2 C * can be obtained. Based on these two optimal responses, the supply chain entity makes decisions in the first period with the goal of maximizing profits. Substituting p p 2 C * and p s 2 C *   into Equation (2) and solving it, the optimal product price p p 1 C * , the optimal extended warranty service price p s 1 C * , and the product quality q C * in the first period can be obtained.
The optimal solutions obtained are as follows:
p p 1 C * = 1 2 c + 1 2 η A + c s η a c s + 1 6 k + c s 2 η 2 a c s + 1 2 36 k 2 A p s 1 C * = 1 2 c s + 1 1 η A + c s η a c s + 1 6 k + c s 2 η 2 a c s + 1 2 36 k 2 A p p 2 C * = 1 2 c + 1 2 a η A + c s η a c s + 1 6 k + c s 2 η 2 a c s + 1 2 36 k 2 A p s 2 C * = 1 2 a + c s 1 η A + c s η a c s + 1 6 k + c s 2 η 2 a c s + 1 2 36 k 2 A q C * = A + c s η a c s + 1 6 k + c s 2 η 2 a c s + 1 2 36 k 2 A
Among these, A = c 2 4 η k c s 3 η 3 a c s + 1 3 216 k 3 2 c s 6 η 6 a c s + 1 6 46656 k 2 c 2 4 η k + c s 3 η 3 a c s + 1 3 216 k 3 1 / 3 .

3.2.2. Decentralized Decision-Making Model

Different from the centralized decision-making model, in the decentralized decision-making model, supply chain enterprises aim to maximize their own interests. As the main party of the decentralized supply chain, the profit functions of retailers and manufacturers in the second period are as follows:
π r 2 D = p p 2 D p 2 + p s 2 c s δ D s 2 w 2 D p 2 I
π m 2 D = w 2 c D p 2 I
Considering strategic inventory, the profit functions of retailers and manufacturers in the two periods are as follows:
π r 1 D = p p 1 w 1 D p 1 + p s 1 c s δ D s 1 h + w 1 I + π r 2 D
π m 1 D = w 1 c D p 1 + I 1 2 k q 2 + π m 2 D
By analyzing the sales process, we can know that the manufacturer first determines the product quality q and the product wholesale price w 1 in the first period, and then the retailer determines the product and its extended warranty service prices p p 1 and p s 1 and decides the inventory strategy I . Then, in the second period, the manufacturer confirms the product wholesale price w 2 , and, finally, the retailer determines the product and its extended warranty service prices p p 2 and p s 2 . The overall decision-making process is shown in Figure 5.
According to the reverse induction method, firstly, the retailer’s profit function (3) of the second period is solved to obtain the optimal product and extended warranty service price p p 2 D * , p s 2 D * . Then, it is substituted into the manufacturer’s profit function (4) of the second period to obtain the optimal solution of the wholesale price w 2 D * ). Then, p p 2 D * , p s 2 D * , w 2 D * are substituted into the retailer’s profit function (5) to obtain p p 1 D * , p s 1 D * , I D * . Finally, w 1 D * , q D * are substituted into the manufacturer’s profit function (6). The following are the equilibrium optimal solutions of each indicator:
p p 1 D * = 4 17 c 1 17 h + 1 68 η 43 + 9 a B + 3 η a + 1 2 136 k + 9 η 2 a + 1 4 18496 k 2 B p s 1 D * = 1 2 c s + 1 1 η B + 3 η a + 1 2 136 k + 9 η 2 a + 1 4 18496 k 2 B p p 2 D * = 11 34 c + 5 34 h + 1 34 η 3 + 20 a B + 3 η a + 1 2 136 k + 9 η 2 a + 1 4 18496 k 2 B p s 2 D * = 1 2 a + c s 1 η B + 3 η a + 1 2 136 k + 9 η 2 a + 1 4 18496 k 2 B w 1 D * = 8 17 c 2 17 h + 9 34 η 1 + a B + 3 η a + 1 2 136 k + 9 η 2 a + 1 4 18496 k 2 B w 2 D * = 11 17 c + 10 17 h + 3 17 η 1 + a B + 3 η a + 1 2 136 k + 9 η 2 a + 1 4 18496 k 2 B I D * = 11 34 a 5 c + 20 h 34 η B + 3 η a + 1 2 136 k + 9 η 2 a + 1 4 18496 k 2 B 3 17 q D * = B + 3 η a + 1 2 136 k + 9 η 2 a + 1 4 18496 k 2 B
Among these, B = 27 η 3 a + 1 6 ( 136 k ) 3 9 c 2 + 4 c h + 8 h 2 68 η k 2 729 η 6 a + 1 12 ( 18496 k 2 ) 3 + 27 η 3 a + 1 6 ( 136 k ) 3 9 c 2 + 4 c h + 8 h 2 68 η k 1 / 3 .

3.3. Model Analysis

The abovementioned models are the optimal solutions of indicators under decentralized decision-making and centralized decision-making models, respectively. The following mainly analyzes the impact of unit inventory cost and product cost on pricing in decentralized decision-making.

3.3.1. Analysis of Unit Inventory Cost Factors

In the previous section, we have obtained the optimal solutions for the indicators under the decentralized decision-making model and the centralized decision-making model. The following mainly analyzes the impact of the two factors, unit inventory cost and product cost, on pricing in decentralized decision-making:
If 9 η 2 a + 1 4 < 18496 k 2 B , p p 1 D * h < 0 , w 1 D * h < 0 , p s 1 D * h > 0 , p s 2 D * h > 0 , I D * h < 0 .
If 9 η 2 a + 1 4 > 18496 k 2 B , p p 2 D * h > 0 , w 2 D * h > 0 , p s 1 D * h < 0 , p s 2 D * h < 0 .
The proof process is as follows:
p p 1 D * h = 1 17 + 1 68 η 43 + 9 a q D * h , p p 2 D * h = 5 17 + 1 34 η 3 + 20 a q D * h , w 1 D * h = 2 17 + 9 34 η 1 + a q D * h , w 2 D * h = 10 17 + 3 17 η 1 + a q D * h , p s 1 D * h = 1 2 η c s + 1 q D * h , p s 2 D * h = 1 2 η a + c s q D * h , I D * h = 1 η q 5 c + 20 h q q D * h 10 17 , q D * h = c + 4 h 51 η k B 2 27 η 3 a + 1 6 ( 136 k ) 3 9 c 2 + 4 c h + 8 h 2 68 η k 2 729 η 6 a + 1 12 ( 18496 k 2 ) 3 1 2 27 η 3 a + 1 6 ( 136 k ) 3 9 c 2 + 4 c h + 8 h 2 68 η k + 1 9 η 2 a + 1 4 18496 k 2 B 1 . When 9 η 2 a + 1 4 < 18496 k 2 B , q D * h < 0 , then p p 1 D * h < 0 , w 1 D * h < 0 , p s 1 D * h > 0 , p s 2 D * h > 0 , I D * h < 0 . When 9 η 2 a + 1 4 > 18496 k 2 B , q D * h > 0 , then p p 2 D * h > 0 , w 2 D * h > 0 , p s 1 D * h < 0 , p s 2 D * h < 0 .
From the above conclusions, we can find that when the condition of 9 η 2 a + 1 4 < 18496 k 2 B is met, the increase in unit inventory cost h will cause the price p p 1 D * and wholesale price w 1 D * of the product in one period to decrease, while the prices of extended warranty services in the two periods p s 1 D * , p s 2 D * will increase, and retailers will reduce their own strategic inventory I D * . This can be explained by the fact that when inventory costs increase, manufacturers plan to reduce the wholesale price of products in the first period, and retailers plan to reduce the selling price of products in one period, while reducing the inventory of products, and ensure sales profits by increasing the pricing of extended warranty services in two periods and reducing the selling price to increase sales. When 9 η 2 a + 1 4 > 18496 k 2 B is satisfied, as the unit inventory cost h increases, the product price p p 2 D * , and wholesale price w 2 D * in the second period increase, and the extended warranty service prices p s 1 D * , p s 2 D * of the two periods decrease. This can be explained by the fact that under this condition, the increase in inventory costs makes retailers intentionally increase the product prices in the second period, and manufacturers also increase the corresponding wholesale prices to seek balance, reducing the profit reduction caused by the increase in inventory costs. At the same time, retailers plan to reduce the extended warranty service prices of products in the two periods to ensure overall profits through the sales of the products themselves.

3.3.2. Analysis of Product Cost Factors

The following mainly analyzes the impact of product cost on pricing in decentralized decision-making:
If 9 η 2 a + 1 4 < 18496 k 2 B , p s 1 D * c > 0 , p s 2 D * c > 0 .
If 9 η 2 a + 1 4 > 18496 k 2 B , p p 1 D * c > 0 , p p 2 D * c > 0 , w 1 D * c > 0 , w 2 D * c > 0 , p s 1 D * c < 0 , p s 2 D * c < 0 .
The proof process is as follows:
p p 1 D * c = 4 17 + 1 68 η 43 + 9 a q D * c , p p 2 D * c = 11 34 + 1 34 η 3 + 20 a q D * c , w 1 D * c = 8 17 + 9 34 η 1 + a q D * c , w 2 D * h = 11 17 + 3 17 η 1 + a q D * c , p s 1 D * c = 1 2 η c s + 1 q D * c , p s 2 D * c = 1 2 η a + c s q D * c , q D * c = 9 c + 2 h 102 η k B 2 27 η 3 a + 1 6 ( 136 k ) 3 9 c 2 + 4 c h + 8 h 2 68 η k 2 729 η 6 a + 1 12 ( 18496 k 2 ) 3 1 2 27 η 3 a + 1 6 ( 136 k ) 3 9 c 2 + 4 c h + 8 h 2 68 η k + 1 9 η 2 a + 1 4 18496 k 2 B 1 . When 9 η 2 a + 1 4 < 18496 k 2 B , q D * c < 0 , then p s 1 D * h > 0 , p s 2 D * h > 0 . When 9 η 2 a + 1 4 > 18496 k 2 B , q D * h > 0 , then p p 1 D * c > 0 , p p 2 D * c > 0 , w 1 D * c > 0 , w 2 D * c > 0 , p s 1 D * c < 0 , p s 2 D * c < 0 .
From the above conclusions, it can be found that when the condition of 9 η 2 a + 1 4 < 18496 k 2 B is met, the increase in product cost c will cause the increase in product extended warranty service pricing p s 1 D * , p s 2 D * . This can be explained as being due to the fact that the cost required for product quality repair and maintenance will increase after the product cost is increased. In order to ensure sales revenue, retailers increase the price of product extended warranty service within two periods to make up for the reduced profit caused by the cost increase. When the condition of 9 η 2 a + 1 4 > 18496 k 2 B is met, with the increase in product cost c , it will cause the increase in the product prices p p 1 D * , p p 2 D * and wholesale prices w 1 D * , w 2 D * , and the decrease in the product extended warranty service prices p s 1 D * , p s 2 D * . This can be explained by the fact that under this condition, the increase in product costs will lead to an increase in product wholesale and sales prices, ensuring the stability of profits. In order to attract customers and improve market competitiveness, retailers increase product attractiveness and expand product sales by lowering the price of product extended warranty services.

4. Supply Chain Coordination Contract Model Based on Extended Warranty Service

4.1. Basic Assumptions

The previous chapter mainly solved the equilibrium of various indicators under the two modes of centralized and decentralized decision-making and focused on analyzing the impact of different cost factors on pricing and inventory in the decentralized decision-making model. It can be found that there are inconsistent decisions under the two different models, and for manufacturers, product costs have a certain impact on subsequent decisions. If the product cost is huge, the profit of the entire supply chain will be affected. Therefore, it is necessary to design a coordination mechanism so that the supply chain entities can obtain a common profit increase and let the supply chain companies make a common decision for the same goal. Retailers can cooperate with manufacturers and consider sharing part of the product quality costs with manufacturers. This can appropriately improve product quality, which is conducive to promoting the marketing enthusiasm of supply chain companies. This paper will use cost-sharing contracts to achieve product supply chain coordination.
The basic assumptions of the model in this chapter are based on the third chapter and the parameter φ is added. The quality cost sharing contract is designed, where φ is the cost sharing coefficient, 0 < φ < 1 . In this paper, the superscript “ t “ means that the supply chain members do not directly decide the quality cost sharing ratio.

4.2. Model Building and Solving

In this coordination contract model, the main consideration is cost sharing in the first period, so the profit function in the second period is the same as that in the decentralized decision-making model.
π r 2 t = p p 2 D p 2 + p s 2 c s δ D s 2 w 2 D p 2 I
π m 2 t = w 2 c D p 2 I
After the introduction of the cost sharing coefficient, retailers need to share the costs consumed by manufacturers in the process of manufacturing products. Considering cost sharing, the profit functions of retailers and manufacturers in two periods are:
π r 1 t = p p 1 w 1 D p 1 + p s 1 c s δ D s 1 h + w 1 I 1 2 φ k q 2 + π r 2 t
π m 1 t = w 1 c D p 1 + I 1 2 1 φ k q 2 + π m 2 t
Consider that supply chain enterprises do not directly decide on the cost sharing coefficient, that is, the product quality cost sharing is not directly determined by manufacturers or retailers. In the decision-making stage, the manufacturer first determines the product quality q and the wholesale price w 1 , and then the retailer determines the product and its extended warranty service prices p p 1 , p s 1 and inventory strategy I . In the second period, the wholesale price w 2 and the product and its extended warranty service prices p p 2 , p s 2 are decided in turn according to the order of manufacturers and retailers.
Using the reverse induction method, the solution process is similar to that in the decentralized decision model, and the solution obtained is as follows:
p p 1 t * = 4 17 c 1 17 h + 1 68 η 43 + 9 a E + 3 η a + 1 2 136 k 1 φ + 9 η 2 a + 1 4 18496 k 2 1 φ 2 E p s 1 t * = 1 2 c s + 1 1 η E + 3 η a + 1 2 136 k 1 φ + 9 η 2 a + 1 4 18496 k 2 1 φ 2 E p p 2 t * = 11 34 c + 5 17 h + 1 34 η 3 + 20 a E + 3 η a + 1 2 136 k 1 φ + 9 η 2 a + 1 4 18496 k 2 1 φ 2 E p s 2 t * = 1 2 a + c s 1 η E + 3 η a + 1 2 136 k 1 φ + 9 η 2 a + 1 4 18496 k 2 1 φ 2 E w 1 t * = 8 17 c 2 17 h + 9 34 η 1 + a E + 3 η a + 1 2 136 k 1 φ + 9 η 2 a + 1 4 18496 k 2 1 φ 2 E w 2 t * = 11 17 c + 10 17 h + 3 17 η 1 + a E + 3 η a + 1 2 136 k 1 φ + 9 η 2 a + 1 4 18496 k 2 1 φ 2 E I t * = 11 34 a 5 c + 20 h 34 η E + 3 η a + 1 2 136 k 1 φ + 9 η 2 a + 1 4 18496 k 2 1 φ 2 E 3 17 q t * = E + 3 η a + 1 2 136 k 1 φ + 9 η 2 a + 1 4 18496 k 2 1 φ 2 E
Among these, E = 27 η 3 a + 1 6 ( 136 k 1 φ ) 3 9 c 2 + 4 c h + 8 h 2 68 η k 1 φ 2 729 η 6 a + 1 12 ( 18496 k 2 ( 1 φ 2 ) ) 3 + 27 η 3 a + 1 6 ( 136 k 1 φ ) 3 9 c 2 + 4 c h + 8 h 2 68 η k 1 φ 1 / 3 .

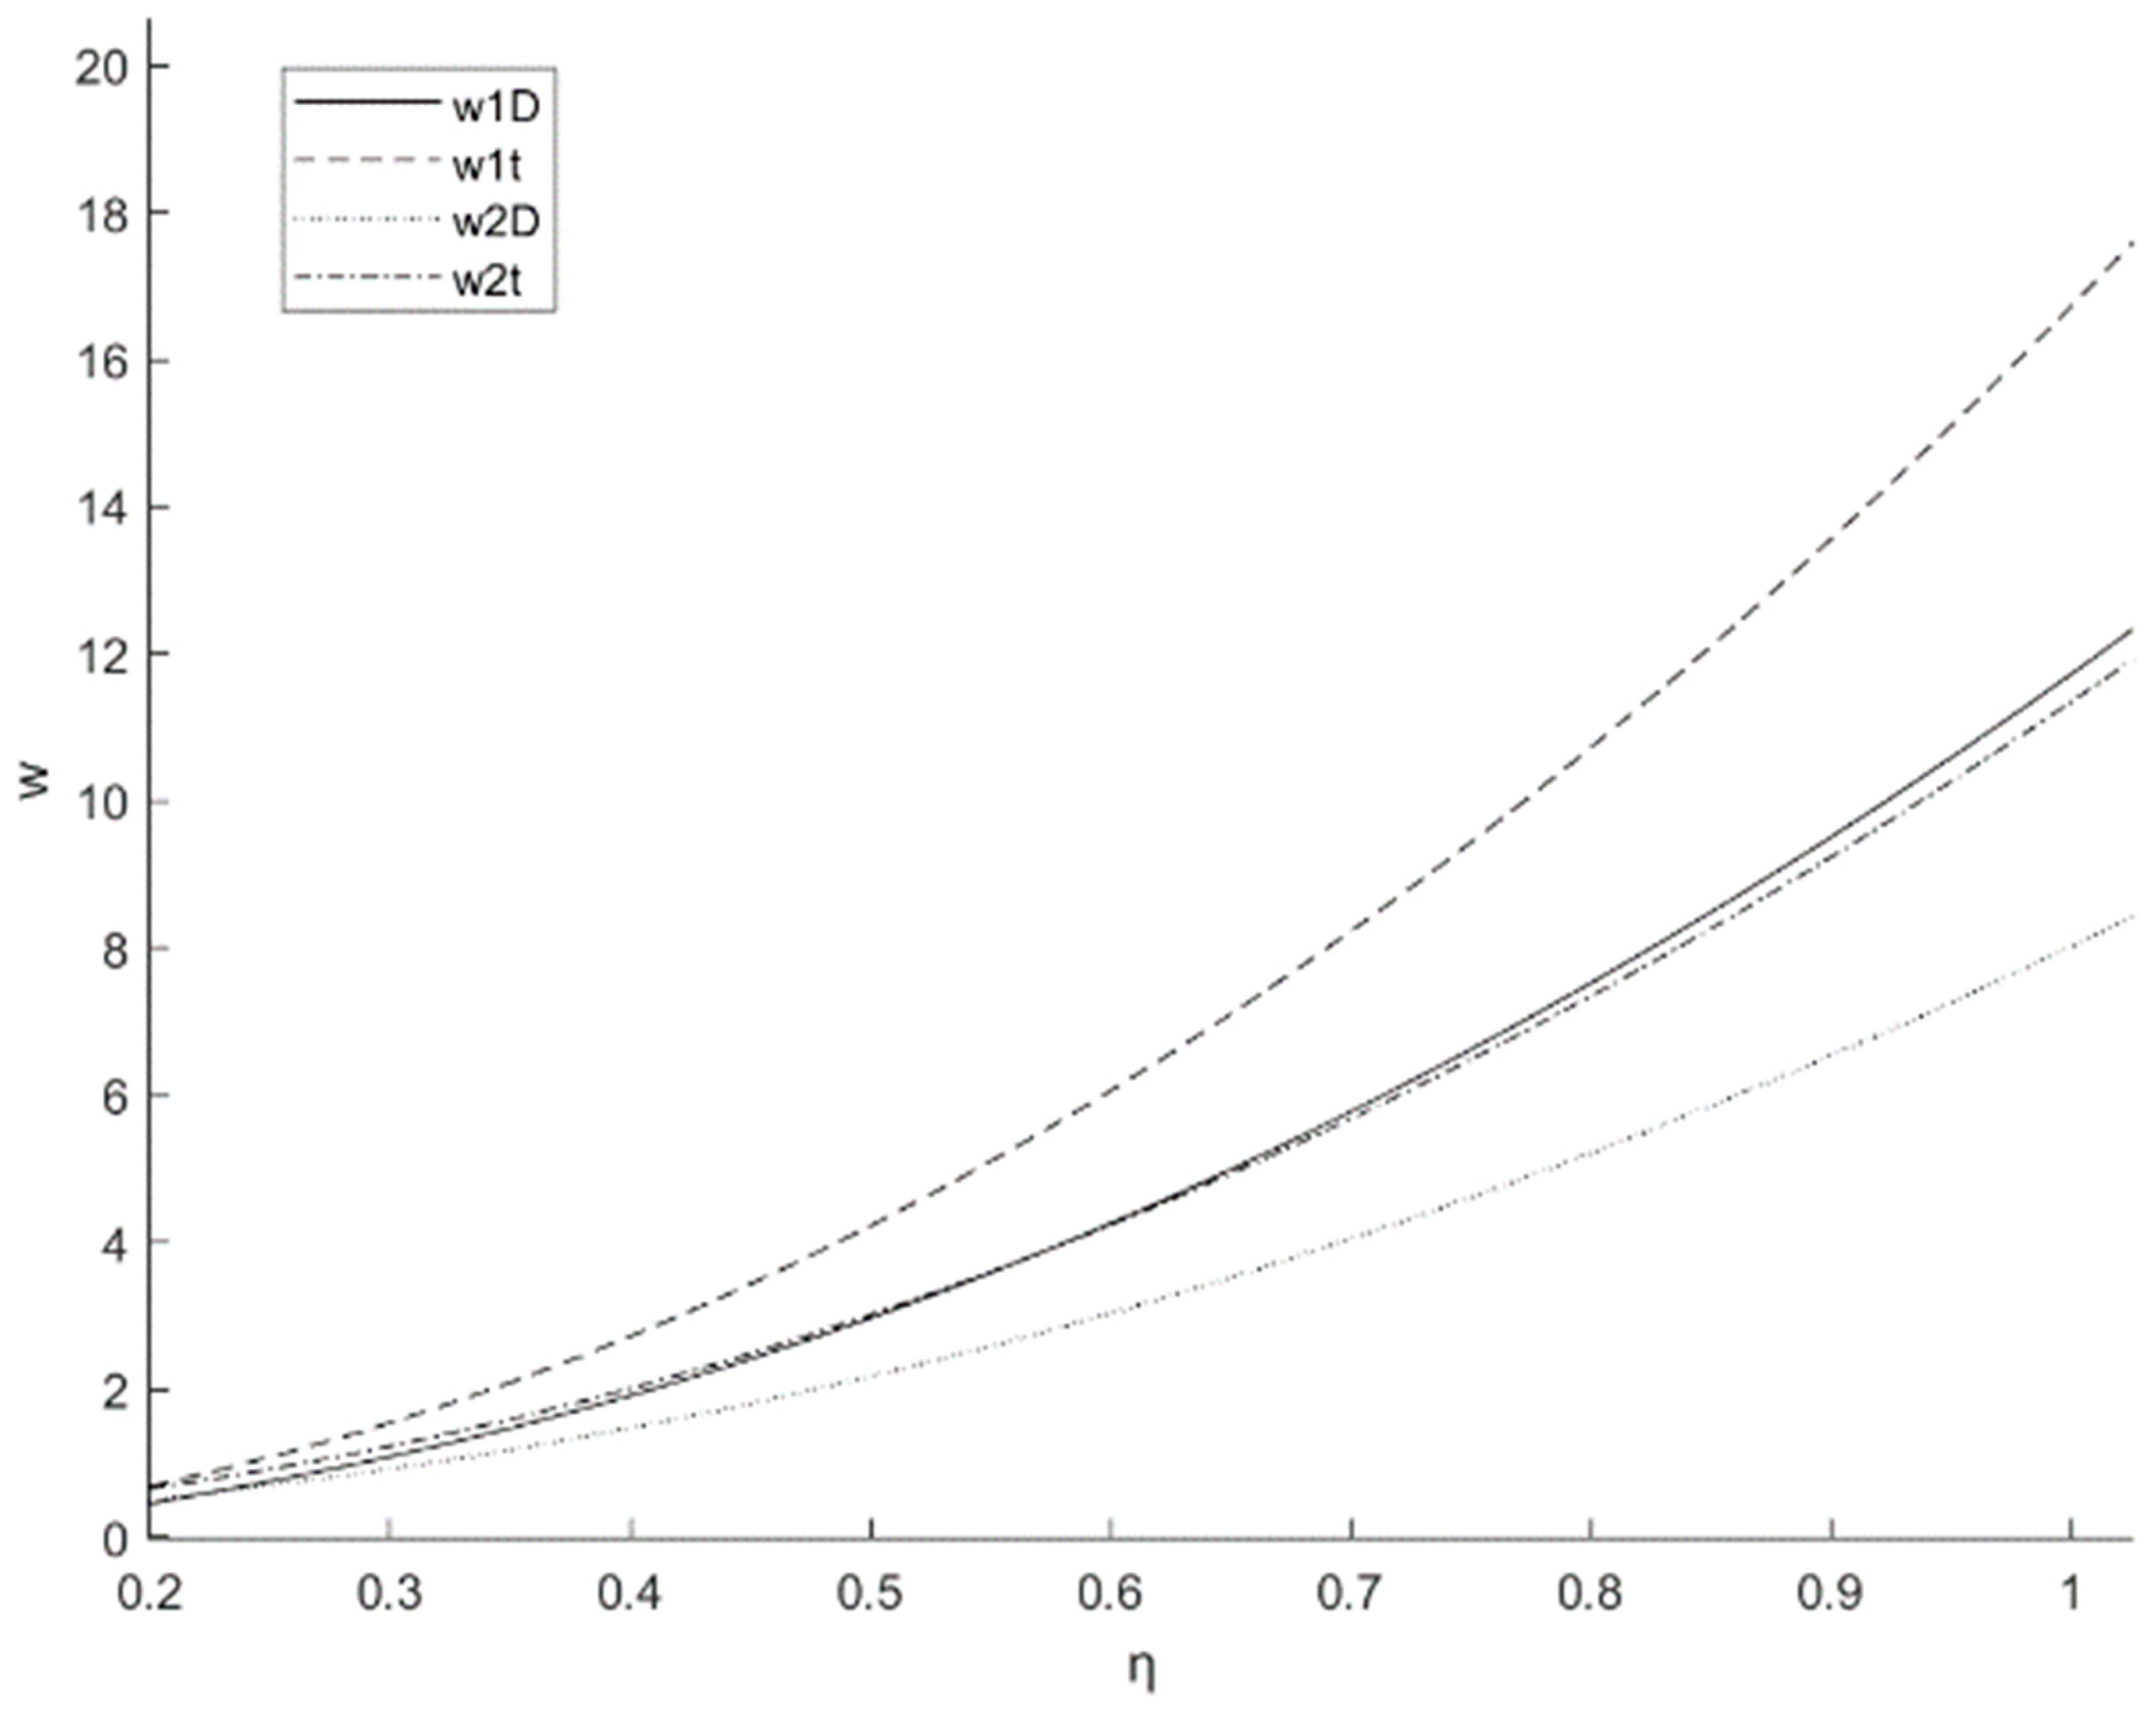
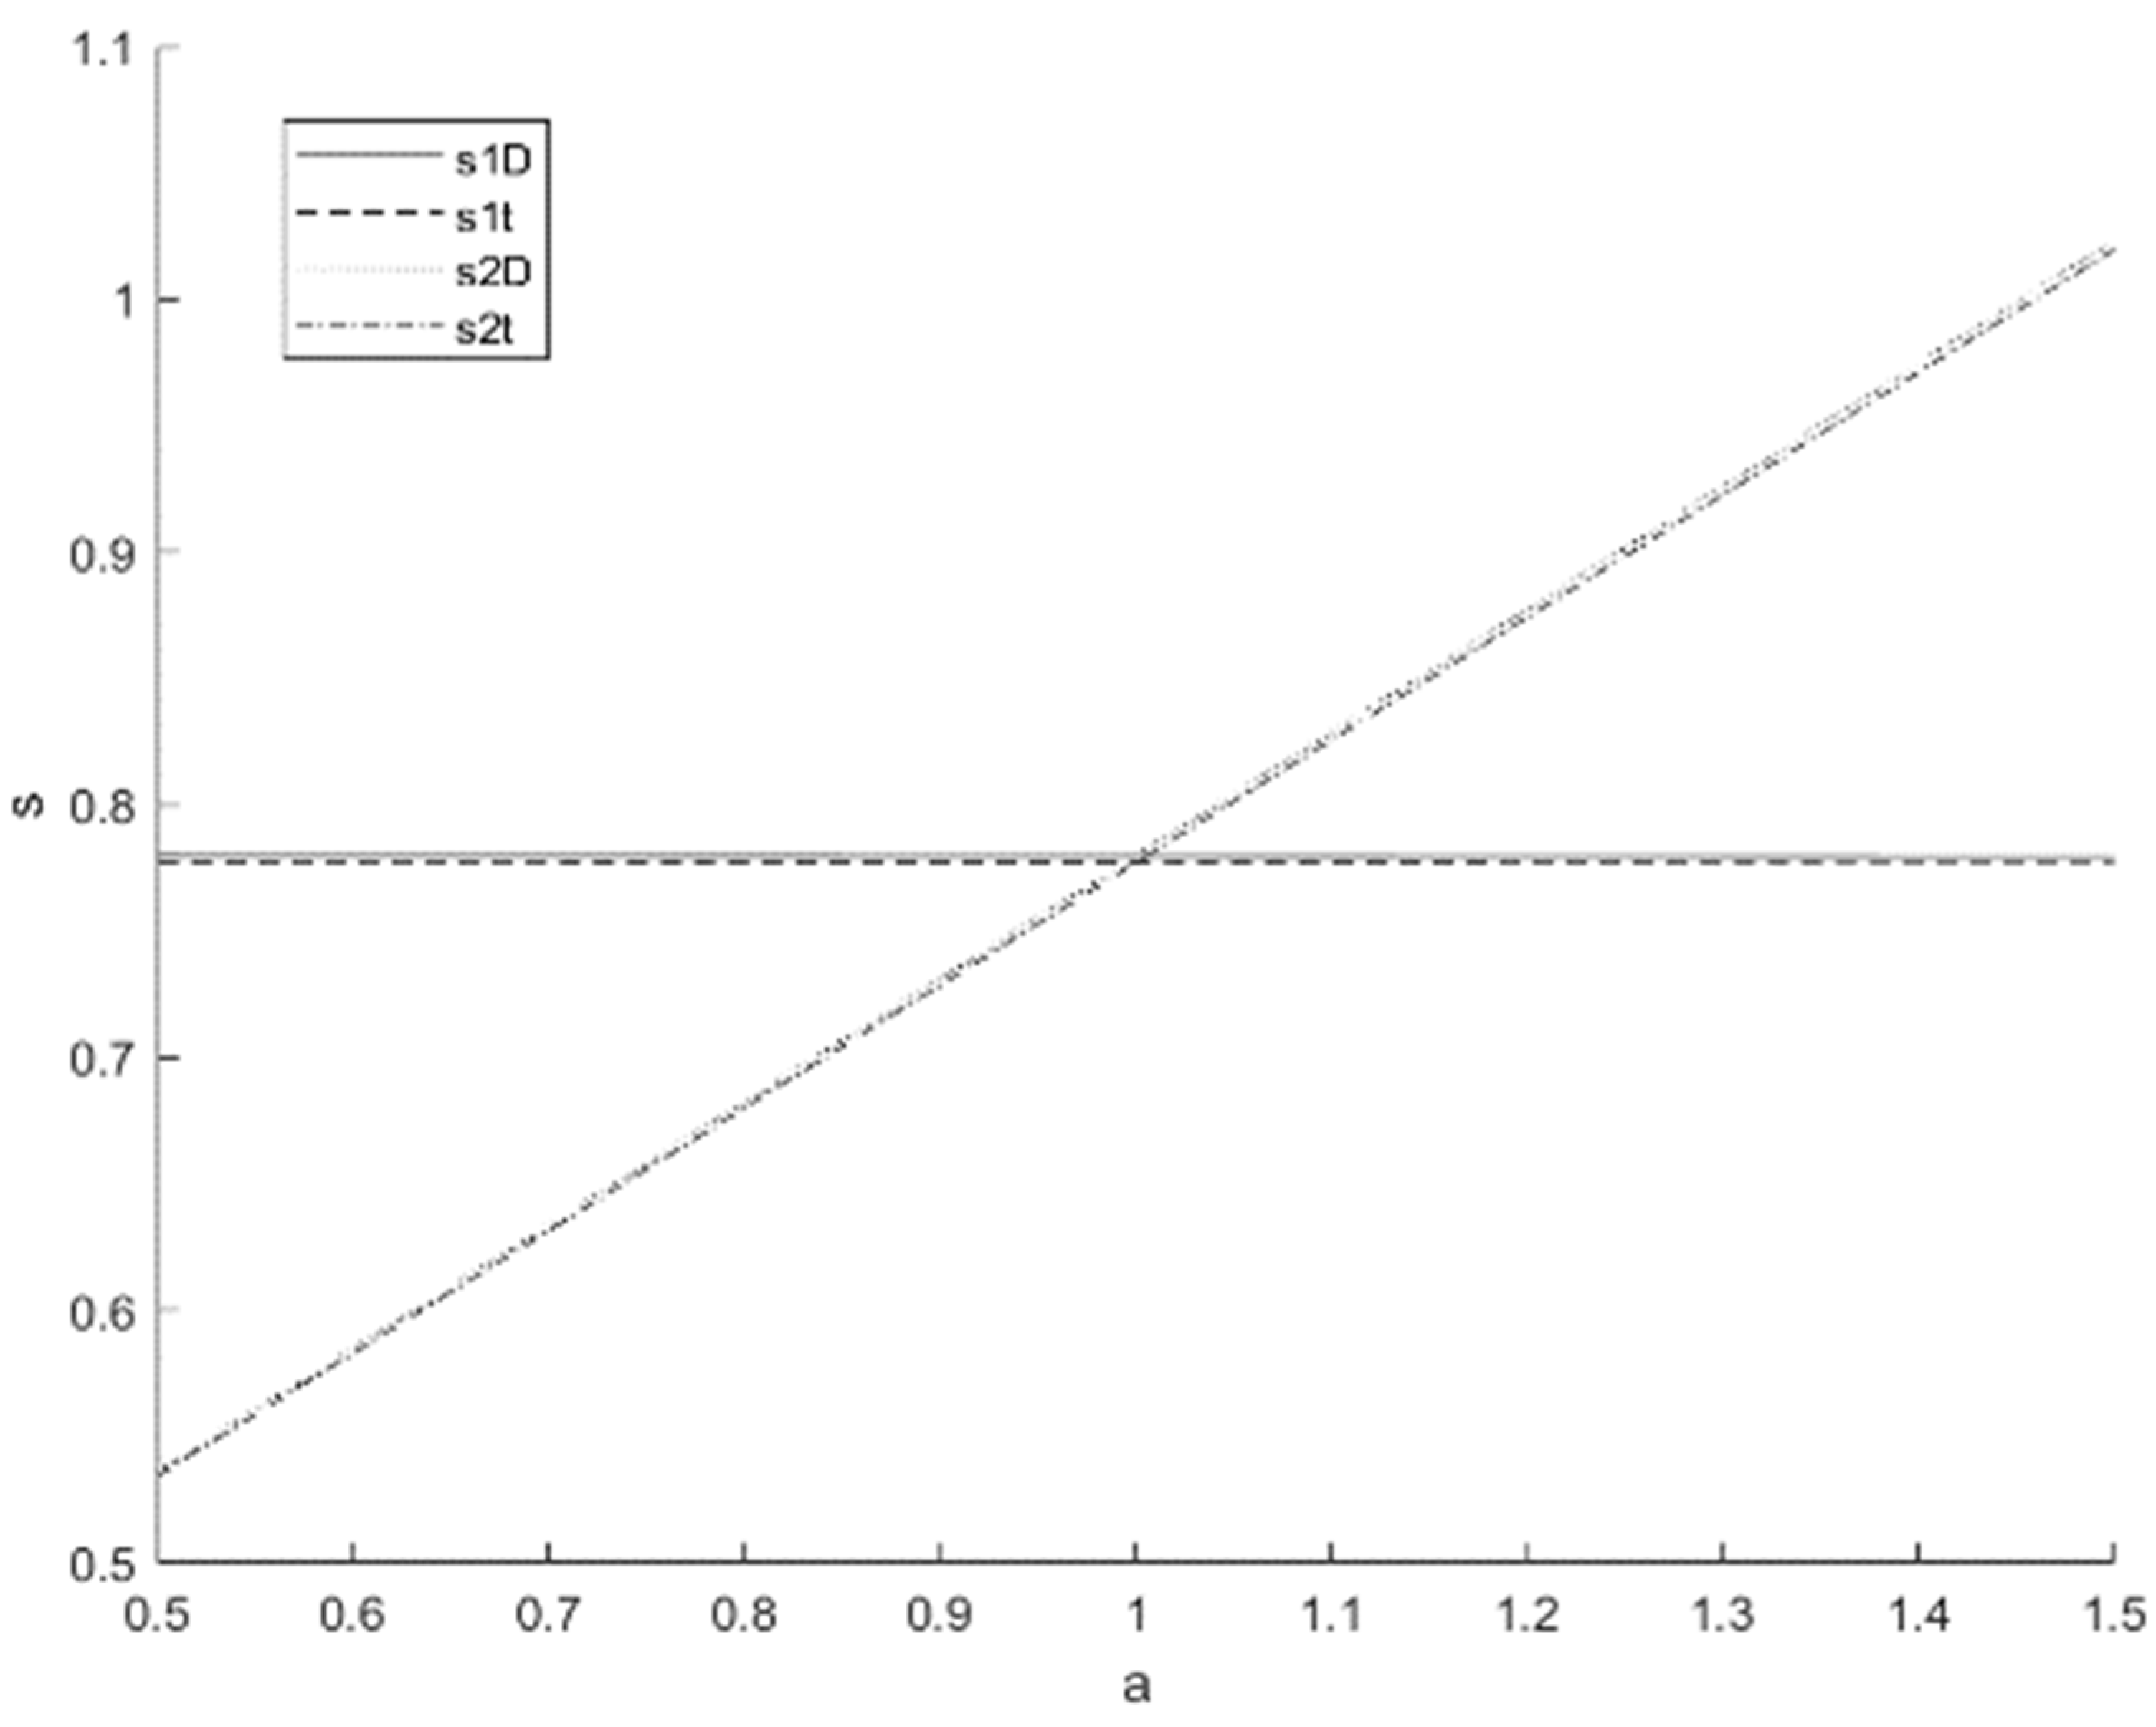
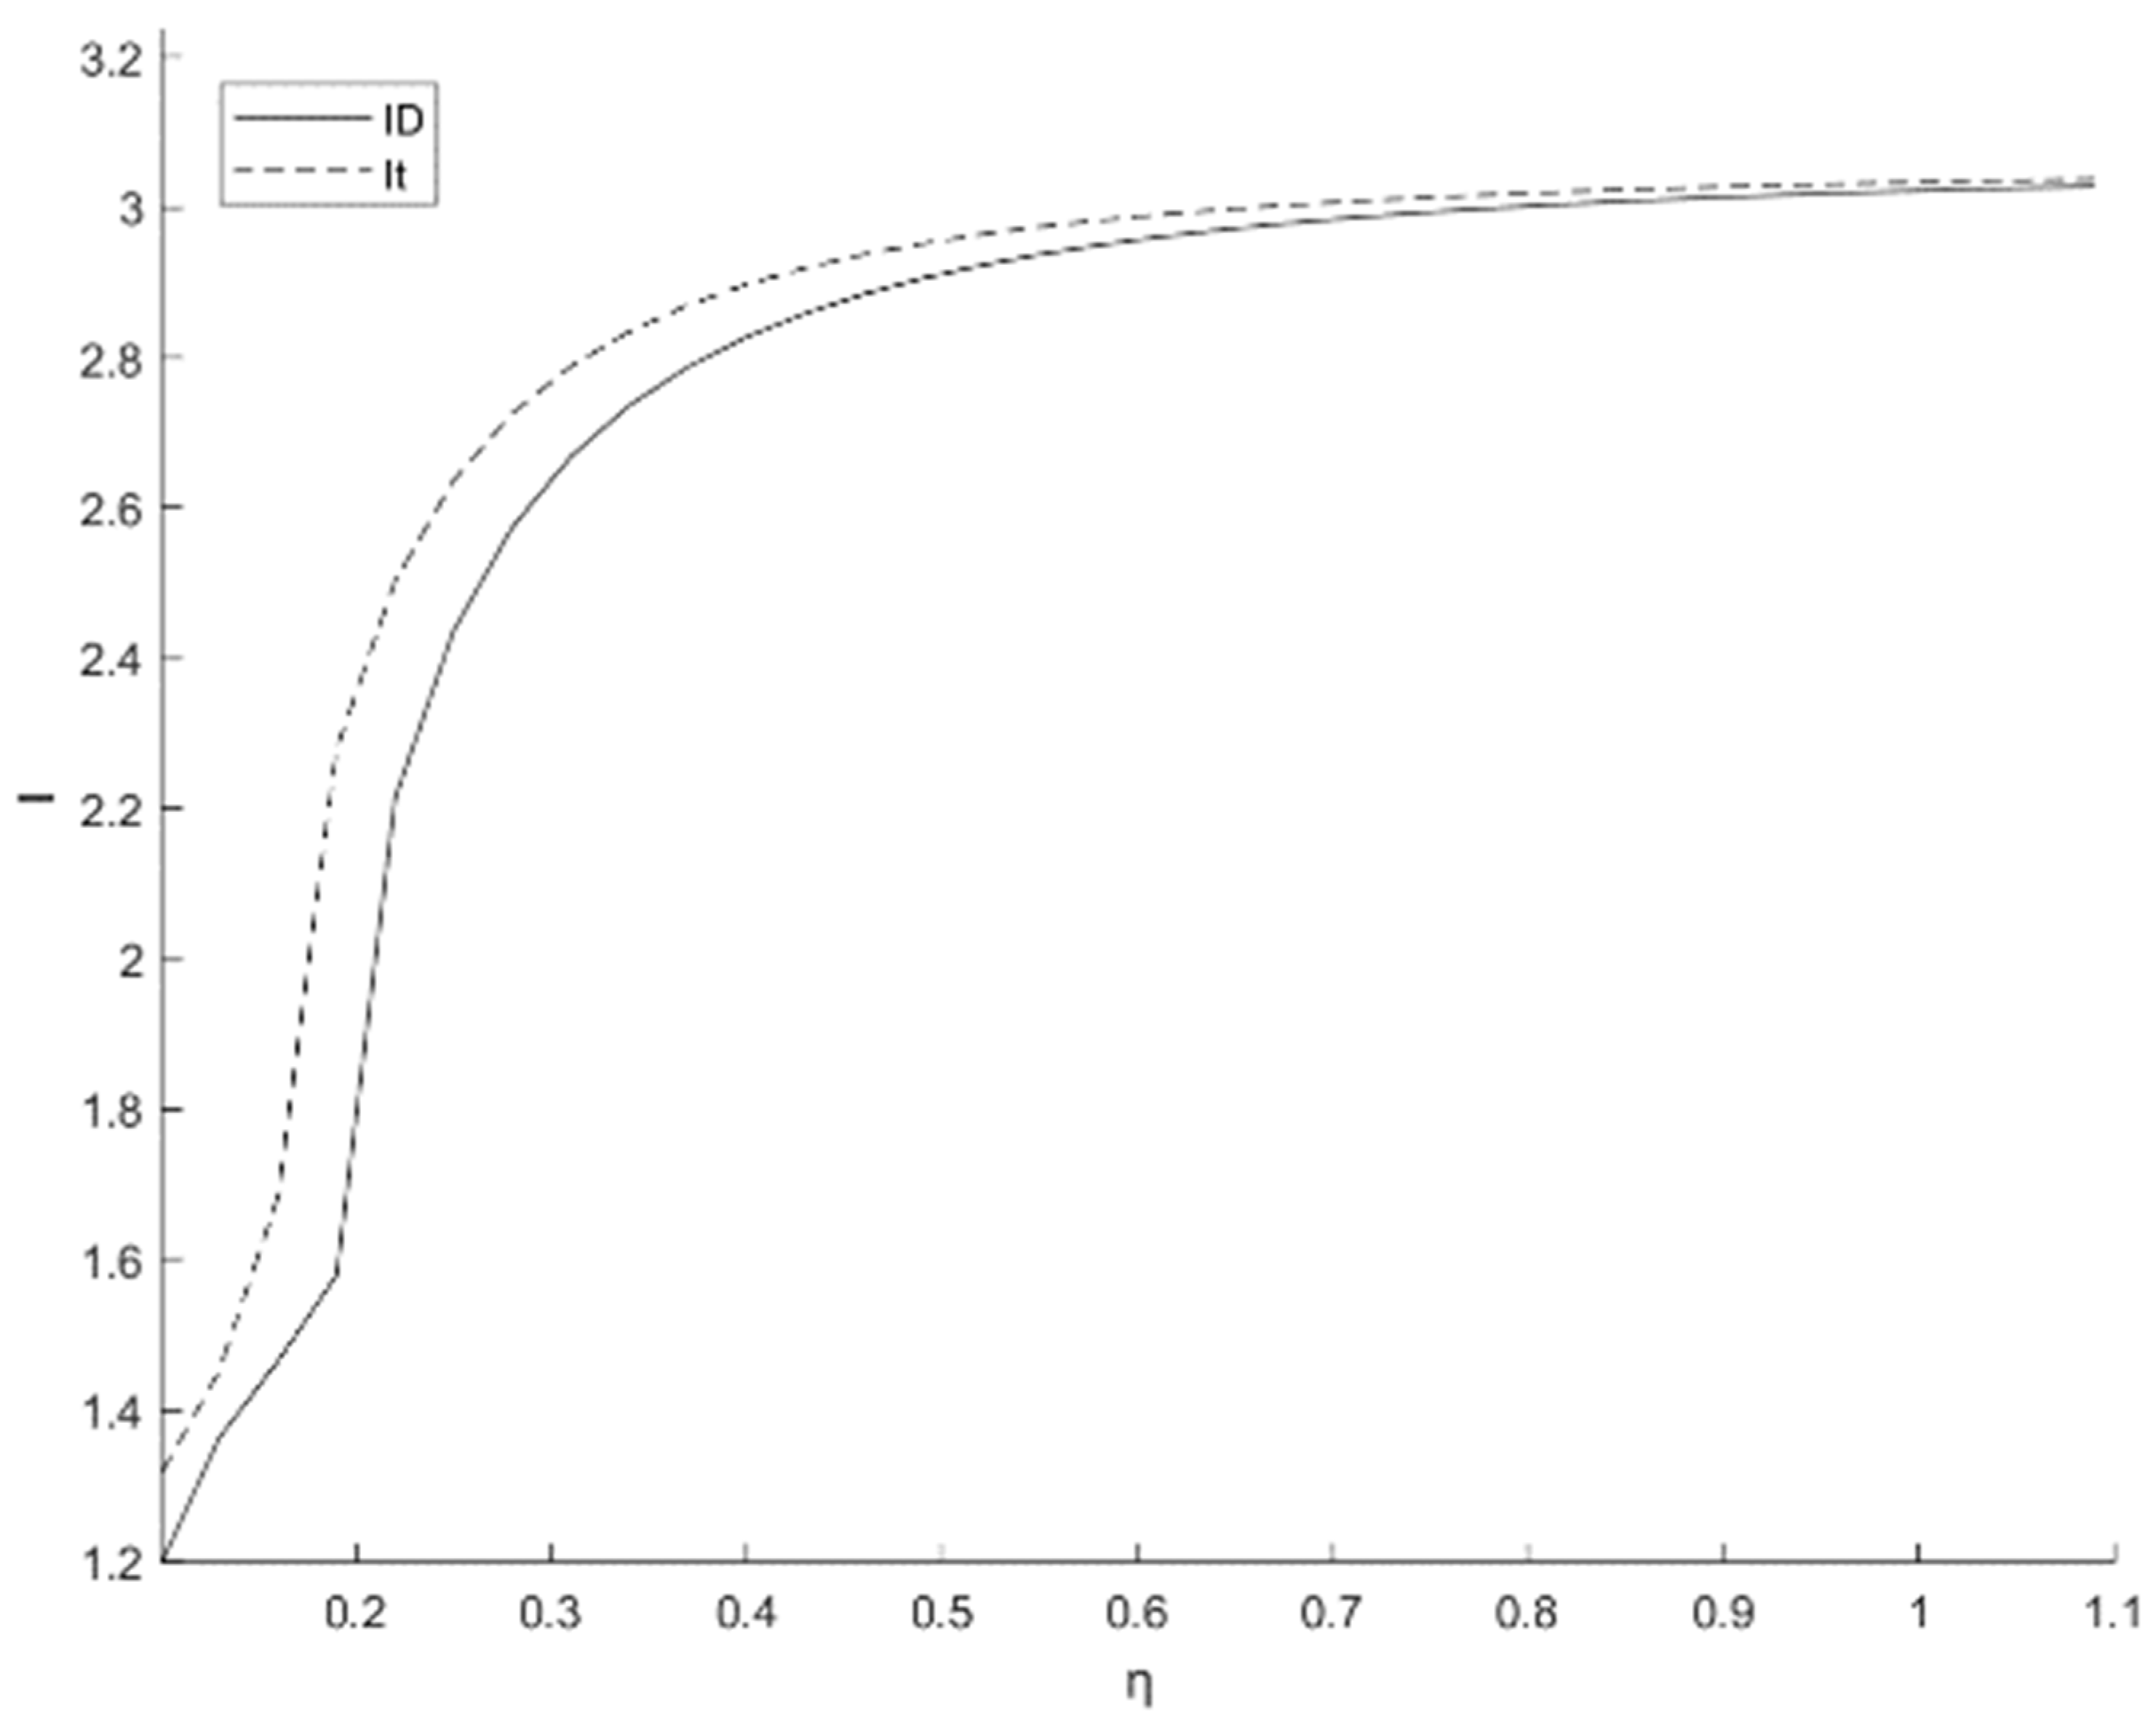
5. Numerical Simulation and Analysis

5.1. Numerical Simulation

Given the complexity of the profit function within the contract model, numerical simulations were employed to analyze the impact of various parameters on different indicators before and after the implementation of the contract. Experimental data are used in this paper. To justify the data selection, we utilized the following parameter values: a = 10 , k = 2 , η = 0.1 , h = 0.2 , c = 0.2 , c s = 0.6 , and φ = 0.3 . These values were chosen based on a preliminary analysis of the system’s operational range and previous empirical studies. The experiments were conducted using MATLAB R2022b, where simulations were performed to visualize the effects of these parameters on various indicators before and after coordination.

5.2. Analysis and Discussion

In the Figure 6, q1D represents the first period, q1t represents the second period, D represents decentralized decision-making, and t represents the coordination mechanism.
In Figure 6, we can see that the product quality after the coordination contract has been significantly improved compared to the decentralized decision-making. After the implementation of product cost sharing, retailers share the pressure of manufacturers to produce products and provide better products. Product quality is also one of the key factors to attract customers. Good products can help companies expand their market competitiveness, so it is necessary to implement a product cost sharing contract.
In Figure 7, it can be seen that the wholesale price of the product increases with the increase in the product failure coefficient. There is a negative correlation between the product failure coefficient and the product failure rate, that is, the larger the product failure coefficient, the smaller the product failure rate, and the product quality will be improved accordingly. To increase profits, manufacturers will increase the wholesale price of products. Considering the strategic inventory of retailers, the wholesale price of manufacturers in the second period will be lower than that in the first period. This is because retailers will adjust their purchase volume in the second period under the influence of inventory strategy and make up for the demand with the inventory volume in the first period. In addition, by comparison, it can be found that the wholesale price rises after the coordination contract is carried out. Because retailers and manufacturers share the product quality costs, the product quality is improved. Accordingly, manufacturers choose to increase wholesale prices in order to increase profits.
As shown in Figure 8, the product sales price in the second period is significantly higher than that in the first period, and the product sales price after the implementation of the coordination contract is higher than the decentralized decision. This is because as the user’s evaluation of the product increases, the user’s recognition of the product also increases, making the product more attractive. After retailers share the cost of product quality, the cost required increases, so they increase product prices to make up for the loss of profit caused by sharing. Considering the situation of strategic inventory, due to the influence of inventory cost factors, the product price in the second period has a significant change compared with the first period, reducing the cost loss caused by inventory and expanding the profit space.
As shown in Figure 9, the price of the product extended warranty service does not change much before and after the coordination, and as the user evaluation coefficient increases, the price of the product extended warranty service in the second period increases. This shows that the implementation of the cost-sharing contract does not affect the change in the extended warranty service price. When the user’s product evaluation coefficient is too low, it means that the user received less positive feedback after using the product in the first period and produced a low impression. Therefore, the retailer will reduce the price of the extended warranty service in the second period and attract customers to buy products through the extended warranty service. When the user’s evaluation of the product exceeds that of the first period, it means that the user has a high degree of recognition of the product, so the retailer will change the relevant decision, so that the price of the extended warranty service in the second period will gradually be higher than that in the first period. The retailer will consider the customer’s evaluation and gradually increase the price of the extended warranty service based on the customer’s strong willingness to buy.
Figure 10 and Figure 11 show that cost-sharing contracts will increase retailers’ strategic inventory appropriately. When the product failure coefficient increases, the retailer’s inventory will gradually increase, and the change between before and after the coordination contract will gradually decrease, and it will remain stable after growing to a certain level. As the product quality cost coefficient increases, retailers will significantly reduce their strategic inventory. The product failure coefficient is strongly correlated with product quality. The improvement of product quality helps the sales ability of the product. In this case, retailers can increase their strategic inventory to meet customers’ product needs in a timely manner. The increase in the product quality cost coefficient means that retailers need to spend more extra costs to manufacture products, which means that retailers will reduce inventory to achieve the purpose of reducing cost expenditures.

6. Conclusions

This paper develops a two-period product extended warranty service supply chain decision model and explores how product quality, pricing, and inventory decisions evolve under centralized and decentralized decision-making structures. Additionally, it introduces a cost-sharing contract model to assess the impact of retailer participation in product quality costs.
First, the model compares the equilibrium solutions under centralized and decentralized decision-making. Due to the diversity of strategies, when participants can choose multiple strategies, each combination of strategies may produce different equilibrium solutions. The coefficients may represent the ratio of costs, benefits, or other relevant parameters, helping to analyze the economic benefits of different strategies. In non-cooperative games, each party aims to maximize its own utility, which may lead to multiple equilibrium states. These equilibria may become more stable under certain conditions. Results indicate distinct differences in the optimal solutions between the two, especially regarding pricing, inventory, and cost fluctuations. The analysis reveals that product and inventory costs play crucial roles in influencing product pricing, making it essential for manufacturers to manage production costs and for retailers to maintain efficient inventory control to prevent profit erosion.
Second, introducing a cost-sharing contract highlights its positive impact on product quality and coordination within the supply chain. Improved product quality, driven by shared costs, leads to higher wholesale prices and enables retailers to adjust pricing based on user evaluations and product failure rates. Retailers can also optimize their inventory strategy based on the extended warranty pricing and consumer response in different periods.
The analysis confirms that cost-sharing contracts enhance both product quality and supply chain coordination, leading to improved pricing and inventory strategies across the supply chain. Retailers, by leveraging consumer feedback, can adjust warranty pricing and strategic inventory to balance profit maximization with customer satisfaction.
Future research should focus on extending the model to include multiple supply chains and exploring interactions between various manufacturers and retailers. Factors, such as consumer income, preferences, and the presence of substitute products, could also be integrated into the model to provide a more comprehensive understanding of supply chain dynamics. Additionally, exploring real-world inventory constraints and supply chain uncertainties will increase the model’s practical applicability.

Author Contributions

Conceptualization, Z.X. and Y.F.; methodology, Z.W. and W.Z.; software, J.T. and W.Z.; validation, W.Z. and Y.C.; formal analysis, W.Z.; investigation, W.Z. and Y.C.; resources, Z.W. and W.Z.; data curation, W.Z.; writing—original draft preparation, W.Z.; writing—review and editing, Z.W., Z.X.; Y.F.; visualization, W.Z.; supervision, Z.W.; project administration, Z.W.; funding acquisition, Z.W. All authors have read and agreed to the published version of the manuscript.

Funding

The work is funded by the Introduction Program of High-Level Innovation and Entrepreneurship Talents in Jiangsu Province [JSSCB20210481], and Seed Research Fund from the Nanjing University of Information Science and Technology.

Institutional Review Board Statement

Not applicable.

Informed Consent Statement

Not applicable.

Data Availability Statement

The data presented in this study are available on request from the corresponding author.

Conflicts of Interest

The authors declare no conflicts of interest.

Nomenclature

VariableDescription
cProduct cost
qProduct quality level
QQuantity of product purchased by the retailer
IInventory for the second period
hUnit product inventory cost
c s Unit product extended warranty service cost (repair and maintenance cost)
δProduct failure rate
ηFailure coefficient
vProduct value perceived by consumers
aCoefficient representing product evaluation change in the second period
w 1 , w 2 Wholesale price in the first/second sales period
D p 1 , D p 2 Product demand in the first/second period
p p 1 , p p 2 Product price in the first/second sales period
D s 1 , D s 2 Extended warranty service demand in the first/second period
p s 1 , p s 2 Extended warranty service price in the first sales period

References

  1. Day, E.; Fox, R.J. Extended Warranties, Service Contracts, and Maintenance Agreements—A Marketing Opportunity? J. Consum. Mark. 1985, 2, 77–86. [Google Scholar] [CrossRef]
  2. Ma, X.; Fu, Y.; Gao, K.; Sadollah, A.; Wang, K. Integration routing and scheduling for multiple home health care centers using a multi-objective cooperation evolutionary algorithm with stochastic simulation. Swarm Evol. Comput. 2022, 75, 101175. [Google Scholar] [CrossRef]
  3. Kim, D.; Nayakankuppam, D. When to present an extended warranty: Pre- vs. post-purchasing a product. Psychol. Mark. 2023, 40, 1821–1829. [Google Scholar] [CrossRef]
  4. Chen, R.; Luo, Z.; Ren, H.; Huang, X.; Xiao, S. A Study of Electronic Product Supply Chain Decisions Considering Extended Warranty Services and Manufacturer Misreporting Behavior. Sustainability 2024, 16, 6195. [Google Scholar] [CrossRef]
  5. Zheng, R.; Fang, H.; Hu, C. Joint optimization of inspection and condition-based maintenance for a deteriorating product under extended warranty. Reliab. Eng. Syst. Saf. 2024, 245, 110043. [Google Scholar] [CrossRef]
  6. Wu, Z.; Zhou, R.; Goh, M.; Wang, Y.; Xu, Z.; Song, W. A digital twin-based modularized design approach for smart warehouses. Int. J. Comput. Integr. Manuf. 2023, 37, 1404–1425. [Google Scholar] [CrossRef]
  7. Aksezer, S.Ç. Sustainability via Extended Warranty Contracts: Design for a Consumer Electronics Retailer. Sustainability 2024, 16, 300. [Google Scholar] [CrossRef]
  8. Liu, Z.; Chen, J.; Diallo, C.; Venkatadri, U. Optimal extended warranty pricing and retailing strategies in a closed-loop supply chain. Int. J. Prod. Res. 2023, 61, 3435–3458. [Google Scholar] [CrossRef]
  9. Li, J.; He, S.; Chen, J.; He, Z. Optimal extended warranty strategy for a two-sided platform under agency selling. Comput. Ind. Eng. 2023, 178, 109129. [Google Scholar] [CrossRef]
  10. Cui, X.; Zhou, C.; Yu, J.; Khan, A.N. Interaction between manufacturer’s recycling strategy and e-commerce platform’s extended warranty service. J. Clean. Prod. 2023, 399, 136659. [Google Scholar] [CrossRef]
  11. Zhang, Q.; Gao, J. Transferability of extended warranty in the presence of a P2P secondary market. Comput. Ind. Eng. 2021, 160, 107541. [Google Scholar] [CrossRef]
  12. Wang, D.; He, Z.; He, S.; Zhang, Z.; Zhang, Y. Dynamic pricing of two-dimensional extended warranty considering the impacts of product price fluctuations and repair learning. Reliab. Eng. Syst. Saf. 2021, 210, 107516. [Google Scholar] [CrossRef]
  13. Fu, Y.; Tian, G.; Li, Z.; Wang, Z. Parallel machine scheduling with dynamic resource allocation via a master–slave genetic algorithm. IEEJ Trans. Electr. Electron. Eng. 2018, 13, 748–756. [Google Scholar] [CrossRef]
  14. He, Z.; Huang, D.; He, S. Design of extended warranty service in a dual supply channel. Total Qual. Manag. Bus. Excell. 2018, 29, 1089–1107. [Google Scholar] [CrossRef]
  15. Salmasnia, A.; Baratian, M. Optimization of maintenance policy under warranty length-based demand with consideration of both manufacturer and buyer satisfaction. Appl. Stoch. Models Bus. Ind. 2020, 36, 586–603. [Google Scholar] [CrossRef]
  16. Fu, Y.; Gao, K.; Wang, L.; Huang, M.; Liang, Y.C.; Dong, H. Scheduling stochastic distributed flexible job shops using an multi-objective evolutionary algorithm with simulation evaluation. Int. J. Prod. Res. 2024, 1–18. [Google Scholar] [CrossRef]
  17. Zheng, B.; Bian, Y.; Sun, Y.; Ding, H. Optimal extended warranty strategy: Uniform or nonuniform pricing? Int. Trans. Oper. Res. 2021, 28, 1441–1464. [Google Scholar] [CrossRef]
  18. Ai, X.; Li, X.; Zheng, C.; He, H. Channel coordination with extended warranty when retailers compete. J. Oper. Res. Soc. 2023, 74, 826–839. [Google Scholar] [CrossRef]
  19. Zhang, J.; Wang, M. Pricing and warranty decisions in a dual-channel supply chain with warranty’s quality signal. Procedia Comput. Sci. 2023, 225, 198–207. [Google Scholar] [CrossRef]
  20. Ma, J.; Si, F.; Zhang, Q.; Wang, Z. Impact of extended warranty service on product pricing in online direct retailers’ competitive market. Energy Econ. 2024, 129, 107217. [Google Scholar] [CrossRef]
  21. Gupta, S.K.; Mukhopadhyay, I.; Chatterjee, A. Two-dimensional extended warranty length design from incomplete warranty data based on a new price curve considering different maintenance policies. Comput. Ind. Eng. 2022, 170, 108323. [Google Scholar] [CrossRef]
  22. Qu, S.; Zhou, Y.; Ji, Y.; Dai, Z.; Wang, Z. Robust maximum expert consensus modeling with dynamic feedback mechanism under uncertain environments. J. Ind. Manag. Optim. 2024. [Google Scholar] [CrossRef]
  23. Liu, B.; Shen, L.; Xu, J.; Zhao, X. A complimentary extended warranty: Profit analysis and pricing strategy. Int. J. Prod. Econ. 2020, 229, 107860. [Google Scholar] [CrossRef]
  24. Vafaeinejad, K.; Sajadieh, M.S. Trade-in price and base warranty length: A heuristic algorithm for concurrent optimization. Comput. Ind. Eng. 2022, 171, 108504. [Google Scholar] [CrossRef]
  25. Zhu, Y.; Xia, T.; Chen, Z.; Zheng, M.; Pan, E.; Xi, L. Joint optimization of price, warranty and service investment for capital-intensive equipment considering maintenance capacity limits. Comput. Ind. Eng. 2022, 169, 108152. [Google Scholar] [CrossRef]
  26. Zhang, Z.; He, S.; He, Z.; Wang, D.; Dong, F. A systematic warranty-reliability-price decision model for two-dimensional warranted products with heterogeneous usage rates. Comput. Ind. Eng. 2022, 163, 107820. [Google Scholar] [CrossRef]
  27. Taleizadeh, A.A.; Mokhtarzadeh, M. Pricing and two-dimensional warranty policy of multi-products with online and offline channels using a value-at-risk approach. Comput. Ind. Eng. 2020, 148, 106674. [Google Scholar] [CrossRef]
  28. Liang, D.; Wang, L.; Liu, S.; Li, S.; Zhou, X.; Xiao, Y.; Zhong, P.; Chen, Y.; Wang, C.; Xu, S.; et al. Global Incidence of Diarrheal Diseases-An Update Using an Interpretable Predictive Model Based on XGBoost and SHAP: A Systematic Analysis. Nutrients 2024, 16, 3217. [Google Scholar] [CrossRef]
  29. Cui, Y.; Hu, Z.; Duan, X. Optimal Pricing of Public Electric Vehicle Charging Stations Considering Operations of Coupled Transportation and Power Systems. IEEE Trans. Smart Grid 2021, 12, 3278–3288. [Google Scholar] [CrossRef]
  30. Pasternack, B.A. Optimal Pricing and Return Policies for Perishable Commodities. Mark. Sci. 2008, 27, 33–140. [Google Scholar]
  31. Zhang, Z.P.; Fu, Y.P.; Gao, K.Z.; Pan, Q.K.; Huang, M. A learning-driven multi-objective cooperative artificial bee colony algorithm for distributed flexible job shop scheduling problems with preventive maintenance and transportation operations. Comput. Ind. Eng. 2024, 196, 110484. [Google Scholar] [CrossRef]
  32. Yu, T.; Guan, Z.; Zhang, J.; Dong, J. Blockchain adoption and contract coordination of poverty alleviation supply chain considering altruistic preference. Comput. Ind. Eng. 2024, 188, 109879. [Google Scholar] [CrossRef]
  33. Peng, Q.; Wang, C.; Goh, M. Green innovation decision and coordination of supply chain under corporate social responsibility and risk preferences. Comput. Ind. Eng. 2023, 185, 109703. [Google Scholar] [CrossRef]
  34. Yuxiang, Z.; Weijun, Z.; Shu-e, M. Supply chain coordination by manufacturer reward contract. Oper. Res. Lett. 2023, 51, 432–438. [Google Scholar]
  35. Luo, T.; Chang, D.; Xu, Z.; Hu, X. Empty container leasing and channel coordination in a Dual-Channel container transportation service chain based on joint contracts. Comput. Ind. Eng. 2023, 181, 109334. [Google Scholar] [CrossRef]
  36. Liang, P.; Fu, Y.; Gao, K. Multi-product disassembly line balancing optimization method for high disassembly profit and low energy consumption with noise pollution constraints. Eng. Appl. Artif. Intell. 2024, 130, 107721. [Google Scholar] [CrossRef]
  37. Zhu, X.; Ding, L.; Guo, Y.; Zhu, H. Decision and coordination analysis of extended warranty service in a remanufacturing closed-loop supply chain with dual price sensitivity under different channel power structures. RAIRO—Oper. Res. 2022, 56, 1149–1166. [Google Scholar] [CrossRef]
  38. Feldman, P.; Frazelle, A.E.; Swinney, R. Managing Relationships Between Restaurants and Food Delivery Platforms: Conflict, Contracts, and Coordination. Manag. Sci. 2022, 69, 812–823. [Google Scholar] [CrossRef]
  39. Yan, B.; Han, L. Decisions and coordination of retailer-led fresh produce supply chain under two-period dynamic pricing and portfolio contracts. RAIRO—Oper. Res. 2022, 56, 349–365. [Google Scholar] [CrossRef]
  40. Fu, Y.P.; Zhou, M.C.; Guo, X.; Qi, L.; Gao, K.; Albeshri, A. Multiobjective Scheduling of Energy-Efficient Stochastic Hybrid Open Shop With Brain Storm Optimization and Simulation Evaluation. IEEE Trans. Syst. Man Cybern. Syst. 2024, 54, 4260–4272. [Google Scholar] [CrossRef]
  41. Ma, H.; Lou, G.; Fan, T.; Chan, H.K.; Chung, S.H. Conventional automotive supply chains under China’s dual-credit policy: Fuel economy, production and coordination. Energy Policy 2021, 151, 112166. [Google Scholar] [CrossRef]
  42. Wang, Y.; Yu, Z.; Jin, M.; Mao, J. Decisions and Coordination of Retailer-led Low-carbon Supply Chain under Altruistic Preference. Eur. J. Oper. Res. 2021, 293, 910–925. [Google Scholar] [CrossRef]
  43. Lin, Z.; Chen, R.; Luo, L.; Ren, H. Research on Coordination of Fresh Supply Chain Considering Supplier Misreporting and Consumer Return. Sustainability 2024, 16, 6225. [Google Scholar] [CrossRef]
Figure 1. The process of the proposed model.
Sustainability 16 08769 g001
Figure 2. Utility analysis of product and extended warranty service with v 1 v 2 v 3 .
Sustainability 16 08769 g002
Figure 3. Utility analysis of product and extended warranty service with v 1 < v 2 < v 3 .
Sustainability 16 08769 g003
Figure 4. Centralized decision-making process.
Sustainability 16 08769 g004
Figure 5. Decentralized decision-making process.
Sustainability 16 08769 g005
Figure 6. The variation in product quality q with respect to η before and after coordination.
Sustainability 16 08769 g006
Figure 7. The variation in wholesale price w with respect to η before and after coordination.
Sustainability 16 08769 g007
Figure 8. The variation in product price p with respect to a before and after coordination.
Sustainability 16 08769 g008
Figure 9. The variation in extended warranty service price s with respect to a before and after coordination.
Sustainability 16 08769 g009
Figure 10. The variation in inventory I with respect to η before and after coordination.
Sustainability 16 08769 g010
Figure 11. The variation in inventory I with respect to k before and after coordination.
Sustainability 16 08769 g011
Disclaimer/Publisher’s Note: The statements, opinions and data contained in all publications are solely those of the individual author(s) and contributor(s) and not of MDPI and/or the editor(s). MDPI and/or the editor(s) disclaim responsibility for any injury to people or property resulting from any ideas, methods, instructions or products referred to in the content.

