Article

Effects of Combined Biochar and Chemical Fertilizer Application on Soil Fertility and Properties: A Two-Year Pot Experiment

1
Institute of Environmental Processes and Pollution Control, School of Environment and Ecology, Jiangnan University, Wuxi 214122, China
2
College of Environmental and Resource, Zhejiang A&F University, Hangzhou 311300, China
3
Changzhou Xingyu Automotive Lighting Systems Co., Ltd., Changzhou 213022, China
4
School of Environment and Natural Resources, Zhejiang University of Science and Technology, Hangzhou 310023, China
*
Author to whom correspondence should be addressed.
These authors contributed equally to this work.
Sustainability 2024, 16(20), 8780; https://doi.org/10.3390/su16208780
Submission received: 13 August 2024 / Revised: 6 October 2024 / Accepted: 9 October 2024 / Published: 11 October 2024
(This article belongs to the Special Issue Advancing Water and Soil Sustainability with Integrative Approaches)

Abstract

:
A two-year pot experiment was conducted to investigate the effects of the combined application of biochar and chemical fertilizer on soil quality and vegetable growth by adding different proportions of chemical fertilizer and biochar to the soil in 2022 and no fertilizer in 2023. It was concluded that the combined treatment improved the soil’s properties. After two consecutive years of planting vegetables, the improvement of soil properties was the most significant with the 1.5 g biochar + 80% chemical fertilizer optimal fertilizer application (BCF6) treatment. In comparison to the control (CK), soil pH, electrical conductivity, and dissolved organic carbon increased by 0.59 units, 166.6%, and 282.6%, respectively. Soil fertility also improved significantly, indicating that the combined treatments resulted in the slow release of nutrients to enhance the effectiveness of the fertilizers. Co-application significantly increased the yield of the edible parts of Chinese cabbage and improved its quality. The most significant effects of vitamin C content and soluble protein were observed in Chinese cabbage under BCF6 treatment, which were 3.33 and 1.42 times more than the CK, respectively. Utilizing biochar as a partial substitute for chemical fertilizers can improve soil structure and fertility over the long term while reducing the reliance on chemical fertilizers, ultimately providing sustained economic and ecological benefits for agricultural production.

1. Introduction

The demand for food is a major challenge worldwide as a result of declining arable land resources, the increasing global population, and intensifying climate change [1,2]. Chemical fertilizers, as traditional and common fertilizers, are added at the time of planting to rapidly provide inorganic nutrients for plant growth, thereby significantly increasing crop yields. However, in order to achieve higher crop yields, especially in vegetable cultivation, fertilizers are over-applied. The use of chemical fertilizers for the cultivation of vegetables is reported to be 3.3-times higher than for other crops [3]. When chemical fertilizer is applied excessively, it can lead to the deterioration of soil properties [4,5]. For example, the excessive use of chemical fertilizers can disrupt the nutrient balance of farmland and result in a pH decrease from overfertilization [6]. In addition, prolonged fertilizer application destroys the chemical structure of soil humic acids, thus increasing the risk of crops being infected with pathogenic bacteria [7]. Ultimately, this leads to the accumulation of pollutants and the eutrophication of water bodies, posing a great threat and burden to the environment [8]. Therefore, optimizing fertilizer management is essential to improve soil properties, vegetable production, and environmental sustainability.
It has been reported that reducing the use of chemical fertilizers and replenishing soil nutrients in other ways can help to achieve sustainable agricultural production [9]. Biochar is an extremely carbon-rich material produced from biological organic materials (biomass) at high temperatures [10,11]. Biochar has the capabilities of holding water and fertilizer [12] and can increase soil pH through its highly alkaline feature [13]. Studies have shown that biochar can provide nutrients to crops by releasing its own nutrients and reserving the nutrients present in soil and fertilizers [14,15]. Biochar can adsorb ammonium nitrogen ( NH 4 + -N) and nitrate nitrogen ( N O 3 -N) in soil, reducing nitrogen (N) leaching and increasing available N [16,17]. It can also adsorb P O 4 3 from soil, subsequently reducing available phosphorus (AP) leaching [18]. Potassium (K) in biochar is highly effective and, when applied to soil, it increases ion exchange and reduces K leaching [18]. The combination of biochar with chemical fertilizer has been shown to positively influence crop yield [19]. As shown in a study, replacing moderate amounts of chemical fertilizers with biochar enhances the soil’s physical structure, improves rice productivity, and reduces chemical fertilizer inputs [20]. In addition, Yu et al. reported that the use of biochar, combined with reduced chemical fertilizer application, can promote the sustainable use of N and P in soil through several transformation processes [21]. Therefore, the co-application of biochar and chemical fertilizer leverages the benefits of both, offering a viable strategy to enhance plant growth, optimize the efficiency of chemical fertilizers, and decrease their overall application. This approach also represents a sustainable method to maintain soil health and boost crop yield [22]. Although some studies have investigated the potential impact of biochar with less fertilizer on crop production [23,24], the amount of biochar replacing fertilizer is still unclear due to the differences in crop types and soil conditions.
Moreover, the long-term effects of this fertilization approach on soil fertility and properties are not well-understood. The aim of this study is to investigate the long-term roles of this co-application on soil fertility and properties during the cultivation of Chinese cabbage. In order to investigate the optimal rate of replacing chemical fertilizers with biochar during Chinese cabbage cultivation, we conducted a two-year pot trial to evaluate its effect on Chinese cabbage yield, as well as its role in the improvement of soil fertility and properties.

2. Materials and Methods

2.1. Site Description

The soil used in this experiment was collected from the south district of Jiangnan University, Wuxi City, Jiangsu Province, China (31°29′ N, 120°16′ E). The soil was Alfisols that has not been planted with crops before. Unfertilized topsoil was collected using the multi-point sampling method. Stones, gravel, and other debris were removed from the collected soil; the soil was air-dried and passed through a 20-mesh sieve. The soil information is shown in Table 1.

2.2. Experimental Material

Chinese cabbage (Brassica chinensis L.) was selected as the test crop, and the species was non-balling cabbage. The selected cultivar was Jingyan Jingguan 1F1 (Jingyan Yinong Seed Science and Technology Co., Ltd., Beijing, China), known for its rapid growth rate, robust petiole, and optimal growth temperature range of 15–25 °C, with a growth cycle of 25–50 days [25].
Rice husk was used as a raw material to produce biochar, which was pyrolyzed at 500 °C in a carbonization oven [26]. The properties of the biochar are as follows: pH of 10.37 and specific surface area of 67.637 m2·g−1. The contents of carbon (C), nitrogen (N), and hydrogen (H) were 40.67%, 4.65%, and 1.99%, respectively, resulting in a C/N ratio of 8.74 and a C/H ratio of 20.38.
The chemical fertilizers used in this study included urea, monoammonium phosphate, and potassium chloride (KCl). Urea was purchased from Anyang Zhongying Chemical Fertilizer Co., Anyang, China. Monoammonium phosphate was obtained from Shifang Kanglong Chemical Co., Ltd., Sichuan, China (P2O5 = 61%, N = 12%), and KCl was purchased from Sinochem Fertilizer Co., Ltd., Beijing, China (K2O ≥ 60%).

2.3. Experimental Design

The experiment was conducted in the solar greenhouse of the School of Environment and Ecology, Jiangnan University, in Wuxi, Jiangsu Province. The optimal amounts of fertilizers used in the experiment were N: 150 mg kg−1, P2O5: 52.5 mg·kg−1, and K2O: 90 mg kg−1 [27], which were calculated according to the final additive amount of 0.8093 g per pot with an N:P:K fertilizer application ratio of 1:0.35:0.6 [27]. There were eight treatments in this study (see Figure 1), which were CK (control): without fertilizer; CF: with the addition of chemical fertilizer (0.8093 g per pot); the proportions of chemical fertilizer as 40%, 60%, and 80% of the optimal chemical fertilizer application rate, and the rest as biochar, which were recorded as BCF1, BCF2, and BCF3, respectively; and a fixed dosage of biochar as 1.5 g (0.1%, w/w) and 40%, 60%, and 80% of the optimal chemical fertilizer application, which were recorded as BCF4, BCF5, and BCF6, respectively. Biochar and chemical fertilizer were homogenized and mixed thoroughly with the soil before planting. Ordinary plastic pots were used in the experiment, containing 1.5 kg of soil in each pot. To ensure that each pot received uniform light, the position of the pots was randomly changed and observed daily (60% of the field water holding capacity). For the duration of the experiment, water was applied every 2 days to maintain soil moisture (60% of the field water holding capacity). Chinese cabbage was planted on 9 March 2022 and harvested on 27 April 2022. The second batch of Chinese cabbage was planted using the same soil as after the first batch, but the pots were not treated with any biochar or chemical fertilizers. The second batch was planted on 17 March 2023 and harvested on 5 May 2023. Plant height was measured with a tape measure, with all four plants in each pot counted and averaged. After harvesting, the plants were rinsed and the fresh weights of the above- and underground parts of the plants in each pot were measured with an electronic balance and averaged. The rhizosphere soils were collected: one part was air-dried and stored for later use and the other part was stored at −80 °C. All samples were stored in airtight polythene bags prior to chemical analysis.

2.4. Chemical Analyses for Soil and Plant

Fresh leaf samples were extracted with 2% oxalic acid, and the vitamin C content was determined using the 2,6-dichloroindophenol colorimetric method [28]. The soluble sugar content of fresh leaves was determined using the phenol method [29] and soluble protein was determined using the Coomassie Brilliant Blue G-250 colorimetric method [30].
The soil was extracted with deionized water at ratios of 1:5 and 1:2.5 (w/v), and then stirred with a magnetic stirrer for 30 min. The electrical conductivity (EC) and pH were measured using a conductivity meter (DDSJ-319L) and a pH meter (FiveEasy Plus, Mettler Toledo, Columbus, OH, USA), respectively [31]. Soil-dissolved organic carbon (DOC) content was determined using an elemental analyzer (TOC-VCPH, Shimadu, Kyoto, Japan) [32]. The extraction of soil total N was performed with 5 mL of concentrated H2SO4 at 450 °C and then determined using the semi-micro-Kjeldahl approach [33]. Soil total P was determined using the NaOH melting molybdenum antimony colorimetry approach [34]. Soil total K was decided using the flame photometer approach [35]. Soil NH 4 + -N and N O 3 -N were extracted with a potassium chloride solution and then determined spectrophotometrically [36]. AP was determined using the molybdenum blue method. AK was determined using flame photometry [37].

2.5. Statistical Analysis

SPSS Statistics 20.0 software was used for one-way analysis of variance (ANOVA) and Duncan’s test was used to determine the differences between treatments at p < 0.05. The differences in soil properties and cabbage growth indexes between 2022 and 2023 were compared using t-test. Data were plotted using Graphpad Prism 8.3. Different lowercase letters in all figures indicate significant differences among different treatments (p < 0.05, n = 3, mean ± S.D).

3. Results

3.1. Effects of the Co-Application of Biochar and Chemical Fertilizer on Soil Properties

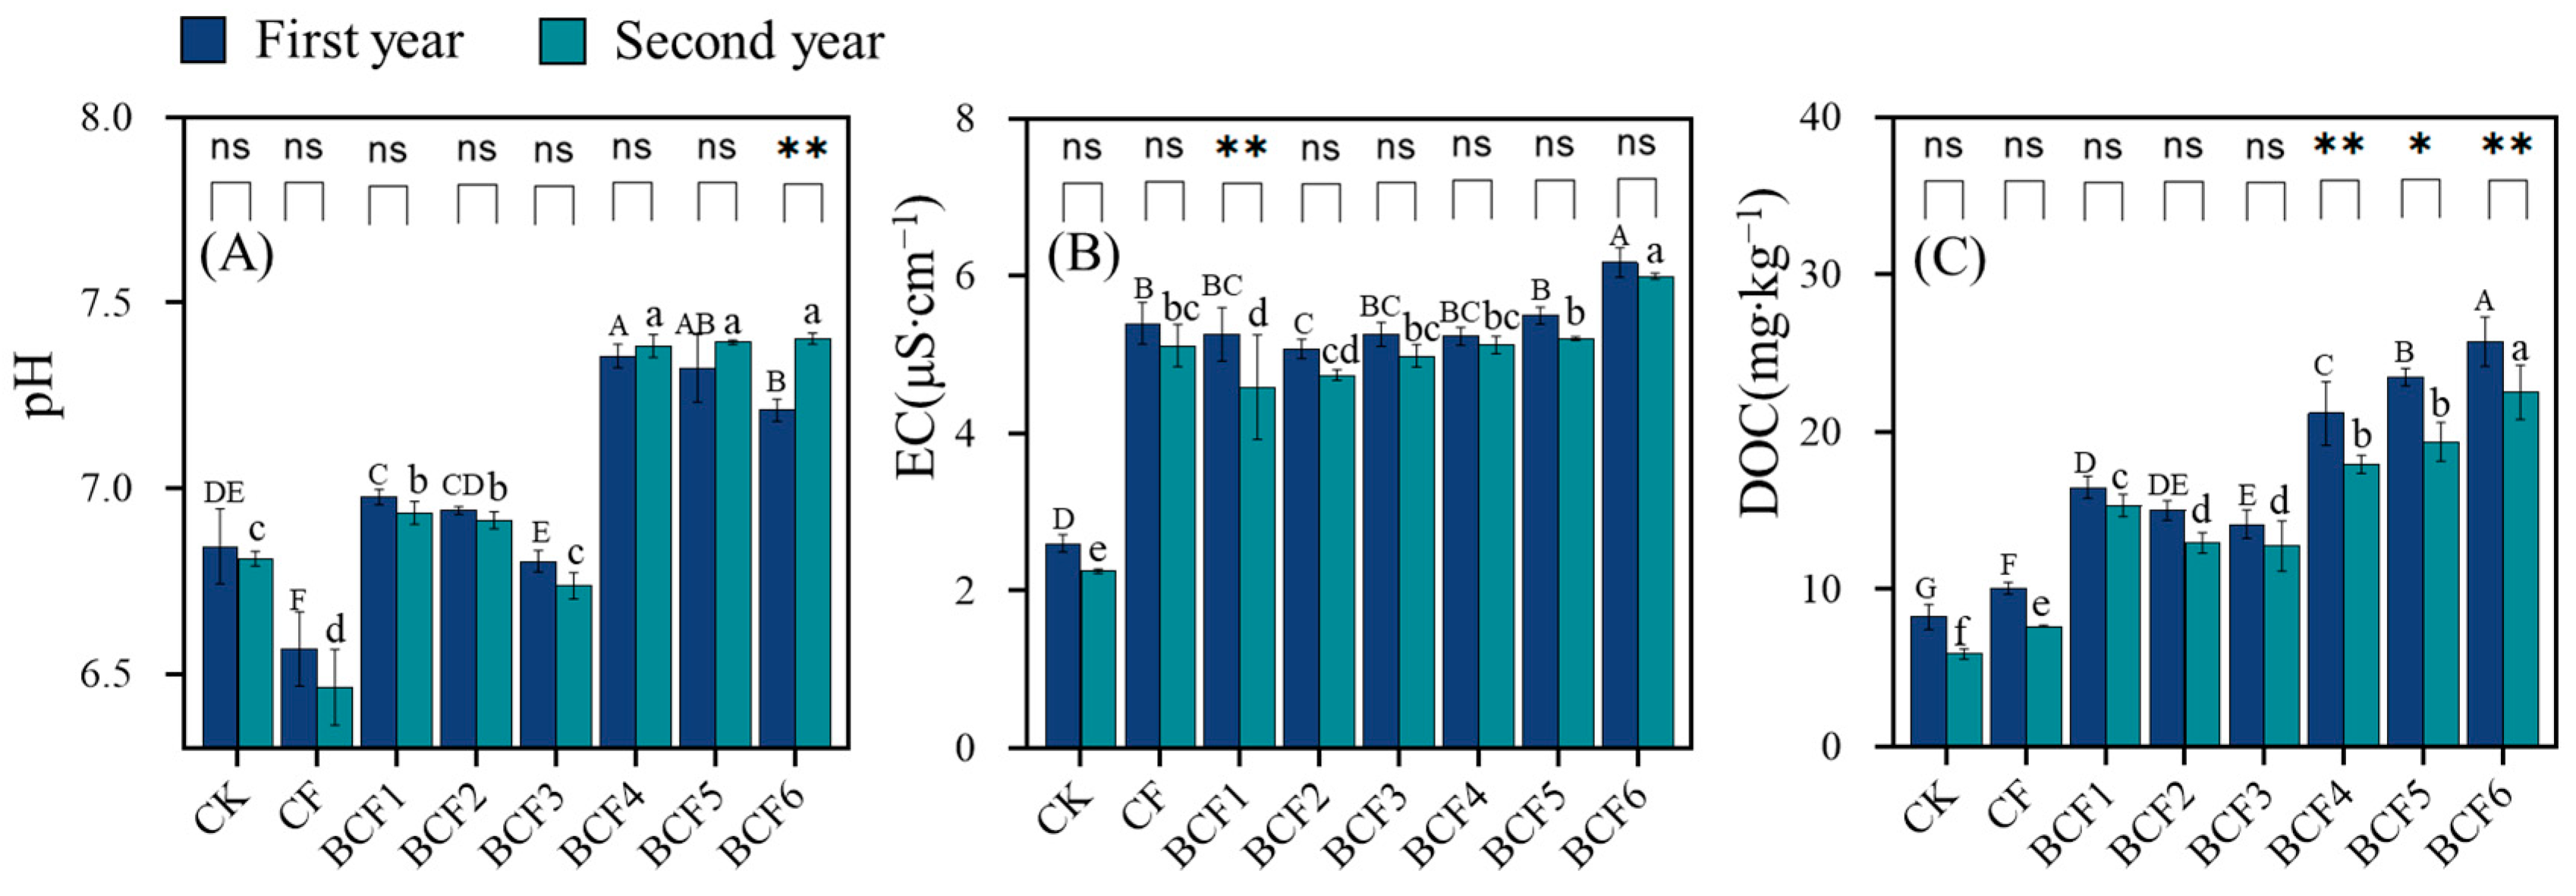
Figure 2A shows that, in two years, soil pH reduce in the chemical fertilizer alone (CF) and 20% biochar replacement ratio (BCF3) treatments compared to the CK, and the CF treatment shows the greatest decline, with decreases of 0.27 and 0.35 units over the CK in both years. The pH in other treatments increased compared to the control: the BCF4, BCF5, and BCF6 treatments significantly increased the soil pH by 0.52, 0.48, and 0.37 units in the first year and 0.58, 0.59, and 0.60 units in the second year, respectively (p < 0.05).
Chemical fertilizer treatments or combined treatments both significantly increased soil EC values (Figure 2B). In both years, the EC value of the BCF6 treatment was the highest, which was 3.1 times and 2.7 times that of CK. Soil EC values were generally higher in the first year than in the second year (p < 0.05).
All fertilizer treatments increased soil DOC contents (p < 0.05) (Figure 2C). DOC content increased with the increase in chemical fertilizer when the biochar ratio was fixed, but decreased when the biochar ratio was decreased. The effectiveness of the treatments in both years followed the order: BCF6 > BCF5 > BCF4 > BCF1 > BCF2 > BCF3 > CF > CK. The BCF6 treatment was the most effective, increasing by 212.9% and 282.6% compared to the CK in two years. DOC content was higher in the first year than in the second year.

3.2. Effect of the Co-Application of Biochar and Chemical Fertilizer on Soil Fertility

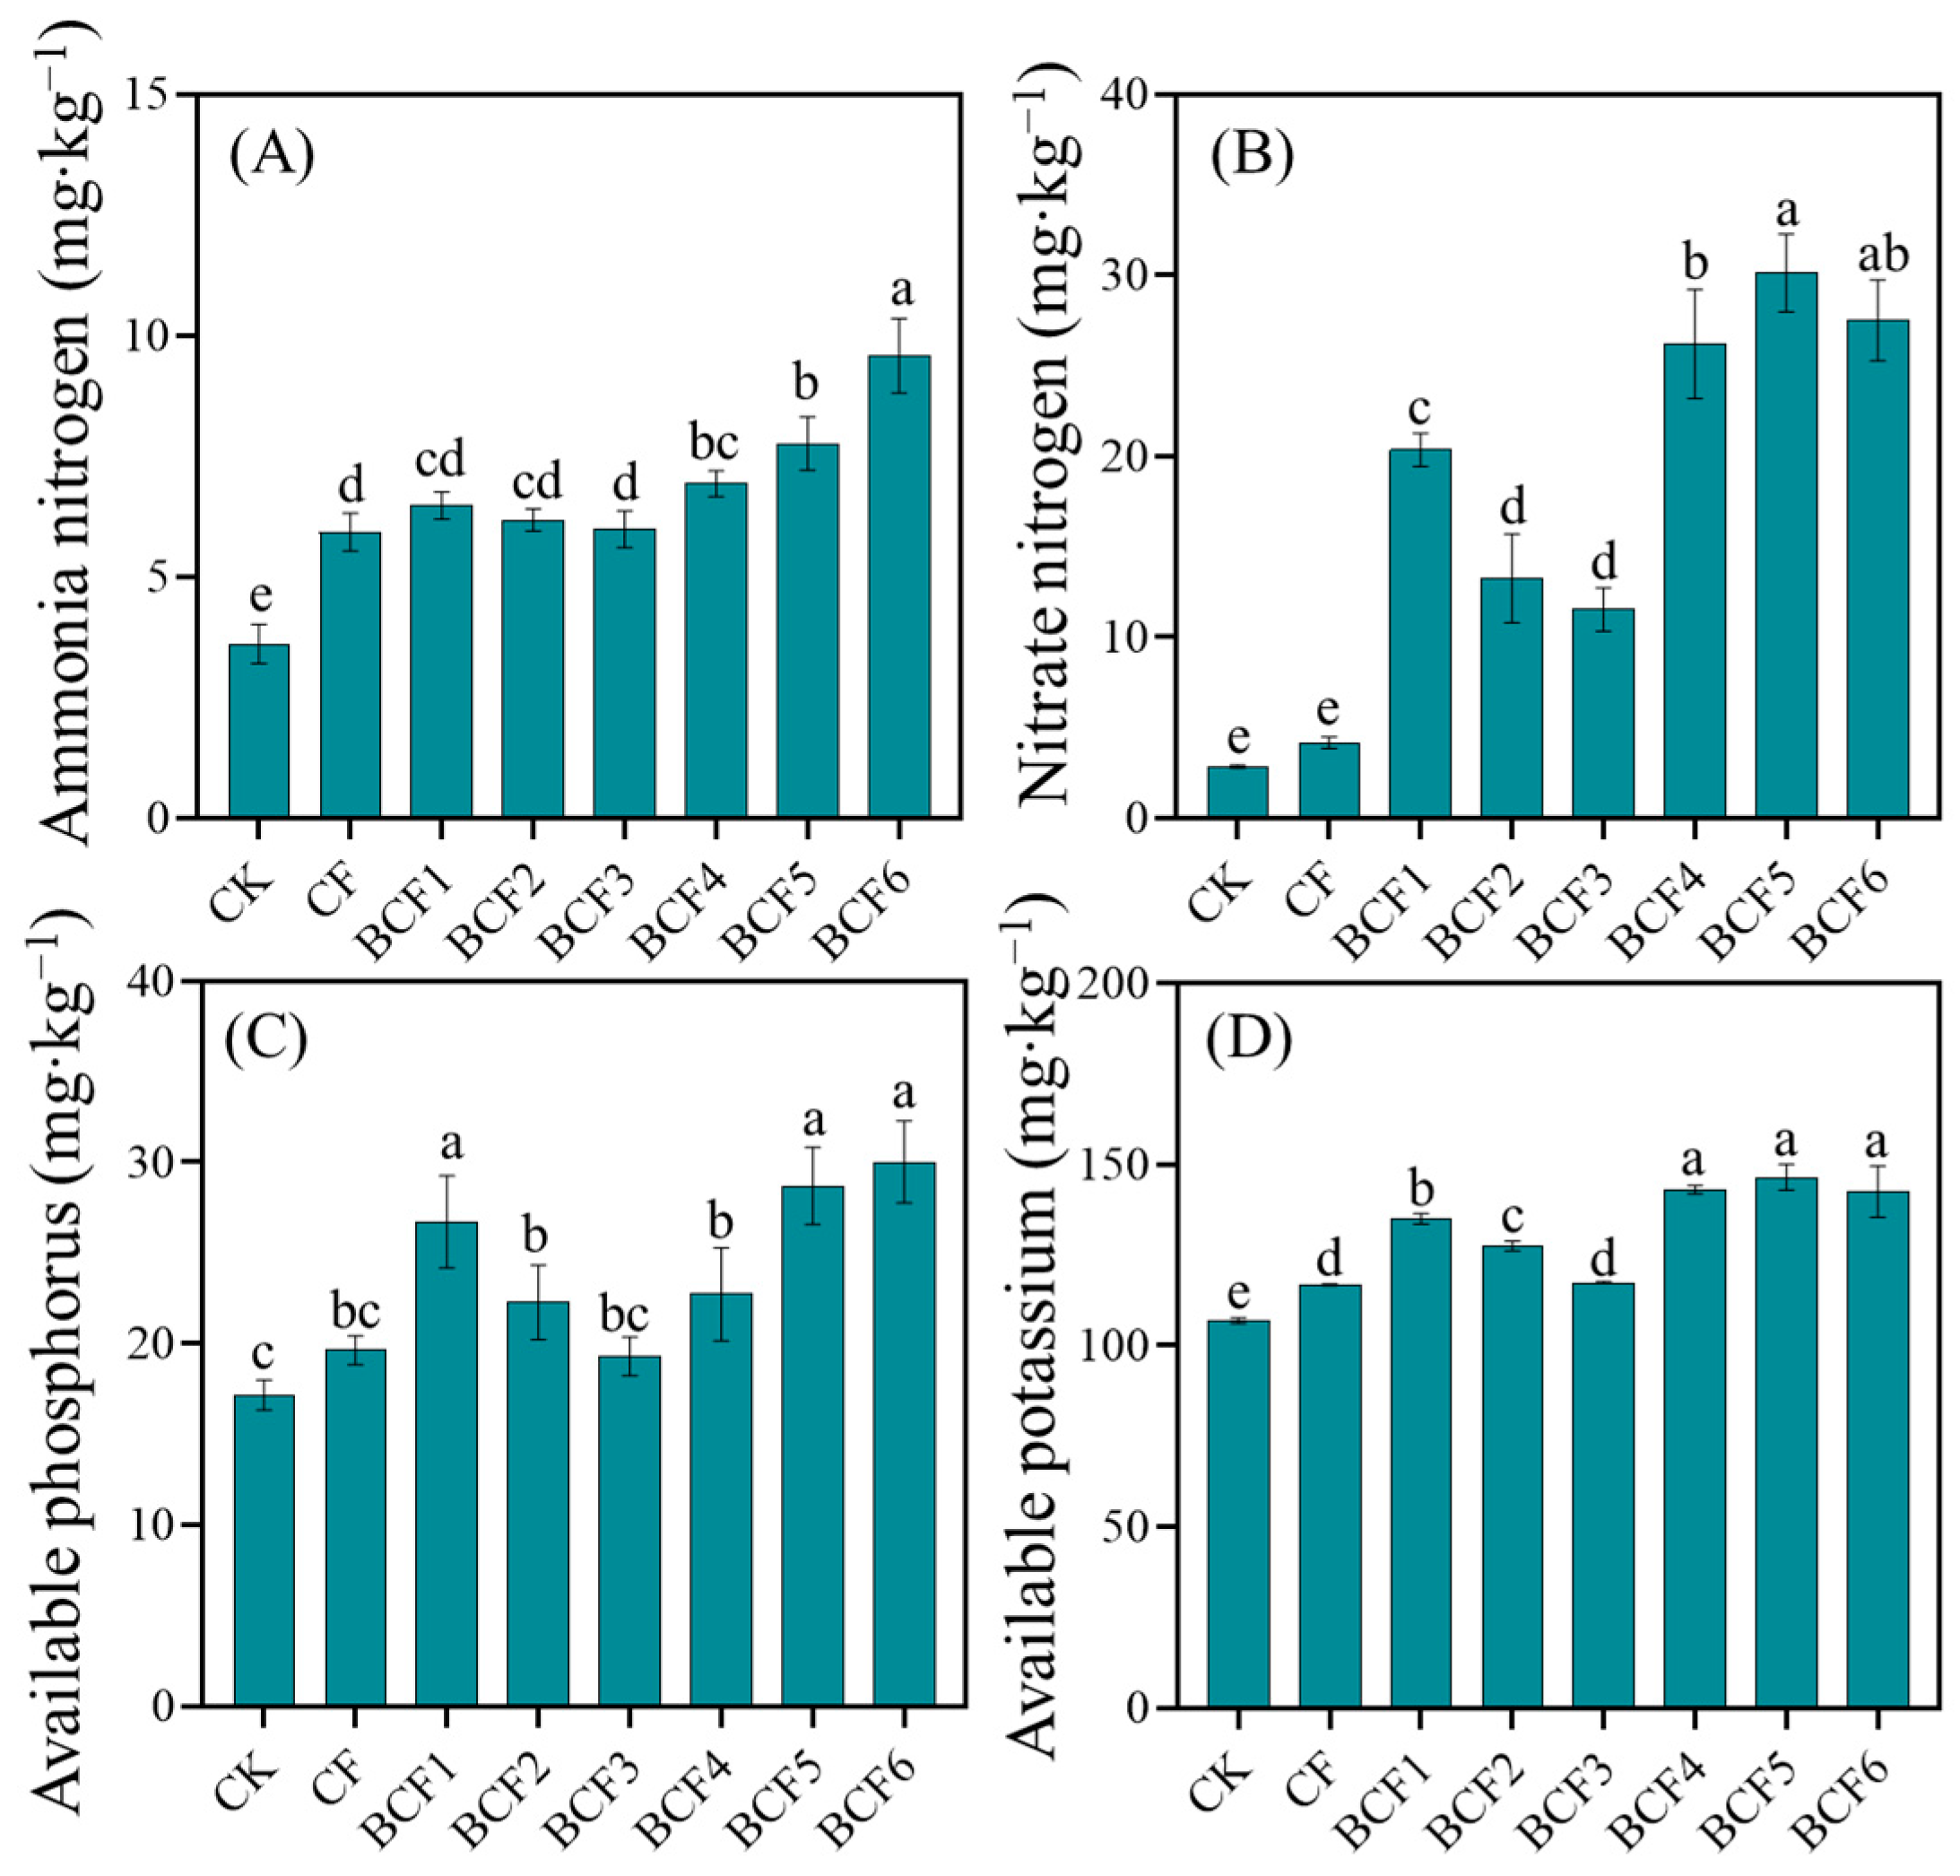
In this study, each fertilizer treatment increased soil NH 4 + -N content in comparison to the CK (Figure 3A). Soil NH 4 + -N content showed an increasing trend when increasing the chemical fertilizer ratio in the combined treatment of the fixed biochar ratio. Among them, BCF6 had the highest NH 4 + -N content of 9.56 mg·kg−1. After two years of fertilizer application and planting, soil N O 3 -N enhancement was significant in the combined treatment compared to the CK (Figure 3B), and soil N O 3 -N gradually increased as the percentage of biochar increased. Among all treatments, the BCF5 treatment peaked at 30.12 mg·kg−1, which was 10.6 times that of the CK.
The application of biochar in conjunction with chemical fertilizers significantly increased the AP content in the soils (Figure 3C); the AP content of BCF1, BCF5, and BCF6 treatments was 1.6, 1.7, and 1.8 times that of the CK, respectively. Soil AK increased under all treatments (Figure 3D). Soil AK content showed an upward trend with the increasing proportion of biochar. In the fixed-dose biochar treatments (BCF4-BCF6), soil AK levels did not change significantly with increasing chemical fertilizer and were about 38% higher than in the CK.

3.3. Effect of the Co-Application of Biochar and Chemical Fertilizer on Chinese Cabbage Growth

During cultivation, the growth rate and final increase in plant height of Chinese cabbage varied among treatments (Table 2). In the first year, the combined treatments (BCF1-BCF6) increased the plant’s height significantly by 100–142%, while the CK and CF increased by only 48% and 13% after 50 d of treatment, respectively. The BCF4 treatment was the most effective, with the plant’s height 2.4-times higher than that of the CK. Plant height in all treatments in the second year showed a decreasing trend compared to the first year, but BCF1-BCF3 treatments still showed higher growth rates than the CK and CF at 29-50 d, and the plant height increased with the increase in biochar. In BCF4-BCF6, plant height increased with increasing the chemical fertilizer. The BCF1-BCF6 treatments increased plant height by 66–148%, while the CK and CF increased it by 56% and 51% after 50 d of treatment, respectively. The effect of BCF1 treatment was the most obvious, and the plant’s height was 1.6 times that of the CK.
The number of leaves of Chinese cabbage under all treatments showed an increasing trend in the range of 29–50 d (Table 3). Leaf numbers after 50 d were higher in combined treatments than chemical fertilizer and CK treatments during Chinese cabbage planting in the first year. Compared with the first year, the number of leaves decreased in the second year; however, the effect of combined treatment on increasing the number of leaves was still significant, and the effectiveness of the treatments in two years was ranked as follows: BCF4 > BCF6 > BCF5 > BCF1 > BCF2 > BCF3 > CF > CK. After 50 d of cultivation, the BCF4 treatment had the best effect, where its number of leaves increased by 92% and 95% compared to the CK in the first and second years, respectively.

3.4. Effect of the Co-Application of Biochar and Chemical Fertilizer on Chinese Cabbage Yield

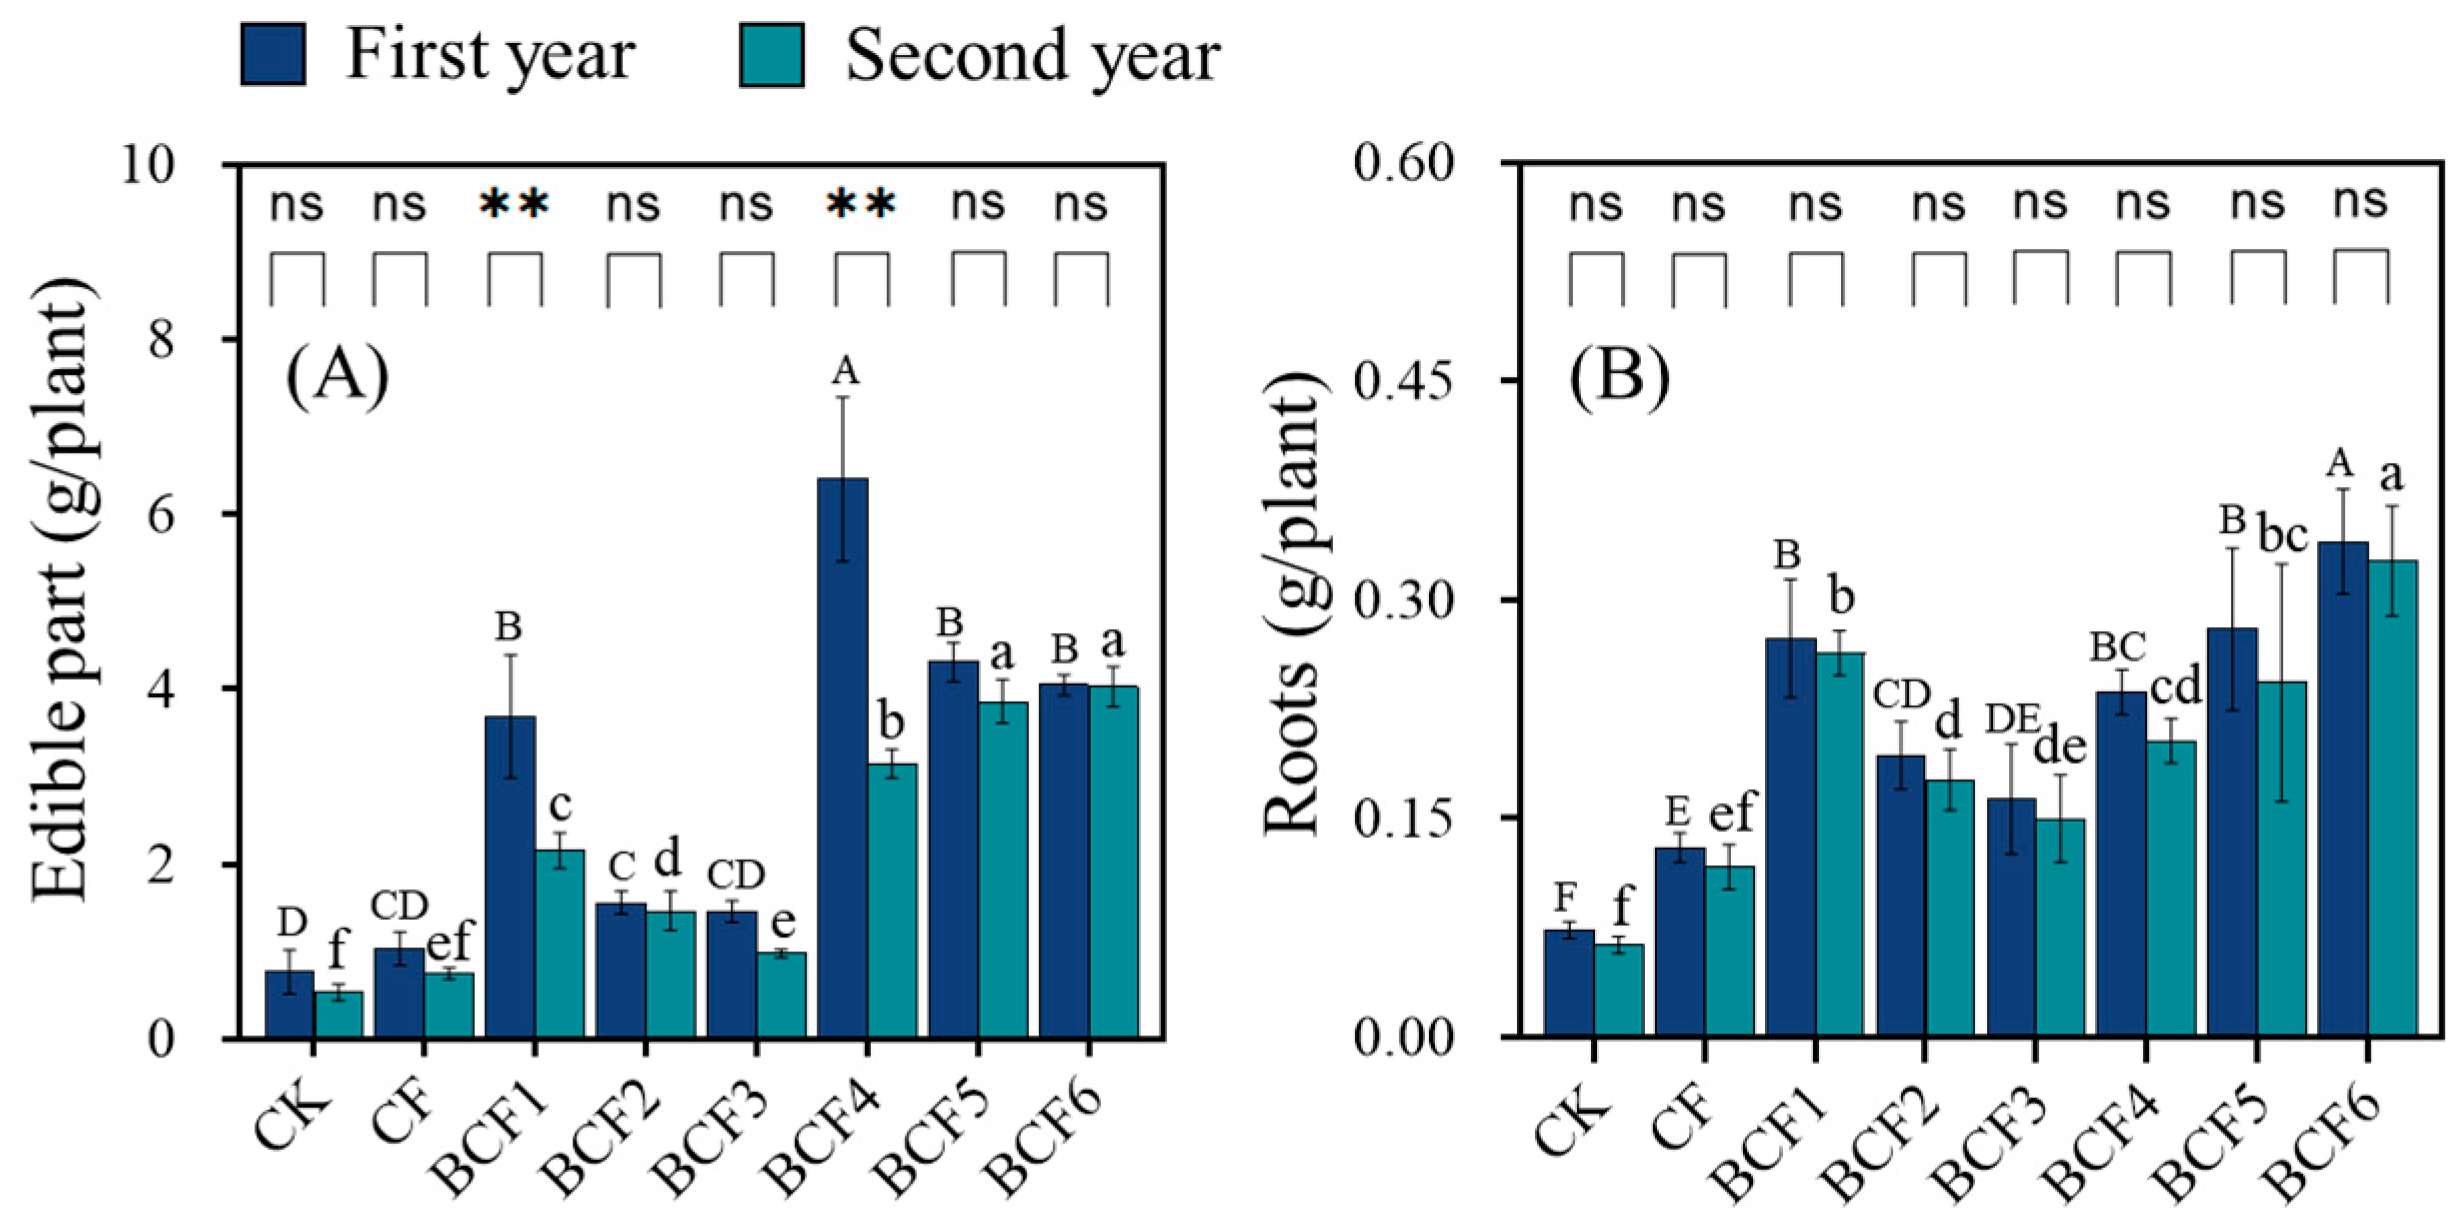
As shown in Figure 4, in two years, the biomass of both the above- and underground parts of Chinese cabbage increased after each fertilizer treatment compared to the CK, and they increased with the higher percentage of biochar in the combined treatment. In addition, when the amount of biochar was fixed, the biomass increased in year 2 when increasing the chemical fertilizer. In the first year, compared to the CK, the aboveground part of the biomass under BCF4 treatment had the most significant effect, with 8.39 times that of the CK. The underground part of the biomass was the most significant in the BCF6 experiment, with 4.66 times that of the CK. In the second year, the biomass decreased compared to the previous year, where the above- and underground fresh weights were the highest during BCF6 treatment, which were 7.6 times and 5.19 times that of the CK, respectively.

3.5. Effect of the Co-Application of Biochar and Chemical Fertilizer on the Quality of Chinese Cabbage

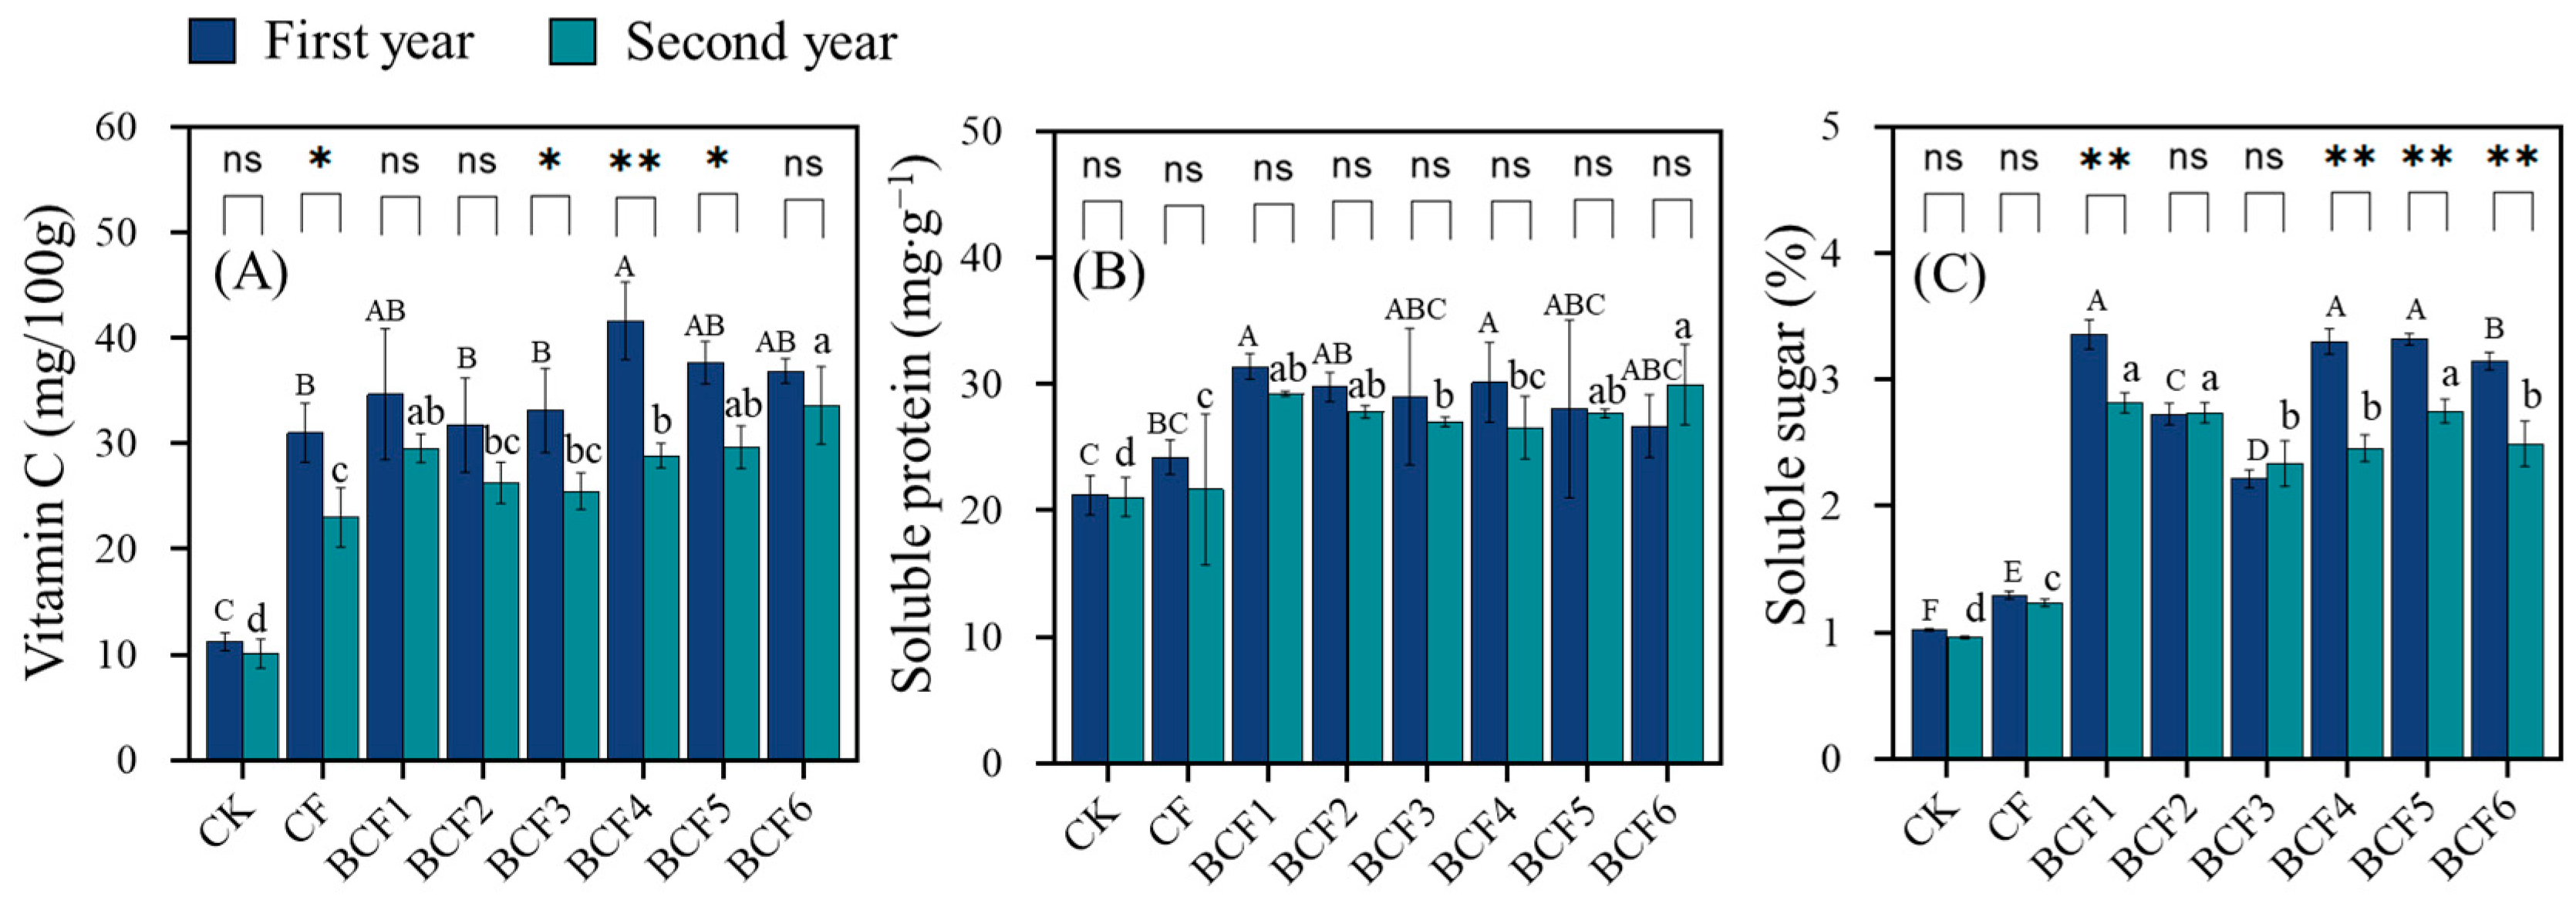
As shown in Figure 5A, each fertilizer treatment significantly increases the vitamin C content of Chinese cabbage in the range of 176.4–270.9% compared to the CK in the first year. The efficacy of the treatments ranked as follows: BCF4 > BCF5 > BCF6 > BCF1 > BCF3 > BCF2 > CF > CK, and the BCF4 treatment was the most effective, increasing by 270.9% compared to the CK. In the second year of vegetable cultivation, vitamin C content decreased following all treatments compared to the first year, but were still significantly greater than the CK exposed to fertilizer treatments. The BCF6 treatment had the most significant effect, increasing by 232.8% compared to the CK, and it showed no significant difference between the two years.
In Figure 5B, the soluble protein of Chinese cabbage increases following each fertilizer treatment compared to the CK in two years, with the highest soluble protein contents of 31.4 mg·g−1 and 30.0 mg·g−1 in the BCF1 treatment in the first year and in the BCF6 treatment in the second year, respectively. Compared to the first year, the soluble protein content in the second year showed a decreasing trend after most treatments, but it was elevated by 12.3% in the BCF6 treatment compared to that in the first year. The most significant effect was observed in the BCF6 treatment, which increased by 42.2% compared to the CK.
Chinese cabbage soluble sugar content was significantly (p < 0.05) higher in the combined treatments (BCF1-BCF6) than the CK and CF treatments in both years (Figure 5C). In the first year, BCF1, BCF4, and BCF5 treatments had the highest soluble sugar content of about 3.3%, which was three-times higher than the CK. Compared to the first year, the soluble sugar content of Chinese cabbage in the second year decreased in most treatments, while BCF3 treatment elevated it by 5.9%. After two years of cultivation, the BCF1 treatment showed the greatest improvement, increasing by 193.4% compared to the CK.

4. Discussion

4.1. Effect of the Co-Application of Biochar and Chemical Fertilizer on Soil Properties

The alkaline property of biochar increased the hydroxyl concentration of soil pore water, thus raising the soil pH [38] in the combined treatment and relating to the proportion of biochar application. Conversely, chemical fertilizers contain urea and monoammonium phosphate; besides the acidic features of monoammonium phosphate, they can also be hydrolyzed to ammonia, which results in the release of H + when ammonia ions are taken up by plants [39,40,41]. This leads to the decrease in soil pH when the chemical fertilizers are added alone. The simultaneous use of both biochar and chemical fertilizer may result in neutralization from the alkalinity of biochar, and the degree of neutralization decreases with increasing chemical fertilizer rates [42]. When more biochar was added (BCF4-BCF6), the chemical fertilizer became less acidic due to degradation, allowing the alkaline effect of the biochar to dominate, which resulted in an elevated soil pH in the second year.
The EC of soil is a measurement of the ability of dissolved ions in the soil to conduct electricity and is often used to assess the salinity and moisture content of soil [43]. A higher EC indicates a higher salt content in the soil. The primary constituents of chemical fertilizers, including N, P, and K, release corresponding cations (e.g., NH 4 +   and   K + ) and anions (e.g., N O 3 and P O 4 3 ) after dissolution in the soil. These ions dissolved in water can increase the EC in the soil solution [44]. Biochar is a form of organic matter, and when it decomposes, it releases organic acids and other organic substances. These organic substances can react with minerals in the soil to form electrolytes and increase the EC [45,46,47]. In the second year, a significant increase in EC was observed compared to the control without the additional fertilizer being attributed to the absorption of nutrients by biochar, which gradually releases them into the soil [48]. This process results in relatively high soil ion concentrations.
Soil DOC content increased with the addition of fertilizers. The application of chemical fertilizers may promote the growth of plant roots and the level of organic secretions from the root system, thus increasing the soil DOC content [49,50]. It has been reported that the main substance (C) and other macronutrients in biochar can provide a good environment for microbial growth [51,52,53]. Generally, the decomposition of organic matter by microorganisms can produce metabolites, such as extracellular enzymes and soluble organic matter, thus increasing the DOC concentration [46]. Therefore, the soil DOC content synergistically increased through root exudates and microorganisms with the addition of biochar and increased as the proportion of biochar increased.
The addition of N, P, and K relates to the quality of Chinese cabbage; their deficiency would lead to a negative influence, like restraining the formation of heads [54,55]. In this study, the combined treatments could enhance the soil’s absorption and holding capacities of N O 3 -N and NH 4 + -N, and slow the release of N. Biochar addition enhanced soil mineral nitrogen content significantly, which was mainly because biochar itself contains a portion of N, and the greater its addition, the greater the soil N content [56,57,58]. Secondly, due to its large specific surface area and hollow and lightweight characteristics, biochar suppresses denitrification in soil by improving aeration [59,60,61], thus increasing the effective N concentration ( N O 3 -N and NH 4 + -N). Moreover, biochar and chemical fertilizer combination treatments increased soil AP and AK contents compared to the CK. It has been found that biochar maintains sustained agricultural production by providing N, P, and K to soil [14]. The metal cations adsorbed by biochar transform the form of P in the soil and activated P, increasing the proportion of AP in the soil [62]. Biochar can also adsorb P O 4 3 - in a soil solution, reducing the competition for the closed-state fixation of AP by alumina and iron colloids in the soil [18,63,64]. In terms of K, biochar is relatively rich in K, which may lead to an increase in AK content [65]. It may also facilitate the conversion of soil K forms to AK by promoting the growth of potassium-solubilizing bacteria [65]. In addition, when biochar is applied with chemical fertilizers, its structure can absorb the nutrients from the chemical fertilizer, thus reducing nutrient loss, slowing the rate of nutrient release, and enables chemical fertilizers to be used for a longer period of time. Moreover, biochar can also improve soil structure and serves to maintain water and fertilizer retention [66]. Therefore, the use of both can reduce the loss of soil nutrients due to the overuse of chemical fertilizers.

4.2. Effect of the Co-Application of Biochar and Chemical Fertilizer on Chinese Cabbage Growth

The study showed that the co-application of biochar and chemical fertilizer was effective in increasing the above- and belowground fresh weights of Chinese cabbage (Figure 4). Gu et al. [67] found that the combined application of biochar and chemical fertilizer increased the dry matter content of crops by 5.50% and 19.19% and increased crop yields by 2.41% and 5.78%. This may be due to the fact that biochar can absorb and replenish nutrients (N, P, K, etc.) in soil through its high surface area and minerals, thereby reducing nutrient loss [68]. The improvement of the soil’s microbiological environment by biochar may be another reason for promoting crop growth and increasing yields [69].
N in the fertilizer used is present in the form of NH 4 + -N; excess NH 4 + -N can produce ammonium toxicity, leading to poorer plant growth [70]. As fertilizer application decreases, ammonium toxicity decreases so that plant growth is not inhibited. It is worth noting that, although high doses of chemical fertilizer applied in combination with biochar (BCF4) can limit crop growth and reduce yields, prolonged application times can mitigate these adverse effects [67]. This is consistent with the findings of An et al. [20].
The content of vitamin C, soluble protein, and soluble sugar in Chinese cabbage is an important indicator of its quality, which directly affects the nutritional value of Chinese cabbage [71,72]. Combined treatments could improve the quality of Chinese cabbage, and the enhancement effect was better than that of the CK and CF treatments (Figure 5). This may be due to the fact that chemical N fertilizers increase the protein and amino acids in the plant, thereby promoting the synthesis of vitamin C [73]. Elemental P is important for energy metabolism and sugar synthesis in plants [74,75]. The appropriate amount of P fertilizer can increase the content of soluble sugar in Chinese cabbage [76]. Trace elements and organic substances in biochar can be directly absorbed and utilized by plants, which may promote the synthesis of components such as vitamin C, soluble sugars, and proteins in Chinese cabbage [77]. In addition, Zeeshan et al. [78] found that biochar increased the photosynthetic rate of leaves and promoted the transport of photosynthetic products to fruits, thereby improving plant quality. Biochar also promotes the adsorption of NH 4 + -N and reduces its conversion to N O 3 -N, thus increasing vitamin C in the plants [79,80]. The decreased quality of Chinese cabbage in the second year can be primarily attributed to the mechanisms of nutrient uptake and the slow-release characteristics of biochar.

5. Conclusions

This study investigated the effect of biochar used in conjunction with chemical fertilizer on Chinese cabbage cultivation in a two-year pot experiment. The results show that this method can significantly improve soil properties and soil fertility. It also increases the biomass and quality of Chinese cabbage in two years. The higher proportion of biochar, the greater the growth rate of Chinese cabbage. The amount of chemical fertilizers should not be too high to avoid the accumulation of excessive salts in the soil, which may be detrimental to productivity. In addition, the growth rate of Chinese cabbage decreased in the second year, but the combined use of biochar and chemical fertilizer had long-term efficacy in improving soil performance compared to chemical fertilizer alone. Among them, under BCF6 (1.5 g biochar + 80% of optimal chemical fertilizer) treatment, it was more favorable to the improvement of soil fertility in the second year, which further promoted plant growth and development. Considering the need to save agricultural inputs, biochar addition should not be too high. The co-application of biochar and chemical fertilizer provides an innovative fertilization strategy for the effective improvement of soil properties and crop quality, and their environmentally friendly nature highlights their potential for wider application in sustainable agricultural practices. In addition, it is necessary to conduct future studies to examine the effects of the co-application of biochar and fertilizer on crops as well as soils over a longer period of time.

Author Contributions

Conceptualization, X.Z. (Xinyu Zhao) and L.H.; Methodology, J.W., T.G. and X.M.; Software, K.G.; Validation, H.Z.; Data curation, X.Z. (Xinyu Zhao), L.H. and K.G.; Writing—original draft, X.Z. (Xinyu Zhao); Writing—review & editing, L.H., K.G., H.Z., J.W., T.G., X.M. and X.Z. (Xiaokai Zhang); Supervision, X.Z. (Xiaokai Zhang); Funding acquisition, X.Z. (Xiaokai Zhang). All authors have read and agreed to the published version of the manuscript.

Funding

This research was funded by projects from the National Natural Science Foundation of China (42107245).

Institutional Review Board Statement

Not applicable.

Informed Consent Statement

Not applicable.

Data Availability Statement

The data presented in this study are available on request from the corresponding authors.

Conflicts of Interest

Author Kun Geng was employed by the company Changzhou Xingyu Automotive Lighting Systems Co., Ltd. The remaining authors declare that the research was conducted in the absence of any commercial or financial relationships that could be construed as a potential conflict of interest.

References

  1. Jiang, Z.X.; Zheng, H.; Xing, B.S. Environmental life cycle assessment of wheat production using chemical fertilizer, manure compost, and biochar-amended manure compost strategies. Sci. Total Environ. 2021, 760, 143342. [Google Scholar] [CrossRef] [PubMed]
  2. Wheeler, T.; Von Braun, J. Climate change impacts on global food security. Science 2013, 341, 508–513. [Google Scholar] [CrossRef]
  3. Qi, Y.; Jiang, F.; Zhou, R.; Wu, Y.; Hou, X.; Li, J.; Lin, W.; Wu, Z. Effects of Reduced Nitrogen with Bio-Organic Fertilizer on Soil Properties, Yield and Quality of Non-Heading Chinese Cabbage. Agronomy 2021, 11, 2196. [Google Scholar] [CrossRef]
  4. Liang, X.; Wang, C.; Wang, H.; Qiu, X.; Ji, H.; Ju, H.; Wang, J. Synergistic effect on soil health from combined application of biogas slurry and biochar. Chemosphere 2023, 343, 140228. [Google Scholar] [CrossRef] [PubMed]
  5. Thakur, B.K.; Sharma, S.; Sharma, A.; Singh, K.K.; Pal, P.K. Integration of biochar with nitrogen in acidic soil: A strategy to sequester carbon and improve the yield of stevia via altering soil properties and nutrient recycling. J. Environ. Manag. 2023, 345, 118872. [Google Scholar] [CrossRef]
  6. Zhang, M.Y.; Muhammad, R.; Zhang, L.; Xia, H.; Cong, M.; Jiang, C.C. Investigating the effect of biochar and fertilizer on the composition and function of bacteria in red soil. Appl. Soil Ecol. 2019, 139, 107–116. [Google Scholar] [CrossRef]
  7. Zhang, J.; Wang, J.; An, T.; Wei, D.; Chi, F.; Zhou, B. Effects of long-term fertilization on soil humic acid composition and structure in Black Soil. PLoS ONE 2017, 12, e0186918. [Google Scholar] [CrossRef]
  8. Huang, J.; Xu, C.C.; Ridoutt, B.G.; Wang, X.C.; Ren, P.A. Nitrogen and phosphorus losses and eutrophication potential associated with fertilizer application to cropland in China. J. Clean. Prod. 2017, 159, 171–179. [Google Scholar] [CrossRef]
  9. Zhou, T.; Chen, L.; Wang, W.; Xu, Y.; Zhang, W.; Zhang, H.; Liu, L.; Wang, Z.; Gu, J.; Yang, J. Effects of application of rapeseed cake as organic fertilizer on rice quality at high yield level. J. Sci. Food Agric. 2022, 102, 1832–1841. [Google Scholar] [CrossRef]
  10. Gao, Y.; Sun, Y.; Song, W.; Jia, Y.; Li, A.; Wang, S. Intrinsic properties of biochar for electron transfer. Chem. Eng. J. 2023, 475, 146356. [Google Scholar] [CrossRef]
  11. Zhou, J.S.; Tang, C.X.; Kuzyakov, Y.; Vancov, T.; Fang, Y.Y.; Song, X.Z.; Zhou, X.H.; Jiang, Z.H.; Ge, T.D.; Xu, L.; et al. Biochar-based urea increases soil methane uptake in a subtropical forest. Geoderma 2024, 449, 116994. [Google Scholar] [CrossRef]
  12. Zhang, D.X.; Jie, H.B.; Zhang, W.J.; Yuan, Q.S.; Ma, Z.H.; Wu, H.Z.; Rao, W.; Liu, S.L.; Wang, D.C. Combined biochar and water-retaining agent application increased soil water retention capacity and maize seedling drought resistance in Fluvisols. Sci. Total Environ. 2024, 907, 167885. [Google Scholar] [CrossRef]
  13. Zhang, J.H.; Bai, Z.G.; Huang, J.; Hussain, S.; Zhao, F.T.; Zhu, C.Q.; Zhu, L.F.; Cao, X.C.; Jin, Q.Y. Biochar alleviated the salt stress of induced saline paddy soil and improved the biochemical characteristics of rice seedlings differing in salt tolerance. Soil Till. Res. 2019, 195, 104372. [Google Scholar] [CrossRef]
  14. Alkharabsheh, H.M.; Seleiman, M.F.; Battaglia, M.L.; Shami, A.; Jalal, R.S.; Alhammad, B.A.; Almutairi, K.F.; Al-Saif, A.M. Biochar and its broad impacts in soil quality and fertility, nutrient leaching and crop productivity: A review. Agronomy 2021, 11, 993. [Google Scholar] [CrossRef]
  15. Major, J.; Rondon, M.; Molina, D.; Riha, S.J.; Lehmann, J. Maize yield and nutrition during 4 years after biochar application to a Colombian savanna oxisol. Plant. Soil 2010, 333, 117–128. [Google Scholar] [CrossRef]
  16. Munda, S.; Bhaduri, D.; Mohanty, S.; Chatterjee, D.; Tripathi, R.; Shahid, M.; Kumar, U.; Bhattacharyya, P.; Kumar, A.; Adak, T.; et al. Dynamics of soil organic carbon mineralization and C fractions in paddy soil on application of rice husk biochar. Biomass Bioenergy 2018, 115, e17835. [Google Scholar] [CrossRef]
  17. Yu, M.J.; Meng, J.; Yu, L.; Su, W.Q.; Afzal, M.; Li, Y.; Brookes, P.C.; Redmile-Gordon, M.; Luo, Y.; Xu, J.M. Changes in nitrogen related functional genes along soil pH, C and nutrient gradients in the charosphere. Sci. Total Environ. 2019, 650, 626–632. [Google Scholar] [CrossRef]
  18. Hossain, M.Z.; Bahar, M.M.; Sarkar, B.; Donne, S.W.; Ok, Y.S.; Palansooriya, K.N.; Kirkham, M.B.; Chowdhury, S.; Bolan, N. Biochar and its importance on nutrient dynamics in soil and plant. Biochar 2020, 2, 379–420. [Google Scholar] [CrossRef]
  19. He, L.L.; Zhong, Z.K.; Yang, H.M. Effects on soil quality of biochar and straw amendment in conjunction with chemical fertilizers. J. Integr. Agric. 2017, 3, 704–712. (In Chinese) [Google Scholar] [CrossRef]
  20. An, N.; Zhang, L.; Liu, Y.; Shen, S.; Li, N.; Wu, Z.; Yang, J.; Han, W.; Han, X. Biochar application with reduced chemical fertilizers improves soil pore structure and rice productivity. Chemosphere 2022, 298, 134304. [Google Scholar] [CrossRef]
  21. Yu, X.; Liu, Y.; Zhang, M.; Ai, S.; Wang, R.; Zhu, L.; Zhang, H.; Li, T.; Zhu, Y.; Tu, C.; et al. Coupled effects of reduced chemical fertilization and biochar supplementation on availability and transformations of nitrogen and phosphorus in vegetable farmland soil: An in situ study in southern China. Agriculture 2021, 11, 979. [Google Scholar] [CrossRef]
  22. Zhang, M.; Liu, Y.; Wei, Q.; Liu, L.; Gu, X.; Gou, J.; Wang, M. Chemical fertilizer reduction combined with biochar application ameliorates the biological property and fertilizer utilization of pod pepper. Agronomy 2023, 13, 1616. [Google Scholar] [CrossRef]
  23. Parker, N.; Agyare, W.A.; Bessah, E.; Amegbletor, L. Biochar as a substitute for inorganic fertilizer: Effects on soil chemical properties and maize growth in Ghana. J. Plant Nutr. 2021, 44, 1539–1547. [Google Scholar] [CrossRef]
  24. Shi, W.; Bian, R.; Li, L.; Lian, W.; Liu, X.; Zheng, J.; Cheng, K.; Zhang, X.; Drosos, M.; Joseph, S.; et al. Assessing the impacts of biochar-blended urea on nitrogen use efficiency and soil retention in wheat production. GCB Bioenergy 2022, 14, 65–83. [Google Scholar] [CrossRef]
  25. Zhang, Z.Y.; Zhang, C.Z.; Liu, X.J.; Hong, X.Y. Dynamics of pesticide residues in the autumn Chinese cabbage (Brassica chinensis L.) grown in open fields. Pest Manag. Sci. 2006, 62, 350–355. [Google Scholar] [CrossRef] [PubMed]
  26. Ouyang, D.; Wu, R.; Xu, Z.; Zhu, X.; Cai, Y.; Chen, R.; Zhu, C.; Barceló, D.; Zhang, H. Efficient degradation of Bisphenol A by Fe3+/Fe2+ cycle activating persulfate with the assistance of biochar-supported MoO2. Chem. Eng. J. 2023, 455, 140381. [Google Scholar] [CrossRef]
  27. Wang, Y.; Wang, S.; Yan, X.; Gao, S.; Man, T.; Yang, Z.; Ren, L.; Wang, P. Preparation of liquid bacteria fertilizer with phosphate-solubilizing bacteria cultured by food wastewater and the promotion on the soil fertility and plants biomass. J. Clean. Prod. 2022, 370, 133328. [Google Scholar] [CrossRef]
  28. Jiang, Y.; Nie, W.J. Chemical properties in fruits of mulberry species from the Xinjiang province of China. Food Chem. 2015, 174, 460–466. [Google Scholar] [CrossRef] [PubMed]
  29. Buysse, J.; Merckx, R. An improved colorimetric method to quantify sugar content of plant tissue. J. Exp. Bot. 1993, 44, 1627–1629. [Google Scholar] [CrossRef]
  30. Ouyang, Z.; Tian, J.; Yan, X.; Shen, H. Effects of different concentrations of dissolved oxygen or temperatures on the growth, photosynthesis, yield and quality of lettuce. Agric. Water Manag. 2020, 228, 105896. [Google Scholar] [CrossRef]
  31. Shen, W.; Lin, X.; Gao, N.; Zhang, H.; Yin, R.; Shi, W.; Duan, Z. Land use intensification affects soil microbial populations, functional diversity and related suppressiveness of cucumber Fusarium wilt in China’s Yangtze River Delta. Plant. Soil 2008, 306, 117–127. [Google Scholar] [CrossRef]
  32. Wang, Q.; Ren, Y.; Meng, L.; Li, H.; Fu, H.; Wang, H. Simultaneous determination of total nitrogen and organic carbon in soil with an elemental analyzer. Chin. J. Anal. Lab. 2013, 32, 41–45. (In Chinese) [Google Scholar] [CrossRef]
  33. Tao, R.; Wakelin, S.A.; Liang, Y.; Chu, G. Response of ammonia-oxidizing archaea and bacteria in calcareous soil to mineral and organic fertilizer application and their relative contribution to nitrification. Soil Biol. Biochem. 2017, 114, 20–30. [Google Scholar] [CrossRef]
  34. Qiao, J.B.; Zhu, Y.J.; Jia, X.X.; Huang, L.M.; Shao, M.A. Vertical distribution of soil total nitrogen and soil total phosphorus in the critical zone on the Loess Plateau, China. Catena 2018, 166, 310–316. [Google Scholar] [CrossRef]
  35. Almeida, T.F.; Carvalho, J.K.; Reid, E.; Martins, A.P.; Bissani, C.A.; Bortoluzzi, E.C.; Brunetto, G.; Anghinoni, I.; Carvalho, P.C.D.; Tiecher, T. Forms and balance of soil potassium from a long-term integrated crop-livestock system in a subtropical Oxisol. Soil Tillage. Res. 2021, 207, 104864. [Google Scholar] [CrossRef]
  36. Rayment, G.E.; Lyons, D.J. New, Comprehensive Soil Chemical Methods Book for Australasia; Taylor & Francis: Abingdon, UK, 2012; pp. 412–418. [Google Scholar] [CrossRef]
  37. Bao, S.D. Analysis Method of Soil and Agricultural Chemistry; China Agricultural Press: Beijing, China, 2000; pp. 25–108. [Google Scholar]
  38. Abedin, J. Enhancing Soils of Labrador through Application of Biochar, Fishmeal, and Chemical Fertilizer. Agron. J. 2018, 110, 2576–2586. [Google Scholar] [CrossRef]
  39. Xie, W.Y.; Yuan, S.T.; Xu, M.G.; Yang, X.P.; Shen, Q.R.; Zhang, W.W.; Su, J.Q.; Zhao, F.J. Long-term effects of manure and chemical fertilizers on soil antibiotic resistome. Soil Biol. Biochem. 2018, 122, 111–119. [Google Scholar] [CrossRef]
  40. Jin, X.; Cai, J.; Yang, S.; Li, S.; Shao, X.; Fu, C.; Li, C.; Deng, Y.; Huang, J.; Ruan, Y. Partial substitution of chemical fertilizer with organic fertilizer and slow-release fertilizer benefits soil microbial diversity and pineapple fruit yield in the tropics. Appl. Soil Ecol. 2023, 189, 104974. [Google Scholar] [CrossRef]
  41. Meena, H.M.; Sharma, R.; Sankhyan, N.; Sepehya, S. Effect of continuous application of fertilizers, farmyard manure and lime on soil fertility and productivity of the maize-wheat system in an acid alfisol. Commun. Soil Sci. Plant Anal. 2017, 48, 1552–1563. [Google Scholar] [CrossRef]
  42. Chintala, R.; Schumacher, T.E.; Kumar, S.; Malo, D.D.; Rice, J.A.; Bleakley, B.; Chilom, G.; Clay, D.E.; Julson, J.L.; Papiernik, S.K.; et al. Molecular characterization of biochars and their influence on microbiological properties of soil. J. Hazard. Mater. 2014, 279, 244–256. [Google Scholar] [CrossRef]
  43. Xie, Y.; Wang, H.; Chen, Y.; Guo, Y.; Wang, C.; Cui, H.; Xue, J. Water retention and hydraulic properties of a natural soil subjected to microplastic contaminations and leachate exposures. Sci. Total Environ. 2023, 901, 166502. [Google Scholar] [CrossRef] [PubMed]
  44. Tan, S.; Xie, D.; Ni, J.; Chen, F.; Ni, C.; Shao, J.; Zhu, D.; Wang, S.; Lei, P.; Zhao, G. Characteristics and influencing factors of chemical fertilizer and pesticide applications by farmers in hilly and mountainous areas of Southwest, China. Ecol. Indic. 2022, 143, 109346. [Google Scholar] [CrossRef]
  45. Chen, M.; Ran, H.; Sommer, S.G.; Liu, Y.; Wang, G.; Zhu, K. The spatiotemporal heterogeneity of fertosphere hotspots impacted by biochar addition and the implications for NH3 and N2O emissions. Chemosphere 2024, 355, 141769. [Google Scholar] [CrossRef] [PubMed]
  46. He, Q.; Li, X.; Ren, Y. Analysis of the simultaneous adsorption mechanism of ammonium and phosphate on magnesium-modified biochar and the slow release effect of fertiliser. Biochar 2022, 4, 25. [Google Scholar] [CrossRef]
  47. Ni, P.; Wang, S.; Liu, B.; Sun, H. Effects of Organic Manure and Biochar-Based Fertilizer Application on Soil Water and Salt Transport in Brackish Water Irrigated Soil Profile. J. Soil Sci. Plant Nutr. 2023, 23, 3120–3136. [Google Scholar] [CrossRef]
  48. Gwenzi, W.; Nyambishi, T.; Chaukura, N.; Mapope, N. Synthesis and nutrient release patterns of a biochar-based N–P–K slow-release fertilizer. Int. J. Environ. Sci. Technol. 2018, 15, 405–414. [Google Scholar] [CrossRef]
  49. Zhang, S.; Li, Y.; Singh, B.P.; Wang, H.; Cai, X.; Chen, J.; Qin, H.; Li, Y.; Chang, S.X. Contrasting short-term responses of soil heterotrophic and autotrophic respiration to biochar-based and chemical fertilizers in a subtropical Moso bamboo plantation. Appl. Soil Ecol. 2021, 157, 103758. [Google Scholar] [CrossRef]
  50. Zhao, X.; Elcin, E.; He, L.; Vithanage, M.; Zhang, X.; Wang, J.; Wang, S.; Deng, Y.; Niazi, N.K.; Shaheen, S.M. Using biochar for the treatment of continuous cropping obstacle of herbal remedies: A review. Appl. Soil Ecol. 2023, 198, 105127. [Google Scholar] [CrossRef]
  51. Zhao, Y.; Lin, S.; Liu, Y.; Li, G.; Wang, J.; Butterbach-Bahl, K. Application of mixed straw and biochar meets plant demand of carbon dioxide and increases soil carbon storage in sunken solar greenhouse vegetable production. Soil Use Manag. 2020, 36, 439–448. [Google Scholar] [CrossRef]
  52. Ali, A.; Guo, D.; Jeyasundar, P.G.S.A.; Li, Y.; Xiao, R.; Du, J.; Li, R.; Zhang, Z. Application of wood biochar in polluted soils stabilized the toxic metals and enhanced wheat (Triticum aestivum) growth and soil enzymatic activity. Ecotox. Environ. Saf. 2019, 184, 109635. [Google Scholar] [CrossRef]
  53. Zhang, H.; Qian, W.; Wu, L.; Yu, S.; Wei, R.; Chen, W.; Ni, J. Spectral characteristics of dissolved organic carbon (DOC) derived from biomass pyrolysis: Biochar-derived DOC versus smoke-derived DOC, and their differences from natural DOC. Chemosphere 2022, 302, 134869. [Google Scholar] [CrossRef] [PubMed]
  54. El-Shinawy, M.; Abd-Elmoniem, E.; Abou-Hadid, A. The use of organic manure for lettuce plants grown under NFT conditions. In Proceedings of the International Symposium Greenhouse Management for Better Yield & Quality in Mild Winter Climates, Antalya, Turkey, 3–5 November 1997; pp. 315–318. [Google Scholar]
  55. Citak, S.; Sonmez, S. Influence of Organic and Conventional Growing Conditions on the Nutrient Contents of White Head Cabbage (Brassica oleracea var. capitata) during Two Successive Seasons. J. Agric. Food Chem. 2010, 58, 1788–1793. [Google Scholar] [CrossRef]
  56. Ding, Y.; Liu, Y.G.; Liu, S.B.; Li, Z.W.; Tan, X.F.; Huang, X.X.; Zeng, G.M.; Zhou, L.; Zheng, B.H. Biochar to improve soil fertility. A review. Agron. Sustain. Dev. 2016, 36, 36. [Google Scholar] [CrossRef]
  57. Li, H.; Yang, L.; Mao, Q.; Zhou, H.; Guo, P.; Agathokleous, E.; Wang, S. Modified biochar enhances soil fertility and nutrient uptake and yield of rice in mercury-contaminated soil. Environ. Technol. 2023, 32, 103435. [Google Scholar] [CrossRef]
  58. Preza Fontes, G.; Greer, K.D.; Pittelkow, C.M. Does biochar improve nitrogen use efficiency in maize? GCB. Bioenergy 2024, 16, e13122. [Google Scholar] [CrossRef]
  59. He, L.; Shan, J.; Zhao, X.; Wang, S.; Yan, X. Variable responses of nitrification and denitrification in a paddy soil to long-term biochar amendment and short-term biochar addition. Chemosphere 2019, 234, 558–567. [Google Scholar] [CrossRef]
  60. Li, H.; Meng, J.; Liu, Z.; Lan, Y.; Yang, X.; Huang, Y.; He, T.; Chen, W. Effects of biochar on N2O emission in denitrification pathway from paddy soil: A drying incubation study. Sci. Total Environ. 2021, 787, 147591. [Google Scholar] [CrossRef]
  61. Yin, Y.; Gu, M.; Zhang, W.; Yang, C.; Li, H.; Wang, X.; Chen, R. Relationships between different types of biochar and N2O emissions during composting based on roles of nosZ-carrying denitrifying bacterial communities enriched on compost and biochar particles. Bioresour. Technol. 2024, 394, 130214. [Google Scholar] [CrossRef]
  62. Yang, L.; Wu, Y.; Wang, Y.; An, W.; Jin, J.; Sun, K.; Wang, X. Effects of biochar addition on the abundance, speciation, availability, and leaching loss of soil phosphorus. Sci. Total Environ. 2021, 758, 143657. [Google Scholar] [CrossRef]
  63. Laird, D.; Fleming, P.; Wang, B.; Horton, R.; Karlen, D. Biochar impact on nutrient leaching from a Midwestern agricultural soil. Geoderma 2010, 158, 436–442. [Google Scholar] [CrossRef]
  64. Trazzi, P.; Leahy, J.J.; Hayes, M.H.; Kwapinski, W. Adsorption and desorption of phosphate on biochars. J. Environ. 2016, 4, 37–46. [Google Scholar] [CrossRef]
  65. Zhao, L.; Xu, W.; Guan, H.; Wang, K.; Xiang, P.; Wei, F.; Yang, S.; Miao, C.; Ma, L.Q. Biochar increases Panax notoginseng’s survival under continuous cropping by improving soil properties and microbial diversity. Sci. Total Environ. 2022, 850, 157990. [Google Scholar] [CrossRef] [PubMed]
  66. Yuan, M.; Zhu, X.; Sun, H.; Song, J.; Li, C.; Shen, Y.; Li, S. The addition of biochar and nitrogen alters the microbial community and their cooccurrence network by affecting soil properties. Chemosphere 2023, 312, 137101. [Google Scholar] [CrossRef] [PubMed]
  67. Gu, W.; Wang, Y.; Feng, Z.; Wu, D.; Zhang, H.; Yuan, H.; Sun, Y.; Xiu, L.; Chen, W.; Zhang, W. Long-Term Effects of Biochar Application with Reduced Chemical Fertilizer on Paddy Soil Properties and japonica Rice Production System. Front. Environ. Sci. 2022, 10, 902752. [Google Scholar] [CrossRef]
  68. Chathurika, J.A.S.; Kumaragamage, D.; Zvomuya, F.; Akinremi, O.O.; Flaten, D.N.; Indraratne, S.P.; Dandeniya, W.S. Woodchip biochar with or without synthetic fertilizers affects soil properties and available phosphorus in two alkaline, chernozemic soils. Can. J. Soil Sci. 2016, 96, 472–484. [Google Scholar] [CrossRef]
  69. Rasul, M.; Cho, J.; Shin, H.S.; Hur, J. Biochar-induced priming effects in soil via modifying the status of soil organic matter and microflora: A review. Sci. Total Environ. 2022, 805, 150304. [Google Scholar] [CrossRef]
  70. Li, W.; Wang, C. Progress in mechanisms of plant tolerance to ammonium toxicity. J. Huazhong Agric. Univ. 2022, 41, 152–159. (In Chinese) [Google Scholar] [CrossRef]
  71. Ji, S.; Liu, Z.; Liu, B.; Wang, Y.; Wang, J. The effect of Trichoderma biofertilizer on the quality of flowering Chinese cabbage and the soil environment. Sci. Hortic. 2020, 262, 109069. [Google Scholar] [CrossRef]
  72. Qu, Z.M.; Qi, X.C.; Wang, J.; Chen, Q.; Li, C.I. Effects of nitrogen application rate and topdressing times on yield and quality of Chinese cabbage and soil nitrogen dynamics. Environ. Pollut. Bioavailability 2019, 31, 1–8. [Google Scholar] [CrossRef]
  73. Ding, S.S.; LI, Y.T.; Yuan, L.; Zhao, B.Q.; Lin, Z.A.; Yang, X.D.; LI, J.; Zhang, J.J. Effects of sugar alcohols and amino acids on growth, quality and calcium nutrition of Chinese cabbage. J. Plant Nutr. 2016, 22, 744–751. (In Chinese) [Google Scholar] [CrossRef]
  74. Fontecilla-Camps, J.C. Primordial bioenergy sources: The two facets of adenosine triphosphate. J. Inorg. Biochem. 2021, 216, 111347. [Google Scholar] [CrossRef]
  75. Malhotra, H.; Vandana; Sharma, S.; Pandey, R. Phosphorus Nutrition: Plant Growth in Response to Deficiency and Excess. In Plant Nutrients and Abiotic Stress Tolerance, 2nd ed.; Mirza, H., Hirosuke, O., Eds.; Springer Nature Singapore Pte Ltd.: Singapore, 2018; pp. 171–190. [Google Scholar] [CrossRef]
  76. Tariq, A.; Zeng, F.; Graciano, C.; Ullah, A.; Sadia, S.; Ahmed, Z.; Murtaza, G.; Ismoilov, K.; Zhang, Z. Regulation of metabolites by nutrients in plants. In Plant Ionomics: Sensing, Signaling, and Regulation; Singh, V.P., Siddiqui, M.H., Eds.; John Wiley & Sons Ltd.: Hoboken, NJ, USA, 2023; pp. 1–18. [Google Scholar] [CrossRef]
  77. Bian, R.; Joseph, S.; Shi, W.; Li, L.; Taherymoosavi, S.; Pan, G. Biochar DOM for plant promotion but not residual biochar for metal immobilization depended on pyrolysis temperature. Sci. Total Environ. 2019, 662, 571–580. [Google Scholar] [CrossRef] [PubMed]
  78. Zeeshan, M.; Ahmad, W.; Hussain, F.; Ahamd, W.; Numan, M.; Shah, M.; Ahmad, I. Phytostabalization of the heavy metals in the soil with biochar applications, the impact on chlorophyll, carotene, soil fertility and tomato crop yield. J. Clean. Prod. 2020, 255, 120318. [Google Scholar] [CrossRef]
  79. Khajavi-Shojaei, S.; Moezzi, A.; Norouzi Masir, M.; Taghavi, M. Synthesis modified biochar-based slow-release nitrogen fertilizer increases nitrogen use efficiency and corn (Zea mays L.) growth. Biomass Conv. Biorefinery 2023, 13, 593–601. [Google Scholar] [CrossRef]
  80. Lou, Y.; Joseph, S.; Li, L.; Graber, E.R.; Liu, X.; Pan, G. Water extract from straw biochar used for plant growth promotion: An initial test. BioResources 2016, 11, 249–266. [Google Scholar] [CrossRef]
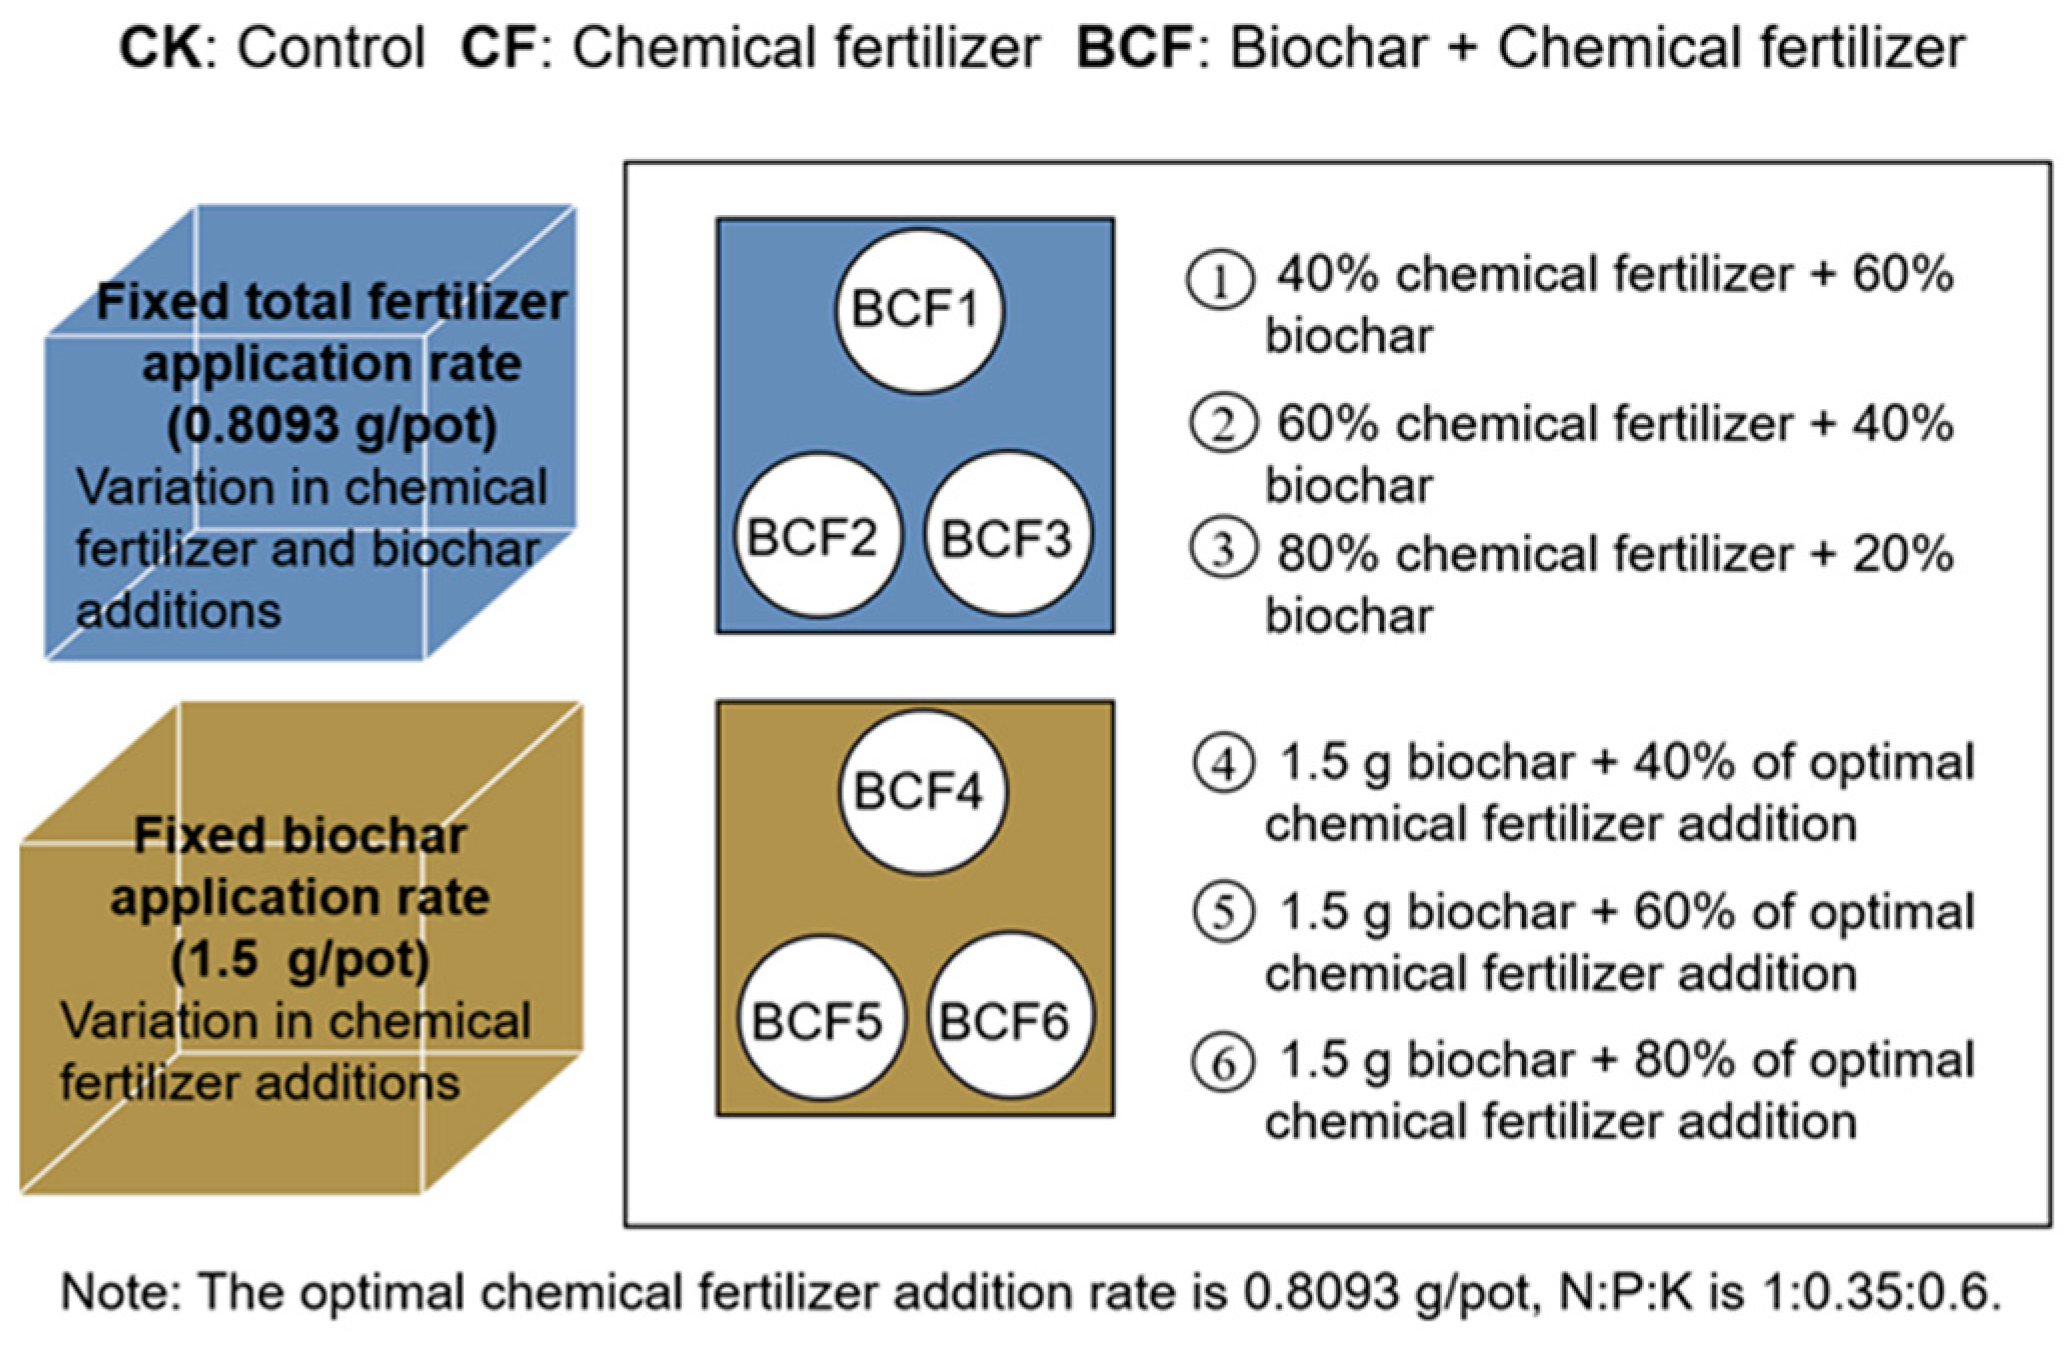
Figure 1. Corresponding treatments in pot experiment.
Sustainability 16 08780 g001
Figure 2. Effects of amendments on soil properties: (A) pH; (B) EC; (C) DOC. Different letters in columns of the same color indicate significant differences among treatments in the first and second years, respectively. The ns, *, and ** in each treatment indicate no significant (p > 0.05), or significant (p < 0.05 and p < 0.01, respectively) difference between the first and second years compared with paired t-test.
Sustainability 16 08780 g002
Figure 3. Effects of amendments on soil fertility in the second year: (A) ammonium nitrogen; (B) nitrate nitrogen; (C) available phosphorus; (D) available potassium. Different lowercase letters in each panel indicate significant differences among different treatments (p < 0.05).
Sustainability 16 08780 g003
Figure 4. Effect of amendments on fresh weight of Chinese cabbage: (A) edible part; (B) roots. Different letters in columns of the same color indicate significant differences among treatments in the first and second years, respectively. The ns, *, and ** in each treatment indicate no significant (p > 0.05), or significant (p < 0.05 and p < 0.01, respectively) difference between the first and second years compared with paired t-test.
Sustainability 16 08780 g004
Figure 5. Effects of amendments on the nutritional quality of Chinese cabbage: (A) vitamin C; (B) soluble protein; (C) soluble sugar. Different letters in columns of the same color indicate significant differences among treatments in the first and second years, respectively. The ns, *, and ** in each treatment indicate no significant (p > 0.05), or significant (p < 0.05 and p < 0.01, respectively) difference between the first and second years compared with paired t-test.
Sustainability 16 08780 g005
Table 1. Properties of the tested soil.
pHDOC
(mg·kg−1)
Total N
(mg·kg−1)
Total P
(mg·kg−1)
Total K
(g·kg−1)
Available K
(mg·kg−1)
Available P
(mg·kg−1)
Ammonium N (mg·kg−1)Nitrate N
(mg·kg−1)
6.824.1171.27610.6711.2467.7317.163.792.6
Table 2. The plant heights (cm) of Chinese cabbage during different periods.
TreatmentsFirst YearSecond Year
29 d36 d43 d50 d29 d36 d43 d50 d
CK15.75 ± 0.50 a6.25 ± 0.66 b6.33 ± 0.14 c6.00 ± 1.15 c3.13 ± 0.31 b4.00 ± 0.23 c4.89 ± 0.23 g5.13 ± 0.00 c
CF15.42 ± 0.14 a6.42 ± 0.29 ab7.25 ± 0.25 bc7.08 ± 1.61 c3.52 ± 0.42 b4.20 ± 0.40 c5.12 ± 0.40 f6.23 ± 0.50 bc
BCF15.75 ± 0.25 a6.67 ± 0.14 ab7.67 ± 0.38 ab9.83 ± 1.42 b4.73 ± 0.31 a5.87 ± 0.42 ab6.87 ± 0.42 e8.55 ± 0.5 b
BCF25.83 ± 0.14 a6.50 ± 0.00 ab7.50 ± 0.00 ab9.25 ± 0.43 b4.67 ± 0.31 a6.20 ± 0.00 a8.13 ± 0.12 c8.01 ± 0.00 b
BCF35.33 ± 0.38 a6.42 ± 0.38 ab7.17 ± 0.88 bc9.17 ± 0.88 b4.47 ± 0.42 a5.77 ± 0.31 b7.53 ± 0.50 d7.90 ± 0.31 b
BCF46.00 ± 0.43 a7.00 ± 0.00 ab8.50 ± 0.25 a11.5 ± 0.25 a5.00 ± 0.20 a6.20 ± 0.20 a8.67 ± 0.31 b10.00 ± 0.20 a
BCF56.17 ± 0.63 a7.25 ± 0.66 a8.17 ± 0.88 ab11.08 ± 1.01 a4.67 ± 0.64 a6.00 ± 0.00 a8.60 ± 0.20 b9.60 ± 0.40 ab
BCF65.75 ± 0.66 a6.75 ± 0.66 ab7.83 ± 0.63 ab11.25 ± 1.32 a5.13 ± 0.31 a6.33 ± 0.58 a9.20 ± 0.40 a9.87 ± 0.81 ab
Notes: Different lowercase letters in each column indicate significant difference (at p < 0.05) in the same column.
Table 3. The leaf numbers of Chinese cabbage during different periods.
TreatmentsFirst YearSecond Year
29 d36 d43 d50 d29 d36 d43 d50 d
CK15.75 ± 0.50 a6.25 ± 0.66 b6.33 ± 0.14 c6.00 ± 1.15 c3.13 ± 0.31 b4.00 ± 0.23 c4.89 ± 0.23 g5.13 ± 0.00 c
CF15.42 ± 0.14 a6.42 ± 0.29 ab7.25 ± 0.25 bc7.08 ± 1.61 c3.52 ± 0.42 b4.20 ± 0.40 c5.12 ± 0.40 f6.23 ± 0.50 bc
BCF15.75 ± 0.25 a6.67 ± 0.14 ab7.67 ± 0.38 ab9.83 ± 1.42 b4.73 ± 0.31 a5.87 ± 0.42 ab6.87 ± 0.42 e8.55 ± 0.5 b
BCF25.83 ± 0.14 a6.50 ± 0.00 ab7.50 ± 0.00 ab9.25 ± 0.43 b4.67 ± 0.31 a6.20 ± 0.00 a8.13 ± 0.12 c8.01 ± 0.00 b
BCF35.33 ± 0.38 a6.42 ± 0.38 ab7.17 ± 0.88 bc9.17 ± 0.88 b4.47 ± 0.42 a5.77 ± 0.31 b7.53 ± 0.50 d7.90 ± 0.31 b
BCF46.00 ± 0.43 a7.00 ± 0.00 ab8.50 ± 0.25 a11.5 ± 0.25 a5.00 ± 0.20 a6.20 ± 0.20 a8.67 ± 0.31 b10.00 ± 0.20 a
BCF56.17 ± 0.63 a7.25 ± 0.66 a8.17 ± 0.88 ab11.08 ± 1.01 a4.67 ± 0.64 a6.00 ± 0.00 a8.60 ± 0.20 b9.60 ± 0.40 ab
BCF65.75 ± 0.66 a6.75 ± 0.66 ab7.83 ± 0.63 ab11.25 ± 1.32 a5.13 ± 0.31 a6.33 ± 0.58 a9.20 ± 0.40 a9.87 ± 0.81 ab
Notes: Different lowercase letters in each column indicate significant difference (at p < 0.05) in the same column.
Disclaimer/Publisher’s Note: The statements, opinions and data contained in all publications are solely those of the individual author(s) and contributor(s) and not of MDPI and/or the editor(s). MDPI and/or the editor(s) disclaim responsibility for any injury to people or property resulting from any ideas, methods, instructions or products referred to in the content.