
Global Dynamics of Environmental Kuznets Curve: A Cross-Correlation Analysis of Income and CO2 Emissions

 ,
,  ,
,  ,
,  and
and 
Abstract
:1. Introduction
2. Brief Literature Review
3. Data and Methods
3.1. Data
3.2. Methods
4. Results and Discussion
4.1. Preliminary Results
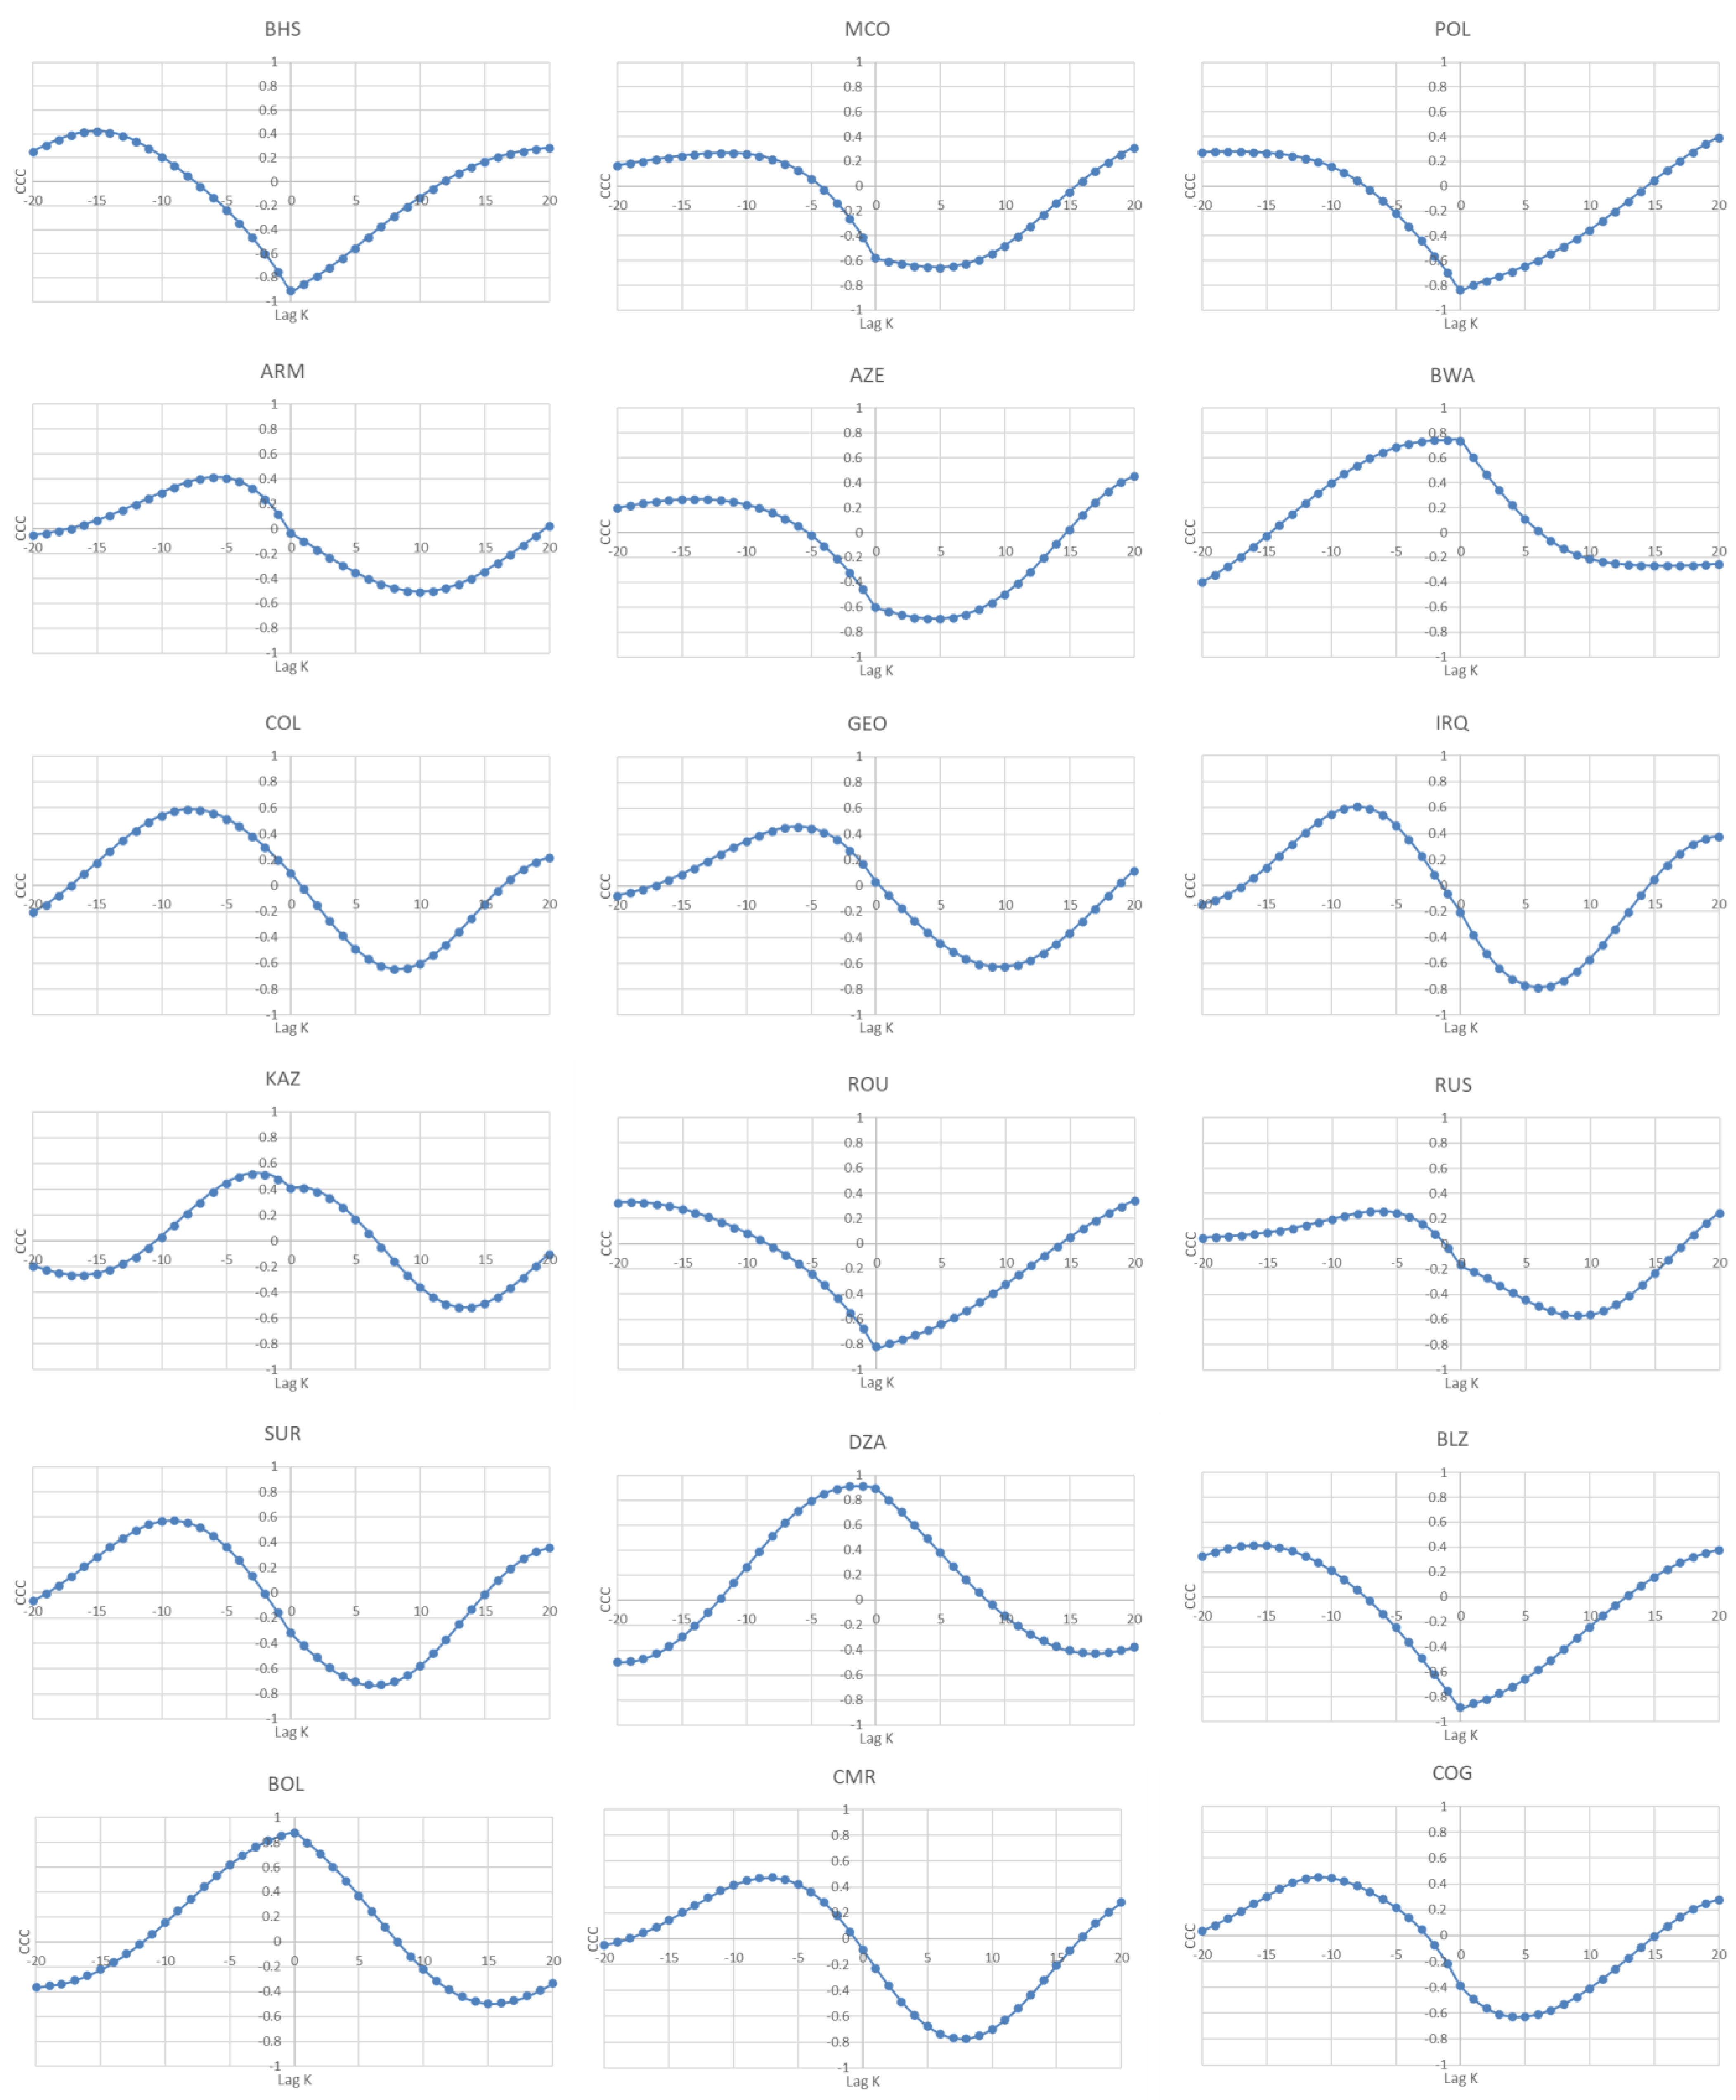
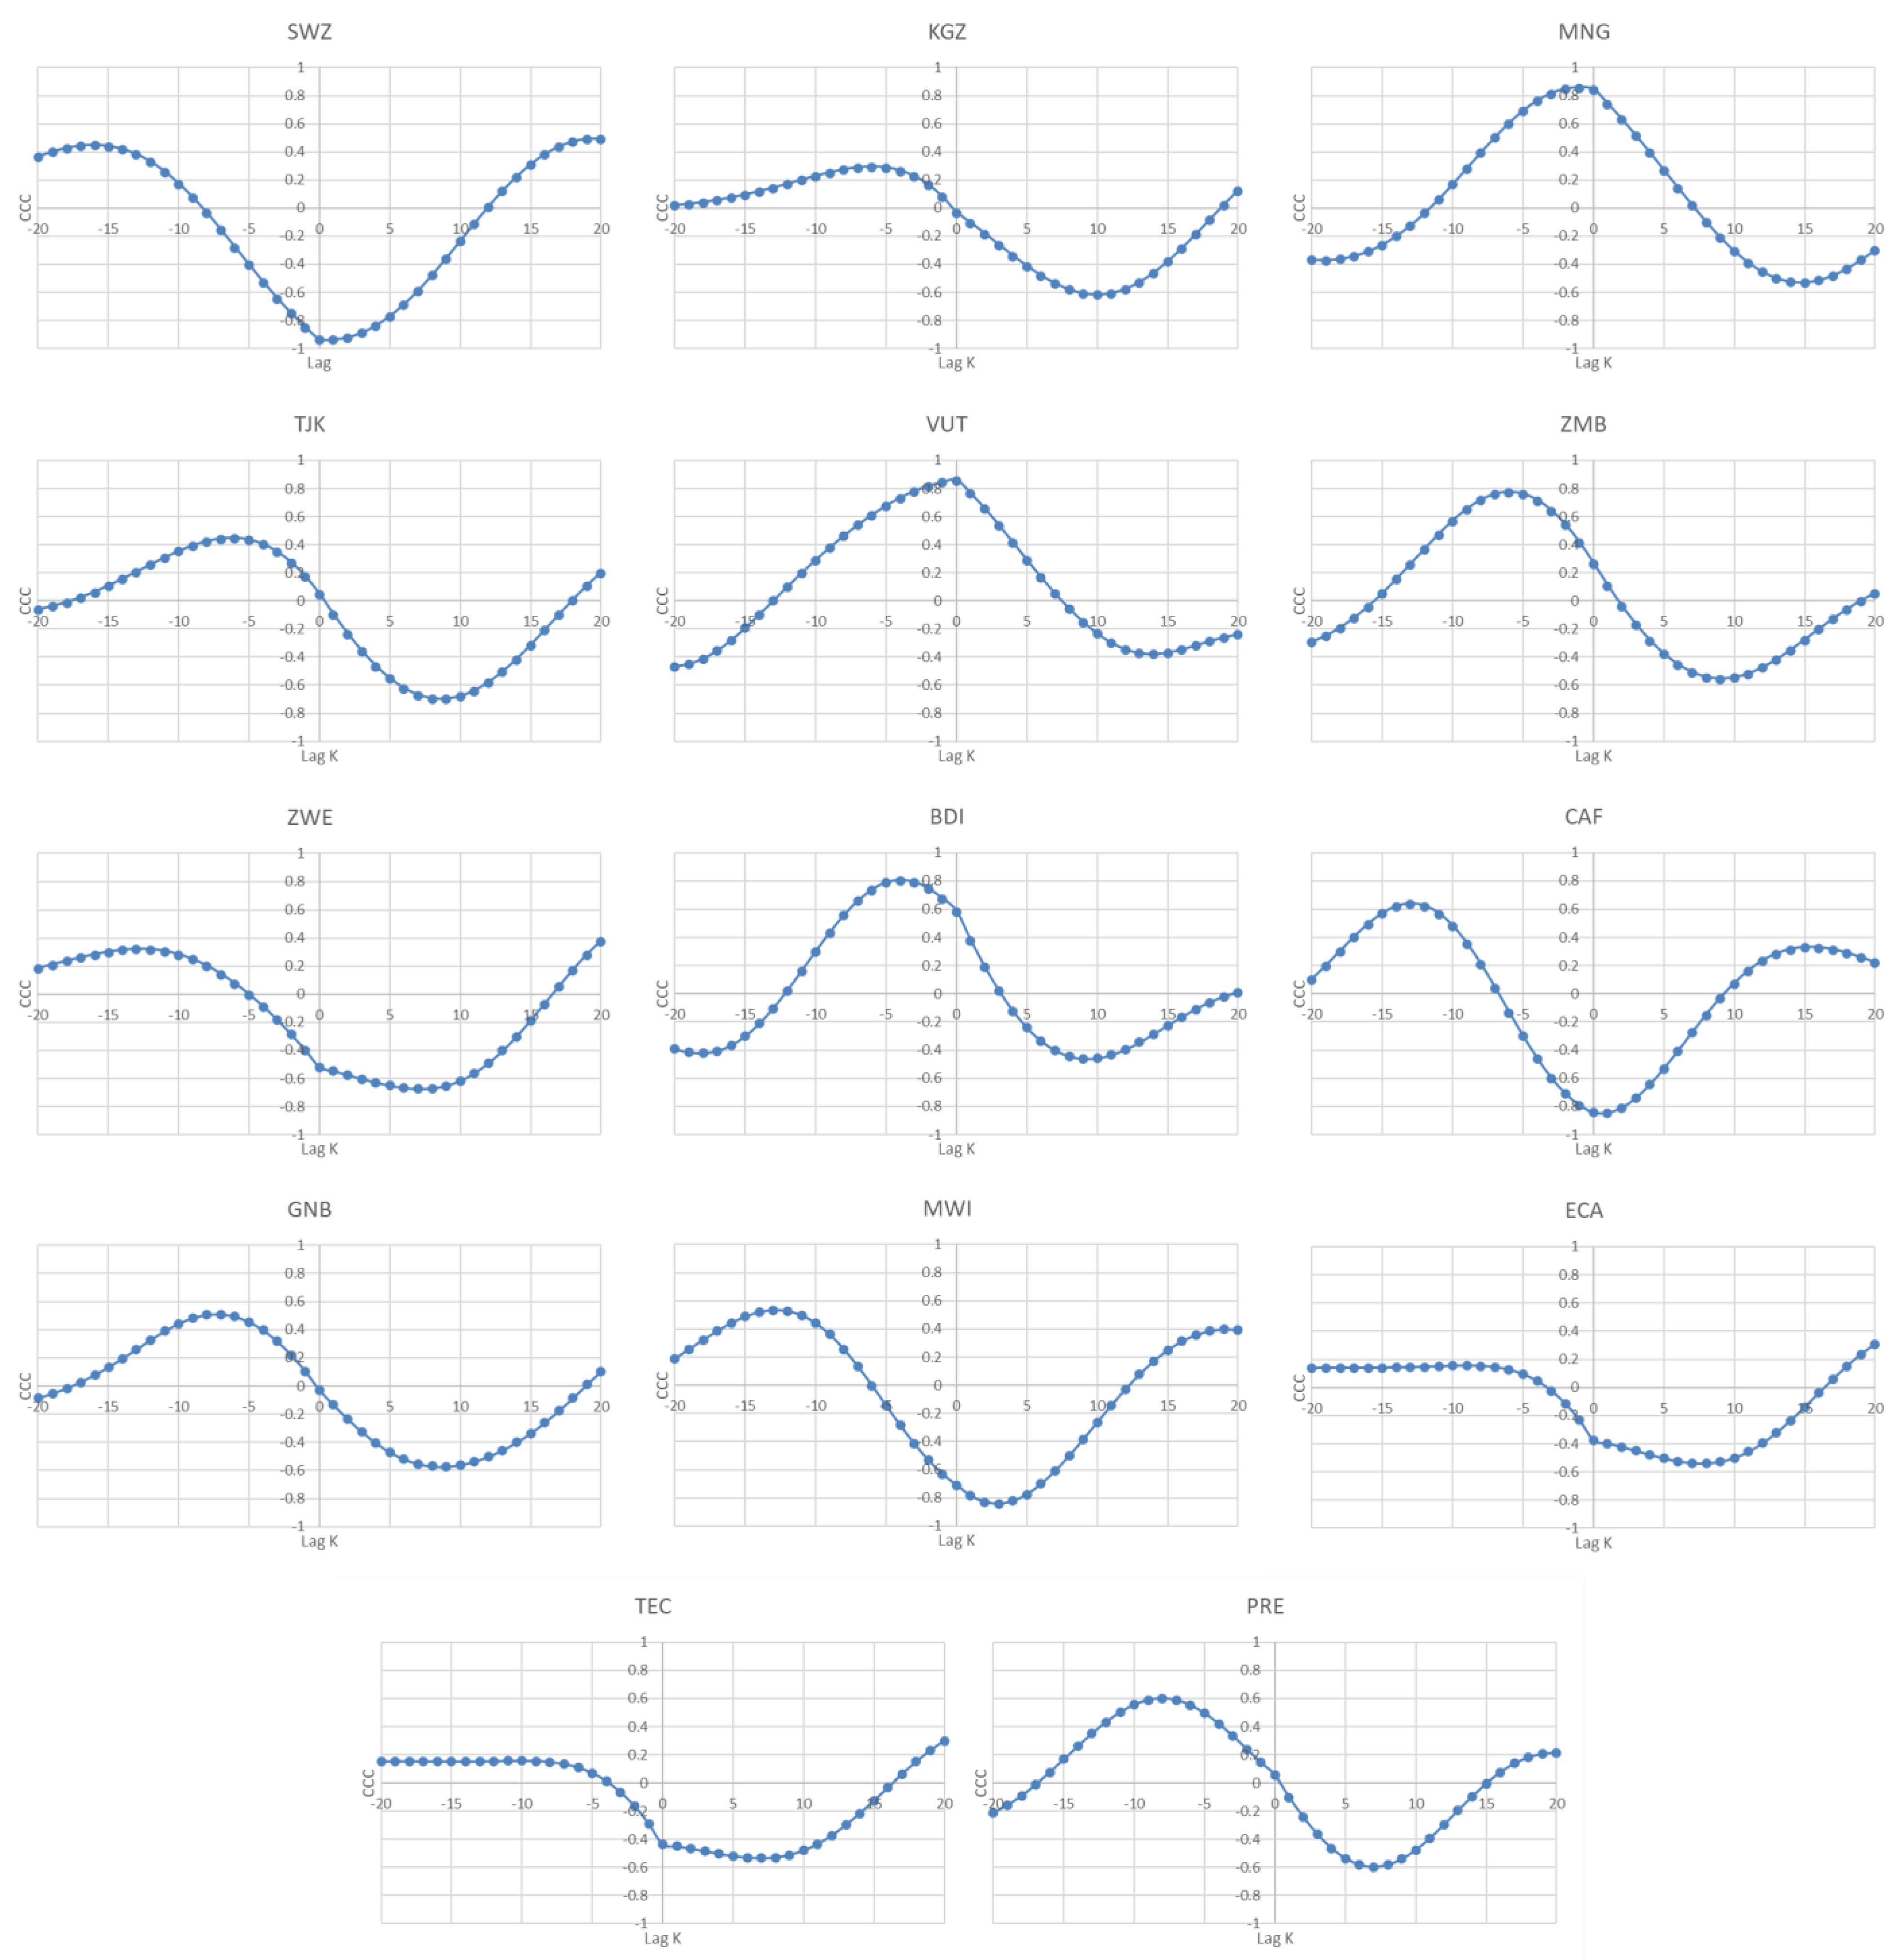
4.2. Cross-Correlation Coefficient Analysis
- (i)
- Negative cross-correlation between both past and future values of CO2 emissions (lags and leads) and the current level of GDP per capita (identified with an “X” in the eighth column of Table 7, Table 8, Table 9, Table 10 and Table 11), meaning, in this case, increasing GDP per capita has led in the past, and could lead in the future, to a reduction in carbon emissions, which partially supports the EKC hypothesis;
- (ii)
- Past/future values of CO2 emissions per capita, i.e., lags/leads, could be negatively/positively correlated with the current values of GDP per capita, meaning that, although in the past an increase in the GDP level led to a reduction in CO2 emissions per capita, in the future, it will not happen (identified with an “X” in the ninth column of Table 7, Table 8, Table 9, Table 10 and Table 11);
- (iii)
- Positive cross-correlation between both past and future values of CO2 emissions (lags and leads) and the current level of GDP per capita, meaning, in this case, increasing GDP per capita has led in the past, and will probably lead in the future, to an increase in carbon emissions (identified with an “X” in the tenth column of Table 7, Table 8, Table 9, Table 10 and Table 11).
5. Conclusions, Policy Recommendations, and Future Research Directions
- (i)
- Governments should implement carbon pricing strategies that are progressively scaled based on the GDP per capita of the regions. (For example, Sweden implemented a carbon tax in 1991, which has been widely recognized as one of the most effective tools for reducing CO2 emissions, while allowing the economy to grow. This policy sets a clear price on carbon emissions, incentivizing businesses and individuals to adopt greener practices [89]). This ensures that higher-income areas, which typically have higher emissions, bear a proportionate cost, incentivizing both corporations and individuals to reduce their carbon footprint;
- (ii)
- Policies should prioritize significant investments in renewable energy infrastructure, especially in regions with rising GDP per capita. This could include subsidies for renewable energy projects, tax incentives for businesses adopting green technologies, and public–private partnerships to accelerate the deployment of solar, wind, and other clean energy sources;
- (iii)
- To introduce or tighten energy efficiency standards across sectors, particularly in industries and buildings. This could be complemented by government-sponsored programs that offer financial support for retrofitting existing structures to meet these standards, thereby reducing overall energy consumption;
- (iv)
- To ensure the long-term success of these policies, there should be an emphasis on public awareness and education regarding the importance of sustainable practices.
- (i)
- For high-income countries, where technological advancements and financial resources are more accessible, we recommend the implementation of strict carbon pricing mechanisms and the promotion of green technologies through subsidies and tax incentives. These measures should be complemented by robust monitoring systems to ensure compliance and continuous improvement. For high-income countries that have decoupled economic growth from CO2 emissions, policymakers should focus on maintaining this trend by incentivizing further technological innovation, promoting renewable energy sources, and strengthening international climate agreements to support carbon neutrality goals;
- (ii)
- For middle-income countries, a phased approach to adopting cleaner technologies is advised. Initially, investments should focus on improving energy efficiency in key sectors, such as manufacturing and transportation. International cooperation (mechanisms such as the Green Climate Fund (GCF) and the Clean Development Mechanism (CDM) provide financial assistance and promote technology transfer, allowing developing countries to access cleaner technologies and to finance renewable energy projects) and financial support will be crucial in facilitating this transition, particularly through technology transfer and capacity-building initiatives;
- (iii)
- In low-income countries, policy efforts should prioritize sustainable development that aligns with poverty alleviation goals.
Author Contributions
Funding
Institutional Review Board Statement
Informed Consent Statement
Data Availability Statement
Conflicts of Interest
References
- Brown, P.T.; Hanley, H.; Mahesh, A.; Reed, C.; Strenfel, S.J.; Davis, S.J.; Kochanski, A.K.; Clements, C.B. Climate Warming Increases Extreme Daily Wildfire Growth Risk in California. Nature 2023, 621, 760–766. [Google Scholar] [CrossRef] [PubMed]
- Carlson, C.J.; Albery, G.F.; Merow, C.; Trisos, C.H.; Zipfel, C.M.; Eskew, E.A.; Olival, K.J.; Ross, N.; Bansal, S. Climate Change Increases Cross-Species Viral Transmission Risk. Nature 2022, 607, 555–562. [Google Scholar] [CrossRef] [PubMed]
- Berkeley Earth. Berkeley Earth Press Release: 2023 Was Warmest Year Since 1850; Berkeley Earth Press: Berkeley, CA, USA, 2024. [Google Scholar]
- Calvin, K.; Dasgupta, D.; Krinner, G.; Mukherji, A.; Thorne, P.W.; Trisos, C.; Romero, J.; Aldunce, P.; Barrett, K.; Blanco, G.; et al. IPCC, 2023: Climate Change 2023: Synthesis Report. Contribution of Working Groups I, II and III to the Sixth Assessment Report of the Intergovernmental Panel on Climate Change; Lee, H., Romero, J., Eds.; IPCC: Geneva, Switzerland, 2023. [Google Scholar]
- Hoegh-Guldberg, O.; Jacob, D.; Taylor, M.; Guillén Bolaños, T.; Bindi, M.; Brown, S.; Camilloni, I.A.; Diedhiou, A.; Djalante, R.; Ebi, K.; et al. The Human Imperative of Stabilizing Global Climate Change at 1.5 °C. Science 2019, 365, eaaw6974. [Google Scholar] [CrossRef] [PubMed]
- Fawzy, S.; Osman, A.I.; Doran, J.; Rooney, D.W. Strategies for Mitigation of Climate Change: A Review. Environ. Chem. Lett. 2020, 18, 2069–2094. [Google Scholar] [CrossRef]
- Duan, H.; Zhou, S.; Jiang, K.; Bertram, C.; Harmsen, M.; Kriegler, E.; van Vuuren, D.P.; Wang, S.; Fujimori, S.; Tavoni, M.; et al. Assessing China’s Efforts to Pursue the 1.5 °C Warming Limit. Science 2021, 372, 378–385. [Google Scholar] [CrossRef]
- Fankhauser, S.; Smith, S.M.; Allen, M.; Axelsson, K.; Hale, T.; Hepburn, C.; Kendall, J.M.; Khosla, R.; Lezaun, J.; Mitchell-Larson, E.; et al. The Meaning of Net Zero and How to Get It Right. Nat. Clim. Change 2022, 12, 15–21. [Google Scholar] [CrossRef]
- Dai, M.; Sun, M.; Chen, B.; Shi, L.; Jin, M.; Man, Y.; Liang, Z.; de Almeida, C.M.V.B.; Li, J.; Zhang, P.; et al. Country-Specific Net-Zero Strategies of the Pulp and Paper Industry. Nature 2024, 626, 327–334. [Google Scholar] [CrossRef]
- Kuznets, S. Economic Growth and Income Inequality. Am. Econ. Rev. 1955, 45, 1–28. [Google Scholar]
- Grossman, G.; Krueger, A. Environmental Impacts of a North American Free Trade Agreement; National Bureau of Economic Research: Cambridge, MA, USA, 1991. [Google Scholar]
- Sarkodie, S.A.; Strezov, V. A Review on Environmental Kuznets Curve Hypothesis Using Bibliometric and Meta-Analysis. Sci. Total Environ. 2019, 649, 128–145. [Google Scholar] [CrossRef]
- Narayan, P.K.; Saboori, B.; Soleymani, A. Economic Growth and Carbon Emissions. Econ. Model. 2016, 53, 388–397. [Google Scholar] [CrossRef]
- Al-Mulali, U.; Saboori, B.; Ozturk, I. Investigating the Environmental Kuznets Curve Hypothesis in Vietnam. Energy Policy 2015, 76, 123–131. [Google Scholar] [CrossRef]
- Borghesi, S. The Environmental Kuznets Curve: A Survey of the Literature. SSRN Electron. J. 2000, 52. [Google Scholar] [CrossRef]
- Stern, D.I. The Rise and Fall of the Environmental Kuznets Curve. World Dev. 2004, 32, 1419–1439. [Google Scholar] [CrossRef]
- Lark, T.J.; Spawn, S.A.; Bougie, M.; Gibbs, H.K. Cropland Expansion in the United States Produces Marginal Yields at High Costs to Wildlife. Nat. Commun. 2020, 11, 4295. [Google Scholar] [CrossRef] [PubMed]
- Usman, O.; Alola, A.A.; Sarkodie, S.A. Assessment of the Role of Renewable Energy Consumption and Trade Policy on Environmental Degradation Using Innovation Accounting: Evidence from the US. Renew. Energy 2020, 150, 266–277. [Google Scholar] [CrossRef]
- Tollefson, J. What the War in Ukraine Means for Energy, Climate and Food. Nature 2022, 604, 232–233. [Google Scholar] [CrossRef]
- Guan, Y.; Yan, J.; Shan, Y.; Zhou, Y.; Hang, Y.; Li, R.; Liu, Y.; Liu, B.; Nie, Q.; Bruckner, B.; et al. Burden of the Global Energy Price Crisis on Households. Nat. Energy 2023, 8, 304–316. [Google Scholar] [CrossRef]
- Tapia Granados, J.A.; Carpintero, Ó. Economic Aspects of Climate Change. J. Crop. Improv. 2013, 27, 693–734. [Google Scholar] [CrossRef]
- Grossman, G.; Krueger, A. Economic Growth and the Environment. Q. J. Econ. 1995, 110, 353–377. [Google Scholar] [CrossRef]
- Cole, M.A. Limits to Growth, Sustainable Development and Environmental Kuznets Curves: An Examination of the Environmental Impact of Economic Development. Sustain. Dev. 1999, 7, 87–97. [Google Scholar] [CrossRef]
- Stagl, S. Delinking Economic Growth from Environmental Degradation? A Literature Survey on the Environmental Kuznets Curve Hypothesis. SSRN Electron. J. 2000, 6, 1–24. [Google Scholar] [CrossRef]
- Purcel, A.-A. New Insights into the Environmental Kuznets Curve Hypothesis in Developing and Transition Economies: A Literature Survey. Environ. Econ. Policy Stud. 2020, 22, 585–631. [Google Scholar] [CrossRef]
- Pincheira, R.; Zuniga, F. Environmental Kuznets Curve Bibliographic Map: A Systematic Literature Review. Account. Financ. 2021, 61, 1931–1956. [Google Scholar] [CrossRef]
- Anwar, M.A.; Zhang, Q.; Asmi, F.; Hussain, N.; Plantinga, A.; Zafar, M.W.; Sinha, A. Global Perspectives on Environmental Kuznets Curve: A Bibliometric Review. Gondwana Res. 2022, 103, 135–145. [Google Scholar] [CrossRef]
- Ekins, P. The Kuznets Curve for the Environment and Economic Growth: Examining the Evidence. Environ. Plan. A Econ. Space 1997, 29, 805–830. [Google Scholar] [CrossRef]
- Churchill, S.A.; Inekwe, J.; Ivanovski, K.; Smyth, R. The Environmental Kuznets Curve in the OECD: 1870–2014. Energy Econ. 2018, 75, 389–399. [Google Scholar] [CrossRef]
- Kiliç, C.; Balan, F. Is There an Environmental Kuznets Inverted-U Shaped Curve? Panoeconomicus 2018, 65, 79–94. [Google Scholar] [CrossRef]
- Sapkota, P.; Bastola, U. Foreign Direct Investment, Income, and Environmental Pollution in Developing Countries: Panel Data Analysis of Latin America. Energy Econ. 2017, 64, 206–212. [Google Scholar] [CrossRef]
- Destek, M.A.; Sarkodie, S.A. Investigation of Environmental Kuznets Curve for Ecological Footprint: The Role of Energy and Financial Development. Sci. Total Environ. 2019, 650, 2483–2489. [Google Scholar] [CrossRef]
- Yang, Q.; Huo, J.; Saqib, N.; Mahmood, H. Modelling the Effect of Renewable Energy and Public-Private Partnership in Testing EKC Hypothesis: Evidence from Methods Moment of Quantile Regression. Renew. Energy 2022, 192, 485–494. [Google Scholar] [CrossRef]
- Aydin, M.; Degirmenci, T.; Gurdal, T.; Yavuz, H. The Role of Green Innovation in Achieving Environmental Sustainability in European Union Countries: Testing the Environmental Kuznets Curve Hypothesis. Gondwana Res. 2023, 118, 105–116. [Google Scholar] [CrossRef]
- Aminu, N.; Clifton, N.; Mahe, S. From Pollution to Prosperity: Investigating the Environmental Kuznets Curve and Pollution-Haven Hypothesis in Sub-Saharan Africa’s Industrial Sector. J. Environ. Manag. 2023, 342, 118147. [Google Scholar] [CrossRef] [PubMed]
- Li, R.; Wang, Q.; Guo, J. Revisiting the Environmental Kuznets Curve (EKC) Hypothesis of Carbon Emissions: Exploring the Impact of Geopolitical Risks, Natural Resource Rents, Corrupt Governance, and Energy Intensity. J. Environ. Manag. 2024, 351, 119663. [Google Scholar] [CrossRef]
- Javed, A.; Rapposelli, A. Examining Environmental Sustainability in Italy: Evidence from ARDL and Non-Linear ARDL Approaches; Springer International Publishing: Cham, Switzerland, 2023; pp. 75–93. [Google Scholar]
- Anwar, A.; Siddique, M.; Dogan, E.; Sharif, A. The Moderating Role of Renewable and Non-Renewable Energy in Environment-Income Nexus for ASEAN Countries: Evidence from Method of Moments Quantile Regression. Renew. Energy 2021, 164, 956–967. [Google Scholar] [CrossRef]
- Mahmood, H. Trade, FDI, and CO2 Emissions Nexus in Latin America: The Spatial Analysis in Testing the Pollution Haven and the EKC Hypotheses. Environ. Sci. Pollut. Res. 2022, 30, 14439–14454. [Google Scholar] [CrossRef]
- Apergis, N. Environmental Kuznets Curves: New Evidence on Both Panel and Country-Level CO2 Emissions. Energy Econ. 2016, 54, 263–271. [Google Scholar] [CrossRef]
- Ozcan, B.; Apergis, N.; Shahbaz, M. A Revisit of the Environmental Kuznets Curve Hypothesis for Turkey: New Evidence from Bootstrap Rolling Window Causality. Environ. Sci. Pollut. Res. 2018, 25, 32381–32394. [Google Scholar] [CrossRef]
- Halliru, A.M.; Loganathan, N.; Golam Hassan, A.A.; Mardani, A.; Kamyab, H. Re-Examining the Environmental Kuznets Curve Hypothesis in the Economic Community of West African States: A Panel Quantile Regression Approach. J. Clean. Prod. 2020, 276, 124247. [Google Scholar] [CrossRef]
- Roelfsema, M.; van Soest, H.L.; Harmsen, M.; van Vuuren, D.P.; Bertram, C.; den Elzen, M.; Höhne, N.; Iacobuta, G.; Krey, V.; Kriegler, E.; et al. Taking Stock of National Climate Policies to Evaluate Implementation of the Paris Agreement. Nat. Commun. 2020, 11, 2096. [Google Scholar] [CrossRef]
- Lorente, D.B.; Álvarez-Herranz, A. Economic Growth and Energy Regulation in the Environmental Kuznets Curve. Environ. Sci. Pollut. Res. 2016, 23, 16478–16494. [Google Scholar] [CrossRef]
- Balsalobre-Lorente, D.; Shahbaz, M.; Roubaud, D.; Farhani, S. How Economic Growth, Renewable Electricity and Natural Resources Contribute to CO2 Emissions? Energy Policy 2018, 113, 356–367. [Google Scholar] [CrossRef]
- Allard, A.; Takman, J.; Uddin, G.S.; Ahmed, A. The N-Shaped Environmental Kuznets Curve: An Empirical Evaluation Using a Panel Quantile Regression Approach. Environ. Sci. Pollut. Res. 2018, 25, 5848–5861. [Google Scholar] [CrossRef]
- Numan, U.; Ma, B.; Meo, M.S.; Bedru, H.D. Revisiting the N-Shaped Environmental Kuznets Curve for Economic Complexity and Ecological Footprint. J. Clean. Prod. 2022, 365, 132642. [Google Scholar] [CrossRef]
- Jahanger, A.; Hossain, M.R.; Onwe, J.C.; Ogwu, S.O.; Awan, A.; Balsalobre-Lorente, D. Analyzing the N-Shaped EKC among Top Nuclear Energy Generating Nations: A Novel Dynamic Common Correlated Effects Approach. Gondwana Res. 2023, 116, 73–88. [Google Scholar] [CrossRef]
- Fakher, H.A.; Ahmed, Z.; Acheampong, A.O.; Nathaniel, S.P. Renewable Energy, Nonrenewable Energy, and Environmental Quality Nexus: An Investigation of the N-Shaped Environmental Kuznets Curve Based on Six Environmental Indicators. Energy 2023, 263, 125660. [Google Scholar] [CrossRef]
- Hossain, M.R.; Rej, S.; Awan, A.; Bandyopadhyay, A.; Islam, M.S.; Das, N.; Hossain, M.E. Natural Resource Dependency and Environmental Sustainability under N-Shaped EKC: The Curious Case of India. Resour. Policy 2023, 80, 103150. [Google Scholar] [CrossRef]
- Shehzad, K.; Zeraibi, A.; Zaman, U. Testing the N-Shaped Environmental Kuznets Curve in Algeria: An Imperious Role of Natural Resources and Economic Globalization. Resour. Policy 2022, 77, 102700. [Google Scholar] [CrossRef]
- Leal, P.H.; Marques, A.C. The Evolution of the Environmental Kuznets Curve Hypothesis Assessment: A Literature Review under a Critical Analysis Perspective. Heliyon 2022, 8, e11521. [Google Scholar] [CrossRef]
- Anser, M.K.; Syed, Q.R.; Apergis, N. Does Geopolitical Risk Escalate CO2 Emissions? Evidence from the BRICS Countries. Environ. Sci. Pollut. Res. 2021, 28, 48011–48021. [Google Scholar] [CrossRef]
- Hassan, T.; Khan, Y.; He, C.; Chen, J.; Alsagr, N.; Song, H. Naveed khan Environmental Regulations, Political Risk and Consumption-Based Carbon Emissions: Evidence from OECD Economies. J. Environ. Manag. 2022, 320, 115893. [Google Scholar] [CrossRef]
- Wang, Q.; Ren, F.; Li, R. Exploring the Impact of Geopolitics on the Environmental Kuznets Curve Research. Sustain. Dev. 2024, 32, 1700–1722. [Google Scholar] [CrossRef]
- Zhang, J.; Lyu, Y.; Li, Y.; Geng, Y. Digital Economy: An Innovation Driving Factor for Low-Carbon Development. Environ. Impact Assess. Rev. 2022, 96, 106821. [Google Scholar] [CrossRef]
- Ding, T.; Li, J.; Shi, X.; Li, X.; Chen, Y. Is Artificial Intelligence Associated with Carbon Emissions Reduction? Case of China. Resour. Policy 2023, 85, 103892. [Google Scholar] [CrossRef]
- Dong, F.; Li, Y.; Gao, Y.; Zhu, J.; Qin, C.; Zhang, X. Energy Transition and Carbon Neutrality: Exploring the Non-Linear Impact of Renewable Energy Development on Carbon Emission Efficiency in Developed Countries. Resour. Conserv. Recycl. 2022, 177, 106002. [Google Scholar] [CrossRef]
- Naeem, M.A.; Appiah, M.; Taden, J.; Amoasi, R.; Gyamfi, B.A. Transitioning to Clean Energy: Assessing the Impact of Renewable Energy, Bio-Capacity and Access to Clean Fuel on Carbon Emissions in OECD Economies. Energy Econ. 2023, 127, 107091. [Google Scholar] [CrossRef]
- Fan, J.; Zhou, L.; Zhang, Y.; Shao, S.; Ma, M. How Does Population Aging Affect Household Carbon Emissions? Evidence from Chinese Urban and Rural Areas. Energy Econ. 2021, 100, 105356. [Google Scholar] [CrossRef]
- Naseem, S.; Guang Ji, T.; Kashif, U. Asymmetrical ARDL Correlation between Fossil Fuel Energy, Food Security, and Carbon Emission: Providing Fresh Information from Pakistan. Environ. Sci. Pollut. Res. 2020, 27, 31369–31382. [Google Scholar] [CrossRef] [PubMed]
- Zhang, S.; Ma, M.; Zhou, N.; Yan, J.; Feng, W.; Yan, R.; You, K.; Zhang, J.; Ke, J. Estimation of Global Building Stocks by 2070: Unlocking Renovation Potential. Nexus 2024, 1, 100019. [Google Scholar] [CrossRef]
- Deng, Y.; Ma, M.; Zhou, N.; Ma, Z.; Yan, R.; Ma, X. China’s Plug-in Hybrid Electric Vehicle Transition: An Operational Carbon Perspective. Energy Convers. Manag. 2024, 320, 119011. [Google Scholar] [CrossRef]
- Aslanidis, N. Environmental Kuznets Curves for Carbon Emissions: A Critical Survey. SSRN Electron. J. 2009. [Google Scholar] [CrossRef]
- Mbatu, R.S.; Otiso, K.M. Chinese Economic Expansionism in Africa: A Theoretical Analysis of the Environmental Kuznets Curve Hypothesis in the Forest Sector in Cameroon. Afr. Geogr. Rev. 2012, 31, 142–162. [Google Scholar] [CrossRef]
- Chen, J.; Hu, T.E.; van Tulder, R. Is the Environmental Kuznets Curve Still Valid: A Perspective of Wicked Problems. Sustainability 2019, 11, 4747. [Google Scholar] [CrossRef]
- Ben Jebli, M.; Madaleno, M.; Schneider, N.; Shahzad, U. What Does the EKC Theory Leave behind? A State-of-the-Art Review and Assessment of Export Diversification-Augmented Models. Environ. Monit. Assess. 2022, 194, 414. [Google Scholar] [CrossRef] [PubMed]
- Shahbaz, M.; Mahalik, M.K.; Shahzad, S.J.H.; Hammoudeh, S. Does the Environmental Kuznets Curve Exist between Globalization and Energy Consumption? Global Evidence from the Cross-Correlation Method. Int. J. Financ. Econ. 2019, 24, 540–557. [Google Scholar] [CrossRef]
- Uddin, M.M.M. Does Financial Development Stimulate Environmental Sustainability? Evidence from a Panel Study of 115 Countries. Bus. Strategy Environ. 2020, 29, 2871–2889. [Google Scholar] [CrossRef]
- Ochoa-Moreno, W.S.; Quito, B.; Enríquez, D.E.; Álvarez-García, J. Evaluation of the Environmental Kuznets Curve Hypothesis in a Tourism Development Context: Evidence for 15 Latin American Countries. Bus. Strategy Environ. 2022, 31, 2143–2155. [Google Scholar] [CrossRef]
- Nguyễn, H.V.; Phan, T.T. Impact of Economic Growth, International Trade, and FDI on Sustainable Development in Developing Countries. Environ. Dev. Sustain. 2023, 2, 1–27. [Google Scholar] [CrossRef]
- Sirag, A.; Matemilola, B.T.; Law, S.H.; Bany-Ariffin, A.N. Does Environmental Kuznets Curve Hypothesis Exist? Evidence from Dynamic Panel Threshold. J. Environ. Econ. Policy 2018, 7, 145–165. [Google Scholar] [CrossRef]
- Beck, K.; Joshi, P. An Analysis of the Environmental Kuznets Curve for Carbon Dioxide Emissions: Evidence for OECD and Non-OECD Countries. Eur. J. Sustain. Dev. 2015, 4, 33. [Google Scholar] [CrossRef]
- Twerefou, D.K.; Adusah-Poku, F.; Bekoe, W. An Empirical Examination of the Environmental Kuznets Curve Hypothesis for Carbon Dioxide Emissions in Ghana: An ARDL Approach. Environ. Socio-Econ. Stud. 2016, 4, 1–12. [Google Scholar] [CrossRef]
- Chow, G.C.; Li, J. Environmental Kuznets Curve: Conclusive Econometric Evidence CO2. Pac. Econ. Rev. 2014, 19, 1–7. [Google Scholar] [CrossRef]
- Nazir, M.I.; Nazir, M.R.; Hashmi, S.H.; Ali, Z. Environmental Kuznets Curve Hypothesis for Pakistan: Empirical Evidence Form ARDL Bound Testing and Causality Approach. Int. J. Green Energy 2018, 15, 947–957. [Google Scholar] [CrossRef]
- Alharthi, M.; Dogan, E.; Taskin, D. Analysis of CO2 Emissions and Energy Consumption by Sources in MENA Countries: Evidence from Quantile Regressions. Environ. Sci. Pollut. Res. 2021, 28, 38901–38908. [Google Scholar] [CrossRef] [PubMed]
- Aljadani, A.; Toumi, H.; Toumi, S.; Hsini, M.; Jallali, B. Investigation of the N-Shaped Environmental Kuznets Curve for COVID-19 Mitigation in the KSA. Environ. Sci. Pollut. Res. 2021, 28, 29681–29700. [Google Scholar] [CrossRef]
- Alotaibi, A.A.; Alajlan, N. Using Quantile Regression to Analyze the Relationship between Socioeconomic Indicators and Carbon Dioxide Emissions in G20 Countries. Sustainability 2021, 13, 7011. [Google Scholar] [CrossRef]
- Awan, A.M.; Azam, M. Evaluating the Impact of GDP per Capita on Environmental Degradation for G-20 Economies: Does N-Shaped Environmental Kuznets Curve Exist? Environ. Dev. Sustain. 2022, 24, 11103–11126. [Google Scholar] [CrossRef]
- Balsalobre-Lorente, D.; Driha, O.M.; Sinha, A. The Dynamic Effects of Globalization Process in Analysing N-Shaped Tourism Led Growth Hypothesis. J. Hosp. Tour. Manag. 2020, 43, 42–52. [Google Scholar] [CrossRef]
- Chenghu, Z.; Arif, M.; Shehzad, K.; Ahmad, M.; Oláh, J. Modeling the Dynamic Linkage between Tourism Development, Technological Innovation, Urbanization and Environmental Quality: Provincial Data Analysis of China. Int. J. Environ. Res. Public Health 2021, 18, 8456. [Google Scholar] [CrossRef]
- Ul Haq, I.; Huo, C.; Saba, I. Economic Growth and Sustainable Development: Evidence from OIC Countries. Int. J. Islam. Middle East. Financ. Manag. 2024, 63, 101429. [Google Scholar] [CrossRef]
- Ravn, M.O.; Uhlig, H. On Adjusting the Hodrick-Prescott Filter for the Frequency of Observations. Rev. Econ. Stat. 2002, 84, 371–376. [Google Scholar] [CrossRef]
- Espoir, D.K.; Sunge, R.; Mduduzi, B.; Bannor, F.; Matsvai, S. Analysing the Response of CO2 Emissions to Business Cycle in a Developing Economy: Evidence for South Africa Post-Apartheid Era. Front. Environ. Sci. 2023, 11, 1321335. [Google Scholar] [CrossRef]
- Hodrick, R.J.; Prescott, E.C. Postwar U.S. Business Cycles: An Empirical Investigation. J. Money Credit Bank 1997, 29, 1. [Google Scholar] [CrossRef]
- Shahbaz, M.; Kumar Mahalik, M.; Jawad Hussain Shahzad, S.; Hammoudeh, S. Testing the Globalization-Driven Carbon Emissions Hypothesis: International Evidence. Int. Econ. 2019, 158, 25–38. [Google Scholar] [CrossRef]
- Galeotti, M.; Lanza, A.; Pauli, F. Reassessing the Environmental Kuznets Curve for CO2 Emissions: A Robustness Exercise. Ecol. Econ. 2006, 57, 152–163. [Google Scholar] [CrossRef]
- Sumner, J.; Bird, L.; Dobos, H. Carbon Taxes: A Review of Experience and Policy Design Considerations. Clim. Policy 2011, 11, 922–943. [Google Scholar] [CrossRef]


| Country Categories (Panels) | Acronym | GNI (USD) | Number of Countries by Category |
|---|---|---|---|
| High income | H | >12.695 | 47 |
| Upper-middle income | UM | 4.096–12.695 | 44 |
| Lower-middle income | LM | 1.046–4.095 | 49 |
| Low income | L | ≤1.045 | 18 |
| Country | Code | GDP | CO2 Emissions | |||||
|---|---|---|---|---|---|---|---|---|
| Mean | Std.Dev. | Mean | Std.Dev. | Corr. | t-Statistic | |||
| Andorra | AND | 33,513.756 | 12,730.017 | 6.991 | 0.490 | −0.458 | −2.773 | *** |
| Antigua and Barbuda | ATG | 12,606.951 | 3440.824 | 4.598 | 0.810 | 0.955 | 17.249 | *** |
| Australia | AUS | 37,398.457 | 17,743.386 | 16.917 | 1.153 | 0.003 | 0.018 | |
| Austria | AUT | 37,669.077 | 11,201.962 | 7.948 | 0.671 | −0.160 | −0.872 | |
| Bahamas, The | BHS | 23,617.698 | 7225.189 | 6.170 | 0.647 | −0.491 | −3.039 | *** |
| Bahrain | BHR | 16,955.385 | 6683.277 | 22.059 | 0.870 | −0.034 | −0.184 | |
| Barbados | BRB | 13,513.067 | 3910.232 | 4.526 | 0.676 | 0.681 | 5.003 | *** |
| Belgium | BEL | 35,184.785 | 10,319.811 | 10.040 | 1.391 | −0.875 | −9.748 | *** |
| Brunei Darussalam | BRN | 25,144.941 | 10,539.514 | 16.086 | 2.534 | 0.685 | 5.067 | *** |
| Canada | CAN | 34,749.151 | 12,273.542 | 15.834 | 0.826 | 0.058 | 0.313 | |
| Chile | CHL | 8897.364 | 4712.158 | 3.641 | 0.845 | 0.945 | 15.542 | *** |
| Czechia | CZE | 13,257.629 | 7453.118 | 11.342 | 1.448 | −0.814 | −7.558 | *** |
| Denmark | DNK | 45,961.280 | 13,673.947 | 9.186 | 2.439 | −0.786 | −6.842 | *** |
| Finland | FIN | 36,981.853 | 11,611.069 | 10.455 | 1.791 | −0.514 | −3.223 | *** |
| France | FRA | 32,848.105 | 8406.669 | 5.564 | 0.675 | −0.755 | −6.203 | *** |
| Germany | DEU | 35,496.418 | 9128.758 | 9.855 | 1.029 | −0.838 | −8.275 | *** |
| Greece | GRC | 18,240.602 | 6296.672 | 7.683 | 1.214 | 0.187 | 1.023 | |
| Hong Kong SAR, China | HKG | 30,551.181 | 9719.464 | 5.233 | 0.582 | −0.822 | −7.767 | *** |
| Iceland | ISL | 44,024.655 | 15,999.350 | 6.845 | 1.212 | −0.708 | −5.400 | *** |
| Ireland | IRL | 43,305.016 | 21,700.216 | 9.292 | 1.401 | −0.437 | −2.619 | ** |
| Italy | ITA | 28,779.928 | 6980.172 | 6.865 | 1.001 | −0.344 | −1.973 | * |
| Japan | JPN | 37,999.932 | 4955.627 | 9.187 | 0.396 | 0.204 | 1.120 | |
| Korea, Rep. | KOR | 19,019.393 | 8642.434 | 9.940 | 1.841 | 0.913 | 12.061 | *** |
| Kuwait | KWT | 28,096.194 | 13,518.981 | 23.522 | 5.081 | 0.584 | 3.873 | *** |
| Luxembourg | LUX | 80,509.712 | 33,061.083 | 21.268 | 4.711 | −0.587 | −3.902 | *** |
| Malta | MLT | 17,272.450 | 8152.843 | 5.696 | 1.282 | −0.724 | −5.647 | *** |
| Monaco | MCO | 135,307.698 | 45,555.805 | 3.585 | 1.829 | −0.433 | −2.590 | ** |
| Netherlands | NLD | 39,411.272 | 12,443.167 | 9.900 | 0.788 | −0.675 | −4.920 | *** |
| New Zealand | NZL | 26,995.219 | 11,864.834 | 7.232 | 0.605 | −0.171 | −0.932 | |
| Norway | NOR | 61,278.249 | 26,302.374 | 7.710 | 0.516 | 0.045 | 0.243 | |
| Oman | OMN | 13526.097 | 6821.440 | 12.861 | 3.694 | 0.920 | 12.600 | *** |
| Poland | POL | 8593.375 | 4888.651 | 8.191 | 0.543 | −0.607 | −4.111 | *** |
| Portugal | PRT | 16,996.778 | 5512.428 | 5.089 | 0.670 | −0.102 | −0.552 | |
| Qatar | QAT | 47,103.477 | 28,177.851 | 38.361 | 5.684 | −0.177 | −0.968 | |
| Saudi Arabia | SAU | 14,270.104 | 6556.716 | 13.351 | 2.091 | 0.937 | 14.440 | *** |
| Seychelles | SYC | 10,653.678 | 3435.597 | 4.314 | 1.172 | 0.906 | 11.512 | *** |
| Singapore | SGP | 36,894.723 | 17,488.764 | 9.076 | 1.038 | −0.806 | −7.337 | *** |
| Slovak Republic | SVK | 11,405.345 | 6464.644 | 7.034 | 1.124 | −0.868 | −9.392 | *** |
| Spain | ESP | 23,038.405 | 7321.656 | 6.241 | 0.974 | −0.042 | −0.225 | |
| St. Kitts and Nevis | KNA | 13,298.978 | 5711.927 | 4.223 | 0.804 | 0.917 | 12.393 | *** |
| Sweden | SWE | 42,712.338 | 12,272.594 | 5.342 | 1.162 | −0.859 | −9.033 | *** |
| Switzerland | CHE | 61,599.929 | 19,686.175 | 5.694 | 0.730 | −0.866 | −9.306 | *** |
| Trinidad and Tobago | TTO | 11,092.989 | 6105.806 | 11.292 | 3.038 | 0.886 | 10.303 | *** |
| United Arab Emirates | ARE | 35,667.627 | 7996.840 | 24.926 | 4.130 | −0.796 | −7.086 | *** |
| United Kingdom | GBR | 34,866.662 | 9954.021 | 8.046 | 1.554 | −0.658 | −4.712 | *** |
| United States | USA | 43,131.007 | 12,689.830 | 17.986 | 2.094 | −0.855 | −8.884 | *** |
| Uruguay | URY | 9796.516 | 5645.954 | 1.782 | 0.326 | 0.671 | 4.876 | *** |
| Country | Code | GDP | CO2 Emissions | |||||
|---|---|---|---|---|---|---|---|---|
| Mean | Std.Dev. | Mean | Std.Dev. | Corr. | t-Statistic | |||
| Albania | ALB | 2665.109 | 1800.928 | 1.298 | 0.444 | 0.804 | 7.282 | *** |
| Argentina | ARG | 8518.593 | 3227.707 | 3.715 | 0.411 | 0.786 | 6.852 | *** |
| Armenia | ARM | 2123.591 | 1619.682 | 1.812 | 1.141 | 0.054 | 0.291 | |
| Azerbaijan | AZE | 2930.402 | 2657.006 | 3.901 | 1.439 | −0.433 | −2.590 | ** |
| Botswana | BWA | 4690.513 | 1590.257 | 2.280 | 0.423 | 0.430 | 2.567 | ** |
| Brazil | BRA | 6549.213 | 3415.845 | 1.837 | 0.328 | 0.857 | 8.942 | *** |
| Bulgaria | BGR | 4718.178 | 3114.510 | 6.182 | 0.642 | −0.306 | −1.730 | * |
| China | CHN | 3620.801 | 3476.529 | 4.655 | 2.182 | 0.945 | 15.529 | *** |
| Colombia | COL | 4277.592 | 2226.098 | 1.543 | 0.125 | 0.198 | 1.089 | |
| Costa Rica | CRI | 6470.315 | 3710.129 | 1.419 | 0.200 | 0.737 | 5.870 | *** |
| Dominica | DMA | 5740.121 | 1653.786 | 1.895 | 0.612 | 0.928 | 13.457 | *** |
| Dominican Republic | DOM | 4227.287 | 2222.225 | 1.961 | 0.376 | 0.724 | 5.645 | *** |
| Ecuador | ECU | 3632.565 | 1851.646 | 2.060 | 0.340 | 0.874 | 9.678 | *** |
| Equatorial Guinea | GNQ | 7175.954 | 6775.226 | 3.837 | 1.786 | 0.708 | 5.405 | *** |
| Fiji | FJI | 3441.352 | 1376.748 | 1.144 | 0.204 | 0.731 | 5.770 | *** |
| Gabon | GAB | 6318.011 | 2019.434 | 3.803 | 0.892 | −0.785 | −6.820 | *** |
| Georgia | GEO | 2342.236 | 1625.935 | 2.097 | 1.365 | 0.117 | 0.634 | |
| Grenada | GRD | 5909.886 | 2169.873 | 2.021 | 0.462 | 0.922 | 12.842 | *** |
| Guatemala | GTM | 2490.587 | 1210.400 | 0.805 | 0.195 | 0.856 | 8.910 | *** |
| Guyana | GUY | 2956.967 | 2353.561 | 2.331 | 0.569 | 0.837 | 8.226 | *** |
| Iraq | IRQ | 3077.271 | 2547.821 | 3.702 | 0.681 | −0.099 | −0.536 | |
| Jamaica | JAM | 3971.723 | 1238.576 | 3.310 | 0.616 | −0.371 | −2.153 | ** |
| Jordan | JOR | 2696.632 | 1223.568 | 2.946 | 0.354 | −0.429 | −2.558 | ** |
| Kazakhstan | KAZ | 5512.682 | 4348.579 | 11.822 | 2.339 | 0.459 | 2.785 | *** |
| Libya | LBY | 8345.772 | 2814.005 | 8.323 | 1.018 | 0.313 | 1.772 | * |
| Malaysia | MYS | 6631.129 | 3043.872 | 5.963 | 1.403 | 0.896 | 10.872 | *** |
| Maldives | MDV | 5069.865 | 3375.597 | 2.132 | 0.954 | 0.970 | 21.379 | *** |
| Marshall Islands | MHL | 2915.601 | 1028.386 | 2.206 | 0.773 | 0.773 | 6.566 | *** |
| Mauritius | MUS | 6343.081 | 3021.857 | 2.328 | 0.752 | 0.940 | 14.778 | *** |
| Mexico | MEX | 8056.363 | 2420.964 | 3.809 | 0.303 | 0.653 | 4.646 | *** |
| North Macedonia | MKD | 3519.998 | 1618.463 | 4.119 | 0.412 | −0.633 | −4.408 | *** |
| Panama | PAN | 7398.370 | 4574.470 | 2.075 | 0.521 | 0.848 | 8.625 | *** |
| Paraguay | PRY | 3421.072 | 1963.058 | 0.835 | 0.207 | 0.779 | 6.680 | *** |
| Peru | PER | 3746.250 | 2082.419 | 1.281 | 0.319 | 0.969 | 21.244 | *** |
| Romania | ROU | 5752.380 | 4257.793 | 4.486 | 0.868 | −0.634 | −4.414 | *** |
| Russian Federation | RUS | 6902.982 | 4683.833 | 11.461 | 1.068 | 0.018 | 0.099 | |
| South Africa | ZAF | 5226.971 | 1825.468 | 7.108 | 0.890 | 0.853 | 8.791 | *** |
| St. Lucia | LCA | 7379.675 | 2389.200 | 2.430 | 0.496 | 0.905 | 11.485 | *** |
| St. Vincent and the Grenadines | VCT | 5227.806 | 2141.860 | 1.781 | 0.558 | 0.915 | 12.199 | *** |
| Suriname | SUR | 4408.957 | 2894.728 | 3.911 | 0.901 | −0.132 | −0.715 | |
| Thailand | THA | 3857.679 | 1909.120 | 3.103 | 0.658 | 0.833 | 8.109 | *** |
| Turkey | TUR | 6980.295 | 3622.281 | 3.695 | 0.814 | 0.889 | 10.438 | *** |
| Turkmenistan | TKM | 3117.179 | 2706.998 | 9.776 | 1.692 | 0.664 | 4.786 | *** |
| Tuvalu | TUV | 2481.515 | 1242.141 | 0.859 | 0.148 | −0.149 | −0.814 | |
| Country | Code | GDP | CO2 Emissions | |||||
|---|---|---|---|---|---|---|---|---|
| Mean | Std.Dev. | Mean | Std.Dev. | Corr. | t-Statistic | |||
| Algeria | DZA | 3136.814 | 1432.914 | 3.061 | 0.542 | 0.817 | 7.616 | *** |
| Angola | AGO | 1982.430 | 1586.901 | 0.888 | 0.169 | 0.226 | 1.251 | |
| Bangladesh | BGD | 774.193 | 588.449 | 0.281 | 0.154 | 0.944 | 15.452 | *** |
| Belize | BLZ | 4962.751 | 929.042 | 1.742 | 0.228 | −0.615 | −4.201 | *** |
| Benin | BEN | 775.224 | 344.346 | 0.340 | 0.198 | 0.951 | 16.531 | *** |
| Bolivia | BOL | 1679.277 | 990.356 | 1.359 | 0.328 | 0.842 | 8.390 | *** |
| Cabo Verde | CPV | 2337.745 | 1192.087 | 0.803 | 0.227 | 0.868 | 9.416 | *** |
| Cameroon | CMR | 1173.040 | 320.181 | 0.361 | 0.068 | 0.040 | 0.214 | |
| Comoros | COM | 1136.511 | 327.103 | 0.232 | 0.076 | 0.653 | 4.638 | *** |
| Congo, Rep. | COG | 1838.393 | 998.058 | 1.135 | 0.148 | −0.005 | −0.026 | |
| Cote d’Ivoire | CIV | 1432.329 | 506.953 | 0.326 | 0.069 | 0.703 | 5.325 | *** |
| Djibouti | DJI | 1321.574 | 779.032 | 0.486 | 0.055 | −0.690 | −5.132 | *** |
| Egypt, Arab Rep. | EGY | 1814.874 | 960.204 | 1.934 | 0.350 | 0.812 | 7.494 | *** |
| El Salvador | SLV | 2564.978 | 1034.958 | 0.983 | 0.200 | 0.776 | 6.625 | *** |
| Eswatini | SWZ | 2666.611 | 1105.311 | 1.015 | 0.190 | −0.702 | −5.304 | *** |
| Ghana | GHA | 990.185 | 732.772 | 0.340 | 0.138 | 0.930 | 13.615 | *** |
| Haiti | HTI | 881.238 | 425.613 | 0.206 | 0.071 | 0.921 | 12.689 | *** |
| Honduras | HND | 1522.123 | 590.852 | 0.867 | 0.212 | 0.765 | 6.400 | *** |
| India | IND | 944.063 | 604.968 | 1.133 | 0.380 | 0.986 | 31.738 | *** |
| Indonesia | IDN | 1990.622 | 1323.478 | 1.519 | 0.390 | 0.909 | 11.776 | *** |
| Kenya | KEN | 860.717 | 562.280 | 0.290 | 0.061 | 0.927 | 13.351 | *** |
| Kiribati | KIR | 1104.692 | 386.045 | 0.476 | 0.104 | 0.754 | 6.184 | *** |
| Kyrgyz Republic | KGZ | 735.667 | 393.812 | 1.624 | 0.976 | 0.079 | 0.425 | |
| Lao PDR | LAO | 988.265 | 866.027 | 0.676 | 0.897 | 0.902 | 11.226 | *** |
| Lesotho | LSO | 762.700 | 309.704 | 0.970 | 0.155 | 0.859 | 9.035 | *** |
| Mauritania | MRT | 1223.134 | 459.310 | 0.547 | 0.153 | 0.830 | 7.999 | *** |
| Micronesia, Fed. Sts. | FSM | 2445.629 | 614.171 | 1.292 | 0.421 | 0.018 | 0.099 | |
| Mongolia | MNG | 1946.519 | 1588.169 | 5.102 | 1.162 | 0.802 | 7.225 | *** |
| Morocco | MAR | 2345.155 | 867.836 | 1.396 | 0.317 | 0.967 | 20.350 | *** |
| Myanmar | MMR | 582.229 | 527.164 | 0.254 | 0.164 | 0.763 | 6.358 | *** |
| Nepal | NPL | 490.987 | 347.138 | 0.183 | 0.143 | 0.933 | 13.921 | *** |
| Nicaragua | NIC | 1261.086 | 549.009 | 0.715 | 0.125 | 0.737 | 5.873 | *** |
| Nigeria | NGA | 1601.920 | 829.271 | 0.686 | 0.122 | −0.695 | −5.211 | *** |
| Pakistan | PAK | 873.978 | 417.101 | 0.694 | 0.102 | 0.915 | 12.222 | *** |
| Papua New Guinea | PNG | 1493.388 | 791.845 | 0.615 | 0.097 | 0.551 | 3.553 | *** |
| Philippines | PHL | 1812.246 | 892.837 | 0.925 | 0.174 | 0.758 | 6.253 | *** |
| Samoa | WSM | 2537.854 | 1294.011 | 0.898 | 0.199 | 0.892 | 10.602 | *** |
| Senegal | SEN | 1059.197 | 308.972 | 0.491 | 0.134 | 0.825 | 7.849 | *** |
| Solomon Islands | SLB | 1465.966 | 579.793 | 0.546 | 0.076 | −0.146 | −0.795 | |
| Sri Lanka | LKA | 1981.855 | 1442.738 | 0.635 | 0.252 | 0.889 | 10.473 | *** |
| Tajikistan | TJK | 525.295 | 317.412 | 0.617 | 0.432 | 0.102 | 0.550 | |
| Tanzania | TZA | 564.769 | 319.562 | 0.137 | 0.058 | 0.961 | 18.803 | *** |
| Tunisia | TUN | 2998.875 | 992.619 | 2.250 | 0.316 | 0.931 | 13.781 | *** |
| Ukraine | UKR | 2115.424 | 1183.604 | 6.610 | 2.278 | −0.396 | −2.322 | ** |
| Uzbekistan | UZB | 1175.693 | 790.401 | 4.412 | 0.726 | −0.823 | −7.798 | *** |
| Vanuatu | VUT | 2063.623 | 716.584 | 0.451 | 0.079 | 0.483 | 2.968 | *** |
| Vietnam | VNM | 1257.278 | 1157.203 | 1.322 | 0.959 | 0.973 | 22.813 | *** |
| Zambia | ZMB | 900.692 | 521.524 | 0.261 | 0.084 | 0.226 | 1.252 | |
| Zimbabwe | ZWE | 876.170 | 442.966 | 1.024 | 0.357 | −0.337 | −1.930 | * |
| Country | Code | GDP | CO2 Emissions | |||||
|---|---|---|---|---|---|---|---|---|
| Mean | Std.Dev. | Mean | Std.Dev. | Corr. | t-Statistic | |||
| Burkina Faso | BFA | 483.356 | 211.656 | 0.123 | 0.065 | 0.873 | 9.628 | *** |
| Burundi | BDI | 189.134 | 46.069 | 0.036 | 0.010 | 0.376 | 2.182 | ** |
| Central African Republic | CAF | 372.932 | 87.692 | 0.049 | 0.010 | −0.574 | −3.779 | *** |
| Chad | TCD | 538.884 | 305.413 | 0.081 | 0.017 | 0.882 | 10.068 | *** |
| Ethiopia | ETH | 334.374 | 249.384 | 0.080 | 0.039 | 0.945 | 15.608 | *** |
| Gambia, The | GMB | 620.288 | 122.167 | 0.209 | 0.030 | 0.417 | 2.469 | ** |
| Guinea | GIN | 587.920 | 207.676 | 0.207 | 0.052 | 0.834 | 8.146 | *** |
| Guinea-Bissau | GNB | 438.391 | 194.574 | 0.155 | 0.015 | 0.002 | 0.012 | |
| Madagascar | MDG | 386.385 | 99.034 | 0.099 | 0.020 | 0.576 | 3.793 | *** |
| Malawi | MWI | 425.618 | 157.423 | 0.077 | 0.008 | −0.477 | −2.921 | *** |
| Mali | MLI | 518.234 | 231.972 | 0.120 | 0.049 | 0.935 | 14.198 | *** |
| Niger | NER | 380.385 | 132.584 | 0.071 | 0.019 | 0.813 | 7.528 | *** |
| Rwanda | RWA | 446.082 | 227.983 | 0.079 | 0.015 | 0.615 | 4.204 | *** |
| Sierra Leone | SLE | 340.939 | 170.745 | 0.098 | 0.033 | 0.894 | 10.773 | *** |
| Sudan | SDN | 1122.105 | 782.028 | 0.351 | 0.133 | 0.741 | 5.942 | *** |
| Togo | TGO | 548.882 | 234.301 | 0.273 | 0.064 | 0.326 | 1.854 | * |
| Uganda | UGA | 483.754 | 278.287 | 0.082 | 0.035 | 0.937 | 14.498 | *** |
| Yemen, Rep. | YEM | 931.176 | 398.789 | 0.735 | 0.246 | 0.105 | 0.570 | |
| World Region | Code | GDP | CO2 Emissions | |||||
|---|---|---|---|---|---|---|---|---|
| Mean | Std.Dev. | Mean | Std.Dev. | Corr. | t-Statistic | |||
| Arab World | ARB | 4409.764 | 1994.329 | 3.687 | 0.551 | 0.958 | 18.087 | *** |
| Caribbean small states | CSS | 7079.385 | 2907.295 | 4.930 | 0.592 | 0.797 | 7.101 | *** |
| Central Europe and the Baltics | CEB | 8716.471 | 5125.355 | 6.933 | 0.641 | −0.677 | −4.953 | *** |
| Early-demographic dividend | EAR | 2145.871 | 997.383 | 1.758 | 0.324 | 0.983 | 29.132 | *** |
| East Asia and Pacific | EAS | 6277.222 | 2971.174 | 4.279 | 1.426 | 0.965 | 19.857 | *** |
| East Asia and Pacific (excluding high income) | EAP | 3102.089 | 2735.300 | 3.707 | 1.582 | 0.953 | 17.009 | *** |
| East Asia and Pacific (IDA and IBRD countries) | TEA | 3137.219 | 2765.625 | 3.719 | 1.614 | 0.953 | 16.953 | *** |
| Euro area | EMU | 30,041.323 | 8329.311 | 7.521 | 0.813 | −0.701 | −5.290 | *** |
| Europe and Central Asia | ECS | 18,426.500 | 6185.380 | 7.558 | 0.741 | −0.664 | −4.787 | *** |
| Europe and Central Asia (excluding high income) | ECA | 5074.851 | 3165.363 | 7.606 | 0.940 | −0.156 | −0.850 | |
| Europe and Central Asia (IDA and IBRD countries) | TEC | 5449.408 | 3331.387 | 7.473 | 0.857 | −0.220 | −1.213 | |
| European Union | EUU | 26,145.894 | 7939.703 | 7.460 | 0.770 | −0.752 | −6.151 | *** |
| Fragile and conflict-affected situations | FCS | 1426.060 | 602.529 | 1.282 | 0.335 | −0.645 | −4.540 | *** |
| Heavily indebted poor countries (HIPC) | HPC | 632.022 | 278.419 | 0.205 | 0.046 | 0.973 | 22.850 | *** |
| High income | HIC | 32,361.412 | 8926.937 | 10.915 | 0.730 | −0.660 | −4.728 | *** |
| IBRD only | IBD | 3222.182 | 2068.898 | 3.339 | 0.791 | 0.987 | 33.038 | *** |
| IDA and IBRD total | IBT | 2652.901 | 1627.332 | 2.667 | 0.556 | 0.985 | 31.048 | *** |
| IDA blend | IDB | 1183.662 | 567.481 | 0.897 | 0.067 | −0.901 | −11.179 | *** |
| IDA only | IDX | 744.650 | 324.124 | 0.289 | 0.060 | 0.968 | 20.673 | *** |
| IDA total | IDA | 890.843 | 399.954 | 0.491 | 0.025 | 0.747 | 6.049 | *** |
| Late-demographic dividend | LTE | 4487.925 | 3304.814 | 4.735 | 1.390 | 0.982 | 27.865 | *** |
| Latin America and Caribbean | LCN | 6267.761 | 2639.431 | 2.443 | 0.260 | 0.897 | 10.935 | *** |
| Latin America and Caribbean (excluding high income) | LAC | 5966.245 | 2463.491 | 2.258 | 0.238 | 0.912 | 11.967 | *** |
| Latin America and the Caribbean (IDA and IBRD countries) | TLA | 6169.196 | 2624.209 | 2.459 | 0.265 | 0.897 | 10.910 | *** |
| Least developed countries: UN classification | LDC | 620.251 | 326.348 | 0.218 | 0.074 | 0.957 | 17.747 | *** |
| Low and middle income | LMY | 2540.821 | 1573.965 | 2.599 | 0.568 | 0.985 | 30.271 | *** |
| Low income | LIC | 649.790 | 214.273 | 0.394 | 0.094 | −0.386 | −2.252 | ** |
| Lower middle income | LMC | 1210.648 | 676.003 | 1.283 | 0.222 | 0.980 | 26.532 | *** |
| Middle East and North Africa | MEA | 5109.302 | 2336.851 | 4.648 | 0.749 | 0.956 | 17.448 | *** |
| Middle East and North Africa (excluding high income) | MNA | 2817.581 | 1229.723 | 3.156 | 0.442 | 0.914 | 12.099 | *** |
| Middle East and North Africa (IDA and IBRD countries) | TMN | 2825.307 | 1235.171 | 3.190 | 0.449 | 0.913 | 12.054 | *** |
| Middle income | MIC | 2730.098 | 1733.156 | 2.807 | 0.654 | 0.986 | 31.420 | *** |
| North America | NAC | 42,300.725 | 12,518.295 | 17.770 | 1.927 | −0.837 | −8.239 | *** |
| OECD members | OED | 29,249.160 | 7759.829 | 9.912 | 0.773 | −0.725 | −5.669 | *** |
| Other small states | OSS | 8366.543 | 4673.966 | 5.300 | 0.742 | 0.972 | 22.326 | *** |
| Pacific island small states | PSS | 2619.201 | 952.894 | 1.020 | 0.112 | 0.505 | 3.152 | *** |
| Post-demographic dividend | PST | 33,151.302 | 9035.017 | 11.068 | 0.906 | −0.755 | −6.203 | *** |
| Pre-demographic dividend | PRE | 1009.993 | 490.465 | 0.474 | 0.040 | 0.065 | 0.353 | |
| Small states | SST | 7761.159 | 4095.455 | 4.950 | 0.666 | 0.968 | 20.902 | *** |
| South Asia | SAS | 916.023 | 574.025 | 0.968 | 0.313 | 0.988 | 33.776 | *** |
| Sub-Saharan Africa | SSF | 1177.861 | 470.510 | 0.768 | 0.029 | −0.030 | −0.162 | |
| Sub-Saharan Africa (excluding high income) | SSA | 1176.860 | 470.380 | 0.768 | 0.029 | −0.032 | −0.171 | |
| Upper middle income | UMC | 4323.453 | 2930.511 | 4.360 | 1.210 | 0.981 | 27.082 | *** |
| World | WLD | 7700.699 | 2545.740 | 4.263 | 0.322 | 0.945 | 15.611 | *** |
| Country | Code | Lags | Leads | (Aver. CCC Lags)/(Aver. CCC Leads) | |||||
|---|---|---|---|---|---|---|---|---|---|
| Σ of CCC | Aver. CCC | Σ of CCC | Aver. CCC | (+)/(−) | (−)/(−) | (−)/(+) | (+)/(+) | ||
| Andorra | AND | −7.042 | −0.352 | 3.093 | 0.155 | X | |||
| Antigua and Barbuda | ATG | 1.640 | 0.082 | 3.098 | 0.155 | X | |||
| Australia | AUS | −6.409 | −0.320 | 6.783 | 0.339 | X | |||
| Austria | AUT | −7.123 | −0.356 | 5.411 | 0.271 | X | |||
| Bahamas, The | BHS | 1.416 | 0.071 | −3.417 | −0.171 | X | |||
| Bahrain | BHR | −5.458 | −0.273 | 6.009 | 0.300 | X | |||
| Barbados | BRB | −2.998 | −0.150 | 4.982 | 0.249 | X | |||
| Belgium | BEL | −4.467 | −0.223 | 0.149 | 0.007 | X | |||
| Brunei Darussalam | BRN | 1.482 | 0.074 | 1.873 | 0.094 | X | |||
| Canada | CAN | −6.774 | −0.339 | 6.410 | 0.320 | X | |||
| Chile | CHL | 1.603 | 0.080 | 3.273 | 0.164 | X | |||
| Czechia | CZE | −3.458 | −0.173 | −1.595 | −0.080 | X | |||
| Denmark | DNK | −4.665 | −0.233 | 0.072 | 0.004 | X | |||
| Finland | FIN | −6.599 | −0.330 | 2.805 | 0.140 | X | |||
| France | FRA | −5.332 | −0.267 | 0.943 | 0.047 | X | |||
| Germany | DEU | −2.401 | −0.120 | −2.587 | −0.129 | X | |||
| Greece | GRC | −8.195 | −0.410 | 4.505 | 0.225 | X | |||
| Hong Kong SAR, China | HKG | −1.112 | −0.056 | −3.821 | −0.191 | X | |||
| Iceland | ISL | −5.115 | −0.256 | 0.536 | 0.027 | X | |||
| Ireland | IRL | −5.985 | −0.299 | 3.257 | 0.163 | X | |||
| Italy | ITA | −7.367 | −0.368 | 3.658 | 0.183 | X | |||
| Japan | JPN | −6.023 | −0.301 | 4.230 | 0.211 | X | |||
| Korea, Rep. | KOR | 0.578 | 0.029 | 4.455 | 0.223 | X | |||
| Kuwait | KWT | −4.113 | −0.206 | 4.203 | 0.210 | X | |||
| Luxembourg | LUX | −3.479 | −0.174 | −1.592 | −0.080 | X | |||
| Malta | MLT | −4.985 | −0.249 | 0.753 | 0.038 | X | |||
| Monaco | MCO | 2.582 | 0.129 | −6.264 | −0.313 | X | |||
| Netherlands | NLD | −6.040 | −0.302 | 1.540 | 0.077 | X | |||
| New Zealand | NZL | −6.196 | −0.310 | 6.340 | 0.317 | X | |||
| Norway | NOR | −6.793 | −0.340 | 5.898 | 0.295 | X | |||
| Oman | OMN | 1.103 | 0.055 | 2.717 | 0.136 | X | |||
| Poland | POL | 0.528 | 0.026 | −5.257 | −0.263 | X | |||
| Portugal | PRT | −6.901 | −0.345 | 5.672 | 0.284 | X | |||
| Qatar | QAT | −6.852 | −0.343 | 5.832 | 0.292 | X | |||
| Saudi Arabia | SAU | 1.557 | 0.078 | 2.515 | 0.126 | X | |||
| Seychelles | SYC | 2.038 | 0.102 | 3.242 | 0.162 | X | |||
| Singapore | SGP | −1.033 | −0.052 | −3.481 | −0.174 | X | |||
| Slovak Republic | SVK | −1.767 | −0.088 | −3.144 | −0.157 | X | |||
| Spain | ESP | −7.544 | −0.377 | 5.409 | 0.270 | X | |||
| St. Kitts and Nevis | KNA | 0.452 | 0.023 | 4.513 | 0.226 | X | |||
| Sweden | SWE | −3.878 | −0.194 | −0.355 | −0.018 | X | |||
| Switzerland | CHE | −3.793 | −0.190 | −0.711 | −0.036 | X | |||
| Trinidad and Tobago | TTO | 0.151 | 0.008 | 2.131 | 0.107 | X | |||
| United Arab Emirates | ARE | −3.084 | −0.154 | −1.219 | −0.061 | X | |||
| United Kingdom | GBR | −6.325 | −0.316 | 1.431 | 0.072 | X | |||
| United States | USA | −4.803 | −0.240 | 0.309 | 0.015 | X | |||
| Uruguay | URY | −1.334 | −0.067 | 5.689 | 0.284 | X | |||
| Country | Code | Lags | Leads | (Aver. CCC Lags)/(Aver. CCC Leads) | |||||
|---|---|---|---|---|---|---|---|---|---|
| Σ of CCC | Aver. CCC | Σ of CCC | Aver. CCC | (+)/(−) | (−)/(−) | (−)/(+) | (+)/(+) | ||
| Albania | ALB | 2.572 | 0.129 | 1.421 | 0.071 | X | |||
| Argentina | ARG | −1.809 | −0.090 | 5.497 | 0.275 | X | |||
| Armenia | ARM | 3.980 | 0.199 | −6.273 | −0.314 | X | |||
| Azerbaijan | AZE | 2.142 | 0.107 | −5.760 | −0.288 | X | |||
| Botswana | BWA | 5.719 | 0.286 | −1.355 | −0.068 | X | |||
| Brazil | BRA | 1.226 | 0.061 | 2.794 | 0.140 | X | |||
| Bulgaria | BGR | −0.522 | −0.026 | −4.344 | −0.217 | X | |||
| China | CHN | 0.601 | 0.030 | 3.943 | 0.197 | X | |||
| Colombia | COL | 6.090 | 0.304 | −5.558 | −0.278 | X | |||
| Costa Rica | CRI | −1.143 | −0.057 | 5.850 | 0.292 | X | |||
| Dominica | DMA | 0.782 | 0.039 | 3.851 | 0.193 | X | |||
| Dominican Republic | DOM | −0.984 | −0.049 | 5.961 | 0.298 | X | |||
| Ecuador | ECU | −0.369 | −0.018 | 4.789 | 0.239 | X | |||
| Equatorial Guinea | GNQ | −3.124 | −0.156 | 3.915 | 0.196 | X | |||
| Fiji | FJI | 1.171 | 0.059 | 4.052 | 0.203 | X | |||
| Gabon | GAB | −3.635 | −0.182 | 0.720 | 0.036 | X | |||
| Georgia | GEO | 4.636 | 0.232 | −7.120 | −0.356 | X | |||
| Grenada | GRD | 1.276 | 0.064 | 3.933 | 0.197 | X | |||
| Guatemala | GTM | 0.667 | 0.033 | 4.708 | 0.235 | X | |||
| Guyana | GUY | 2.944 | 0.147 | 1.842 | 0.092 | X | |||
| Iraq | IRQ | 5.283 | 0.264 | −6.099 | −0.305 | X | |||
| Jamaica | JAM | −6.906 | −0.345 | 3.431 | 0.172 | X | |||
| Jordan | JOR | −6.571 | −0.329 | 3.835 | 0.192 | X | |||
| Kazakhstan | KAZ | 1.546 | 0.077 | −2.976 | −0.149 | X | |||
| Libya | LBY | −4.513 | −0.226 | 6.170 | 0.309 | X | |||
| Malaysia | MYS | 0.258 | 0.013 | 4.560 | 0.228 | X | |||
| Maldives | MDV | 1.493 | 0.075 | 3.479 | 0.174 | X | |||
| Marshall Islands | MHL | −0.372 | −0.019 | 5.549 | 0.277 | X | |||
| Mauritius | MUS | 0.781 | 0.039 | 4.087 | 0.204 | X | |||
| Mexico | MEX | −4.029 | −0.201 | 4.495 | 0.225 | X | |||
| North Macedonia | MKD | −4.714 | −0.236 | 1.115 | 0.056 | X | |||
| Panama | PAN | −0.258 | −0.013 | 5.076 | 0.254 | X | |||
| Paraguay | PRY | 3.121 | 0.156 | 1.264 | 0.063 | X | |||
| Peru | PER | 1.919 | 0.096 | 2.436 | 0.122 | X | |||
| Romania | ROU | 0.232 | 0.012 | −5.237 | −0.262 | X | |||
| Russian Federation | RUS | 2.822 | 0.141 | −6.041 | −0.302 | X | |||
| South Africa | ZAF | −0.629 | −0.031 | 3.504 | 0.175 | X | |||
| St. Lucia | LCA | 0.297 | 0.015 | 4.700 | 0.235 | X | |||
| St. Vincent and the Grenadines | VCT | 0.318 | 0.016 | 4.420 | 0.221 | X | |||
| Suriname | SUR | 5.648 | 0.282 | −6.308 | −0.315 | X | |||
| Thailand | THA | −0.578 | −0.029 | 5.583 | 0.279 | X | |||
| Turkey | TUR | 3.570 | 0.179 | 0.906 | 0.045 | X | |||
| Turkmenistan | TKM | −0.722 | −0.036 | 3.844 | 0.192 | X | |||
| Tuvalu | TUV | −6.195 | −0.310 | 5.766 | 0.288 | X | |||
| Country | Code | Lags | Leads | (Aver. CCC Lags)/(Aver. CCC Leads) | |||||
|---|---|---|---|---|---|---|---|---|---|
| Σ of CCC | Aver. CCC | Σ of CCC | Aver. CCC | (+)/(−) | (−)/(−) | (−)/(+) | (+)/(+) | ||
| Algeria | DZA | 4.102 | 0.205 | −0.346 | −0.017 | X | |||
| Angola | AGO | −4.264 | −0.213 | 5.273 | 0.264 | X | |||
| Bangladesh | BGD | 0.686 | 0.034 | 3.729 | 0.186 | X | |||
| Belize | BLZ | 1.398 | 0.070 | −4.353 | −0.218 | X | |||
| Benin | BEN | 2.272 | 0.114 | 2.525 | 0.126 | X | |||
| Bolivia | BOL | 3.386 | 0.169 | −1.245 | −0.062 | X | |||
| Cabo Verde | CPV | 0.743 | 0.037 | 3.582 | 0.179 | X | |||
| Cameroon | CMR | 4.937 | 0.247 | −7.669 | −0.383 | X | |||
| Comoros | COM | 2.943 | 0.147 | 1.325 | 0.066 | X | |||
| Congo, Rep. | COG | 4.618 | 0.231 | −5.458 | −0.273 | X | |||
| Cote d’Ivoire | CIV | 1.507 | 0.075 | 3.856 | 0.193 | X | |||
| Djibouti | DJI | −3.880 | −0.194 | 2.471 | 0.124 | X | |||
| Egypt, Arab Rep. | EGY | −0.120 | −0.006 | 4.455 | 0.223 | X | |||
| El Salvador | SLV | −1.105 | −0.055 | 5.670 | 0.283 | X | |||
| Eswatini | SWZ | 0.549 | 0.027 | −3.841 | −0.192 | X | |||
| Ghana | GHA | 1.088 | 0.054 | 3.561 | 0.178 | X | |||
| Haiti | HTI | 2.643 | 0.132 | 2.221 | 0.111 | X | |||
| Honduras | HND | −1.539 | −0.077 | 6.070 | 0.303 | X | |||
| India | IND | 1.776 | 0.089 | 2.878 | 0.144 | X | |||
| Indonesia | IDN | 0.794 | 0.040 | 4.129 | 0.206 | X | |||
| Kenya | KEN | 2.843 | 0.142 | 0.968 | 0.048 | X | |||
| Kiribati | KIR | −0.374 | −0.019 | 4.338 | 0.217 | X | |||
| Kyrgyz Republic | KGZ | 3.337 | 0.167 | −7.047 | −0.352 | X | |||
| Lao PDR | LAO | 3.118 | 0.156 | 0.419 | 0.021 | X | |||
| Lesotho | LSO | 0.641 | 0.032 | 3.001 | 0.150 | X | |||
| Mauritania | MRT | 2.926 | 0.146 | 0.907 | 0.045 | X | |||
| Micronesia, Fed. Sts. | FSM | −2.482 | −0.124 | 4.009 | 0.200 | X | |||
| Mongolia | MNG | 3.658 | 0.183 | −2.346 | −0.117 | X | |||
| Morocco | MAR | 2.354 | 0.118 | 2.396 | 0.120 | X | |||
| Myanmar | MMR | 3.740 | 0.187 | 0.539 | 0.027 | X | |||
| Nepal | NPL | 2.907 | 0.145 | 1.167 | 0.058 | X | |||
| Nicaragua | NIC | −1.402 | −0.070 | 5.709 | 0.285 | X | |||
| Nigeria | NGA | −1.219 | −0.061 | −2.816 | −0.141 | X | |||
| Pakistan | PAK | 1.766 | 0.088 | 3.367 | 0.168 | X | |||
| Papua New Guinea | PNG | −1.266 | −0.063 | 5.309 | 0.265 | X | |||
| Philippines | PHL | 2.785 | 0.139 | 1.786 | 0.089 | X | |||
| Samoa | WSM | 1.870 | 0.094 | 3.248 | 0.162 | X | |||
| Senegal | SEN | 0.628 | 0.031 | 3.601 | 0.180 | X | |||
| Solomon Islands | SLB | −5.705 | −0.285 | 5.866 | 0.293 | X | |||
| Sri Lanka | LKA | 1.283 | 0.064 | 3.779 | 0.189 | X | |||
| Tajikistan | TJK | 4.742 | 0.237 | −7.472 | −0.374 | X | |||
| Tanzania | TZA | 2.741 | 0.137 | 2.177 | 0.109 | X | |||
| Tunisia | TUN | 2.682 | 0.134 | 1.322 | 0.066 | X | |||
| Ukraine | UKR | −0.118 | −0.006 | −4.406 | −0.220 | X | |||
| Uzbekistan | UZB | −1.843 | −0.092 | −2.292 | −0.115 | X | |||
| Vanuatu | VUT | 4.250 | 0.212 | −0.697 | −0.035 | X | |||
| Vietnam | VNM | 2.030 | 0.102 | 2.504 | 0.125 | X | |||
| Zambia | ZMB | 7.000 | 0.350 | −5.704 | −0.285 | X | |||
| Zimbabwe | ZWE | 2.766 | 0.138 | −7.409 | −0.370 | X | |||
| Country | Code | Lags | Leads | (Aver. CCC Lags)/(Aver. CCC Leads) | |||||
|---|---|---|---|---|---|---|---|---|---|
| Σ of CCC | Aver. CCC | Σ of CCC | Aver. CCC | (+)/(−) | (−)/(−) | (−)/(+) | (+)/(+) | ||
| Burkina Faso | BFA | 3.388 | 0.169 | 0.836 | 0.042 | X | |||
| Burundi | BDI | 4.111 | 0.206 | −3.874 | −0.194 | X | |||
| Central African Republic | CAF | 2.653 | 0.133 | −1.602 | −0.080 | X | |||
| Chad | TCD | 3.009 | 0.150 | 0.231 | 0.012 | X | |||
| Ethiopia | ETH | 0.550 | 0.027 | 3.212 | 0.161 | X | |||
| Gambia, The | GMB | 1.928 | 0.096 | 1.590 | 0.079 | X | |||
| Guinea | GIN | 0.931 | 0.047 | 3.144 | 0.157 | X | |||
| Guinea-Bissau | GNB | 5.180 | 0.259 | −6.979 | −0.349 | X | |||
| Madagascar | MDG | 3.746 | 0.187 | 0.645 | 0.032 | X | |||
| Malawi | MWI | 3.356 | 0.168 | −4.334 | −0.217 | X | |||
| Mali | MLI | 1.907 | 0.095 | 2.875 | 0.144 | X | |||
| Niger | NER | 1.254 | 0.063 | 1.030 | 0.051 | X | |||
| Rwanda | RWA | 3.432 | 0.172 | 0.806 | 0.040 | X | |||
| Sierra Leone | SLE | 3.057 | 0.153 | 1.047 | 0.052 | X | |||
| Sudan | SDN | 0.858 | 0.043 | 1.852 | 0.093 | X | |||
| Togo | TGO | −3.624 | −0.181 | 7.107 | 0.355 | X | |||
| Uganda | UGA | 2.133 | 0.107 | 2.301 | 0.115 | X | |||
| Yemen, Rep. | YEM | −3.368 | −0.168 | 3.962 | 0.198 | X | |||
| World Region | Code | Lags | Leads | (Aver. CCC Lags)/(Aver. CCC Leads) | |||||
|---|---|---|---|---|---|---|---|---|---|
| Σ of CCC | Aver. CCC | Σ of CCC | Aver. CCC | (+)/(−) | (−)/(−) | (−)/(+) | (+)/(+) | ||
| Arab World | ARB | 1.4163 | 0.0708 | 2.7020 | 0.1351 | X | |||
| Caribbean small states | CSS | −0.7673 | −0.0384 | 3.3647 | 0.1682 | X | |||
| Central Europe and the Baltics | CEB | −0.7807 | −0.0390 | −4.2701 | −0.2135 | X | |||
| Early-demographic dividend | EAR | 1.7162 | 0.0858 | 2.9637 | 0.1482 | X | |||
| East Asia and Pacific | EAS | 0.9762 | 0.0488 | 3.6751 | 0.1838 | X | |||
| East Asia and Pacific (excluding high income) | EAP | 0.6940 | 0.0347 | 3.8910 | 0.1945 | X | |||
| East Asia and Pacific (IDA and IBRD countries) | TEA | 0.6817 | 0.0341 | 3.9099 | 0.1955 | X | |||
| Euro area | EMU | −5.7828 | −0.2891 | 1.4026 | 0.0701 | X | |||
| Europe and Central Asia | ECS | −2.8028 | −0.1401 | −2.1610 | −0.1081 | X | |||
| Europe and Central Asia (excluding high income) | ECA | 1.8913 | 0.0946 | −5.7348 | −0.2867 | X | |||
| Europe and Central Asia (IDA and IBRD countries) | TEC | 1.7816 | 0.0891 | −5.7382 | −0.2869 | X | |||
| European Union | EUU | −5.1135 | −0.2557 | 0.4929 | 0.0246 | X | |||
| Fragile and conflict-affected situations | FCS | −0.8084 | −0.0404 | −3.5588 | −0.1779 | X | |||
| Heavily indebted poor countries (HIPC) | HPC | 2.3229 | 0.1161 | 1.8006 | 0.0900 | X | |||
| High income | HIC | −6.3282 | −0.3164 | 2.5069 | 0.1253 | X | |||
| IBRD only | IBD | 1.6665 | 0.0833 | 2.6546 | 0.1327 | X | |||
| IDA and IBRD total | IBT | 1.6870 | 0.0843 | 2.5757 | 0.1288 | X | |||
| IDA blend | IDB | −0.8144 | −0.0407 | −3.8206 | −0.1910 | X | |||
| IDA only | IDX | 2.6625 | 0.1331 | 1.9562 | 0.0978 | X | |||
| IDA total | IDA | 4.0536 | 0.2027 | 0.1180 | 0.0059 | X | |||
| Late-demographic dividend | LTE | 1.4871 | 0.0744 | 2.8646 | 0.1432 | X | |||
| Latin America and Caribbean | LCN | −0.4408 | −0.0220 | 4.1896 | 0.2095 | X | |||
| Latin America and Caribbean (excluding high income) | LAC | −0.0048 | −0.0002 | 3.9480 | 0.1974 | X | |||
| Latin America and the Caribbean (IDA and IBRD countries) | TLA | −0.4764 | −0.0238 | 4.2045 | 0.2102 | X | |||
| Least developed countries: UN classification | LDC | 1.9338 | 0.0967 | 2.6043 | 0.1302 | X | |||
| Low and middle income | LMY | 1.6198 | 0.0810 | 2.6587 | 0.1329 | X | |||
| Low income | LIC | −3.5011 | −0.1751 | −0.2927 | −0.0146 | X | |||
| Lower middle income | LMC | 2.8035 | 0.1402 | 1.4232 | 0.0712 | X | |||
| Middle East and North Africa | MEA | 1.0904 | 0.0545 | 3.0532 | 0.1527 | X | |||
| Middle East and North Africa (excluding high income) | MNA | 1.1766 | 0.0588 | 2.4594 | 0.1230 | X | |||
| Middle East and North Africa (IDA and IBRD countries) | TMN | 1.2038 | 0.0602 | 2.4229 | 0.1211 | X | |||
| Middle income | MIC | 1.6087 | 0.0804 | 2.7081 | 0.1354 | X | |||
| North America | NAC | −5.0336 | −0.2517 | 0.6449 | 0.0322 | X | |||
| OECD members | OED | −6.0581 | −0.3029 | 1.9011 | 0.0951 | X | |||
| Other small states | OSS | 1.7261 | 0.0863 | 2.2628 | 0.1131 | X | |||
| Pacific island small states | PSS | −1.9978 | −0.0999 | 6.6179 | 0.3309 | X | |||
| Post-demographic dividend | PST | −5.8276 | −0.2914 | 1.5317 | 0.0766 | X | |||
| Pre-demographic dividend | PRE | 5.8432 | 0.2922 | −4.6393 | −0.2320 | X | |||
| Small states | SST | 1.4265 | 0.0713 | 2.5121 | 0.1256 | X | |||
| South Asia | SAS | 1.7308 | 0.0865 | 2.9572 | 0.1479 | X | |||
| Sub-Saharan Africa | SSF | −6.5806 | −0.3290 | 4.2205 | 0.2110 | X | |||
| Sub-Saharan Africa (excluding high income) | SSA | −6.5758 | −0.3288 | 4.1991 | 0.2100 | X | |||
| Upper middle income | UMC | 1.3743 | 0.0687 | 3.0030 | 0.1502 | X | |||
| World | WLD | 1.2405 | 0.0620 | 2.8374 | 0.1419 | X | |||
| (Average CCC Lags)/(Average CCC Leads) | Total | ||||
|---|---|---|---|---|---|
| (+)/(−) | (−)/(−) | (−)/(+) | (+)/(+) | ||
| Panel A: High-income (H) countries | |||||
| Number of countries | 3 | 9 | 26 | 9 | 47 |
| Percentage of countries | 6.38% | 19.15% | 55.32% | 19.15% | 100% |
| Panel B: Upper middle-income (UM) countries | |||||
| Number of countries | 10 | 1 | 17 | 16 | 44 |
| Percentage of countries | 22.73% | 2.27% | 38.64% | 36.36% | 100% |
| Panel C: Lower middle-income (LM) countries | |||||
| Number of countries | 12 | 3 | 10 | 24 | 49 |
| Percentage of countries | 24.49% | 6.12% | 20.41% | 48.98% | 100% |
| Panel D: Lower-income (L) countries | |||||
| Number of countries | 4 | 0 | 2 | 12 | 18 |
| Percentage of countries | 22.22% | 0.00% | 11.11% | 66.67% | 100% |
| World regions | |||||
| Number of regions | 3 | 5 | 13 | 23 | 44 |
| Percentage of regions | 6.82% | 11.36% | 29.55% | 52.27% | 100% |
Disclaimer/Publisher’s Note: The statements, opinions and data contained in all publications are solely those of the individual author(s) and contributor(s) and not of MDPI and/or the editor(s). MDPI and/or the editor(s) disclaim responsibility for any injury to people or property resulting from any ideas, methods, instructions or products referred to in the content. |
© 2024 by the authors. Licensee MDPI, Basel, Switzerland. This article is an open access article distributed under the terms and conditions of the Creative Commons Attribution (CC BY) license (https://creativecommons.org/licenses/by/4.0/).
Share and Cite
Almeida, D.; Carvalho, L.; Ferreira, P.; Dionísio, A.; Haq, I.U. Global Dynamics of Environmental Kuznets Curve: A Cross-Correlation Analysis of Income and CO2 Emissions. Sustainability 2024, 16, 9089. https://doi.org/10.3390/su16209089
Almeida D, Carvalho L, Ferreira P, Dionísio A, Haq IU. Global Dynamics of Environmental Kuznets Curve: A Cross-Correlation Analysis of Income and CO2 Emissions. Sustainability. 2024; 16(20):9089. https://doi.org/10.3390/su16209089
Chicago/Turabian StyleAlmeida, Dora, Luísa Carvalho, Paulo Ferreira, Andreia Dionísio, and Inzamam Ul Haq. 2024. "Global Dynamics of Environmental Kuznets Curve: A Cross-Correlation Analysis of Income and CO2 Emissions" Sustainability 16, no. 20: 9089. https://doi.org/10.3390/su16209089
APA StyleAlmeida, D., Carvalho, L., Ferreira, P., Dionísio, A., & Haq, I. U. (2024). Global Dynamics of Environmental Kuznets Curve: A Cross-Correlation Analysis of Income and CO2 Emissions. Sustainability, 16(20), 9089. https://doi.org/10.3390/su16209089