Abstract
The source region of the Yellow River (SRYR) serves as a crucial ecological barrier on the Qinghai–Tibet Plateau in China. In recent decades, the ecological condition of the SRYR has deteriorated, resulting in a state of ecological insecurity. This state of affairs endangers the region’s living environment, aggravates poverty, and seriously hinders the region’s sustainable ecological, social, and economic development. Ecosystems, landscape patterns, ecological carrying capacity (ECC), and drivers interact with each other in the region, shaping the regional ecological pattern’s past, present, and future. However, the specific mechanisms underlying these interactions have yet to be elucidated. Based on the land use type data of the SRYR in China for the last 30 years in seven periods (1990, 1995, 2000, 2005, 2010, 2015, and 2020), and combined with the ecological footprint method, we carried out a study of spatial and temporal changes at the county scale and the source region scale, used the landscape pattern index to describe the changes in ECC, and analyzed the main drivers that affect the ECC of the source region. The results indicate the following: (1) Over the past 30 years, the greatest changes in the area have occurred in grasslands and unused lands. Between 2005 and 2010, a significant conversion of unused lands to grasslands occurred in the SRYR, amounting to 7382.33 km2, mainly distributed in Maduo County and Maqin County. (2) The absolute ecological carrying capacity (AECC) of grasslands in the SRYR has shown an upward trend, while that of forests has declined. The ECC of the source region has generally increased, with higher ECC observed in Maqin County, Maduo County, and Xinghai County. (3) The spatial distribution of ECC in the SRYR has shown non-uniform changes, with an increasing trend observed across all county-level areas. The spatial heterogeneity of AECC is high, with minor overall spatial distribution changes. (4) There is a positive correlation between the ECC of the SRYR with SPLIT, PARA_MN, and COHESION (p < 0.05). The impact of landscape pattern indices on ECC ranked as COHESION > PARA_MN > SPLIT. (5) Principal component analysis indicates that the primary driving forces of the SRYR’s ECC are social factors, such as urban population (X5) and per capita GDP (X8), with natural factors being less significant than social factors. This research is crucial for maintaining ECC in the SRYR, protecting and restoring the ecological environment, and ensuring the sustainable development of the economy and society.
1. Introduction
With the escalation of climate change and human land use activities, regional ecological patterns have undergone changes in both time and space, leading to alterations in regional ecological carrying capacity [1]. Human activities and environmental changes have resulted in ecological degradation and a continuous decline in regional ECC. In contrast, the demand for ECC by humans has been rapidly increasing, creating the largest gap where demand exceeds supply, placing ecosystems in an insecure state [2]. This situation not only endangers regional living environments and exacerbates poverty but also severely impedes the sustainable development of regional ecologies, societies, and economies.
Land use/cover change is a critical input parameter for emulating global climate and biogeochemical effects [3]. ECC reflects the magnitude of an ecosystem’s ability to regulate its own health status [4,5]. With the development of human society and economy, the intensification of human expansion activities leads to changes in ECC influenced by landscape patterns and land use conditions, which is one of the factors affecting the dynamic changes in ECC [6]. To maintain the sustainable development of society and economy, it is crucial to determine whether the intensity of human activities exceeds the self-regulation and tolerance capacity of ecosystems. The status of regional ECC is one of the important bases for planning a country’s socio-economic development and adopting appropriate strategies and measures for environmental issues [7]. With the deepening of globalization, the connections between countries have become more intertwined, and environmental issues have emerged as a focal point of international concern. The ecological challenges in the Yellow River Basin are not only a domestic issue for China but also a component of global ecological security. By enhancing domestic governance and international cooperation, we can collectively advance ecological security in the Yellow River Basin and beyond, achieving harmonious coexistence between humans and nature. Presently, the establishment of legal frameworks, the improvement in ecological compensation mechanisms, the implementation of ecological monitoring, and the adoption of ecological restoration technologies have become paramount.
The ecological footprint method is one of the most widely researched and applied methods for assessing ECC in recent years [8,9], with the advantages of simplicity, easy access to data, and strong operability [10]. The ecological footprint method uses the production capacity of different types of land as the regional ECC, reflecting to some extent the influence of natural and socio-economic factors on ECC [11,12]. Currently, research in China mainly focuses on the improvement in the ECC model [13,14], temporal and spatial changes [15,16], and driving force analysis [17], but there are still issues with the subjectivity in building the ECC index system, weak quantification of ecosystem function assessment, and a lack of integration with landscape patterns, human activities, and ecological environmental changes, with a greater emphasis on static evaluation methods [18].
The SRYR located in the northeastern part of the Qinghai–Tibet Plateau serves as an ecological shield for the plateau [19,20]. In recent years, under the influence of both natural and human factors, the ecological environment in the region has become fragile, with frequent extreme weather events [21,22]. The SRYR is a crucial water conservation area within the Yellow River Basin. In recent years, under the influence of both natural and anthropogenic factors, significant changes have occurred in the ecological environment and water supply systems of the SRYR. These changes include a reduction in water conservation functions, frequent occurrences of extreme weather, and degradation of wetlands, posing threats to the production and livelihoods of local residents. Additionally, the establishment of hydropower stations since the last century has led to a continuous decline in the ECC of the SRYR. However, human demand for ECC has been rapidly increasing. Therefore, conducting research on the ECC of the SRYR over the past 30 years and its driving factors is of great significance for regional ecological protection, restoration, and sustainable development in the SRYR. Current research on the source region mainly focuses on ecohydrology and the impact of climate change on ecosystems [23,24]. However, there are few research findings on the ECC of this region, consisting of only studies on the ECC of individual counties or grasslands within the SRYR, which are characterized by small research areas, short study periods, and weak evaluation and quantification [25]. Research on ECC and landscape patterns at multiple scales within the SRYR has not yet been reported. It is urgent to reveal the mechanisms of interaction among ecosystems, landscape patterns, ECC, and driving factors.
This paper utilizes data on the area changes in land use types in the SRYR over the past 30 years, employing the ecological footprint method to investigate the temporal and spatial changes in ECC over the past 30 years. It also explores the relationship between landscape patterns and ECC in the SRYR, analyzes the driving factors of changes in ECC, and provides scientific evidence for the sustainable supply of ecological carrying capacity in the SRYR.
2. Materials and Methods
Overview of the Study Region
The SRYR is located in the northeastern hinterland of the Qinghai–Tibet Plateau (32°09′~36°34′ N, 95°54′~103°24′ E), covering an area of 9.8 × 10⁴ km2 with an average elevation of over 3000 m [26] (Figure 1). The region experiences significant variations in diurnal temperature and seasonal precipitation. Precipitation is mainly concentrated in the summer and autumn seasons, accounting for more than 75% of the annual rainfall. This region contributes to 49% of the total water volume of the Yellow River, making it an important water resource conservation region on the Qinghai–Tibet Plateau [27]. The SRYR possesses a unique plateau ecosystem and scarce biological resources. The vegetation is dominated by alpine grasslands and alpine meadows, including species such as Kobresia, Stipa purpurea, and Poa annua L. The region is also home to various protected wild animals, such as the white-lipped deer (Cervus albirostris), brown bear (Ursus arctos), and Tibetan antelope (Pantholops hodgsonii) [28].
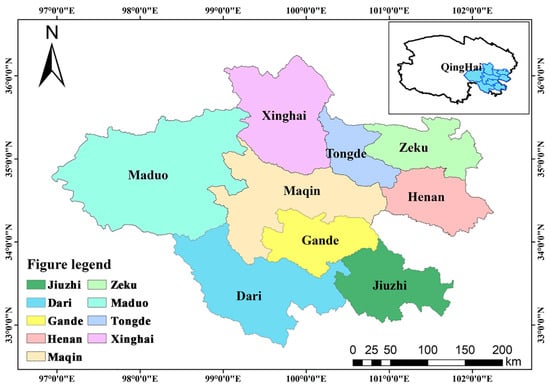
Figure 1.
Geographical map of the source region of the Yellow River. Figure 1 was generated using ArcGIS, which was downloaded from the website and its version number is 10.8. (URL: https://www.esri.com/en-us/home, accessed on 20 December 2022). In this picture, the SRYR is divided into nine counties, with each color indicating a county, and the notes in the lower left legend corner indicate the name of the county.
3. Research Methods
3.1. Data Sources and Preprocessing
The land use data utilized in this study were sourced from the Resource and Environmental Science Data Center of the Chinese Academy of Sciences (https://www.resdc.cn/, accessed on 13 November 2022), which is based on Landsat (TM/ETM+/OLI) series remote sensing data with a resolution of 30 m. Expert visual interpretation, combined with field survey data, was employed to classify land use types according to the national land use classification methods [29,30], achieving an accuracy of 85%. Seven sets of remote sensing data were selected at five-year intervals. Using the interpreted land use data of the SRYR within the ArcGIS 10.8 software environment, secondary land use categories were aggregated into primary categories to statistically analyze the types and areas of different land uses, subsequently mapping the spatial distribution of land use types and ECC for the seven periods (Table 1). Data on mean annual temperature, annual precipitation, and annual average evaporation from the region were obtained from the Qinghai Provincial Meteorological Bureau, while socio-economic data were sourced from the "Qinghai Statistical Yearbook". These data were employed to analyze the driving factors of landscape pattern changes.

Table 1.
Classification system of land use landscape types.
3.2. Land Use Dynamic Degree
Due to the long time span of this study, some land use types such as woodland and construction land change less every year. Therefore, when obtaining remote sensing data, we take 5 years as a time node, which can better reflect the degree of land use change. Utilizing the land use area data obtained from the interpretation for seven periods and combining it with Equations (1) and (2), we calculated the dynamics of single land use types and the comprehensive land use dynamics within the source region for the years 1990, 1995, 2000, 2005, 2010, 2015, and 2020. The dynamics of a single land use type refer to the quantitative changes in a specific land use category within the study area over a particular timeframe, while the comprehensive land use dynamics represent the annual rate of change in land use across the entire study region [1,2,3]. The relevant calculation equations and indicators are as follows:
where Ua and Ub are the areas of a certain land use type before and after the change, respectively; T is the length of the study period. The second equation was as follows:
where ΔLUi is the area of a certain land use type at the beginning of this study; ΔLUi-j is the absolute value of the area of a land use type converted to another land use type during the study period; and T is the length of the study period.
3.3. Calculation of ECC
- The ecological footprint method was adopted. ECC refers to the total amount of available productive land and water resources within a specific research area over a period of time, typically one year [31,32]. The ECC equation was as follows:where BC is the ecological carrying capacity in global hectares (g ha); Ai is the area (hm2); YFi is the yield factor, which refers to the ratio of the productivity of a specific bio-productive land in one particular country or region to the average productivity of the same land in the world; and EQFi is the equilibrium factor, which is calculated as follows: the average ecological productivity of productive biological land in the world is divided by the average ecological productivity of all kinds of biologically productive land across the globe.
- AECC in the SRYR is calculated at the grid level as the basic unit, with the statistics of the AECC for each county unit being compiled accordingly [33] as follows:where BC is the total ecological carrying capacity in the unit.
- ECC and AECC classification [34].
Using the natural discontinuity classification method in the ArcGIS10.8 software, a numerical classification interval is defined for ECC, and similar values can be most appropriately grouped. By dividing each element into several grades, the ECC is divided into low, medium, and high, and the total ECC is divided into high and low values to maximize the difference among different grades. Where the data values differ, this class’s edge will be set, and the corresponding range will be automatically generated.
- 4.
- When calculating the regional ecological footprint, the most critical parameters are the equilibrium factor and the yield factor. Given the challenges in obtaining yield factors and equilibrium factors, this experiment employed yield factors and equilibrium factors from similar years as conversion factors for ECC. The equilibrium factors and yield factors utilized in this study were sourced from relevant domestic and international literature [35,36,37], as detailed in Table 2 and Table 3. We selected the conversion factor of similar years as the ECC calculation data of similar years in this study.
Table 2. Equivalence factors in the SRYR.
Table 3. Productivity factors in the SRYR.
3.4. ECC Correlation Analysis
- Redundancy Analysis of Landscape Patterns and ECC
Utilizing the FRAGSTATS 4.2 software, this study selected and calculated seven landscape metrics at the landscape level for seven periods in the SRYR: 1990, 1995, 2000, 2005, 2010, 2015, and 2020. These metrics include PD (Patch Density), LPI (Largest Patch Index), PARA_MN (Perimeter-Area Ratio), IJI (Interspersion and Juxtaposition Index), COHESION (Patch Cohesion Index), SPLIT (Splitting Index), and SHDI (Shannon’s Diversity Index), as referenced in Table 4. The influence of these metrics on the overall ECC of the SRYR was examined. Subsequently, the Canoco 5.0 software was employed to conduct a redundancy analysis, where the landscape level indices served as response variables and the total ECC as the explanatory variable. This analysis aimed to explore the changes in ECC in the SRYR from 1990 to 2020, against the backdrop of landscape pattern alterations.
Table 4.
Landscape index at the landscape level.
- 2.
- Analysis of ECC Drivers
In light of the geographical, climatic, and ecological conditions of the SRYR, this study identified two types of driving factors affecting the ECC changes, as listed in Table 5. The natural factors include annual average temperature (X1), annual precipitation (X2), and annual evaporation (X3). The social factors encompass population (X4), urban population (X5), rural population (X6), GDP (X7), per capita GDP (X8), primary industry output (X9), secondary industry output (X10), tertiary industry output (X11), total energy production (X12), and animal husbandry (X13). Through principal component analysis (PCA) on each driving factor, this study screened out components with eigenvalues greater than 1, calculated the comprehensive scores of each driving factor, and identified the key driving factors influencing the ecological carrying capacity of the SRYR [36,38,40,41,42].
Table 5.
ECC drivers in the SRYR.
4. Results and Analysis
4.1. Changes in Land Use Types
4.1.1. Dynamic Attitude of Land Use Types
The dynamics of land use in the SRYR as depicted in Table 6 indicate that over the past three decades, the growth rate of construction land has been the most rapid, reaching 6.22%. Conversely, forest land has experienced a slight decrease, registering at 0.0015%. The dynamics of land use change are most pronounced in construction land, followed by unutilized land, cultivated land, water bodies, grassland, and forest land. The expansion and transformation of construction land have accelerated due to the development of urbanization and industrialization. The overall dynamics of land use stand at 0.214%, suggesting that the rate of land use change in the SRYR has been relatively slow over the past 30 years.
Table 6.
Indexes of land use dynamics of the SRYR.
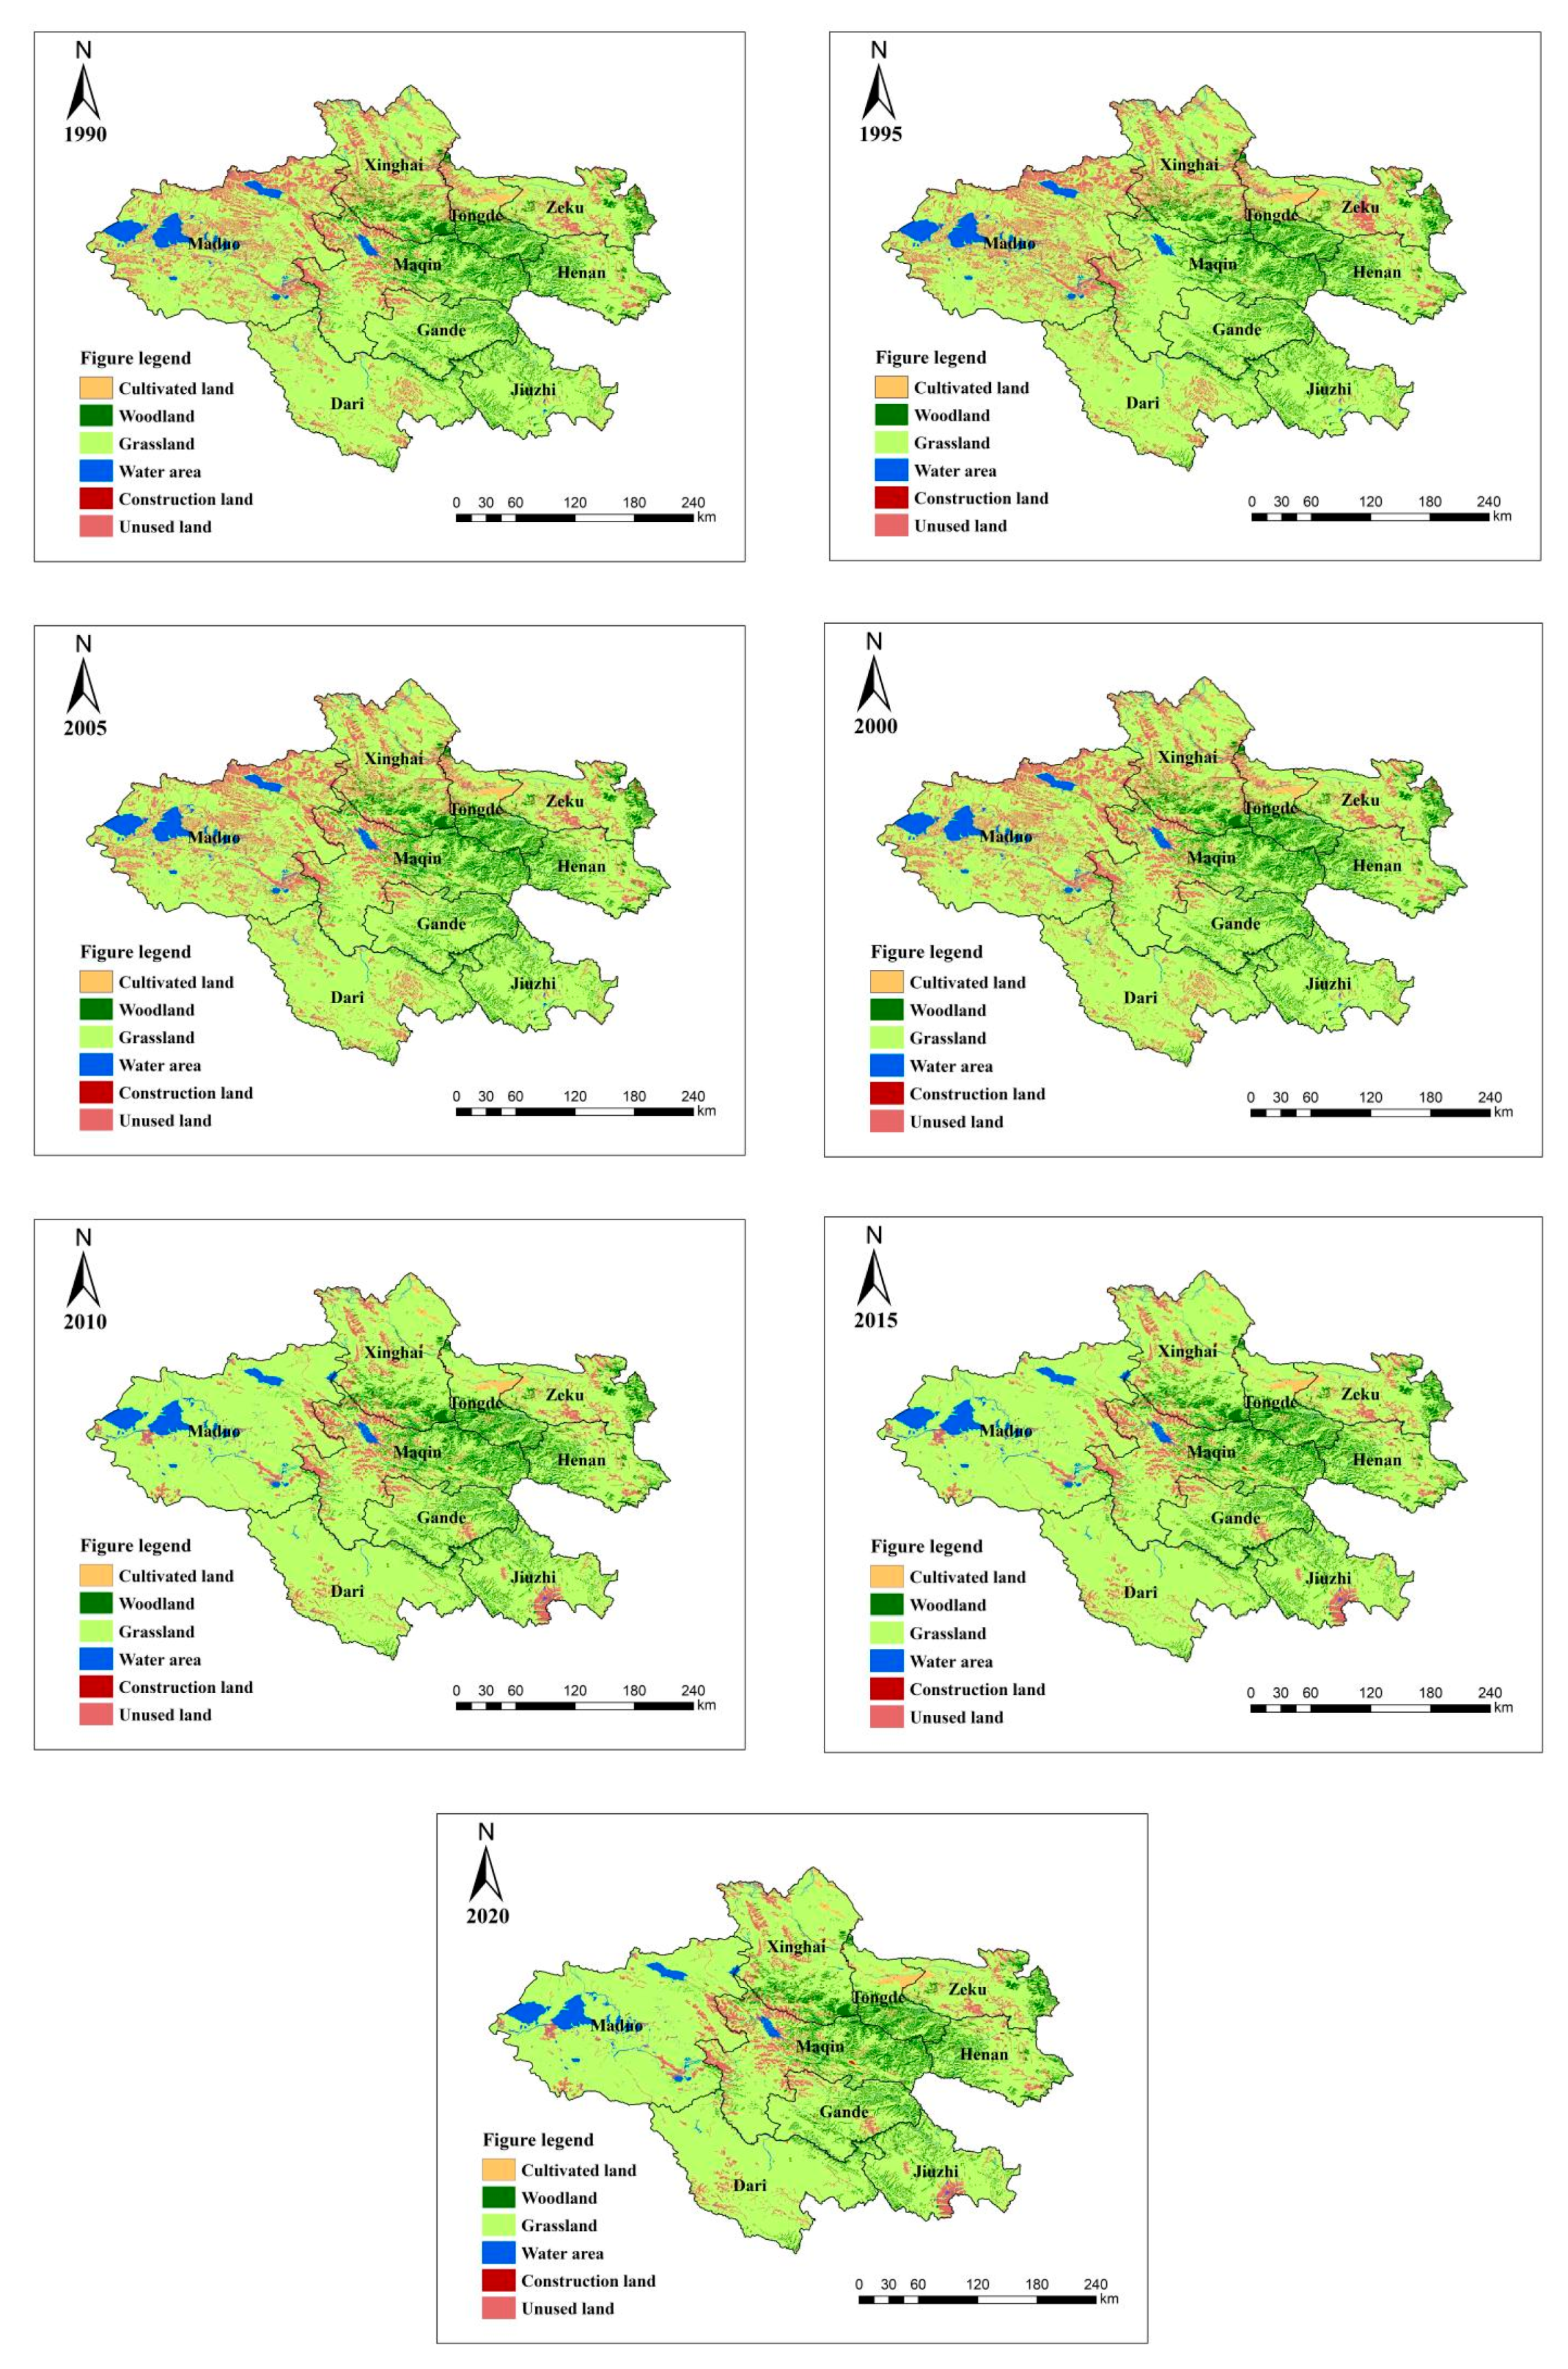
4.1.2. Spatial Distribution of Land Use Types
As illustrated in Figure 2, the area of land use types in the SRYR over the past 30 years has exhibited a fluctuating trend. The primary land use types consist of cultivated land, forest land, grassland, water bodies, construction land, and unutilized land. Cultivated land is predominantly located in the northeastern part; forest land is distributed in the central-eastern part, covering areas in Tongde County and Xinghai County to the south, Maqin County and Gade County to the east, and Henan County to the west. Grassland is extensive, accounting for approximately 80% of the total area of the SRYR. Water bodies are primarily situated in the northwestern and central regions, with a significant number of lakes in Maduo County and permanent glaciers in the northwestern part of Maqin County. Construction land is sporadically distributed throughout the source region, while unutilized land is scattered, with concentrated distribution in the western and northern parts. Since 2005, unutilized land in the western part has disappeared, mainly transforming into grassland.
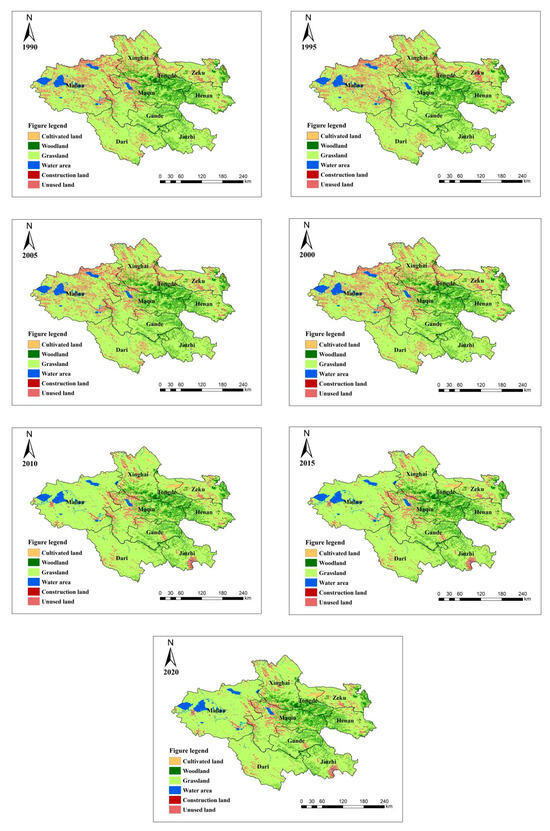
Figure 2.
Map of land use types in the SRYR from 1990 to 2020. Figure 2 was generated using ArcGIS, which was downloaded from the website and its version number is 10.8. (URL: https://www.esri.com/en-us/home, accessed on 15 December 2022).
4.1.3. Temporal Changes in Land Use Types
As depicted in Table 7, between 1990 and 2020, the grassland area experienced the most significant increase, with an annual average change rate of 0.199%. The water area expanded by 239.06 km2, while the increase in construction land area was relatively modest at 53.23 km2. The largest reduction was observed in the area of unused land, with an annual average change rate of −0.214%. The forest area exhibited the least change, amounting to merely 3.64 km². During the period of 1990–2000, both grassland and water areas showed a decreasing trend, with respective reductions of −36.57 km2 and −10.25 km2, corresponding to decline rates of −0.008% and −0.002%. All other land use types experienced an increase in area, with the most substantial growth observed in cultivated land, which expanded by 18.91 km2, representing an increase rate of 0.002%. Between 2000 and 2010, both forest and unused land areas diminished, with decreases of −14.93 km2 and −6326.7 km², respectively, and corresponding decline rates of −0.004% and −1.286%. Among the other land use types, the area of grassland saw the most significant expansion, with an increase rate of 1.218%. From 2010 to 2020, both cultivated and grassland areas exhibited a downward trend, with reductions of −1.03 km2 and −86.54 km2, respectively, and decline rates of 0 and −0.018%. The remaining land use types continued to show an increasing trend, with the water area registering the largest expansion, at an increased rate of 0.01%.
Table 7.
Land use change in the SRYR from 1990 to 2020 (unit: km2).
4.2. Temporal and Spatial Dynamic Changes in ECC
4.2.1. Spatial Distribution of ECC at the County Scale
As shown in Figure 3, the spatial distribution of ECC across different counties in the SRYR exhibits distinct patterns. Over the past 30 years, the ECC of all counties has generally increased. However, there are notable variations among the counties. Maduo County stands out with the highest ECC, significantly surpassing that of other counties. Conversely, Zeku County, Henan County, Gade County, and Jiuzhi County have the lowest ECC. Xinghai County, Tongde County, Maqin County, and Dari County fall into the medium range regarding ECC. Notably, between 2005 and 2015, the growth trend of ECC across all counties was relatively stable.
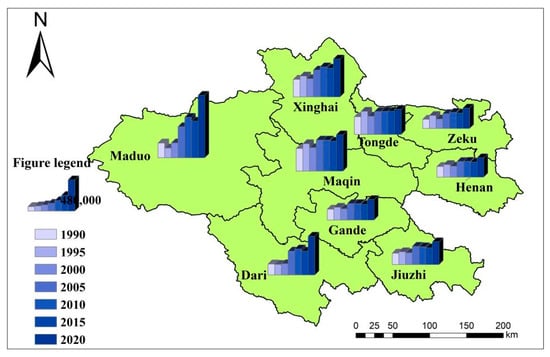
Figure 3.
Spatial distribution of ECC of different counties in the SRYR from 1990 to 2020. Figure 3 was generated using ArcGIS, which was downloaded from the website and its version number is 10.8. (URL: https://www.esri.com/en-us/home, accessed on 15 December 2022).
4.2.2. Spatial Distribution of ECC at the Source Region Scale
Figure 4 illustrates the spatially heterogeneous distribution of ECC in the SRYR over the past three decades. The area predominantly characterized by low ECC is concentrated in the west, whereas the central region exhibits moderate ECC. In contrast, the southern region demonstrates high ECC. During the period from 1995 to 2000, the majority of the SRYR exhibited moderate ECC. However, between 2005 and 2020, the expanse of low ECC in the western region expanded towards the central region. Concurrently, moderate ECC has been expanding eastward in a patchy manner. High ECC is predominantly distributed in a patchy pattern across the northern and southeastern parts of the SRYR.
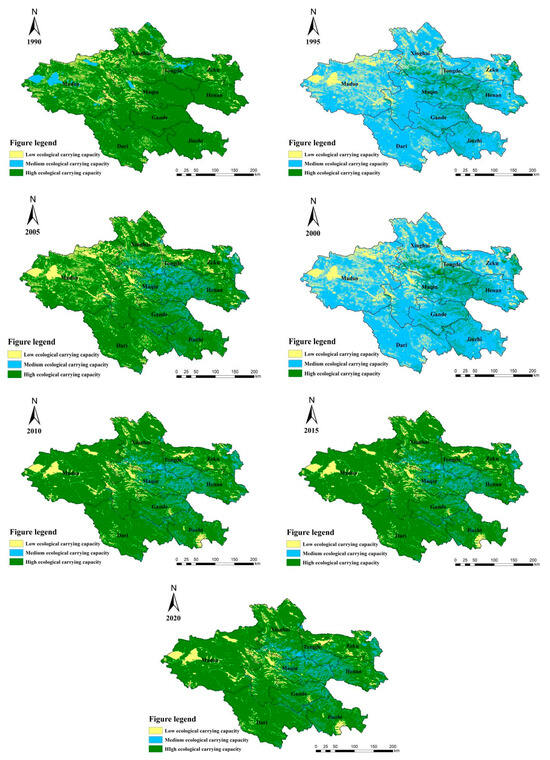
Figure 4.
Spatial distribution of ECC in the SRYR from 1990 to 2020. Figure 4 was generated using ArcGIS, which was downloaded from the website and its version number is 10.8. (URL: https://www.esri.com/en-us/home, accessed on 20 December 2022).
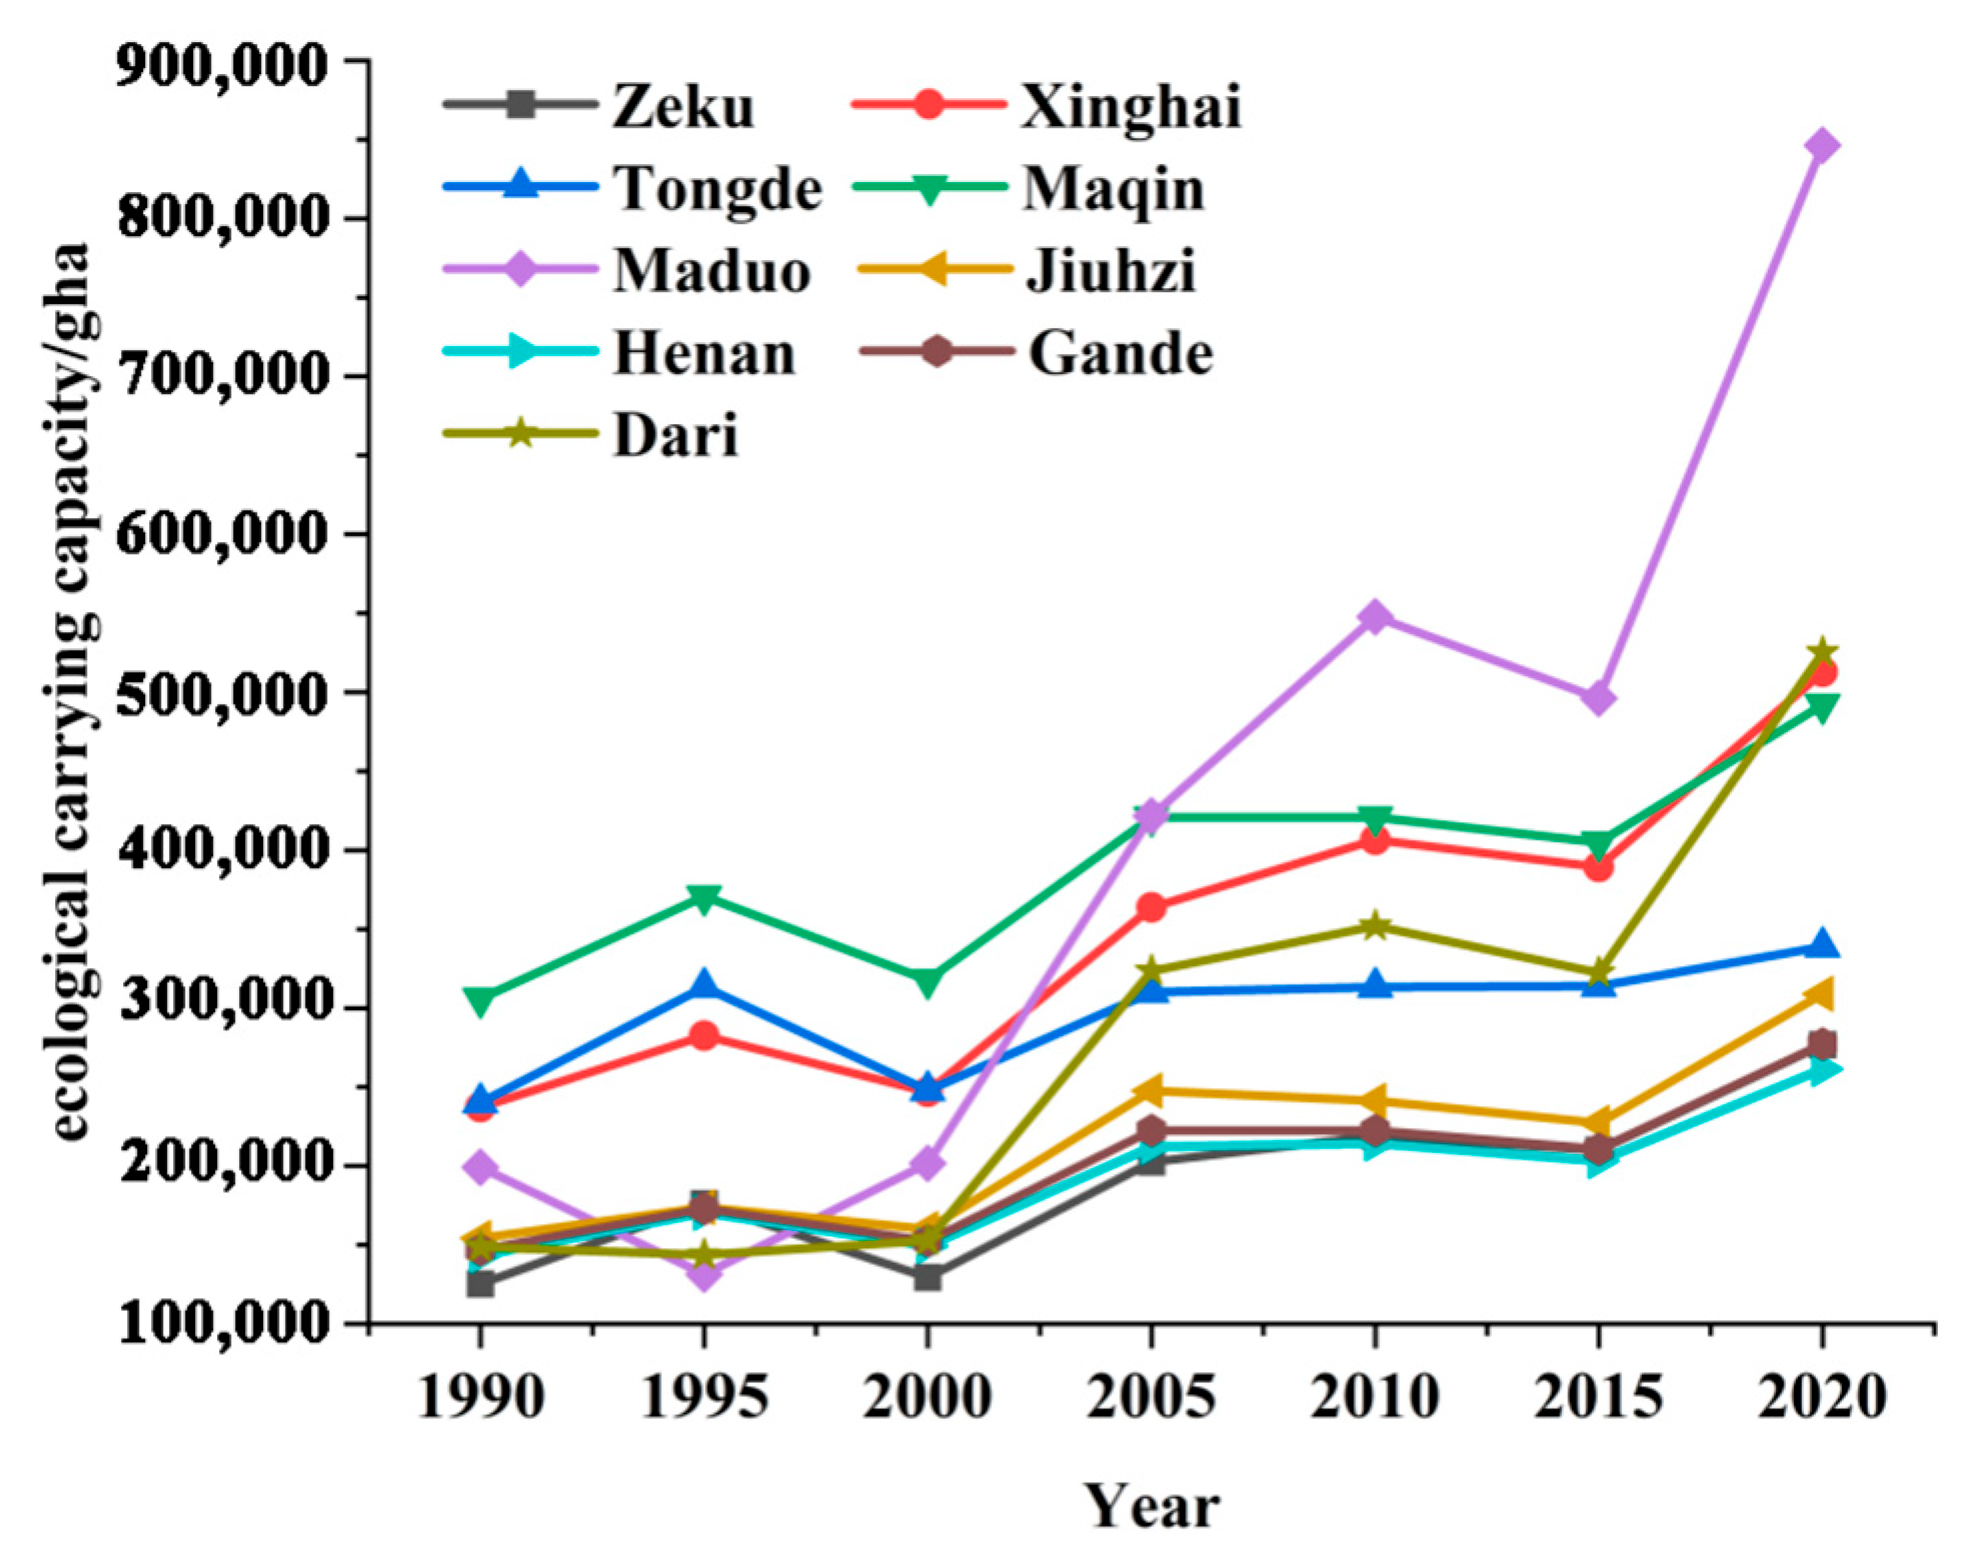
4.2.3. Temporal Changes in ECC at the County Scale
As depicted in Figure 5, from a county-scale perspective over the past three decades, the ECC of all nine counties has shown an increasing trend. Among them, the ECC of Maduo County has increased the most significantly, while that of Gade County has increased the least. From 1990 to 2020, the ECC of Maduo County and Dari County has consistently risen. In contrast, the other counties have shown a fluctuating upward trend. Between 1990 and 1995, Zeku County, Jiuzhi County, Maqin County, Henan County, Xinghai County, Gade County, and Tongde County experienced a substantial increase, with the ECC of Maqin County being twice that of Zeku County. After 1995, the ECC of all counties underwent a sharp decline, followed by a sustained upward trend and stabilization until 2015, when another significant increase occurred. Among these, the increase in ECC of Maduo County was the most substantial, with its ECC being approximately four times that of Henan County.
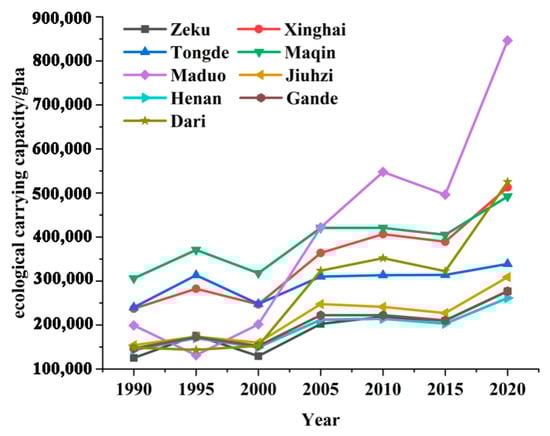
Figure 5.
Changes in ecological carrying capacity of different counties. Figure 5 was generated using Origin Pro 2022, which was downloaded from the website and its version number is 2022 (URL: https://www.originlab.com/, accessed on 15 January 2023).
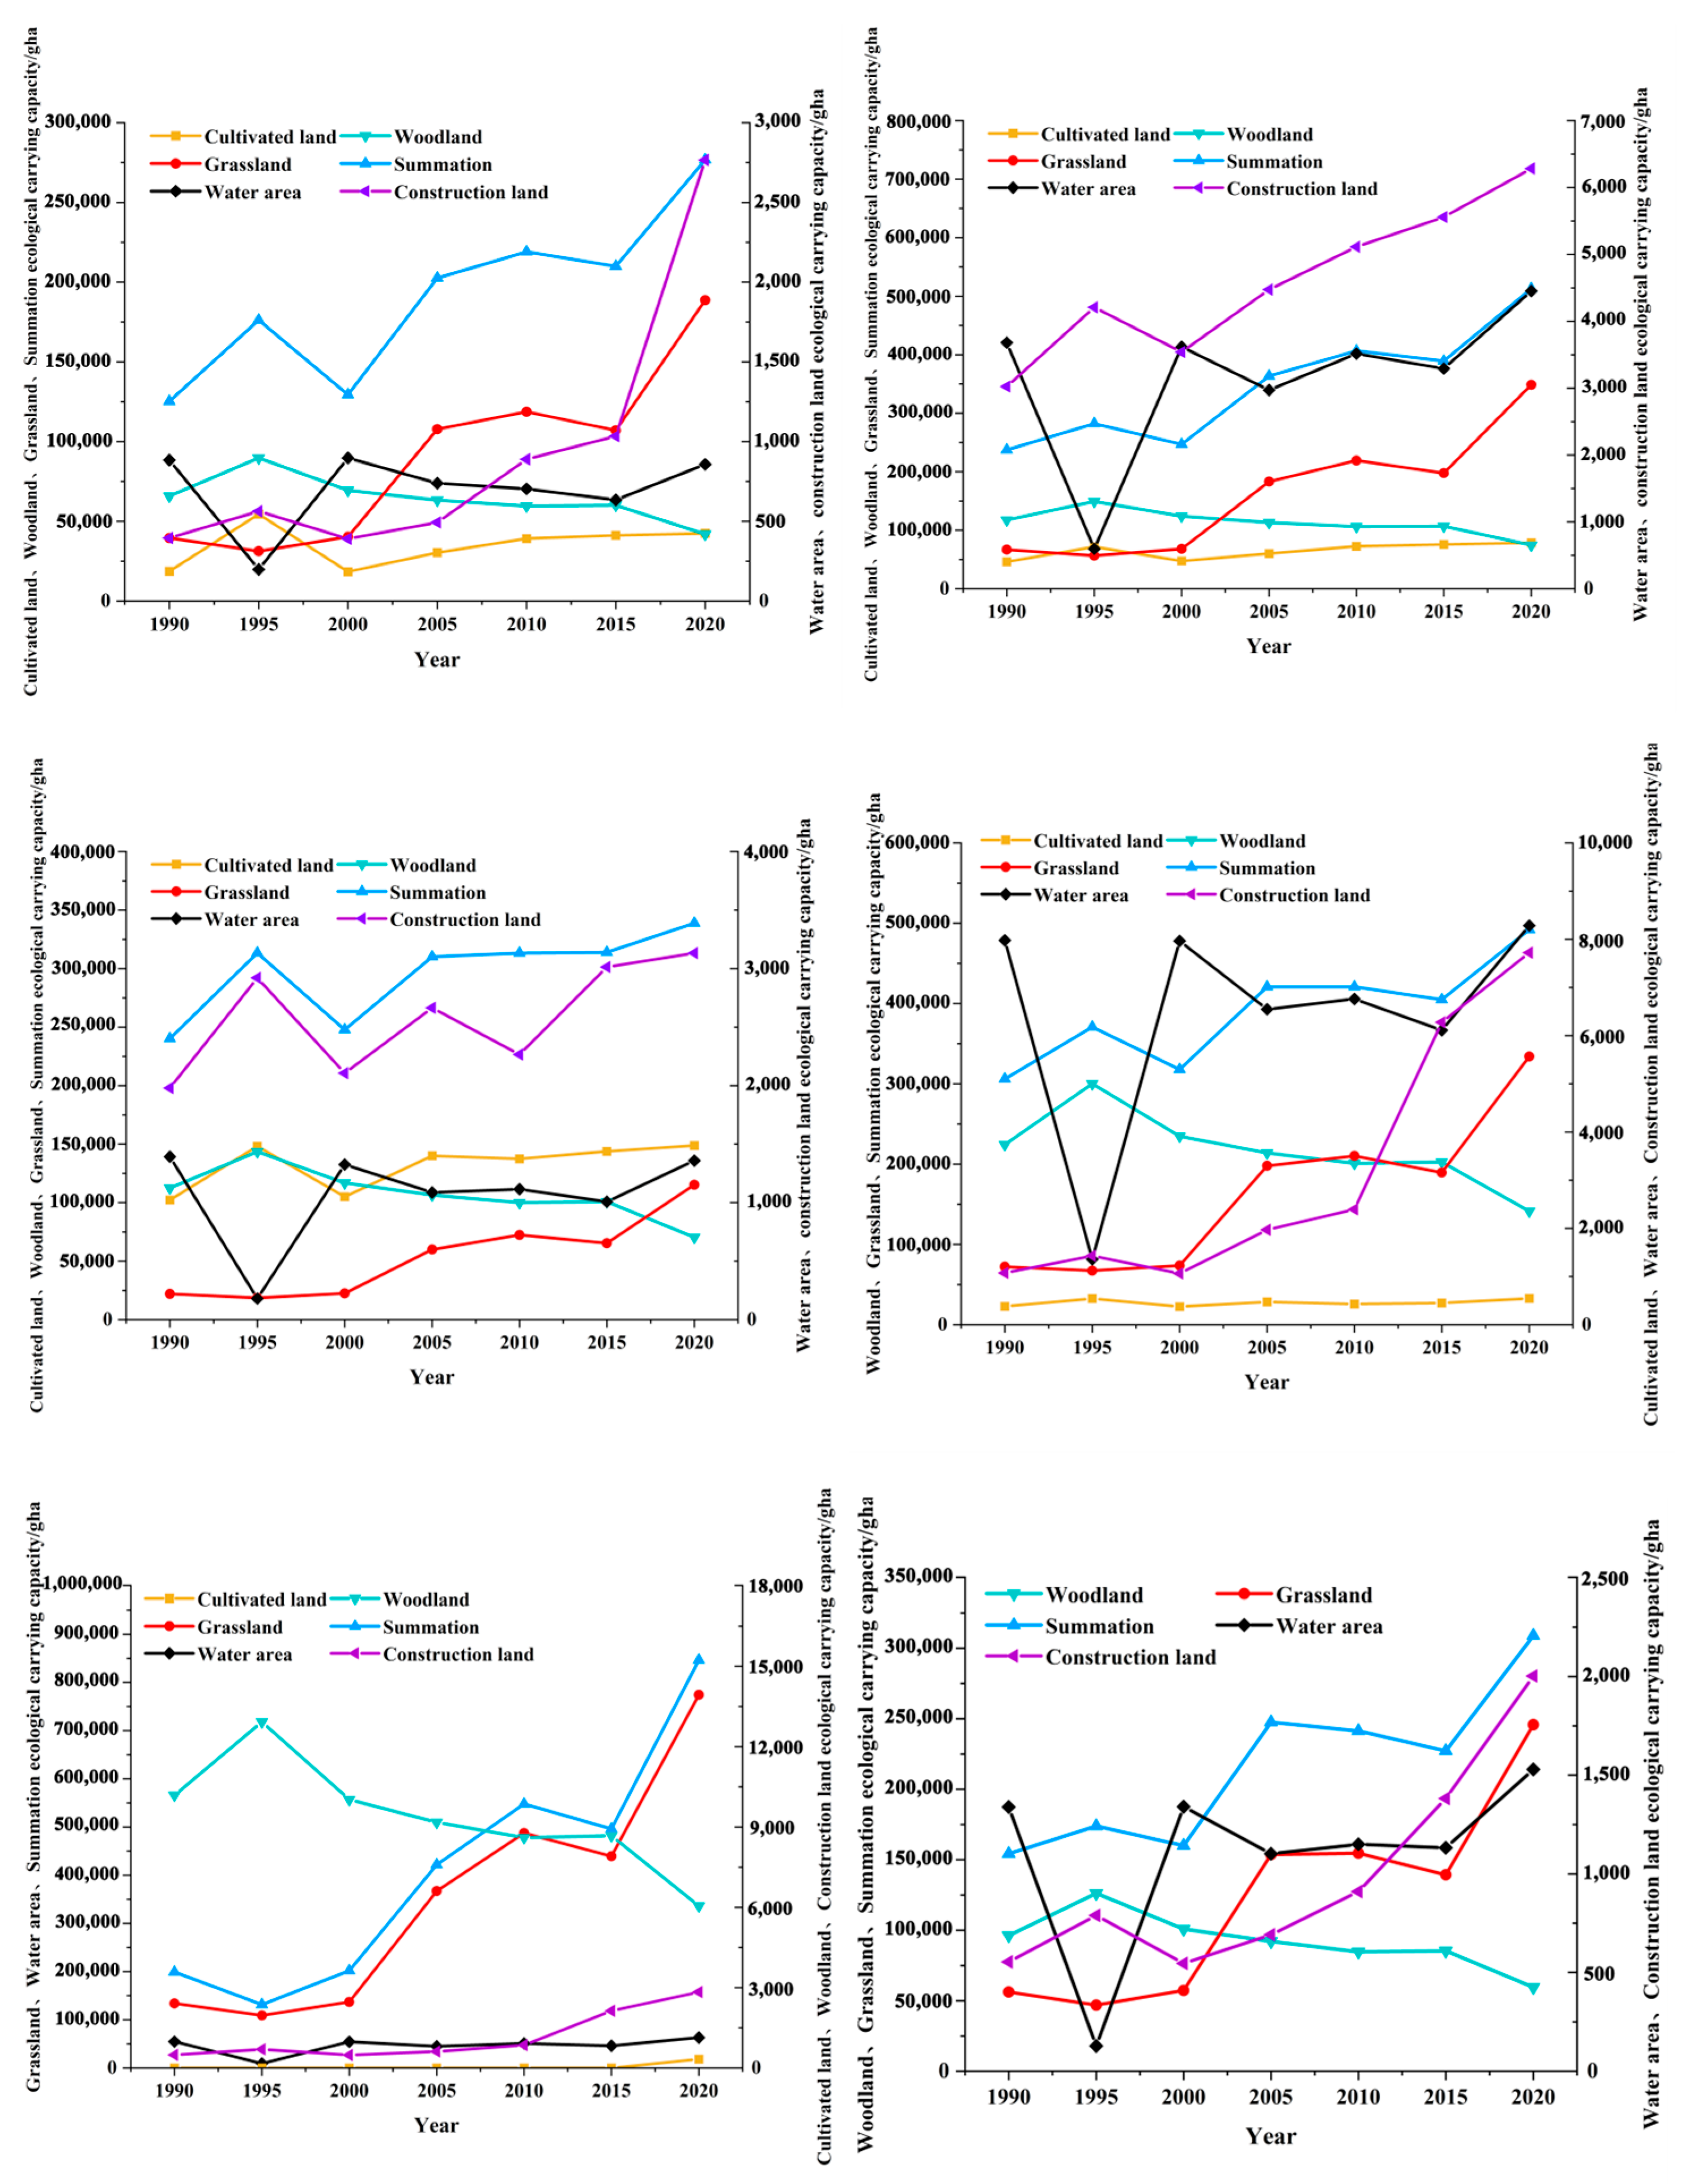
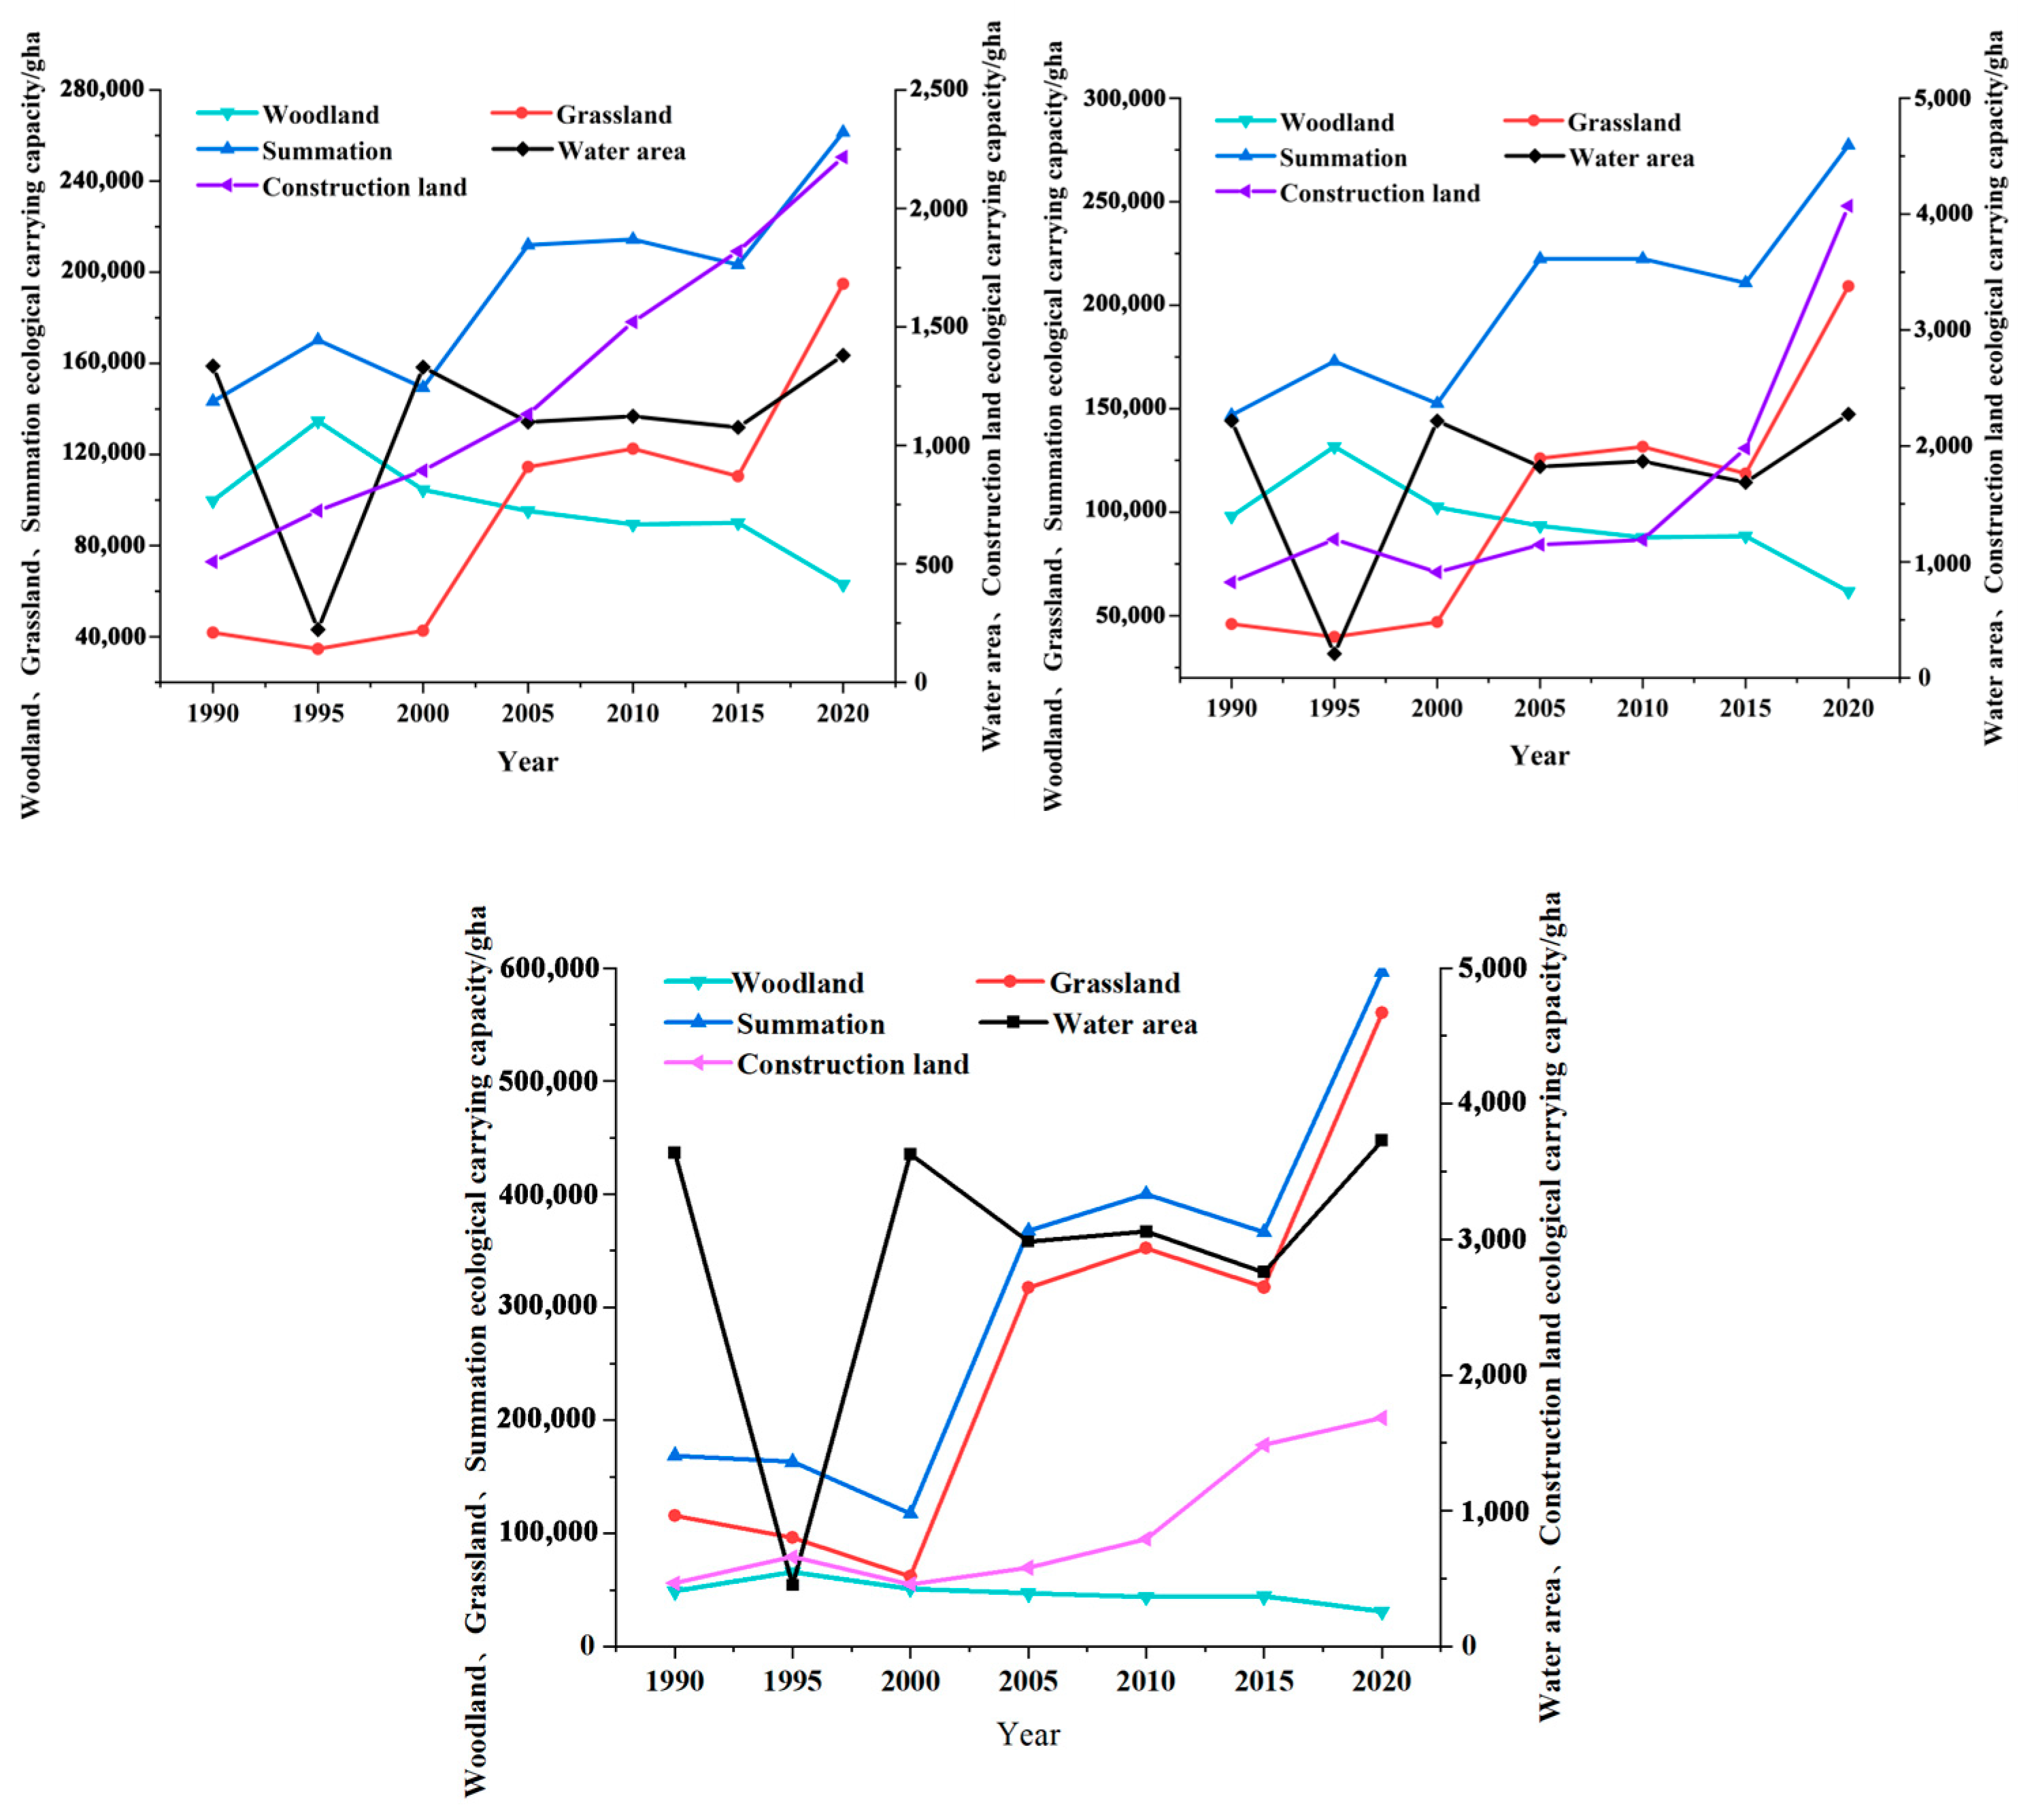
As shown in Figure 6, between 1990 and 2020, the ECC of water area and unutilized land in Zeku County experienced a downward trend, while all other land types experienced an increasing trend. The most significant increase in Xinghai County was observed in grassland, but a noticeable decline occurred in 2015. The ECC of construction land experienced a significant decrease in 2000 and then continued to increase. In Tongde County, the largest increase was in grassland, while the smallest increase was in construction land. In Maqin County, both grassland and construction land showed increasing trends in ECC, but forest land showed a decreasing trend. Maduo County saw a gradual upward trend in both grassland and construction land.
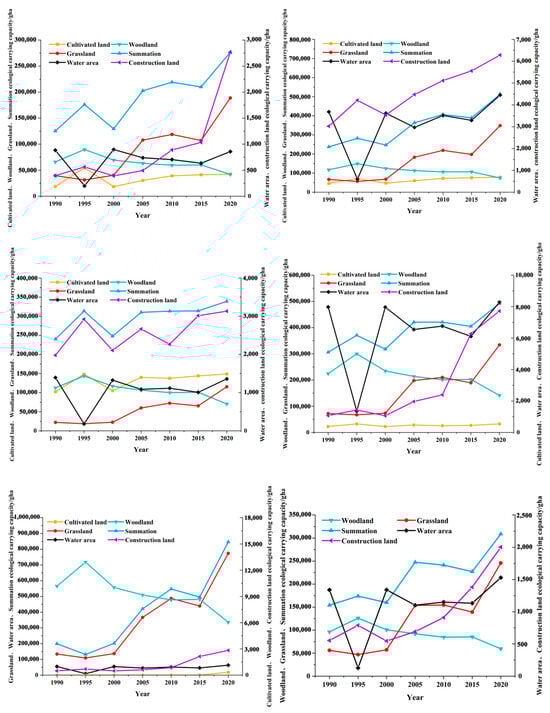
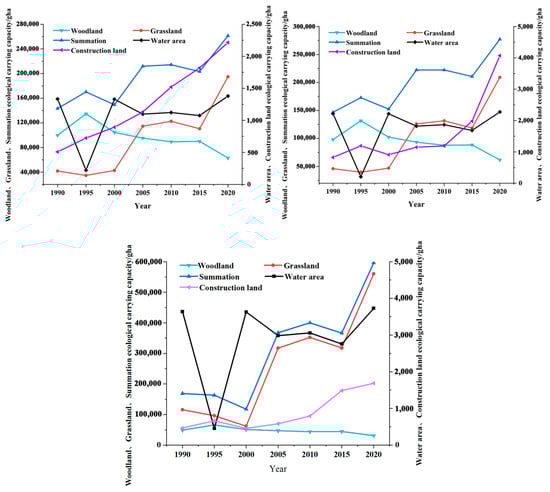
Figure 6.
Changes in ECC of different counties. Figure 6 was generated using Origin Pro 2022, which was downloaded from the website and its version number is 2022 (URL: https://www.originlab.com/, accessed on 15 January 2023).
Over the past 30 years, the ECC of Jiuzhi County, Henan County, Gade County, and Dari County has shown similar patterns of change. The cultivated land in all these counties was zero, mainly because the cultivated land was fragmented and covered a very small area, making it undetectable at a resolution of 30 m. The ECC of grassland and construction land has gradually increased. The water area initially decreased and then increased, while the carrying capacity of forest land initially increased and then continued to decrease.
4.2.4. Temporal Changes in ECC at the Source Region Scale
As shown in Figure 7, the overall ECC in the SRYR has shown an upward trend over the past 30 years, with significant differences in different years. The ECC of grassland was the highest, while that of forest land initially increased and then continued to decline. Between 1990 and 2000, the cultivated land showed a trend of first increasing and then decreasing, and the water area initially decreased and then increased. After 2000, the cultivated land showed a sustained increasing trend, and the water area fluctuated but generally increased. The ECC of construction land remained relatively stable and showed an upward trend.
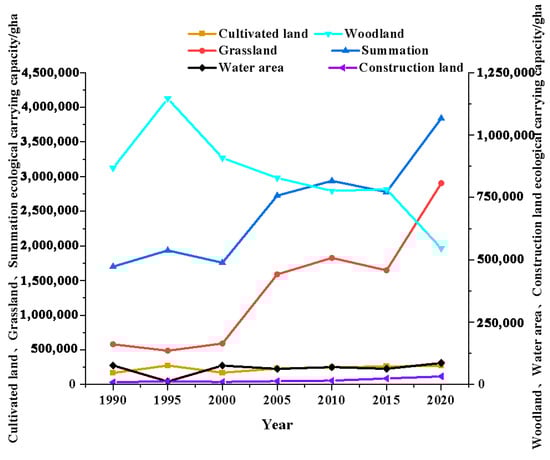
Figure 7.
Dynamic chart of ECC in the SRYR from 1990 to 2020. Figure 7 was generated using Origin Pro 2022, which was downloaded from the website and its version number is 2022 (URL: https://www.originlab.com/, accessed on 16 January 2023).
4.3. Temporal and Spatial Dynamic Changes in AECC
4.3.1. Spatial Distribution of AECC
Figure 8 depicts the spatial distribution of AECC in the source region from 1990 to 2020. Over the past three decades, there has been a general increase in the AECC, with a consistent spatial pattern between the AECC and the distribution of ECC. Between 1990 and 2005, high AECC was predominantly concentrated in a belt-like formation in the northwestern area, while low AECC was patchily distributed in the northern regions. During the period of 2010 to 2020, there was a tendency for the high AECC in the northern area to expand towards the central region, with low AECC remaining in a patchy configuration in the northeastern part of the AECC.
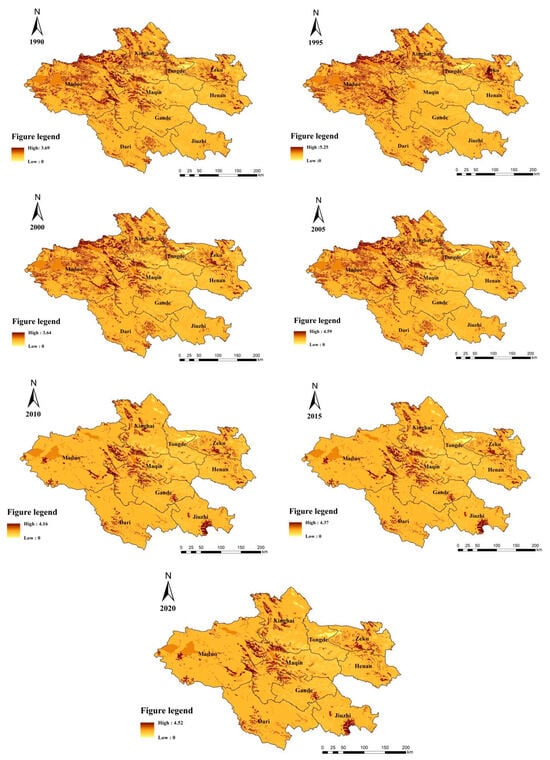
Figure 8.
Spatial distribution of AECC in the SRYR from 1990 to 2020. Figure 8 was generated using ArcGIS, which was downloaded from the website and its version number is 10.8. (URL: https://www.esri.com/en-us/home, accessed on 25 December 2022).
4.3.2. Temporal Changes in AECC
As indicated in Table 8, over the past three decades, the AECC of grassland in the SRYR has exhibited an upward trend, while that of forest land has shown a downward trend. For cultivated land and construction land, the AECC experienced a trend of initial increase, followed by a decrease between 1990 and 2000, and since 2005, it has been increasing at a slow pace. The AECC of water bodies has demonstrated a downward trend during the period from 2000 to 2015, with a significant increase observed in 2020, indicating a substantial fluctuation.
Table 8.
AECC in the SRYR from 1990 to 2020 (unit: g ha).
4.4. ECC Correlation Analysis Results
4.4.1. Redundancy Analysis
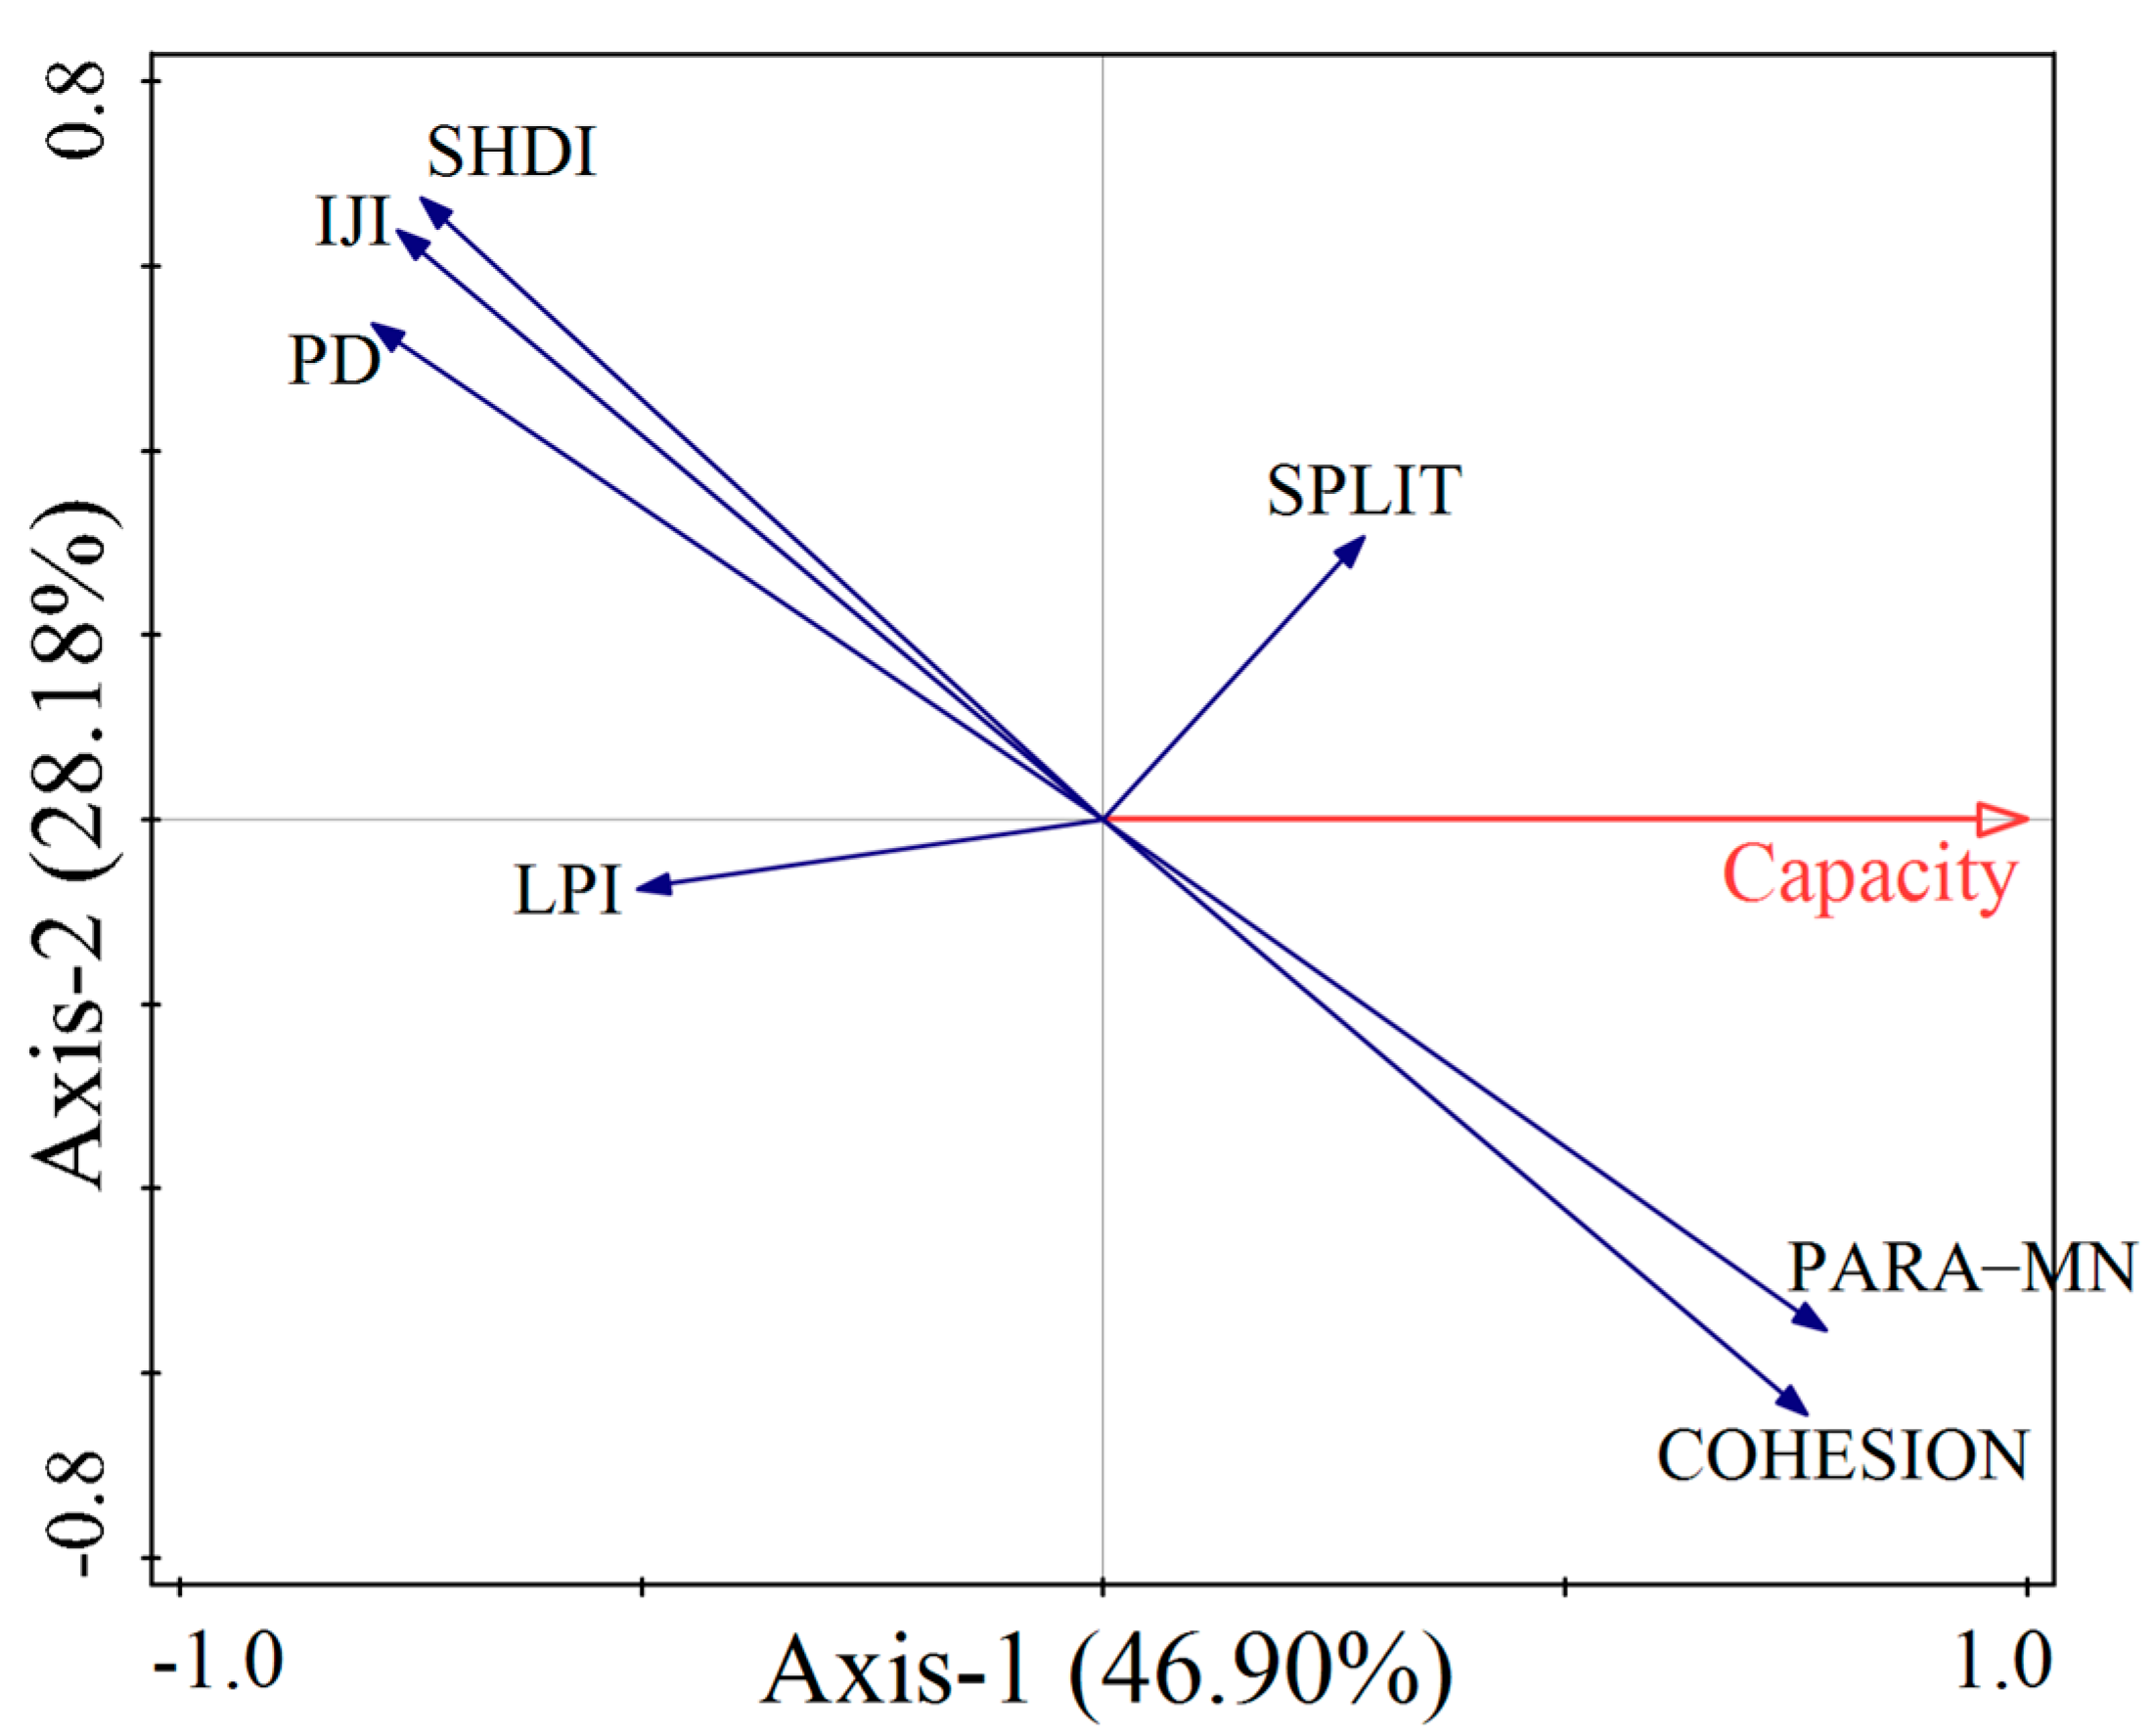
In Figure 9, the response relationship between ECC at the landscape level and landscape pattern indices in the SRYR is depicted. The contribution rates of RDA (redundancy analysis) principal axis 1 and principal axis 2 are 46.90% and 28.18%, respectively, with a cumulative contribution percentage of 75.07%. This adequately reflects the relationship between changes in ECC and landscape pattern indices. In the principal component of principal axis 1, the angles between each index and ECC indicate that SPLIT, PARA_MN, and COHESION have a positive correlation with the ECC (p < 0.05), while SHDI, IJI, PD, and LPI show a negative correlation (p < 0.05). From the projection lengths of each index on ECC in principal axis 2, it can be seen that the main landscape pattern index affecting the ECC is COHESION, followed by PARA_MN, while SPLIT has a weaker explanatory power for the ECC of the SRYR.
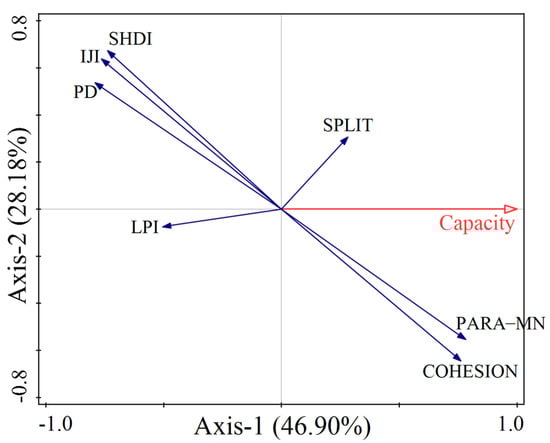
Figure 9.
Correlation analysis of ECC and landscape level landscape pattern index in the SRYR. Figure 9 was generated using Canoco, which was downloaded from the website and its version number is 5.0. (URL: http://www.canoco5.com/, accessed on 18 December 2022).
4.4.2. Driving Factor Analysis
Using the SPSS 27.0 software, a principal component analysis was conducted on ECC and its driving factors. As indicated in Table 9, the eigenvalue of Principal Component 1 is 10.104, encompassing 80.034% of the information. The eigenvalue of Principal Component 2 is 1.447, containing 11.133% of the information. Together, these two principal components account for 91.167% of the original data, demonstrating that the majority of the original data are encapsulated within these components, thereby meeting the extraction criteria.
Table 9.
Eigenvalues and contribution rates and cumulative contribution rates.
According to Table 10, in Principal Component 1, with the exception of the two driving factors, mean annual temperature (X1) and rural population (X6), which exhibit negative correlations, all other driving factors show positive correlations. The primary influencing factors on ECC are social factors. Among the positive driving factors, the largest is urban population (X5), followed by per capita GDP (X8) and total energy production (X12). In Principal Component 2, the driving factors affecting ECC are primarily natural factors. The largest positive factor is mean annual temperature (X1), followed by annual precipitation (X2), and the largest negative factor is animal husbandry (X13).
Table 10.
Principal component load matrix coefficients.
Upon analyzing the relationship between driving factors and the ECC of the SRYR, we computed the scores of two principal components, Y1 and Y2, as well as the comprehensive score Y, where Y is determined by the equation Y = 0.8003 × Y1 + 0.1113 × Y2. Utilizing the linear regression equations derived from the principal component coefficients X1 through X13, the results are presented in Table 11. The comprehensive score Y increased from −2.48 in 1990 to 4.52 in 2020, indicating a year-by-year upward trend in ECC and suggesting a gradual improvement in the ecological environment of the SRYR.
Table 11.
Principal component scores and composite scores for the SRYR from 1990 to 2020.
5. Discussion
5.1. Exploration of Land Use Types and Conversions
The land use structure in the SRYR is relatively simple, aligning with the landscape type structure of Qinghai Province, as described by Qiao [39,43], and corroborating the finding by Zhang [40,44] that the predominant land type is grassland. Between 1995 and 2000, the region experienced a population increase, and herders, in an effort to enhance their income, engaged in the indiscriminate increase in livestock numbers and overgrazing [41,42,45,46], leading to a reduction in grassland area and exacerbating land desertification and sandstorm disasters [43,47]. Research by Wu [44,48] indicates that prior to 2000, the SRYR witnessed an expansion of desertification, which contributed to an increase in the area of unused land during the period from 1995 to 2000. In the context of global climate warming, the region has seen rising temperatures and increased precipitation, resulting in the melting of glaciers and permafrost, and consequently, an expansion of water bodies [45,46,47,49,50,51]. After 2005, there has been a significant increase in grassland area in the region, attributable to the implementation of ecological restoration projects such as returning farmland to forest and grassland, and the ecological protection and construction of the Three-River Source Region starting from 2005 [48,52]. This has led to an increase in grassland areas and a gradual improvement in the ecological environment. Throughout the period from 1995 to 2020, the area of construction land in the region has continuously expanded, driven by urban population growth, which has resulted in the conversion of substantial areas of other land uses into construction land.
Land use type changes predominantly occurred in western Maduo County and central Maqin County within the SRYR, a finding consistent with the research by Wang [49,53]. In 1999, Maduo County experienced severe drought and windstorms, leading to grassland degradation and resulting in a transformation from grassland to unutilized land in the period between 1995 and 2000. Between 2005 and 2010, a significant portion of unutilized land was converted back to grassland, a trend attributed to the alleviation of overgrazing and an intensified effort in grassland restoration [50,54].
5.2. Exploration of Changes in ECC and AECC
In this study, the low ECC in the SRYR between 1990 and 2020 was primarily concentrated in western Maduo County, due to its high altitude, cold and arid climate, and poor soil fertility, which severely impacted the growth of forage grasses [51,52,55,56]. The serious loss of soil and water led to a reduction in the area of grasslands and water bodies in the western region, resulting in low ECC in the area. During the period of 2010 to 2020, the high ECC spread from the northern region to the central region (Maqin County and Gade County), which was attributed to the intensified efforts by Qinghai Province in the central SRYR to implement "grazing withdrawal and grassland restoration" [53,54,57,58]. The trend of grassland degradation in the central counties of the SRYR was initially curbed, leading to an increase in the ECC of the grasslands [55,59].
The ECC of the SRYR and the ECC of each county showed an overall upward trend, which is consistent with the findings of Zhao [56,60]. With the implementation of key projects such as the ecological protection and restoration of the Three-River Source Region, adjustments in land use structure within the SRYR have reduced human interference, contributing to ecological conservation and recovery. In the research by Xin et al. [57,61], the ECC trends of cultivated land and forests have gradually stabilized, which is inconsistent with the results of this study. This discrepancy may be due to the different time scales of the two studies. Xin’s research covered the period from 1990 to 2005, while this study spans from 1990 to 2020. The land use dynamics of construction land showed the greatest changes during the period of 1990–2020, which corresponded with the changes in ECC. The ECC decreased with the increase in land use intensity [58,59,62,63]. Wu [60,64] found that the grassland ECC at the county level was higher than that of other land types, which is consistent with this study, as the SRYR is the base for Qinghai Province’s dominant industry—animal husbandry—with grasslands being predominant in each county. In 2015, the ECC in Jiuzhi County, Gade County, Henan County, and Zeku County was relatively low, which is contrary to the conclusion of Zhang [61]. This discrepancy may be due to the use of different research methods. This study employed ECC conversion factors from comparable years at a global and national level, while Zhang [61,65] estimated the yield factors based on a comparison of bio-productive area yields in Qinghai Province to the national average, with the yield factor set at 70% of the national yield factor. The ECC of grasslands and forests in each county was the highest in this study, which is consistent with the findings of Gao [62,66] in the Three-River Source Region, where grassland resources are abundant. The AECC of grasslands showed an upward trend [3]. The AECC of water bodies in the SRYR showed a downward trend during the period of 2000–2015 and rebounded in 2020, which is consistent with the conclusion of Yin [51] et al. During the period of 2000–2015, due to the dry and rainless climate, a large amount of grassland degraded and the area of water bodies decreased.
5.3. Exploring the Correlation Between Landscape Patterns and ECC
Huang [63,67] found that the landscape pattern specifically reflects the ecological status of the study region, and landscape indices are the manifestation of landscape patterns. There is a correlation between landscape patterns and ECC. Regions with higher land use intensity and faster changes in land use experience altered landscape patterns, and their ECC relative values are lower [64,68]. Currently, there are no related reports on the changes in ECC under landscape pattern changes in the SRYR. Zeng [35], through a study on the Shule River basin, found that changes in landscape patterns significantly affect the ECC and ecological water demand of the basin.
In the results of this study, the overall ECC of the SRYR showed significant positive correlations with SPLIT, PARA_MN, and COHESION, and significant negative correlations with PD, SHDI, LJI, and LPI. This indicates that the process of complexification of the SRYR’s landscape patch shapes has deepened, suggesting that the overall landscape dispersion degree of the SRYR has not changed significantly, and the impact of human activities is decreasing [65,69]. Peng found that the glacier Splitting Index (SPLIT) increased in the Yarkant River basin, which is contrary to the results of this study [66,70]. The reason for this discrepancy may be that climate change has a more intense impact on glaciers in the Yarkant River basin, leading to continuous reduction in glacial landscapes and increased fragmentation. In this study, the landscape indices of the SRYR were mainly COHESION and PARA_MN, which reflect the density differences and size of shapes in the landscape.
5.4. Exploring the Drivers of ECC
Annual mean temperature and annual precipitation, as natural environmental factors, exert a strong explanatory effect on the ECC of the SRYR. Xu [67,71] also concluded that precipitation and temperature exhibit a stronger synergy and exert a greater impact on the service value of the SRYR, which aligns with the findings of this research. The socio-economic factors examined in this study, including urban population, output value of the tertiary industry, output value of the secondary industry, and per capita GDP, significantly influence the ECC. This is likely due to the socio-economic development that has led to the rural–urban migration of the population and changes in industrial structure, resulting in an increase in the economic output and GDP of the SRYR, in agreement with the assertions of Wang [68,72] that population and GDP growth play a significant driving role. Lu [69,73], in her analysis of the factors influencing land use and land cover changes in the Yellow River Basin, similarly demonstrated that population is a primary factor affecting these changes, with its impact intensifying over time.
In the present study, the impact of urban population, per capita GDP, and the output value of the secondary industry on the ECC of the SRYR is most pronounced. This contrasts with the findings of Li [70,74] regarding the driving forces of the Pearl River Delta urban agglomeration, as the regions and timeframes of the two studies differ. With the increasing emphasis on ecological conservation by Qinghai Province, the population in the SRYR has gradually increased, leading to a rise in the income of the region’s residents, an increase in industrial output, and an expansion of livestock production, thereby escalating the demand for the region’s ECC year by year. The vegetation coverage and wetland area in the SRYR have been increasing annually, along with the temperature and annual mean evaporation rate, all of which have impacted the ECC of the region [71,75].
6. Conclusions
Based on the land use data and ecological ECC factors of the SRYR for the years 1990, 1995, 2000, 2005, 2010, 2015, and 2020, this paper calculates the ECC and AECC for seven periods over the past 30 years using the ecological footprint model. It conducts redundancy analysis between landscape pattern indices and ECC to analyze the driving factors of the SRYR and draws the following conclusions:
- (1)
- From 1990 to 2020, the area of woodland in the SRYR remained relatively stable, while the area of unused land significantly decreased. The areas of cultivated land, grassland, water bodies, and construction land increased, with grassland showing the largest increase. The main land use types experiencing area transitions were grassland and unused land, mainly distributed in western Maduo County and central Maqin County. The most significant transition occurred between 2005 and 2010, when a large amount of unused land was converted to grassland, with a conversion volume of 7382.33 km2.
- (2)
- Over the past 30 years, the ECC of the SRYR and each county has generally shown an upward trend. The ECC of grassland and construction land has increased significantly, while that of woodland has decreased. The ECC is higher in Maqin County, Maduo County, and Xinghai County, and lower in Zeku County, Gade County, and Henan County. The AECC of cultivated land and construction land initially increased and then decreased, and has shown a slow growth trend since 2005.
- (3)
- Over the past 30 years, the SRYR has shown predominantly low ECC in the west, medium ECC in the central area, and high ECC in the southern region. High AECC is concentrated in a banded distribution in the northwest, while low AECC is patchily distributed in the northern region.
- (4)
- There is a correlation between the ECC of the SRYR and various landscape-level indicators, among which COHESION, PARA_MN, and SPLIT have better explanatory power.
- (5)
- Over the past 30 years, the land use in the SRYR has been rational, with both ECC and AECC showing an increasing trend, and the ecological environment gradually improving. The population and GDP in the social factors have greatly affected the ECC of the region, which is the main driving factor of the ecological carrying capacity of the SRYR.
Author Contributions
Conceptualization, S.L.; methodology, J.S.; software, S.Z. and X.Z. (Xiaoyan Zhang); validation, X.Z. (Xiaojing Zheng); formal analysis, Y.G. and B.Q.; data curation, S.L. and X.M.; writing—original draft preparation, J.T.; visualization, J.S.; project administration, S.L. All authors have read and agreed to the published version of the manuscript.
Funding
This study was supported by the Qinghai Science and Technology Department (No. 2023-HZ-802).
Additional Information
Correspondence and requests for materials should be addressed to Lusujin.
Data Availability Statement
All data generated or analyzed during this study are included in this published article.
Conflicts of Interest
The authors declare no competing interests.
References
- Chun, X.; Qing, F.Y.; Zhou, H.J.; Dan, D.; Xia, Y.-Y.; Ulambadrakh, K. Effects of climate variability and land use/land cover change on the Daihai wetland of central Inner Mongolia over the past decades. J. Mt. Sci. 2020, 17, 3070–3084. [Google Scholar] [CrossRef]
- Chen, J. Influence and Evaluation of Economic Carrying Capacity in Guangdong Province from the Perspective of Trans-regional Marine Ecological Environment Flow. J. Coast. Res. 2020, 104, 682–686. [Google Scholar] [CrossRef]
- Liu, J.Y.; Ning, J.; Kuang, W.H.; Xu, X.; Zhang, S.; Yan, C.; Li, R.; Wu, S.; Hu, Y.; Du, G.; et al. Spatio-temporal pattern and new features of land use change in China from 2010 to 2015. J. Geogr. 2018, 73, 789–802. [Google Scholar] [CrossRef]
- Zhang, L.Y.; Chung, S.; Qiu, J. Ecological carrying capacity assessment of diving site: A case study of Mabul Island, Malaysia. J. Environ. Manag. 2016, 183, 253–259. [Google Scholar] [CrossRef]
- Wen, X.M.; Du, L.Y.; Dou, Y.Y.; Lu, X. Research on Ecological Carrying Capacity and Industrial Transfer in Hebei Province. Coop. Econ. Technol. 2018, 6, 32–33. [Google Scholar] [CrossRef]
- Miyake, S.; Renouf, M.; Peterson, A.; McAlpine, C.; Smith, C. Land use and environmental pressures resulting from current and future bioenergy crop expansion: A review. J. Rural. Stud. 2012, 28, 650–658. [Google Scholar] [CrossRef]
- Feng, Z.M.; Yang, Y.Z.; Jiang, D.; Yuan, G.; Ma, J.; Zhang, Z.; Zhang, H.; Liu, H.; Yan, H.; Pan, T. The compilation of natural resources balance sheet and evaluation of resources and environmental carrying capacity. J. Ecol. 2016, 36, 7140–7145. [Google Scholar] [CrossRef]
- Medved, S. Present and future ecological footprint of Slovenia-The influence of energy demand scenarios. Ecol. Model. 2006, 192, 25–36. [Google Scholar] [CrossRef]
- Yang, D.; Li, M.; Wang, F.; Lin, W.; Li, W. Ecological footprint evaluation: An empirical study of the Bohai coast of the Jing-Jin-Ji region. J. Coast. Res. 2020, 106, 407–413. [Google Scholar] [CrossRef]
- Wu, R.; Li, C.Y. Land use analysis based on three-dimensional ecological footprint model under ArcGIS-taking eastern cities of Qinghai Province as an example. Land Nat. Resour. Res. 2020, 6, 20–27. [Google Scholar] [CrossRef]
- Du, W.P.; Yan, H.M.; Feng, Z.M.; Yang, Y.; Chen, R. Study on the ecological carrying capacity of China-Nepal corridor area based on the balance between ecological supply and consumption. J. Ecol. 2020, 40, 6445–6458. [Google Scholar]
- Zhen, L.; Xu, A.; Zhao, Y.; Jijun, W.; Yunfeng, H.; Juanle, W. Ecological carrying capacity and green development in the “belt and road” initiative region. J. Resour. Ecol. 2019, 10, 569–573. [Google Scholar] [CrossRef]
- Zhang, L. Research on sustainable development of Xian city based on ecological footprint model. Can. Soc. Sci. 2020, 16, 18–24. [Google Scholar] [CrossRef]
- Su, Z.L.; Yuan, G.H.; Zhou, W. Evaluation of ecological carrying capacity of land in Anhui province based on improved three-dimensional ecological footprint model. Soil Water Conserv. Res. 2020, 27, 256–262. [Google Scholar] [CrossRef]
- Lu, Y.; Li, X.; Ni, H.; Chen, X.; Xia, C.; Jiang, D.; Fan, H. Temporal-spatial evolution of the urban ecological footprint based on net primary productivity: A case study of Xuzhou central area, China. Sustainability 2019, 11, 199. [Google Scholar] [CrossRef]
- Yue, D.X.; Chen, G.G.; Zhu, M.X.; Guo, X.; Zhou, Y.; Li, K.; Wang, D.; Guo, J.; Zeng, J. Research on ecological carrying capacity and ecological water demand of Shule River Basin in recent 20 years. J. Ecol. 2019, 39, 5178–5187. [Google Scholar] [CrossRef]
- Danis, H.; Ulucak, R.; Khan, U.D. Determinants of the ecological footprint: Role of renewable energy, natural resources, and urbanization. Sustain. Cities Soc. 2020, 54, 101996. [Google Scholar] [CrossRef]
- Yang, Y. Study on Ecological Carrying Capacity of Alpine Grassland in Qinghai-Tibet Plateau. Master’s Thesis, Hebei Normal University, Shijiazhuang, China, 2019. [Google Scholar]
- Bai, L.Y.; Rong, Y.S. Impact of climate change on water resources in the source areas of the Yangtze River and the Yellow River. Water Resour. Prot. 2012, 28, 46–50. [Google Scholar] [CrossRef]
- Gu, M.L. Analysis of ecological environment protection and sustainable utilization of water resources in the source region of the Yellow River. Gansu Agric. 2019, 9, 76–77. [Google Scholar] [CrossRef]
- Tian, S.M.; Han, B.; Liang, S.; Jing, Y.; Chen, R.; Wang, W. Discussion on water conservation in the source region of the Yellow River. J. Water Resour. Waterw. Eng. 2022, 1, 19–27. [Google Scholar] [CrossRef]
- Liang, W.T.; Wei, L.Y.; Liu, Y.; Yin, H.; Han, Z. The increase of land water reserves in the source region of the Yellow River in recent 20 years and its possible causes. China Rural. Water Hydropower 2022, 35, 138–147. [Google Scholar]
- Lu, S.J.; Si, J.H.; Qi, Y.; Wang, Z.; Wu, X.; Hou, C. Distribution characteristics of TOC, TN and TP in the wetland sediments of Longbao Lake in the San-Jiang head waters. Acta Geophys. 2016, 64, 2471–2486. [Google Scholar] [CrossRef]
- Lu, S.J.; Si, J.H.; Hou, C.Y.; Li, Y.-S.; Wang, M.-M.; Yan, X.-X.; Xie, M.; Sun, J.-X.; Chen, B.-J.; Li, S.-S. Spatiotemporal distribution of nitrogen and phosphorus in alpine lakes in the Sanjiangyuan Region of the Tibetan Plateau. Water Sci. Technol. 2017, 76, 396–412. [Google Scholar] [CrossRef]
- Wang, H.H.; Zeng, W.H.; Ma, B.G.; Li, Q. Study on multi-objective optimization model of ecological carrying capacity uncertainty of protected land-taking maduo county, the source area of the Yellow River as an example. China Environ. Sci. 2021, 41, 1300–1310. [Google Scholar] [CrossRef]
- Wang, Y.; Li, Y.H.; Sun, X.Y. Impact of climate change on the ecological environment of the Yellow River source region. Grassl. Sci. 2015, 32, 539–551. [Google Scholar] [CrossRef]
- Wang, L.J.; Guo, N.; Sha, S.; Yang, Y.; Wang, X.; Hu, D. Effects of land cover type conversion on water exchange and climate change in the source area of the Yellow River. Theor. Appl. Climatol. 2022, 149, 525–536. [Google Scholar] [CrossRef]
- Fu, X.; Yang, X.; Dong, Q.; Zhang, C.; Liu, W.; Yu, C.; Zhang, X.; Su, C.; Shi, G.; Yang, Z.; et al. Response of major species in alpine grassland to grazing. Grassl. Sci. 2021, 38, 531–543. [Google Scholar] [CrossRef]
- Zhao, Y.J.; Li, Y.B.; Shao, J.G. Ecological risk assessment of small watersheds in the Three Gorges Reservoir Area based on land use change—The case of Caotang Creek. J. Nat. Resour. 2013, 28, 944–956. [Google Scholar] [CrossRef]
- Zhu, M.S. Research on Land Use Change and Its Ecological Effect in the Lower Reaches of the Yellow River Based on GEE. Master’s Thesis, Shandong University of Architecture, Jinan, China, 2023. [Google Scholar]
- Yue, D.; Xu, X.; Li, Z.; Hui, C.; Li, W.; Yang, H.; Ge, J. Spatiotemporal analysis of ecological footprint and biological capacity of Gansu, China 1991–2015: Down from the environmental cliff. Ecol. Econ. 2005, 58, 393–406. [Google Scholar] [CrossRef]
- Yan, J.F.; Wang, M.H.; Su, F.Z.; Zhang, X.; Gao, S.; Xu, M. Changes in land cover and ecological stress in Borneo based on remote sensing and an ecological footprint method. Landsc. Ecol. Eng. 2020, 16, 319–333. [Google Scholar] [CrossRef]
- Hu, X.K.; Wei, H.D.; Chen, F.; Xu, X.; Zhou, J.; Tang, J. Dynamic changes of alpine wetland landscape in Maqu County, the source region of the Yellow River. J. Southwest For. Univ. 2012, 32, 43–47+111. [Google Scholar] [CrossRef]
- Liu, C.H.; Wang, P.L.; Wen, T.T.; Yu, D.; Bai, W. Study on the temporal and spatial law of climate change in the source region of the Yellow River from 1960 to 2019. Arid Area Res. 2021, 38, 9–10. [Google Scholar] [CrossRef]
- Zeng, J.J. Study on Ecological Carrying Capacity and Ecological Water Demand of Shule River Basin in the Context of Landscape Pattern Change. Ph.D. Thesis, Lanzhou University, Lanzhou, China, 2018. [Google Scholar]
- Liu, M.C.; Li, W.H.; Xie, G.D. Measurement of yield factor of China’s ecological footprint based on net primary productivity. J. Ecol. 2010, 29, 592–597. [Google Scholar] [CrossRef]
- Wackernagel, M.; Rees, W.E. Our Ecological Footprint: Reducing Human Impact on the Earth; New Society Publishers: Gabriola Island, BC, Canada, 1997; Volume 1. [Google Scholar] [CrossRef]
- WWF. Living Planet Report 2014: Species and Spaces, People and Places; World Wildlife Fund: Surrey, UK, 2014; Available online: http://awsassets.panda.org/downloads/lpr_living_planet_report_2014.pdf (accessed on 16 May 2022).
- WWF. Living Planet Report 2002: Resource Destruction: The Earth is Overdrawn; World Wildlife Fund: Surrey, UK, 2002; Available online: https://wwfint.awsassets.panda.org/downloads/lpr2002.pdf (accessed on 16 May 2022).
- Guo, X.N.; Liu, X.N.; Song, Y.B.; Ning, X. A study on the dynamics of landscape pattern in Dongfang City, Hainan Province based on Fragstats. Zhongnan For. Surv. Plan. 2016, 35, 30–33+52. [Google Scholar] [CrossRef]
- Zhu, Y.G. Analysis of spatial and temporal evolution and driving factors of green total factor productivity in cities in the Yellow River Basin. Sci. Ind. 2021, 21, 61–69. [Google Scholar] [CrossRef]
- Cao, X.J. An analysis of the operating performance of listed banks in China-an approach based on principal component analysis, factor analysis and cluster analysis. J. Cebu Acad. 2016, 31, 25–29. [Google Scholar] [CrossRef]
- Qiao, B.; Zhu, C.X.; Cao, X.Y.; Xiao, J.-S.; Zhaxi, L.-D.; Yan, Y.-Q.; Chen, G.-Q.; Shi, F.-F. Spatial autocorrelation analysis of land use and ecosystem service value in Maduo county, Qinghai under grid scale. J. Appl. Ecol. 2020, 31, 1660–1672. [Google Scholar] [CrossRef]
- Zhang, L. Spatial-Temporal Dynamic Changes of Land Use and Vegetation Index and Its Driving Factors in the Source Region of the Yellow River in Recent 32 Years. Ph.D. Thesis, Xi’an University of Technology, Xi’an, China, 2017. [Google Scholar]
- Zhang, Y.L.; Liu, L.S.; Wang, Z.F.; Bai, W.; Ding, M.; Wang, X.; Yan, J.; Xu, E.; Wu, X.; Zhang, B.; et al. Temporal and spatial characteristics of land use and cover change in Qinghai-Tibet Plateau. Sci. Bull. 2019, 64, 2865–2875. [Google Scholar]
- Zhang, Y.S. Water and soil loss and control measures in the headwaters of the Yellow River. Qinghai Agric. For. Sci. Technol. 2007, 2, 83–84+86. [Google Scholar] [CrossRef]
- Li, R.S.; Shao, Z.T.; Zhang, H.H.; An, Z. Study on the temporal and spatial evolution and causes of desertification in the upper reaches of the Yellow River in recent 30 years. World Geol. 2014, 33, 494–503. [Google Scholar] [CrossRef]
- Wu, X.F.; Li, G.X.; Pan, X.P.; Wang, Y.; Zhang, S.; Liu, F.; Shen, Y. Response of vegetation coverage in the source region of the Yellow River to temperature and precipitation. Resour. Sci. 2015, 37, 512–521. [Google Scholar]
- Yao, L.; Wu, Q.M. Characteristics of climate change in Qinghai-Tibet Plateau. Meteorol. Sci. Technol. 2002, 30, 163–164+143. [Google Scholar] [CrossRef]
- Guan, Y.L. Study on the Change of Global Climate Landscape Pattern and Its Impact on the Surface Water Resources of Qinghai-Tibet Plateau. Ph.D. Thesis, North China Electric Power University, Beijing, China, 2021. [Google Scholar]
- Shao, Q.Q.; Fan, J.W.; Liu, J.; Huang, L.; Cao, W.; Xu, X.; Ge, J.; Wu, D.; Li, Z.; Gong, G.; et al. Ecological Effect Evaluation of the First Phase of Sanjiangyuan Ecological Protection and Construction Project. J. Geogr. 2016, 71, 3–20. [Google Scholar] [CrossRef]
- Li, H.M.; Li, W.Q.; Yuan, Y.; Zhang, Z.J. Study on land use/cover change and its driving factors in cities and towns in eastern Qinghai Province. Sci. Technol. Innov. 2021, 27, 118–121. [Google Scholar] [CrossRef]
- Wang, M.L. Protecting lawn ecological environment and promoting sustainable development of ecological and organic animal husbandry in Huangnan. Peasant Staff 2021, 119–120. [Google Scholar]
- Chen, Q.; Zhang, Y.L.; Liu, F.G.; Zhou, Q.; Wang, S.; Cheng, Y.; Guo, R.; Zhi, Z.; Xu, H. Review of land use change and its impact in the source region of the Yellow River Basin. Resour. Sci. 2020, 42, 446–459. [Google Scholar] [CrossRef]
- Yin, B.K.; Cao, X.Y.; Zhang, J.G.; Zhang, D.; Wang, X. Dynamic changes of soil erosion in the source region of the Yellow River from 1999 to 2018. Bull. Soil Water Conserv. 2020, 40, 216–220+325. [Google Scholar] [CrossRef]
- Qinghai Provincial Department of Finance. Qinghai: Improving fiscal policy measures-supporting the protection of Sanjiangyuan. China Financ. 2020, 3, 66–68. [Google Scholar] [CrossRef]
- Mao, J.H.; Wu, Q.; Zhu, M.H.; Lu, C. Effects of Environmental Regulation on Green Total Factor Productivity: An Evidence from the Yellow River Basin, China. Sustainability 2022, 14, 2015. [Google Scholar] [CrossRef]
- Zhong, M.C. Ecological carrying state and protection responsibility of ecological functional areas in the development of the Yellow River Basin. Hebei Acad. J. 2021, 41, 182–189. [Google Scholar]
- Qinghai Provincial People’s Government. Environmental protection of Qinghai province in the 13th five-year plan. Qinghai Sci. Technol. 2016, 26–30. Available online: http://www.qinghai.gov.cn/ (accessed on 13 May 2022).
- Zhao, S.X. The practice of high-quality development and high-quality living in Qinghai. J. Natl. Teach. Coll. Qinghai Norm. Univ. 2020, 31, 54–58. [Google Scholar] [CrossRef]
- Xin, Y.J.; Zhou, D.M.; Jin, Y.L.; Ma, J.; Zhang, J. Study on the spatio-temporal evolution characteristics and driving forces of ecological carrying capacity in Shule River Basin. Remote Sens. Inf. 2021, 36, 18–28. [Google Scholar] [CrossRef]
- Ji, Y.M.; Wang, X.W.; Liang, B.C.; Hong, L. Analysis of dynamic changes of land use and ecological carrying capacity in northern Shaanxi. China Popul. Resour. Environ. 2011, 21, 271–274. [Google Scholar] [CrossRef]
- Zhuo, Y.; Wang, X.W.; Xu, J.F.; Yang, N. Analysis of dynamic changes of land use and ecological carrying capacity in southern Shaanxi. Anhui Agric. Sci. 2009, 37, 1266–1270. [Google Scholar] [CrossRef]
- Wu, Y. Evaluation of the Implementation Effect of Grassland Ecological Protection Subsidy and Reward Policy in the Source Area of the Yellow River. Ph.D. Thesis, Lanzhou University, Lanzhou, China, 2019. [Google Scholar]
- Zhang, Y.X.; Fan, J.W.; Wang, S.Z.; Zhang, H.; Guan, H. Ecological carrying capacity and ecological security evaluation and analysis of limiting factors in Sanjiangyuan region. Acta Vet. Sin. 2019, 39, 360–372. [Google Scholar] [CrossRef]
- Gao, Y.L.; Lin, H.L.; Zhou, Z.Y.; Wei, Y. Ecological footprint of sustainable development in Sanjiangyuan region. Lawn Sci. 2019, 36, 11–19. [Google Scholar] [CrossRef]
- Huang, Y.Q. Analysis of land use change and driving forces in the Yellow River Basin from 1995 to 2018. J. Northwest For. Univ. 2022, 37, 113–121. [Google Scholar] [CrossRef]
- Huang, X. Analysis of Landscape Pattern Changes and Ecological Carrying Capacity of Dongting Lake Area in the Past 20 Years. Ph.D. Thesis, Hunan Agricultural University, Changsha, China, 2017. [Google Scholar]
- Lu, Y.; Wei, F.; Luo, C.C. The influence of landscape pattern on habitat quality in Wanning City. Tropical Agric. Sci. 2023, 43, 63–69. [Google Scholar]
- Peng, J.J.; Xu, L.P.; Cao, C. Spatial and temporal evolution of glacial landscape patterns in the Yarkand River basin from 1991–2017. J. Ecol. 2022, 42, 8265–8275. [Google Scholar] [CrossRef]
- Xu, M.J.; Cheng, X.J.; Quan, Q.; Yan, D.; Zhang, F. Evolution of runoff and analysis of its drivers in the source region of the Yellow from 1960 to 2019. China Soil Water Conserv. 2023, 63–67. [Google Scholar] [CrossRef]
- Wang, A.Q. Research on Land Ecological Security Evaluation and Influencing Factors in the Yellow River Basin. Ph.D. Thesis, Xi’an University of Technology, Xi’an, China, 2024. [Google Scholar]
- Lu, L. Analysis of Land Use/Cover Change Characteristics and Influencing Factors in the Yellow River Basin. Ph.D. Thesis, Lanzhou University, Lanzhou, China, 2024. [Google Scholar]
- Li, Y.H. Study on the Coupling and Coordination of New Urbanization and Resource and Environmental Carrying Capacity of the Pearl River Delta Urban Agglomeration. Ph.D. Thesis, Guangzhou University, Guangzhou, China, 2022. [Google Scholar]
- Zhao, J. Analysis of Ecological Environment Evolution and Driving Forces of Sanjiangyuan Based on RS and GIS Technology. Ph.D. Thesis, Jilin University, Changchun, China, 2009. [Google Scholar]


Disclaimer/Publisher’s Note: The statements, opinions and data contained in all publications are solely those of the individual author(s) and contributor(s) and not of MDPI and/or the editor(s). MDPI and/or the editor(s) disclaim responsibility for any injury to people or property resulting from any ideas, methods, instructions or products referred to in the content. |
© 2024 by the authors. Licensee MDPI, Basel, Switzerland. This article is an open access article distributed under the terms and conditions of the Creative Commons Attribution (CC BY) license (https://creativecommons.org/licenses/by/4.0/).