Article

The Feeling of Safety by Pedestrians at Night: An Overlooked Aspect of Climate Change?

1
School of Management, Western Galilee College, Acre 2412101, Israel
2
School of Environmental Sciences, University of Haifa, Mt. Carmel, Haifa 3103301, Israel
3
Department of Economics, University of Haifa, Mt. Carmel, Haifa 3103301, Israel
*
Author to whom correspondence should be addressed.
Sustainability 2024, 16(23), 10402; https://doi.org/10.3390/su162310402
Submission received: 17 September 2024 / Revised: 18 November 2024 / Accepted: 22 November 2024 / Published: 27 November 2024

Abstract

:
As the climate becomes more extreme and heat waves become more prevalent, the effects of climate change spill over into previously unnoticed areas. One such prominent result of global warming is the adverse effect of outdoor weather on pedestrians at night. To investigate this rather overlooked effect, we carried out a large-scale field study in 232 different locations in three different cities in Israel–Tel Aviv-Yafo (106 locations), Haifa (49 locations), and Beersheba (77 locations). The study, involving 30,216 observations on the feeling/s of safety (FoS) performed by 491 participants, started in August 2019 and lasted almost one year. As the study reveals, people feel safer, with all other factors being constant, when the temperature is moderate and humidity is high. According to the study findings, if temperature increases from 25 °C to 30 °C, illumination should be increased by ~20 lx to maintain the same level of FoS. However, if the temperature drops, less illumination can be supplied, which makes a case for smart illumination policies. As providing sufficient FoS is important for an active life outdoors, this study generates knowledge that can help support active and secure mobility in urban areas and beyond. As temperatures rise and humidity patterns change, our findings may have broad implications for urban areas worldwide, both in Israel and beyond.

1. Introduction

In his seminal book, Motivation and Personality, Maslow (1954) [1] defines five main groups of human needs, starting with physiological needs, followed by safety and security needs, love and belongingness needs, esteem needs, and self-actualization needs. According to this hierarchy, the safety need becomes dominant once physiological needs are fulfilled. Maslow’s hierarchy emphasizes the importance of safety in a well-functioning society, which includes protection from environmental and criminal threats [2].
According to recent psychological studies [3], the pursuit of safety remains a powerful driving force in human decision-making, and therefore, it directly impacts the well-being and confidence of individuals. As empirical studies reveal, the feeling of safety (FoS) experienced by pedestrians can be affected by several factors, including the time of day [4], crime risk [5], nighttime illumination [4,6], surrounding traffic [7], and road design [8].
Is weather one of the factors that affect FoS? Somewhat surprisingly, no study carried out to date has attempted to answer this question with certainty. However, this knowledge may have a number of important practical implications.
First and foremost, a FoS is directly linked to active and secure mobility, which is one of the main functions supported by the urban environment [9]. In turn, active mobility, such as walking and cycling, improves health [10] and helps achieve better and more efficient use of urban spaces [11,12]. Therefore, by affecting the FoS, weather influences the choice of commuting and transportation modes, human activity patterns, and functional use of urban spaces in general.
Ongoing climate change that manifests itself in climate warming and extreme weather events impacts public health, infrastructure, and human safety. As a result, strategies of urban resilience aimed at enhancing the ability of cities to withstand and adapt to these environmental challenges become critical in addressing these threats [13]. As widely acknowledged at present, integrating sustainability principles, such as reducing carbon emissions, improving the greenness of urban areas, and promoting walkability, can help cities become more resilient to the impacts of extreme weather events in general and rising temperatures in particular [14].
The mechanism by which the weather can affect the FoS for pedestrians at night might involve the following three channels: car accidents, visual comfort, and the fear of crime. For example, wet or icy roads may increase the likelihood of car accidents, especially at night, when visibility is low. Pedestrians may also feel less safe when crossing roads and driveways in adverse weather conditions due to the increased risk of road accidents. Poor weather can also amplify concerns about the ability of drivers to see pedestrians [15]. Furthermore, poor weather can create a more secluded environment and provide a potential cover for criminals [16].
Heavy fog or rain, accompanied by inadequate street lighting, can also impact pedestrian visual comfort and make it difficult to identify potential hazards or navigate the surroundings. Therefore, reduced visual comfort can lead to increased anxiety among pedestrians, as they may not be able to properly assess their environment and identify potential risks. Dark and rainy conditions may also reduce the likelihood of witnessing and surveillance. Therefore, pedestrians may feel more vulnerable to crime during inclement weather. In addition, cold or cool weather can require the use of warm clothing, including hoods and scarves, that may partially obscure a person’s face and reduce peripheral vision. On the other hand, wearing bulky or concealing clothes can make pedestrians less identifiable to others. Concurrently, when people dress lightly and are more exposed, the perceived risk of victimization may increase, especially among young women. Although different impact mechanisms may work under different weather conditions, understanding these mechanisms helps to develop strategies to improve pedestrian safety under different weather conditions, be it through improved infrastructure, increased lighting, or public awareness campaigns.
If the FoS drops due to the weather or other reasons, better crime monitoring and law enforcement can help [17]. However, these are not the only tools. For instance, sufficient nighttime illumination can help to reduce fears and make people feel safer after dark when the FoS declines [6,18]. According to Doleac and Sanders (2015) [19], sufficient nighttime illumination increases the probability of apprehension of people involved in criminal acts, while daylight saving time (DST) has been found to decrease robbery rates by approximately 7%.
In this study, we employ a data collection approach based on a location- and time-specific mobile phone app [18], which enables us to study the effect of different weather conditions on FoS and to determine potential compensatory mechanisms for improving FoS when the weather adversely affects it.
A total of 491 participants took part in our data collection experiment, which was carried out in 232 different locations in three cities in Israel–Tel Aviv-Yafo, Haifa, and Beersheba providing us with a total of 30,000+ individual FoS-assessment reports. The analysis of the assembled data was performed using multivariate statistical tools.
As our study demonstrates, people feel safer, all other factors being constant when the temperature is moderate and wet. Our analysis also reveals that increased street lighting helps compensate for the reduction in FoS caused by increasing temperatures and dropping humidity. Currently, less street lighting can be supplied during cooler and wetter seasons, helping to save energy without adversely affecting FoS.

2. Summary of Previous Studies

Previous studies on FoS have been mainly focused on environmental and individual levels factors, such as age, gender, traffic, and vegetation density, as well as street illumination [4,6,18,20,21]. Other studies dealt with daytime conditions [22,23,24] and largely overlooked the association between weather and FoS after dark. As a result, there is no direct evidence linking weather with FoS, although weather is a topic widely studied in relation to human health and well-being.
Indirectly, the weather can also affect FoS by altering the risk of crime. In particular, as Ranson (2014) [25] and Baryshnikova et al. (2022) [26] demonstrate, rising temperatures are linked to higher crime incidence. As the weather alters the risk of victimization or, at least, the perception of it, this might also affect pedestrians’ FoS.
As FoS normally drops after dark, several individual-level and environmental factors might affect the extent and direction of this change. These factors include gender, age, socioeconomic status, and ethnicity [27,28]. Psychological attributes of a person, such as anxiety, avoidance behavior, and previous victimization experience, can also play a role, while the fear of entrapment might differ between men and women [29].
Research has shown that temperature increases are often linked to higher crime rates [25], which in turn may impact the feeling of safety (FoS) among pedestrians. Physical characteristics of the environment, such as street lighting [4,6], signs of disorder in the neighborhood [30,31,32], the presence of other people in the area, and the availability of refuge spaces and escape routes are also known to affect FoS [5,8,33]. The socioeconomic status of the neighborhood [34], the physical landscape [35], open spaces and amenities [36], urban morphology [37], and street network connectivity [38] are also known to influence FoS.
Yet previous studies of the effect of the weather on FoS have been sporadic and infrequent [22,23,24,39,40,41], and many such studies were performed in laboratory or close-to-laboratory conditions [42]. Therefore, field studies are needed since, according to Patching et al. (2017) [43], it is difficult to accurately “reproduce the quality of the light of each lighting application in simulated environments”.
As investigating the effect of weather on FoS requires a comparison of numerous FoS observations carried out under different weather conditions, such traditional techniques can hardly help. This necessitates the use of alternative solutions for recording and processing observations, such as those presented and discussed in the rest of this paper. However, before such data collection tools are discussed, we shall introduce a conceptual model of the FoS–weather relationships that underscore our study.

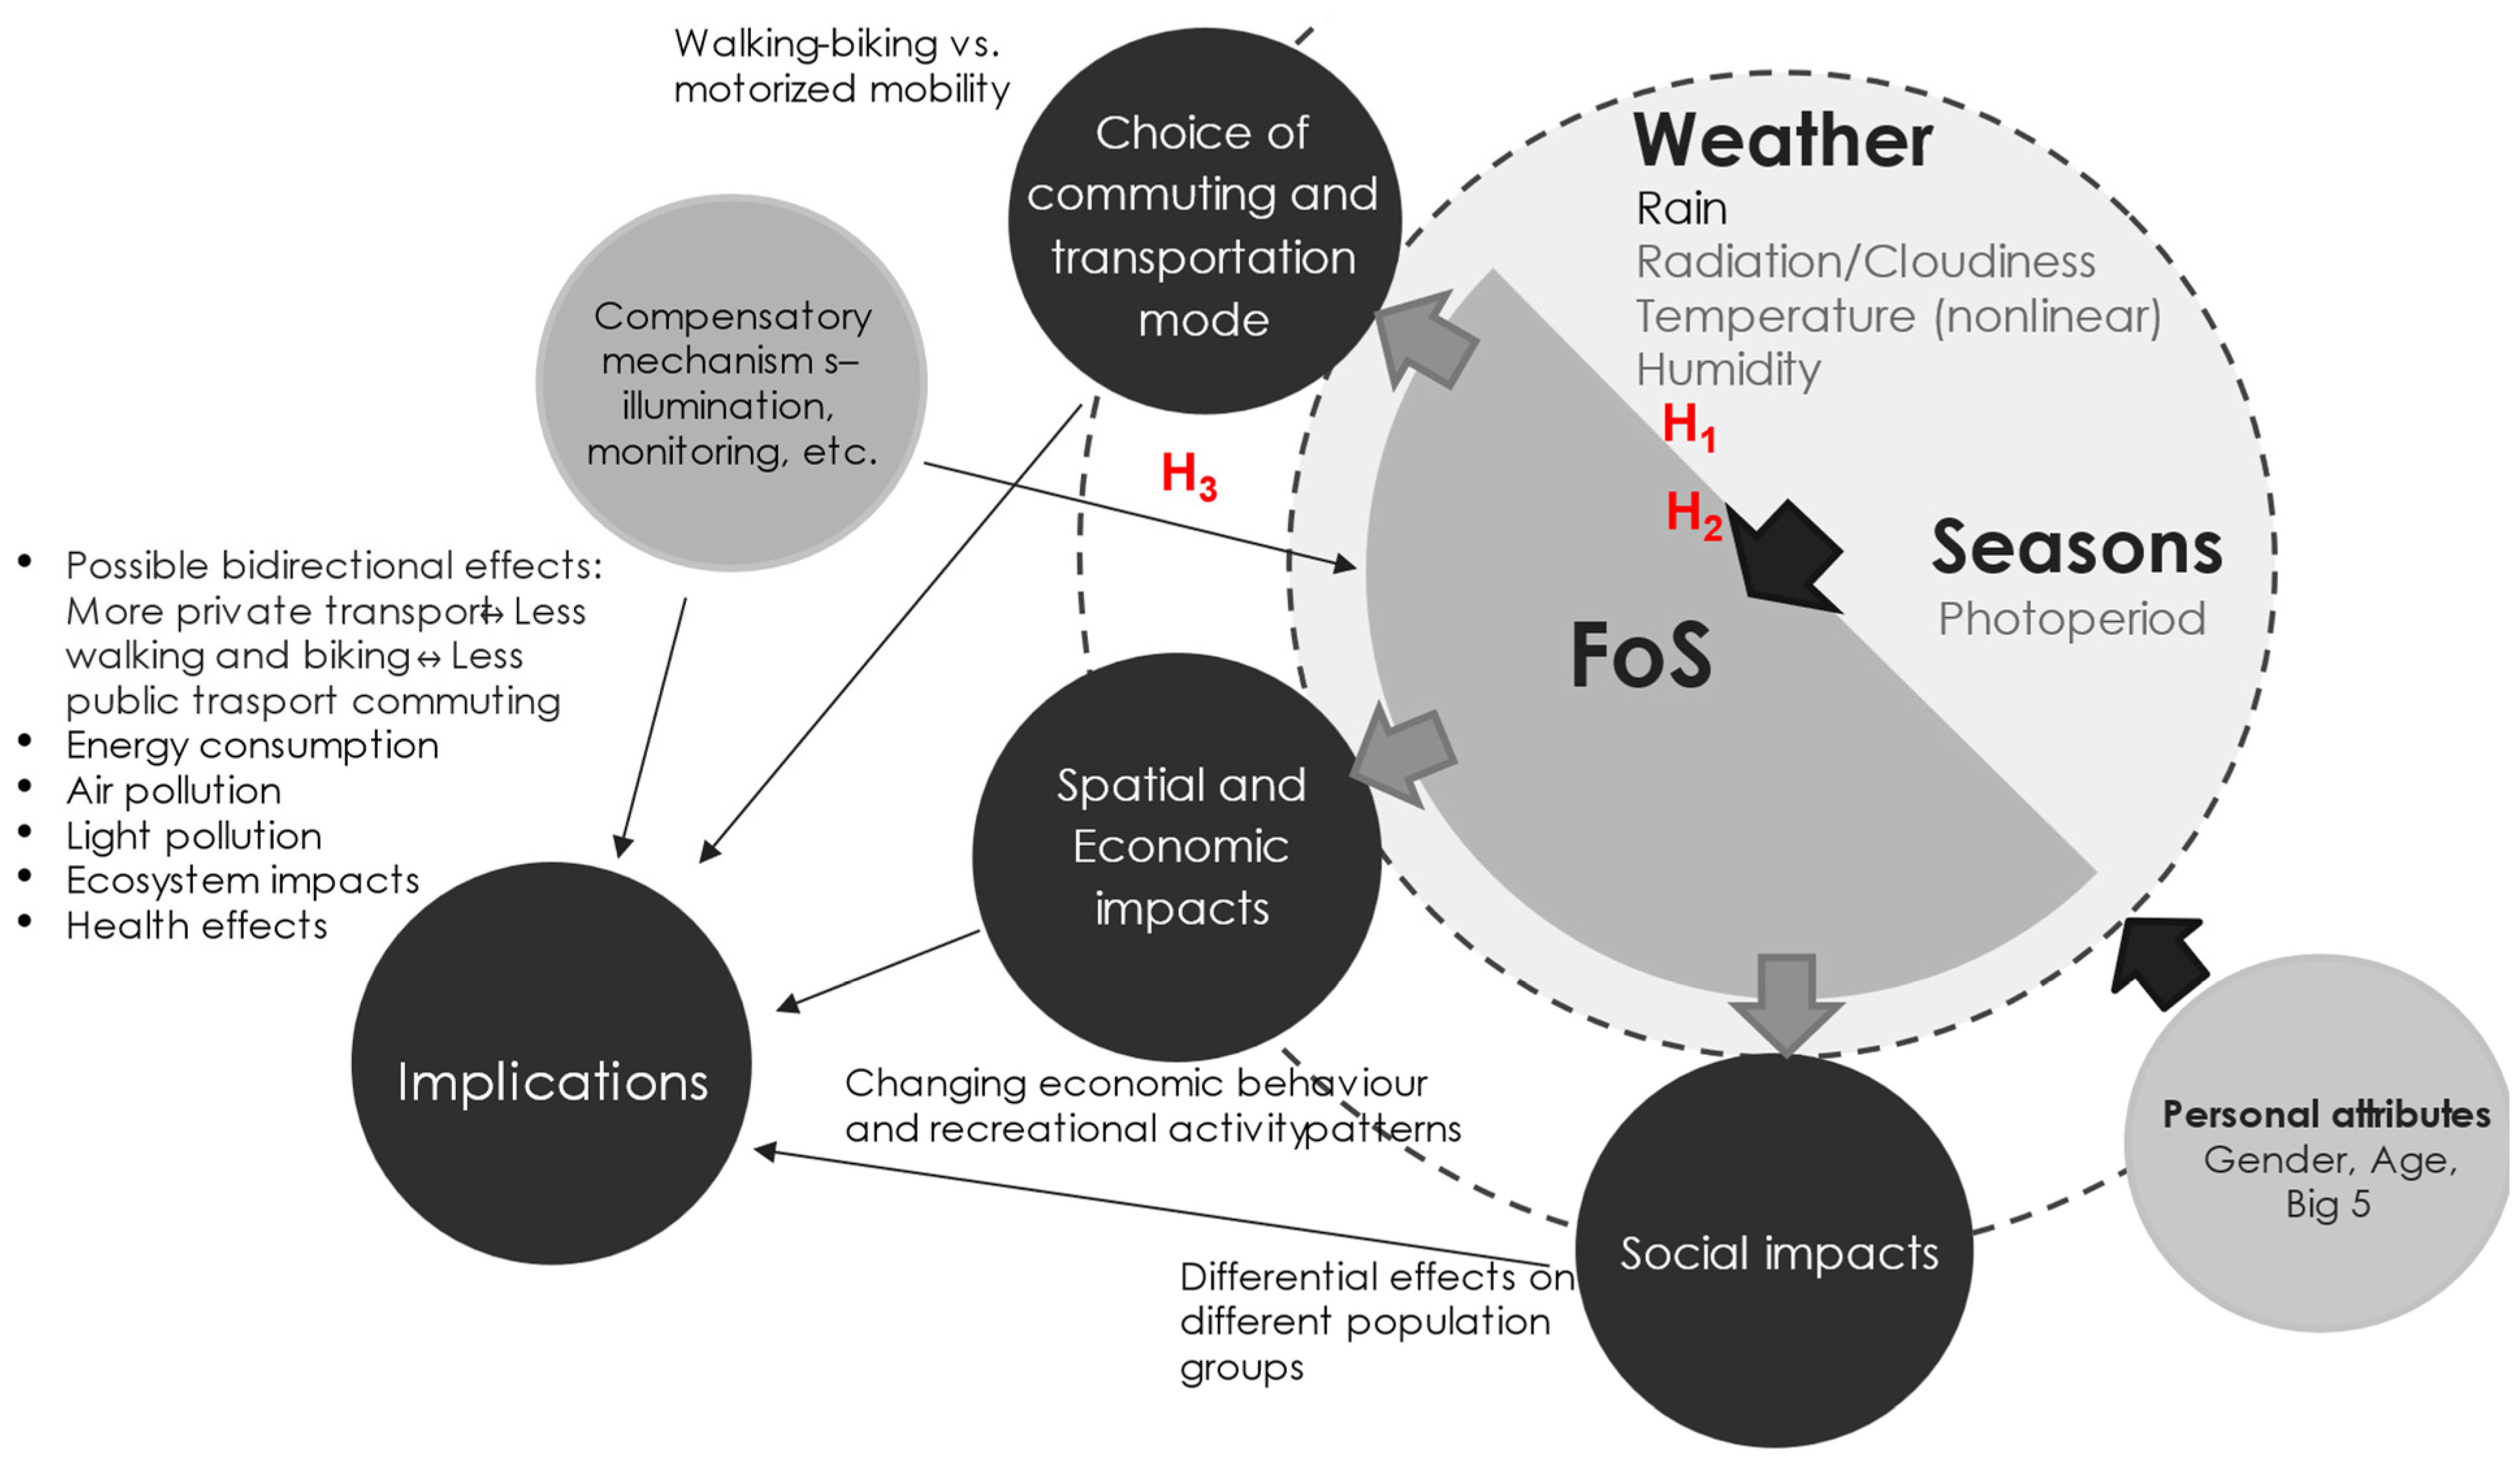
3. Conceptual Model of the Weather–FoS Relationship

Research indicates that weather conditions affect mobility choices, with unfavorable weather leading to increased use of cars and buses, which contribute to pollution [11,44]. Consequently, weather affects the mode and generates environmental externalities (see Figure 1: transportation and commuting mode). In addition, if, under particular weather conditions, walking in the neighborhood is considered dangerous, people might prefer traveling to more populous and well-illuminated places, such as enclosed shopping malls in already crowded urban centers [37]. Such relocation of human activities from close-to-home neighborhood spaces to enclosed malls and central business districts might negatively affect local businesses and recreational use of open areas in the neighborhoods (see Figure 1: spatial and economic impacts).
However, the relationship between weather and FoS is not limited only by first-order interactions. If people opt for motorized travel instead of walking and cycling, the reduced active travel might result in poorer health and an increase in transport-related pollution and road congestion [10]. Consequently, the weather–FoS interactions impact human health, the use of urban spaces, and the environment (Figure 1: Implications).

4. Materials and Method

4.1. Data Collection Tool

Modern mobile phones, with their backlit displays and GPS capabilities, help to record observations from different places simultaneously under varying weather conditions, thus enabling the collection of a large amount of data for a robust statistical analysis. The mobile phone app we use in this study is the CityLightTM smartphone app, which was developed in the framework of a major nighttime illumination project carried out in Israel [7]. The app enables the participants to record their FoS observations in various locations and in real-time, along with other factors, such as observation time, place, and date of assessment (ibid.).
In our previous studies, this app was used to establish illumination sufficiency [6,18], to determine potential energy savings attributed to urban street lighting [4], and to identify over-illuminated areas in the neighborhood [20]. The database, generated by the CityLightTM app, was constantly expanded between August 2019 and March 2022, incorporating new observations submitted by more and more participants who had joined the experiment.
The survey participants were hired by a specialized survey company [45] from a general population. As previously mentioned, the dataset assembled and analyzed in this study consists of 30,000+ observations submitted by 491 participants, the majority of whom (474 respondents) surveyed locations in one city only, that is, in either Tel Aviv-Yafo, Haifa, or Beersheba. The number of participants in each city was roughly proportional to the size of the city’s population and represented the local population in terms of gender and age. The ability to use a smartphone was a requirement. However, selecting participants with a mobile phone is a minor issue, as most people in Israel possess and use mobile phones. In addition, each survey participant was introduced to the survey app by the survey agency during the pre-survey training phase.
The survey participants were explicitly asked to make their assessments alone to avoid interference. The participants were allowed to make assessments twice: in the early evening (between 20:00 and 22:00) and late in the evening (between 22:00 and 24:00), though not on the same day. Furthermore, each participant was asked to perform FoS assessments twice a year, during winter or fall (October–February) and during spring or summer (March–August), thus enabling them to record observations under different weather conditions.
Due to the mild climate of the country, people in Israel can presumably easily manage most of its weather conditions. Therefore, as our analysis shows, there was no significant drop in the number of survey participants during the winter months. On the contrary, there were more observations collected during the winter period than in the summer or shoulder months (see Appendix A). It should also be noted that most of the analyzed observations were collected before and after the COVID-19 pandemic, as during the pandemic, surveyors were reluctant to participate in the experiment, and the survey was largely suspended.
In each neighborhood, a pedestrian route, stretching for about 800–1000 m, was designed to cover main and secondary streets—without a need to cross major thoroughfares, to minimize the risk of road accidents—as well as open spaces, such as children’s playgrounds and parks (if present). Along the sidewalks of each route, about 20–30 survey points were selected at intervals of 20–30 m from each other to represent typical places along each route (see Figure 2). To facilitate the identification of the survey locations by the observers, all the survey points were located, where possible, next to the local landmarks, such as road signs, lampposts, fire hydrants, staircases, etc. (see [18] for more details).
The survey participants were guided to the assessment points by detailed information packages provided in advance and asked to use the app, installed on their mobile phones, to report their FoS assessments on the 4-point Likert scale: 0—feel very unsafe; 1—feel slightly unsafe; 2—feel reasonably safe; and 3—feel very safe. In social psychology studies, it is common to use such even scales to circumvent the tendency of avoiding responders to express a definite opinion while choosing the middle option instead [46].

4.2. Instrumental Measurements of Nighttime Illumination

To determine whether nighttime illumination is linked to FoS, we performed instrumental measurements of nighttime illumination in the same locations that were assessed by the observers. The illuminance measurements were conducted following the European EN 13201 Standard [47], according to which horizontal illuminance is measured in lx at the ground level while positioning the light meter horizontally up to 30 cm above the ground. The measurements were carried out by Light Engineering Ltd., which served as the project subcontractor.

4.3. Environmental Factors

In addition to the instrumental measurements detailed in the previous subsection, vegetation and traffic density in survey locations were assessed by the researchers in situ, using a three-point Likert scale (high-medium-low). Variables ‘vegetation’ and ‘traffic density’ were introduced into the models as categorical predictors, referencing ‘no vegetation’ and ‘sparse traffic’, respectively. Moreover, two dummy variables were introduced into the models: the day of assessment (weekday vs. weekend) and measurement time—20:00–22:00 vs. 22:00 until 24:00.

4.4. Weather Attribute

The climate in Israel is Mediterranean along the coast and desert-like in the south [48]. A typical Mediterranean climate has hot, dry summers and mild and wet winters, with average temperatures ranging in summer from 24 °C to 30 °C, while winter temperatures range from 5 °C to 16 °C. (ibid.). The three cities studied—the coastal cities of Haifa, Tel Aviv, and the desert city of Beersheba—thus experience somewhat different climatic conditions that can affect pedestrians’ FoS during nighttime.
For each day on which FoS observations were performed (see Section 4.1), we also retrieved several weather-related attributes to match them with the FoS assessments carried out by the participants. These weather parameters covered the following four separate metrics with available daily data: average ambient temperature (°C), global radiation (w/m2), daily rainfall (mm), and relative humidity (%). Previous studies [25,26,49] mention these weather attributes, alone or in combination, as factors linked to crime incidence. Therefore, we assume that these factors might also affect FoS.
For analysis, the observations of the participants were matched to the weather records of the nearest air quality monitoring station. There are 157 such stations located all over the country, with at least one or more stations in each major city [50]. Therefore, the average distance between the nearest air quality monitoring station and the most distant survey neighborhood did not exceed 1 km, which helped us to assign relevant weather attributes to the survey locations with reasonable accuracy.
In addition to the above-mentioned weather attributes, solar radiation data were obtained from the Ministry of Transport and Road Safety [51]. Three separate solar radiation metrics are reported in this database: direct radiation, diffuse radiation, and global radiation, which is the sum of the former two. Although direct radiation comes directly from the Sun, diffuse radiation results from the scattering and reflection of sunlight [52]. In this study, we used the global radiation metric as the most inclusive.
During the initial stages of the analysis, all the above-mentioned weather metrics—i.e., daily temperatures, global radiation, daily rainfall, and relative humidity—were tested in the models. However, some of these variables (e.g., daily temperature vs. global radiation or daily rainfall vs. relative humidity) were found to be strongly collinear (r > 0.6; p < 0.01). This observation is supported by the graph reported in Appendix B, which shows how average temperatures in the study area change by month and explains why ambient temperatures cannot be included in the same model with month dummies due to a multicollinearity consideration. Therefore, only the daily temperatures and relative humidity variables, which perform best, were retained in the final models, presented later in this paper. Notably, relative humidity has an important advantage, as it is continuous, while rain might occur in waves throughout the day.

4.5. Data Retrieval and Processing

The observations for the present analysis were downloaded from the CityLightsTM app cloud server on 29 June 2020, covering the period between 15 August 2019 and 29 June 2020. The data collected from the participants (see Section 4.1), instrumental measurements and locational attributes (see Section 4.2 and Section 4.3), and weather attributes (Section 4.4) were combined into a unified database by linking the assessment report’s number to instrumental measurements, locational attributes, weather conditions, and individual attributes of the participants, and filtering out incomplete observations, yielding a dataset with 30,216 observations. Table 1 reports selected descriptive statistics of the combined dataset.

4.6. Statistical Analysis

To identify and measure the effect of different predictors on FoS, we employ ordered logistic regression [53]. Our choice of this model is due to the fact that the dependent variable in the study (FoS) is measured on an ordered Likert scale (see Section 4.1), and participants are randomly drawn. (The ordered logistic regression estimates several intercepts, one for each increase or “jump” in each assessment class [53], as well as the predictors’ parameters. In particular, as the response variable in this study—FoS—has four categories (see Section 4.1), our analysis reports three intercepts, each of which can be interpreted as a “push” into the next FoS category). Specifically, we employ the following proportional odds model:
l n P r F o S k P r ( F o S > k ) = α k x i j T β + z i j T b i + ε i j
where P r F o S k P r ( F o S > k ) P r F o S k P r ( F o S > k ) is the odds ratio of FoS; P r F o S k   P r F o S k is the cumulative probability of FoS being less than or equal to a specific category, k; x i j T are transposed xij that denote the jth row of the fixed effects design matrix XiXi with corresponding fixed effects coefficients denoted by β; zij denotes the jth row of the fixed effects design matrix Zi with corresponding fixed effects b i and the coefficients α k denote the threshold parameters for each category. Binary logistic regression was also performed in the initial stages of the analysis, in which we categorized FoS = 0 and 1 into one group and FoS = 2 and 3 into the second group, and the results were found to be similar to those obtained by using the ordered logistic regression.
Using this specification, we investigated the fixed and random effects that are devised from the vector of city dummies (Tel Aviv, Haifa, and Beersheba); the vector of environmental attributes of the survey locations, including traffic, vegetation, and horizontal illuminance (measured in lx); the vector of individual attributes of the participants, including age, gender, education, and country of birth; the vector of temporal dummies, which included weekdays vs. weekend days, and the time of measurement (before 22.00 vs. after 22.00); and the vector of outdoor weather conditions, including outdoor temperature, and relative humidity (see Section 4.4).
As high correlations between several weather-related variables, e.g., between the daily rain amount and relative humidity and between global radiation and average temperature (r > 0.6), were detected, we did not include, due to a multicollinearity concern [54], highly correlated components into the same model simultaneously, as previously mentioned (see comment in Section 4.4), and reported only the best performing models. It is also to be noted that participants’ fixed effects provide a finer partition than that of neighborhood effects, as FoS varies significantly for individual people [55].

4.7. Research Hypotheses

Previous studies demonstrate that sociodemographic attributes of participants’ physical settings, such as lighting conditions, building morphology, and time of the day, affect human perceptions of the environment [27,28,29]. However, the extent to which weather affects pedestrians’ FoS remains unclear. Therefore, our first hypothesis is as follows:
H10: 
Weather conditions do not affect pedestrian FoS after dark;
H11: 
Weather conditions change pedestrians’ FoS after dark (H1: see Figure 1).
As demonstrated in previous studies [56], different social and health phenomena (such as mortality, morbidity, and crime rates) tend to respond to the weather in a non-linear manner, often following a U-type curve, with responses dropping initially in line with, for example, temperatures and increasing again, after reaching a negative peak [56]. Following this observation, we also consider the possibility that weather attributes (especially temperature) might affect FoS non-linearly. Therefore, our second hypothesis posited for empirical testing is as follows:
H20: 
Changes in weather attributes do not affect FoS or affect it in a linear (i.e., dose-response) manner.
H21: 
Weather attributes affect FoS nonlinearly with, for example, an initial increase in temperature leading to increased FoS, while further increases lead to lower (or unchanged) FoS.
It is well established in the empirical literature that nighttime illumination is an important component of the urban environment, which helps to maintain pedestrians’ FoS [27,57,58]. However, it remains unclear whether a drop in FoS, attributed to weather change, can be compensated for by more nighttime illumination. Therefore, our third research hypothesis is as follows:
H30: 
Increased nighttime illumination does not compensate for the drop in FoS attributed to changes in weather conditions.
H31: 
An increase in nighttime illumination can effectively compensate for a drop in FoS, resulting, for example, from less favorable weather conditions (H3: see Figure 1).

5. Results

5.1. General Trends

As indicated in Figure 3, the survey participants appeared to feel quite safe in most of the survey locations, with at least 68% of them reporting that they felt “safe” or “very safe” during the survey. However, as seen in Figure 3, the probability of feeling safe or better (FoS ≥ 2) differs by city, being higher in Tel Aviv and Haifa (77% and 76% of reports, respectively) than in Beersheba (68.0%). In fact, the FoS reported by the survey participants coincides with data reported by different data sources that show relatively low crime risks and crime perceptions in the study cities (Appendix C).

5.2. Regression Modelling

The models linking FoS to various predictors are reported in Table 2 and Table 3. Model 1 (Table 2) is a basic specification that incorporates the variables of interest and the characteristics of the participants. In Model 2 (Table 2), the observers’ fixed effects are also reported, while Models 3 and 4 (Table 3) report the effect of illumination, temperature, and humidity on FoS in individual cities. In addition, to control for seasonality, the model that incorporates month dummies is reported in Appendix D.
As indicated in Table 2 and Table 3, most of the variables included in all the models are statistically significant, at least at a 10% significance level, except for several interaction terms between temperature, relative humidity, and city in Models 3 and 4.
In Models 1 and 2, all the weather attributes, that is, temperature, both nonlinear and linear terms, and relative humidity are significantly associated with FoS. In particular, FoS appears to increase with humidity (relative humidity: B = 6.00 × 10⁻³; p < 0.01) and initially increase with temperature, but after reaching a positive peak at about 15.7 °C, FoS starts to decrease with further increase in temperature, as indicated by a negative coefficient of the temperature^2 term (B = −3.00 × 10⁻³, p < 0.01).
Although the fear of crime might be a mediator through which outdoor weather is linked to pedestrians’ FoS, crime levels in the study neighborhoods are actually low [18]. However, the victimization concern may be present even in such a low-crime environment. This concern is highlighted by the observation that young women report the most significant drop in FoS as the weather becomes warm and dry (Age1 * Gender: b = −0.794, t = −10.118, p < 0.01; Table 2, and Age1 * Gender: b = −0.845, t = −10.714, p < 0.01; Table 3).
Temporal factors (such as weekdays and before 22.00) are significant and negative in Models 3 and 4, in which fixed effects are introduced. However, in Models 1 and 2, the weekday variable is significantly negative, and the “before 22.00” variable is significant and positive. Individual factors in Models 1 and 3 are also significant, indicating, for example, that older participants feel safer than younger ones and that males feel safer than females.
Characteristically, according to the survey results, the average FoS levels are the highest in the middle-aged group (both among males and females), compared to both younger and older survey participants. In particular, middle-aged people appear to feel safer than the younger and older ones (see Model 1; Table 2). This result corresponds to the findings of several previous studies. For instance, Ziegler and Mitchell (2003) [59] reveal that older people tend to report a lower fear of crime than younger adults. In particular, they are less afraid to walk alone, both day and night. Baker et al. (1983) [60] also point out that older people have higher confidence in the police and therefore feel safer than younger adults. Fein et al. (2007) [61] also found that older adults may be more risk-averse and cautious in decision-making compared to younger adults. As Mata et al. (2011) [62] further show, older people are more likely to avoid risky choices in decision-making compared to younger adults. However, as in our study, we categorize age groups into three different classes—young, middle-aged, and older—somewhat different trends emerge.
Road traffic is also positively and significantly associated with FoS, implying that cars with their headlights improve pedestrians’ FoS, while dense vegetation reduces it, making people feel less safe (p < 0.01). In addition, horizontal illuminance appears to be positively associated with pedestrians’ FoS in all the models, while if all other variables remain constant, the participants consider Haifa and Beersheba less safe compared to Tel Aviv. In particular, the effect of illumination has a greater impact in Beersheba (B = 0.673; p < 0.01) than in other cities in the study. It is also worth mentioning that Models 2 and 4, which include fixed effects, demonstrate a better model fit by providing lower negative log-likelihood values (see Table 2 and Table 3), which are estimates that a good model minimizes.
As further shown in Figure 4, which is estimated using Model 1, the relationship between FoS and ambient temperature follows an inverted-U shape, as we initially hypothesized (H2). This implies that FoS initially increases up to ~15.7 °C, when FoS is at its highest (see Figure 4A), and then starts to drop, while the effect of humidity on FoS is fairly linear (see Figure 4B).

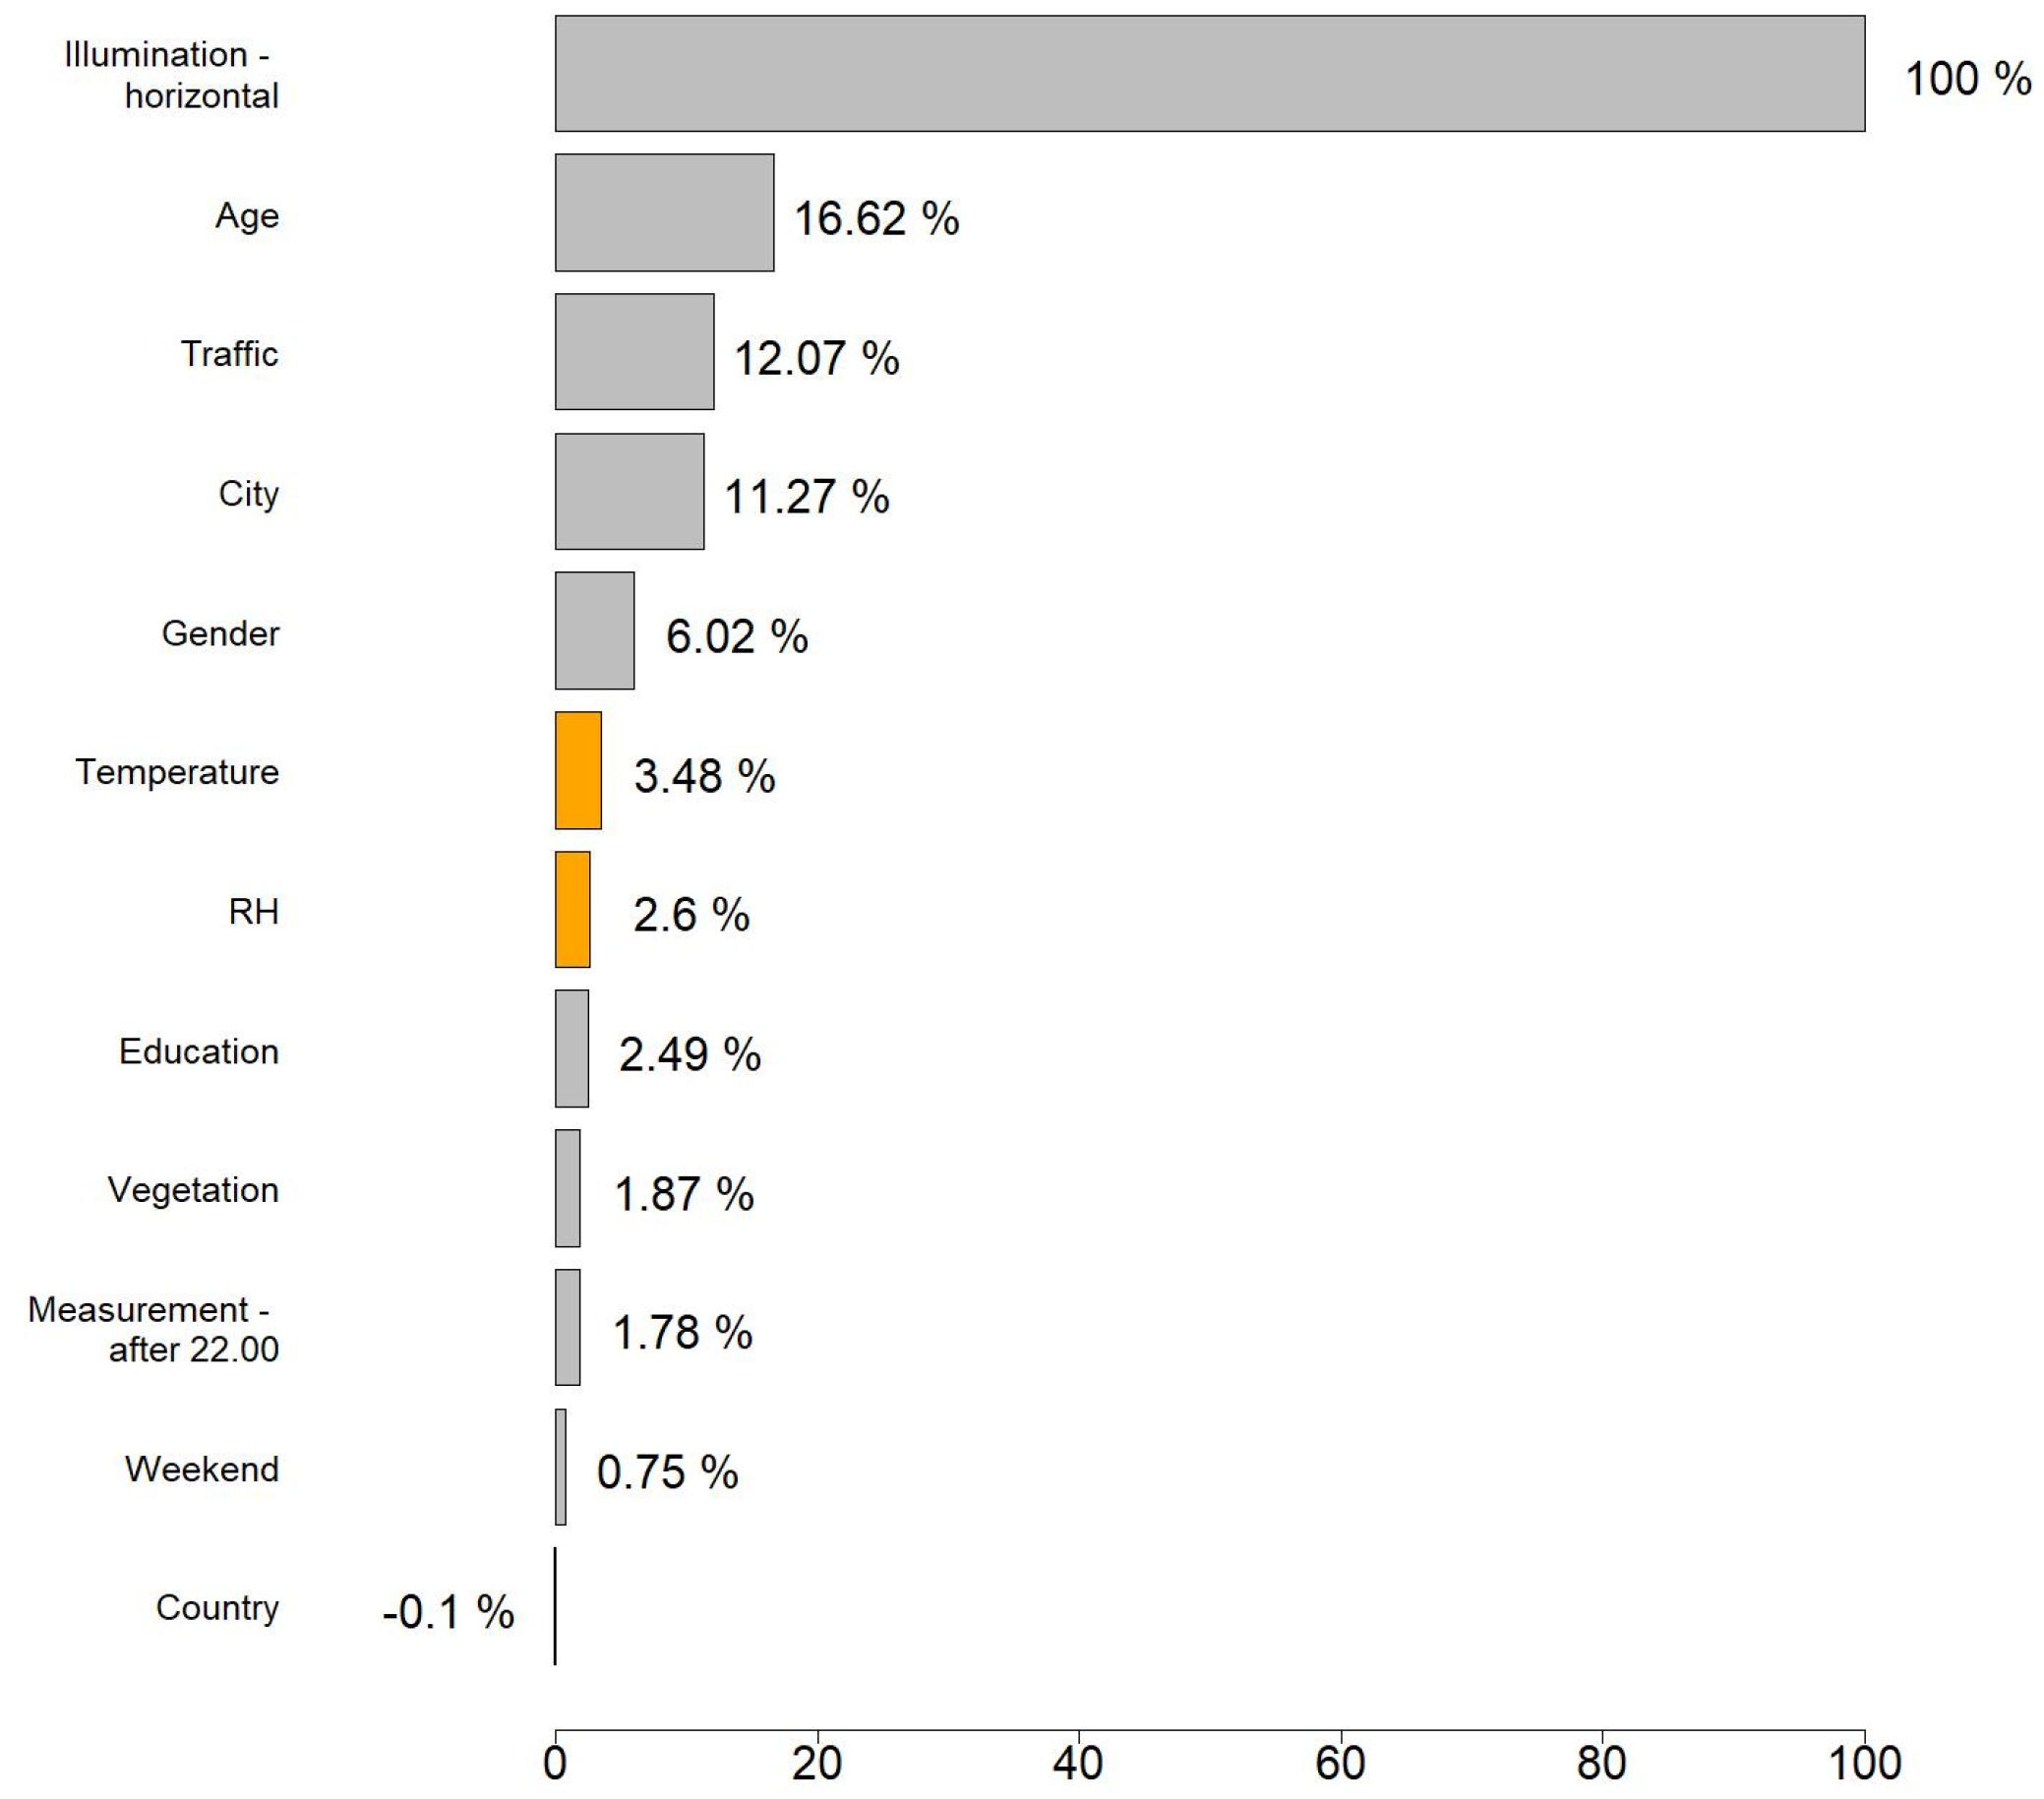
5.3. Factors’ Contribution Test

In Figure 5, we report the results of the ablation test according to which different variables are excluded from the models, one by one, and the change in the Cox and Snell pseudo-R2 is monitored. As indicated in this figure, illumination contributes most to FoS (100%), while temperature contributes ~3.48% of the illumination’s effect, and relative humidity contributes ~2.6%, which is also not negligible.
Figure 6 assesses the amount of illuminance needed to compensate for a drop in FoS resulting from a weather change (rise in temperature and drop in humidity), a possibility we hypothesized (H3; see Section 4.7). To construct this figure, the regression coefficients in Table 2 (Model 1) were used. As this figure shows, if outdoor temperatures increase from, say, 25 °C to 30 °C, the illumination should increase by 26.8 lx to preserve the same level of FoS ≥ 2 (“feel safe” or “feel very safe”). Currently, if temperatures drop from 20 °C to 16 °C, illuminance can be reduced by 1–2 lx while preserving the same level of FoS. By the same token, if relative humidity increases, for example, from 65 to 100%, illumination might be decreased by 5 lx without negatively affecting FoS (see Figure 6A,B).

6. Discussion

Weather attributes, such as precipitation, humidity, solar radiation, and air temperature, are known to affect the perceived quality of the environment. Yet previous studies of the effect of these factors on FoS have been sporadic and infrequent, mainly focusing on daytime conditions [22,23,24,39]. The present study aimed to bridge the gap in this knowledge by analyzing the level of reassurance of pedestrians under different weather conditions after natural dark.
As the present analysis reveals, an increase in relative humidity positively affects pedestrians’ FoS, while temperature has a non-linear effect on FoS. In particular, an increase in temperature from 0 °C to ~15.7 °C is found to affect FoS positively, while a further increase in temperature is found to adversely affect pedestrians’ FoS (p < 0.01). We explain this finding by the possibility that when the weather is warm and people dress lightly, the perceived risk of victimization may increase, especially among young women (see Figure 4). This conclusion coincides with the findings of the study by Ceccato and Loukaitou-Sideris (2022) [63], who point out that females often modify their clothes, carry out self-defense tools, or use a backpack as a protective barrier to minimize the risk of harassment. Yet further research should be carried out to substantiate this observation. Therefore, this finding validates overall our first hypothesis (H1) about the impact of weather on the FoS for pedestrians. Although we do not recommend people to walk through the places in which they feel unsafe, on the other hand, we cannot control the weather either. As the weather gets warm and dry, people feel less safe, as the present study shows, even in a mild climate, a low crime environment was investigated in this study. Although the contribution of temperature and relative humidity to the FoS of pedestrians is estimated to reach ~6%, this number is not negligible as it occurs across the board and can make the difference between tolerable and intolerable conditions. Furthermore, as global warming might worsen in the future, the effect of the weather on FoS might increase accordingly.
Temperature and humidity play a significant role in shaping perceptions of safety, as adverse weather can reduce visibility and heighten anxiety [15,16]. Our study supports these findings by demonstrating that higher temperatures and lower humidity correlate with lower FoS, particularly at night. The present study adds to this body of work by showing that climate-induced discomfort can be mitigated through adequate nighttime illumination, but the overall impact of weather on safety remains a crucial factor for urban planners to consider. However, the magnitude of this effect is not explored yet.
The findings of this study also contribute to the broad discussion of urban sustainability, mainly to its societal and economic components. Thus, from a societal perspective, pedestrian safety is crucial for fostering active mobility, which enhances public health and social well-being. As the present study shows, when temperatures rise, and humidity reduces, the FoS among pedestrians is likely to drop. We see a smart illumination of urban areas as a solution to this problem. The research also highlights the critical role that weather conditions play in changing the FoS experienced by people who walk through urban areas at night. As these feelings affect pedestrian travel, the absence of such travel can undermine local businesses that depend on visitors. The integration of climate-sensitive urban design, such as adaptive street lighting and improved infrastructure, can mitigate these impacts and support the transition to a resilient, low-carbon urban environment [64].
This research is also novel as it addresses a largely overlooked aspect of urban climate adaptation, that is, the influence of weather on the FoS of pedestrians who walk through residential urban areas at night. While previous studies have focused on urban mobility and climate resilience in general, very few of them examined how specific weather conditions affect the perceptions and behaviors of city dwellers at night [65]. In line with urban resilience strategies, which refer to the set of actions and policies designed to prepare cities for the challenges posed by climate change [13], the study’s findings provide critical insights for urban planners, showing that when temperatures rise, and humidity fluctuates, the adverse effect of these changes can be counter-balanced by smart illumination.
If earlier studies placed an emphasis on thermal comfort [40,41], follow-up studies switched their focus to the microclimate, spatial context, and the subjectivity of individuals’ perceptions, expectations, and preferences [22,23,24]. Thus, in an early study, Wang et al. (2018) [41] revealed that people feel more comfortable when their body temperature tends toward physiological neutrality, even if the same temperatures are associated with thermal discomfort in other circumstances. Our study confirms this observation.
An important point the present study reveals is that, as nighttime illumination positively affects FoS, additional illumination might help compensate for a decline in FoS when the weather gets warmer. In particular, if outdoor temperatures increase from, for example, 25 °C to 30 °C, nighttime illuminance should be increased from 15 lx to 41.8 lx, that is, by 26.8 lx, to preserve the same level of FoS (i.e., feel safe or better). These results align with the results reported by several previous studies. For instance, in Portnov et al. (2022) [6], the optimal nighttime illumination was found to range from 8.9 to 26 lx depending on location, while Boyce et al. (2000) [66] found that “35 lx is required for males and 60 lx for females”. According to another study by Svechkina et al. (2020) [18], sufficient horizontal illumination ranges from 5 to 25 lx depending on location. In another study, Fotios et al. (2019) [67] found that under the level of illuminance reaching 20 lx, no day-dark differences are observed (see Figure 3 in ibid.). This finding thus supports our third hypothesis (H3) about a compensatory mechanism by which nighttime illumination can counterbalance a drop in FoS attributed to a change in the weather.
The knowledge gained in this study can have a variety of practical applications. As we mentioned previously, if people feel unsafe while walking outdoors, they use their environment differently compared to people who feel reasonably safe. For instance, if people feel sufficiently safe in their neighborhood, they will probably prefer walking or cycling to move from one place to another, at least locally. In contrast, if people feel unsafe, they will choose other forms of local travel, such as cars or buses. As active mobility affects physical and mental health [68,69], understanding the factors affecting FoS can help to find practical solutions for supporting healthy lifestyles associated with active and environmentally friendly mobility.
Although our findings are drawn from the urban environment in Israel, in which the study was carried out, these findings may have broader implications for cities worldwide, as weather change that manifests itself in rising temperatures and changing humidity is evident across the board, not in Israel alone. By understanding the role of weather in shaping pedestrian behavior, urban planners can develop more resilient and climate-sensitive infrastructure to ensure safer and more sustainable cities that align with the United Nations’ Sustainable Development Goals (SDGs), particularly Goal 11, which call for making cities inclusive, safe, resilient, and sustainable [70].
Several limitations of the study need to be mentioned. First, the study is based on data obtained in three cities in Israel, which limits our ability to generalize its results. The research also mainly focused on potential safety concerns attributed to weather. Therefore, we intentionally selected for the study only neighborhoods with relatively low crime rates so as to minimize the effect of potential confounding. Therefore, in future studies, the research applicability of the findings to other cities and countries should be verified. It should also be noted that average daily temperatures in Israel rarely fall below 5 °C. Therefore, the relationship between outdoor temperatures and FoS needs to be investigated further in other environmental settings, especially in cold climates. Separate analyses should also be performed for different seasons separately to investigate the effect of the amount of rain and relative humidity, which can vary substantially depending on local conditions.
It is important to note that the number of participants in each city was set roughly proportional to the size of the city’s population and represented the local population in terms of gender and age (with a 4.5% sampling error). Yet future research should try to increase the accuracy of the estimates by employing larger samples, diversifying the list of places in which the study is carried out, and using finer-grained weather data, should such data become available.
The main difficulty associated with a study of this type is that FoS observations need to be documented under different weather conditions and by different groups of people. While Patching et al. (2017) [43] state that “self-report questionnaires often rely on paper and pencil format that can be difficult to complete outdoors at night when it is dark”, Johansson et al. (2014) [71] suggest that “paper and pencil tools are vulnerable to wet conditions and the tool may benefit from being further adapted into electronic form and thereby available, for example, for use in mobile phones or tablets”. This makes the “paper and pencil” data recording technique laborious, time-consuming, and poses significant difficulties for the elderly and visually impaired. Such data recording techniques are also problematic for recording observations on rainy or windy days [18]. The drawback is that if participants experience difficulties in recording observations in poor weather, they prefer not to record assessments on the spot but later on when they are back home or in the research laboratory, leading to uncontrolled errors due to memory limitations and recall bias [43]. We overcome such difficulties by employing a place-specific, real-time data-collecting approach based on real-time data-collecting technologies.
This study shows that young females feel less safe than their male peers when the temperature increases. This observation coincides with the study by Cogoni et al. (2021) [72] that when women cover less of their body, men’s brain responses associated with understanding other people’s feelings and emotions are reduced, suggesting a potential decrease in empathy or less shared emotional understanding. However, further studies of this potential effect are needed. In addition, population density might also impact pedestrians’ FoS as it is affected by the presence of other pedestrians. Although in our study, traffic density (sparse, average, and heavy) was used as a proxy for street traffic and urban activity in general, an attempt should be made in further studies to integrate pedestrian density.
Lastly, we should note that in Baryshnikova et al. (2022) [26] and other studies, hourly observations of weather and crime are used to show that higher temperatures are associated with an increase in crime. However, as hourly temperature data were not available for this study, participants’ FoS were linked to average daily temperature. Follow-up studies might be needed to address this limitation. Further studies should attempt to acquire hourly weather data to capture more accurately the conditions experienced by pedestrians as they walk through urban areas at night. Follow-up studies might also be needed to investigate the effect of personal attributes (such as self-confidence, self-assurance, and other potential confounders) on FoS.
However, the use of smartphones, on which this survey is based, and proficiency of their use may vary across different age groups. This can impact the accuracy and representativeness of the survey results. We cannot also exclude the possibility that particularly bad weather or safety perceptions might influence the survey results. For instance, a possibility exists that survey participants, under particularly bad weather or due to safety precautions, might avoid some locations, resulting in missing observations. However, such a possibility was unlikely in our survey. As explicitly commented on in the text, the survey participants were asked to assess fixed locations marked on the map, and the survey participants’ actual position was validated by the smartphone’s GPS. Moreover, the neighborhoods selected for the survey are located in cities with relatively low crime rates (see Appendix C), and no “problematic” areas appear to be present in these neighborhoods, but follow-up studies should attempt to incorporate place-specific crime risks. Yet, these possibilities are important for interpreting the results and may warrant further research to address these potential limitations.

7. Conclusions

Knowledge about the effect of weather on FoS is important because impaired FoS can alter mobility mode and increase the use of less environmentally friendly and less healthy mobility alternatives, such as motor traffic, even for local travel. Therefore, internalizing the factors affecting FoS is important for improving health and achieving global sustainability goals [11]. In this respect, the study’s finding that an adverse effect of weather on FoS can be counterbalanced by adjusting nighttime illumination is particularly important. It is also technically feasible. Recent advances in lighting applications, such as illuminance and light color temperature-adjusting LEDs [73], object-focused luminaries, and light dimmers [74], can make such counterbalancing possible. Low-cost WiFi weather monitoring stations and movement monitoring devices can also help collect external data in a smart way by using built-in sensors. In particular, in cool and rainy weather, street lighting can be reduced without negatively impacting the FoS of pedestrians, while in warm and dry weather, more street lighting should be supplied to achieve the desired level of FoS. Such smart illumination strategies can increase energy efficiency and reduce health risks to humans and ecosystems, which are known to exist [7]. The present study thus contributes to advanced knowledge about human–environment interaction in general and, in particular, to knowledge about the effect of weather factors on the pedestrians’ FoS, which can help to create a better and more sustainable urban environment.

Author Contributions

Conceptualization, B.A.P.; Methodology, R.S. and B.A.P.; Software, R.S.; Validation, R.S. and B.A.P.; Formal analysis, R.S., B.A.P. and D.K.; Investigation, B.A.P.; Resources, B.A.P.; Data curation, R.S. and B.A.P.; Writing—original draft, R.S. and B.A.P.; Writing—review and editing, R.S. and B.A.P. All authors have read and agreed to the published version of the manuscript.

Funding

This research was funded by the Israel Science Foundation, grant number 400/18.

Institutional Review Board Statement

The study was approved by the institutional ethics committee of the University of Haifa (Approval number 177/19).

Informed Consent Statement

Informed consent was obtained from all subjects involved in the study.

Data Availability Statement

Due to ethical concerns, supporting data cannot be made openly available. Researchers interested in gaining access to the data used in the study can request a de-identified dataset by directly contacting the Israel Science Foundation (ISF) that funded this research.

Conflicts of Interest

The authors declare no conflicts of interest.

Appendix A

Figure A1. The total number of observations collected in the survey by observation season.
Sustainability 16 10402 g0a1
Figure A2. The total number of observations collected in the survey by the year of the study.
Sustainability 16 10402 g0a2

Appendix B

Figure A3. The changes in the average ambient temperatures in the study area by month (Source: Ministry of Transport and Road Safety (n.d.)).
Sustainability 16 10402 g0a3

Appendix C

Table A1. The safety assessments for the study cities compared to the country total.
SourceTel Aviv-YafoHaifaBeershebaIsraeli Average
Percent of respondents who reported feeling reasonable safe or very safe in this survey (%)77.076.068.0-
Crime index measured on a 100-point scale, from 0 (Low) to 100 (High) (Source: Numbeo, nd)26.7426.6647.1132.22
Percent of residents who report “feel safe after dark” in the nationwide survey (Source: CBSI, 2022)83.2072.1068.8080.40
Crimes reported to the Israeli police per 1000 residents in 2022—bodily harm and sex crimes only (Source: Israel Police, 2023)6.4710.049.89-

Appendix D

Table A2. Factors affecting FoS for pedestrians (Method: multiple ordered logistic regression; the dependent variable—FoS measured on a four-point Likert scale: 0—feel very unsafe; 1—feel slightly unsafe; 2—feel reasonably safe, and 3—feel very safe; the observation month is included instead of the temperature and humidity).
PredictorBt-Value
Illumination
Illuminance—horizontal (Ln)0.35537.593 ***
Relative humidity
RH0.01010.676 ***
Locational and environmental factors
City dummies (ref. = Tel Aviv-Yafo)
     Haifa−0.121−4.079 ***
     Beersheba−0.359−11.158 ***
Traffic density (ref. = sparse traffic)
     average traffic 0.35212.993 ***
     heavy traffic 0.37711.119 ***
Vegetation (ref. = no vegetation)
     sparse vegetation−0.070−2.842 ***
     dense vegetation−0.192−5.279 ***
Individual level factors
Age group (ref. = 60+)
     18–40 yo (Age1)−0.109−2.200 *
     40–59 yo (Age2)0.0591.141 *
Gender (ref. = Male)
· Female0.4906.674 ***
Interaction terms:
   Age1 * Gender−0.745−9.363 ***
   Age2 * Gender−0.600−7.121 ***
Education (years of schooling)0.0276.914 ***
Country of birth (ref. = Israel)
     other countries0.1083.344 **
Temporal factors
Day of the week (ref. = weekend)
     weekday−0.027−1.057 ***
Assessment time (ref. = after 22:00)
     before 22:000.1184.405 ***
Winter months (ref. = Oct.)
     November 0.55110.676 ***
     December 0.4449.752 ***
     January0.2063.657 ***
     February0.5538.593 ***
Summer months (ref. = Oct.)
     May−1.237−4.618 ***
     Jun0.3637.761 ***
     July−0.457−2.582 ***
Shoulder months (ref. = Oct.)
     March0.7717.568 ***
     September0.1432.828 ***
Intercepts
     α1 (0|1)−1.057−8.884 ***
     α2 (1|2)0.9968.501 ***
     α3 (2|3)3.10726.223 ***
Number of observations 30,216
  −2 log-likelihood34,289.240
AIC68,636.480
*** statistically significant at 1% level; ** statistically significant at 5% level; * statistically significant at 10% level.

References

  1. Maslow, A.H. Motivation and Personality; Harpers: Oxford, UK, 1954. [Google Scholar]
  2. Tay, L.; Diener, E. Needs and Subjective Well-Being around the World. J. Pers. Soc. Psychol. 2011, 101, 354–365. [Google Scholar] [CrossRef] [PubMed]
  3. Zheng, Z.; Gu, S.; Lei, Y.; Lu, S.; Wang, W.; Li, Y.; Wang, F. Safety Needs Mediate Stressful Events Induced Mental Disorders. Neural Plast. 2016, 2016, 8058093. [Google Scholar] [CrossRef]
  4. Saad, R.; Portnov, B.A.; Trop, T. Saving Energy While Maintaining the Feeling of Safety Associated with Urban Street Lighting. Clean. Technol. Environ. Policy 2021, 23, 251–269. [Google Scholar] [CrossRef]
  5. Loewen, L.J.; Steel, G.D.; Suedfeld, P. Perceived Safety from Crime in the Urban Environment. J. Environ. Psychol. 1993, 13, 323–331. [Google Scholar] [CrossRef]
  6. Portnov, B.A.; Saad, R.; Trop, T.; Kliger, D.; Svechkina, A. Linking Nighttime Outdoor Lighting Attributes to Pedestrians’ Feeling of Safety: An Interactive Survey Approach. PLoS ONE 2020, 15, e0242172. [Google Scholar] [CrossRef]
  7. Svechkina, A.; Portnov, B.A.; Trop, T. The Impact of Artificial Light at Night on Human and Ecosystem Health: A Systematic Literature Review. Landsc. Ecol. 2020, 35, 1725–1742. [Google Scholar] [CrossRef]
  8. Foster, S.; Giles-Corti, B.; Knuiman, M. Neighbourhood Design and Fear of Crime: A Social-Ecological Examination of the Correlates of Residents’ Fear in New Suburban Housing Developments. Health Place 2010, 16, 1156–1165. [Google Scholar] [CrossRef]
  9. Koszowski, C.; Gerike, R.; Hubrich, S.; Götschi, T.; Pohle, M.; Wittwer, R. Active Mobility: Bringing Together Transport Planning, Urban Planning, and Public Health. In Towards User-Centric Transport in Europe: Challenges, Solutions and Collaborations; Springer: Cham, Switzerland, 2019; pp. 149–171. [Google Scholar]
  10. European Environment Agency. Walking, Cycling and Public Transport in Cities Remain Greener Mobility Options than Electric Scooters or Car Ride-Hailing. Available online: https://www.eea.europa.eu/highlights/walking-cycling-and-public-transport (accessed on 30 October 2024).
  11. Yigitcanlar, T.; Kamruzzaman, M. Planning, Development and Management of Sustainable Cities: A Commentary from the Guest Editors. Sustainability 2015, 7, 14677–14688. [Google Scholar] [CrossRef]
  12. Panter, J.R.; Jones, A.P.; van Sluijs, E.M. Environmental Determinants of Active Travel in Youth: A Review and Framework for Future Research. Int. J. Behav. Nutr. Phys. Act. 2008, 5, 34. [Google Scholar] [CrossRef]
  13. Meerow, S.; Newell, J.P.; Stults, M. Defining Urban Resilience: A Review. Landsc. Urban. Plan. 2016, 147, 38–49. [Google Scholar] [CrossRef]
  14. Hodson, M.; Marvin, S. Urbanism in the Anthropocene: Ecological Urbanism or Premium Ecological Enclaves? City 2010, 14, 298–313. [Google Scholar] [CrossRef]
  15. Chen, C.; Zhao, X.; Liu, H.; Ren, G.; Liu, X. Influence of Adverse Weather on Drivers’ Perceived Risk during Car Following Based on Driving Simulations. J. Mod. Transp. 2019, 27, 282–292. [Google Scholar] [CrossRef]
  16. Lee, S.; Ha, M. The Duality of Visibility: Does Visibility Increase or Decrease the Fear of Crime in Schools′ Exterior Environments? J. Asian Archit. Build. Eng. 2015, 14, 145–152. [Google Scholar] [CrossRef]
  17. Di Tella, R.; Schargrodsky, E. Do Police Reduce Crime? Estimates Using the Allocation of Police Forces After a Terrorist Attack. Am. Econ. Rev. 2004, 94, 115–133. [Google Scholar] [CrossRef]
  18. Svechkina, A.; Trop, T.; Portnov, B.A. How Much Lighting Is Required to Feel Safe When Walking Through the Streets at Night? Sustainability 2020, 12, 3133. [Google Scholar] [CrossRef]
  19. Doleac, J.L.; Sanders, N.J. Under the Cover of Darkness: How Ambient Light Influences Criminal Activity. Rev. Econ. Stat. 2015, 97, 1093–1103. [Google Scholar] [CrossRef]
  20. Portnov, B.A.; Saad, R.; Trop, T. Interactive Scenario-Based Assessment Approach of Urban Street Lighting and Its Application to Estimating Energy Saving Benefits. Energies 2021, 14, 378. [Google Scholar] [CrossRef]
  21. Fotios, S.; Castleton, H. Specifying Enough Light to Feel Reassured on Pedestrian Footpaths. Leukos 2016, 12, 235–243. [Google Scholar] [CrossRef]
  22. Andrade, H.; Alcoforado, M.-J.; Oliveira, S. Perception of Temperature and Wind by Users of Public Outdoor Spaces: Relationships with Weather Parameters and Personal Characteristics. Int. J. Biometeorol. 2011, 55, 665–680. [Google Scholar] [CrossRef]
  23. Kaparias, I.; Bell, M.G.H.; Miri, A.; Chan, C.; Mount, B. Analysing the Perceptions of Pedestrians and Drivers to Shared Space. Transp. Res. Part. F Traffic Psychol. Behav. 2012, 15, 297–310. [Google Scholar] [CrossRef]
  24. Stathopoulos, T.; Wu, H.; Zacharias, J. Outdoor Human Comfort in an Urban Climate. Build. Environ. 2004, 39, 297–305. [Google Scholar] [CrossRef]
  25. Ranson, M. Crime, Weather, and Climate Change. J. Environ. Econ. Manag. 2014, 67, 274–302. [Google Scholar] [CrossRef]
  26. Baryshnikova, N.; Davidson, S.; Wesselbaum, D. Do You Feel the Heat around the Corner? The Effect of Weather on Crime. Empir. Econ. 2022, 63, 179–199. [Google Scholar] [CrossRef]
  27. Boomsma, C.; Steg, L. Feeling Safe in the Dark. Environ. Behav. 2014, 46, 193–212. [Google Scholar] [CrossRef]
  28. Yeoh, B.S.A.; Yeow, P.L. Where Women Fear to Tread: Images of Danger and the Effects of Fear of Crime in Singapore. GeoJournal 1997, 43, 273–286. [Google Scholar] [CrossRef]
  29. Blöbaum, A.; Hunecke, M. Perceived Danger in Urban Public Space. Environ. Behav. 2005, 37, 465–486. [Google Scholar] [CrossRef]
  30. Box, S.; Hale, C.; Andrews, G. Explaining Fear of Crime. Br. J. Criminol. 1988, 28, 340–356. [Google Scholar] [CrossRef]
  31. Brown, B.B.; Perkins, D.D.; Brown, G. Crime, New Housing, and Housing Incivilities in a First-ring Suburb: Multilevel Relationships across Time. Hous. Policy Debate 2004, 15, 301–345. [Google Scholar] [CrossRef]
  32. Robinson, J.B.; Lawton, B.A.; Taylor, R.B.; Perkins, D.D. Multilevel Longitudinal Impacts of Incivilities: Fear of Crime, Expected Safety, and Block Satisfaction. J. Quant. Criminol. 2003, 19, 237–274. [Google Scholar] [CrossRef]
  33. Warr, M. Dangerous Situations: Social Context and Fear of Victimization. Soc. Forces 1990, 68, 891–907. [Google Scholar] [CrossRef]
  34. Brown, G.; Raymond, C. The Relationship between Place Attachment and Landscape Values: Toward Mapping Place Attachment. Appl. Geogr. 2007, 27, 89–111. [Google Scholar] [CrossRef]
  35. Macarthur, D. Place and Experience: A Philosophical Topography. Philos. Rev. 2001, 110, 632–634. [Google Scholar] [CrossRef]
  36. Kothencz, G.; Kolcsár, R.; Cabrera-Barona, P.; Szilassi, P. Urban Green Space Perception and Its Contribution to Well-Being. Int. J. Environ. Res. Public Health 2017, 14, 766. [Google Scholar] [CrossRef] [PubMed]
  37. Peña-García, A.; Hurtado, A.; Aguilar-Luzón, M.C. Considerations about the Impact of Public Lighting on Pedestrians’ Perception of Safety and Well-Being. Saf. Sci. 2016, 89, 315–318. [Google Scholar] [CrossRef]
  38. Ayataç, H.; Türk, Ş.Ş. An Assessment of Quality of Place (QoP) Research for Istanbul. A|Z. ITU J. Fac. Archit. 2009, 6, 77–93. [Google Scholar]
  39. Cohen, P.; Shashua-Bar, L.; Keller, R.; Gil-Ad, R.; Yaakov, Y.; Lukyanov, V.; Bar (Kutiel), P.; Tanny, J.; Cohen, S.; Potchter, O. Urban Outdoor Thermal Perception in Hot Arid Beer Sheva, Israel: Methodological and Gender Aspects. Build. Environ. 2019, 160, 106169. [Google Scholar] [CrossRef]
  40. Lin, T.-P.; Matzarakis, A.; Hwang, R.-L. Shading Effect on Long-Term Outdoor Thermal Comfort. Build. Environ. 2010, 45, 213–221. [Google Scholar] [CrossRef]
  41. Wang, Z.; de Dear, R.; Luo, M.; Lin, B.; He, Y.; Ghahramani, A.; Zhu, Y. Individual Difference in Thermal Comfort: A Literature Review. Build. Environ. 2018, 138, 181–193. [Google Scholar] [CrossRef]
  42. Johan, R.; Maria, J. Walking After Dark—The Human Response to Outdoor Lighting on a Pedestrian Path; Department of Architecture and Built Environment: Lund, Sweden, 2016. [Google Scholar]
  43. Patching, G.R.; Rahm, J.; Jansson, M.; Johansson, M. A New Method of Random Environmental Walking for Assessing Behavioral Preferences for Different Lighting Applications. Front. Psychol. 2017, 8, 345. [Google Scholar] [CrossRef]
  44. Ha, S.; Hu, H.; Roussos-Ross, D.; Kan, H.; Roth, J.; Xu, X. The Effects of Air Pollution on Adverse Birth Outcomes. Environ. Res. 2014, 134, 198–204. [Google Scholar] [CrossRef]
  45. Dialogue: Organizational Consulting Firm. Available online: https://dialogue.co.il/ (accessed on 1 May 2020).
  46. Wakita, T.; Ueshima, N.; Noguchi, H. Psychological Distance Between Categories in the Likert Scale. Educ. Psychol. Meas. 2012, 72, 533–546. [Google Scholar] [CrossRef]
  47. European Standards. EN 13201 Standards for Road Lighting All Parts. Available online: https://www.en-standard.eu/csn-en-13201-1-4-road-lighting/ (accessed on 25 May 2024).
  48. Israel Meteorological Service Climate of Israel. Available online: https://ims.gov.il/en (accessed on 20 July 2022).
  49. Stathopoulos, T. Pedestrian Level Winds and Outdoor Human Comfort. J. Wind Eng. Ind. Aerodyn. 2006, 94, 769–780. [Google Scholar] [CrossRef]
  50. Ministry of Environmental Protection. Air Quality Monitoring Stations Website. Available online: https://www.gov.il/en/pages/a_new_site_for_air_quality_data_in_israel (accessed on 24 May 2021).
  51. Ministry of Transport and Road Safety Meteorological Database. Israel Meteorological Service. Available online: https://ims.gov.il/en (accessed on 21 May 2021).
  52. Spitters, C.J.T.; Toussaint, H.A.J.M.; Goudriaan, J. Separating the Diffuse and Direct Component of Global Radiation and Its Implications for Modeling Canopy Photosynthesis Part I. Components of Incoming Radiation. Agric. For. Meteorol. 1986, 38, 217–229. [Google Scholar] [CrossRef]
  53. Sloane, D.; Morgan, S.P. An Introduction to Categorical Data Analysis. Annu. Rev. Sociol. 1996, 22, 351–375. [Google Scholar] [CrossRef]
  54. Mansfield, E.R.; Helms, B.P. Detecting Multicollinearity. Am. Stat. 1982, 36, 158–160. [Google Scholar] [CrossRef]
  55. Dubra, J.; Echenique, F. Information Is Not about Measurability. Math. Soc. Sci. 2004, 47, 177–185. [Google Scholar] [CrossRef]
  56. Guo, Y.; Barnett, A.G.; Pan, X.; Yu, W.; Tong, S. The Impact of Temperature on Mortality in Tianjin, China: A Case-Crossover Design with a Distributed Lag Nonlinear Model. Environ. Health Perspect. 2011, 119, 1719–1725. [Google Scholar] [CrossRef] [PubMed]
  57. Ebbensgaard, C.L. Illuminights: A Sensory Study of Illuminated Urban Environments in Copenhagen. Space Cult. 2015, 18, 112–131. [Google Scholar] [CrossRef]
  58. van Rijswijk, L.; Haans, A. Illuminating for Safety: Investigating the Role of Lighting Appraisals on the Perception of Safety in the Urban Environment. Environ. Behav. 2018, 50, 889–912. [Google Scholar] [CrossRef]
  59. Ziegler, R.; Mitchell, D.B. Aging and Fear of Crime: An Experimental Approach to an Apparent Paradox. Exp. Aging Res. 2003, 29, 173–187. [Google Scholar] [CrossRef]
  60. Baker, M.H.; Nienstedt, B.C.; Everett, R.S.; McCleary, R. The Impact of a Crime Wave: Perceptions, Fear, and Confidence in the Police. Law. Soc. Rev. 1983, 17, 319–335. [Google Scholar] [CrossRef]
  61. Fein, G.; Mcgillivray, S.; Finn, P. Older Adults Make Less Advantageous Decisions than Younger Adults: Cognitive and Psychological Correlates. J. Int. Neuropsychol. Soc. 2007, 13, 480–489. [Google Scholar] [CrossRef] [PubMed]
  62. Mata, R.; Josef, A.K.; Samanez-Larkin, G.R.; Hertwig, R. Age Differences in Risky Choice: A Meta-analysis. Ann. N. Y. Acad. Sci. 2011, 1235, 18–29. [Google Scholar] [CrossRef]
  63. Ceccato, V.; Loukaitou-Sideris, A. Fear of Sexual Harassment and Its Impact on Safety Perceptions in Transit Environments: A Global Perspective. Violence Against Women 2022, 28, 26–48. [Google Scholar] [CrossRef]
  64. Masson-Delmotte, V.; Zhai, P.; Pirani, A.; Connors, S.L.; Clotilde, P.; Chen, Y.; Goldfarb, L.; Gomis, M.I.; Matthews, J.B.R.; Berger, S.; et al. Climate Change 2021—The Physical Science Basis—Intergovernmental Panel on Climate Change (IPCC); Cambridge University Press: Cambridge, UK, 2023; ISBN 9781009157896. [Google Scholar]
  65. Vanky, A.P.; Verma, S.K.; Courtney, T.K.; Santi, P.; Ratti, C. Effect of Weather on Pedestrian Trip Count and Duration: City-Scale Evaluations Using Mobile Phone Application Data. Prev. Med. Rep. 2017, 8, 30–37. [Google Scholar] [CrossRef]
  66. Boyce, P.R.; Eklund, N.H.; Hamilton, B.J.; Bruno, L.D. Perceptions of Safety at Night in Different Lighting Conditions. Light. Res. Technol. 2000, 32, 79–91. [Google Scholar] [CrossRef]
  67. Fotios, S.; Monteiro, A.L.; Uttley, J. Evaluation of Pedestrian Reassurance Gained by Higher Illuminances in Residential Streets Using the Day–Dark Approach. Light. Res. Technol. 2019, 51, 557–575. [Google Scholar] [CrossRef]
  68. Hess, F.; Salze, P.; Weber, C.; Feuillet, T.; Charreire, H.; Menai, M.; Perchoux, C.; Nazare, J.-A.; Simon, C.; Oppert, J.-M.; et al. Active Mobility and Environment: A Pilot Qualitative Study for the Design of a New Questionnaire. PLoS ONE 2017, 12, e0168986. [Google Scholar] [CrossRef] [PubMed]
  69. Raifman, M.; Lambert, K.F.; Levy, J.I.; Kinney, P.L. Mortality Implications of Increased Active Mobility for a Proposed Regional Transportation Emission Cap-and-Invest Program. J. Urban Health 2021, 98, 315–327. [Google Scholar] [CrossRef]
  70. United Nations. THE 17 GOALS | Sustainable Development. Available online: https://sdgs.un.org/goals (accessed on 12 June 2024).
  71. Johansson, M.; Pedersen, E.; Maleetipwan-Mattsson, P.; Kuhn, L.; Laike, T. Perceived Outdoor Lighting Quality (POLQ): A Lighting Assessment Tool. J. Environ. Psychol. 2014, 39, 14–21. [Google Scholar] [CrossRef]
  72. Cogoni, C.; Carnaghi, A.; Silani, G. Reduced Shared Emotional Representations toward Women Revealing More Skin. Cogn. Emot. 2021, 35, 225–240. [Google Scholar] [CrossRef] [PubMed]
  73. Sweater-Hickcox, K.; Narendran, N.; Bullough, J.; Freyssinier, J. Effect of Different Coloured Luminous Surrounds on LED Discomfort Glare Perception. Light. Res. Technol. 2013, 45, 464–475. [Google Scholar] [CrossRef]
  74. Senthilkumar, S.; Brindha, K.; Jena, A. Automated Intelligent Public Lighting System. Int. J. Internet Technol. Secur. Trans. 2020, 10, 618. [Google Scholar] [CrossRef]
Figure 1. The weather, FoS, and their secondary impacts (Note: H1, H2, and H3 refer to the research hypotheses discussed further in this paper; arrows signify inter-factor links).
Sustainability 16 10402 g001
Figure 2. An example of a typical survey route in the ‘HaTsafon HaHadash’ neighborhood in Tel Aviv-Yafo (the survey route contains 27 survey points marked by the purple dots on the map).
Sustainability 16 10402 g002
Figure 3. Probabilities of different FoS assessment estimates for different cities under study. (A) cumulative probability and (B) probability density function.
Sustainability 16 10402 g003
Figure 4. Probabilities of feeling safe or very safe (FoS ≥ 2) estimated for different age and gender groups at different outdoor temperatures (A) and different levels of relative humidity (B).
Sustainability 16 10402 g004aSustainability 16 10402 g004b
Figure 5. The relative contribution of different factors to the explained variance in FoS. Notes: Estimated using Model 1 in Table 2. The variables are sorted in order of decreasing contributions to the Cox and Snell R2, with the relative contribution of the strongest variable horizontal illumination (illuminance, ln), conditionally set at 100.
Sustainability 16 10402 g005
Figure 6. The tradeoff between the horizontal illuminance and temperature (A) and the horizontal illuminance and relative humidity (B) calculated on the condition that the probability of feeling safe (FoS ≥ 2) is equal to 0.75.
Sustainability 16 10402 g006
Table 1. The descriptive statistics of the research variables.
A. Number of Observations (Discrete and Categorical Variables)
VariableNumber of Observers or Measurements%Number of Observations%
Feeling of safety (FoS) 30,216100.00
      • Feel very safe (FoS = 3)--896029.65
      • Feel reasonably safe (FoS = 2) --13,66045.21
      • Feel little unsafe (FoS = 1) --622920.62
      • Feel unsafe (FoS = 0) --13674.52
Location factors23210030,216100
City
      • Tel Aviv-Yafo (ref.) 10645.6917,71758.63
      • Haifa 4921.12654921.68
      • Beersheba 7733.19595019.69
Traffic
      • Sparse traffic (ref.) 13759.05--
      • Average traffic 6829.31--
      • Intense traffic 2711.64--
Vegetation
      • No vegetation (ref.) 9741.81--
      • Sparse vegetation 10545.26--
      • Dense vegetation 3012.93--
Individual factors49110030,216100
Age
      • 18–40 (ref.) 26854.5816,79655.58
      • 41–60 17936.4610,33634.21
      • 61+ 448.96308410.21
Gender
      • Female (ref.) 22746.2312,79342.34
      • Male 26453.7717,42357.66
Country of birth
      • Israel (ref.) 42185.7425,81185.42
      • Other countries 7014.26440514.58
Education (years of schooling)491100--
Temporal factors
Day of week62310030,216100
      • Weekday 41165.9721,66271.69
      • Weekend 21234.03855428.31
Assessment time63410030,216100
      • Before 22.00 42166.4021,76372.02
      • After 22.00 21333.60845327.98
B. Continuous variables, by city
VariableMeanSDMinMax
Illuminance—horizontal (ln)
      • Tel Aviv-Yafo (ref.) 2.111.24−1.664.30
      • Haifa 2.271.24−0.514.36
      • Beersheba 2.131.07−0.654.24
      • All 2.151.21−1.664.36
Temperature, °C
      • Tel Aviv-Yafo (ref.) 20.224.7610.2029.20
      • Haifa 21.594.7110.8028.60
      • Beersheba 18.455.0310.8027.50
      • All 20.174.9110.2029.20
Relative humidity (RH), %
      • Tel Aviv-Yafo (ref.) 66.8613.1413.8093.40
      • Haifa 67.5414.6718.3096.00
      • Beersheba 59.2813.8714.0082.00
      • All 65.5113.9813.8096.00
C. Categorical variables, by city
TrafficSparse trafficAverage trafficIntense trafficGrand total
      • Tel Aviv-Yafo 11,9862788294317,717
      • Haifa 357323805966549
      • Beersheba 286226304585950
      • Grand total 18,4217798399730,216
VegetationNo vegetationSparse vegetationDense vegetationGrand total
      • Tel Aviv-Yafo 468510,907212517,717
      • Haifa 386620036806549
      • Beersheba 310619169285950
      • Grand total 11,65714,826373330,216
Age18–4041–6061+Grand total
      • Tel Aviv-Yafo 87376913206717,717
      • Haifa 351624336006549
      • Beersheba 45439904175950
      • Grand total 16,79610,336308430,216
Country of birth-IsraelOther countriesGrand total
      • Tel Aviv-Yafo 209615,62117,717
      • Haifa 122653236549
      • Beersheba 108348675950
      • Grand total 440525,81130,216
Day of the week-WeekdayWeekendGrand total
      • Tel Aviv-Yafo 12,470524717,717
      • Haifa 447120786549
      • Beersheba 472112295950
      • Grand total 21,662855430,216
Table 2. The factors affecting FoS for pedestrians (Method: multiple ordered logistic regression; the dependent variable—FoS measured on a four-point Likert scale: 0—feel very unsafe; 1—feel slightly unsafe; 2—feel reasonably safe; and 3—feel very safe).
PredictorModel 1Model 2
B t-ValueB t-Value
Weather attributes
      temperature (°C) 0.0948.717 ***0.0524.501 ***
      temperature^2 −0.003−9.932 ***−1.16 × 10⁻³−3.842 ***
      relative humidity (%)0.0067.675 ***4.66 × 10−35.585 ***
Illumination
Illuminance—horizontal (Ln)0.35237.379 ***0.47546.945 ***
Locational and environmental factors
City dummies (ref. = Tel Aviv-Yafo)
      Haifa−0.134−4.573 ***--
      Beersheba−0.403−12.889 ***--
Traffic density (ref. = sparse traffic)
      average traffic 0.35713.184 ***0.46216.410 ***
      heavy traffic 0.37010.921 ***0.59516.254 ***
Vegetation (ref. = no vegetation)
      sparse vegetation−0.069−2.827 ***−0.118−4.697 ***
      dense vegetation−0.194−5.342 ***−0.251−6.480 ***
Individual level factors
Age group (ref. = 60+)
      18–40 yo (Age1)−0.084−1.766 *--
      40–59 yo (Age2)0.0981.940 *--
Gender (ref. = Male)
· Female0.5187.134 ***--
Interaction terms:
·   Age1 * Gender−0.794−10.118 ***
·   Age2 * Gender−0.615−7.401 ***
Education (years of schooling)0.0256.592 ***--
Country of birth (ref. = Israel)
      other countries0.0682.120 **--
Temporal factors
Day of the week (ref. = weekend)
      weekday−0.069−2.807 ***0.0863.273 ***
Assessment time (ref. = after 22:00)
      before 22:000.1355.142 ***0.1324.746 ***
Intercepts
      α1 (0|1)−1.060−130.606 ***−2.003−22.921 ***
      α2 (1|2)0.98935.947 ***0.4124.525 ***
      α3 (2|3)3.09099.947 ***3.21534.453 ***
Number of observations 30,21630,216
  −2 log-likelihood34,383.08028,269.040
AIC68,810.17057,544.070
*** statistically significant at 1% level; ** statistically significant at 5% level; * statistically significant at 10% level; Notes: regression coefficients; Models 1 and 2—pooled the effects of illuminance, temperature, and humidity effects; Models 2—include the fixed effects.
Table 3. The factors affecting FoS for pedestrians (Method: multiple ordered logistic regression); the dependent variable—FoS, measured on a four-point Likert scale: 0—Feel very unsafe; 1—Feel slightly unsafe; 2—Feel reasonably safe; and 3—Feel very safe.
PredictorModel 3Model 4
B t-ValueB t-Value
Weather attributes
· temperature (°C)|Tel Aviv−0.054−4.233 ***0.21214.900 ***
· temperature^2|Tel Aviv4.974 × 10−41.452 ns−5.27 × 10⁻³−13.871 ***
· temperature (°C)|Haifa0.45123.578 ***0.0834.849 ***
· temperature^2|Haifa−0.011−21.581 ***−1.31 × 10⁻³−2.683 ***
· temperature (°C)|Beersheba0.0261.373 ns0.1418.394 ***
· temperature^2|Beersheba−0.001−1.182 ns−4.78 × 10⁻³−9.884 ***
· relative humidity (%)|Tel Aviv0.2312.243 **−0.170−1.610
· relative humidity (%)|Haifa1.60610.822 ***1.38710.642 ***
· relative humidity (%)|Beersheba0.1420.857 ns1.1669.254 ***
Illuminance|City
Illuminance—horizontal (Ln)|Tel Aviv0.36130.759 ***0.48037.808 ***
Illuminance—horizontal (Ln)|Haifa0.24712.814 ***0.34216.551 ***
Illuminance—horizontal (Ln)|Beersheba0.51621.612 ***0.67326.456 ***
Locational and environmental factors
City dummies (ref. = Tel Aviv-Yafo)
· Haifa−5.919−335.223 ***--
· Beersheba−1.798−82.944 ***--
Traffic density (ref. = sparse traffic)
· average traffic 0.32511.880 ***0.42614.462 ***
· heavy traffic 0.38811.435 ***0.60616.483 ***
Vegetation (ref.= no vegetation)
· sparse vegetation−0.044−1.781 *−0.091−3.426 ***
· dense vegetation−0.151−4.119 ***−0.200−5.082 ***
Individual level factors
Age group (ref. = 60+)
· 18–40 yo (Age1)−0.075−1.554 ns--
· 40–59 yo (Age2)0.1072.099 ***--
Gender (ref. = male)
· female0.5557.617 ***--
Interaction terms:
·    Age1 * Gender−0.845−10.714 ***
·    Age2 * Gender−0.660−7.903 ***
Education (years of schooling)0.0266.789 ***--
Country of birth (ref. = Israel)
· other countries0.0591.824 *--
Temporal factors
Day of the week (ref. = weekend)
· weekday−0.084−3.440 ***0.1043.740 ***
Assessment time (ref. = after 22:00)
·    before 22:000.1405.332 ***0.1424.721 ***
Intercepts
· α1 (0|1)−2.816−82.186 ***−0.640−5.942 ***
· α2 (1|2)−0.755−17.816 ***1.78916.243 ***
· α3 (2|3)1.35630.484 ***4.60141.134 ***
Number of observations 30,21630,216
  −2 log-likelihood34,275.95028,199.680
AIC68,611.91057,421.350
*** statistically significant at 1% level; ** statistically significant at 5% level; * statistically significant at 10% level; ns = not significant. Notes: Models 3 and 4—illuminance, temperature, and humidity effects by city; Models 4—include participant fixed effects.
Disclaimer/Publisher’s Note: The statements, opinions and data contained in all publications are solely those of the individual author(s) and contributor(s) and not of MDPI and/or the editor(s). MDPI and/or the editor(s) disclaim responsibility for any injury to people or property resulting from any ideas, methods, instructions or products referred to in the content.

