Abstract
Cross-border power cooperation is considered a pathway for optimal regional use of renewable resources and the reduction of carbon emissions. To enhance such cooperation, it is essential to understand the game behaviors of the involved parties. This study applied evolutionary game theory (EGT) and system dynamics (SD) methods to analyze the factors influencing strategic choices and cooperation benefits in the China–Laos electricity cooperation. An EGT model was first developed to examine the interactive behavior of both parties and the stability of strategies. Subsequently, an SD model of EGT was constructed to simulate the evolutionary game process, explore the intrinsic mechanisms of the evolutionary game, and analyze the factors affecting strategy selection. The results show that: (1) the gaming behaviors cannot be ignored in cross-border power cooperation; (2) compared to the cross-border trade scenario, the strategic cooperation will generate more benefits for the parties involved and thus will be selected as the cooperation game evolves; (3) the initial strategy ratio of both parties is crucial, influencing the direction of strategy evolution and the time to reach equilibrium; (4) the choice of system cooperation strategy is affected by the unit profit of electricity trade, input cost, incremental return, trade volume, transaction cost, excess return, fine for agreement violation, and the ratio of benefit allocation, among which the former three are critical.
1. Introduction
Over the past century, fossil fuel has been the primary driving force for social and economic development. In addition to its contribution to improving people’s quality of life, it also emits substantial amounts of greenhouse gasses [1,2,3], and thus becomes a barrier to the goals of sustainable development [4]. In response to climate change and the Paris Agreement, many countries have set targets for achieving carbon neutrality. Cross-border power cooperation is anticipated to facilitate large-scale power grid interconnection and promote the consumption of clean electricity. This form of cooperation involves collaborative efforts between neighboring countries or regions to address common challenges and promote mutual benefits, particularly in the areas of energy, economic, social, and environmental development [5,6].
Specifically, the cross-border power cooperation between neighboring countries such as China and Laos is expected to enhance the utilization of renewable energy, reduce dependence on fossil fuels, and consequently lower carbon emissions. Such collaboration aims to enhance the sustainability of power supplies. It can also drive the green transformation and sustainable development of the regional economy through resource sharing and infrastructure development. In 2022, in discussing the implementation of the “Action Plan on Building a Community with a Shared Future between China and Laos”, the leaders of China and Laos emphasized the need to “deepen the strategic partnership for China–Laos power cooperation”, which provides a fundamental basis for promoting power cooperation [7].
With China’s rapid economic growth, the country’s electricity consumption is increasing year by year. The whole society’s electricity consumption was around 9224.1 billion kilowatt-hours with a year-on-year increase of 6.7% in 2023 [8]. Although the overall electricity supply and demand are generally balanced, certain regions experience tight supply during peak periods, particularly in the eastern region during winter and summer. Since thermal power accounts for nearly 70% of China’s total power output, reducing carbon emissions in the power industry is crucial for meeting the carbon peak and neutrality targets. In addition to developing domestic renewable energy, importing renewable electricity from neighboring countries is expected to be another potential pathway for carbon emission reduction.
Laos is rich in clean energy, particularly hydropower, which constitutes more than 70% of its total electricity output. In 2021, power output reached 44,915 GWh, of which domestic consumption only accounts for 20% [9]. Electricity exports bring large foreign exchange earnings to Laos, and Laos’ electricity exports are expected to exceed 14,000 megawatts by 2030 [10]. The power industry is the most important industry in Laos. The Lao government has planned to exploit hydropower resources, promote economic development, achieve industrialization and modernization, and strive to build Laos into the “battery of Indochina”. However, Laos faces challenges such as a lag in power grid construction, limited deployment capacity, and significant waste of water during high-water periods, as well as insufficient power supply during dry periods.
In 2020, the total electricity trade volume between China and Laos was 96.75 million kilowatt hours [9]. Cross-border power cooperation between China and Laos can improve the clean energy consumption capabilities of both parties, promote green economic growth, reduce carbon emissions, and achieve a win–win situation. However, without a clear understanding of the stakeholders’ interests and actions through game theory, bilateral power cooperation risks slow progress, with many initiatives remaining only theoretical for a long time. Game theory can be employed to analyze strategic interactions and facilitate resource pooling, thereby accelerating meaningful cooperation. In general, there are the following problems: (1) The market supply of electricity fluctuates over time, and unit pricing is highly subjective. Game theory can be used to analyze the interaction between the two parties in the pricing process. (2) The production, transmission, and consumption of electricity are carried out almost simultaneously, leading to a game relationship between the two parties in terms of transmission planning and trade volume. Game theory helps to understand the mutual interactions in this process. (3) Cross-border power cooperation requires the investment of various resources such as labor and capital. The allocation of cooperation costs and the distribution of cooperation benefits are key factors in determining whether the cooperation can proceed smoothly. Game theory can be applied to address these issues. (4) In the process of cooperation, the development of power resources and the construction of infrastructure have the characteristics of positive externalities and public goods, leading to the “free-rider” phenomenon, which can undermine the smooth progress of cooperation. Additionally, cooperation brings excess income, and the distribution of this income also constitutes a game relationship. Game theory can be used to capture the interests and actions of such different stakeholders, in the process of cooperation.
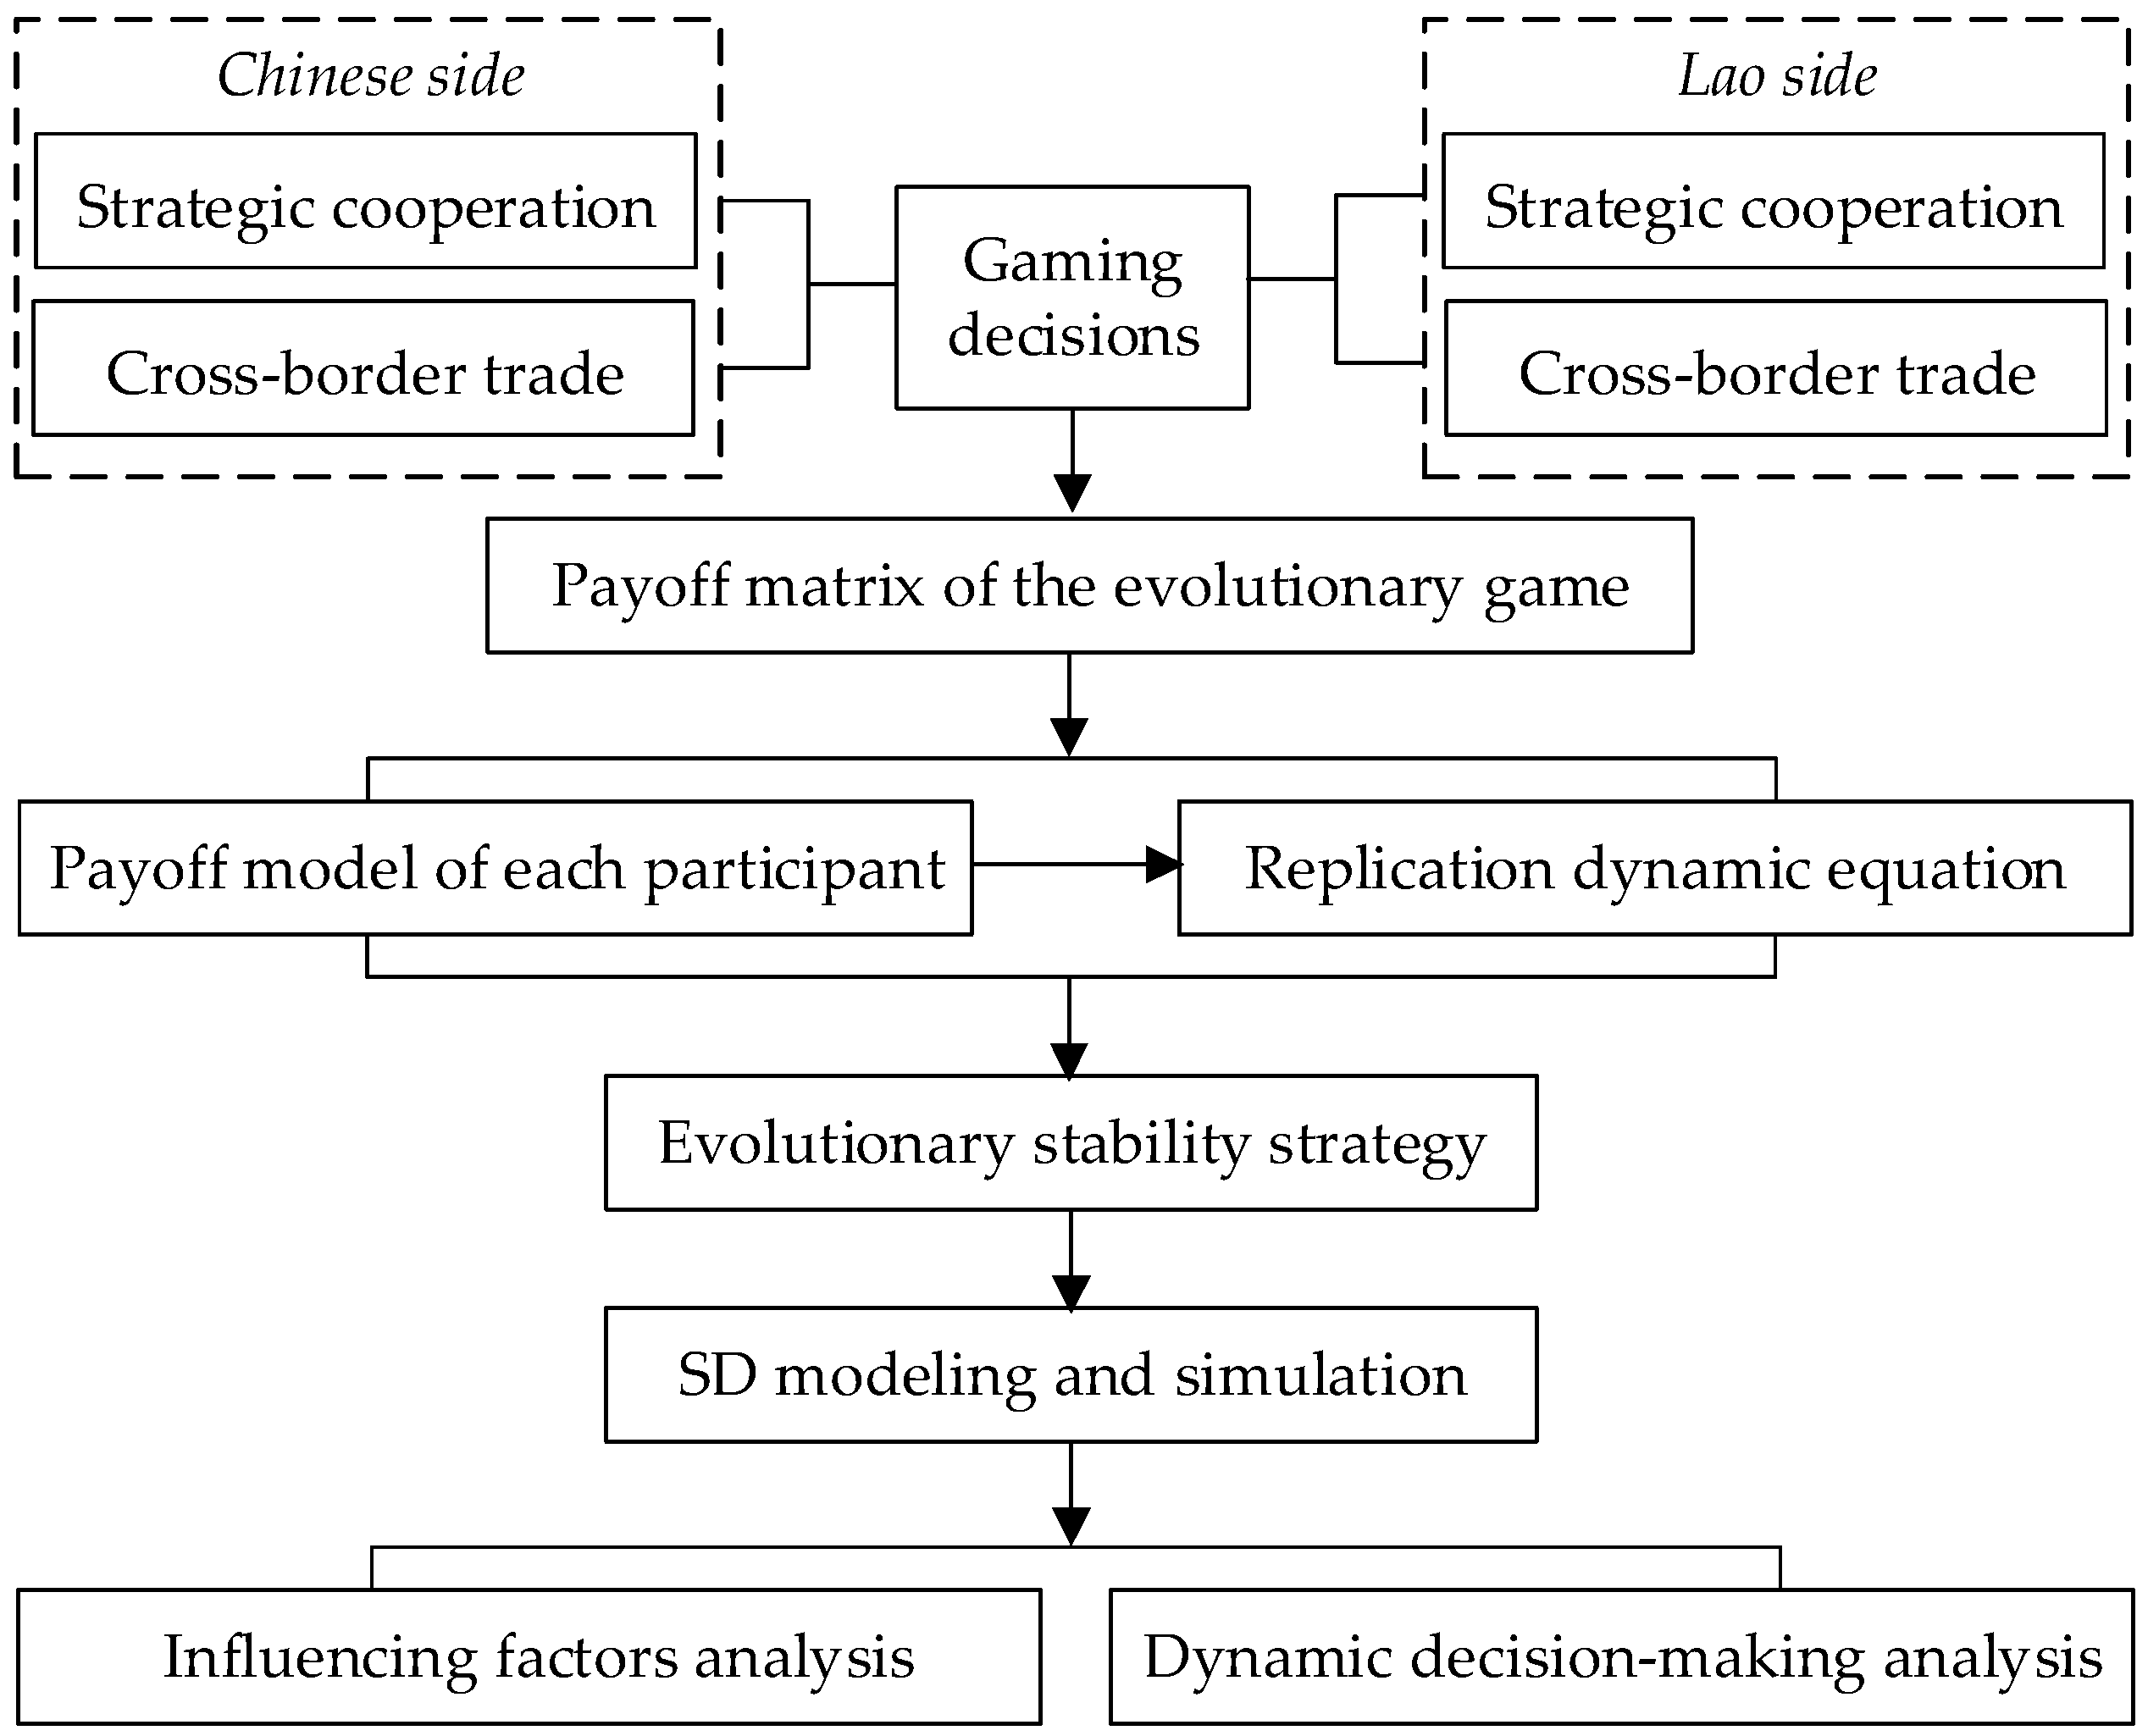
The primary focus of this study is to promote China–Laos power cooperation by understanding the strategic behaviors of both parties. This study first establishes an evolutionary game model to analyze the factors influencing the choice and stability of power cooperation strategies between China and Laos; subsequently, a simulation using Vensim PLE is conducted to illustrate the internal evolution mechanism, and a sensitivity analysis is performed to identify the critical factors affecting strategy selection and cooperation benefits. The introduction to the whole modeling and simulation process regarding the research methodology is depicted in Figure 1. Finally, based on the research findings, some recommendations are proposed to promote China–Laos power cooperation.
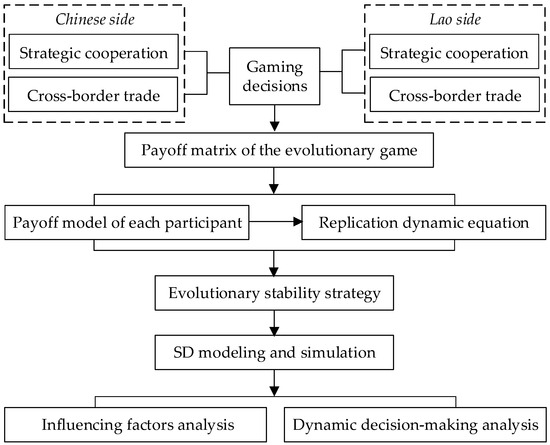
Figure 1.
The introduction to the whole modeling and simulation process regarding the research methodology.
While cross-border power cooperation is considered an effective approach for constructing a low-carbon, clean, and modern energy system [4,11], existing literature on the influencing factors of such cooperation is mainly qualitative and expert subjective evaluation, such as a SWOT-AHP analysis of the influencing factors of cross-border power trade between Bangladesh and neighboring countries [12], and a qualitative analysis of the trade barriers of cross-border power cooperation in South Asia [6]. The contributions of this study are twofold: first, it provides a quantitative understanding of cross-border power cooperation by applying the evolutionary game model and system dynamics model to analyze the strategic choices, evolution paths, and influencing factors of cooperation. Second, while traditional international trade models based on comparative advantage and factor endowments are inadequate for handling the two-way trade phenomenon of electricity [13], this study estimates the benefits for both parties through simulation analysis based on a system dynamics model, thereby providing quantitative evidence to inform policy-making for promoting China–Laos power cooperation.
The remainder of this paper is organized as follows: Section 2 reviews the related literature. Section 3 provides the model assumptions and parameter variables and constructs an evolution model. Section 4 analyzes the evolutionary game model. Section 5 establishes an SD model, conducts simulation analysis, and expounds on the research results. Section 6 draws research conclusions and puts forward recommendations.
2. Literature Review
2.1. Cross-Border Power Cooperation
Cross-border power interconnection and cooperation can enhance the reliability and quality of the overall power supply system and increase the share of renewable energy in total power output [14,15]. To address environmental issues caused by fossil fuel consumption, countries worldwide are accelerating cross-border power cooperation. Such cooperation can significantly improve resource utilization efficiency and the capacity for clean energy consumption in each country. For example, African countries have integrated cross-border resources through models such as the West African Power Pool (WAPP) and the Southern African Power Pool (SAPP), thereby enhancing the stability of power supply and energy security in the region [16,17]. Similarly, major power shortages in South Asia have severely constrained the economic growth of the region. However, by implementing appropriate policies, establishing effective institutions, and strengthening grid interconnections, the cross-border power cooperation among Bangladesh, Bhutan, India, and Nepal (BBIN) has not only improved power supply but also accelerated the process of regional economic integration [18]. These successful cross-border power cooperation projects provide valuable experience and a reference for China–Laos cross-border power cooperation.
However, cross-border power cooperation is constrained by interconnected power grids and other electricity infrastructure [13]. In the construction of bilateral or multilateral power grid interconnections, issues such as grid planning and design, project investment, and financing arise [19]. While improving power infrastructure is essential, the establishment of power market transactions and regulatory systems, as well as the coordination of interests, are more complex [20,21]. For example, Europe realized the physical interconnection of power grids very early, but the progress of marketization is slow, mainly because of the slow establishment of related trading and interest coordination systems [20].
Electricity production, transmission, and consumption occur almost simultaneously, leading to potential issues for trading partners in terms of transmission scheduling and trade volume. Chen et al. (2019) considered the uncertainty of renewable energy and the specific characteristics of the cross-border power market in a long-term cross-border power-trading mode [22]. The goal of cross-border power cooperation is regional power market integration. In this process, technical challenges such as real-time power grid operation, transmission congestion, market power impact, temporary transactions, and capacity market auctions arise [23,24,25,26]. Additionally, there are many participants in the electricity market, including but not limited to power generation companies, power transmission companies, government departments, and consumers. Many decisions can only be made if they meet the interests of all involved parties and reach an agreement [27]. Despite extensive analyses of the problems in cross-border power cooperation, few studies have systematically examined the benefits, strategic choices, game behaviors, and influencing factors on both sides of such a cooperation.
2.2. Application of Evolutionary Game in Electricity Market
Game theory is frequently employed to assist rational individuals in making optimal choices in interactive processes. However, classical game theory assumes that participants are fully rational—a premise that is challenging to realize in reality due to incomplete information [28]. Evolutionary game theory expands on the ideas of classical game theory by incorporating population ecology. This approach assumes that participants possess bounded rationality, aligning with the principles of biological evolution [29]. The theory originated from the replicator dynamics proposed by Taylor and Jonker in 1978 [30]. Evolutionary game theory combines classical game theory with dynamic evolutionary theory, using the principles of evolution as its foundation. It views the subjects in the game as rational individuals who adapt their strategies according to environmental changes, gradually reaching a state of equilibrium, which is more reflective of real-world scenarios. Although initially applied in biology [31], evolutionary game theory is now widely used in political science [32] and sociology [33], particularly in analyzing competition and cooperation mechanisms in supply chains [34]. It has also been applied to study the evolutionary game between the government and enterprises in the context of carbon emissions under environmental protection tax systems [35], and to examine the strategic choices of manufacturers in response to government carbon taxes, subsidies, and other environmental policies [36]. This theory offers an effective framework for understanding strategy adjustments and evolutionary processes in the complex systems of cross-border power cooperation.
The evolutionary game theory is mainly applied to study the dynamic behavioral strategies and bidding strategies in the electricity market. It was used to analyze the game behavior of power generation entities using a non-cooperative game model and further applied an evolutionary game model to explore the interactive behavior on the user side [37], and to solve the Nash equilibrium point, and analyze the influence of different market parameters on its stability, considering different behavioral decisions of power generation enterprises [38]. Peng et al. (2019) used this method to simulate the dynamic evolutionary game process of bidding strategies of different power generation companies under the new energy grid-connected environment [39]. In addition, this method was also used to study the renewable energy portfolio standards and green certificate transactions in renewable energy power markets [40,41].
In some simulation games, such as Cesim SimPower, there is an emphasis on direct competition between teams, which aligns with the competitive environment described in evolutionary game theory [42]. Players need to adjust their strategies in a dynamic market to achieve optimal results. This simulation demonstrates how participants adjust their decisions based on changes in the environment. Additionally, the power system model developed by Toba et al. (2018) [43] also emphasizes the optimization of complex networks, continuously adjusting strategies to determine the best solution. This simulation can also help players understand and apply strategy adjustments to solve conflicts among economic efficiency, reliability, and environmental responsibility in power systems.
Since evolutionary game theory is applicable to studying the game behaviors, strategy choices, and influencing factors in the process of power cooperation between China and Laos, it can effectively be used to analyze their interactions in a dynamic and complex environment.
2.3. Applications of System Dynamics
The evolutionary game model of a China–Laos electric power cooperation can obtain multiple evolutionarily stable equilibrium solutions, but it fails to analyze long-term strategic stability and to intuitively and accurately express the evolutionary rules using only evolutionary game analysis methods. System dynamics (SD) is a methodology used to understand and model the behavior of complex systems over time [44]. It employs various tools and techniques to represent and analyze the dynamic interactions within a system. The SD model can not only handle high-order, complex time-varying system problems, but also quantitatively adjust the relationship between the internal influencing factors of the system and analyze the system structure and the mechanism of the influencing factors [45,46,47,48]. In recent years, SD has been widely applied in various fields. For example, Shen et al. (2022) established an SD model incorporating economic, resource, and population dynamics to study the regional green development path of Zhejiang Province [49]. Considering the increase in urban population and resource scarcity, Li et al. (2022) developed an SD model that included the production and consumption of food, energy, and water, and conducted a multi-scenario analysis for Beijing [50].
Some scholars have also applied the SD model to the power industry. Karbasioun et al. (2023) studied the transition from fossil to new energy generation based on an SD model and analyzed the impact of technology, cost, and public acceptance of government behavior in three scenarios [51]. Heidari et al. (2023) considered the intrinsic and economic attributes of government policies to study the impact of different policies on photovoltaic development by constructing an SD model of a photovoltaic ecosystem [52]. Forrester (1958) first proposed the application of system dynamics to evolutionary games, providing a new perspective for studying economic issues [53]. Li et al. (2022) established a tripartite evolutionary game model between the government, the community, and residents, and simulated it through the SD model to analyze the impact of various strategies on the game process and game equilibrium [54]. Zhang et al. (2023) established a four-party evolutionary game model including organizations, managers, miners, and groups [55]. Then, they combined it with system dynamics modeling to analyze the interaction and evolution of behavioral strategies of stakeholders in the behavioral safety management system of coal mines.
Therefore, the simulation analysis of the China–Laos power cooperation evolution game system based on the system dynamics method is conducive to solving the problems of the evolution equilibrium state and the abstraction of the evolution law. While few studies have established evolutionary game models to analyze the factors that affect strategy selection, this study constructs an evolutionary game model to analyze the strategy evolution trend and stable equilibrium results, uses system dynamics simulation to display the evolutionary equilibrium state and evolution law intuitively and quantitatively analyzes the factors influencing the choice of cooperation strategies between the two sides to promote a win–win situation.
3. Evolutionary Game Model Construction
3.1. Problem Description
The players of the China–Laos power cooperation are the Chinese government and its affiliated China Southern Power Grid (CSG) (hereinafter referred to as the Chinese side) and the Lao government and its affiliated Lao State Electricity (EDL) company (hereinafter referred to as the Lao side). The behavior strategies of both sides include cross-border trade scenarios and strategic cooperation scenarios. The cross-border trade scenario refers to the communication and determination of cross-border power trade details based on power demand. In this case, the average transaction cost of power trade is relatively high, and the trade volume of power is small. The problem faced in the cross-border trade scenario is that there are large differences between the two parties, resulting in high cooperation costs and difficulty in achieving the expected cooperation results. The strategic cooperation scenario refers to the in-depth cooperation between the two parties based on the agreement reached, including cooperation in investment and construction for the exploitation of power resources, technological integration, construction of regional power markets, the establishment of coordination mechanisms, etc., which requires China and Laos to invest various resources. Due to the standardization of technical standards, trading rules, and other institutional arrangements, the total volume of cross-border power trade will become larger, the average transaction cost will reduce, and it will bring excess returns.
3.2. Evolutionary Game Model Assumptions and Parameter Descriptions
Based on bounded rationality, the evolutionary game model is more realistic and universal, and it can better explore the decision-making interaction process between China and Laos in their power cooperation. This study establishes an evolutionary game model for a China–Laos power cooperation and proposes the following assumptions:
Assumption 1.
assume that the main players of the game, China and Laos, are each a “population” with bounded rationality, and adjust their strategies through continuous learning. Assume that the strategy set is (cross-border trade scenario; strategic cooperation scenario), the probability of China’s strategic cooperation scenario is , and the probability of cross-border trade scenario is ; assume that the probability of Laos’ strategic cooperation scenario is , and the probability of cross-border trade scenario is , where , and are all functions of time.
Assumption 2.
when both China and Laos adopt the strategic cooperation scenario strategy, the electricity trade volume of both parties is , and the transaction cost per unit of power trade is . In strategic cooperation, both parties need to invest resources such as work force and capital. The cooperation costs for China and Laos are and , respectively. Similarly, the incremental benefits from cooperation, such as in the further development of power resources, are and , respectively. When both parties adopt a strategic cooperation scenario, they will obtain excess returns (0 < ), such as the reduction of carbon dioxide. In this case, the Chinese side’s income is ; the Lao side’s income is , and is the distribution coefficient of the excess income between China and Laos (0 < < 1).
Assumption 3.
in the process of promoting China–Laos electric power cooperation, we are facing the issue that each party maximizes its own benefits and may renege on the cooperation contract. In order to avoid this problem, when signing the strategic cooperation contract, the two parties agree to impose a fine (0 < ) on the one that violates the contract to compensate and motivate the one that adopts the strategic cooperation scenario strategy. The party that chooses the strategic cooperation scenario strategy will invest in cooperation costs but will gain incremental benefits and will be compensated by fines; the side that chooses the cross-border trade scenario strategy will be fined by an amount of . Therefore, when the strategic combination of the Chinese side and the Lao side is (strategic cooperation scenario, cross-border trade scenario), the Chinese side’s benefit is and the Lao side’s benefit is ; when the strategic combination of the Chinese side and the Lao side is (cross-border trade scenario, strategic cooperation Scenario), the Chinese party’s benefit is and the Lao party’s benefit is .
Assumption 4.

when China and Laos adopt the cross-border trade scenario strategy, the electricity trade volume of both parties is , China’s benefit per unit trade volume is , Laos’ benefit per unit trade volume is , and the transaction cost per unit trade volume is . Both sides share transaction costs equally. and are related to production cost, selling price and other factors. In this case, the basic benefit of Chinese side is , and the basic benefit of Lao side is . The relevant parameter settings and their meanings are shown in Table 1.
Table 1.
Basic parameter settings and their definitions.
According to the assumption and parameter descriptions in the previous section, the payoff matrix of the evolutionary game model about China–Laos power cooperation is shown in Table 2.
Table 2.
Payoff matrix of the China–Laos power cooperation evolutionary game.
4. Analysis of the Evolutionary Game Model
4.1. Evolutionary Stability Analysis of Chinese Side Strategy
According to the evolutionary principle, the evolution of strategies can be described by differential equations [56,57]. Assume that the expected benefit of China under the “strategic cooperation scenario” strategy is , the expected benefit under the “cross-border trade scenario” strategy is , and the average expected benefit is . From the payoff matrix in Table 2, we can derive the following:
The replication dynamic equation for the probability of the Chinese side choosing strategic cooperation scenario is:
According to the stability principle of differential equations, the point that meet the conditions of and is the evolutionary equilibrium point. Let , we can obtain , , and , so these are the evolutionary equilibrium points of the Chinese replication dynamic equation. The first order partial derivative of is:
where indicates the probability of the Lao side choosing the “strategic cooperation scenario” strategy, and to be meaningful, so there are the following three situations:
- (I)
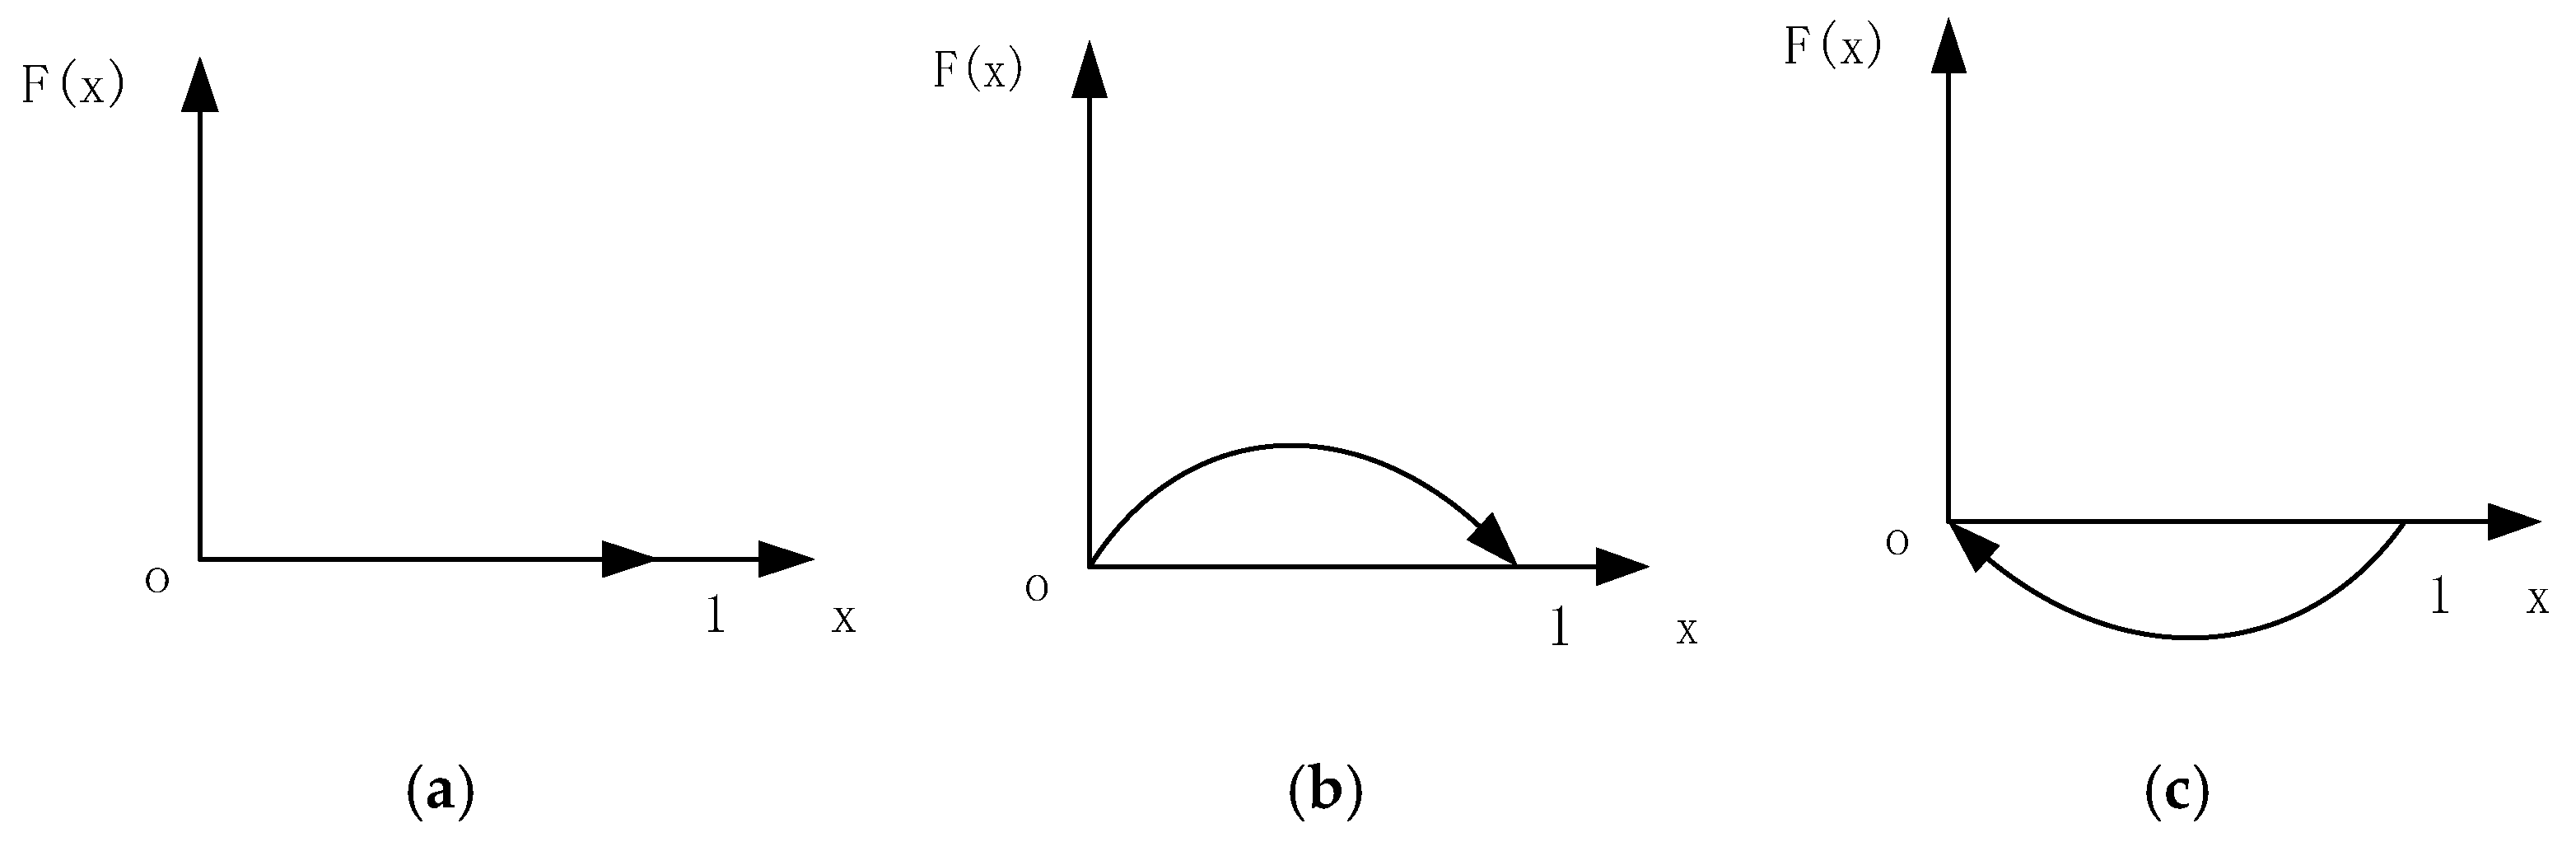
- When , that is, the probability that the Lao side chooses the strategy of “strategic cooperation scenario” is , we can obtain and . At this point, for all , are Chinese side’s Evolutionary Stable Strategies (ESS). Thus, the probability that China chooses the strategy of “strategic cooperation scenario” will not change with time. The evolutionary phase diagram for this situation is shown in Figure 2a.
 Figure 2. Evolutionary phase diagrams of the Chinese side in three situations. (a) ; (b) ; (c) .
 - (II)
- When , that is, the probability that the Lao side chooses the strategy of “strategic cooperation scenario” is greater than , we can obtain , . Then, = 1 is the evolutionary stability strategy of the Chinese side, and the Chinese side will choose the “strategic cooperation scenario” strategy. The evolutionary phase diagram for this situation is shown in Figure 2b.
- (III)
- When , that is, the probability that the Lao side chooses the strategy of “strategic cooperation scenario” is less than , we can obtain , . Then, is the evolutionary stability strategy of the Chinese side, and the Chinese side will choose the “cross-border trade scenario” strategy. The evolutionary phase diagram for this situation is shown in Figure 2c.
To sum up, the evolutionary stability strategy phase diagram of Chinese side in the above three situations is shown in Figure 2.
4.2. Evolutionary Stability Analysis of the Lao Side Strategy
Assuming that the Lao side adopts the strategy of “strategic cooperation scenario” with the expected benefit of , adopts the strategy of “cross-border trade scenario” strategy with the expected benefit of , and the average expected benefit of the Lao side’s strategy choice is , from the payoff matrix in Table 2, we can derive the following:
The replication dynamic equation for the probability of the Lao side choosing the strategic cooperation scenario is:
According to the stability principle of differential equations, the point that meets the conditions of and is the evolutionary equilibrium point. Let , we can obtain , , and , so these are the evolutionary equilibrium points of the Lao side’s replication dynamic equation. The first order partial derivative of is:
where indicates the probability that the Chinese side chooses the “strategic cooperation scenario” strategy, and to be meaningful, so there are also the following three situations.
The Lao side will have similar stability strategy with similar evolutionary phase diagram as shown in Figure 2, although its expected benefit may be different.
4.3. Stability Analysis of the Combination Strategy of China and Laos
From the above analysis, the following five equilibrium points of the evolutionary game system in the China–Laos power cooperation can be obtained: O (0, 0), A (1, 0), B (0, 1), C (1, 1), D (, ), where , . That is established if and only when .
Refer to the discriminant method proposed by Friedman (1991) [58]. The Evolutionarily stable strategy (ESS) needs to meet the following conditions: the trace of the Jacobi matrix (represented by J) is less than 0 ( < 0) and the determinant of the J matrix is greater than 0 ( > 0). So we can find the partial derivatives of and for and , respectively, and establish the Jacobi matrix as:
For the convenience of the research, let , . Further, and corresponding to the five equilibrium points can be obtained. According to the corresponding results of and , the stability analysis results of the evolutionary game can be obtained, as shown in Table 3 below.
Table 3.
Analysis of equilibrium stability in the evolutionary game between China and Laos.
From the above analysis, it can be seen that since D (, ) corresponds to , it does not meet the condition of equilibrium point stability judgment , so D (, ) is a saddle point. Therefore, equilibrium points can only exist between O (0, 0), A (0, 1), B (1, 0), and C (1, 1). However, the signs of and depend on several parameters, and different values of different parameters will produce various stability situations. Therefore, this paper further uses the SD simulation software Vensim PLE 7.2a for simulation analysis to study the effects of various uncertain factors on the evolution process of the game.
5. Simulation and Discussion
5.1. System Dynamics Modeling of Evolutionary Game Model
Although the evolutionary game model can elucidate the process and equilibrium state of a game, it has limitations in illustrating the dynamic decision-making process of the game participants. To address this, our study constructs a dynamic model of a China–Laos power cooperation by integrating evolutionary game analysis with system dynamics (SD) theory. Through simulation, we provide a more intuitive representation of the dynamic changes in strategic choices made by both parties. As an effective tool for studying the behavioral characteristics and feedback mechanisms of a system, SD is particularly suitable for cross-border power cooperation because the decision-making behaviors of the involved parties influence each other. Each party observes and learns from the other’s gains, adjusting its decision-making strategy accordingly. Based on this approach, we developed a corresponding SD model using Vensim PLE software to simulate and analyze the dynamic behavior of this complex system (as shown in Figure 3).
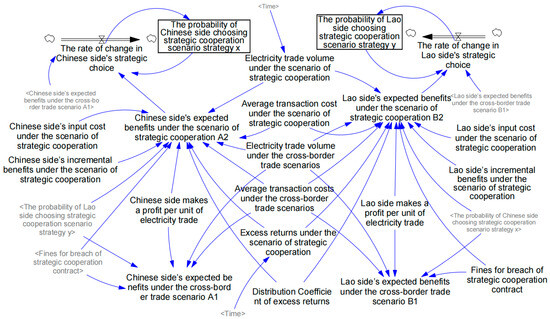
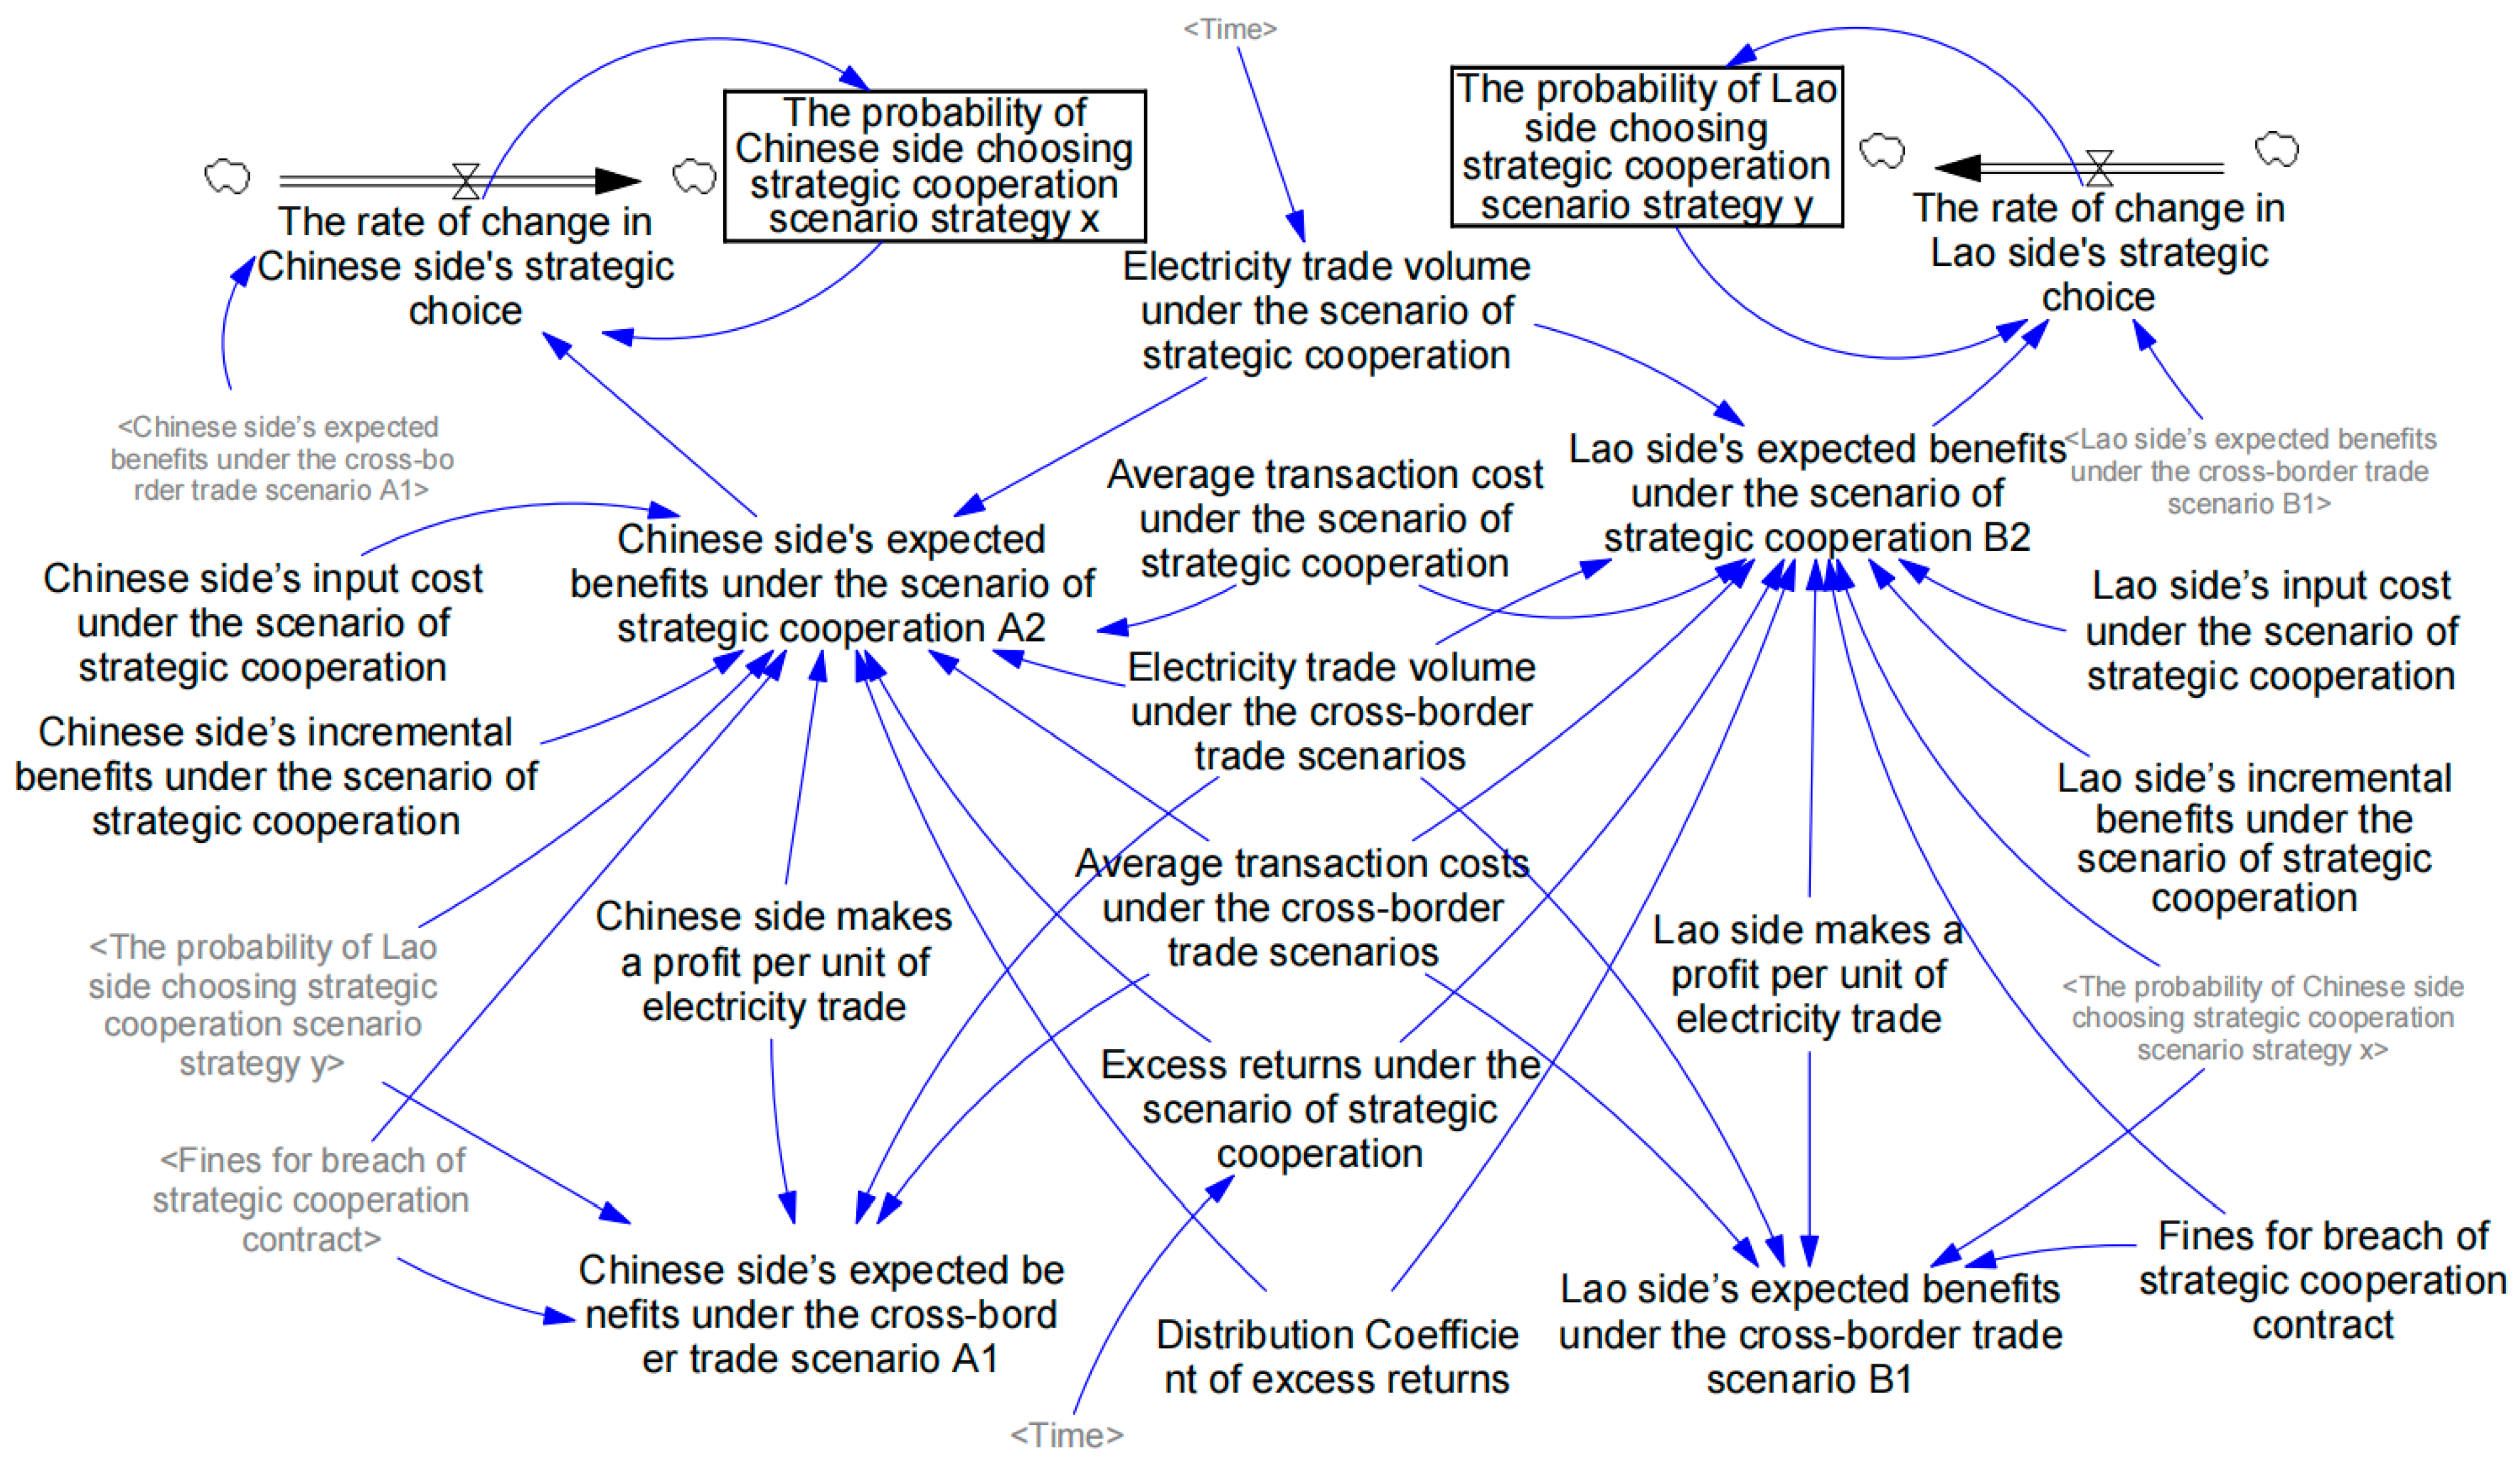
Figure 3.
The system flow diagram of the evolutionary game SD model.
As illustrated in Figure 3, the SD model for the two-player evolutionary game comprises two horizontal variables, two rate variables, thirteen intermediate variables, and thirteen external variables. In particular, the probability of the Chinese side choosing the strategic cooperation scenario strategy and the probability of the Lao side choosing the strategic cooperation scenario strategy are represented by two horizontal variables. The rate of change in the Chinese side’s strategic choice and the rate of change in the Lao side’s strategic choice are represented by two rate variables. The external variables correspond to the values of the variables listed in Table 2. Furthermore, the flow equations and the functional relationships among the horizontal, rate, intermediate, and external variables in the SD model are primarily derived from the game analysis and replication dynamic equations discussed in Section 4, specifically Equations (1)–(10). Then, the SD analysis is conducted, and to ensure that the simulation is closely aligned with the actual situation, we set some key parameters based on the actual data on the China–Laos power trade and the existing literature.
This study utilizes the average transaction volume of the China–Laos electricity trade from 2015 to 2020 as a basis, setting the transaction volume for the cross-border trade scenario at 9.675. Based on the analysis of Laos’ power resource potential, technical potential, and market potential, KHAMSONE (2020) estimated that Laos’ future power export growth rate will be 8% per year [59]. This study is based on the electricity trade volume in 2020 and assumes that the bilateral trade volume increases by 8% each year from 2020 to 2030 as strategic cooperation scenario trade volume . Reasonably set the excess return in 2020 to 1, with an annual growth rate of 5% (based on China’s economic growth rate). Set other parameters based on reality analysis and references [60], [60], [61], [61], , , , , , . Among them, the unit of electricity trade volume is 10 million kWh, the unit of power trade profit and cost is yuan/kWh, and the unit of cost and benefit is 10 million in every year for the next 10 years. We assume that the model start time is INITIAL TIME = 0, end time is FINAL TIME = 10, representing ten years; step size TIME STEP = 0.083, representing January, in line with the actual situation of monthly power transactions. In addition, the initial probabilities and of the strategy choices of China and Laos are set to 0.5 before the model is run.
5.2. Numerical Analysis and Discussion
This study uses Vensim PLE software to simulate and analyze the benefits of cooperation projects, as shown in Figure 4 below.
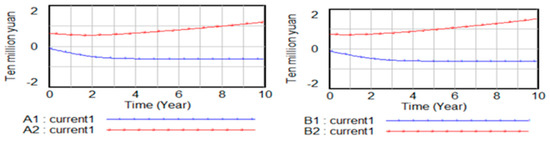
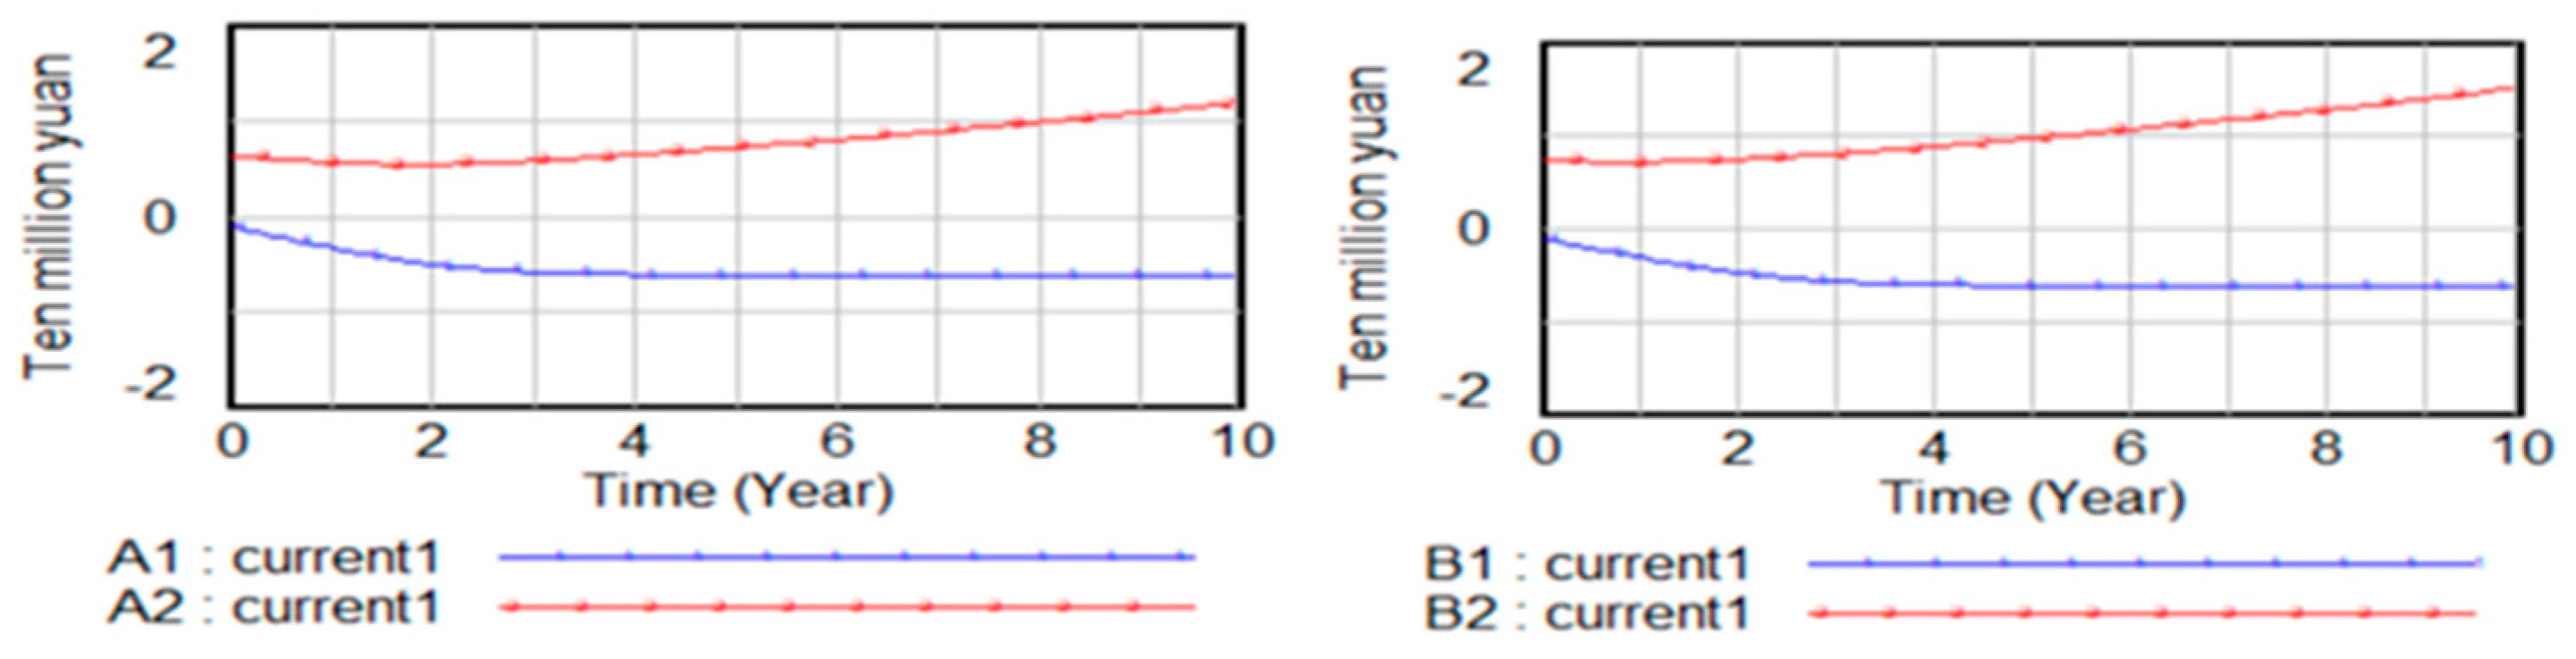
Figure 4.
Simulation benefit under different scenarios for China and Laos.
As the cooperation project progresses, both players will choose a strategic cooperation scenario strategy. By the 10th year, the Chinese side’s income will be CNY 11.92 million, and the Lao side’s income will be CNY 15.17 million. The benefits for both players mainly come from the increase in trade volume, the increase in excess returns, and the incremental benefits brought by cooperation costs, such as the development of power resources. If one player chooses the cross-border trade scenario, the benefit will be CNY −6.16 million, of which the power trade benefit will be CNY 3.84 million, and the penalty for violating the cooperation contract will be CNY 10 million.
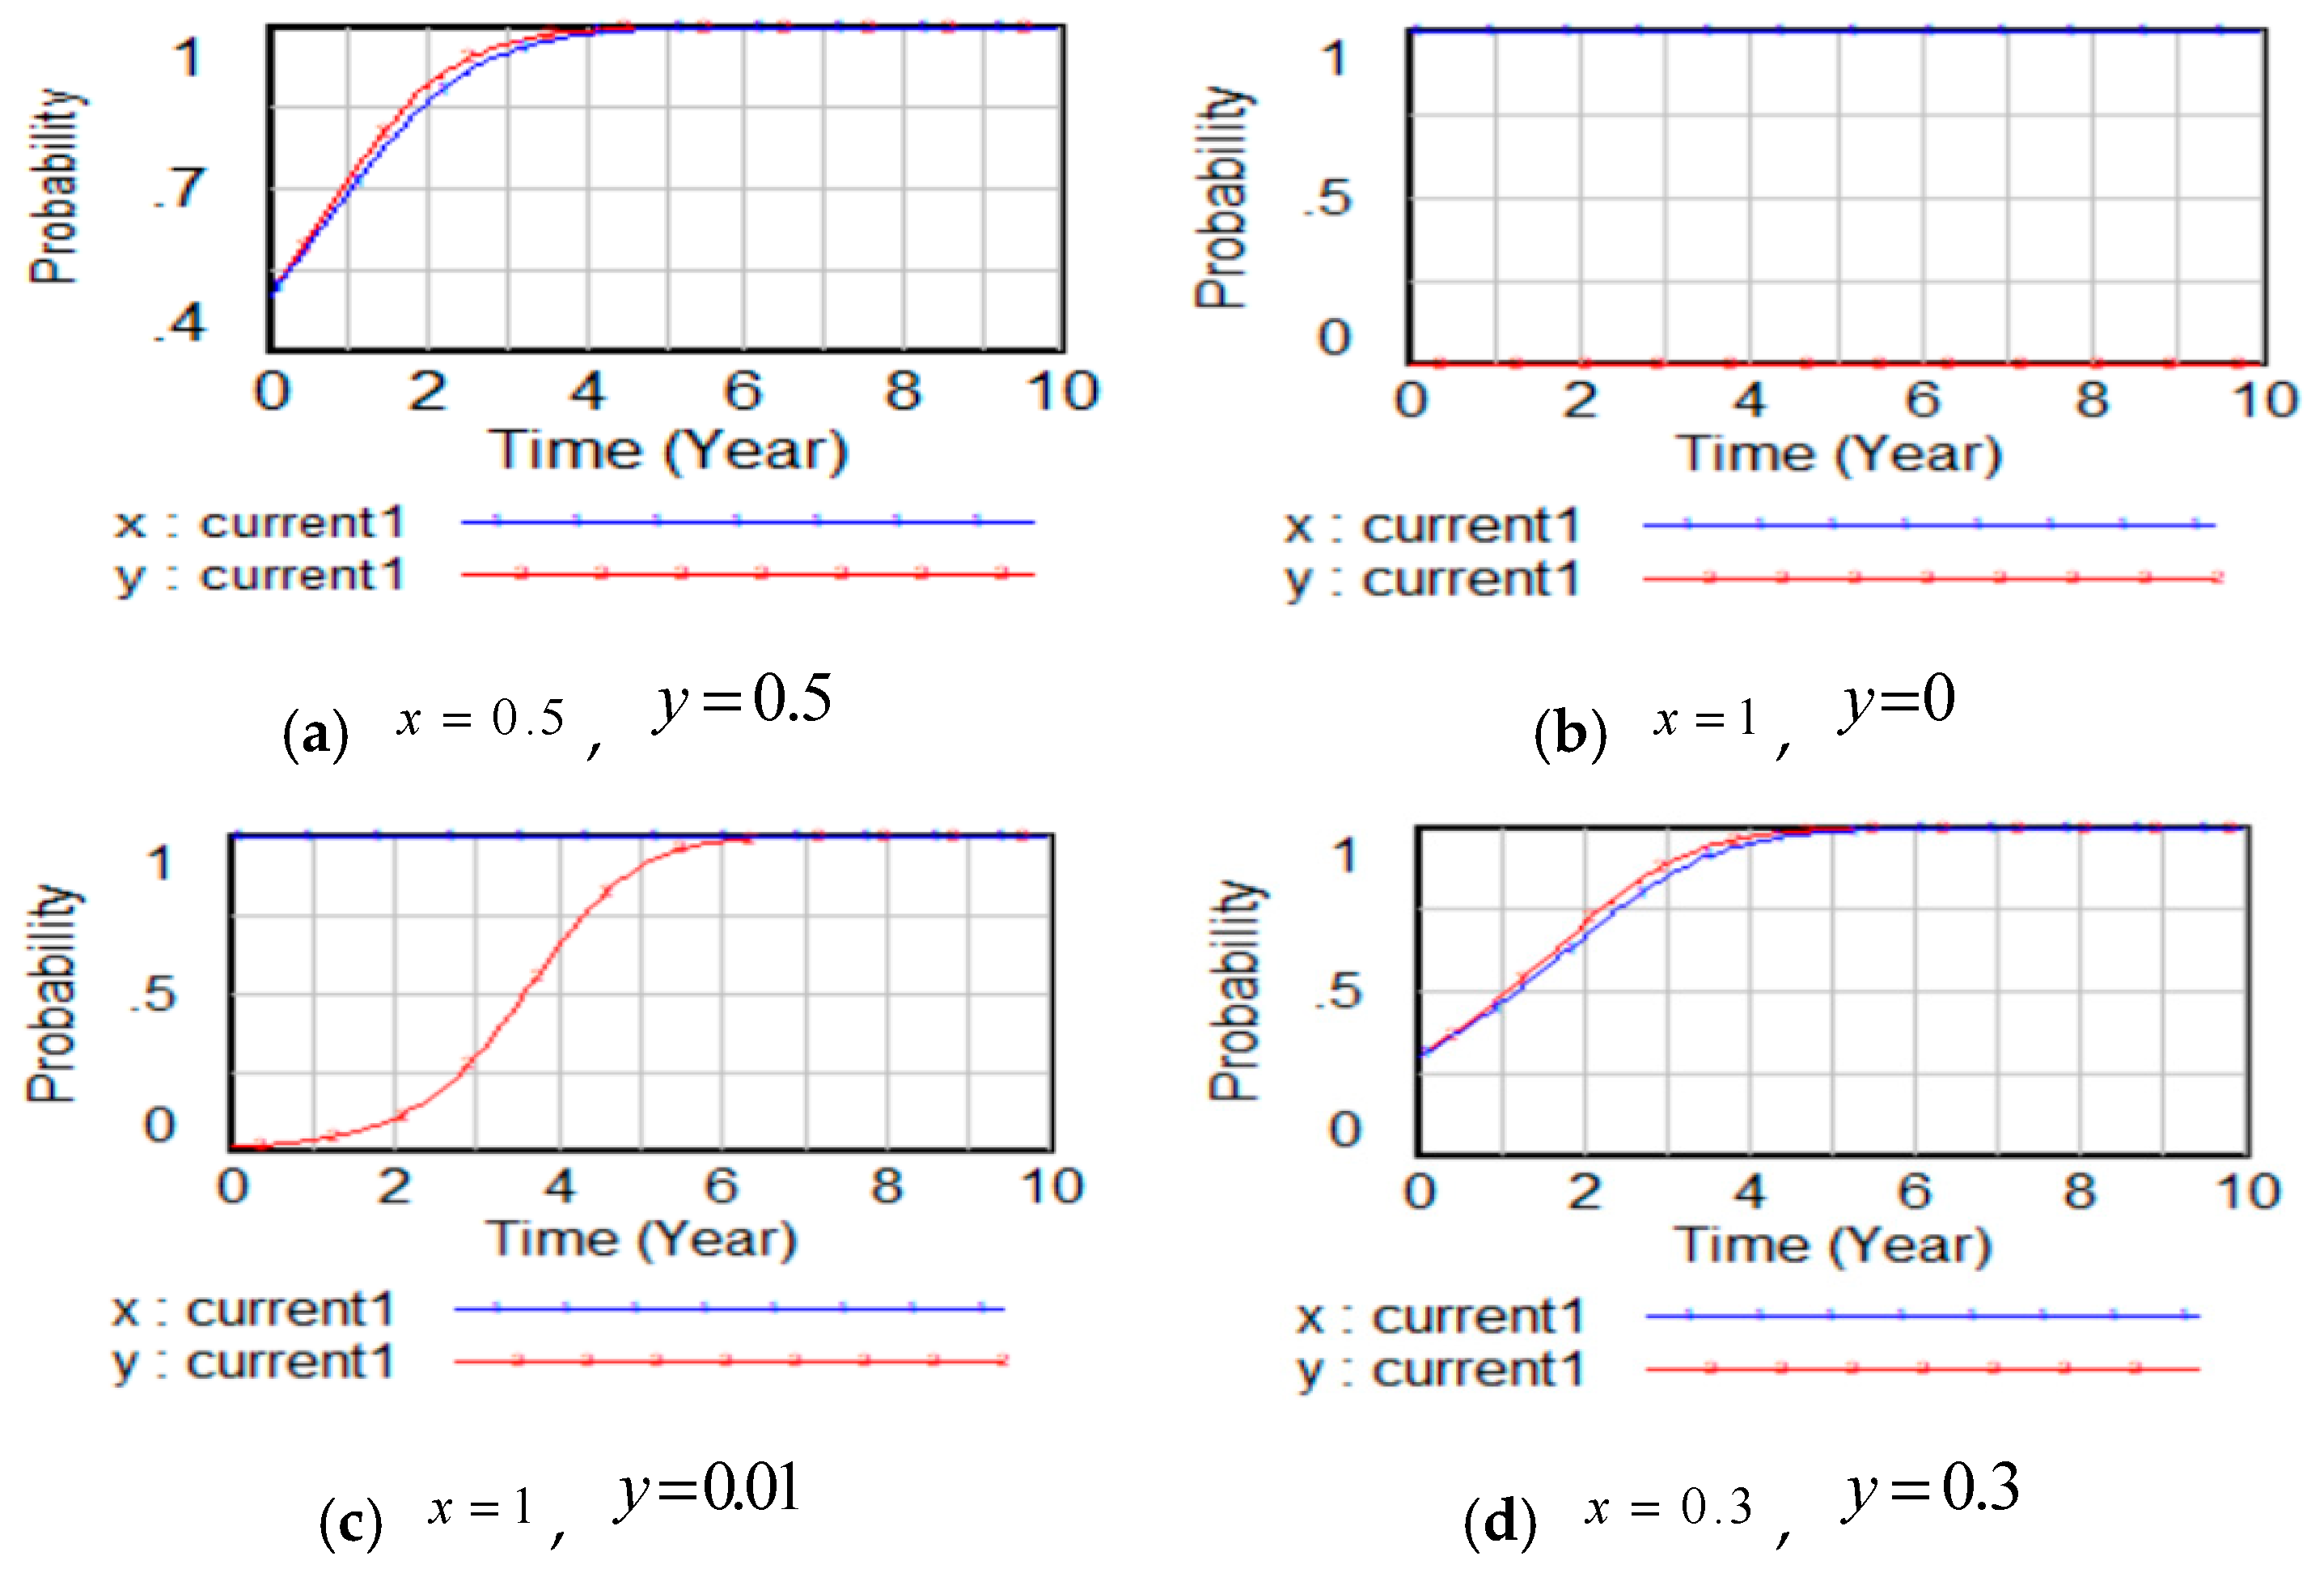
From the above analysis, it can be seen that the stable strategies of both China and Laos are 0 or 1, forming four strategy combinations (0, 0), (0, 1), (1, 0), and (1, 1). When the strategies of both players are pure, the system is in an equilibrium state. If either player does not actively change the existing strategy at this time, then the four strategy combinations are the equilibrium state of the system. However, this state is not stable. If one player changes slightly, the system will lose its equilibrium state. Therefore, this study chooses different strategy combinations for analysis, as shown in Figure 5.
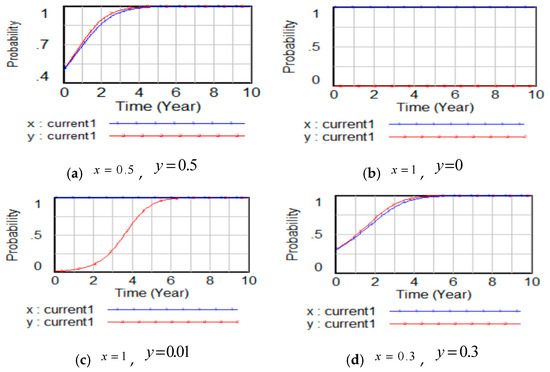
Figure 5.
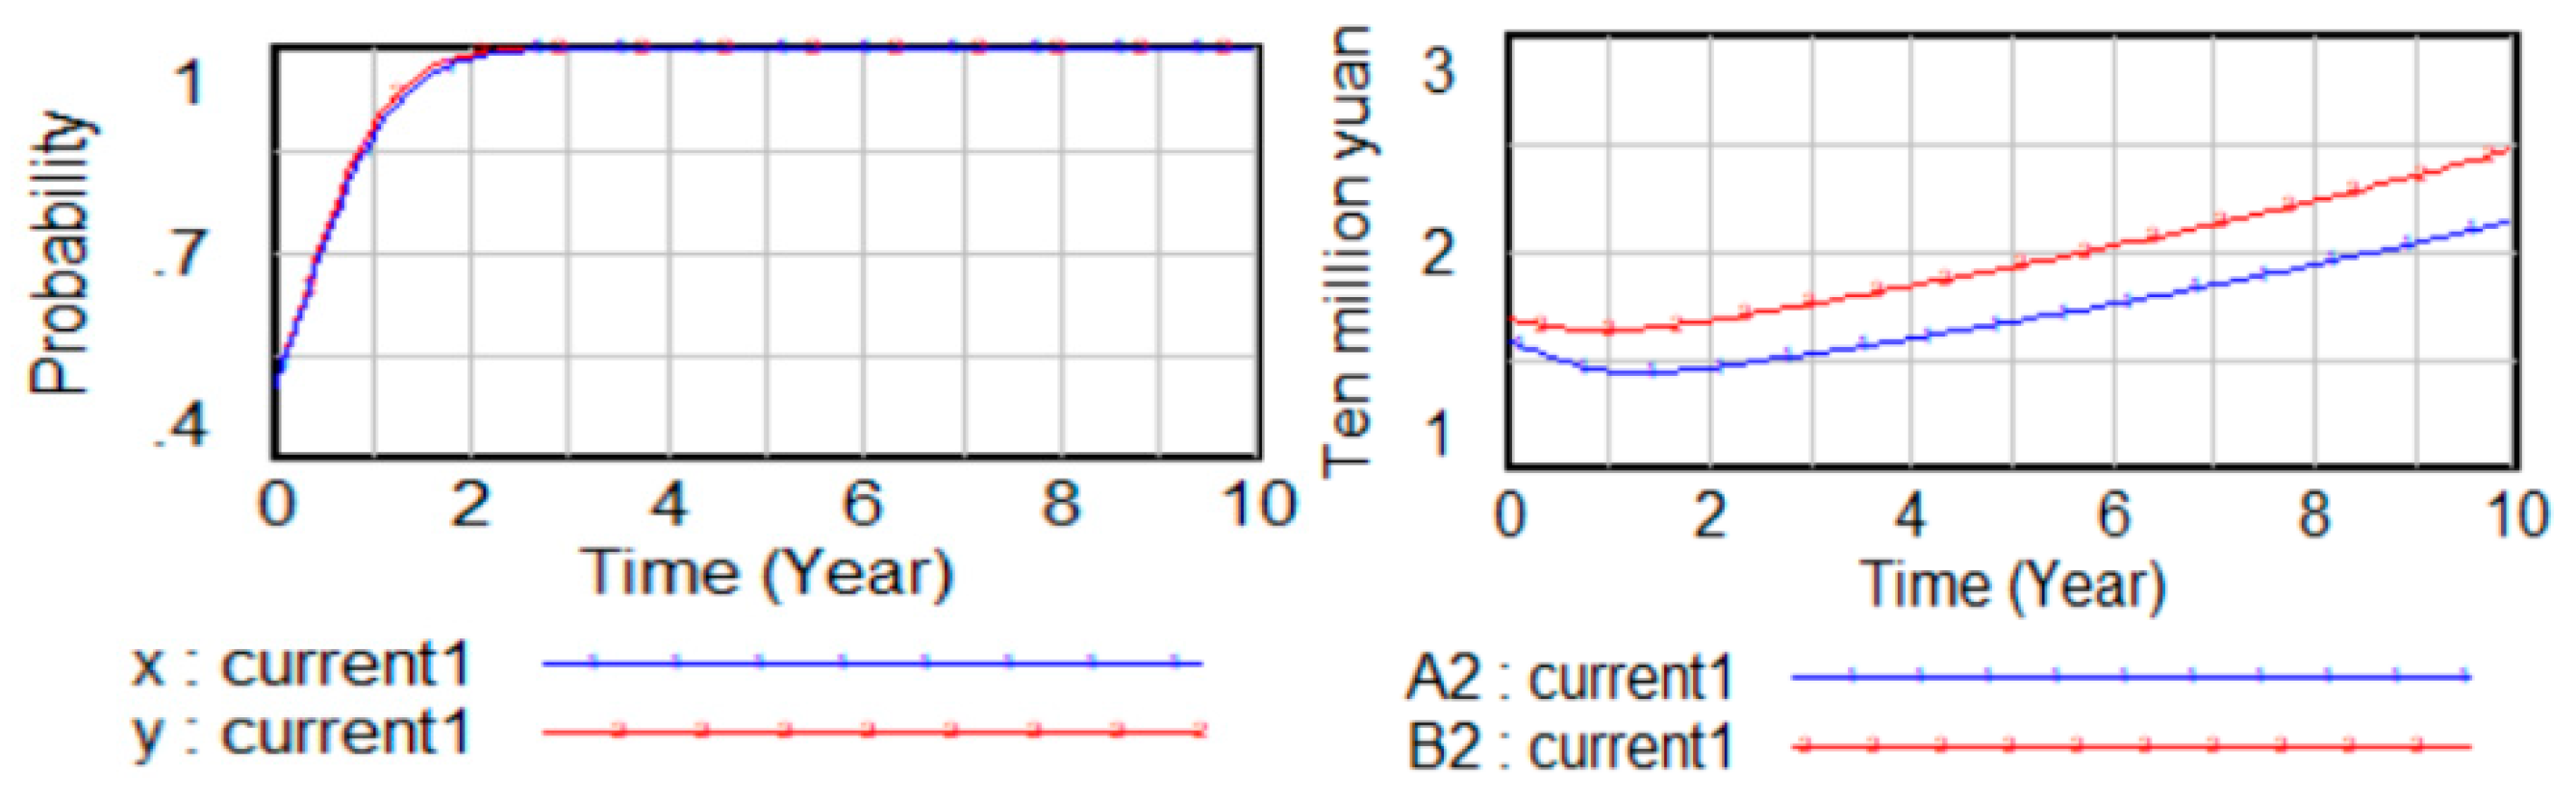
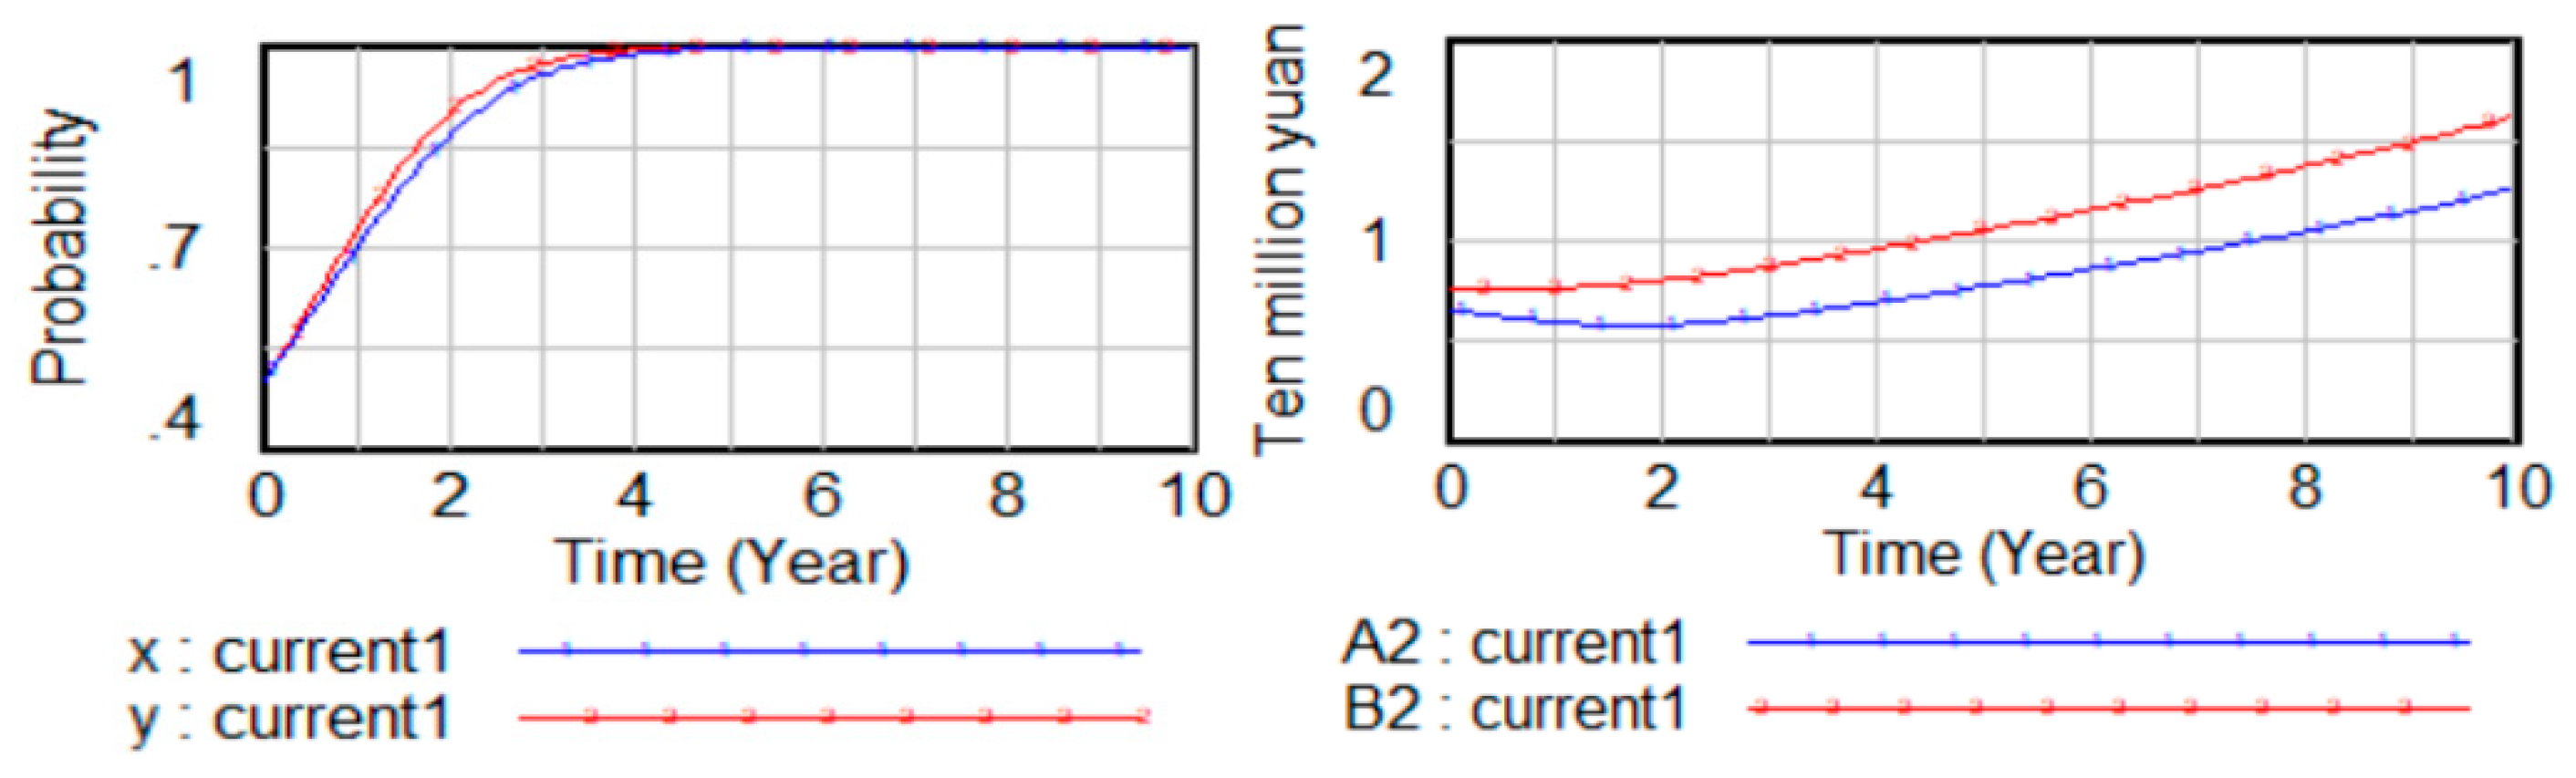
Simulation results under different values of and .
Simulation analysis is performed with initial parameters, and the evolution results are shown in Figure 5a. As the game progresses, both players reach equilibrium in strategic cooperation strategies. When the strategies of both players are pure strategies, the evolution results are shown in Figure 5b and the strategies of both players are in a stable state. , adjust , and the evolution results are shown in Figure 5c. Although the initial probability of the Lao side choosing strategic cooperation is very low, as long as the participating players find that there is a higher-yield strategic choice in the system, they will adjust through mutual imitation of the original strategies; the system evolves to a new equilibrium state. When the initial probability of both players becomes low, the evolution result is shown in Figure 5d, and the time for both parties to reach the equilibrium state of strategic cooperation becomes longer.
It can be seen from Table 3 that different values of parameters will have different cooperation results. The following will explore the impact of different variables on the cooperation results through comparative analysis with the initial parameter simulation results.
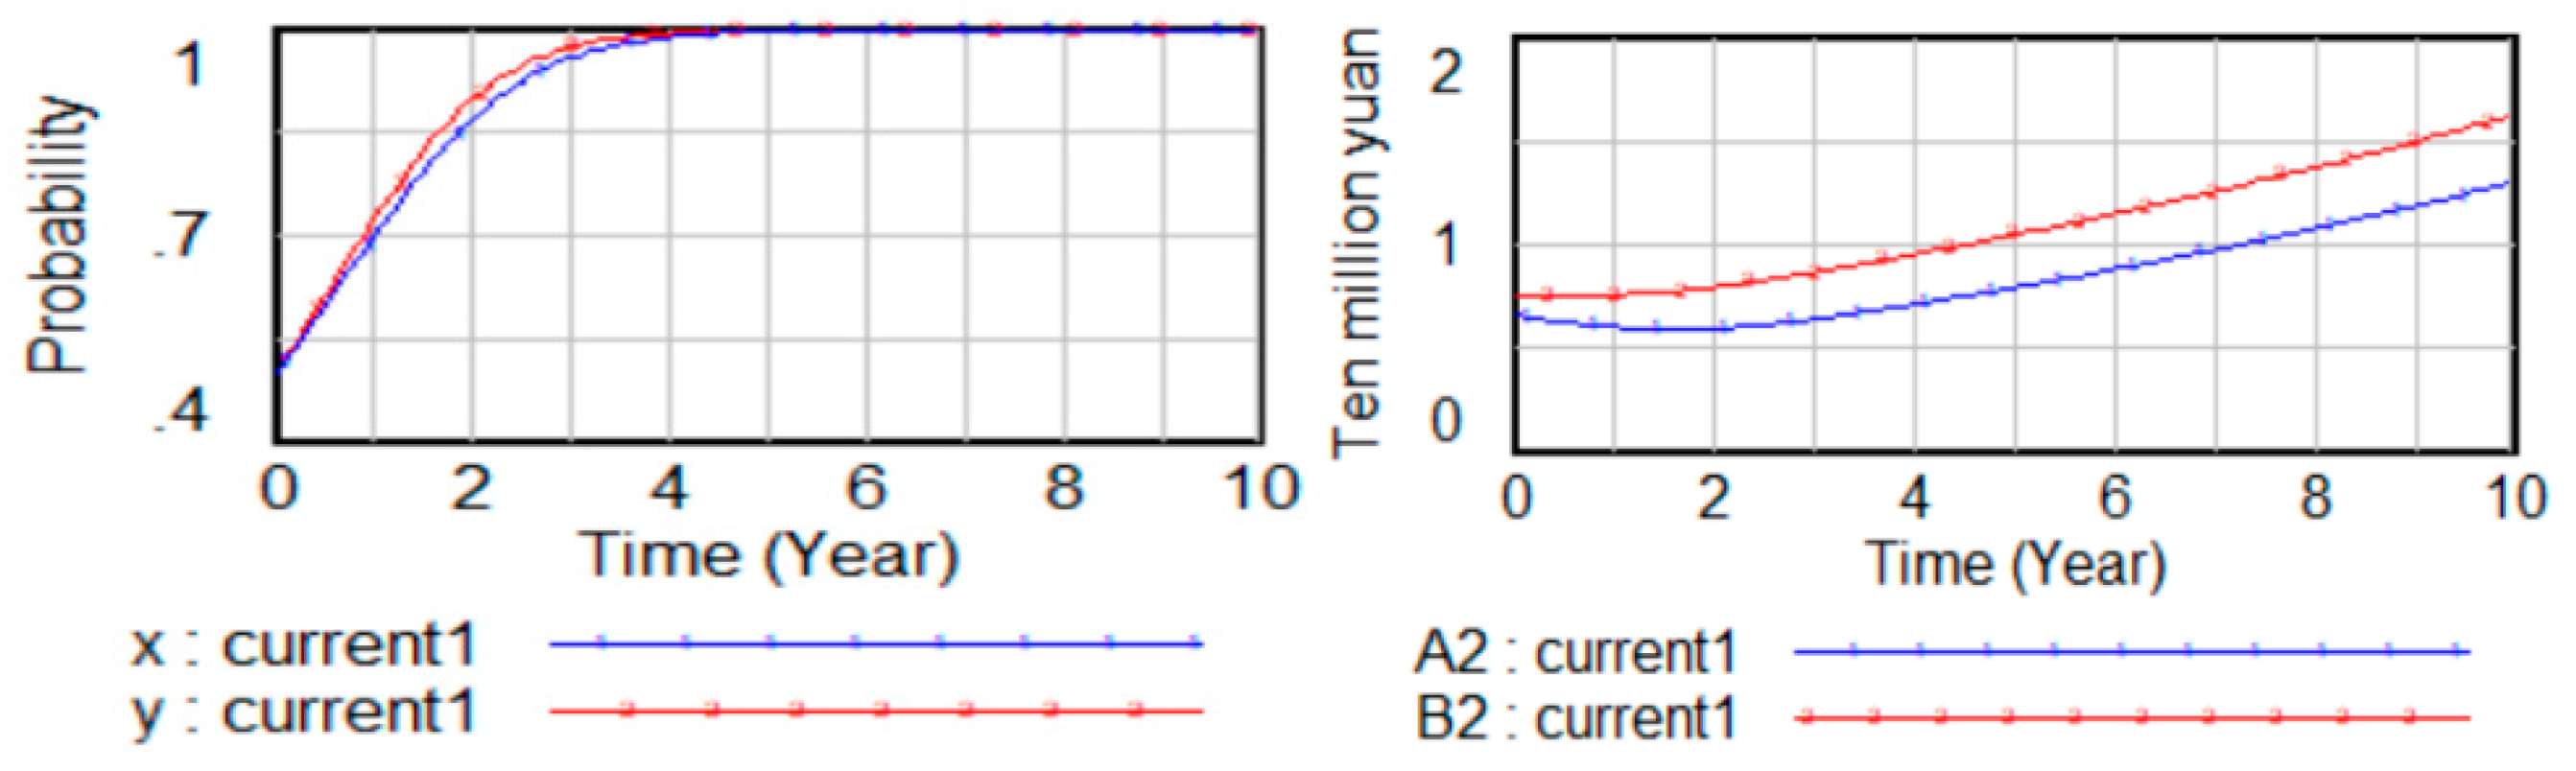
(1) Effect of electricity trade volume on evolutionary results during strategic cooperation.
The simulation results when the electricity trade volume increases by 10% during strategic cooperation are shown in Figure 6. Comparative analysis with Figure 4 and Figure 5a shows that the power trade volume increases during strategic cooperation, the time for both players to reach the equilibrium state of strategic cooperation strategies becomes shorter, and the cooperation benefits of both players increase.
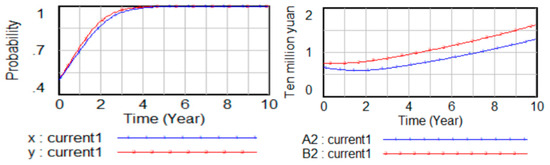
Figure 6.
Results of strategy and benefit changes when power-trading volume increases by 10%.
(2) Effect of average transaction cost on evolutionary results during strategic cooperation.
The simulation results when the average transaction cost of strategic cooperation electricity is 0.11 are shown in Figure 7. It can be seen from the comparative analysis of the simulation results of Figure 4 and Figure 5a that the average transaction cost of electricity is 0.1 when strategic cooperation is under the initial parameters. The average transaction cost of electricity increases, the time to reach the equilibrium state of strategic cooperation becomes longer, and the benefits of cooperation between both players decrease.
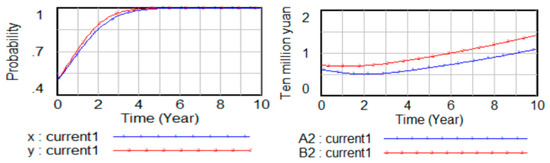
Figure 7.
Results of strategies and benefit changes when the average transaction cost of strategic cooperation electricity is 0.11.
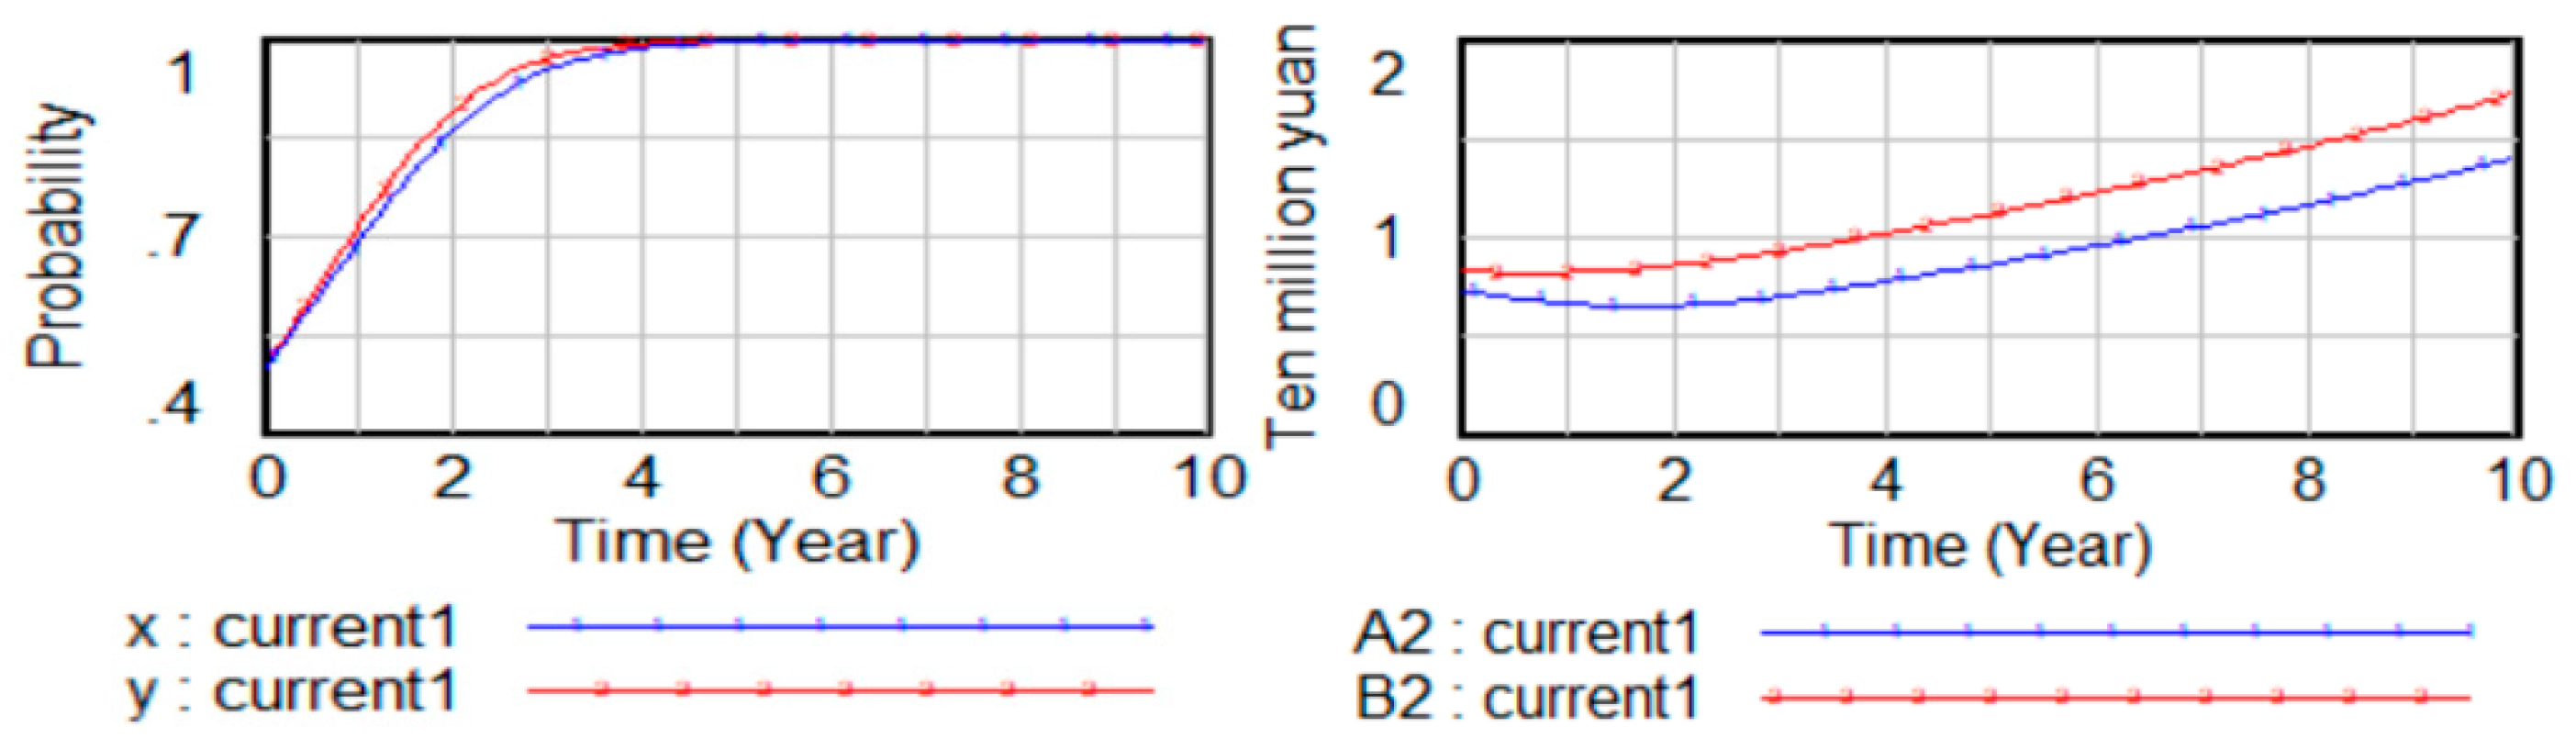
(3) Effect of profit per unit of electricity trade on evolutionary results.
The simulation results when the profit per unit of power trade between both players during strategic cooperation is 0.11 are shown in Figure 8. Comparative analysis of the simulation results in Figure 4 and Figure 5a when the average profit per unit of power trade is 0.1 when strategic cooperation is under initial parameters. It can be seen that the more profit per unit of power trade, the shorter the time for both players to reach the equilibrium state of the strategic cooperation scenario, and the greater the cooperation benefits.
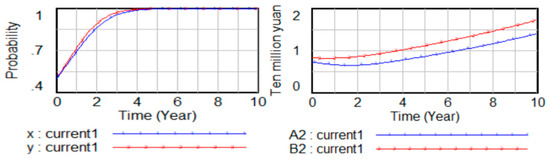
Figure 8.
Results of strategy and benefit change when profit per unit of electricity trade between both players is 0.11.
(4) Effect of input costs on evolutionary results during strategic cooperation.
The simulation results when the investment cost of both players in the strategic cooperation is 11 is shown in Figure 9. It can be seen from the comparative analysis of the simulation results of Figure 4 and Figure 5a that the investment cost is 10 for strategic cooperation under the initial parameters. The more cooperation costs both players invest, the longer it takes to reach the equilibrium state of strategic cooperation strategy, and the lesser the benefits from cooperation between both players.
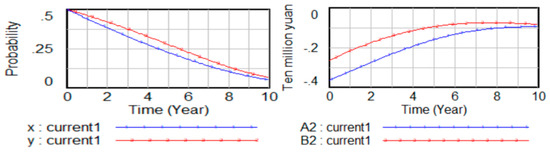
Figure 9.
Results of strategy and benefit changes when investment cost of strategic cooperation between both players is 11.
(5) Effect of incremental benefits on evolutionary results during strategic cooperation.
The simulation results when the incremental benefit of both players in the strategic cooperation is 10.45 are shown in Figure 10. Comparative analysis of the simulation results of Figure 4 and Figure 5a when the incremental return is 9.5 when strategic cooperation is under the initial parameters. It can be seen that the greater the incremental benefits of both players, the shorter the time to reach the equilibrium state of the strategic cooperation scenario, and the greater the benefits of cooperation for both players.
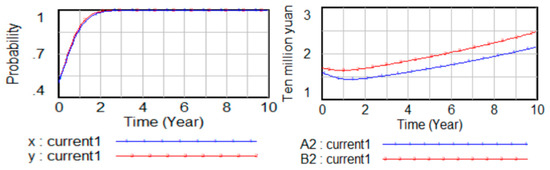
Figure 10.
Results of strategy and benefit changes when incremental income of both players’ strategic cooperation is 10.45.
(6) Effect of excess returns on evolutionary results.
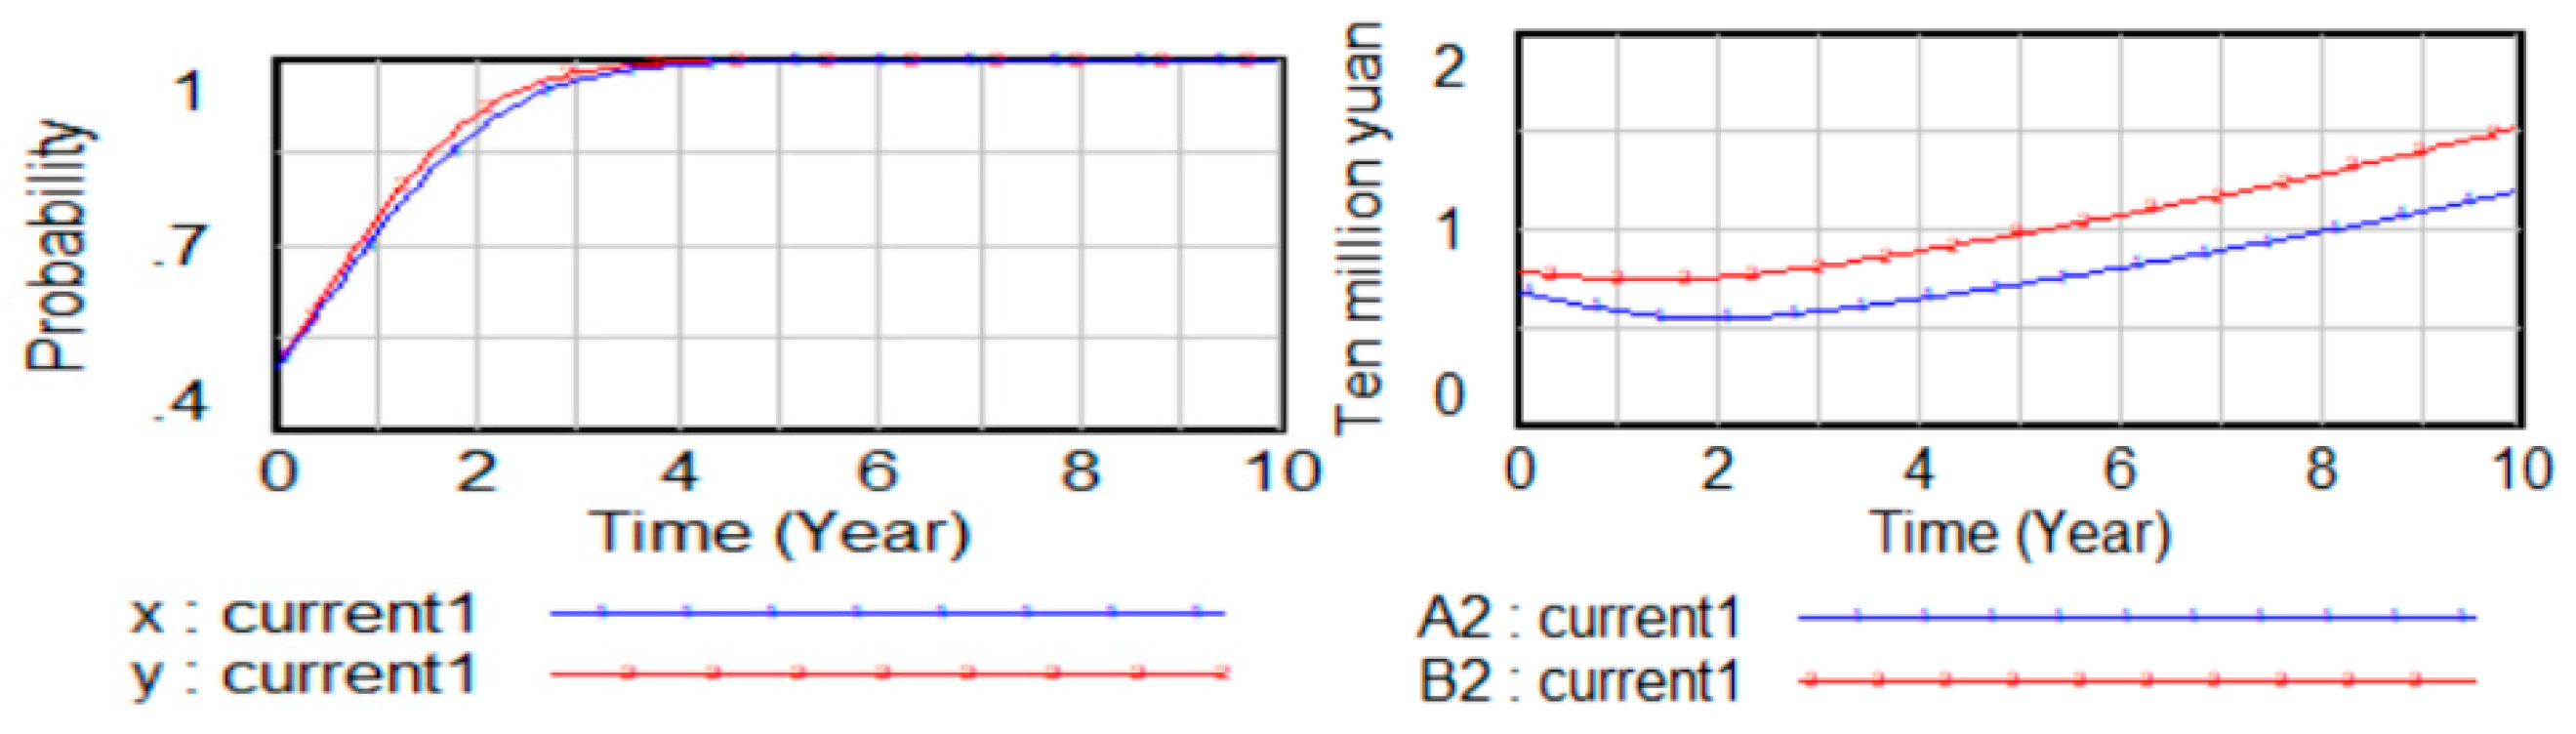
When excess returns increase by 10% during strategic cooperation, the simulation results are shown in Figure 11. Comparative analysis of the simulation results in Figure 4 and Figure 5a when comparing the strategic cooperation with the initial parameters. It can be seen that the greater the excess return, the shorter the time to reach the equilibrium state of the strategic cooperation scenario, and the greater the benefits for both players in the strategic cooperation scenario.
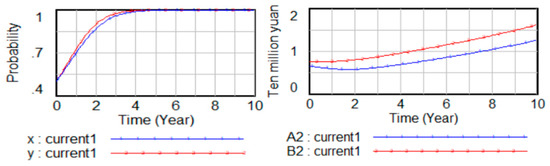
Figure 11.
Results of strategy and benefit change when excess income increases by 10% during strategic cooperation.
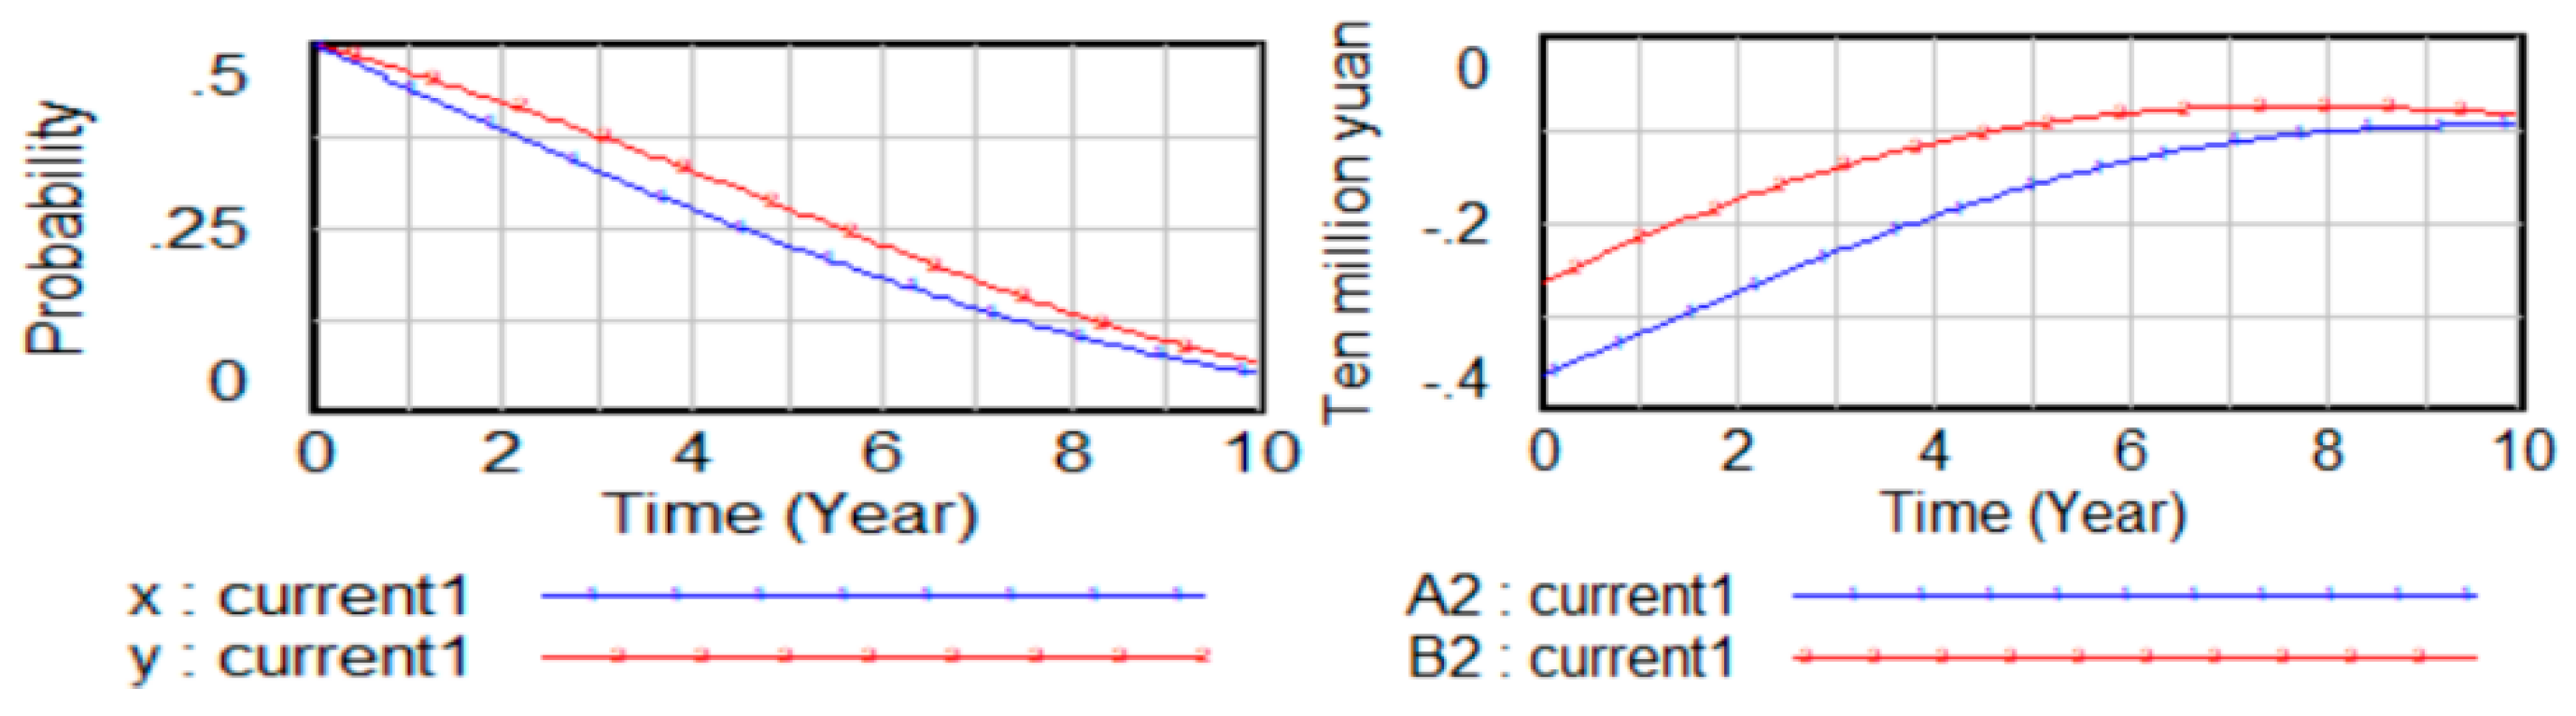
(7) Effect of fines on evolutionary results.
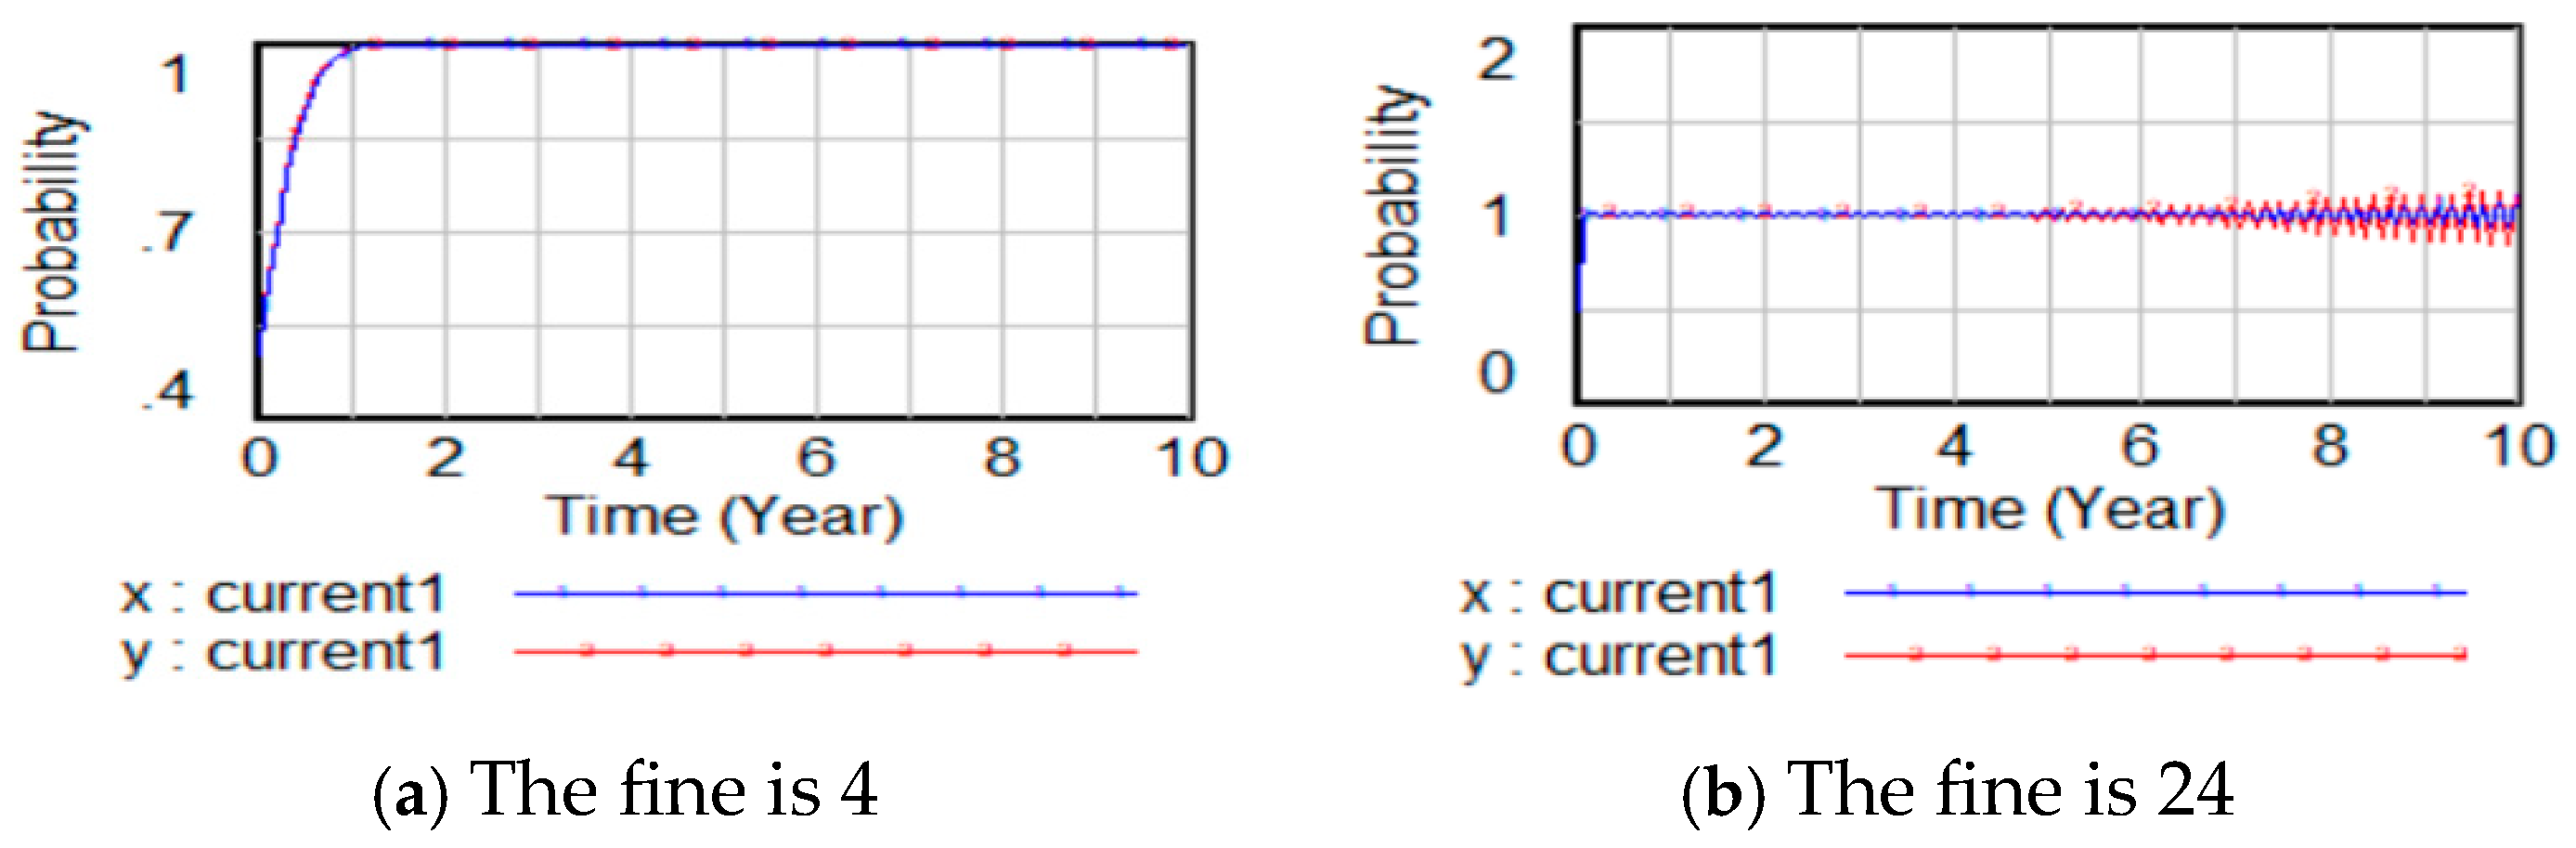
The simulation results with fines of 4 and 24 are shown in Figure 12. Comparative analysis with Figure 5a of the simulation results with a fine of 1 under the initial parameters. It can be seen that the greater the fine within a certain range, the shorter the time to reach the equilibrium state of the strategic cooperation scenario. However, when the fine increases to a certain level as shown in Figure 12b, the strategies of both players become unstable. When the penalty is 1.1, the simulation results are shown in Figure 13. The time to reach the equilibrium state of the strategic cooperation scenario becomes shorter, and the cooperation benefits of both players remain unchanged.

Figure 12.
Results of strategy selection under different fines.
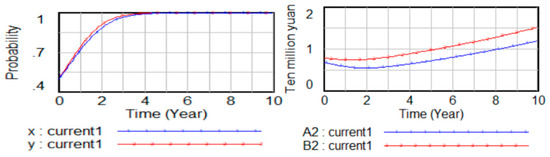
Figure 13.
Results of strategy and benefit change when the fine is 1.1.
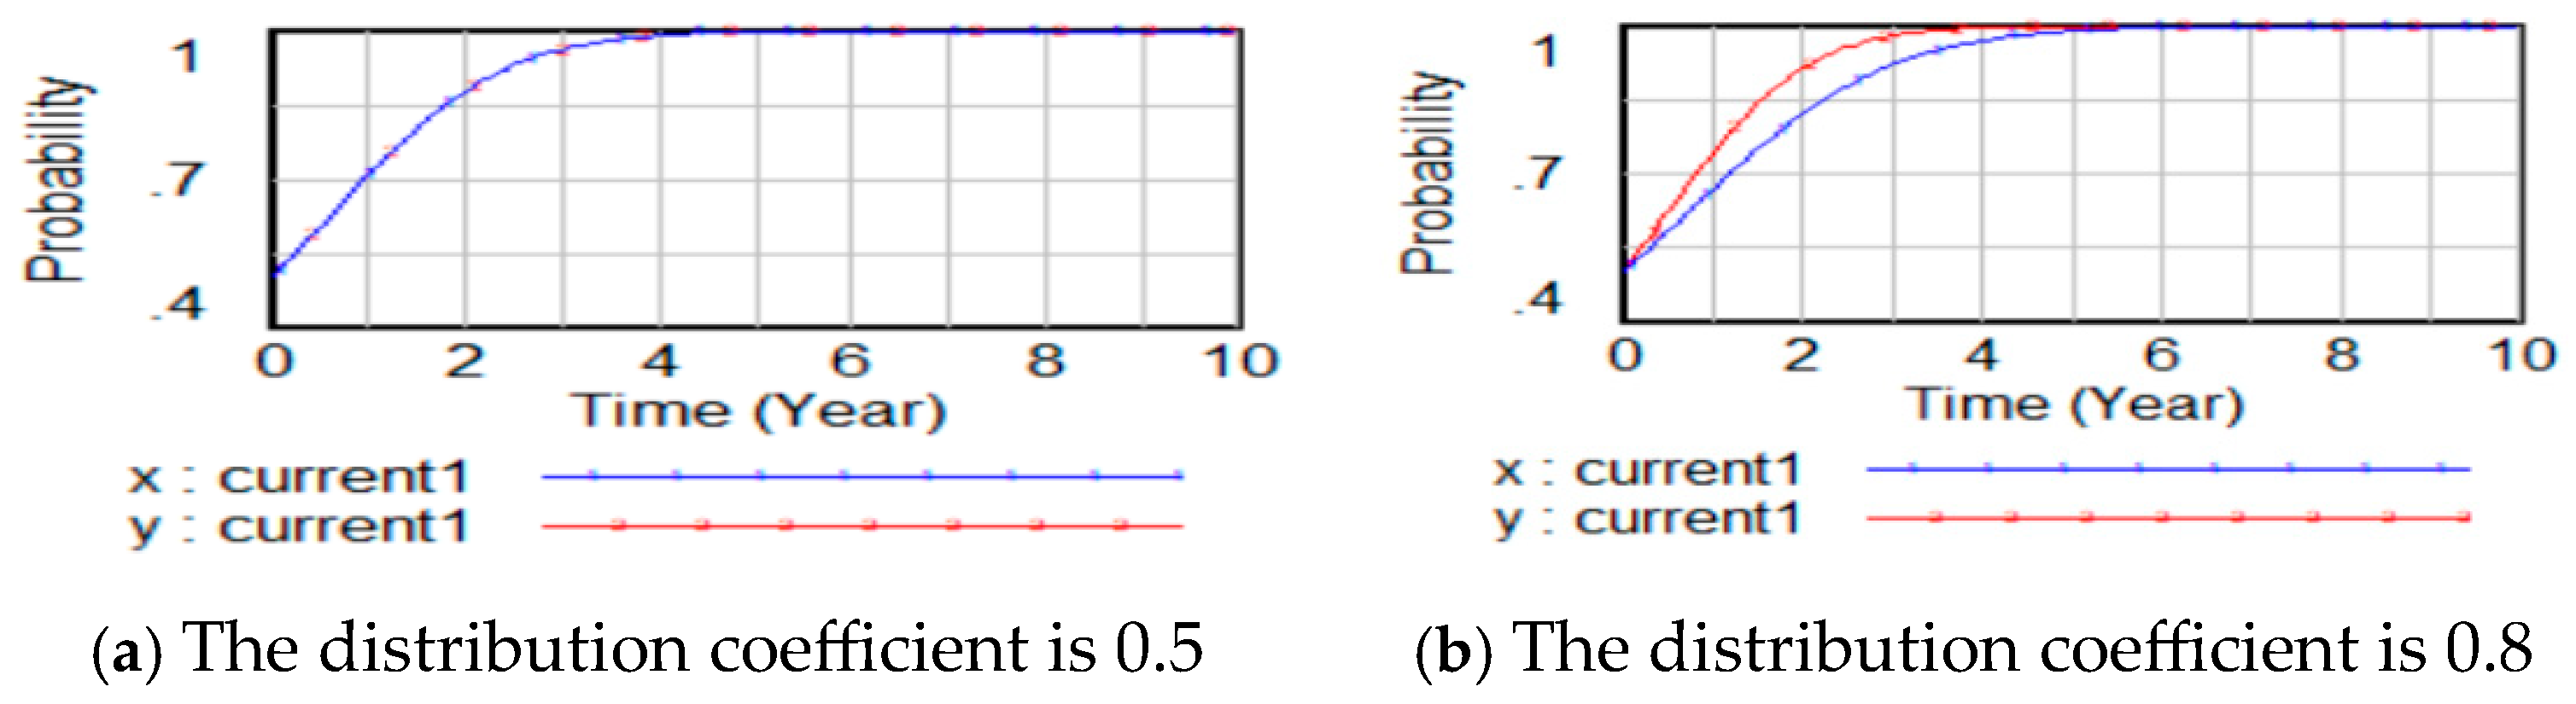
(8) Effect of distribution coefficient of excess returns on evolutionary results.
The simulation results with excess returns distribution coefficients of 0.5 and 0.8 are shown in Figure 14. Comparative analysis with Figure 5a of the simulation results with the distribution coefficient of 0.6. It can be seen that the closer the distribution coefficient is to 0.5, the shorter the time for both players to simultaneously reach the equilibrium state of strategic cooperation strategies.
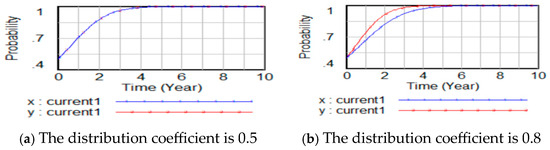
Figure 14.
Results of strategy selection of different distribution coefficient.
(9) Sensitivity analysis
This study uses the time for both players to reach strategic equilibrium and the cooperation benefits to both parties in 2030 as sensitivity output carriers. Then, we analyze the sensitivity of electricity trade volume, average electricity transaction cost, unit power trade profits of both players, Chinese cooperation input costs, cooperation input costs of both players, incremental benefits of both players, excess returns, and fines. Sensitivity analysis will provide support for the promotion of China–Laos cross-border power cooperation projects and policy recommendations. The sensitivity coefficients of key variables of the China–Laos electric power cooperation system are shown in Table 4.
Table 4.
Sensitivity analysis of China–Laos electric power cooperation system.
As shown in Table 4, the cooperation benefits of the China–Laos power cooperation system are relatively sensitive to input costs, incremental benefits, trade profits per unit, trade volume and transaction costs, among which input costs and incremental benefits are the most sensitive. Mainly because at this stage, compared with trade gains, cooperation investment costs and incremental gains are relatively large. The time it takes for both strategies to reach equilibrium is sensitive to input costs, fines, trade volume, and transaction costs.
6. Conclusions
With the reduction of carbon emissions and the consensus of human beings on sustainable development, global cross-border power cooperation has developed rapidly. This study focuses on the game behavior in the process of a China–Laos power cooperation, based on the evolutionary game model, analyzes the interaction behavior and the stability of the strategy of the two sides, and combines the SD model to simulate and analyze the long-term dynamic cooperation scenario. The research conclusions are as follows:
(1) After ten years of cooperation, both parties adopt the strategic cooperation strategy. The Chinese side’s annual income is CNY 11.92 million, and the Lao side’s annual income is CNY 15.17 million. The initial strategy ratio of both parties affects the direction of strategy evolution and the time to reach equilibrium.
(2) The volume of electricity trade, incremental income, excess returns, and profit per unit of electricity trade positively affect the cooperation benefits, shortening the time to reach equilibrium; the input cost and average electricity transaction cost negatively affect the cooperation benefits, prolonging the time to reach equilibrium. Sensitivity analysis shows that the benefits for both sides and the equilibrium time are significantly affected by cooperation input costs, incremental benefits, power trade volume, transaction costs, and trade profits. Penalties can shorten the evolutionary equilibrium time but do not affect income.
(3) The distribution coefficient of excess returns affects the time for both sides to evolve to the strategic equilibrium state of the strategic cooperation scenario; within a certain range, increasing penalties for breach of contract can reduce the time to reach the strategic equilibrium state. However, when the penalty is too high, there is no stable strategy for both sides.
Laos has a superior geographical location and is a key link in realizing cross-border power interconnection and cooperation between China and Indo-China Peninsula countries in the future. In this context, exploring the game behavior and influencing factors in the process of a China–Laos cross-border power cooperation has theoretical significance and practical value. The results of this study have the following policy and practical implications. First with regard to policy implications:
(1) China and Laos should actively deepen cross-border power cooperation and promote the implementation of the “Strategic Cooperation Scenario”. Both parties should further increase investments in green electricity, especially in the hydropower sector. The governments of both countries can encourage enterprises to participate in the development and utilization of green electricity by providing financial incentives, tax reductions, and low-interest loans, thereby contributing to carbon reduction and sustainable development.
(2) Establish a specialized cross-border power cooperation management agency to coordinate and address various issues that may arise during cooperation. A clear and comprehensive legal framework should be established to provide legal safeguards for electricity cooperation, enhancing cooperation efficiency and mitigating cooperation risks. Furthermore, it is essential to optimize the electricity trade and investment environment, reducing cooperation costs and ensuring the long-term sustainability of collaboration.
(3) Develop a robust regional electricity trading market. By leveraging the regulatory role of the market and comparative advantages, the efficiency of electricity resource development and utilization can be increased, electricity costs reduced, and the scale of electricity trade expanded, thereby enhancing cooperation benefits. This also facilitates the optimal allocation of electricity resources, improving the stability and reliability of the electricity supply.
(4) Implement a well-designed penalty mechanism to prevent “free-riding” and unfair practices in cooperation. Simultaneously, robust monitoring and enforcement mechanisms should be established to ensure the effective implementation of penalties and fines, thereby maintaining fairness and stability of cooperation. In this context, both parties need to focus on cost control and incremental returns of cooperative investments. By devising reasonable cost control measures and effective investment strategies, the overall benefits of cooperation can be enhanced. Additionally, emphasis should be placed on strengthening supervision and management throughout the cooperation process to ensure prudent use of funds and smooth project execution, thereby effectively promoting the sustainable development of cross-border power cooperation.
We then also present some practical implications to guide the smooth implementation of this cross-border power cooperation project and its applicability to other similar regions. The practical implications are as follows:
(1) Both parties should enhance the interconnection of power infrastructure, particularly the construction and upgrading of cross-border power grids. Through the improvement of infrastructure, the stability and reliability of the power grid can be enhanced, ensuring the sustainability and quality of electricity supply.
(2) Both parties should select representative regions or projects to initiate power cooperation demonstration projects. Suitable projects can be chosen in border areas, where management optimization can lead to efficient allocation and utilization of power resources. Furthermore, successful experiences from these demonstration projects should be used to develop effective and replicable cooperation models, providing practical references for broader cross-border power cooperation.
(3) Both parties should enhance exchanges and cooperation in the field of power technology, regularly organizing technical training and seminars to improve the professional skills and management capabilities of technicians. This systematic talent development will strengthen the technical support capacity for power cooperation, ensuring the smooth implementation and long-term stable operation of cooperative projects.
(4) The evolutionary game model and system dynamics model used in this study have been proven effective in analyzing the gaming behavior and long-term dynamic cooperation scenarios in cross-border power cooperation. The exploration of these models and some key influencing factors is not only applicable to China–Laos power cooperation but can also provide valuable references for similar cross-border power cooperation in other regions. For instance, the Association of Southeast Asian Nations (ASEAN) is promoting multilateral cross-border electricity trade and cooperation, and the models and analysis results from this study can offer important references for their power cooperation strategies.
While a transition from fossil fuel to renewable energy can contribute to sustainable development, the cross-border cooperation in exploiting renewable energy is facing numerous challenges, especially the understanding of the strategic behaviors of stakeholders. This study not only recommends specific policies and practical measures for China–Laos cooperation in exploiting renewable energy, but also provides references for addressing similar challenges elsewhere and thus contributes to sustainability literature.
However, due to the lack of investment data and excess return data in the process of cooperation between the two sides, this paper uses reasonably estimated data for simulation analysis. Results will be improved if statistical survey data are made available in the future. This study does not evaluate the benefits of reducing carbon emissions in the scenario of strategic cooperation between the two sides, and the actual economic benefits should be higher than the simulation results. In addition, this study mainly focuses on cross-border power cooperation between China and Laos, considering that Laos and Thailand are in the process of power cooperation, so future research can introduce a three-party evolutionary game model through the actual situation of China, Laos, and Thailand, to analyze multi-country cross-border power cooperation in a more comprehensive way.
Author Contributions
Conceptualization, Y.L. and Z.W.; methodology, L.Z. and Y.H.; software, Y.L. and L.Z.; validation, Y.H. and Z.W.; formal analysis, L.Z.; investigation, Y.L. and L.Z.; resources, Z.W.; data curation, L.Z.; writing—original draft preparation, Y.L. and L.Z.; writing—review and editing, Z.W.; visualization, Y.L.; supervision, Z.W.; project administration, Z.W.; funding acquisition, Z.W. All authors have read and agreed to the published version of the manuscript.
Funding
This research is funded by the National Natural Science Foundation of China (72264040) and the Yunnan Provincial Department of Education Scientific Research Fund Project (2023Y0360).
Institutional Review Board Statement
Not applicable.
Informed Consent Statement
Not applicable.
Data Availability Statement
The data presented in this study will be made available on request.
Conflicts of Interest
The authors declare no conflicts of interest.
References
- Sohag, K.; Chukavina, K.; Samargandi, N. Renewable energy and total factor productivity in OECD member countries. J. Clean. Prod. 2021, 296, 126499. [Google Scholar] [CrossRef]
- Dingbang, C.; Cang, C.; Qing, C.; Lili, S.; Caiyun, C. Does new energy consumption conducive to controlling fossil energy consumption and carbon emissions?—Evidence from China. Resour. Policy 2021, 74, 102427. [Google Scholar] [CrossRef]
- Wen, H.; Liang, W.; Lee, C.C. China’s progress toward sustainable development in pursuit of carbon neutrality: Regional differences and dynamic evolution. Environ. Impact Assess. Rev. 2023, 98, 106959. [Google Scholar] [CrossRef]
- Pan, X.; Shao, T.; Zheng, X.; Zhang, Y.; Ma, X.; Zhang, Q. Energy and sustainable development nexus: A review. Energy Strategy Rev. 2023, 47, 101078. [Google Scholar] [CrossRef]
- Borge-Diez, D.; Rosales-Asensio, E.; Cabrera, P.; Sarmento, P.; Carta, J.A. Cross-border electricity cooperation in Southern Asia: Consequences and benefits. Processes 2024, 12, 2324. [Google Scholar] [CrossRef]
- Singh, A.; Jamasb, T.; Nepal, R.; Toman, M. Electricity cooperation in South Asia: Barriers to cross-border trade. Energy Policy 2018, 120, 741–748. [Google Scholar] [CrossRef]
- Joint Statement on Further Deepening the Construction of a China-Laos Community of Shared Future. Available online: https://paper.people.com.cn/rmrb/html/2022-12/02/nw.D110000renmrb_20221202_2-04.htm (accessed on 2 December 2022).
- Electricity Consumption of the Whole Society Grew by 6.7 Per Cent Year-on-Year in 2023. Available online: https://www.gov.cn/lianbo/bumen/202401/content_6926853.htm (accessed on 18 January 2024).
- Lao Statistics Bureau. Available online: https://www.lsb.gov.la/en (accessed on 5 November 2024).
- Laos to Export over 14,000 MW of Electricity by 2030. Available online: https://laoccc.org/index.php/zh-cn/ (accessed on 11 December 2018).
- Motalebi, S.; Barnes, T.; Lu, L.; Leibowicz, B.D.; Niet, T. The role of US-Canada electricity trade in North American decarbonization pathways. Energy Strategy Rev. 2022, 41, 100827. [Google Scholar] [CrossRef]
- Haque, H.E.; Dhakal, S.; Mostafa, S.M.G. An assessment of opportunities and challenges for cross-border electricity trade for Bangladesh using SWOT-AHP approach. Energy Policy 2020, 137, 111118. [Google Scholar] [CrossRef]
- Antweiler, W. Cross-border trade in electricity. J. Int. Econ. 2016, 101, 42–51. [Google Scholar] [CrossRef]
- Voropai, N.; Podkovalnikov, S.; Osintsev, K. From interconnections of local electric power systems to Global Energy Interconnection. Glob. Energy Interconnect. 2018, 1, 4–10. [Google Scholar]
- Newbery, D.; Strbac, G.; Viehoff, I. The benefits of integrating European electricity markets. Energy Policy 2016, 94, 253–263. [Google Scholar] [CrossRef]
- Kanyako, F.; Lamontagne, J.; Baker, E.; Turner, S.; Wild, T. Seasonality and trade in hydro-heavy electricity markets: A case study with the West Africa Power Pool (WAPP). Appl. Energy 2023, 329, 120214. [Google Scholar] [CrossRef]
- Aidoo, L.; Khobai, H.; Kleynhans, E.P. The impact of renewable energy on economic growth in the Southern African Power Pool (SAPP). Energy Sources Part B Econ. Plan. Policy 2023, 18, 2234905. [Google Scholar] [CrossRef]
- Vaidya, R.A.; Yadav, N.; Rai, N.; Neupane, S.; Mukherji, A. Electricity trade and cooperation in the BBIN region: Lessons from global experience. Int. J. Water Resour. Dev. 2021, 37, 439–465. [Google Scholar] [CrossRef]
- Elena, B. Study on the Influence of Russia’s Power Output to China; Harbin Institute of Technology: Harbin, China, 2020. (In Chinese) [Google Scholar]
- Zhu, T. An Institutional Analysis of Grid Interconnection: European Experience and China’s Problem. Contemp. Financ. Econ. 2019, 2, 3–13. (In Chinese) [Google Scholar]
- Ding, T.; Mou, C.L.; Bie, C.H.; Du, P.W.; Fan, Z.Y.; Zou, Z.X.; Yang, Y.H.; Wu, Z.Y.; Xu, Y.; Tang, B.G. Review of Energy Internet and Its Operation. Proc. CSEE 2018, 38, 4318–4328+4632. (In Chinese) [Google Scholar]
- Chen, F.; Huang, K.; Hou, Y.; Ding, T. Long-term cross-border electricity trading model under the background of Global Energy Interconnection. Glob. Energy Interconnect. 2019, 2, 122–129. [Google Scholar] [CrossRef]
- Zhang, R. The Development Dilemma of Latin American Energy Integration: Taking Power Integration as an Example. J. Latin Am. Stud. 2018, 40, 109–123+157. (In Chinese) [Google Scholar]
- Bao, M.L.; Ding, Y.; Shao, C.Z.; Song, Y.H. Review of Nordic Electricity Market and Its Suggestions for China. Proc. CSEE 2017, 37, 4881–4892+5207. (In Chinese) [Google Scholar]
- Zhang, W.; Yu, J.W.; He, C.L.; Ma, H.X. Overview of Market Power Mitigation Measures in North American Electricity Market. Guangdong Electr. Power 2021, 34, 24–33. (In Chinese) [Google Scholar]
- Han, B.Q. A Study on GMS Power Trade Arrangement and Risk Management. Ph.D. Thesis, University of International Business and Economics, Beijing, China, 2015. (In Chinese). [Google Scholar]
- Voropai, N.I.; Ilkevich, N.I.; Rabchuk, V.I.; Saneev, B.G.; Senderov, S.M.; Trufanov, V.V. Technological and Corporative Aspects of Infrastructural Energy Systems Development on the Eurasian Continent. World 2004, 2110, 354. [Google Scholar]
- Li, C.; Zhang, F.; Cao, C.; Liu, Y.; Qu, T. Organizational coordination in sustainable humanitarian supply chain: An evolutionary game approach. J. Clean. Prod. 2019, 219, 291–303. [Google Scholar] [CrossRef]
- Wang, J.; Hu, Y.; Qu, W.; Ma, L. Research on emergency supply chain collaboration based on tripartite evolutionary game. Sustainability 2022, 14, 11893. [Google Scholar] [CrossRef]
- Taylor, P.D.; Jonker, L.B. Evolutionary stable strategies and game dynamics. Math. Biosci. 1978, 40, 145–156. [Google Scholar] [CrossRef]
- Gatenby, R.A.; Vincent, T.L. Application of quantitative models from population biology and evolutionary game theory to tumor therapeutic strategies. Mol. Cancer Ther. 2003, 2, 919–927. [Google Scholar] [PubMed]
- Arasteh, A. Considering the investment decisions with real options games approach. Renew. Sustain. Energy Rev. 2017, 72, 1282–1294. [Google Scholar] [CrossRef]
- Zhang, M.; Li, H.; Xue, L.; Wang, W. Using three-sided dynamic game model to study regional cooperative governance of haze pollution in China from a government heterogeneity perspective. Sci. Total Environ. 2019, 694, 133559. [Google Scholar] [CrossRef]
- Wang, Y.P.; Meng, W.D. Evolutionary game analysis on co-competition mechanism of supply chain. J. Ind. Eng. Eng. Manag. 2004, 2, 96–98. (In Chinese) [Google Scholar]
- Luo, H.Y.; Qu, X.; Hu, Y.X. The Impact of Government Regulation on Enterprise’s Emission Reduction Behavior under Environmental Protection Tax System—Analysis based on Evolutionary Game. J. Beijing Inst. Technol. (Soc. Sci. Ed.) 2020, 22, 1–12. (In Chinese) [Google Scholar]
- Chen, W.; Hu, Z.H. Using evolutionary game theory to study governments and manufacturers’ behavioral strategies under various carbon taxes and subsidies. J. Clean. Prod. 2018, 201, 123–141. [Google Scholar] [CrossRef]
- Chai, B.; Chen, J.; Yang, Z.; Zhang, Y. Demand response management with multiple utility companies: A two-level game approach. IEEE Trans. Smart Grid 2014, 5, 722–731. [Google Scholar] [CrossRef]
- Chen, R.Y. Evolutionary Game and Chaos Control of Power Market Based on Heterogeneous Behavioral Decision-makings. Master’s Thesis, Changsha University of Science & Technology, Changsha, China, 2010. (In Chinese). [Google Scholar]
- Peng, C.H.; Qian, K.; Yan, J.L. A Bidding Strategy Based on Differential Evolution Game for Generation Side in Power Grid Integrated with Renewable Energy Resources. Power Syst. Technol. 2019, 43, 2002–2010. (In Chinese) [Google Scholar]
- Yi, Z.; Xin-Gang, Z.; Yu-Zhuo, Z.; Ying, Z. From feed-in tariff to renewable portfolio standards: An evolutionary game theory perspective. J. Clean. Prod. 2019, 213, 1274–1289. [Google Scholar] [CrossRef]
- Zhu, C.; Fan, R.; Lin, J. The impact of renewable portfolio standard on retail electricity market: A system dynamics model of tripartite evolutionary game. Energy Policy 2020, 136, 111072. [Google Scholar] [CrossRef]
- On-line Business Simulation for Electric Utilities. Available online: http://simpower.cesim.com (accessed on 5 November 2024).
- Toba, A.L.; Seck, M.; Ngatang, I. Gaming and simulation for energy system infrastructure: A case of the power grid system. In Proceedings of the Annual Simulation Symposium, Baltimore, MD, USA, 15–18 April 2018; pp. 1–12. [Google Scholar]
- Ding, Z.; Gong, W.; Li, S.; Wu, Z. System dynamics versus agent-based modeling: A review of complexity simulation in construction waste management. Sustainability 2018, 10, 248. [Google Scholar] [CrossRef]
- Li, X. Social System Dynamics; Fudan University Press: Shanghai, China, 2019. (In Chinese) [Google Scholar]
- Jiang, N.; Chen, Z.H.; Zhao, Z.M.; Long, Y.X.; Huang, P. Study of water pollution load prediction and pollution economic loss in coastal zone based on system dynamics: A case study of Jiangmen city. Mar. Environ. Sci. 2018, 37, 720–727. (In Chinese) [Google Scholar]
- Bendoly, E. System dynamics understanding in projects: Information sharing, psychological safety, and performance effects. Prod. Oper. Manag. 2014, 23, 1352–1369. [Google Scholar] [CrossRef]
- Zhang, L.B.; Hu, Y.N.; Jin, J.L.; Wu, C.G.; Zhou, Y.L.; Cui, Y. Dynamic prediction of water resources carrying capacity of Chaohu Basin and system optimization regulation based on system dynamics simulation. J. Lake Sci. 2021, 33, 242–254. (In Chinese) [Google Scholar]
- Shen, H.; Dong, M.T.; Gao, C.H.; Zhang, C.Y. Study on the Development Path of Two Mountains Based on the System Dynamics Model. Ecol. Econ. 2022, 38, 210–216. (In Chinese) [Google Scholar]
- Li, X.; Zhang, L.; Hao, Y.; Zhang, P.; Xiong, X.; Shi, Z. System dynamics modeling of food-energy-water resource security in a megacity of China: Insights from the case of Beijing. J. Clean. Prod. 2022, 355, 131773. [Google Scholar] [CrossRef]
- Karbasioun, M.; Gholamalipour, A.; Safaie, N.; Shirazizadeh, R.; Amidpour, M. Developing sustainable power systems by evaluating techno-economic, environmental, and social indicators from a system dynamics approach. Util. Policy 2023, 82, 101566. [Google Scholar] [CrossRef]
- Heidari, M.R.; Heravi, G. Policy assessment in photovoltaic development using system dynamics: Case study of power generation in Iran. Sust. Cities Soc. 2023, 94, 104554. [Google Scholar] [CrossRef]
- Forrester, J.W. Industrial dynamics: A major breakthrough for decision makers. Harv. Bus. Rev. 1958, 36, 37–66. [Google Scholar]
- Li, Y.; Yang, T.; Zhang, Y. Evolutionary game theory-based system dynamics modeling for community solid waste classification in China. Util. Policy 2022, 79, 101451. [Google Scholar] [CrossRef]
- Zhang, Y.; Wang, S.X.; Yao, J.T.; Tong, R.P. The impact of behavior safety management system on coal mine work safety: A system dynamics model of quadripartite evolutionary game. Resour. Policy 2023, 82, 103497. [Google Scholar] [CrossRef]
- Roca, C.P.; Cuesta, J.A.; Sánchez, A. Evolutionary game theory: Temporal and spatial effects beyond replicator dynamics. Phys. Life Rev. 2009, 6, 208–249. [Google Scholar] [CrossRef]
- Wang, J.; Qin, Y.; Zhou, J. Incentive policies for prefabrication implementation of real estate enterprises: An evolutionary game theory-based analysis. Energy Policy 2021, 156, 112434. [Google Scholar] [CrossRef]
- Friedman, D. Evolutionary games in economics. Econometrica 1991, 59, 637–666. [Google Scholar] [CrossRef]
- Khamson, S. Analyze the Effect of Electricity Trade on Economic Development in Lao PDR. Master’s Thesis, Southwestern University of Finance and Economics, Chengdu, China, 2020. (In Chinese). [Google Scholar]
- Li, P.F. The Cooperation Model Between the Sender and Receiver and the Receiver Itself in Inter-Provincial Transactions Under the Condition of Autonomous Power Purchase. Master’s Thesis, North China Electric Power University (Beijing), Beijing, China, 2021. (In Chinese). [Google Scholar]
- Ren, L.Z. Strategic Behavior and Contract Design of Tradable Green Certificates Based on Common Interest Game. Ph.D. Thesis, North China Electric Power University (Beijing), Beijing, China, 2019. (In Chinese). [Google Scholar]

Disclaimer/Publisher’s Note: The statements, opinions and data contained in all publications are solely those of the individual author(s) and contributor(s) and not of MDPI and/or the editor(s). MDPI and/or the editor(s) disclaim responsibility for any injury to people or property resulting from any ideas, methods, instructions or products referred to in the content. |
© 2024 by the authors. Licensee MDPI, Basel, Switzerland. This article is an open access article distributed under the terms and conditions of the Creative Commons Attribution (CC BY) license (https://creativecommons.org/licenses/by/4.0/).