Article

Improvement of Engine Combustion and Emission Characteristics by Fuel Property Modulation

1
Liaoning Provincial Key Laboratory of Energy Storage and Energy Utilization Technology, Yingkou Institute of Technology, Yingkou 115000, China
2
School of Automotive Engineering, Jilin University, Changchun 130052, China
*
Author to whom correspondence should be addressed.
Sustainability 2024, 16(23), 10764; https://doi.org/10.3390/su162310764
Submission received: 3 November 2024 / Revised: 4 December 2024 / Accepted: 5 December 2024 / Published: 8 December 2024
(This article belongs to the Special Issue Technology Applications in Sustainable Energy and Power Engineering)

Abstract

:
The sustainability of diesel engines has come to the forefront of research with the growing global interest in reducing greenhouse gas emissions and improving energy efficiency. The aim of this paper is to support the goal of sustainable development by improving the volatile properties of diesel fuel to promote cleaner combustion in engines. In order to study the effect of diesel fuel volatility on spraying, combustion, and emission, the tests were carried out with the help of the constant volume chamber (CVC) test rig and an engine test rig, respectively. CVC test: A high-speed video camera recorded the spray characteristics of different volatile fuels in a constant-volume combustion bomb. The effects of different rail pressures and ambient back pressures on the spray characteristics were investigated. Engine test: The combustion and emission characteristics of different volatile diesel fuels under different load conditions (25%, 50%, 75%) were investigated in a four-stroke direct-injection diesel engine with the engine speed fixed at 2000 rpm. The test results show that as the rail pressure increases and the ambient pressure decreases, the spray characteristics of the fuels tend to increase; for the more volatile fuels, although reducing the spray tip penetration, the spray projected area and spray cone angle increase, which is conducive to improving the homogeneity of the fuel and air mixing in the cylinder. The improvement of fuel volatility can form more and better-quality mixtures within the ignition delay time (ID), resulting in a 1–2% increase in peak cylinder pressure and a 2–4% increase in peak heat release. For different loads, pre-injection heat release is generated to redefine the ID and combustion duration (CD). Improved fuel volatility effectively reduces carbon monoxide (CO) emissions by about 8–10% and hydrocarbon (HC) emissions by about 13–16%, but it increases nitrogen oxide (NOx) emissions by about 8–11%. Analyzing from the perspective of particulate matter (PM), combined with the aromatic content of volatile fuels, it is recommended to use fuels with moderate volatility and aromatic content under low load conditions, and at medium to large loads, the volatility of the fuel has less weight on particulates and more weight on aromatics, so it is desirable to use the fuel with the lowest volatility and lowest aromatic content of the fuel selected.

1. Introduction

In the global energy consumption structure, diesel, as an important oil-derived fuel, is widely used in transportation, industry, and agriculture. With the rapid economic development and the growth of energy demand, diesel engines are favored for their high thermal efficiency and good power performance. However, the emission problem of diesel engines has been a major challenge for environmental protection and sustainable development. The spray, combustion, and emission characteristics of diesel fuel directly affect the engine performance and environmental pollution level; therefore, an in-depth study of these characteristics is important for achieving sustainability in energy utilization.
Sustainability refers to meeting the needs of the present generation without compromising the ability of future generations to meet their own needs. Against the background of global climate change and increasing environmental pollution, sustainable development has become a consensus of the international community. The sustainable development of the transportation sector, as one of the major sources of energy consumption and pollutant emissions, is key to achieving the global sustainable development goals. The volatility of diesel fuel is one of the key factors affecting its spraying, combustion, and emission processes. Fuels with high volatility tend to form fine spray particles, which may improve combustion efficiency, but at the same time may increase the generation of harmful emissions. Therefore, the study of the effect of diesel fuel volatility on spray, combustion, and emissions is of paramount importance for optimizing engine design, reducing pollutant emissions, promoting the development of clean energy technologies, and achieving sustainable development in the transportation sector.
The performance of the engine is essentially determined by the combustion process, which in turn depends on the fuel characteristics and the technical architecture and cycle mode of the internal combustion engine itself. Fuel physicochemical parameters such as cetane number, volatility, and the content of each component have a certain effect on the performance [1]. Tests have shown that improving fuel volatility affects the quality of fuel atomization injected into the cylinder, contributing to shorter fuel–air mixing times and reduced carbon soot under high loads [2], and some of the literature found that high-volatile fuels can improve the effect of fuels with lower emission values in the low-temperature range compared to low-volatile fuels [3]. Hutchison B R M investigated the effect of fuel volatility on PM emissions from direct injection spark ignition engines. It is worth noting that PM emissions are directly related to seasonal variations. In addition, the effect of different volatilities on PM was different when blended with 10% ethanol. The results showed that there was no significant change in PM emissions after the addition of ethanol to high-volatility fuels, but there was an increase in PM emissions after the addition of ethanol to low-volatility fuels [4]. Premixed charge compression ignition (PCCI) technology is mainly utilized at low engine loads, but at low loads, low exhaust temperatures are difficult to reduce for NOx emissions. A fuel matrix with a near-constant aromatic content of 15% was chosen in the experiment to investigate the effect of fuel volatility and bio blends on PCCI. The test results show that PCCI can reduce NOx emissions by more than 67% under two different effective pressure operating conditions, and smoke levels can also be reduced relative to conventional diesel combustion benchmarks. Depending on the fuel used, pressure, and combustion staging, the reduction in smoke levels is more moderate, about 40–50%. In addition, under certain operating conditions, increasing fuel volatility and cetane numbers may help reduce HC emissions and potentially trade off further NOx reductions, and keep emissions of these pollutants at manageable levels [5].
Cheng A studied the effect of fuel volatility on low-temperature combustion using an optically accessible diesel engine and found that increasing fuel volatility reduced fuel deposition and fire buildup on the cylinder wall, resulting in significant reductions in smoke and emissions, especially at a high volatility content of 78%, which was effective in reducing carbon soot emissions and fire buildup [6]. Ge’s study found that for diesel engines using canola oil biodiesel (COBF) and B20, 20% COBF blended with 80% CDF by volume significantly reduced CO, HC, and PM emissions, as well as the types and amounts of VOCs, compared to conventional diesel fuel. The B20 blend had the lowest VOC emissions under all test conditions, and the study also presents methods for sampling and analyzing VOC emissions and concludes that COBF and CDF blends with volume ratios of 20–80 are effective alternative fuels [7]. Sun conducted an in-depth investigation into how fuel physicochemical properties affect spray characteristics and combustion emissions. The fuel spray behavior was tested in CVC by high-speed camera technology, and this study aims to elucidate the variation rule of spray patterns under different boundary conditions. In the subsequent engine bench experiments, the particulate emission characteristics of five diesel fuels with different physicochemical properties were systematically analyzed under the rapid loading condition of 5 s. The experimental results show that the spray parameters are jointly influenced by the boundary conditions, among which the ambient pressure has the most significant effect on the spray cone angle, while the increase in the spray pressure is favorable to improve the spray area. The use of fuels with high cetane numbers, excellent volatility, and low aromatic content is effective in reducing particulate emissions during rapid loading [8].
In the transportation sector, reducing pollution from diesel engine emissions is a key component in achieving the goal of sustainable development. The volatility of diesel fuel is an important factor affecting the engine spraying, mixing, combustion, and emission processes; therefore, an in-depth study of the effect of volatility on the above processes is of great practical significance in realizing cleaner combustion and lower emissions. Emission of pollutants can be reduced by regulating the volatility of diesel fuel, which helps to reduce the impact on the atmosphere and meets the requirements of environmental protection. Improved combustion efficiency not only reduces fuel consumption but also extends engine life and helps to achieve efficient energy utilization. By reducing emission control costs and potential fuel savings, it provides an economically optimized path for engine design and operation. In order to study the effect of fuel volatilization on diesel engine combustion and emission more deeply, it is necessary to study the in-cylinder mixing process and combustion emission process by experimental means. In this paper, three kinds of fuels with different volatility are studied, although there are many variables of fuel characteristics; in order to facilitate the qualitative analysis of this paper, we choose a variable with a large difference in characteristics, while the other characteristics are similar to a single variable for the study. Our test utilized the help of the high-speed camera in the fixed-capacity combustion bomb on the injection test of different volatile diesel fuels, and different volatile fuels on the CVC within the spray pattern; we analyzed the spray pattern on the evaporation of fuel, the formation of the impact mixture, and the combination with the engine test platform, studying the effects of three low, medium, and high loads on combustion and emission.

2. Experimental Parts

2.1. CVC Instrumentation

The test platform is schematically shown in Figure 1. It is mainly composed of CVC, high-speed camera, HP3 Pump, ECU, Oil Rail etc.
In this study, all experiments were conducted under isothermal conditions to ensure that the ambient temperature in the laboratory was stabilized at 298 K to simulate standard room temperature conditions. Among them, the injection pressure is 80, 100, 120 MPa, and the ambient pressure is 5, 10 MPa. To enhance the reliability of the experimental data and the significance of the statistical analyses, multiple rounds of replicated experiments, each containing three independent measurement sequences, were executed to minimize random errors and to ensure the convergence and reproducibility of the experimental results. The Phantom v611 high-speed camera from AMETEK (Berwyn, PA, USA) was mainly used in the experiment to capture the spray development process and process it with software to derive the spray parameters. The camera’s resolution is 600 × 800 and the exposure time is 240 s.

2.2. Test Fuel and Experiment Method

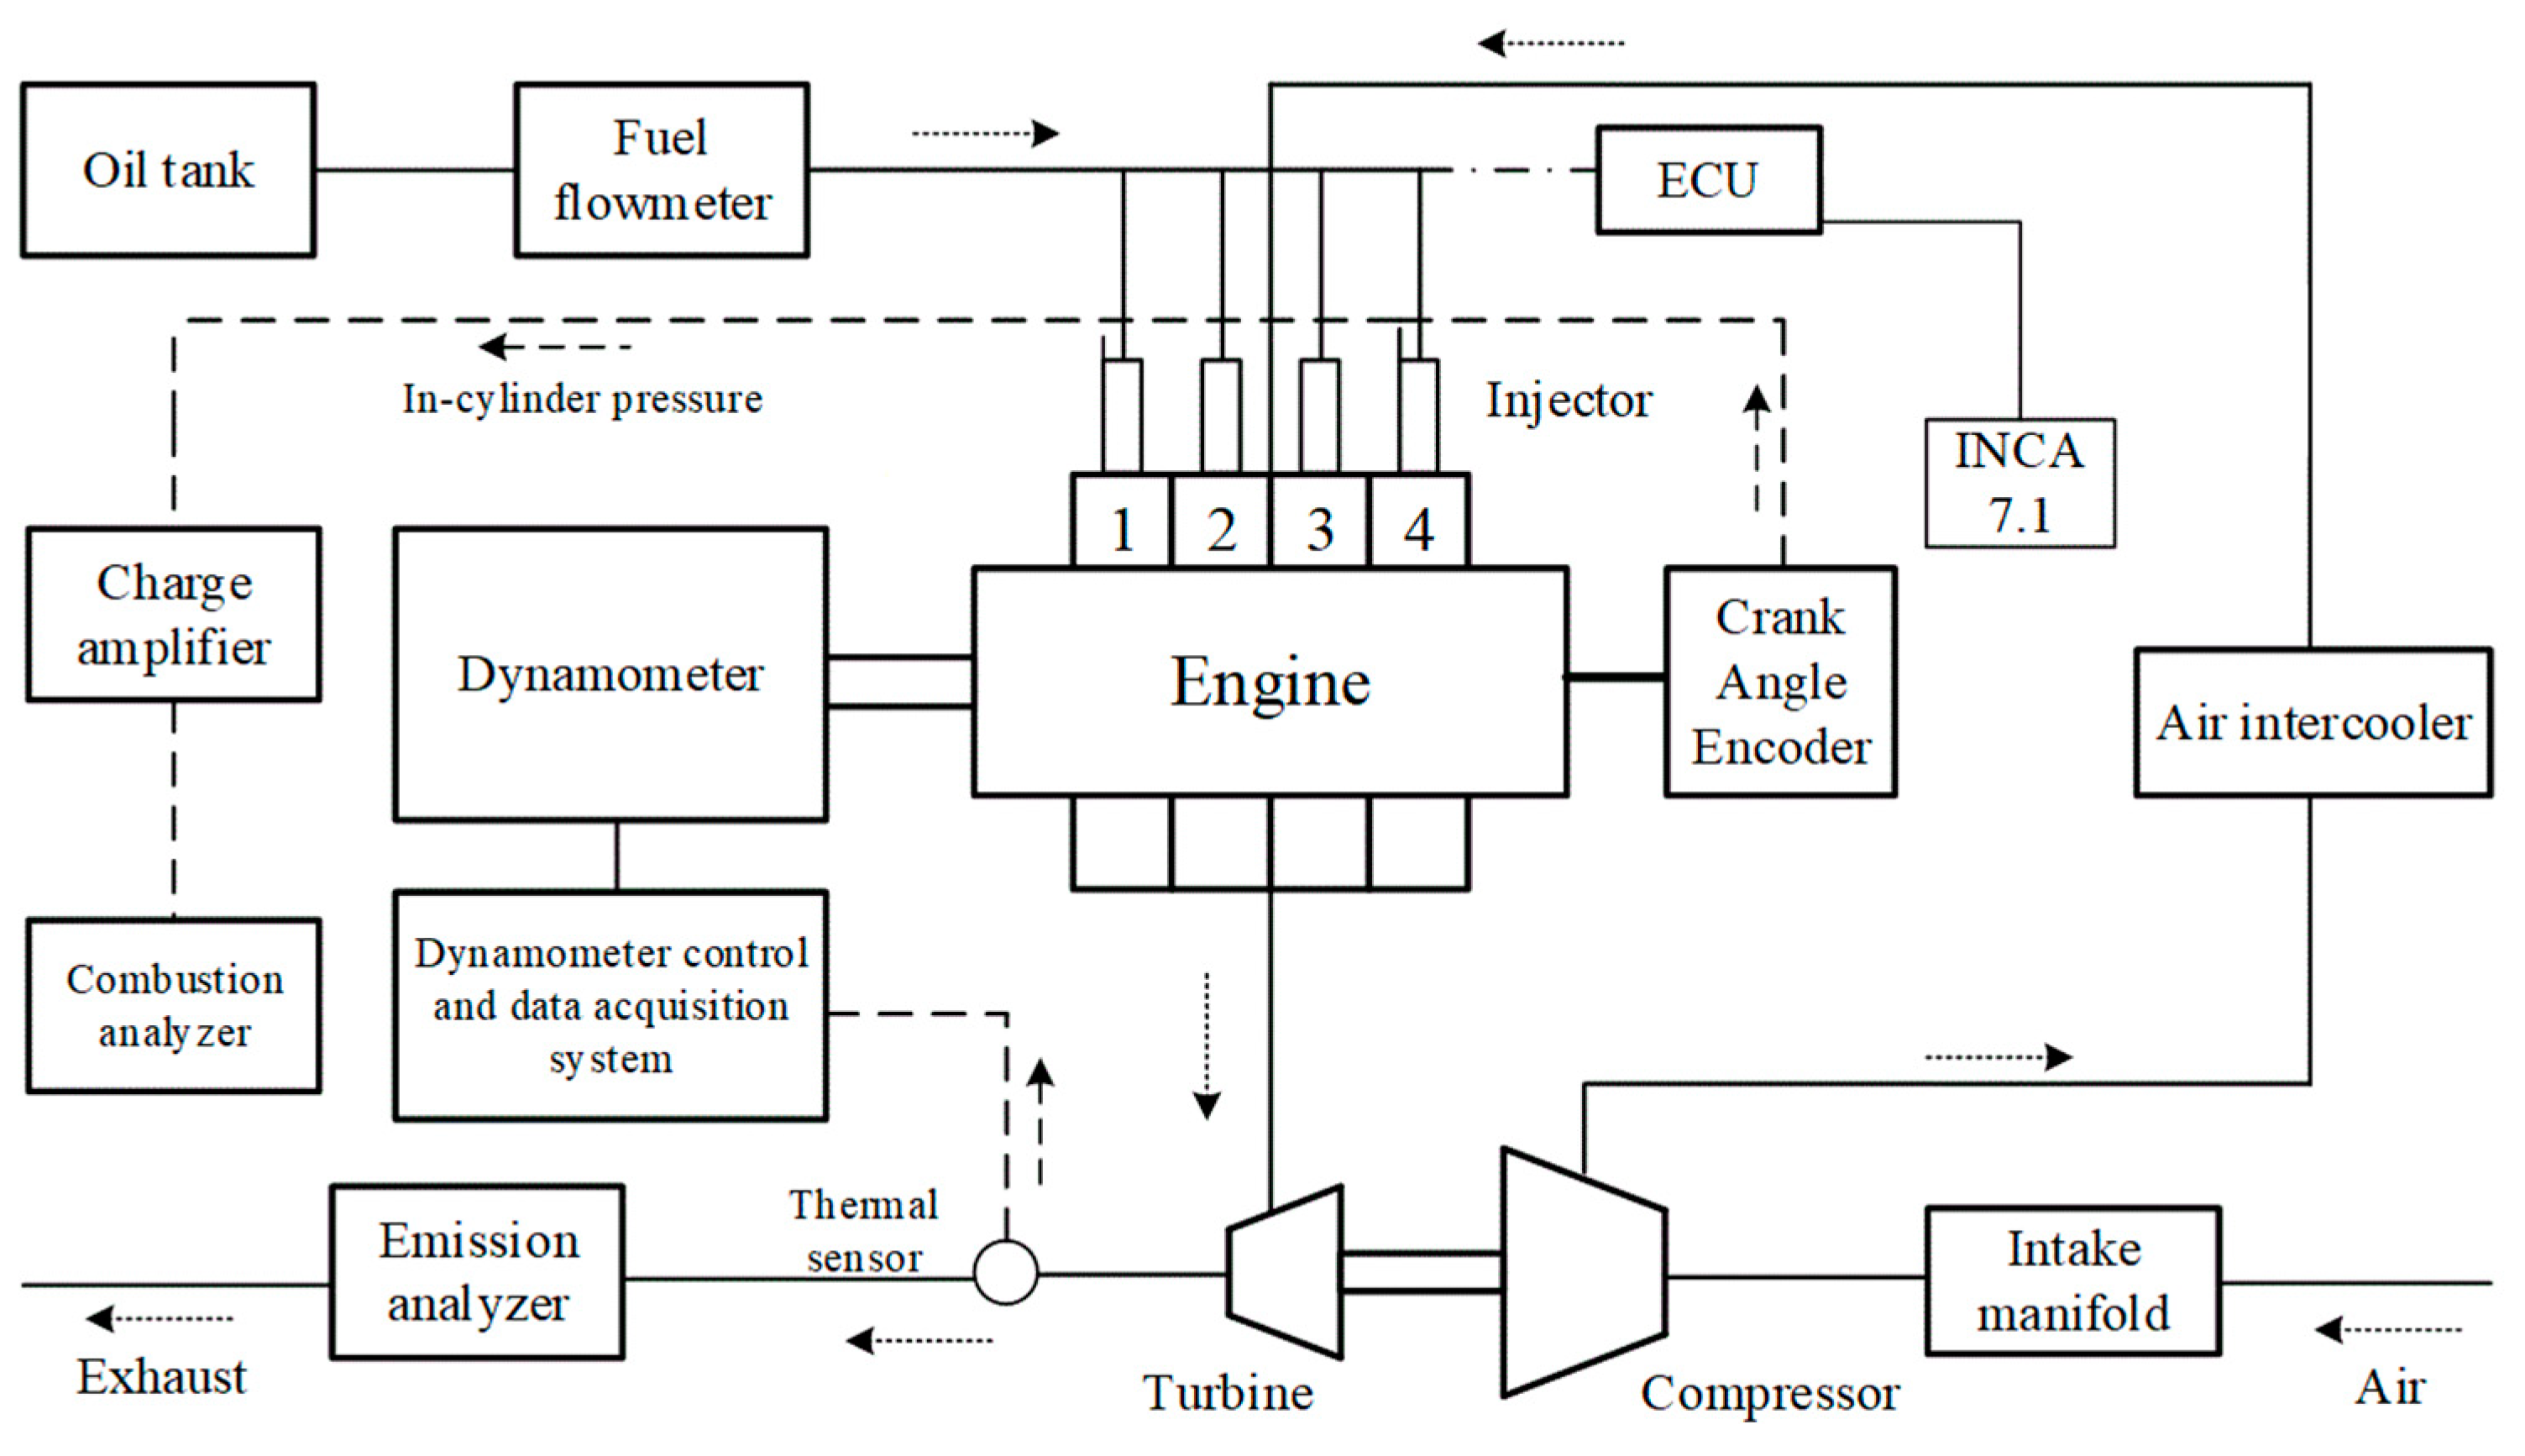
The engine used for the test was four-cylinder, turbocharged, and water-cooled with a compression ratio of 17.2, and the experimental platform is arranged as shown in Figure 2. Measuring equipment instruments for the test process and uncertainty analysis can be found in reference [9].
The main physical and chemical properties of the fuel are shown in Table 1. Although there are more variables of fuel characteristics, for the convenience of qualitative analysis in this paper, we choose a single variable with a large difference in the characteristics of one variable and similar characteristics of the other variables to be studied. The test conditions were selected for the engine test at the same rotational speed with three different loads of 25%, 50%, and 75% (Brake Mean Effective Pressure (BMEP) of 0.267 MPa, 0.535 MPa, and 0.802 MPa, respectively).

3. Results and Discussion

3.1. Effect of Fuel Volatility on Spray Characteristics

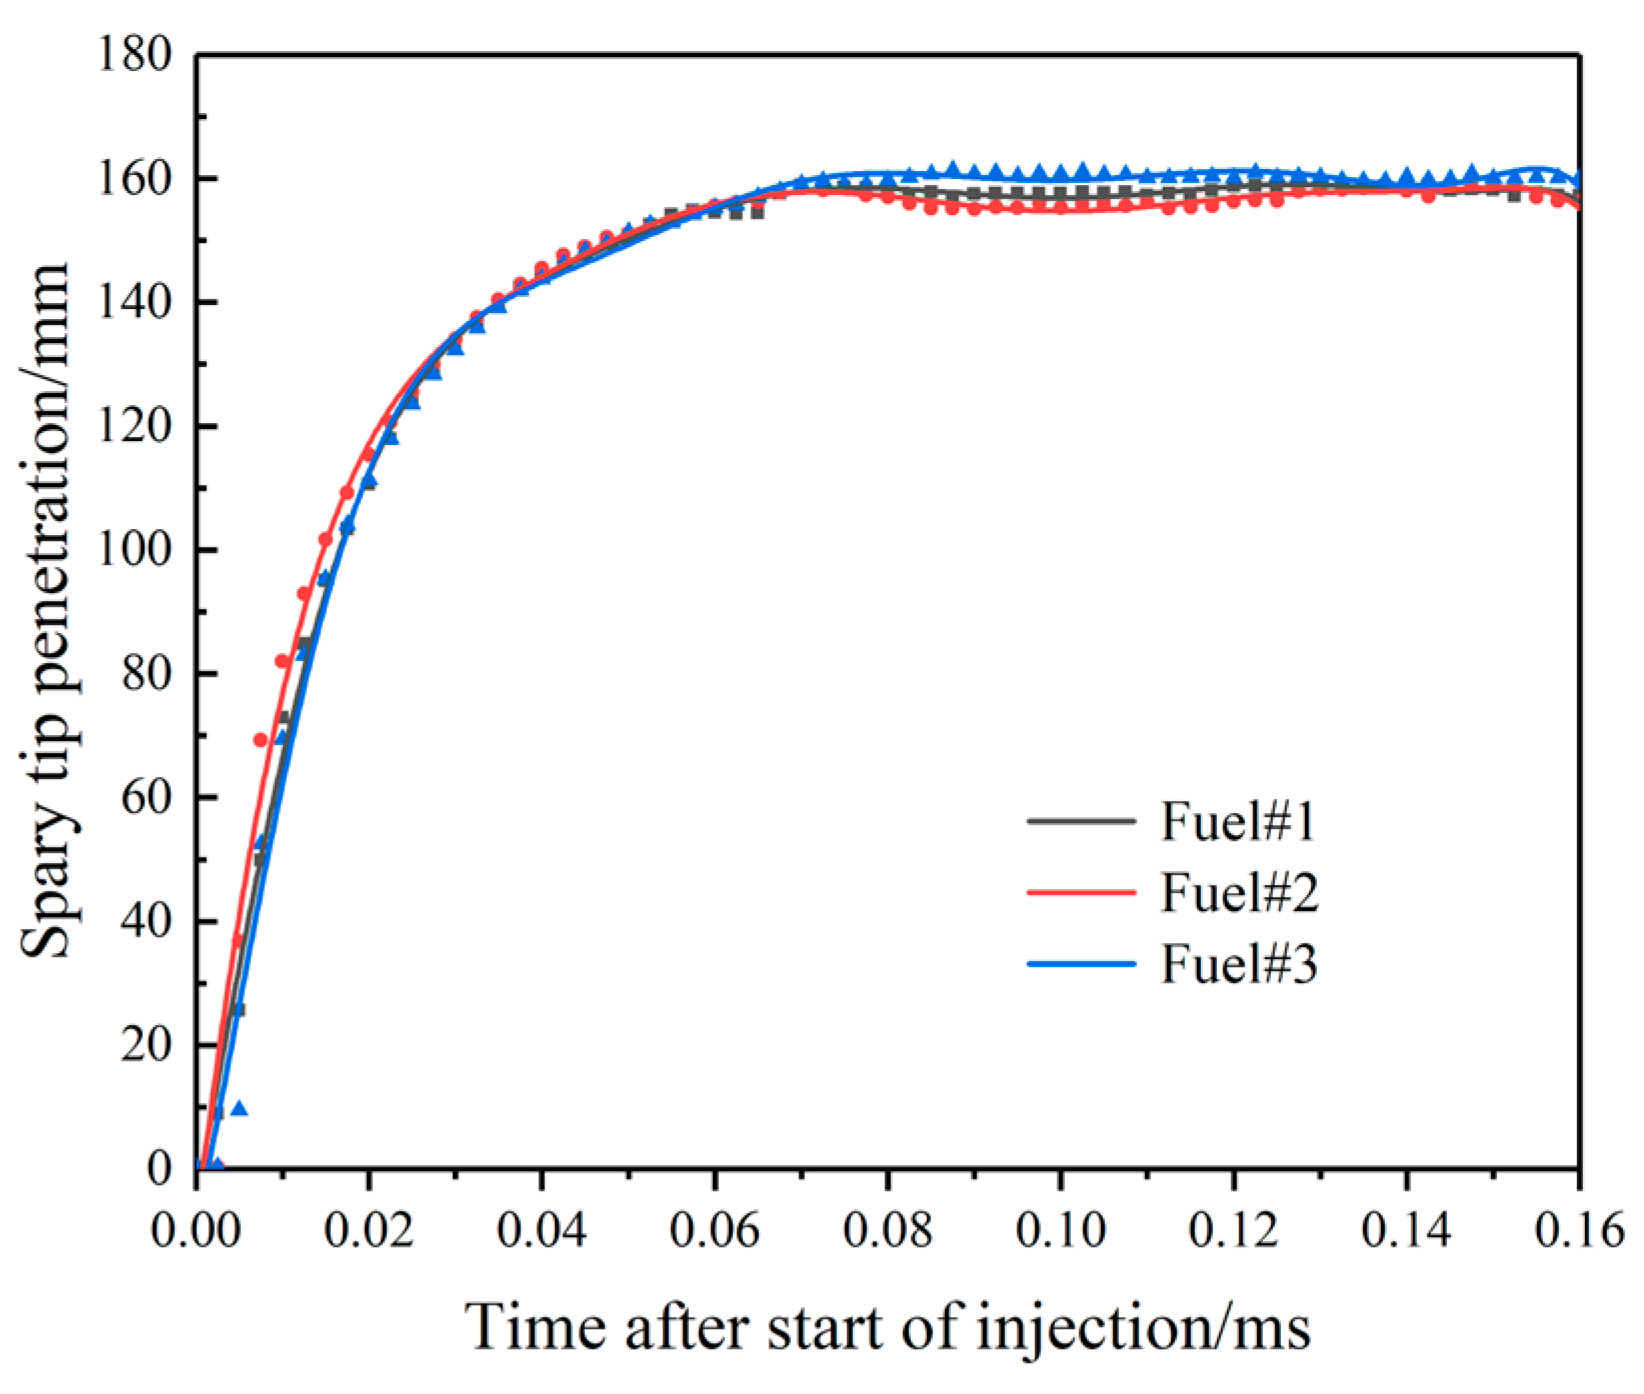
The 50% distillation temperature of the fuel indicates the average volatility of the diesel fuel. The 50% distillation temperature is low, which indicates that the diesel fuel contains more light fractions, which are more volatile and conducive to the formation of the mixture. The 90% distillation temperature and 95% distillation temperature indicate the content of the heavy fractions (heavy components) in the diesel fuel that are difficult to evaporate, which has a direct effect on the mixing and combustion of the fuel. If the content of heavy fractions is high, the fuel in the cylinder is not evaporated in time, which directly affects the formation of the mixture and leads to incomplete combustion. Therefore, it can be concluded that Fuel#2 has the best volatility and Fuel#3 has the worst volatility. During the experiment, the ambient pressure was set to 10 MPa, and the injection pressure was 100 MPa [9]. Figure 3 shows the effect of fuel volatility on spray tip penetration. After the spray has stabilized, Fuel#3 has the largest spray tip penetration value, followed by Fuel#1, and finally Fuel#2. This is because as volatility increases, the relative viscosity of the fuel decreases, and the spraying of the fuel into the incendiary bomb accelerates the breaking up of the fuel, and the increase in atomization results in the shortest spray tip penetration for the volatile Fuel#2.
The effect of fuel volatility on the spray cone angle is shown in Figure 4, where (a) is the near-field cone angle and (b) is the far-field cone angle. In spray studies, the classification of spray cone angles into near-field and far-field cone angles is used to more accurately characterize the development of sprays in space and time. The exact reasons and definitions of spray parameters can be found in reference [9]. In figure (a) (b), the fuel with the best volatility is Fuel#2 which has the largest near-field cone angle and far-field cone angle, followed by Fuel#1. The fuel with the smallest near-field cone angle and far-field cone angle is Fuel#3, which is the least volatile. In Figure (a), the near-field cone angles of the three volatile fuels show an increasing and then decreasing trend. Fuel#2 reaches the maximum value of 24.5/degree around 0.05 ms. In Figure (b) the far-field cone angles of the three volatile fuels show a localized fluctuating trend, and Fuel#2 reaches the maximum value of 25.2/degree around 0.07 ms.This is because the fuel with better volatility has a relatively low viscosity. With a certain injection pressure, into the combustion bomb, and the surrounding air will be involved in suction, volatile fuel, suction effect is more obvious, can be fully mixed with the air.
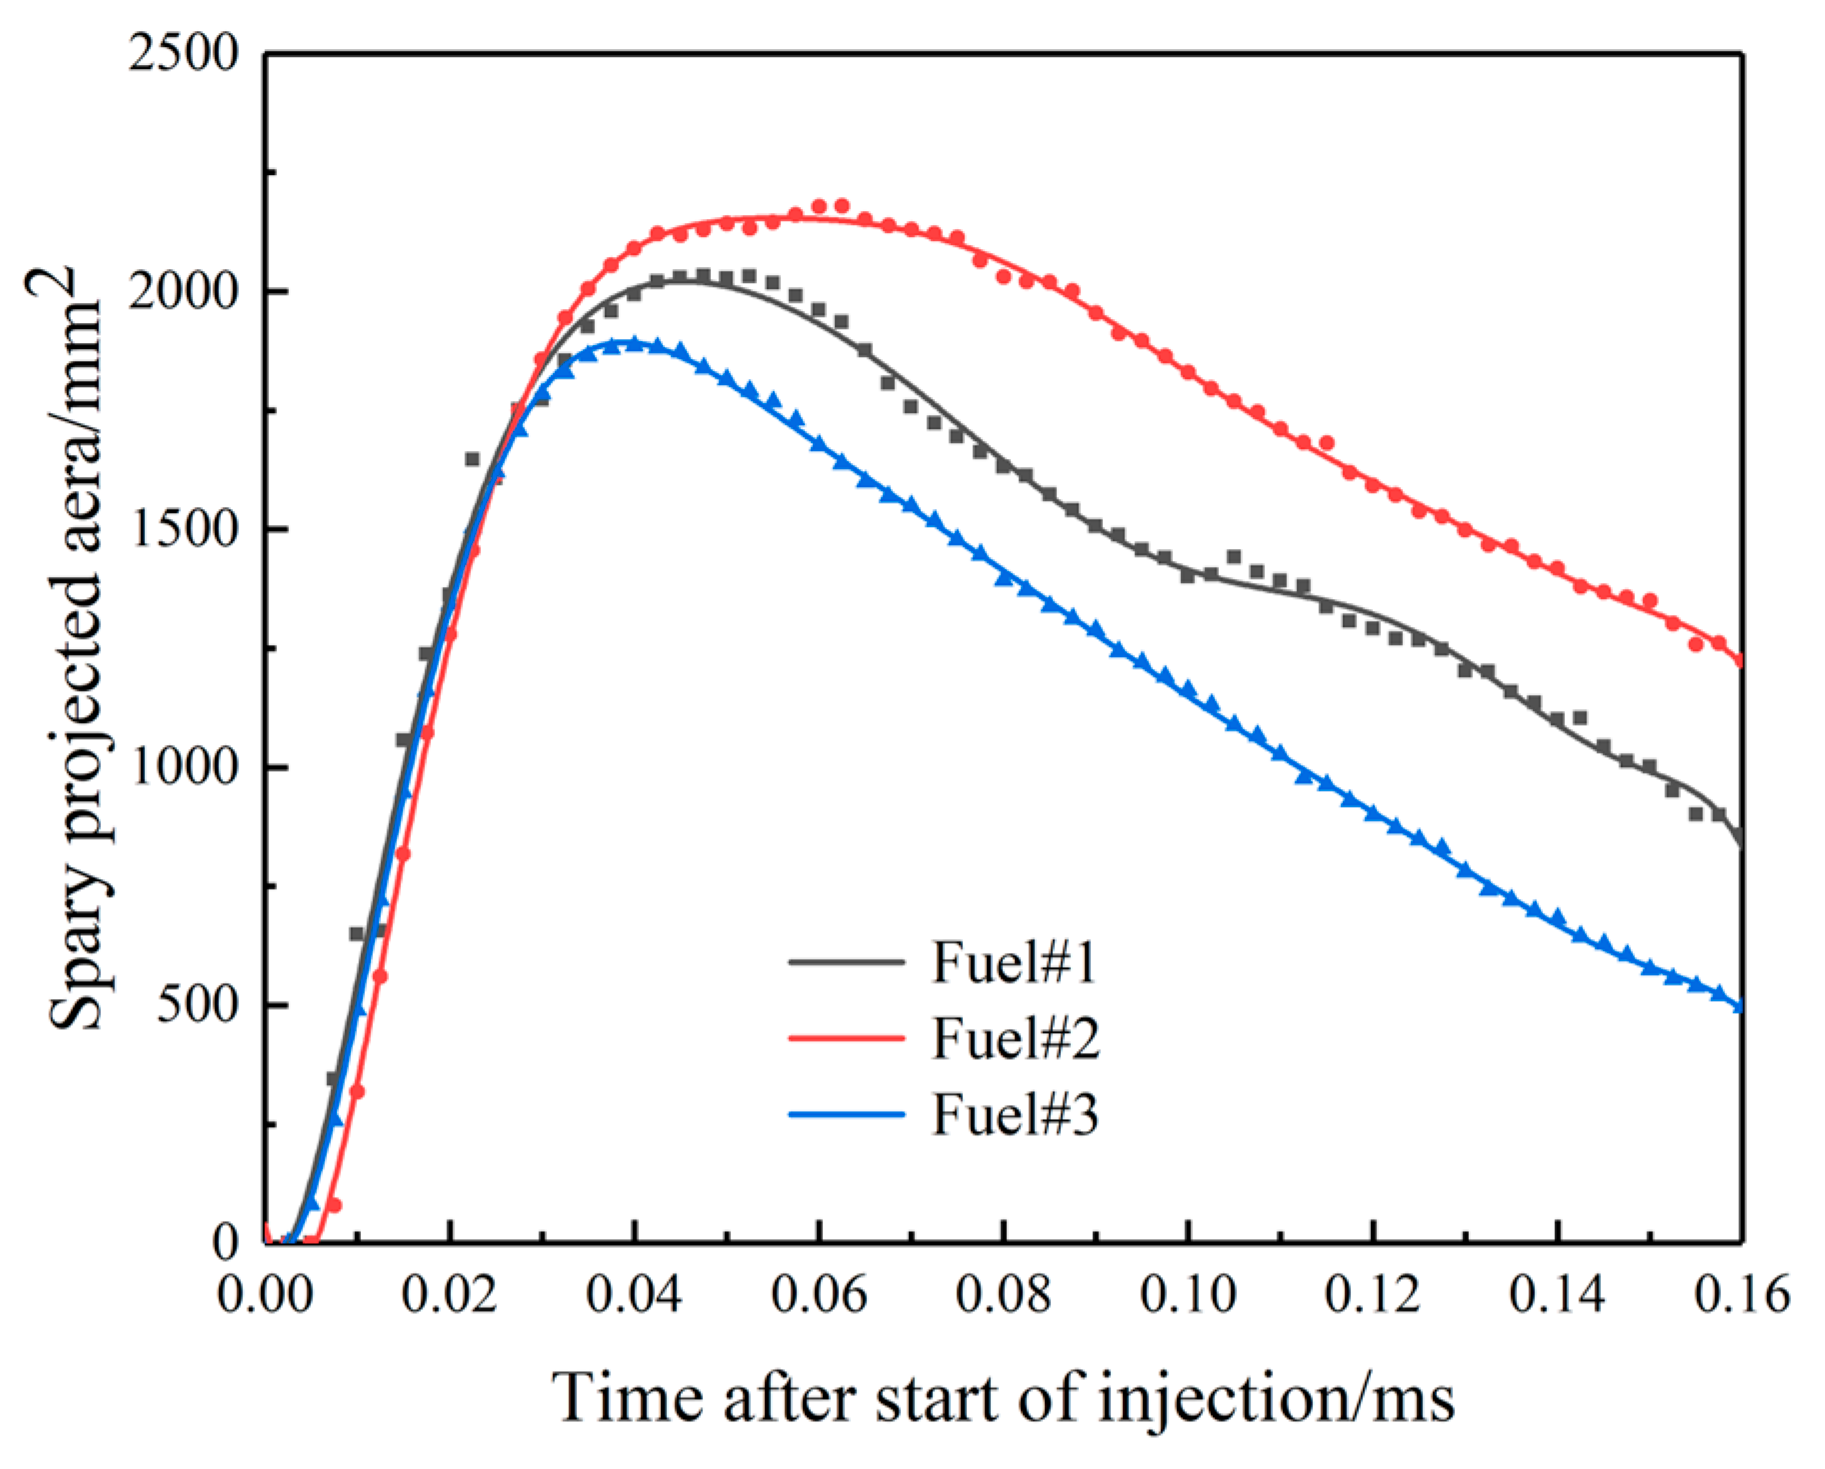
Figure 5 shows the effect of fuel volatility on the spray area. It can be seen that Fuel#2 has the largest spray area of 2228.74 mm2, followed by Fuel#1 of 2008.52 mm2, and the smallest spray area is Fuel#3 of 1760.25 mm2. This is because the volatility of the fuel is relatively low viscosity; with a certain injection pressure into the combustion bomb, the surrounding air will be involved in the inhalation, and the inhalation effect is more pronounced, so that the fuel through the distance has been reduced, but the diffusion of the spray to the radial direction of the tendency increased to improve the fuel evaporation to help increase the spray area.

3.1.1. Effect of Injection Pressure on Fuel Spray Characteristics

As shown in Figure 6a–c is the effect of spray pressure at 80 MPa, 100 MPa, and 120 MPa on the spray tip penetration, respectively. In Figure (a), the spray tip penetration of the three volatile fuels shows an increasing trend. Then it stays constant, and Fuel#3 reaches the maximum value of 161.3 mm at around 0.04 ms. In Figure (b), the spray tip penetration of the three volatile fuels shows an increased trend and then stays constant, with local fluctuations, but Fuel#3 has the highest spray tip penetration of 162.2 mm. 162.2 mm. In Figure (c), the spray tip penetration of the three volatile fuels shows a similar trend as in Figure (a) (b), with Fuel#3 having the highest spray tip penetration of 163.4 mm. The average spray tip penetration of Fuel#1, Fuel#2, and Fuel#3 increased by 4.21 mm, 3.49 mm, and 4.75 mm, respectively, at an injection pressure of 120 MPa compared with that at an injection pressure of 80 MPa. In addition, different volatile fuels exhibit different spray characteristics at different injection pressures. It can be seen that the spray tip penetration of Fuel#3 is larger than that of Fuel#1 and Fuel#2, which is because the fuel with good evaporation has a relatively low viscosity, which enables the fuel droplets to break up and atomize faster. Therefore, the volatility of the fuel plays a dominant role in the spatial development of the fuel bundle on its spray characteristics.
Figure 7 shows the effect of three different injection pressures on the variation of cone angles, where (a), (c), (e) are near-field cone angles and (b), (d), (f) are far-field cone angles. In Figure (a), the near-field cone angle shows a trend of appearing to increase and then decrease with time. Fuel#2 reaches its maximum value at about 0.03 ms. The near-field cone angles in descending order are Fuel#2 > Fuel#1 > Fuel#3. In Figure (c), the near-field cone angle shows an increasing and then decreasing trend with the increase of time. Fuel#2 reaches its maximum value at about 0.03 ms, which is 21.8 degrees. The near-field cone angles in descending order are Fuel#2 > Fuel#1 > Fuel#3. In Figure (e), the near-field cone angle follows the same trend as in Figure (a) (c). Fuel#2 reaches its maximum value of 20.2 degree at about 0.03 ms. In Figure (b), the far-field cone angle shows an emergent increasing trend with increasing time. The far-field cone angle in descending order of value is Fuel#2 > Fuel#1 > Fuel#3. In Figure (d), the far-field cone angle shows an increasing trend with the increase of time. The far-field cone angles in descending order are Fuel#2 > Fuel#1 > Fuel#3. In Figure (f), the far-field cone angles follow the same trend as in Figure (b) (d). When the injection pressure increases, the cone angle increases. This is due to the increase in the initial velocity of the fuel as it is ejected from the nozzle and the increased inward thrust of the jet. This enhanced inward thrust helps to overcome the surface tension of the fuel and facilitates the droplet breakup and atomization process. The change in cone angle tends to stabilize in the range of 0.03–0.06 ms. This indicates that the diffusion rate of the spray begins to slow down, and the spray pattern tends to stabilize. This is because the fuel that has been sprayed and the air in the CVC formed a stagnation effect on the subsequent sprayed fuel, and this effect limited the further development of the spray cone angle so that it remained in the stable range [10]. As the injection process proceeds, the fuel energy decreases. The morphology of the injected fuel changes and its distribution in the CVC becomes sparse. There are also ambient temperature effects on the outer layer of the liquid fuel where evaporative cooling occurs, i.e., the process of transforming droplets from the liquid phase to the gas phase. This phase change contributes to further atomization and mixing of the fuel [11].
Figure 8 shows the trend of spray projected area with time. (a)–(c) is the effect of spray pressure at 80 MPa, 100 MPa, and 120 MPa on the spray projected area, respectively. In Figure (a), it can be seen that the spray projected area Fuel#2 reaches its maximum value at about 0.04 ms, which is 2053.4 mm2. The spray projected area in order of numerical size is Fuel#2 > Fuel#1 > Fuel#3. In Figure (b), it can be seen that Fuel#2 reaches its maximum value at about 0.03 ms, which is 2282.5 mm2. The order of the spray projected area according to the value: Fuel#2 > Fuel#1 > Fuel#3. In Figure (c), it can be seen that Fuel#2 reaches its maximum value at about 0.04 ms, which is 2687.1 mm2. The trend of the spray projected area is the same as that of the Figure (a) and (b). This is because improving the volatility of the fuel can help the gaseous fuel to diffuse more efficiently and the spray projection area increases.The increase in injection pressure increases the rate of increase in the spray projection area slightly and also causes the spray to reach its maximum area in a shorter time. In terms of spray projected area, with the improvement of volatility, the spray projected area also increases. the maximum spray projected area of Fuel#1, Fuel#2, and Fuel#3 increased by 521.24 mm2, 553.72 mm2, and 482.74 mm2, respectively, at an injection pressure of 120 MPa compared with that at an injection pressure of 80 MPa. From Table 1, it can be seen that the volatile fuel has low density, the mass of spray droplets with the same particle size is small, and accordingly, the momentum of the fuel after spraying is small, which makes the fuel penetration distance decrease, but increases the diffusion tendency of the spray to the radial direction, which is conducive to improving the mixture homogeneity of the mixture.

3.1.2. Effect of Ambient Pressure on Spray Characteristics

Figure 9 shows the curves of spray tip penetration force with time for different ambient pressures. (a), (b) is the effect of ambient pressure of 5 MPa, and 10 MPa on the spray tip penetration, respectively. In Figure (a), the spray tip penetration of the three volatile fuels tends to increase and then remain unchanged, with Fuel#3 reaching its maximum value around 0.04 ms, In descending order of spray tip penetration: Fuel#3 > Fuel#1 > Fuel#2. In Figure (b), the spray tip penetration of the three volatile fuels shows an increasing and then constant trend, with local fluctuations, and Fuel#3 reaches its maximum value around 0.06 ms. The order of spray tip penetration for the three fuel volatiles remains consistent with Figure (a). The average spray tip penetration of the three fuels, Fuel#1, Fuel#2, and Fuel#3, at an ambient pressure of 5 MPa compared to that at an ambient pressure of 10 MPa increased by 7.92 mm, 6.11 mm, and 9.49 mm, respectively, suggesting that higher ambient pressure hinders the development of spray tip penetration, and the higher the ambient pressure, the smaller the increase in spray tip penetration. This is because when the ambient pressure increases, the density of the ambient gas subsequently becomes larger, and the coiling and suction of the oil beam with the ambient medium intensify during the forward movement, resulting in a larger loss of kinetic energy. In addition, as fuel volatility improves, the fuel spray penetration distance decreases, which is because the fuel will have an increased coiling effect with the ambient medium and the camera will not be able to capture the spray edge [12].
Figure 10 shows the trend of cone angle with time. (a) (b) is the near-field cone angle, and (c) (d) is the far-field cone angle. The near-field cone angles in Figure (a) (b) show an increasing and then decreasing trend. In Figure (a), it can be seen that Fuel#2 reaches its maximum value at 0.04 ms, which is 20.1 degree. In Figure (b), it can be seen that Fuel#2 reaches its maximum value at 0.07 ms, which is 23.7 degree. The near-field cone angles in the order of magnitude of the values are Fuel#2 > Fuel#1 > Fuel#3. Figure (c) (d) of the far-field cone angle shows an increasing trend. In Figure (c), it can be seen that Fuel#2 reaches its maximum value of 28.2 degree at 0.16 ms, and in Figure (d), it can be seen that Fuel#2 reaches its maximum value of 24.8 degree at 0.06 ms. The order of the far-field cone angle according to the magnitude of the values is Fuel#2 > Fuel#1 > Fuel#3. This is because improved fuel volatility can contribute to more efficient diffusion of gaseous fuels and increased far-field cone angles.At an ambient pressure of 10 MPa, the near-field cone angle decreases, which is attributed to the fact that the spray pressure pushes the oil beam forward, and the oil droplets evaporate and interact with the ambient gas, resulting in a decrease in the cone angle. At the same time, the increase in ambient pressure helps the gaseous fuel to diffuse more efficiently [13].
Figure 11 illustrates the dynamic curve of the spray projection area with time under different ambient pressure conditions. Observation of the curves shows that the spray projected area increases and then decreases with time. In Figure (a), it can be seen that Fuel#2 reaches its maximum value at 0.03 ms, which is 2282.5 mm2. In Figure (b), it can be seen that Fuel#2 reaches its maximum value at 0.04 ms, which is 2282.5 mm2. The spray projection area is ranked in order of magnitude: Fuel#2 > Fuel#1 > Fuel#3. The maximum spray area for the three fuels (#1, #2, and #3) increased by 420.92 mm2, 316.11 mm2, and 67.49 mm2, respectively, at 10 MPa ambient pressure compared to 5 MPa, which is mainly because a fuel with good evaporation has a relatively low viscosity, which enables the fuel droplets to be broken up, accelerates the atomization rate, increases the diffusion of the spray in the radial direction, and increases the tendency of spray diffusion in the radial direction.

3.2. Effect of Fuel Volatility on Combustion and Emissions

3.2.1. CGP and HRR

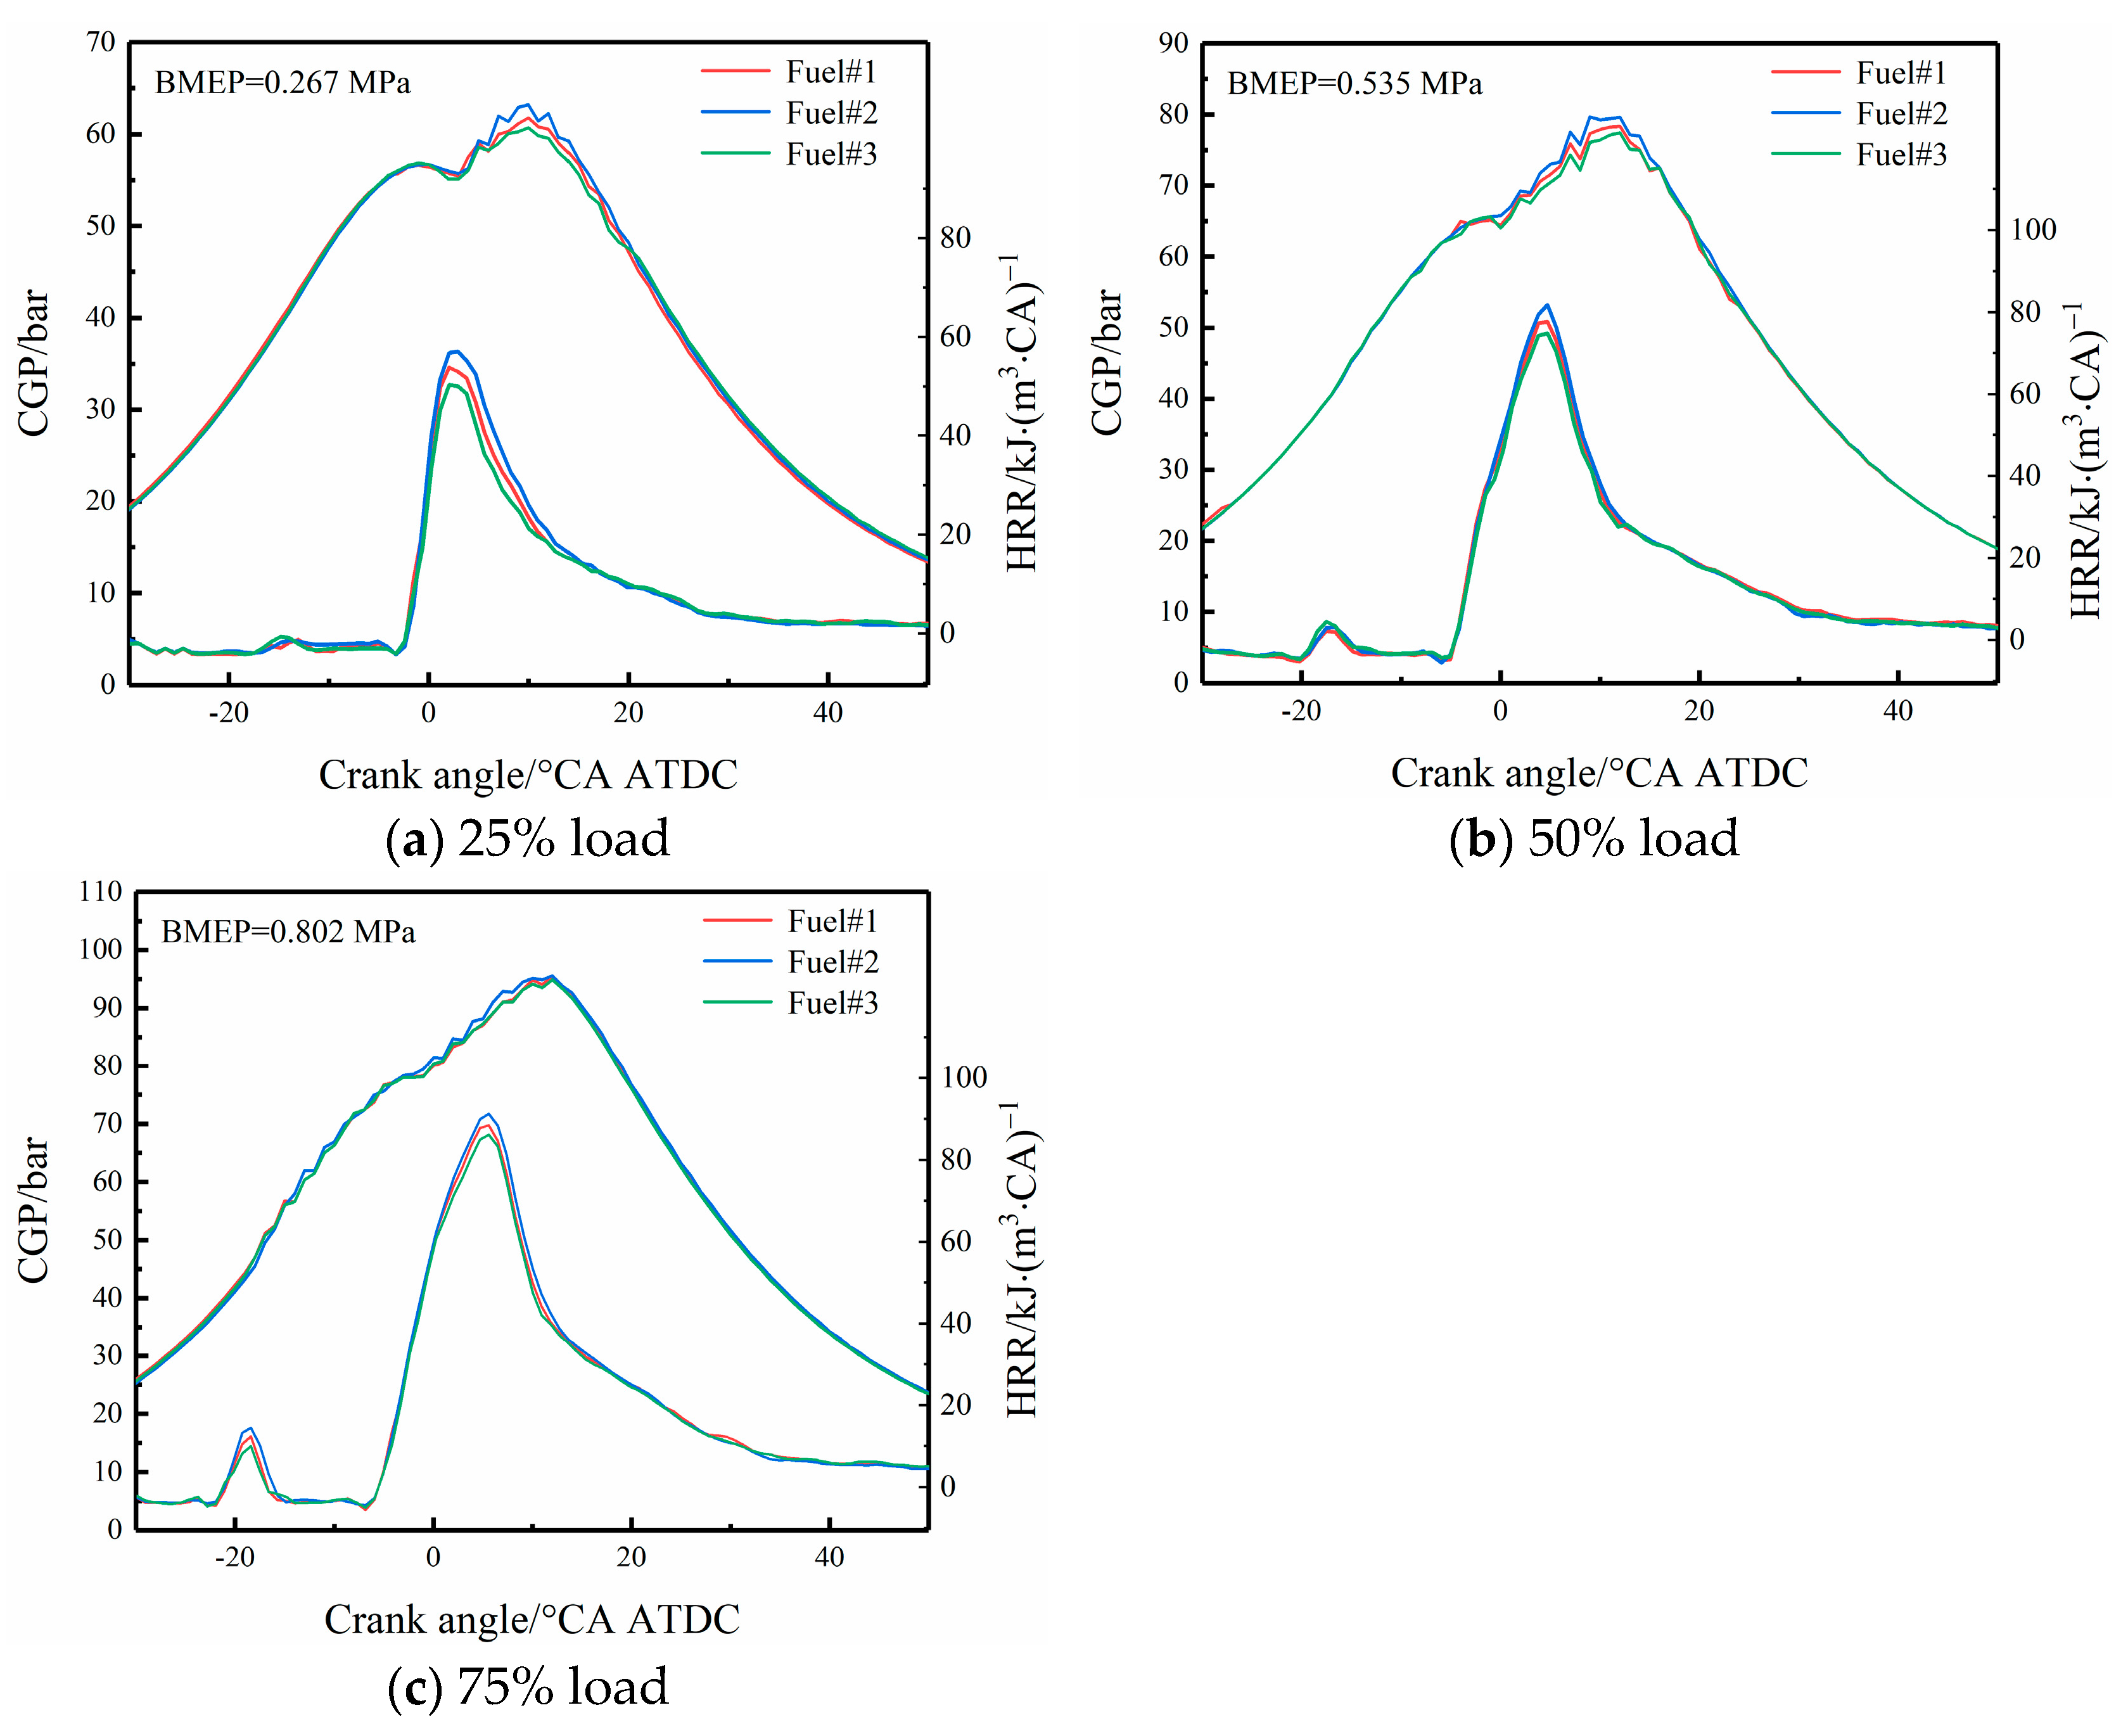
The cylinder gas pressure (CGP) and heat release rate (HRR) for three different volatile fuels at three engine load conditions are shown in Figure 12. BMEP increases from 0.267 MPa to 0.802 MPa, the peak CGP increases from 65 bar to 95 bar, and the HRR has increased from 57 kJ/m3/°CA to 90 kJ/m3/°CA because as the load increases, the temperature inside the cylinder increases, and the fuel can be fully atomized and combusted, bursting out more CGP and HRR. The volatile fuel remained at 25% engine load with no pre-injection heat release, while the other two loads have pre-injection heat release. Next, the ID and CD are analyzed separately [14]. It can be seen from the graphs that improving volatility increases both CGP and HRR. Improved volatility allows for better mixing with the air, and within the ID, a larger and better-quality mixture can be formed, resulting in a certain degree of increase in CGP and HRR after ignition [15].

3.2.2. ID and CD

The variation of ID and CD with engine load for different volatile test fuels is shown in Figure 13. The three different volatile fuels were categorized and analyzed based on the fact that they did not produce pre-injection heat release at different loads [16]. At 25% load, the ID for the three volatile fuels was in the range of 2.5–4 °CA, whereas for the fuel that produced the pre-injection of heat release, the ID was in the range of 14–17 °CA. This is due to the different ways of calculation. The values were obtained by integrating them against the heat release curves [17]. The IDs for the three volatile fuels are consistent across loads. The fuel with better volatility, Fuel#2, has the shortest ID, followed by the fuel with moderate volatility, Fuel#1, and the longest ID is for the fuel with the worst volatility, Fuel#3. At 25% load, the three fuels that did not produce pre-spray had burn times in the range of 28–33 °CA, while the fuels that produced pre-sprayed heat release had burn times in the range of 55–65 °CA. The reason for this is similar to the IDs. The longest burn time was for the more volatile Fuel#2, followed by the moderately volatile Fuel#1, and the shortest burn time was for the least volatile Fuel#3.

3.2.3. BTE

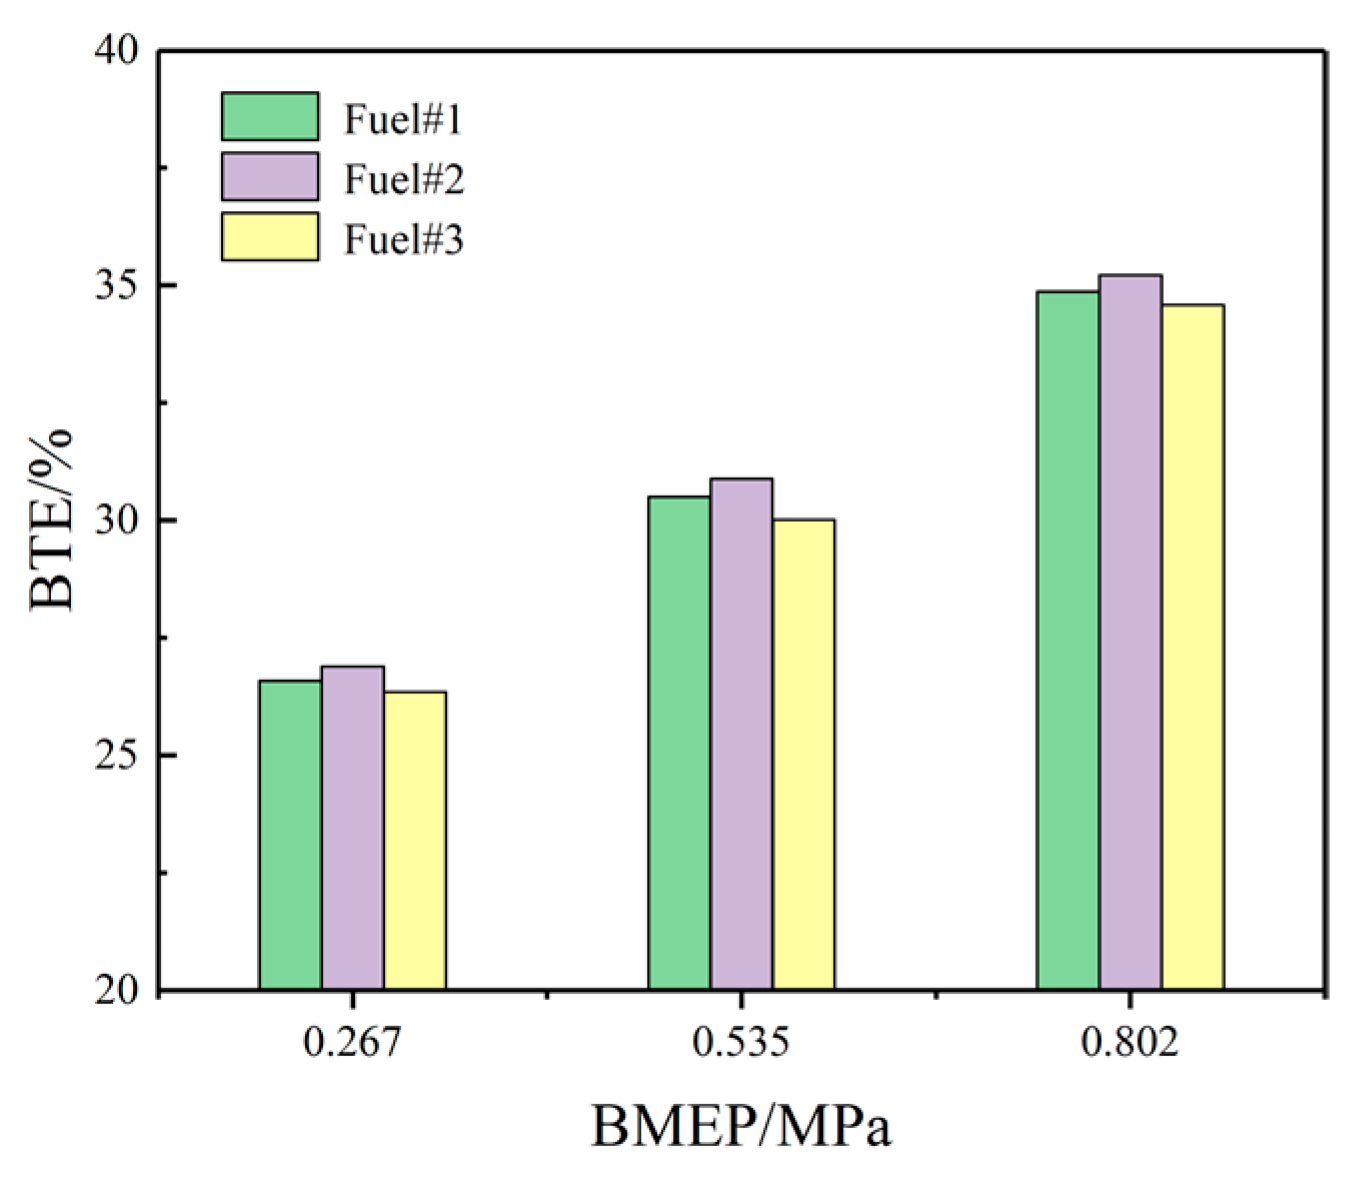
The variation of brake thermal efficiency (BTE) emissions with engine load for different volatile test fuels is shown in Figure 14. The fuel with better volatility maintains the highest BTE at all different loads. This is due to the fact that the fuel with better volatility can effectively promote mixing with air, and more premixed gases can be formed during the ID, improving the combustion quality and increasing the BTE [18]. At BMEP = 0.267 MPa engine load, the BTE of all three fuels is around 26% and similar values, but at medium and high loads, the BTE of volatile fuels shows significant differences. The increase in BTE from 0.267 MPa to 0.802 MPa in BMEP is about 14.7% and 14.2%, respectively. This is due to the lower BTE resulting from the lower in-cylinder temperature and poor fuel atomization quality at low load conditions [19]. An increase in load and an increase in in-cylinder temperature leads to an increase in BTE, which provides sufficient conditions for the full combustion of fuel as well as an increase in BTE [20].

3.2.4. HC and CO Emission

Figure 15 shows the effect of volatile fuels on HC and CO at different engine loads. The improvement in fuel volatility results in lower HC and CO emissions. The main reason is that improved volatility of the fuel promotes the uniformity of mixing between fuel and air in the cylinder and a weakening of the action of the narrow gap effect so that more fuel is involved in combustion [21]. As BMEP = 0.267 MPa increases to BMEP = 0.802 MPa, there will be a significant increase in the in-cylinder temperature, and the volatility of the fuel is enhanced, so that more fuel will be volatilized and come into contact with the air during the ID. Increasing the contact area, the above two aspects caused a further increase in the volatilized fuel from Fuel#2, which was able to promote the formation of a combustible mixture, improve the quality of combustion, and lead to a reduction in the unvolatilized fuel in the in-cylinder slit, resulting in lower HC and CO emission values [22].

3.2.5. NOx Emission

The variation of NOx emission with engine load for the three different volatile test fuels is shown in Figure 16. NOx emission is mainly dependent on three factors, which are high temperature, oxygen enrichment, and CD. As volatility improves, NOx emissions also increase [23]. This is because fuel volatility affects the ID, which can be seen in the figure; the better the volatility, the shorter the ID. For the same starting load, the volatility of Fuel#2 is about 1.5–2 °CA shorter than the ID of Fuel#3, which leads to an increase in the initial heat release, and the better volatility of the fuel results in the formation of a larger quality of premix during the ID, which leads to an increase in cylinder temperatures, which also leads to an increase in NOx emissions [24]. The more volatile fuel will volatilize a small portion of the fuel in the cylinder into the residual slit of the cylinder; this area will remain at a higher temperature, and the area has less volatile fuel, but relatively more oxygen will also cause an increase in NOx in this area. Overall, NOx emissions increase as volatility improves. The NOx growth rate increases as the load increases [25]. The NOx growth rate is 41.7%, 41.5%, and 42.5% when the working condition is from 25% load to 50% load, and 43.7%, 43.7%, and 45.7% when the working condition is from 50% load to 75% load. This is mainly because the increase from the 25% load condition to the 75% load condition under the same operating conditions and fuel premise causes an increase in the cylinder temperature, and the HRR also increases, so NOx emission increases [26].

3.2.6. PMs Emissions

The variation in the distribution of PM number concentration with particle size for the three different volatile test fuels at different engine loads is shown in Figure 17. With the increase in load, the peaks of the number concentrations of combusted PM of the three fuels showed an increasing trend, showing a single-peak distribution, and the peaks corresponded to the particle sizes shifted toward the large particle sizes [27]. In addition, the distribution of the number concentration of PM with particle size for the three tested fuels at 25% load was not consistent with the trend of particle size distribution at 50% and 75% load. The reason is that at 25% load, with the improvement of fuel volatility, it can promote the mixing of fuel and air uniformly and reduce the overdense area in the cylinder [28], which in turn reduces the PM number concentration, but in this condition, for the more volatile fuel, part of the volatilized fuel will enter into will be in the residual gap narrow slit in the cylinder, which will cause the PM number concentration to increase [29]. However, at 50% and 75% loads, the temperature in the cylinder increases and the ID decreases, and Fuel#3 should be selected to reduce the PM number concentration [30]. However, Fuel#2 has an aromatic content of 21.2%, which is the highest of the three volatile fuels, and therefore causes an increase in the PM number concentration. Therefore, at medium to large loads, a fuel with better volatility and lower aromatic content should be selected to reduce the PM number concentration [31].
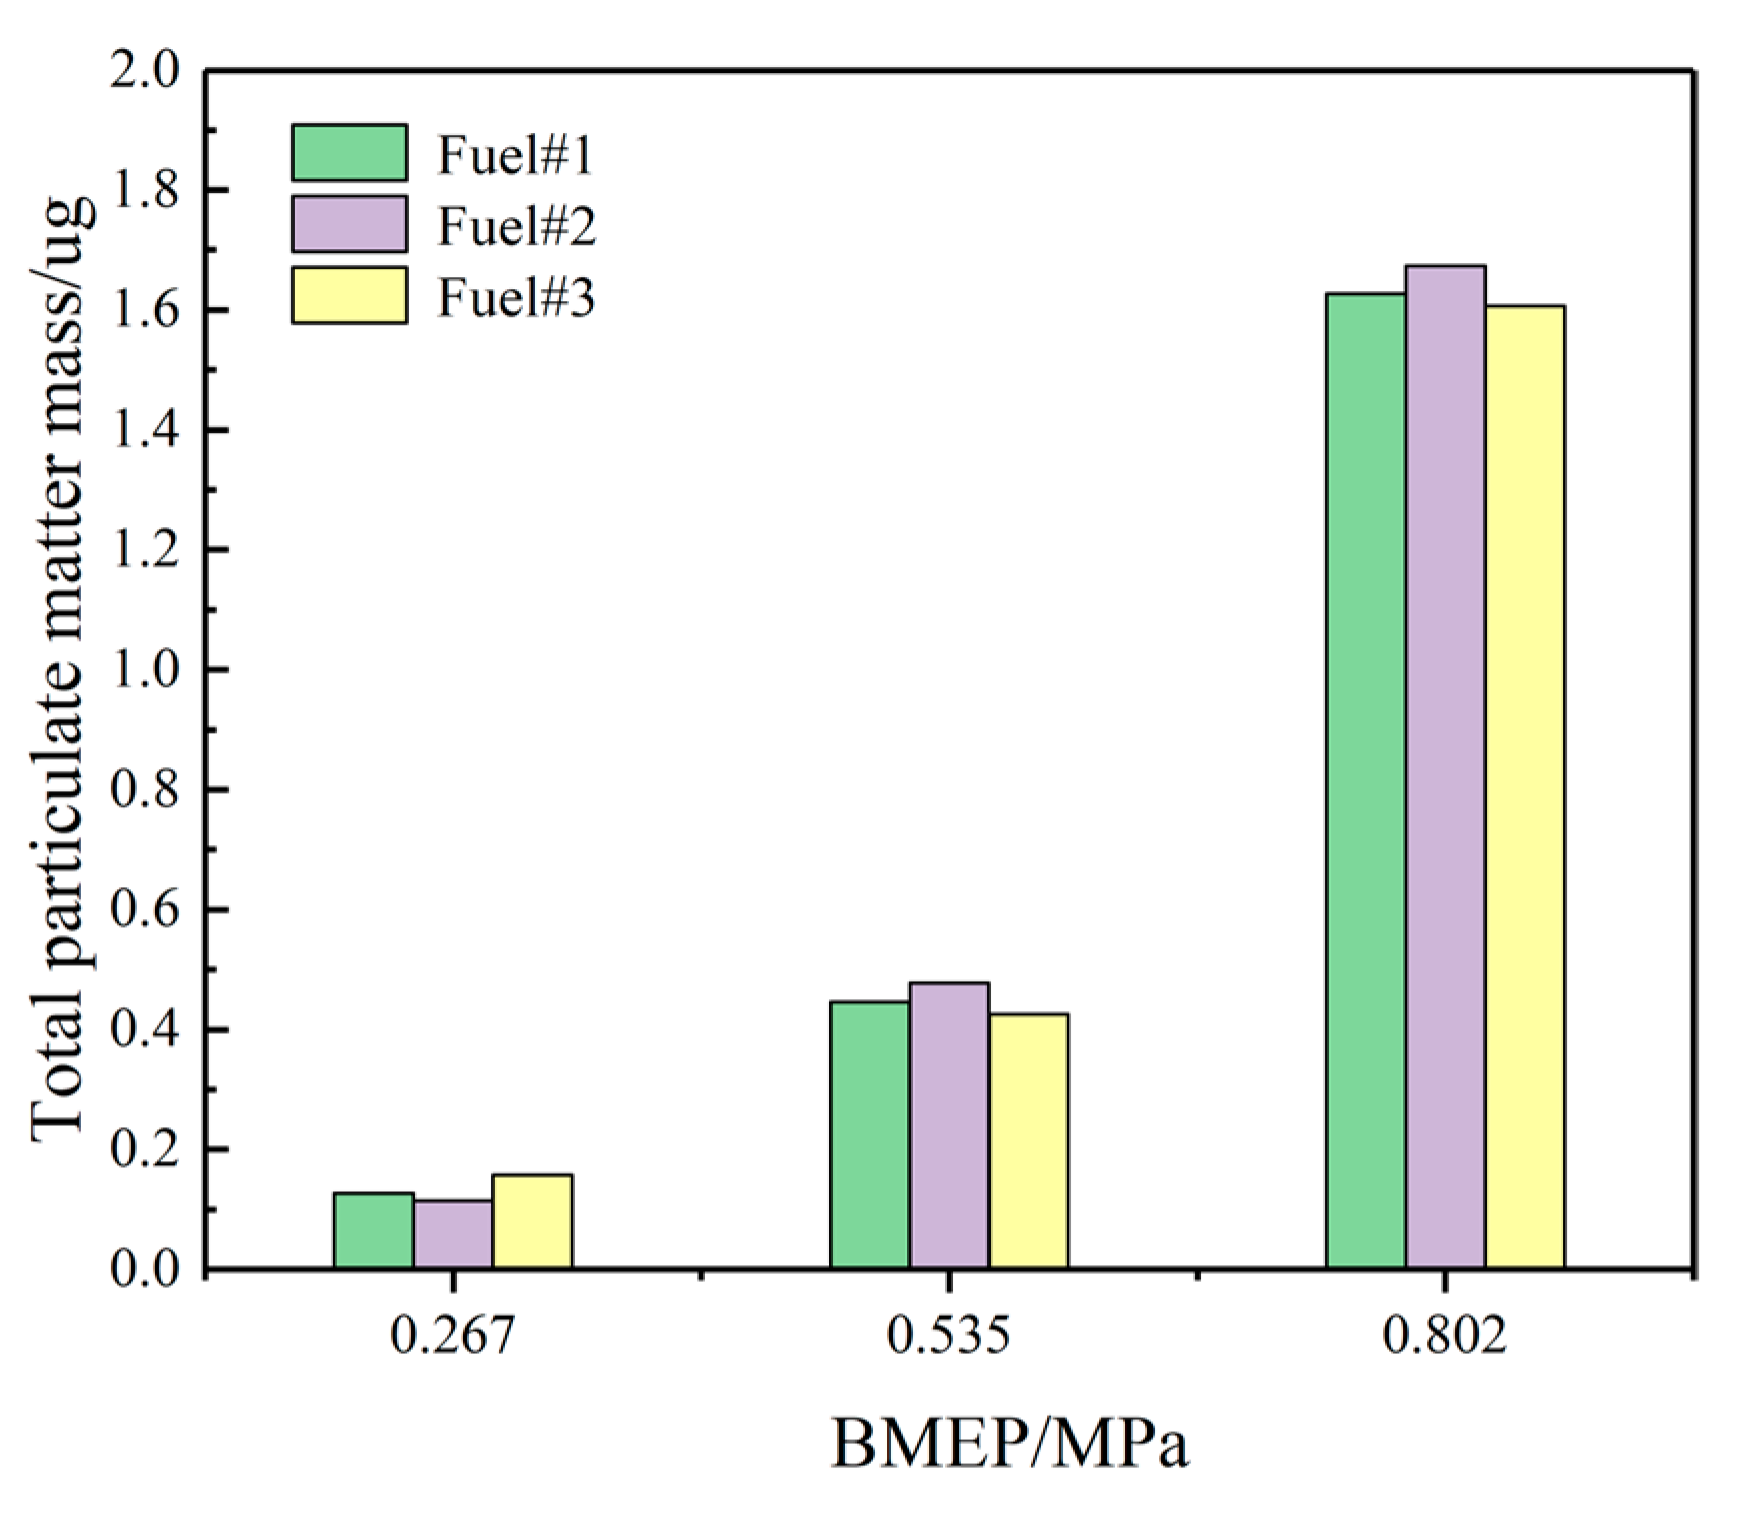
The changes in the engine load of PM mass concentration of the three different volatile test fuels are shown in Figure 18. At 25% load, the increase in the volatile and aromatic hydrocarbon content of the fuel resulted in a decrease followed by an increase in the total PM concentration. [32]. From the figure, it can be concluded that Fuel#2 with medium volatility and aromatic hydrocarbon content can be used at 25% load condition. At 50% and 75% loads, the trends of PM mass concentrations caused by the three volatile fuels remained consistent, and the less volatile and least aromatic Fuel#3 should be selected, which can reduce the PM mass concentrations. Overall, the physicochemical properties of the fuels (volatility and aromatic content) affected the PM mass concentration at 25% load, but at 50% and 75% loads, the aromatic content contributed more to the PM mass concentration than the volatility of the fuels [33].

4. Conclusions

This paper provides a theoretical and experimental basis for the development of new diesel additives or fuel formulations to improve combustion efficiency and reduce pollutant emissions. It also provides a scientific basis for subsequent exploration of the quantitative relationship between diesel fuel volatility improvement and engine performance optimization for engine design and adjustment of operating parameters. We evaluate the long-term impact of diesel volatility improvement on achieving broader environmental and energy sustainability goals. The above studies are expected to provide new insights into cleaner combustion technologies for diesel engines and contribute to the promotion of sustainable development in the fields of energy and environmental protection. This will not only help to reduce environmental pollution but also promote the improvement of energy utilization efficiency and lay the foundation for a greener and more efficient energy system. The main conclusions of this paper are as follows:
(1)
For fuel spraying, increasing rail pressure and decreasing ambient back pressure can increase the spray tip penetration and spray projected area. Specifically, as rail pressure increases from 80 MPa to 120 MPa and ambient pressure decreases from 10 MPa to 5 MPa, spray nozzle penetration spray increases by approximately 1–5%, and the projected area increases by 15–25%. At the same time, rail pressure has little effect on the spray cone angle, while increasing ambient back pressure can increase the spray cone angle. Although the volatile fuel reduces the spray tip penetration, the larger spray cone angle makes the total spray area larger, which is conducive to improving the degree of oil and gas mixing.
(2)
Improved fuel volatility effectively reduces CO emissions by about 8–10% and HC emissions by about 13–16%, but it increases NOx emissions by about 8–11%. Analyzing from the perspective of PM, it is necessary to combine the aromatic content of volatile fuels. Under low load conditions, it is recommended to use fuels with moderate volatility and aromatic content, and at medium and high loads, the volatility of the fuel has less weight on particulates and more weight on aromatics, so at medium and high loads, it is recommended to use fuels with less volatility and lower aromatic content.
(3)
With the increase in load, the peak CGP and HRR increased by 46.15% and 57.89%, respectively. The effect of volatility on cylinder pressure and combustion exothermic onset decreases. Redefine the ID and CD for different diesel volatile fuels with and without pre-injection heat release under different load conditions.

Author Contributions

K.L., J.L.: Methodology, Software, Writing-original manuscript. G.L., Z.S.: Conceptualization, Writing—Reviewing and Editing. Z.J., J.F.: Visualization. All authors commented on the manuscript. All authors have read and agreed to the published version of the manuscript.

Funding

This research received no external funding.

Institutional Review Board Statement

Not applicable.

Informed Consent Statement

Not applicable.

Data Availability Statement

The data that support the findings of this study are available from the corresponding author upon reasonable request.

Conflicts of Interest

The authors declare that they have no known competing financial interests or personal relationships that could have appeared to influence the work reported in this paper.

References

  1. Wang, Z.; Xu, H.; Jiang, C.; Wyszynski, M.L. Experimental study on microscopic and macroscopic characteristics of diesel spray with split injection. Fuel 2016, 174, 140–152. [Google Scholar] [CrossRef]
  2. Kook, S.; Pickett, L.M. Effect of fuel volatility and ignition quality on combustion and soot formation at fixed premixing conditions. SAE Int. J. Engines 2010, 2, 11–23. [Google Scholar] [CrossRef]
  3. Kitano, K.; Nishiumi, R.; Tsukasaki, Y.; Tanaka, T.; Morinaga, M. Effects of fuel properties on premixed charge compression ignition combustion in a direct injection diesel engine. SAE Tech. Pap. 2003. [Google Scholar] [CrossRef]
  4. Sluder, C.S.; Wagner, R.M.; Lewis, S.A.; Storey, J.M. Fuel property effects on emissions from high efficiency clean combustion in a diesel engine. SAE Tech. Pap. 2006. [Google Scholar] [CrossRef]
  5. Hutchison, B.R.M.; Wallace, J.S. Influence of fuel volatility on particulate matter emissions from a production DISI engine. Fuel 2021, 303, 121206. [Google Scholar] [CrossRef]
  6. Stanik, W. The effect of the cetane number improver on the ignition properties and combustion process of diesel fuel in a compression ignition engine. Naft.-Gaz-Sci. Technol. Oil Gas Ind. 2017, 73, 651–659. [Google Scholar]
  7. Ge, C.J.; Kim, Y.H.; Yoon, K.S.; Choi, N.J. Reducing volatile organic compound emissions from diesel engines using canola oil biodiesel fuel and blends. Fuel 2018, 218, 266–274. [Google Scholar] [CrossRef]
  8. Sun, B.; Zhao, S.; Zhai, Y.; Liu, Q.; Wu, G.; Wu, H. Effect of Fuel Physicochemical Properties on Spray and Particulate Emissions. ACS Omega 2022, 7, 44251–44265. [Google Scholar] [CrossRef]
  9. Wu, H.; Xie, F.; Han, Y. Effect of cetane coupled with various engine conditions on diesel engine combustion and emission. Fuel 2022, 322, 124164. [Google Scholar] [CrossRef]
  10. Singh, A.P.; Agarwal, A.K. Experimental evaluation of sensitivity of low-temperature combustion to intake charge temperature and fuel properties. Int. J. Engine Res. 2018, 19, 732–757. [Google Scholar] [CrossRef]
  11. Xie, H.Z.; Song, L.B.; Xie, Y.Z.; Pi, D.; Shao, C.; Lin, Q. An Experimental Study on the Macroscopic Spray Characteristics of Biodiesel and Diesel in a Constant Volume Chamber. Energies 2015, 8, 5952–5972. [Google Scholar] [CrossRef]
  12. Chen, W.; Shuai, S.; Wang, J. Effect of the cetane number on the combustion and emissions of diesel engines by chemical kinetics modeling. Energy Fuels 2010, 24, 856–862. [Google Scholar] [CrossRef]
  13. Camille, H.; Chetankumar, P.; Lam, T.N.; Nilaphai, O.; Mounaïm-Rousselle, C. Effect of ABE and butanol blends with n-dodecane in different volume ratios on diesel combustion and soot characteristics in ECN spray a conditions. Fuel 2023, 345, 128099. [Google Scholar]
  14. Liu, S.; Zhu, Z.; Zhang, Z.; Gao, G.; Wei, Y. Effect of a cetane number (CN) improver on combustion and emission characteristics of a compression-ignition (CI) engine fueled with an ethanol–diesel blend. Energy Fuels 2010, 24, 2449–2454. [Google Scholar] [CrossRef]
  15. Han, Y.; Hu, S.; Sun, Y.; Sun, X.; Tan, M.; Xu, Y.; Tian, J.; Li, R.; Shao, Z. Compositional effect of gasoline on fuel economy and emissions. Energy Fuels 2018, 32, 5072–5080. [Google Scholar] [CrossRef]
  16. Wei, J.; Yin, Z.; Wang, C.; Lv, G.; Zhuang, Y.; Li, X.; Wu, H. Impact of aluminum oxide nanoparticles as an additive in diesel-methanol blends on a modern DI diesel engine. Appl. Therm. Eng. 2021, 185, 116372. [Google Scholar] [CrossRef]
  17. Wu, H.; Xie, F.; Han, Y.; Zhang, Q.; Li, Y. Effect of cetane coupled injection parameters on diesel engine combustion and emissions. Fuel 2022, 319, 123714. [Google Scholar] [CrossRef]
  18. Groendyk, M.; Rothamer, D. Effect of increased fuel volatility on CDC operation in a light-duty CIDI engine. Fuel 2017, 194, 195–210. [Google Scholar] [CrossRef]
  19. Burger, J.L.; Lovestead, T.M.; Gough, R.V.; Bruno, T.J. Characterization of the effects of cetane number improvers on diesel fuel volatility by use of the advanced distillation curve method. Energy Fuels 2014, 28, 2437–2445. [Google Scholar] [CrossRef]
  20. Bao, J.; Wang, H.; Wang, R.; Wang, Q.; Di, L.; Shi, C. Comparative experimental study on macroscopic spray characteristics of various oxygenated diesel fuels. Energy Sci. Eng. 2023, 11, 1579–1588. [Google Scholar] [CrossRef]
  21. Sekimoto, K.; Koss, A.R.; Gilman, J.B.; Selimovic, V.; Coggon, M.M.; Zarzana, K.J.; Yuan, B.; Lerner, B.M.; Brown, S.S.; Warneke, C.; et al. High-and low-temperature pyrolysis profiles describe volatile organic compound emissions from western US wildfire fuels. Atmos. Chem. Phys. 2018, 18, 9263–9281. [Google Scholar] [CrossRef]
  22. Chen, P.C.; Wang, W.C.; Roberts, W.L.; Fang, T. Spray and atomization of diesel fuel and its alternatives from a single-hole injector using a common rail fuel injection system. Fuel 2013, 103, 850–861. [Google Scholar] [CrossRef]
  23. Huang, H.; Liu, Q.; Wang, Q.; Zhou, C.; Mo, C.; Wang, X. Experimental investigation of particle emissions under different EGR ratios on a diesel engine fueled by blends of diesel/gasoline/n-butanol. Energy Convers. Manag. 2016, 121, 212–223. [Google Scholar] [CrossRef]
  24. Teoh, Y.H.; Huspi, H.A.; How, H.G.; Sher, F.; Din, Z.U.; Le, T.D.; Nguyen, H.T. Effect of Intake Air Temperature and Premixed Ratio on Combustion and Exhaust Emissions in a Partial HCCI-DI Diesel Engine. Sustainability 2021, 13, 8593. [Google Scholar] [CrossRef]
  25. Loo, D.L.; Teoh, Y.H.; How, H.G.; Teh, J.S.; Andrei, L.C.; Starčević, S.; Sher, F. Applications Characteristics of Different Biodiesel Blends in Modern Vehicles Engines: A Review. Sustainability 2021, 13, 9677. [Google Scholar] [CrossRef]
  26. Wei, L.; Cheung, C.S.; Huang, Z. Effect of n-pentanol addition on the combustion, performance and emission characteristics of a direct-injection diesel engine. Energy 2014, 70, 172–180. [Google Scholar] [CrossRef]
  27. Zhu, J.; Huang, H.; Zhu, Z.; Lv, D.; Pan, Y.; Wei, H.; Zhuang, J. Effect of intake oxygen concentration on diesel–n-butanol blending combustion: An experimental and numerical study at low engine load. Energy Convers. Manag. 2018, 165, 53–65. [Google Scholar] [CrossRef]
  28. Kim, S.Y.; Han, J.E.; Sohn, Y.S. Demand Forecasting for Heavy-Duty Diesel Engines Considering Emission Regulations. Sustainability 2017, 9, 166. [Google Scholar] [CrossRef]
  29. Alptekin, E. Emission, injection and combustion characteristics of biodiesel and oxygenated fuel blends in a common rail diesel engine. Energy 2017, 119, 44–52. [Google Scholar] [CrossRef]
  30. Teoh, Y.H.; How, H.G.; Sher, F.; Le, T.D.; Nguyen, H.T.; Yaqoob, H. Fuel Injection Responses and Particulate Emissions of a CRDI Engine Fueled with Cocos nucifera Biodiesel. Sustainability 2021, 13, 4930. [Google Scholar] [CrossRef]
  31. Ge, J.C.; Kim, J.Y.; Yoo, B.O.; Song, J.H. Effects of Engine Load and Ternary Mixture on Combustion and Emissions from a Diesel Engine Using Later Injection Timing. Sustainability 2023, 15, 1391. [Google Scholar] [CrossRef]
  32. Zhao, X.; Yang, F.; Li, Z.; Tan, H. Formation and emission characteristics of PAHs during pyrolysis and combustion of coal and biomass. Fuel 2024, 378, 132935. [Google Scholar] [CrossRef]
  33. Li, X.; Liu, Q.; Ma, Y.; Wu, G.; Yang, Z.; Fu, Q. Simulation Study on the Combustion and Emissions of a Diesel Engine with Different Oxygenated Blended Fuels. Sustainability 2024, 16, 631. [Google Scholar] [CrossRef]
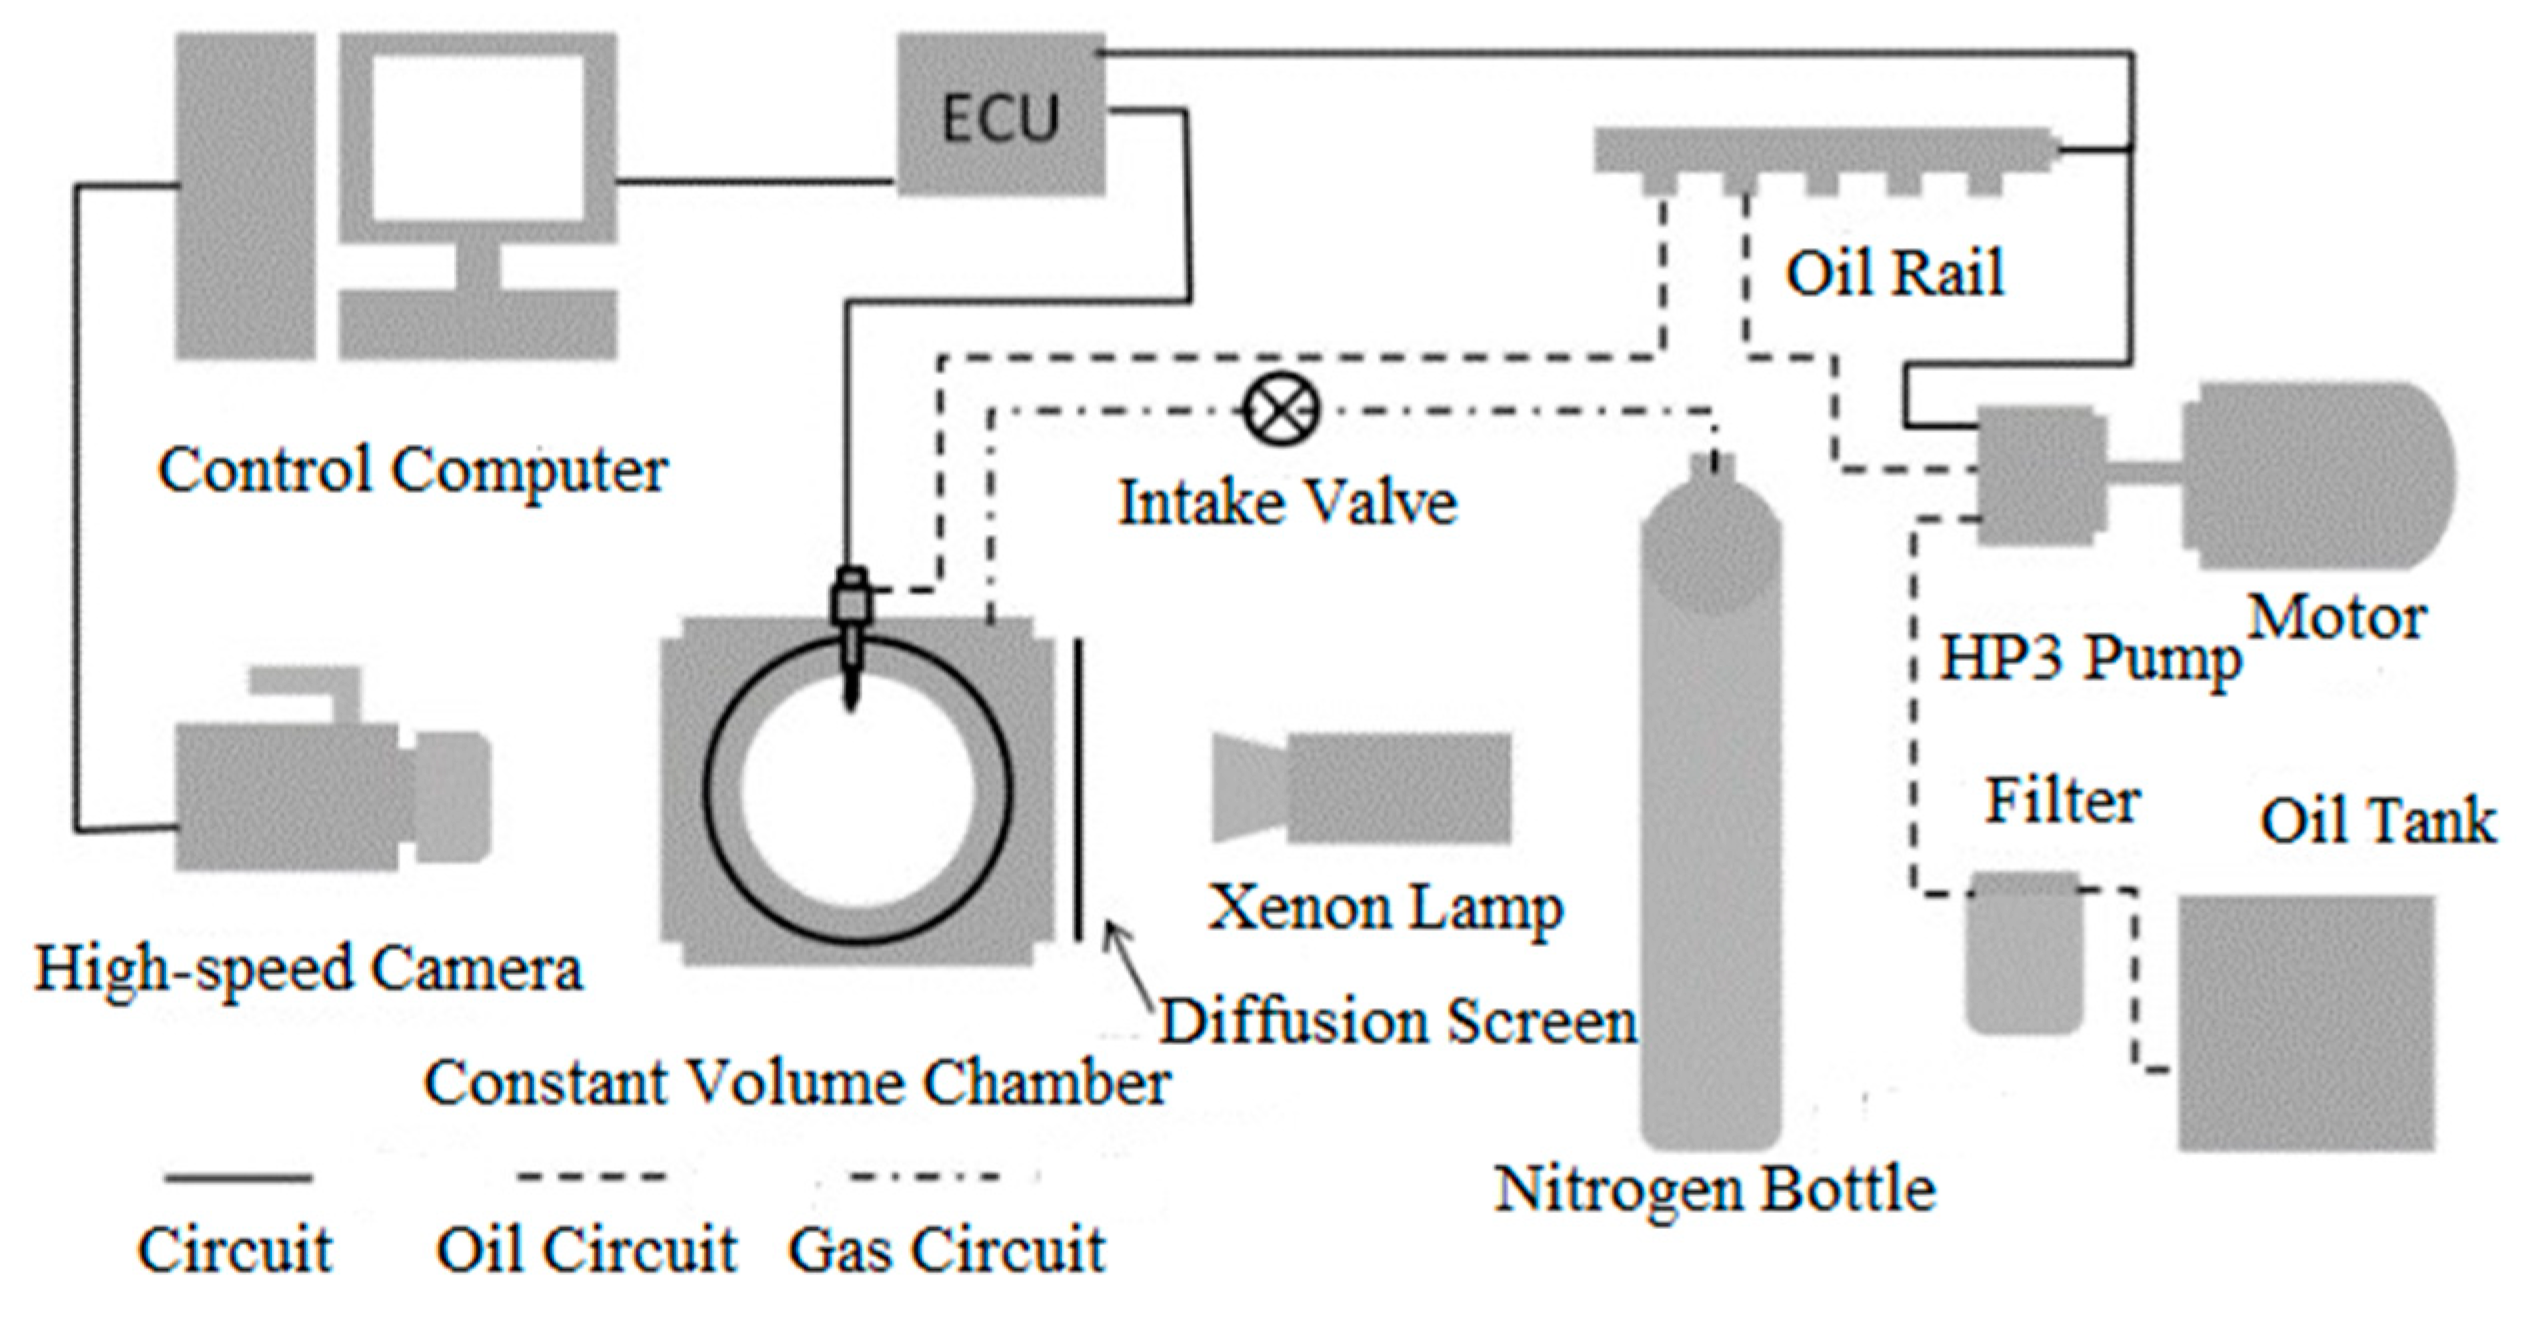
Figure 1. Schematic of the experimental set-up.
Sustainability 16 10764 g001
Figure 2. Schematic diagram of the engine stand.
Sustainability 16 10764 g002
Figure 3. Effect of fuel volatility on spray tip penetration.
Sustainability 16 10764 g003
Figure 4. Effect of different diesel fuel volatility on spray cone angle.
Sustainability 16 10764 g004
Figure 5. Effect of fuel volatility on spray projected area.
Sustainability 16 10764 g005
Figure 6. Effect of injection pressure on spray tip penetration.
Sustainability 16 10764 g006
Figure 7. Effect of injection pressure on spray cone angle.
Sustainability 16 10764 g007aSustainability 16 10764 g007b
Figure 8. Effect of injection pressure on spray projected area.
Sustainability 16 10764 g008
Figure 9. Effect of ambient pressure on spray tip penetration.
Sustainability 16 10764 g009
Figure 10. Effect of ambient pressure on spray cone angle.
Sustainability 16 10764 g010aSustainability 16 10764 g010b
Figure 11. Effect of ambient pressure on spray projected area of volatile fuels.
Sustainability 16 10764 g011
Figure 12. CGP and HRR of volatility of three fuels at different engine loads.
Sustainability 16 10764 g012
Figure 13. ID and CD for three fuel volatilities at different engine loads.
Sustainability 16 10764 g013
Figure 14. Volatile BTE of three fuels at different engine loads.
Sustainability 16 10764 g014
Figure 15. Fuel volatility effects on HC and CO.
Sustainability 16 10764 g015
Figure 16. Volatility effects on NOx emissions.
Sustainability 16 10764 g016
Figure 17. The effect of volatility on the number concentrations of PM.
Sustainability 16 10764 g017
Figure 18. PM mass of 3 volatile fuels at different engine loads.
Sustainability 16 10764 g018
Table 1. Main characteristics of test fuel.
Properties#1#2#3
LowCalorific value (MJ/kg)42.9442.9942.95
Density (25 °C) (kg/m3)818.8818.8820.6
KinematicViscosity (25 °C) (mm2/s)3.43.43.4
Surface Tension (10−3 N/m)24.924.524.4
50% distillation temperature (°C)244.4234.6259.8
90% distillation temperature (°C)330.8338.6360.3
95% distillation temperature (°C)342.6359.1361.8
Sulfur content (mg/kg)3.73.84.1
Cyclic aromatic hydrocarbon content (%)15.421.214.8
Alkane content (%)50.147.337.8
Disclaimer/Publisher’s Note: The statements, opinions and data contained in all publications are solely those of the individual author(s) and contributor(s) and not of MDPI and/or the editor(s). MDPI and/or the editor(s) disclaim responsibility for any injury to people or property resulting from any ideas, methods, instructions or products referred to in the content.