Article

Spatio-Temporal Analysis of CO2 Emissions from Vehicles in Urban Areas: A Satellite Imagery Approach

by
Nur Fatma Fadilah Yaacob
1,
Muhamad Razuhanafi Mat Yazid
2,*,
Khairul Nizam Abdul Maulud
2,
Shabir Hussain Khahro
3,* and
Yasir Javed
4
1
Department of Civil Engineering, Faculty of Engineering and Built Environment, Universiti Kebangsaan Malaysia, Bangi 43600, Selangor, Malaysia
2
Sustainable Urban Transport Research Centre, Faculty of Engineering and Built Environment, Universiti Kebangsaan Malaysia, Bangi 43600, Selangor, Malaysia
3
College of Engineering, Prince Sultan University, Riyadh 11586, Saudi Arabia
4
College of Computers and Information Sciences, Prince Sultan University, Riyadh 11586, Saudi Arabia
*
Authors to whom correspondence should be addressed.
Sustainability 2024, 16(23), 10765; https://doi.org/10.3390/su162310765
Submission received: 22 October 2024 / Revised: 28 November 2024 / Accepted: 28 November 2024 / Published: 9 December 2024

Abstract

:
Carbon dioxide (CO2) emissions are a significant global environmental concern, widely notable as a major cause of climate change. Meanwhile, transportation is the main sector contributing to CO2 emissions, which are escalating at a faster rate than Gross Domestic Product Growth. This study attempted to evaluate the spatial–temporal pattern of CO2 emissions from vehicles using the Sentinel 5P satellite image. The Sentinel 5P image was acquired from the European Space Agency from 2019 until 2022. Utilizing ArcGIS 10.5, these data were analyzed to extract the CO2 values, which were then displayed as the total column amount. Thereafter, the extraction by point method was conducted on road features based on the Mukim Kajang basemap to obtain the value of CO2 emissions from transportation. Spatial–temporal mapping was then accomplished through kernel density analysis, enabling the identification of CO2 emission hotspot areas. The findings show that the spatial–temporal pattern of CO2 emissions was higher in September 2019 (0.06964 mol/m2), March 2020 (0.03596 mol/m2), December 2021 (0.0437 mol/m2), and January (0.03384 mol/m2), respectively. Based on eight cities in Mukim Kajang, Bandar Kajang has been a hotspot area for carbon dioxide emissions from motor vehicles for four consecutive years, starting in 2019 until 2022. In summary, the results of this study could provide guidelines to researchers and policymakers to develop effective strategies to reduce the level of CO2 emissions from transportation in urban areas.

1. Introduction

The World Health Organization [1] estimates that air pollution is responsible for 7 million deaths globally each year, with 90% of the population exposed to polluted air. According to the WHO, air pollution is linked to various health issues, including strokes, heart disease, chronic obstructive pulmonary disease, lung cancer, and acute respiratory infections. Over 80% of urban populations are exposed to air quality that exceeds the limits recommended by the WHO [2]. Air pollution negatively impacts human health, particularly the respiratory system, as carbon monoxide (CO) interferes with the blood’s ability to transport oxygen [3]. It also harms plants, causing necrosis, chlorosis, and inhibited growth. Additionally, air pollution contributes to the depletion of the ozone layer, which increases the risk of skin cancer and accelerates polar ice melting [4]. One of the most critical current issues related to air pollution is global warming, driven by the buildup of carbon dioxide (CO2) in the atmosphere [5]. This trapped CO2 leads to environmental heating, ecosystem disruptions, and unusual natural phenomena.
The development of transportation in Malaysia began more than 25 years ago, marking significant progress in infrastructure and mobility [6]. However, Sukor et al. [7] stated this rapid expansion in motor vehicle use, alongside advancements in manufacturing technology, has been linked to pressing global issues such as climate change and global warming. These phenomena, driven by greenhouse gas (GHG) emissions like CO2, pose substantial threats to the environment and public health. This is because they are often accompanied by harmful co-pollutants such as particulate matter (PM2.5), nitrogen dioxide (NO2), and ozone (O₃), which originate from the same combustion sources, including vehicles, industrial facilities, and power plants [8]. These pollutants have well-documented health impacts: PM2.5 is linked to respiratory and cardiovascular diseases, NO2 irritates the respiratory system, and ground-level ozone, formed through chemical reactions involving CO2-associated pollutants, exacerbates asthma and other respiratory conditions [9]. Populations near these hotspots face disproportionately higher risks, particularly vulnerable groups like children, the elderly, and individuals with pre-existing health conditions [10]. It is essential to represent CO2 hotspots as indicators for the existence of these harmful pollutants, which pose serious health risks. Accurately contextualizing these hotspots helps connect observed health risks to the actual pollutants responsible, ensuring clarity in studies and discussions on urban air quality challenges.
In response, authorities worldwide have prioritized initiatives aimed at mitigating climate change through strategies like smart resource management and environmental conservation [11]. One such initiative is the promotion of Low Carbon Cities (LCCs), which seeks to reduce carbon footprints and ensure a high quality of life for future generations. Among the various factors contributing to CO2 emissions including industry, electricity generation, and residential and commercial activities, transportation is the leading source [12]. The transportation sector’s CO2 emissions are closely tied to the growing use of motor vehicles as living standards improve. Without effective intervention, emissions from transportation are expected to rise by an alarming 305% by 2050 [13]. Research by C. Zhu and Gao [11,14] highlighted that in 2015, the transportation sector was the second-largest contributor to global CO2 emissions, accounting for 23.96% of total emissions across all sectors. This percentage is expected to increase annually as the sector grows. Fossil fuel combustion in vehicles is a major contributor to these emissions, as harmful pollutants react with other chemicals during the engine combustion process [15]. The type of fossil fuel and the condition of the vehicle play critical roles in determining emission levels. For example, trucks emit the highest levels of CO2 compared with other vehicles, such as vans and small trucks [16]. Thus, as the transportation sector continues to expand in Malaysia and globally, there is a pressing need to adopt sustainable solutions like Low Carbon Cities and green transportation initiatives to address the rising CO2 emissions, ensuring environmental and societal well-being for future generations.
There are multiple methods for measuring CO2 emissions, including approaches such as calculating emissions based on (i) travel distance [17], (ii) fuel consumption [18], (iii) vehicle speed [19], and (iv) vehicle type [20]. Each method provides insights into different factors that contribute to the overall CO2 emissions. For instance, longer travel distances or higher vehicle speeds generally result in increased fuel consumption, leading to higher emissions. Similarly, vehicle type plays a significant role, as larger or older vehicles often emit more CO2 than smaller, more fuel-efficient models. Beyond these direct methods, CO2 emissions can also be tracked using advanced technologies such as air quality monitoring tools [21] or through satellite image analysis [22]. Satellite-based monitoring offers a more comprehensive view of emissions patterns over larger geographical areas and over time. One of the most widely used satellites for this purpose is the Sentinel satellite series, developed by the European Space Agency (ESA). As explained by Maurya et al. [23], Sentinel satellites provide high-resolution multispectral data, allowing for detailed monitoring of environmental conditions, including CO2 emissions.
According to the European Space Agency [24], the Sentinel series comprises six types of satellites, each with distinct applications: Sentinel 1 focuses on land and sea observation, Sentinel 2 specializes in land monitoring and emergency response, and Sentinel 3 is used to measure sea-surface topography, temperatures, and ocean color. Sentinel 4 and Sentinel 5P are particularly useful for atmospheric monitoring. Sentinel 5P, for example, is specifically designed to detect gases and aerosols that negatively affect air quality and contribute to climate change. Finally, Sentinel 6 is used for oceanography and climate research. Of these, Sentinel 5P stands out as an ideal tool for measuring CO2 emissions due to its high spatial and temporal resolution [25]. It provides detailed atmospheric data that can be used to monitor air quality, ozone levels, ultraviolet radiation, and climate changes. This makes Sentinel 5P particularly valuable in efforts to track CO2 emissions and understand their effects on air quality and global warming. By leveraging this technology, researchers and policymakers can gain more accurate, real-time insights into emission trends, enabling them to formulate effective strategies for reducing CO2 emissions and mitigating climate change.
The Geographic Information System (GIS) is a comprehensive system designed to capture, store, analyze, integrate, manipulate, and display spatial data related to the Earth’s surface [26]. As a combination of hardware and software, the GIS facilitates the storage, retrieval, mapping, and in-depth analysis of geographical information. The GIS also encompasses various processes that transform raw spatial data into valuable insights, aiding in decision-making. This is especially important as the GIS allows users to efficiently reference spatial outputs, enabling them to address complex problems and make informed decisions [27]. Furthermore, the GIS offers advanced methods for conducting spatial analysis that would be difficult or impossible to perform using traditional techniques [28]. For instance, Liu et al. [29] demonstrated how the GIS can be used to develop models for analyzing the relationship between workplace location and the carbon emissions generated by each person commuting to that location. Their study highlighted the importance of visual representation for better decision-making. Heripracoyo et al. [30] further advanced the application of the GIS by creating a real-time GIS-based mobile application for tracking greenhouse gas (GHG) emissions, which aids local policymakers in addressing environmental issues more effectively. Other researchers, such as Zhang et al. [31] and Kang et al. [32], employed remote sensing combined with the GIS to monitor land use changes and quantify total carbon emissions. Similarly, Ma et al. [33] used the GIS to calculate carbon emissions based on vehicle travel distance, while Schroder and Cabral [13] took this further by analyzing vehicle fuel consumption and creating a 3D road model using the GIS. Their model calculates fuel usage by considering total travel time and distance, ultimately suggesting environmentally friendly routes displayed in full 3D for clearer interpretation.
In addition to that, kernel density analysis (KDA) is a spatial analysis that offers significant advantages in identifying, visualizing, and interpreting patterns within spatial data [34]. By estimating the probability density of events or features across a continuous surface, this analysis reveals hotspots or areas of high concentration that may not be visible through simple point data representation [35]. KDA is valuable for studying CO2 emissions from transportation as it helps identify and visualize areas with high emissions, or “hotspots”, on a spatial map. Using KDA, researchers can pinpoint zones with intensified CO2 output due to heavy traffic, road conditions, or the presence of high-emission vehicles, particularly in urban areas [36]. This spatial understanding enables policymakers and urban planners to target specific locations for interventions, such as improving road infrastructure, optimizing traffic flow, or introducing emission-reducing measures [37]. For example, in cities where transportation contributes significantly to air pollution, KDA can help highlight emission-heavy zones, like busy intersections or highways, showing where improvements like cleaner transportation options or traffic rerouting could be most effective [38]. By providing a visual representation of CO2 concentrations, KDA makes it easier to communicate the need for policy changes and to prioritize actions where they will have the most impact on air quality and public health. Additionally, KDA’s flexibility in adjusting the radius or bandwidth allows researchers to scale the analysis from regional trends to very localized hotspots, making it a versatile tool for detailed transportation-related emission studies [39].
Therefore, the GIS is a versatile platform that allows for the performance of both statistical and spatial analyses, making it a crucial tool for environmental research and decision-making [40]. This study utilizes the GIS to explore the spatial–temporal patterns of CO2 emissions by analyzing monthly satellite data from Sentinel-5P. Using the GIS, hotspot areas of CO2 emissions were identified through kernel density analysis, and the results were visualized in map form to provide a clearer understanding of emission distribution and trends.

2. Methodology

2.1. Study Area

Hunter et al. [41] stated that urban areas are one of the contributors to CO2 emissions due to the high population densities, which are leading to an increase in the number of motor vehicles being used. Usually, this area often experiences traffic congestion, especially during peak hours. When vehicles are stuck in traffic or moving slowly, they burn more fuel, which increases CO2 emissions [42]. In addition, urban areas have extensive road networks to support motor vehicle movement. While this improves mobility, it also leads to an increased number of vehicles on the road, and subsequently to an increase in CO2 emissions [43]. Therefore, this study chose Mukim Kajang as the study area because it has the characteristics that have been stated. There are 342,657 residents in Mukim Kajang, consisting of 60.4% Malays, 19.3% Chinese, 9.7% Indians, and 10.6% from other ethnic groups [44]. The area of this study is 165 km2 and consists of several major cities such as Bandar Bangi, Bandar Baru Bangi, Bandar Serdang, Bandar Kajang, Bandar Baru Kajang, Bandar Teknologi Kajang, Bandar Seri Putra, and Bandar Bukit Mahkota, which have various types of land use such as industrial sectors, residential areas, green areas, agriculture, commercial areas and access roads including the North–South Expressway (PLUS), Kajang–Seremban Expressway (LEKAS), and Kajang Traffic Dispersal Expressway (SILK). However, the scope of this study does not cover all the roads but only focuses on the nearest road in this study area as shown in Figure 1.

2.2. Data

This study specifically selected Sentinel 5P as the primary satellite tool for measuring CO2 emissions from transportation due to its renowned high accuracy [45,46]. Sentinel 5P is known for its advanced capabilities in monitoring various atmospheric gases, including pollutants, which makes it particularly well suited for environmental studies. One of the key advantages of Sentinel 5P is its spatial resolution, which ranges from 3.5 km to 7.0 km [47]. This resolution is broader compared with the finer resolutions of satellites like Landsat, which offer higher detail (typically around 10–30 m) but are more suitable for ground features and smaller-scale monitoring [48]. Sentinel-5P’s resolution is therefore better adapted for atmospheric observations, while Landsat’s higher detail is optimal for land surface mapping and detecting smaller ground features. Hence, this resolution is sufficient to meet the specific needs of the study area, allowing for a precise analysis of emissions, especially in complex urban environments where air quality can vary significantly over short distances.
Sentinel 5P is primarily designed to monitor air pollution and gases that contribute to air quality degradation, which is especially critical in densely populated urban areas where transportation is a major source of emissions. Enkhjargal et al. [49] used data from the TROPOMI instrument on the Sentinel-5P satellite to map CO levels across Ulaanbaatar during winter. These satellite data provided valuable insights into air quality by offering a broad, city-wide view of CO distribution. Meanwhile, Borsdorff et al. [50] used the Sentinel-5P’s TROPOMI instrument to detect transportation-related CO emission, identifying pollution hotspots along arterial roads in urban areas.
Even though Sentinel 5P is highly effective in tracking various pollutants, it has limitations when it comes to direct CO2 measurements [51]. The satellite is more focused on monitoring CO, a precursor and indicator of CO emissions, rather than CO2 itself [52]. This is because measuring CO2 at a small scale requires a very fine resolution, something that Sentinel 5P’s horizontal resolution cannot achieve [53]. Despite this limitation, Sentinel 5P data remain valuable for CO2 emission studies. Researchers have developed methods to use CO data as a proxy for estimating CO2 emissions. As noted by Wang et al. [54] and Niu et al. [55], the ratio of CO to CO2 is generally consistent and can be used as a benchmark for calculating CO2 emissions. Specifically, the established ratio, supported by sources such as FlexBook Portal [56] and Zeng and Fu [57], indicates that for every one part of CO, there are typically two parts of CO2 emitted. This 1:2 ratio allows researchers to infer total CO2 emissions from the observed CO data provided by Sentinel 5P [58].
Several studies have explored using CO data as a proxy to estimate CO2 emissions due to the correlation between CO and CO2 emissions in combustion processes. Specifically, research has shown that the CO to CO2 emission ratio can serve as a basis for converting observed CO data into CO2 estimates. For instance, studies on emissions from steel production in Germany applied a sector-specific CO ratio to calculate CO2 emissions from satellite-derived CO data, showcasing the potential for using CO data to infer CO2 emissions in industrial applications [59]. Similarly, methodologies have been developed for other sectors, leveraging this emission ratio to assess CO2 levels based on CO measurements in environments where CO2 data are more challenging to obtain directly [60]. A study by Leguijt et al. [61] found that CO emissions, which are co-emitted with fossil fuel CO2 during combustion, can serve as a proxy for estimating CO2. Their research utilized Sentinel-5P CO data to assess CO2 emissions from road transportation in African cities. In conclusion, although CO and CO2 behave differently in the atmosphere, CO monitoring remains an effective proxy for estimating CO2 emissions.
In this study, the researchers utilized this relationship to estimate CO2 emissions from transportation sources. The data collection involved downloading monthly Sentinel 5P datasets from the Copernicus Open Access Hub Portal, covering the period from 2019 to 2022. This extensive dataset provided a comprehensive overview of air quality trends and allowed for the analysis of CO emissions as a proxy for CO2, thereby enabling the study to map and assess CO2 emissions over time. Table 1 in the report provides a detailed characterization of both CO2 and CO, further illustrating how these gases are analyzed in the context of this research.

2.3. Method

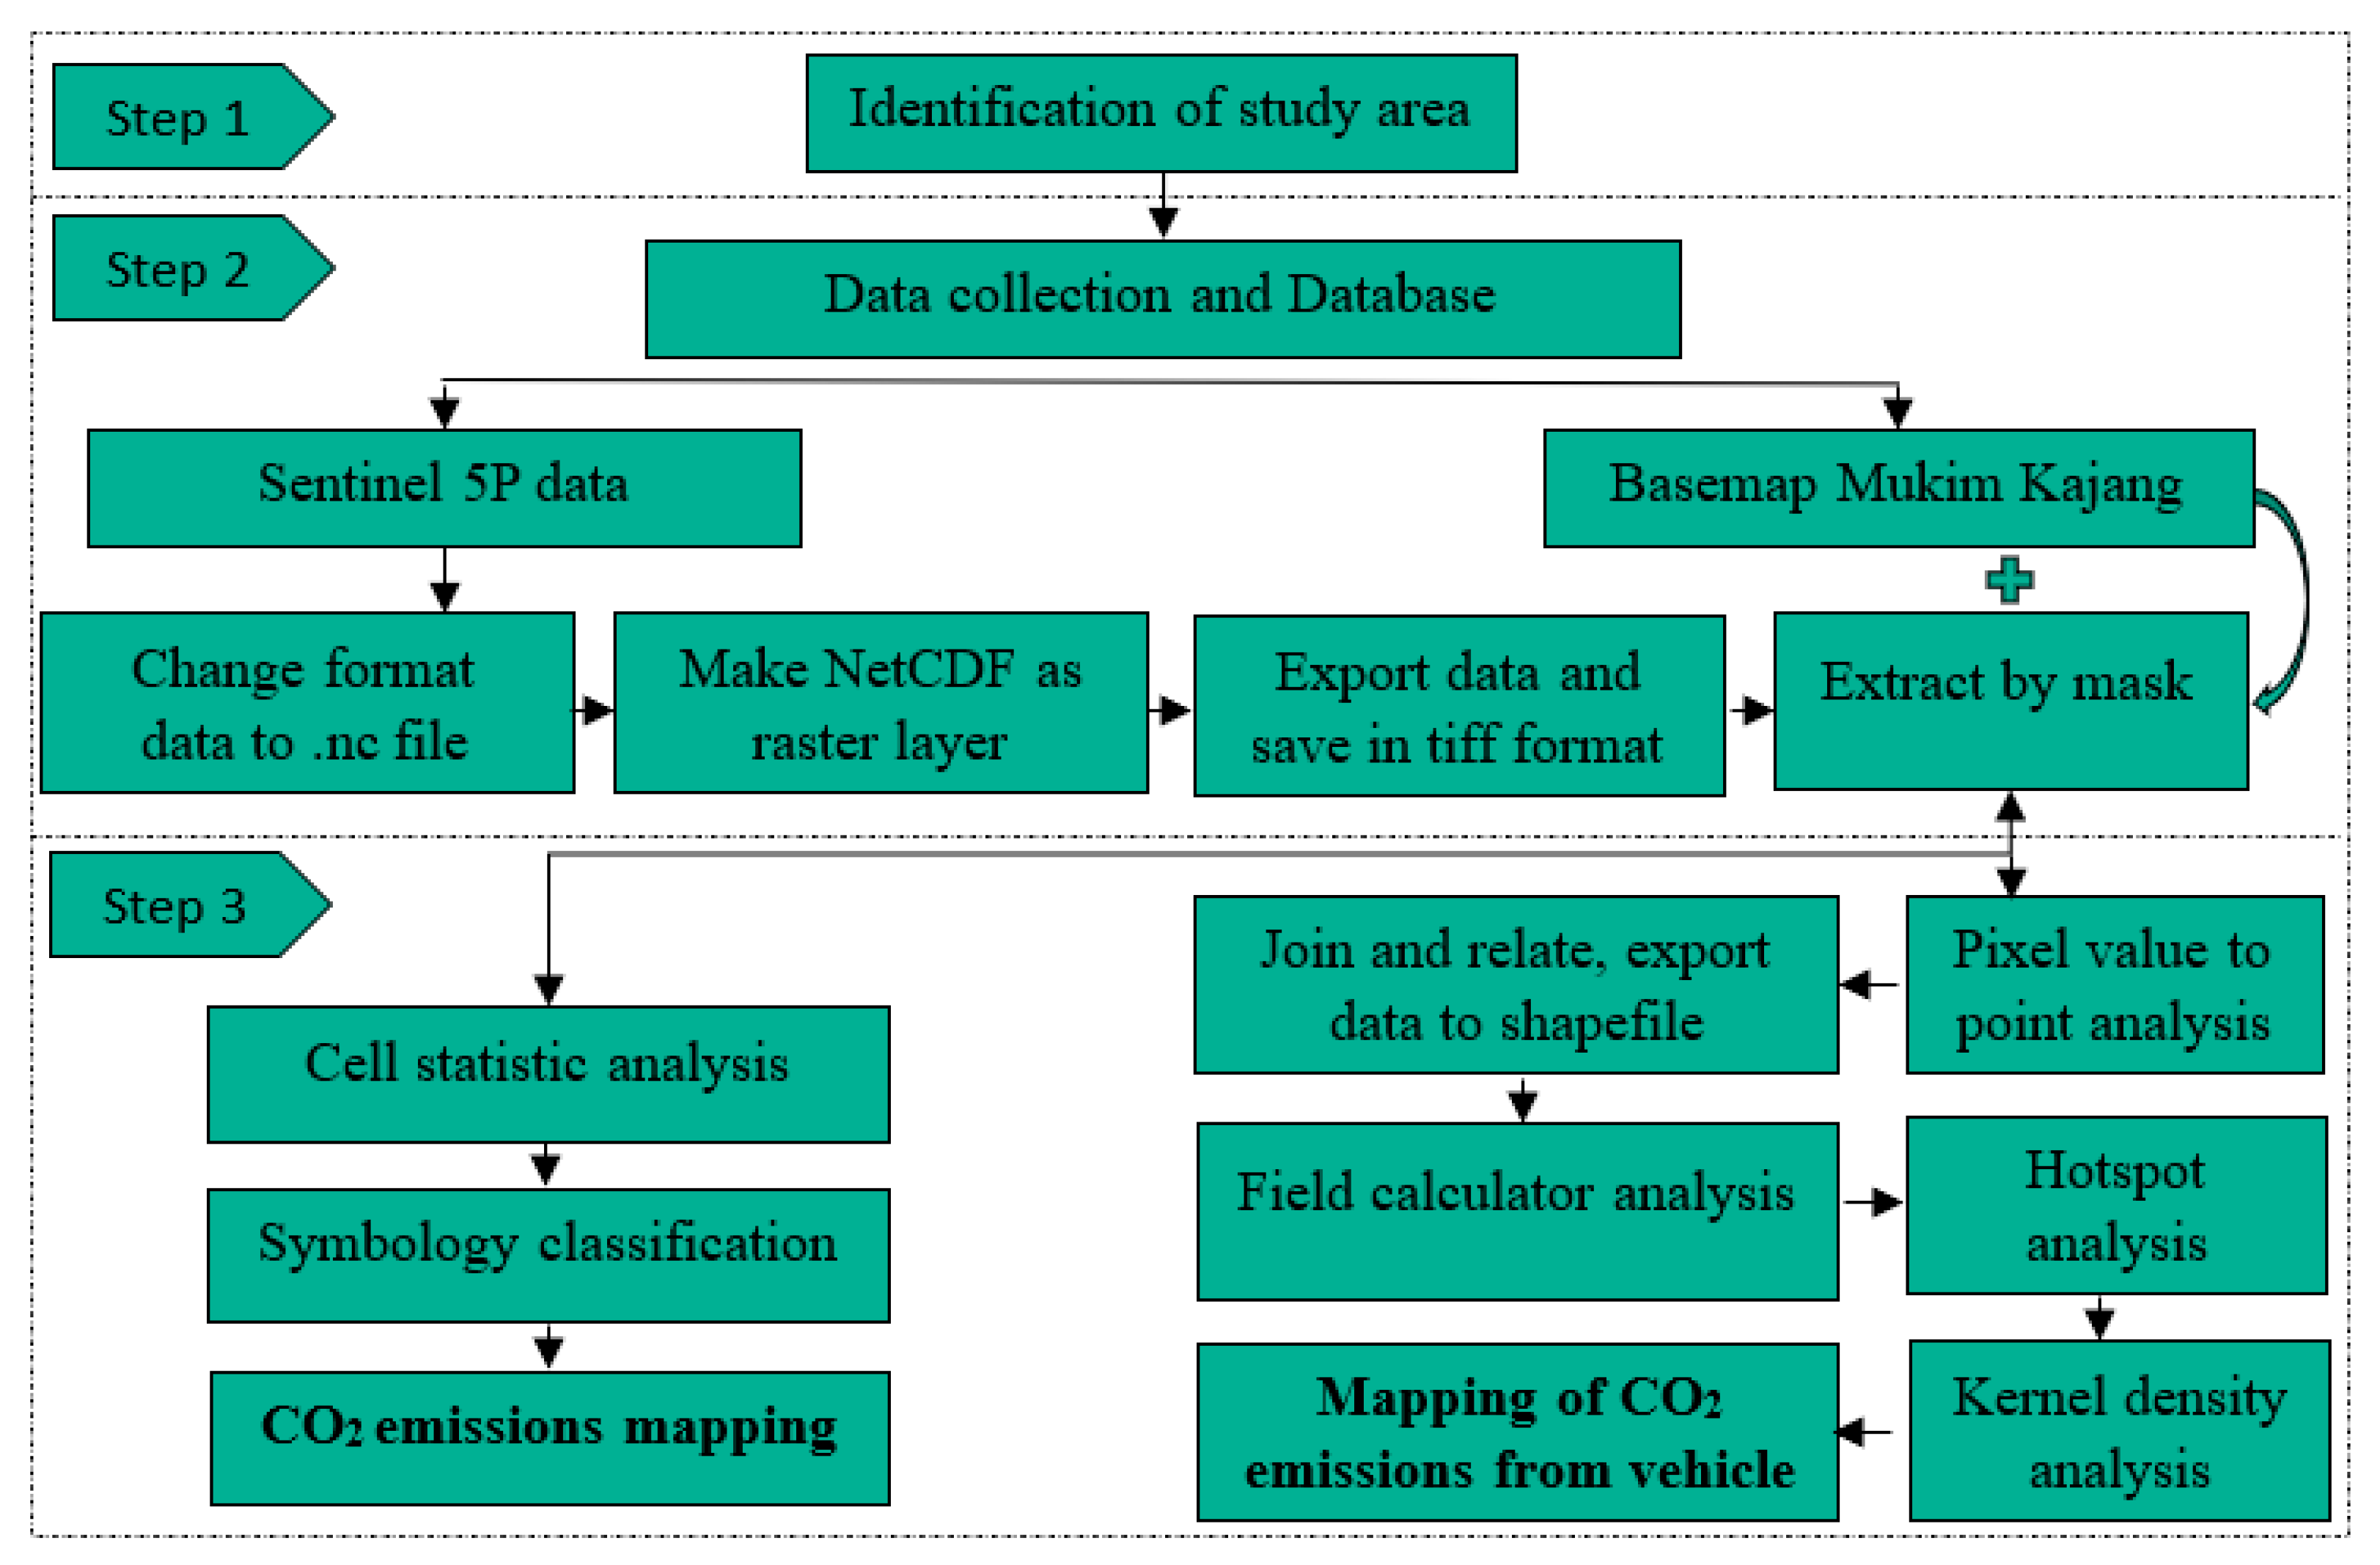
Figure 2 illustrates a Geographic Information System (GIS)-based technical framework, coupled with three essential procedures designed for the comprehensive analysis and mapping of CO2 emissions. This framework was pivotal in understanding and visualizing the spatial distribution of CO2 emissions, particularly from vehicles, within a designated study area. The framework was structured into three primary steps, each of which is crucial for ensuring accurate and effective analysis. The first step involved the identification of the study area. This step was critical as it set the stage for the entire analysis by defining the specific geographical boundaries and the scope of the study. The selection of the study area was based on the objective of the analysis, such as assessing CO2 emissions in urban areas or along major transportation corridors. This involved careful consideration of the area’s relevance to the research objectives, the availability of data, and the need for detailed analysis. By establishing clear boundaries, the study ensured that all subsequent data collection and analysis were both targeted and relevant to the specific area of interest.
The second step was the data collection and database development. This stage laid the groundwork for all further valuation and spatial analysis. The process began with the collection of Sentinel 5P satellite data, which are known for their high-resolution capabilities in monitoring atmospheric gases like CO2. The data for this study were downloaded from the Copernicus Open Access Hub Portal (https://scihub.copernicus.eu/, 19 November 2019). This study focused on data collected from the year 2019 to 2022. The raw data from Sentinel 5P were initially in a specific format that needed conversion. Therefore, it needed to be converted to a NetCDF (.nc) file format using specialized software like SeaDAS 8.1.0, which is commonly employed for processing satellite data.
Once converted, the NetCDF file was imported into ArcGIS 10.5 software, where it was transformed into a raster layer. This transformation is essential as raster data are well suited for spatial analysis within GIS environments. After creating the raster layer, the data were exported and saved in TIFF format, which is a widely accepted format for storing raster graphics. The Sentinel-5P satellite image used the WGS 84 (World Geodetic System 1984) coordinate system, which is standard for satellite data, while the basemap for Mukim Kajang was in the Kertau RSO Malaya (meter) coordinate system. To align the two in ArcGIS, a coordinate transformation from WGS 84 to Kertau RSO Malaya was necessary. To do this, load the WGS84 data into ArcGIS, go to the Project Tool found under ArcToolbox > Data Management Tools > Projections and Transformations. Select your dataset as the input, then choose Kertau RSO Malaya (m) under Projected Coordinate System > National Grids > Malaysia as the output system. If a geographic transformation is required, select a compatible option, like WGS_1984_To_Kertau. Run the tool, which will generate a new dataset with the converted coordinates, making it compatible with the Kertau RSO Malaya (m) system for accurate local mapping in Malaysia.
The next step involved an extract by mask operation, where the Sentinel 5P data were subsetted based on the predefined study area. To perform the extract by mask operation in ArcGIS, first load both the Sentinel-5P raster data and the study area boundary (mask layer) into ArcGIS. Then, go to the ArcToolbox, navigate to Spatial Analyst Tools > Extraction, and select Extract by Mask. In the tool dialog box, choose Sentinel-5P raster as the Input Raster and the study area boundary as the Feature Mask Data. Specify an output location and filename for the resulting raster. After running the tool, the output raster will contain only the data within your study area, making it more efficient and precise for subsequent analyses by excluding irrelevant data outside the study boundary.
The third and final step was the assessment and mapping of CO2 emissions. In this step, the data collected in the previous stage were analyzed to evaluate CO2 emissions within the study area. This involved performing cell statistical analysis in ArcGIS, specifically by using Spatial Analyst Tools > Zonal Statistics to calculate mean values for CO2 emissions over a 12-month period for the years 2019 to 2022. The Zonal Statistics tool can compute summary statistics such as the mean, minimum, maximum, and sum for each cell in the study area, providing insights into temporal variations in emissions. By averaging the data over an extended period, this approach accounted for seasonal and yearly fluctuations, offering a more comprehensive understanding of CO2 emission trends. This statistical analysis provided a robust foundation for identifying long-term patterns and assessing the effectiveness of the mitigation measures in reducing emissions. Once the average values were calculated, symbology classification was conducted to create a visual representation of the CO2 emissions across the study area. This step was crucial for producing an understandable map that can be easily interpreted by stakeholders, policymakers, and the public.
In addition to that, to obtain a detailed analysis of CO2 emissions from vehicles along the roads, pixel values were extracted to points within the study area. This method provided a fine-grained view of how emissions are spatially distributed along transportation routes. First, points were created along the road features in the basemap at 2 m intervals. Each of these points was then used to store CO2 emission data from the corresponding satellite imagery pixel, making it possible to assess CO2 concentrations at precise locations across the road network. This approach supported a more accurate understanding of CO2 levels relative to specific transportation routes. To analyze pixel values at specific points in ArcGIS, you can use the “Extract Multi Values to Points” tool to assign raster data values to points located along a road network. Start by loading your raster layer and the point layer (representing locations along roads) into ArcGIS. Next, open the Extract Multi Values to Points tool from ArcToolbox > Spatial Analyst Tools > Extraction. In this tool, select the point layer as the Input Point Features and the raster data layer(s) as the Input Rasters. This will assign the raster’s pixel values to each point based on its location relative to the raster, storing them in new fields in the point layer’s attribute table. Once the tool is completed, each point will contain CO2 values, allowing for detailed spatial analysis of CO2 emissions at specific road points, ideal for further visual or statistical analysis. This process enables a more precise understanding of CO2 distribution across transportation networks.
Next, a join and relate process was applied to combine the monthly data into a single layer. Using the field calculator, an annual average was then calculated, offering a comprehensive view of CO2 emissions over the study period. This step was followed by a hotspot analysis to identify statistically significant clusters of high (hotspots) and low (cold spots) CO2 emissions within the study area. In ArcGIS 10.5, this involved using the Hot Spot Analysis (Getis-Ord Gi*) tool, found under Spatial Statistics Tools > Mapping Clusters in the ArcToolbox. Select the combined CO2 data layer as the input feature, with the appropriate field representing emission levels, and configure any necessary parameters to reflect the spatial context of the data. The resulting output is a point shapefile that contains a Gi* score for each feature, indicating the intensity of CO2 emissions across locations within the study area.
To further refine the analysis, a kernel density analysis was performed in ArcGIS to visualize CO2 emission concentration. This process uses the kernel density tool found under Spatial Analyst Tools > Density in the ArcToolbox. By selecting the CO2 point data as the input and setting an appropriate cell size and search radius, the tool calculates the magnitude-per-unit area, creating a smooth raster layer that highlights high-emission areas. This visualization aids in identifying specific regions with concentrated emissions, potentially guiding targeted interventions. For accuracy, the search radius is determined using a formula based on standard distance (SD), median distance (Dm), and either the number of points (n) or the population field if one is used [62]. This calculation ensures meaningful density estimation, as illustrated in Equation (1). The kernel density output provides a clearer representation of CO2 hotspots across the study area.
S e a r c h   R a d i u s = 0.9 × m i n S D , 1 ln 2 × D m × n 0.2
Finally, the mapping of CO2 emissions from vehicles was completed, resulting in a comprehensive visual representation of the spatial distribution of emissions. This map not only highlighted the areas with the highest concentrations of CO2 but also served as a valuable tool for identifying hotspots. These hotspots can inform targeted interventions, such as implementing emission reduction policies or improving public transportation options, ultimately aiding in the development of more effective environmental policies and strategies.

3. Results

3.1. Rate of Carbon Dioxide Emissions

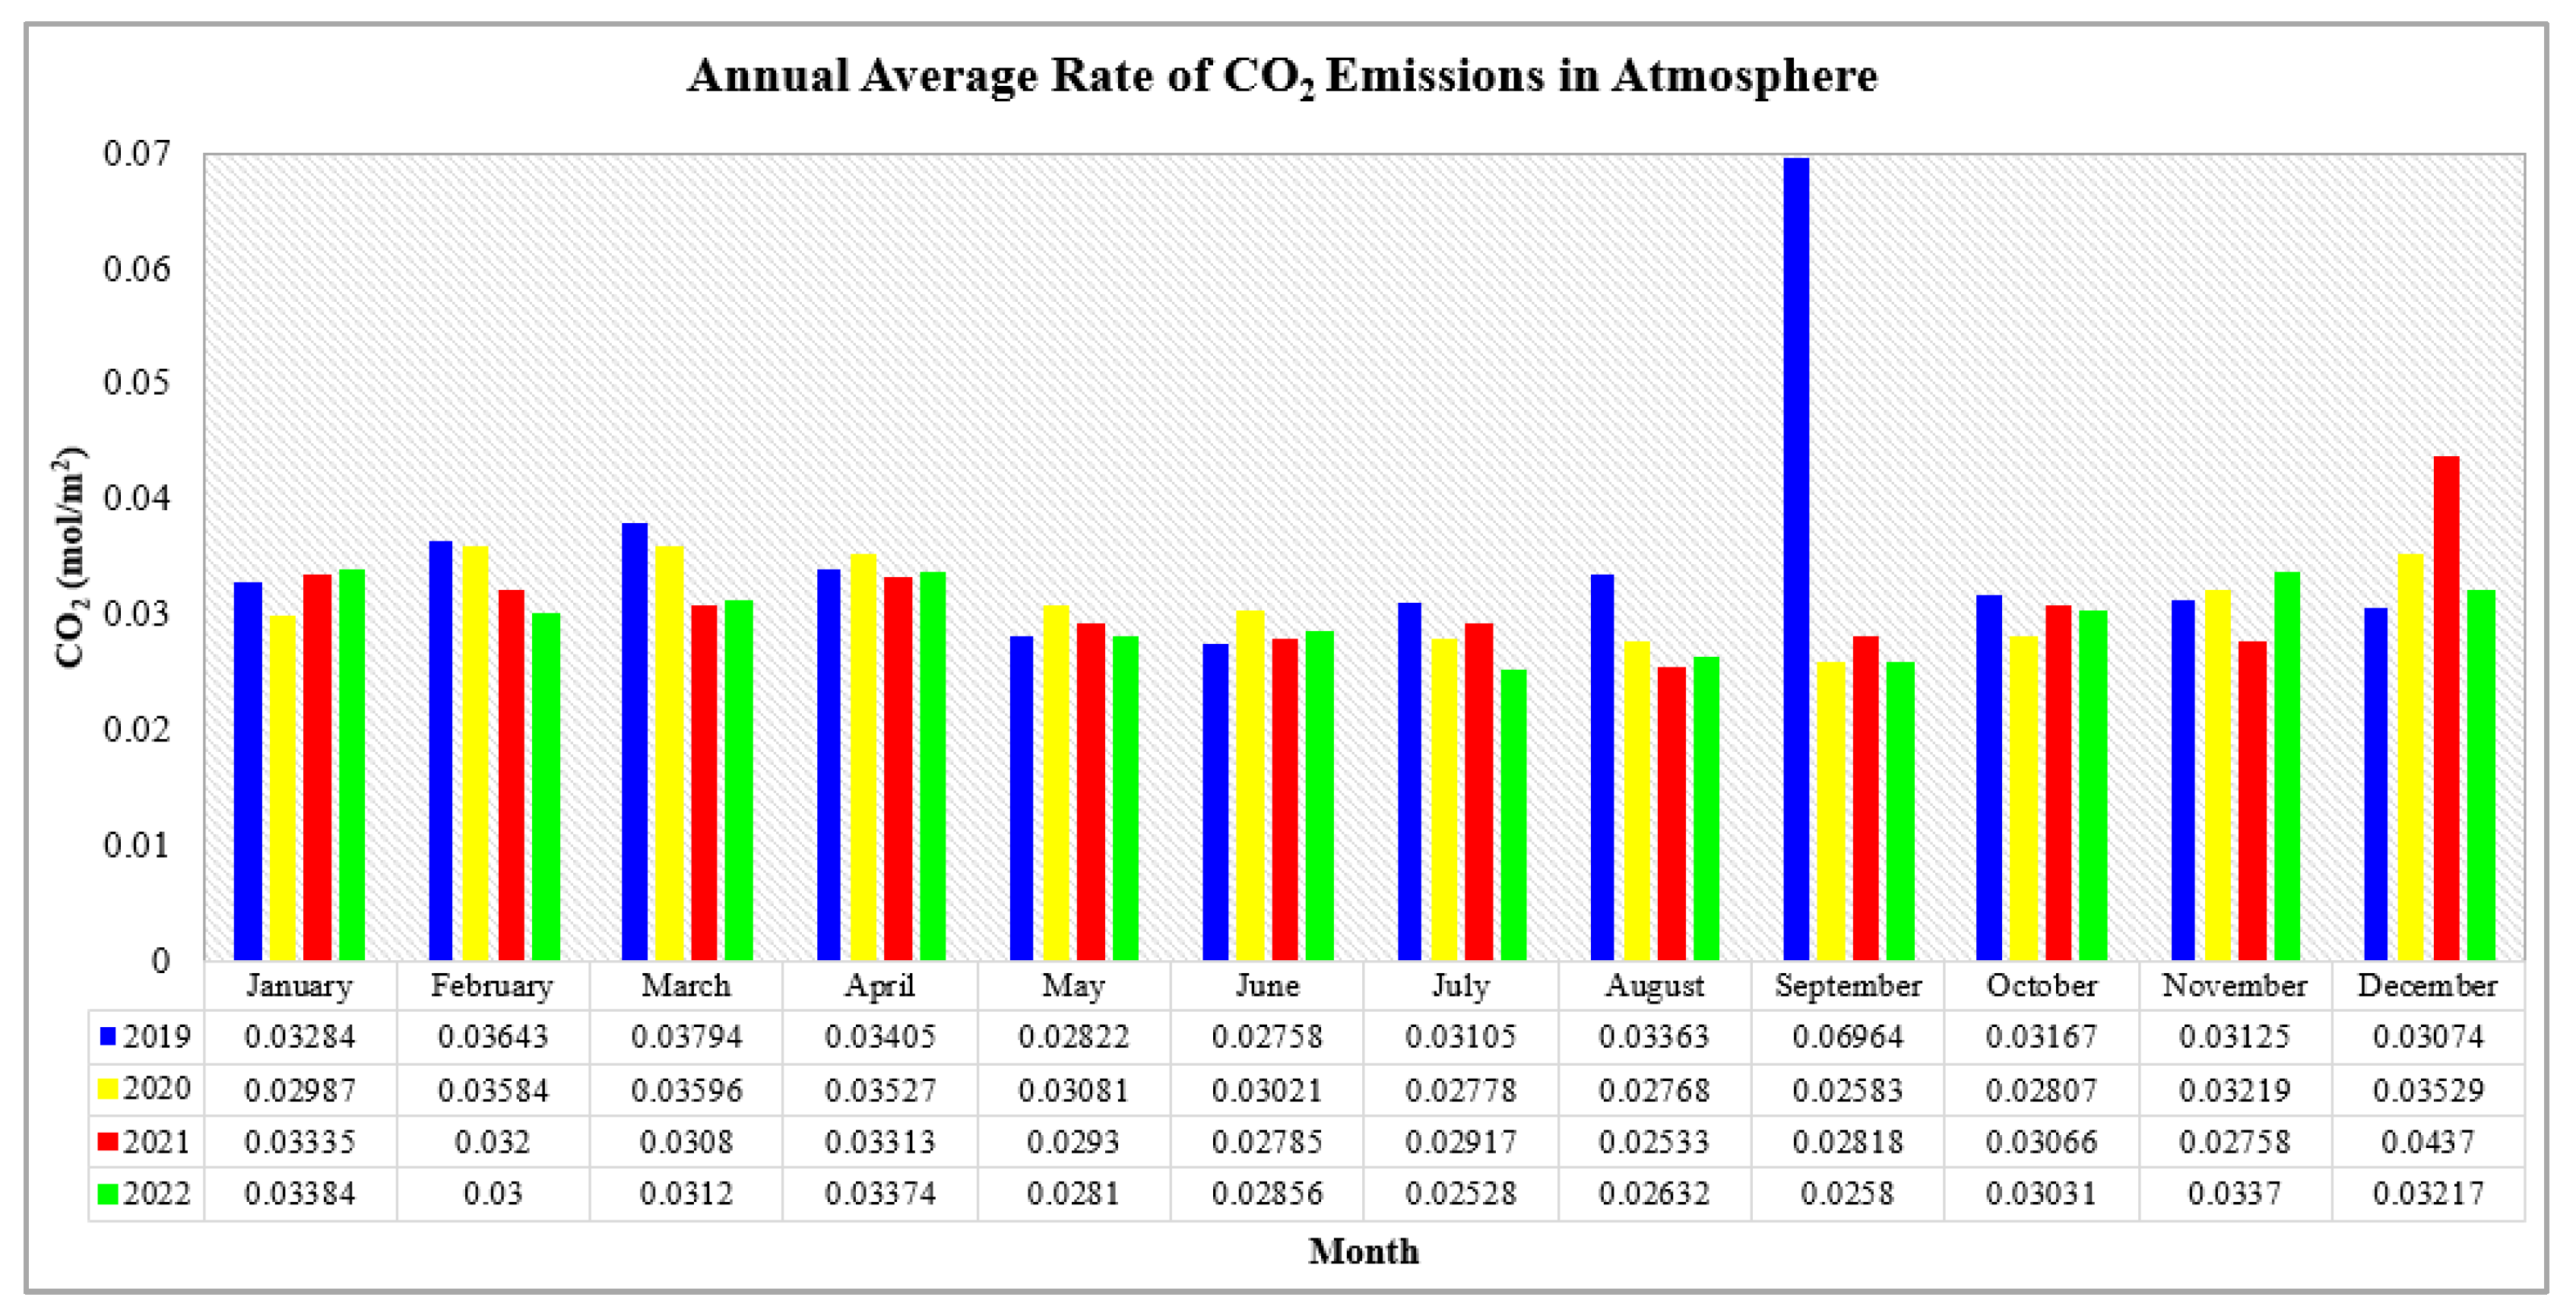
Figure 3 represents the monthly average concentration of CO2 emissions in the air, referred to as the “Tropospheric CO2 Total Column”, for the years 2019 through 2022. These data provide a detailed view of how CO2 levels fluctuate throughout each year, highlighting both the lowest and highest emission months. In 2019, the data reveal a significant variation in CO2 emissions from month to month. The month with the lowest CO2 emissions was June, with an average concentration of 0.0276 mol/m2. This was followed closely by May, which recorded 0.0282 mol/m2. As the year progressed, December registered slightly higher emissions at 0.0307 mol/m2, followed by July at 0.0310 mol/m2. The months of November and October saw even higher levels, with emissions of 0.0313 mol/m2 and 0.0317 mol/m2, respectively, indicating a gradual increase towards the end of the year. On the other hand, September was marked by the highest CO2 emissions for 2019, with a substantial spike to 0.0696 mol/m2. This was a significant outlier compared to other months, due to severe haze from forest fires in Sumatra and Kalimantan, Indonesia [60]. The second highest emissions were recorded in March, at 0.0379 mol/m2, followed by February at 0.0364 mol/m2. April had a slightly lower emission level of 0.0341 mol/m2, while August and January recorded 0.0336 mol/m2 and 0.0328 mol/m2, respectively. The graph clearly indicates that September was the peak month for CO2 emissions in 2019, while June had the lowest levels.
In 2020, the pattern shifted slightly, with September emerging as the month with the lowest CO2 emissions at 0.0275 mol/m2. This was followed by August at 0.0277 mol/m2 and July at 0.0278 mol/m2. October’s emissions were slightly higher at 0.0281 mol/m2, while January and June recorded 0.0299 mol/m2 and 0.0302 mol/m2, respectively. Conversely, March saw the highest emissions of the year, with a concentration of 0.0360 mol/m. February followed closely with 0.0358 mol/m2, and both December and April recorded 0.0353 mol/m2. The final months with notable emissions were November at 0.0322 mol/m2 and May at 0.0308 mol/m2. This pattern shows that September was the month with the lowest emissions, while March had the highest in 2020.
In 2021, the data indicated August as the month with the lowest CO2 emissions at 0.0253 mol/m2. This was followed by November at 0.0276 mol/m2 and June at 0.0279 mol/m2. As the year progressed, September recorded 0.0282 mol/m2 in emissions, followed by July with 0.0292 mol/m2 and May at 0.0293 mol/m2. December was the month with the highest CO2 emissions, reaching 0.0437 mol/m2, which is notably higher than in other months. January followed with 0.0334 mol/m2, and April saw 0.0331 mol/m2 in emissions. February recorded 0.0320 mol/m2, with March at 0.0308 mol/m2, and October at 0.0307 mol/m2. The data for 2021 highlight that August had the lowest emissions, while December had the highest, indicating a peak towards the end of the year.
For the year 2022, the month with the lowest CO2 emissions was July, with a concentration of 0.02528 mol/m2. This was followed by September at 0.02580 mol/m2, August at 0.02632 mol/m2, May recorded 0.02810 mol/m2, while June followed with 0.02856 mol/m2. February had slightly higher emissions at 0.03000 mol/m2. In contrast, January showed the highest CO2 emissions for the year, reaching 0.03384 mol/m2. This was followed by April at 0.03374 mol/m2 and November at 0.03370 mol/m2. December saw emissions of 0.03217 mol/m2, while March and October recorded 0.0312 mol/m2 and 0.03030 mol/m2, respectively. The data from 2022 clearly show that July was the month with the lowest emissions, while January had the highest, marking the beginning of the year with elevated CO2 levels.
Across all four years, the data demonstrate seasonal variations in CO2 emissions, with certain months consistently showing lower or higher concentrations. September 2019 stands out for its exceptionally high emissions, while other months such as June 2019, September 2020, August 2021, and July 2022 show the lowest emissions in their respective years. In September 2019, CO2 emissions in Malaysia surged due to severe haze caused by large-scale forest fires in Sumatra and Kalimantan, Indonesia. Portal The Star [63] reported that these fires, primarily ignited by illegal slash-and-burn agricultural practices, led to the release of vast amounts of carbon dioxide and other harmful pollutants into the atmosphere. The resulting haze significantly degraded air quality across Malaysia and other parts of Southeast Asia, contributing to heightened health risks and environmental concerns. Due to this incident, CO2 emissions have increased and affected the results obtained in this study. Therefore, understanding these patterns is crucial for identifying the factors driving CO2 emissions and for developing targeted strategies to mitigate their impact on the environment. Fachrie [64] stated that to prevent forest fires and haze pollution, Indonesia should enhance human security awareness, educate the public, especially in high-risk areas, and work with the National Human Rights Commission to ensure human rights protection amid environmental threats. Furthermore, the Indonesian government faced criticism in 2019 for modifying forest maps under the moratorium to allow for more palm oil and paper plantations, which contributed to widespread fires [65]. This situation prompted Indonesia to commit to the ASEAN Agreement on Transboundary Haze Pollution (AATHP) to address cross-border haze issues effectively through the key strategy of the Haze-Free Roadmap [66]. It consists of four main components such as the vison, the overall goal with indicators, key strategies with measures of progress, and actions [67]. Therefore, to address regional haze, ASEAN countries are focusing on cross-border collaboration and establishing shared regional standards. Protocol and law enforcement are essential to manage border-related haze issues, ensuring all member countries follow consistent guidelines [68].
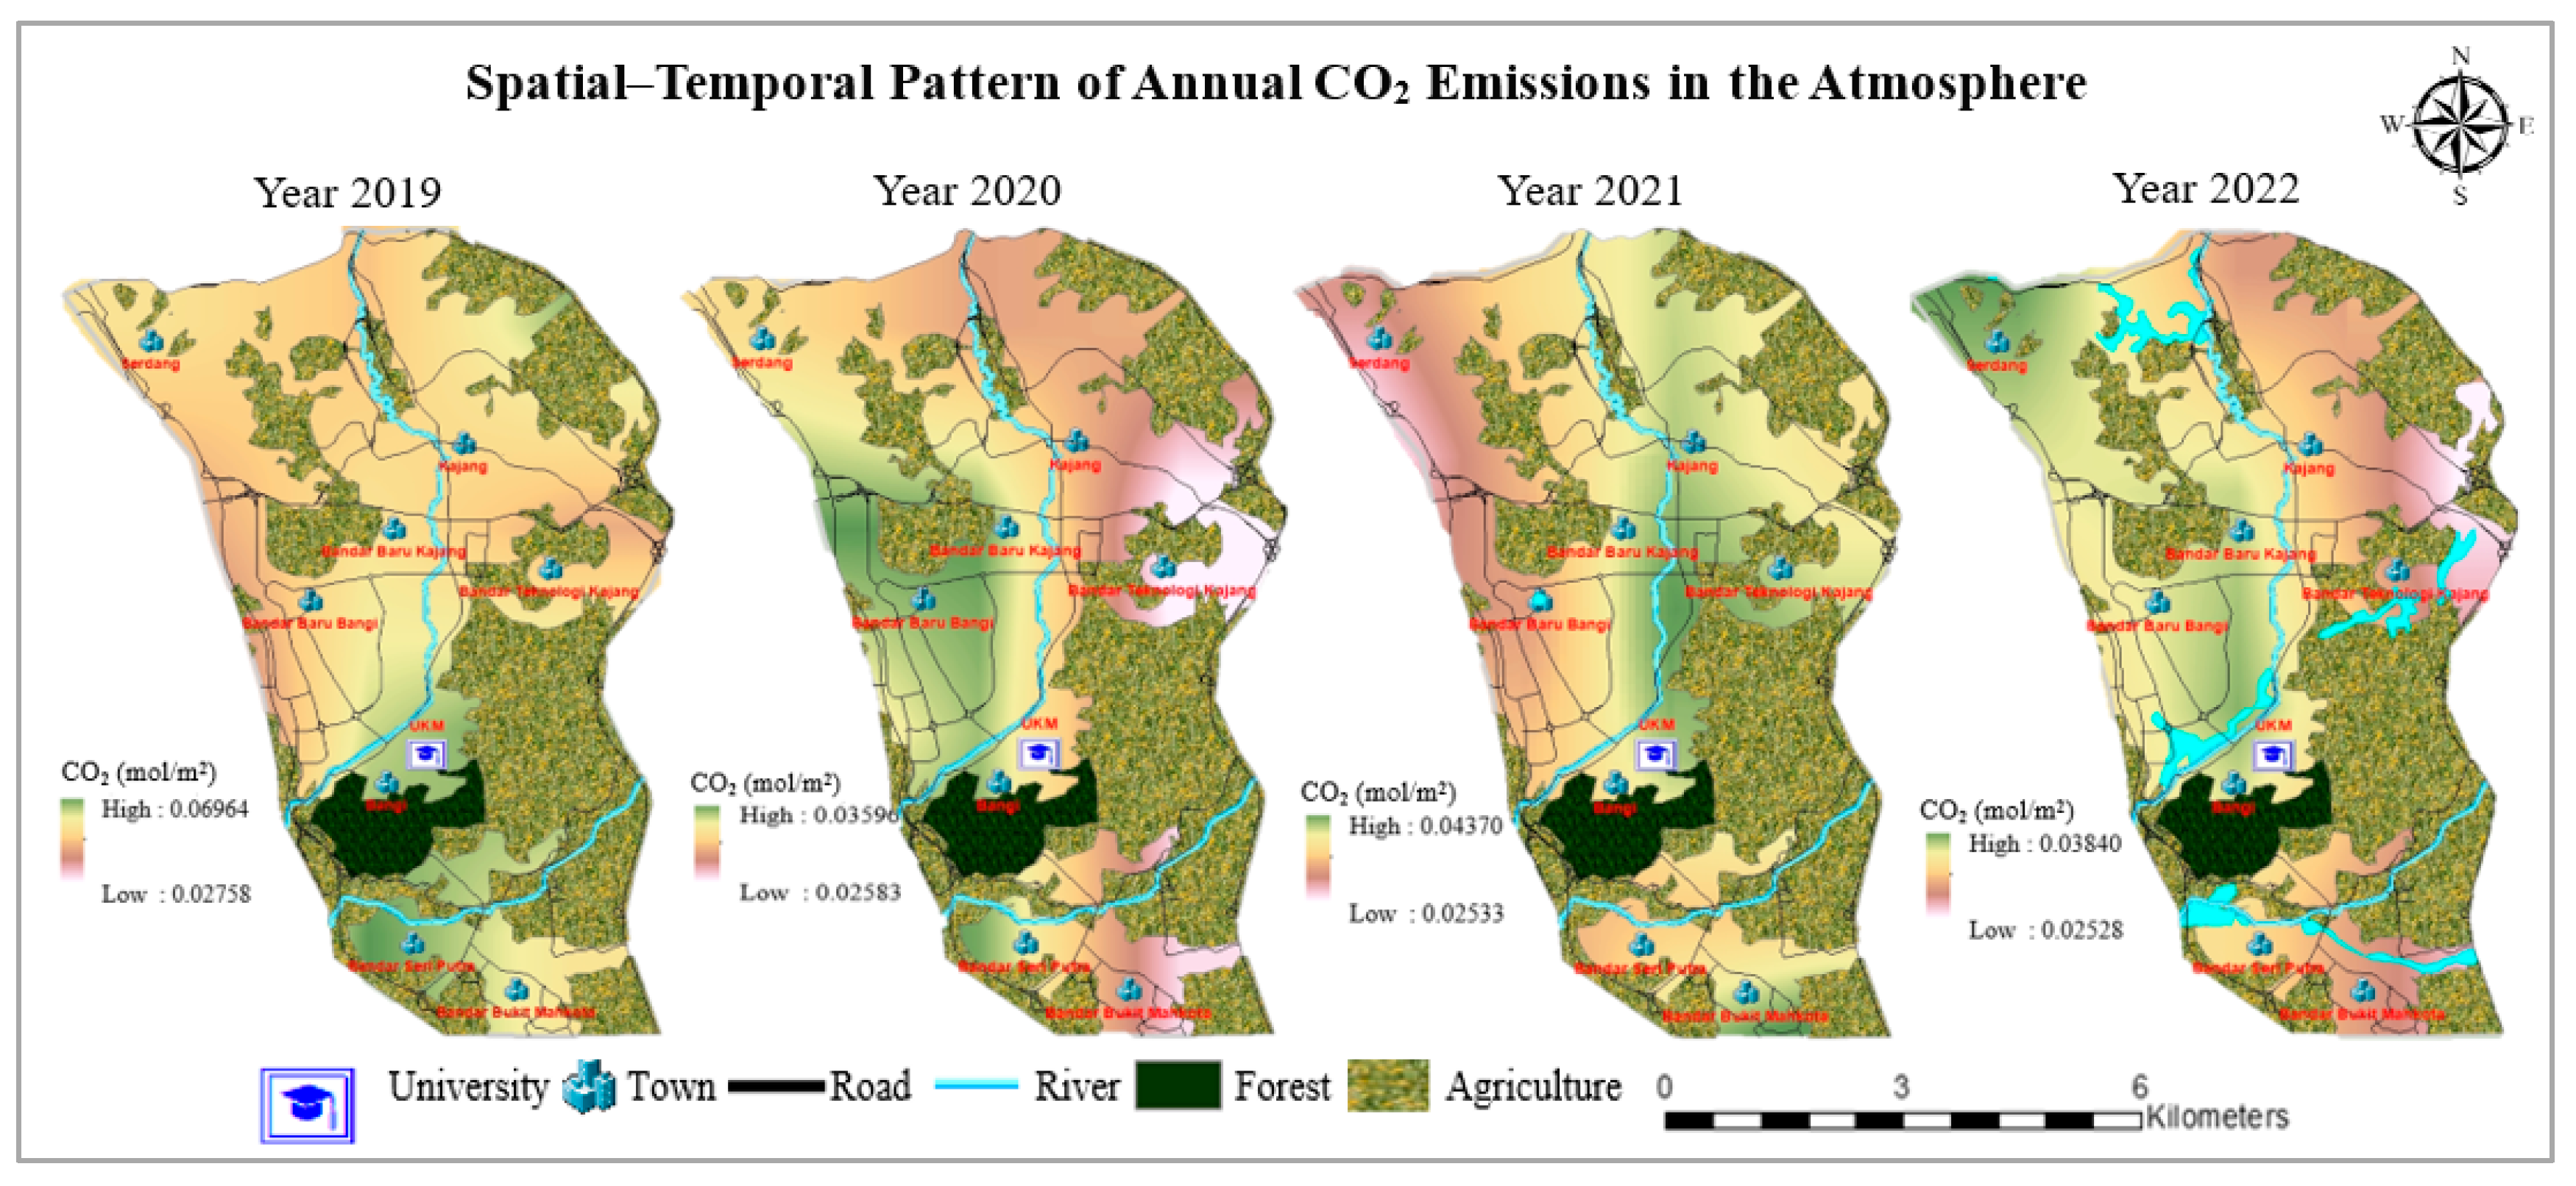
Figure 4 shows the spatial and temporal distribution of annual CO2 emissions across specific regions from 2019 to 2022. Starting with 2019, the towns of Bandar Serdang and Bandar Kajang exhibited moderate to high CO2 emissions, particularly in the northern parts near major roads. The proximity to busy urban centers and significant transportation routes likely contributed to these elevated levels. Similarly, Bandar Baru Bangi and Bandar Teknologi Kajang showed high emissions, especially in areas close to industrial zones and major highways. These two areas recorded the highest CO2 concentrations in the region, making them significant contributors to overall emissions. In comparison, Bandar Baru Kajang experienced moderate emission levels, slightly lower than its neighboring areas, with concentrations mainly along the main roads and commercial zones. On the other hand, Bandar Bukit Mahkota and Bandar Seri Putra displayed lower CO2 emissions, likely due to their more suburban characters, less dense populations, and the presence of surrounding vegetation that aids in CO2 absorption. Consistent with this trend, Bandar Bangi showed low emissions, among the lowest in the region, which indicates limited industrial activity.
Moving into 2020, the data reveal a shift influenced by the pandemic’s impact on human activities. Both Bandar Serdang and Bandar Kajang saw a slight decrease in CO2 emissions, reflecting reduced activity during the pandemic period. However, emissions remained moderate due to the continued movement of essential services and goods. A similar trend was observed in Bandar Baru Bangi and Bandar Teknologi Kajang, where CO2 levels decreased but remained among the highest emitters. This persistence was largely due to ongoing industrial operations and significant traffic on major roads. Meanwhile, Bandar Baru Kajang maintained its moderate emission levels but saw a notable decline compared with 2019, likely a result of decreased commercial activities. Bandar Bukit Mahkota and Bandar Seri Putra also experienced a further reduction in emissions, highlighting their lower reliance on heavy industry and transportation. Bandar Bangi continued to maintain low CO2 emissions, showing little change from 2019, suggesting minimal emissions from human activities.
As the post-pandemic recovery began in 2021, there was a noticeable shift in CO2 emission patterns. In Bandar Serdang and Bandar Kajang, emissions began to rise again as activities resumed, although they did not reach the levels observed in 2019. This increase was particularly noticeable near major roads. Bandar Baru Bangi and Bandar Teknologi Kajang also saw a significant rebound in CO2 emissions, approaching or exceeding 2019 levels. This rebound was likely driven by the return of industrial and commercial activities. Bandar Baru Kajang experienced a rise in emissions as well, but they remained moderate, reflecting a balanced recovery without a drastic rise in pollution. Meanwhile, Bandar Bukit Mahkota and Bandar Seri Putra continued to have lower emissions, with a slight increase compared with 2020, maintaining their status as low-emission areas. Bandar Bangi remained stable with low emissions, showing minimal impact from the overall regional increase in CO2 levels.
Finally, in 2022, there was a general stabilization of CO2 emissions across the regions. In Bandar Serdang and Bandar Kajang, emissions stabilized with a slight decrease from 2021 levels, suggesting a plateau as activities normalized. Similarly, Bandar Baru Bangi and Bandar Teknologi Kajang maintained high emissions, consistent with their status as industrial and commercial hubs. However, the levels were slightly lower than in 2021. Bandar Baru Kajang showed a slight decrease in emissions, indicating a stabilization trend similar to that observed in Serdang and Kajang. Bandar Bukit Mahkota and Bandar Seri Putra continued to exhibit low emissions, with minimal changes from previous years, reinforcing their roles as lower emission zones. Bandar Bangi also sustained consistently low emissions, highlighting the continued presence of green spaces and low levels of industrial activity.
The analysis of CO2 emissions from 2019 to 2022 across these eight towns shows a clear pattern. Urbanized and industrialized areas, such as Bandar Baru Bangi and Bandar Teknologi Kajang, consistently exhibited higher CO2 emissions. In contrast, suburban and less developed areas like Bandar Bukit Mahkota, Bandar Seri Putra, and Bandar Bangi maintained lower CO2 levels, underscoring the importance of urban planning and green spaces in mitigating emissions. The temporary reduction in emissions during 2020 due to the pandemic emphasized the significant impact of human activities on air quality, with a gradual return to pre-pandemic levels observed in 2021 and 2022.
This is supported by the fact that various studies observed significant reductions in CO2 emissions during the COVID-19 pandemic due to strict lockdowns that curtailed transportation, industrial activity, and energy demand. For instance, a study by the Potsdam Institute for Climate Impact Research found that global CO2 emissions dropped by up to 17% in early 2020 compared with pre-pandemic levels [69]. This was largely attributed to decreases in road traffic and industrial output, with the largest declines seen in major emitters such as China, the U.S.A, Europe, and India [70]. Researchers noted that this temporary reduction highlighted the potential impact of structural changes in transportation and energy systems for long-term emission reductions. However, many experts caution that the drop was short-lived, with emissions expected to rebound as restrictions eased [69]. In 2021, global fossil CO2 emissions rose by approximately 4.2%, reaching 36.2 billion metric tons, nearly matching 2019 levels [71]. A study by Ahmed and Stern [72] found that China’s carbon emissions increased by 10% from 2019 to 2023, reaching 2.95 million tons daily, with a 21% rise in emissions from the power sector. In conclusion, the finding of this study aligns with other studies that document the pandemic’s temporary effect on emissions and underscore the necessity of green recovery policies for enduring environmental impact.

3.2. Rate of Carbon Dioxide Emissions from Vehicles

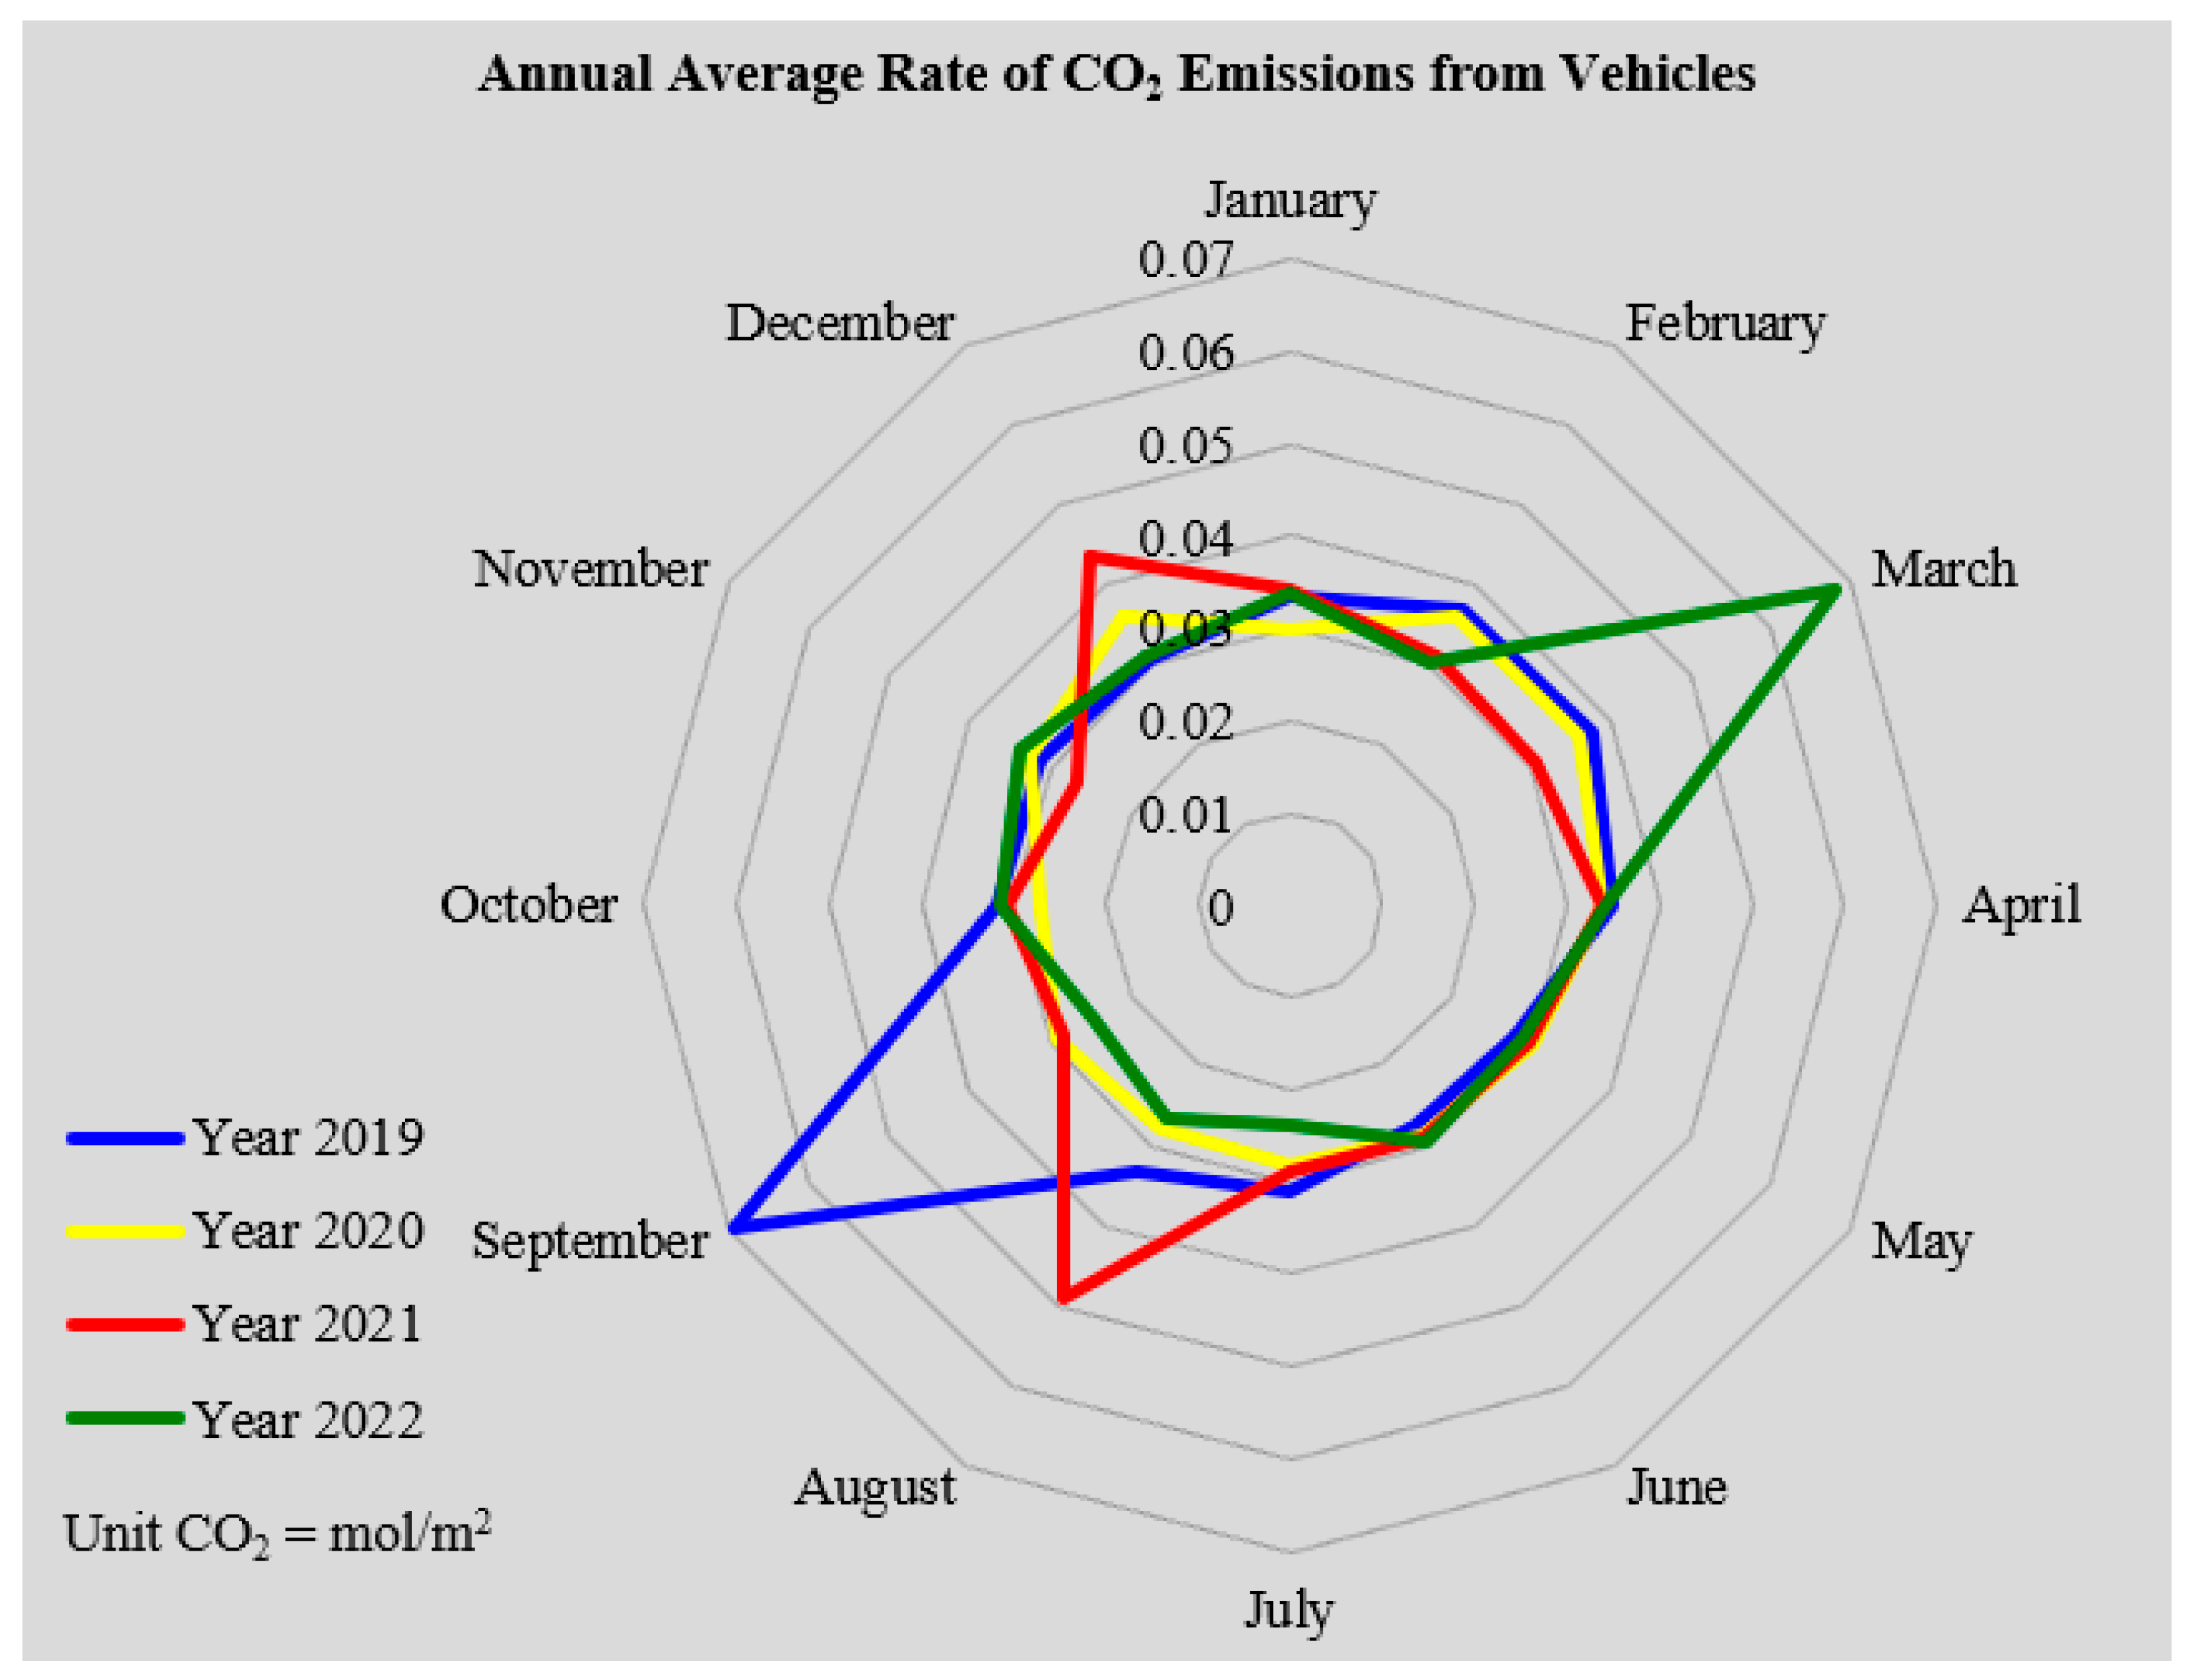
The radar chart in Figure 5 illustrates the annual average rate of CO2 emissions from vehicles over four years starting from 2019 until 2022, with the unit of measurement in mol/m2. A general observation from the chart is the fluctuating pattern of CO2 emissions throughout the months for each year, with notable peaks indicating periods of higher emissions. In 2019, represented by the blue line, there was a significant peak in September, reaching the highest emission rate among all years at approximately 0.06960 mol/m2. The emissions for that year were generally moderate throughout, with noticeable increases towards the latter part of the year. For 2020, shown by the yellow line, emissions were relatively lower compared with 2019, with a notable peak in March at 0.03629 mol/m2. There was a significant drop in emission rates from April to August, which could be attributed to factors like reduced transportation activities. The red line for 2021 shows a moderate peak in December, with emissions just above 0.04915 mol/m2, and maintains a relatively consistent pattern with less pronounced peaks compared with 2019. In 2022, represented by the green line, there was a prominent peak in March similar to the peak observed in 2020, reaching about 0.06803 mol/m2. Emissions for the rest of the year were relatively lower compared with 2019 but slightly higher than in 2020 and 2021. The chart also reveals some seasonal trends, such as higher emissions in September (2019) and March (2022), indicating that certain months were more prone to elevated CO2 emissions, possibly due to increased travel or specific weather conditions that impacted vehicle emissions.
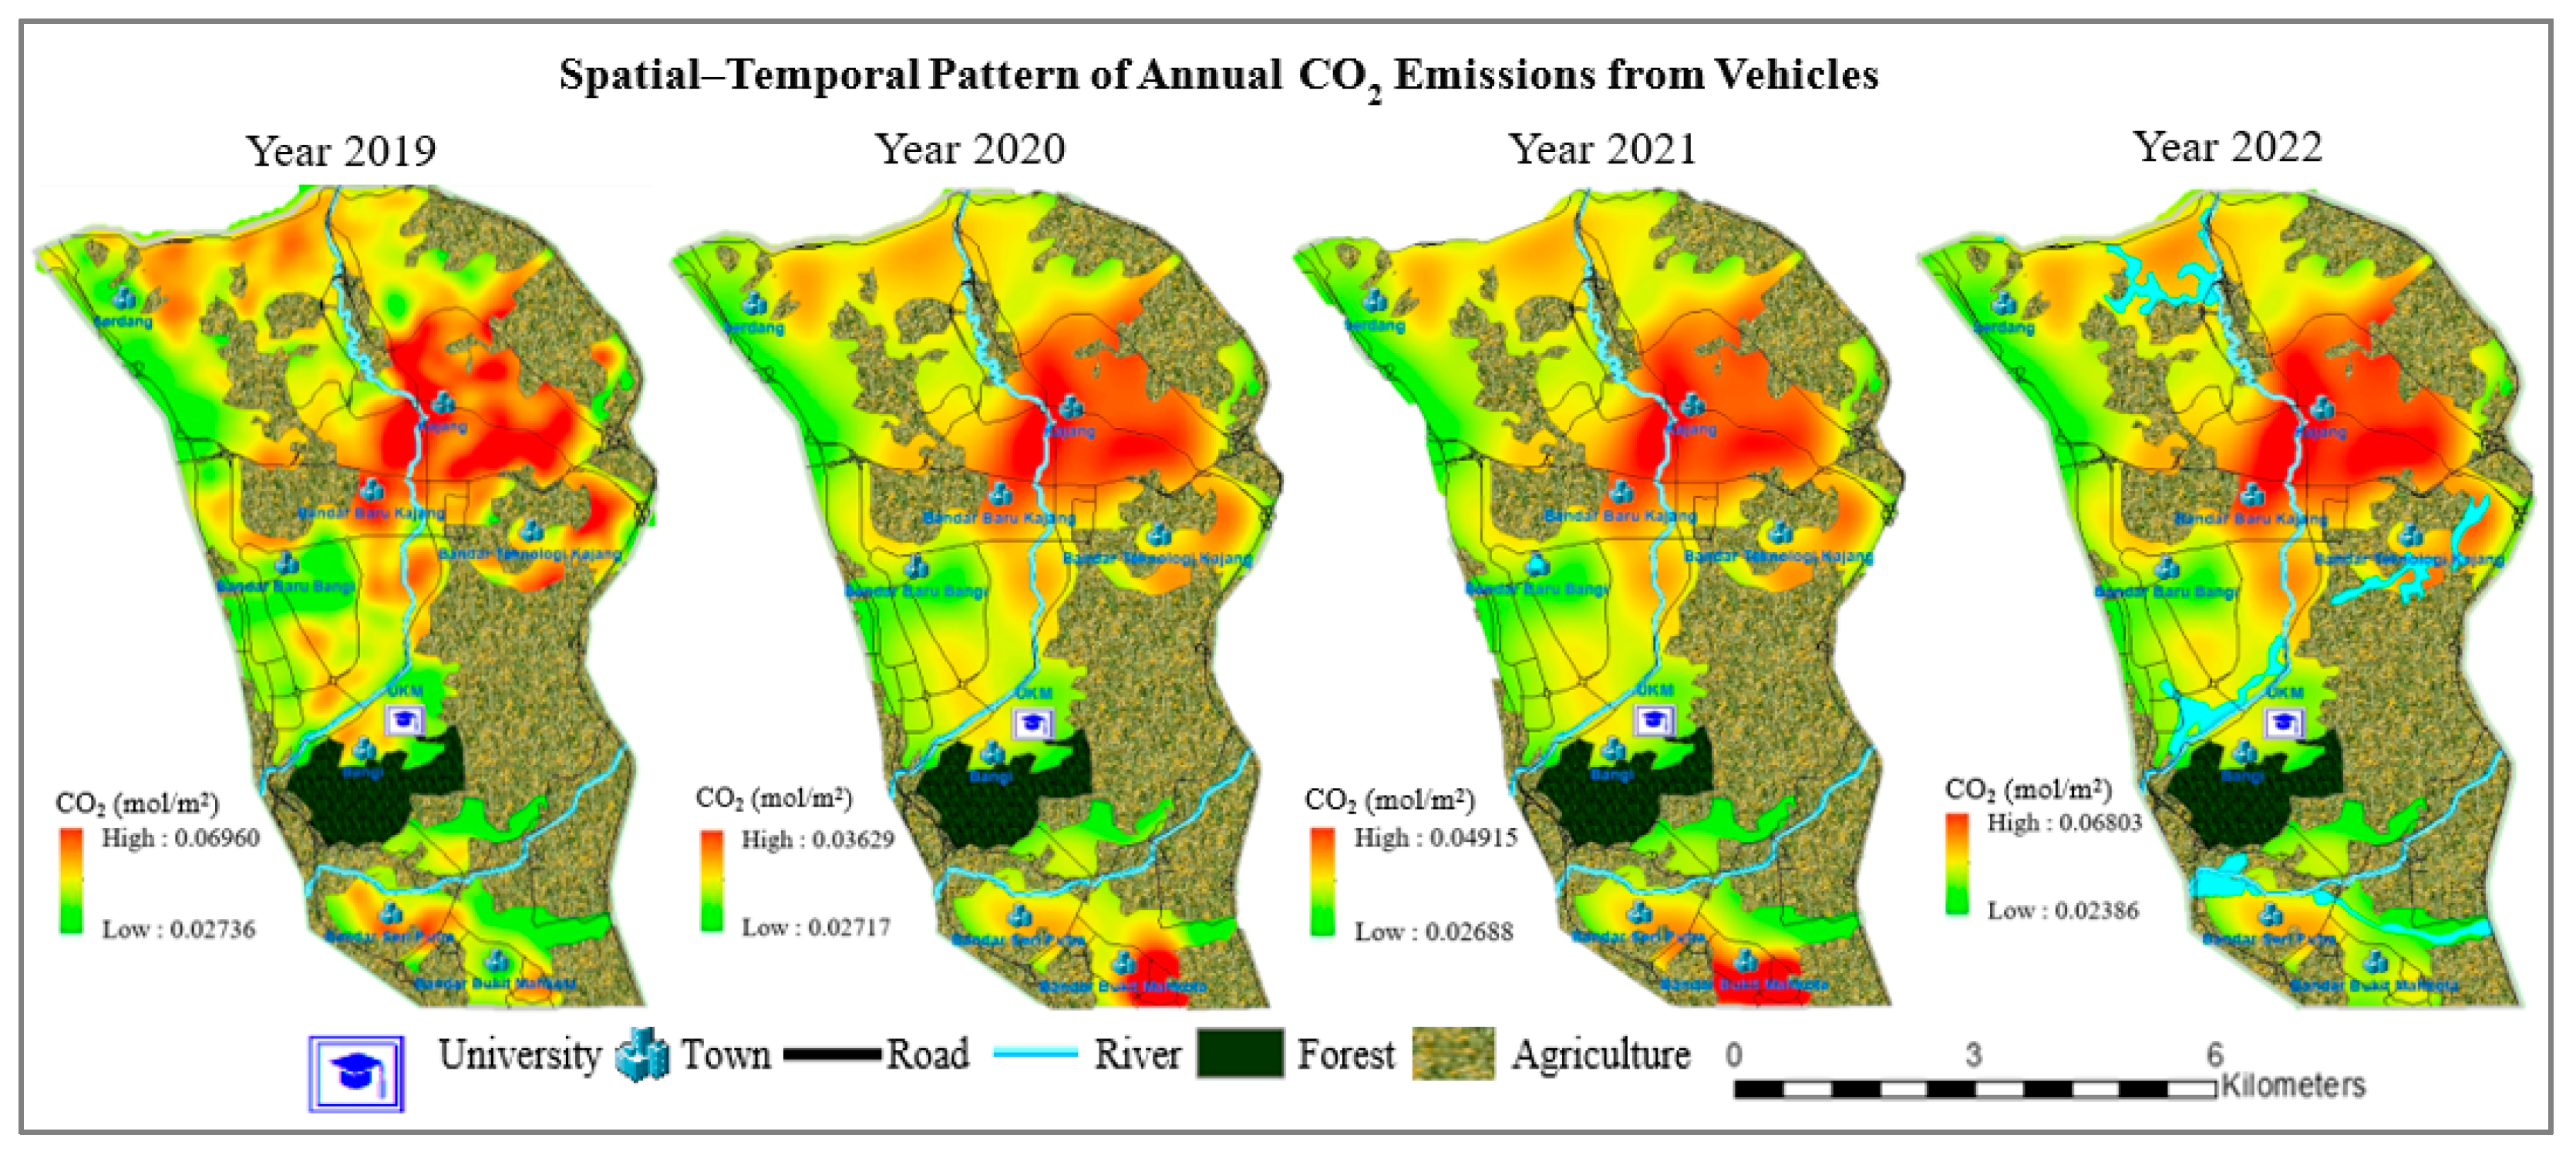
Figure 6 shows the spatial–temporal pattern of annual CO2 emissions from vehicles in the Mukim Kajang region across four years (2019–2022). The maps indicate the levels of CO2 (measured in mol/m2) emitted from vehicles, highlighting areas of high and low emissions. In 2019, the high emission areas were primarily located in Bandar Kajang, particularly around Bandar Baru Kajang and Bandar Teknologi Kajang. These urban centers, known for their high population density and significant traffic flow, experienced the highest emissions, likely due to the intense movement of vehicles. The main roads connecting these towns also exhibited elevated emission levels, indicating that transportation activity plays a central role in CO2 output. The emissions were lowest in forested and agricultural regions in the southern part of the area, where vehicular activity was minimal, and natural vegetation played a role in absorbing some of the emitted CO2.
Meanwhile, the CO2 emission levels dropped significantly in 2020 due to the reduced transportation activities caused by the COVID-19 pandemic. With fewer vehicles on the road due to movement restrictions, there was a clear reduction in emissions compared with 2019. Despite the drop, Bandar Kajang remained a hotspot for CO2 emissions, though at a lower intensity than in 2019. This was likely due to essential services still operating during the lockdown, maintaining some vehicular traffic in urban centers.
However, emissions began to rise again in 2021. This increase coincided with the easing of COVID-19 restrictions and the resumption of regular economic and transportation activities. The urban centers of Bandar Kajang, Bandar Teknologi Kajang, and Bandar Baru Bangi once again emerged as key hotspots for CO2 emissions, as vehicular traffic picked up. The road networks continued to show high levels of emissions, indicating that transportation remained the primary contributor to CO2 levels in these areas. Meanwhile, the southern rural and forested regions continued to show lower emission levels, confirming the pattern that the emissions were highly concentrated in urban areas with dense road networks.
Lastly, emissions reached their highest peak across the four years by 2022. The emissions approached levels like those recorded in 2019, suggesting that transportation activities had almost fully recovered to pre-pandemic levels. Bandar Kajang area remained the central emission hotspot, with high emissions recorded along major roadways and densely populated urban centers. This suggests that despite potential advancements in vehicle technology or public transportation systems, the reliance on private vehicles continued to be a significant source of CO2 emissions in the region [73]. The areas near Bandar Baru Bangi and Bandar Teknologi Kajang continued to experience high emissions, further indicating that these towns were major contributors to vehicular CO2 output.
In conclusion, the spatial–temporal analysis of CO2 emissions from vehicles in Mukim Kajang revealed a clear pattern of urban-centric emissions driven by transportation activities. The data emphasize the need for targeted interventions, such as promoting public transportation, increasing the use of electric vehicles, and implementing urban planning strategies that reduce vehicle dependency. Without such measures, the region is likely to continue experiencing high levels of CO2 emissions, particularly in its urban centers, contributing to environmental degradation and climate change.

4. Reducing Carbon Emissions Through Electric Vehicles, Public Transit, and Sustainable Mobility Solutions

The transportation sector has been identified as a significant contributor to global carbon emissions, accounting for a significant portion of the total carbon footprint [74]. According to the International Energy Agency, the transportation sector is responsible for approximately 25% of worldwide carbon emissions, and this figure has increased by 71% since the 1990s [75]. The primary driver of this increase is the heavy reliance of the transportation sector on fossil fuels for energy input, which results in the release of large amounts of CO2 into the atmosphere [76]. The factors contributing to the increase in carbon emissions from the transportation sector are multifaceted. First, growing population and urbanization trends have led to an increase in the number of motor vehicles on the roads [77], resulting in higher energy consumption and, consequently, higher carbon emissions [7,78]. Additionally, increasing commuting distances due to urban sprawl have further exacerbated the problem, as longer journeys translate to higher fuel consumption and greater carbon emissions [79]. Furthermore, the rapid growth of city populations and urban areas has led to increased traffic congestion, which in turn leads to higher fuel consumption and emissions due to the inefficient operation of vehicles in stop-and-go traffic [80].
Another contributing factor is the lack of efficient and accessible public transportation options in many urban areas. Even though Bandar Kajang had public transport facilities such as an express bus service, Mass Rapid Transit (MRT), Light Rail Transit (LRT), KTM Commuter, Rapid KL Buses, and others, this area still had higher car-borne emissions. A study from Yusoff et al. [81] revealed that despite the presence of public transportation like LRT, Malaysia’s reliance on private vehicles and an insufficient public shift to rail services contribute to higher carbon emissions. This is because the over-reliance on private vehicles for personal mobility has resulted in a higher modal share of cars, which are generally less fuel-efficient and produce more carbon emissions per passenger kilometer compared with public transport [82]. In a nutshell, public transportation systems are essential for reducing emissions, but their effectiveness is contingent upon broader systemic changes, including energy policies and public engagement in sustainable practices.
In addition, heavy traffic flow, vehicle types, and road conditions all contribute significantly to increased CO2 emissions from transportation due to their combined effects on fuel consumption and efficiency. Heavy traffic leads to stop-and-go driving and idling, which forces engines to consume more fuel than they would at a steady speed due to constant braking and accelerating [83]. Larger vehicles, such as SUVs and trucks, with bigger engines, burn more fuel per mile than smaller cars; moreover, gasoline-powered vehicles produce more CO2 emissions than electric or hybrid cars, which rely partially or fully on electricity [84]. Poor road conditions, like potholes and rough surfaces, further exacerbate fuel use as vehicles consume more fuel navigating these obstacles, and they can lead to congestion that results in additional idling and inefficient stop-and-go movement, thereby raising CO2 emissions [85,86]. Improving factors like optimizing traffic flow, promoting fuel-efficient vehicles, and maintaining quality roads can contribute significantly to reducing transportation-related CO2 emissions [87,88].
Addressing the issue of rising carbon emissions from the transportation sector requires a comprehensive strategy that tackles the problem from multiple angles. One critical aspect is the promotion of electric vehicles (EVs), which offer a cleaner alternative to traditional petrol and diesel cars. Governments can incentivize EV adoption through subsidies, tax breaks, and the development of charging infrastructure, making it more accessible and appealing to consumers. In addition to EVs, creating a more efficient and widely accessible public transportation system is essential. This involves improving the reliability, coverage, and affordability of public transit options like buses, trains, and light rail systems. A strong public transport network can reduce the need for private vehicle usage, thereby decreasing overall emissions. Another key component is the implementation of policies that promote sustainable transportation modes such as walking, cycling, and shared mobility services like carpooling or ride sharing. By making urban areas more pedestrian and cyclist-friendly, cities can encourage people to rely less on cars for short-distance travel. These initiatives, when combined, can lead to significant reductions in CO2 emissions from the transportation sector.

5. Urban CO2 Emissions from Vehicles, Highlighting Patter, Trends, and Implications for Carbon Reduction Policies

This research employed CO data derived from the Sentinel-5P satellite to investigate the patterns of CO2 emissions from vehicles over four consecutive years, from 2019 to 2022. By incorporating advanced GIS applications, the study was able to graphically represent the spatial distribution of emissions, enhancing the overall understanding of the relationship between vehicular activity and carbon emissions. To comprehensively analyze the data, statistical approaches were used alongside spatial analysis techniques such as the Getis–Ord Gi hotspot and kernel density estimation. These methods allowed for the identification of areas with the highest concentration of emissions, enabling the study to draw important conclusions about the spatial–temporal distribution of CO2 emissions in the study area.
The findings consistently pointed to three major urban centers, (i) Bandar Kajang, (ii) Bandar Teknologi Kajang, and (iii) Bandar Baru Bangi, as the most significant contributors to CO2 emissions throughout the four-year period. This is largely due to the high density of road networks and the corresponding volume of vehicular traffic in these areas. The strong correlation between traffic volume and CO2 emissions underscores the critical role transportation plays in contributing to atmospheric carbon levels. This relationship also highlights the broader environmental impact of urbanization, especially in areas where road infrastructure is designed to support high levels of vehicle usage.
A significant reduction in CO2 emissions was observed in 2020, which can be directly attributed to the global COVID-19 pandemic. Movement restrictions, lockdowns, and reduced economic activity resulted in fewer vehicles on the roads, leading to a dramatic decrease in transportation-related emissions. This sudden decline during 2020 presented a unique insight into how transportation patterns directly influence atmospheric CO2 levels. The data highlight the direct link between human mobility and carbon emissions, suggesting that policy interventions targeting transportation could have immediate and measurable effects on emission levels.
However, the data from 2021 and 2022 indicated a swift recovery of emissions to pre-pandemic levels as restrictions were eased and transportation activities resumed. This rebound points to the deep-rooted reliance on motor vehicles for daily activities and economic functions in urban areas. It also suggests that any reductions in CO2 emissions observed during the pandemic were temporary and that sustained, long-term reductions will require deliberate and systematic changes in transportation infrastructure and policies. The rapid return of emissions highlights the urgency of addressing transportation as a key sector in efforts to reduce overall CO2 emissions.
The study’s findings emphasize the critical role of the transportation sector in Malaysia’s broader climate goals, particularly the commitment to reducing CO2 emissions by 45% by 2030. Given that motor vehicles are a dominant source of carbon emissions in urban areas, there is a clear need for intensified research and policy interventions aimed at reducing the transportation sector’s carbon footprint. This could involve strategies such as promoting the use of public transport, increasing the adoption of electric vehicles, improving traffic management systems, and encouraging urban planning that minimizes the need for vehicle use.
The research demonstrates the significant impact of transportation on CO2 emissions and underscores the importance of addressing vehicular emissions in efforts to mitigate climate change. As Malaysia seeks to meet its carbon reduction targets, the findings of this study provide valuable insights into the spatial and temporal dynamics of transportation-related emissions, offering a foundation for developing effective mitigation strategies at both local and national levels. Long-term solutions will need to focus not only on technological advancements but also on encouraging behavioral changes in transportation habits and investing in sustainable infrastructure.

6. Conclusions

This study highlights the significant role of transportation in contributing to CO2 emissions within urban areas, especially through vehicle emissions. Using high-resolution satellite imagery from Sentinel-5P and GIS-based analytical tools, this research successfully mapped and analyzed the spatial and temporal patterns of CO2 emissions in Mukim Kajang, providing a comprehensive look at emission hotspots and trends. The findings demonstrate that areas with high traffic density and urban activity, particularly major towns within Mukim Kajang, are major contributors to CO2 emissions.
A notable decrease in emissions during 2020, attributed to the COVID-19 pandemic, underscores the direct impact of reduced transportation activity on emission levels. This temporary decline reveals the potential for emissions reduction through structural changes, such as decreased reliance on personal vehicles and increased adoption of sustainable transport practices. However, the subsequent rebound in emissions in 2021 and 2022 emphasizes the need for long-term, sustainable interventions to achieve lasting reductions.
This study underscores the urgency of implementing measures such as promoting public transportation, increasing the adoption of electric vehicles, and enhancing urban planning strategies that reduce vehicle dependence. The findings contribute to Sustainable Development Goal 13 (Climate Action) by providing valuable insights that can guide policymakers in formulating effective strategies for mitigating CO2 emissions. Ultimately, this research serves as a foundation for developing targeted interventions and sustainable transport policies that align with Malaysia’s environmental goals and global climate targets. The study’s methodology and findings can be adapted for similar urban analyses in other regions, adding value to the global effort to address climate change.

Author Contributions

Validation, N.F.F.Y., M.R.M.Y., K.N.A.M. and S.H.K.; Formal analysis, N.F.F.Y., M.R.M.Y., K.N.A.M. and Y.J.; Investigation, N.F.F.Y., M.R.M.Y., K.N.A.M. and S.H.K.; Writing—original draft, N.F.F.Y.; Writing—review & editing, N.F.F.Y. and M.R.M.Y. All authors have read and agreed to the published version of the manuscript.

Funding

This research was funded by Dana Impak Perdana 2.0 (DIP 2.0) (Ref: UKM.PPI.800-1/3/3) and The APC was funded by Prince Sultan University.

Institutional Review Board Statement

Not applicable.

Informed Consent Statement

Not applicable.

Data Availability Statement

The original contributions presented in the study are included in the article, further inquiries can be directed to the corresponding authors.

Acknowledgments

The authors would like to acknowledge the support of Prince Sultan University for paying the Article Processing Charges (APC) of this publication and Dana Impak Perdana 2.0 (DIP 2.0) (Ref: UKM.PPI.800-1/3/3) for supporting this work.

Conflicts of Interest

The authors declare no conflict of interest.

References

  1. World Health Organization (WHO). Air Pollution; WHO: Geneva, Switzerland, 2019. [Google Scholar]
  2. Rajput, P.; Prakash, J.; Sharma, D. High-Resolution Ambient Record of Aerosols over Delhi and Associated Typical Health Effects. In Airborne Particulate Matter; Springer Nature: Singapore, 2022; pp. 75–101. [Google Scholar] [CrossRef]
  3. Manisalidis, I.; Stavropoulou, E.; Stavropoulos, A.; Bezirtzoglou, E. Environmental and Health Impacts of Air Pollution: A Review. Front. Public Health 2020, 8, 505570. [Google Scholar] [CrossRef] [PubMed]
  4. Neale, R.E.; Barnes, P.W.; Robson, T.M.; Neale, P.J.; Williamson, C.E.; Zepp, R.G.; Wilson, S.R.; Madronich, S.; Andrady, A.L.; Heikkilä, A.M.; et al. Environmental effects of stratospheric ozone depletion, UV radiation, and interactions with climate change: UNEP Environmental Effects Assessment Panel. In Photochemical and Photobiological Sciences; Springer International Publishing: Berlin/Heidelberg, Germany, 2021. [Google Scholar] [CrossRef]
  5. Tan, C.H.; Ong, M.Y.; Nomanbhay, S.M.; Shamsuddin, A.H.; Show, P.L. The Influence of COVID-19 on Global CO2 Emissions and Climate Change: A Perspective from Malaysia. Sustainability 2021, 13, 8461. [Google Scholar] [CrossRef]
  6. Ridzuan, N.Q.M.; Maiddin, S.H.M. Road Development in Five Malaysian Plan, 1966–1990. J. Hist. Dep. 2024, 33, 70–87. [Google Scholar] [CrossRef]
  7. Sukor, N.S.A.; Airak, S.; Hassan, S.A. “More Than a Free Bus Ride”—Exploring Young Adults’ Perceptions of Free Bus Services Using a Qualitative Approach: A Case Study of Penang, Malaysia. Sustainability 2021, 13, 3294. [Google Scholar] [CrossRef]
  8. Nakhawa, H.A.; Thipse, S. Characterization of the Ultrafine and Nano Particle Emissions on Modified Indian Driving Cycle for Passenger Cars Operating on CNG Phase Wise Analysis. Adv. Eng. Forum 2015, 14, 86–96. [Google Scholar] [CrossRef]
  9. Khaniabadi, Y.O.; Goudarzi, G.; Daryanoosh, S.M.; Borgini, A.; Tittarelli, A.; De Marco, A. Exposure to PM10, NO2, and O3 and impacts on human health. Environ. Sci. Pollut. Res. 2017, 24, 2781–2789. [Google Scholar] [CrossRef]
  10. Olaniyan, T.; Jeebhay, M.; Röösli, M.; Naidoo, R.N.; Künzli, N.; de Hoogh, K.; Saucy, A.; Badpa, M.; Baatjies, R.; Parker, B.; et al. The association between ambient NO2 and PM2.5 with the respiratory health of school children residing in informal settlements: A prospective cohort study. Environ. Res. 2020, 186, 109606. [Google Scholar] [CrossRef]
  11. Chowdhury, M.I.; Rahman, S.M.; Abubakar, I.R.; Aina, Y.A.; Hasan, A.; Khondaker, A.N. A review of policies and initiatives for climate change mitigation and environmental sustainability in Bangladesh. Environ. Dev. Sustain. 2020, 23, 1133–1161. [Google Scholar] [CrossRef]
  12. Yu, D.; Zhou, X.; Qi, H.; Qian, F. Low-carbon city planning based on collaborative analysis of supply and demand scenarios. City Built Environ. 2023, 1, 7. [Google Scholar] [CrossRef]
  13. Schröder, M.; Cabral, P. Eco-friendly 3D-Routing: A GIS based 3D-Routing-Model to estimate and reduce CO2-emissions of distribution transports. Comput. Environ. Urban Syst. 2019, 73, 40–55. [Google Scholar] [CrossRef]
  14. Zhu, C.; Gao, D. A Research on the Factors Influencing Carbon Emission of Transportation Industry in “the Belt and Road Initiative” Countries Based on Panel Data. Energies 2019, 12, 2405. [Google Scholar] [CrossRef]
  15. Sukor, N.S.A.; Basri, N.K.; Hassan, S.A. Carbon Footprint Reduction in Transportation Activity by Emphasizing the Usage of Public Bus Services Among Adolescents. IOP Conf. Ser. Mater. Sci. Eng. 2017, 226, 012054. [Google Scholar] [CrossRef]
  16. CO2 Emissions from Cars: The Facts; Transport & Environment: Brussels, Belgium, 2018.
  17. Brand, C.; Dons, E.; Anaya-Boig, E.; Avila-Palencia, I.; Clark, A.; de Nazelle, A.; Gascon, M.; Gaupp-Berghausen, M.; Gerike, R.; Götschi, T.; et al. The climate change mitigation effects of daily active travel in cities. Transp. Res. Part D Transp. Environ. 2021, 93, 102764. [Google Scholar] [CrossRef]
  18. Heni, H.; Diop, S.A.; Renaud, J.; Coelho, L.C. Measuring fuel consumption in vehicle routing: New estimation models using supervised learning. Int. J. Prod. Res. 2021, 61, 114–130. [Google Scholar] [CrossRef]
  19. Mądziel, M. Vehicle Emission Models and Traffic Simulators: A Review. Energies 2023, 16, 3941. [Google Scholar] [CrossRef]
  20. Farren, N.J.; Davison, J.; Rose, R.A.; Wagner, R.L.; Carslaw, D.C. Underestimated Ammonia Emissions from Road Vehicles. Environ. Sci. Technol. 2020, 54, 15689–15697. [Google Scholar] [CrossRef]
  21. Singh, D.; Dahiya, M.; Kumar, R.; Nanda, C. Sensors and systems for air quality assessment monitoring and management: A review. J. Environ. Manag. 2021, 289, 112510. [Google Scholar] [CrossRef]
  22. Pan, G.; Xu, Y.; Ma, J. The potential of CO2 satellite monitoring for climate governance: A review. J. Environ. Manag. 2020, 277, 111423. [Google Scholar] [CrossRef]
  23. Maurya, N.K.; Pandey, P.C.; Sarkar, S.; Kumar, R.; Srivastava, P.K. Spatio-Temporal Monitoring of Atmospheric Pollutants Using Earth Observation Sentinel 5P TROPOMI Data: Impact of Stubble Burning a Case Study. ISPRS Int. J. Geo Inf. 2022, 11, 301. [Google Scholar] [CrossRef]
  24. European Space Agency. Sentinel 5P. Available online: https://Sentinel.Esa.Int/Web/Sentinel/Missions/Sentinel-5p (accessed on 13 November 2021).
  25. Sagar, V.K.; Pathakoti, M.; Mahalakshmi, D.V.; Rajan, K.S.; Sesha Sai, M.V.R.; Hase, F.; Dubravica, D.; Sha, M.K. Ground-Based Remote Sensing of Total Columnar CO2, CH4, and CO Using EM27/SUN FTIR Spectrometer at a Suburban Location (Shadnagar) in India and Validation of Sentinel-5P/TROPOMI. IEEE Geosci. Remote. Sens. Lett. 2022, 19, 1005505. [Google Scholar] [CrossRef]
  26. Howari, F.M.; Ghrefat, H. Geographic information system: Spatial data structures, models, and case studies. In Pol-Lution Assessment for Sustainable Practices in Applied Sciences and Engineering; Elsevier: Amsterdam, The Netherlands, 2021; pp. 165–198. [Google Scholar] [CrossRef]
  27. Samany, N.N.; Liu, H.; Aghataher, R.; Bayat, M. Ten GIS-Based Solutions for Managing and Controlling COVID-19 Pandemic Outbreak. SN Comput. Sci. 2022, 3, 269. [Google Scholar] [CrossRef] [PubMed]
  28. Dehimi, S. The use of new techniques in spatial modeling and analysis of urban quality of life: Multiple-criteria decision analysis and GIS. Geoj. Tour. Geosites 2021, 35, 355–363. [Google Scholar] [CrossRef]
  29. Liu, Q.; Zhao, P.; Zhang, Y.; Zhang, Z.; Yang, J. Estimating the non-linear effects of urban built environment at residence and workplace on carbon dioxide emissions from commuting. Front. Public Health 2022, 10, 1077560. [Google Scholar] [CrossRef]
  30. Heripracoyo, S.; Imawan, F.Z.; Adikusumo, L.W. Design of the Mobile Application to Reduce the Carbon Track. IOP Conf. Ser. Earth Environ. Sci. 2024, 1324, 012005. [Google Scholar] [CrossRef]
  31. Zhang, P.; Yang, Z.; Ma, Q.; Huang, J.; Jia, J.; Li, H.; Liu, H. EAI Endorsed Transactions Study on the Influence of Land Use Change on Carbon Emissions Using System Modeling under the Framework of Dual Carbon Goals. EAI Endorsed Trans. Energy Web 2024, 11, 5717. [Google Scholar] [CrossRef]
  32. Kang, J.; Zhang, B.; Dang, A. A novel geospatial machine learning approach to quantify non-linear effects of land use/land cover change (LULCC) on carbon dynamics. Int. J. Appl. Earth Obs. Geoinf. 2024, 128, 103712. [Google Scholar] [CrossRef]
  33. Ma, J.; Xu, M.; Jiang, J. Mapping high-resolution urban road carbon and pollutant emissions using travel demand data. Energy 2022, 263, 126059. [Google Scholar] [CrossRef]
  34. Chan, T.N.; Choi, B.; Xu, J.; Cheng, R. Kernel Density Visualization for Big Geospatial Data: Algorithms and Applications. In Proceedings of the 24th IEEE International Conference on Mobile Data Management (MDM), Singapore, 3–6 July 2023; pp. 1–4. [Google Scholar] [CrossRef]
  35. Gelb, J.; Apparicio, P. Temporal Network Kernel Density Estimation. Geogr. Anal. 2023, 56, 62–78. [Google Scholar] [CrossRef]
  36. Zhang, G.; Xu, J.; Zhang, G.; Xu, J. Multi-GPU-Parallel and Tile-Based Kernel Density Estimation for Large-Scale Spatial Point Pattern Analysis. ISPRS Int. J. Geo Inf. 2023, 12, 31. [Google Scholar] [CrossRef]
  37. Shu, Y.; Lam, N.S. Spatial disaggregation of carbon dioxide emissions from road traffic based on multiple linear regression model. Atmos. Environ. 2011, 45, 634–640. [Google Scholar] [CrossRef]
  38. Qin, H.; Huang, Q.; Zhang, Z.; Lu, Y.; Li, M.; Xu, L.; Chen, Z. Carbon dioxide emission driving factors analysis and policy implications of Chinese cities: Combining geographically weighted regression with two-step cluster. Sci. Total. Environ. 2019, 684, 413–424. [Google Scholar] [CrossRef] [PubMed]
  39. Liu, H.; Nie, J.; Cai, B.; Cao, L.; Wu, P.; Pang, L.; Wang, X. CO2 emissions patterns of 26 cities in the Yangtze River Delta in 2015: Evidence and implications. Environ. Pollut. 2019, 252, 1678–1686. [Google Scholar] [CrossRef] [PubMed]
  40. Tu, L.H.; Ha, P.T.; Tram, V.N.Q.; Thuy, N.N.; Phuong, D.N.D.; Nhat, T.T.; Loi, N.K. GIS Application in Environmental Management: A Review. VNU J. Sci. Earth Environ. Sci. 2023, 39, 4957. [Google Scholar] [CrossRef]
  41. Hunter, G.W.; Sagoe, G.; Vettorato, D.; Jiayu, D. Sustainability of Low Carbon City Initiatives in China: A Comprehensive Literature Review. Sustainability 2019, 11, 4342. [Google Scholar] [CrossRef]
  42. Zhu, Q.; Liu, Y.; Liu, M.; Zhang, S.; Chen, G.; Meng, H. Intelligent Planning and Research on Urban Traffic Congestion. Futur. Internet 2021, 13, 284. [Google Scholar] [CrossRef]
  43. Campisi, T.; Severino, A.; Al-Rashid, M.A.; Pau, G. The Development of the Smart Cities in the Connected and Autonomous Vehicles (CAVs) Era: From Mobility Patterns to Scaling in Cities. Infrastructures 2021, 6, 100. [Google Scholar] [CrossRef]
  44. Dewan Negeri Selangor. Mesyuarat Ketiga Penggal Kedua Dewan Negeri Selangor. Portal Rasmi Dewan Negeri Selangor. 2024. Available online: http://dewan.selangor.gov.my/question/tahap-usia-belia-dewasa/ (accessed on 13 August 2024).
  45. AbdelSattar, A. Monitoring Air Pollution Using Satellite Data. In Proceedings of the International Conference on Indusrial Engineering and Operations Management, Riyadh, Saudi Arabia, 26–28 November 2019; pp. 772–780. [Google Scholar]
  46. Broquet, G.; Bréon, F.-M.; Renault, E.; Buchwitz, M.; Reuter, M.; Bovensmann, H.; Chevallier, F.; Wu, L.; Ciais, P. The potential of satellite spectro-imagery for monitoring CO2 emissions from large cities. Atmos. Meas. Tech. 2018, 11, 681–708. [Google Scholar] [CrossRef]
  47. van Geffen, J.; Eskes, H.; Compernolle, S.; Pinardi, G.; Verhoelst, T.; Lambert, J.-C.; Sneep, M.; ter Linden, M.; Ludewig, A.; Boersma, K.F.; et al. Sentinel-5P TROPOMI NO2 retrieval: Impact of version v2.2 improvements and comparisons with OMI and ground-based data. Atmos. Meas. Tech. 2022, 5, 2037–2060. [Google Scholar] [CrossRef]
  48. Song, X.-P.; Huang, W.; Hansen, M.C.; Potapov, P. An evaluation of Landsat, Sentinel-2, Sentinel-1 and MODIS data for crop type mapping. Sci. Remote Sens. 2021, 3, 100018. [Google Scholar] [CrossRef]
  49. Enkhjargal, O.; Tuyagerel, D.; Tovuudorj, R.; Khurelsukh, Z.; Sarangerel, E. Dispersion mapping of Carbon Monoxide (CO) derived Sentinel 5P and evaluation with LUR model during winter in Ulaanbaatar, Mongolia. Proc. Mong. Acad. Sci. 2024, 64, 3545. [Google Scholar] [CrossRef]
  50. Borsdorff, T.; de Brugh, J.A.; Pandey, S.; Hasekamp, O.; Aben, I.; Houweling, S.; Landgraf, J. Carbon monoxide air pollution on sub-city scales and along arterial roads detected by the Tropospheric Monitoring Instrument. Atmos. Chem. Phys. 2019, 19, 3579–3588. [Google Scholar] [CrossRef]
  51. Reuter, M.; Buchwitz, M.; Schneising, O.; Krautwurst, S.; O’Dell, C.W.; Richter, A.; Bovensmann, H.; Burrows, J.P. Towards monitoring localized CO2 emissions from space: Co-located regional CO2 and NO2 enhancements observed by the OCO-2 and S5P satellites. Atmos. Chem. Phys. 2019, 19, 9371–9383. [Google Scholar] [CrossRef]
  52. Omokpariola, D.O.; Nduka, J.N.; Omokpariola, P.L. Short-term trends of air quality and pollutant concentrations in Nigeria from 2018–2022 using tropospheric sentinel-5P and 3A/B satellite data. Discov. Appl. Sci. 2024, 6, 182. [Google Scholar] [CrossRef]
  53. Chimot, J.; Bosch, H.; Bovensmann, H.; Buchwitz, M.; Breon, F.-M.; Camy-Peyret, C.; Bacour, C.; Weele MVan Haan, J.D.; Veefkind, P. Requirement for CO2 Monitoring by Sentinel-Noveltis. 2012. Available online: https://www.iup.uni-bremen.de/sciamachy/NIR_NADIR_WFM_DOAS/NOV-3945-NT-11712_v1.1.pdf (accessed on 13 August 2024).
  54. Wang, Y.; Munger, J.W.; Xu, S.; McElroy, M.B.; Hao, J.; Nielsen, C.P.; Ma, H. CO2 and its correlation with CO at a rural site near Beijing: Implications for combustion efficiency in China. Atmos. Chem. Phys. 2010, 10, 8881–8897. [Google Scholar] [CrossRef]
  55. Niu, Z.; Zhou, W.; Feng, X.; Feng, T.; Wu, S.; Cheng, P.; Lu, X.; Du, H.; Xiong, X.; Fu, Y. Atmospheric fossil fuel CO2 traced by 14CO2 and air quality index pollutant observations in Beijing and Xiamen, China. Environ. Sci. Pollut. Res. 2018, 25, 17109–17117. [Google Scholar] [CrossRef] [PubMed]
  56. FlexBook Portal. Ratio CO vs. COCK-12 Foundation 2022. 2019. Available online: https://flexbooks.ck12.org/cbook/ck-12-chemistry-flexbook-2.0/section/4.3/primary/lesson/law-of-multiple-proportions-chem/ (accessed on 27 January 2022).
  57. Zeng, T.; Fu, W.B. The ratio CO/CO2 of oxidation on a burning carbon surface. Combust. Flame J. 1996, 107, 197–210. [Google Scholar] [CrossRef]
  58. National Entrance Eligibility Test (NEET) Portal. CO vs CO2. 2021. Available online: https://Byjus.Com/Neet/Difference-between-Carbon-Dioxide-and-Carbon-Monoxide/ (accessed on 13 August 2021).
  59. Schneising, O.; Buchwitz, M.; Reuter, M.; Weimer, M.; Bovensmann, H.; Burrows, J.P.; Bösch, H. Towards a sector-specific CO/CO2 emission ratio: Satellite-based observations of CO release from steel production in Germany. Atmos. Chem. Phys. 2024, 24, 7609–7621. [Google Scholar] [CrossRef]
  60. Andrade, B.F.; Buchwitz, M.; Reuter, M.; Bovensmann, H.; Richter, A.; Boesch, H.; Burrows, J.P. A method for estimating localized CO2 emissions from co-located satellite XCO2 and NO2 images. Atmos. Meas. Tech. 2024, 17, 1145–1173. [Google Scholar] [CrossRef]
  61. Leguijt, G.; Maasakkers, J.D.; van der Gon, H.A.C.D.; Segers, A.J.; Borsdorff, T.; Aben, I. Quantification of carbon monoxide emissions from African cities using TROPOMI. Atmos. Chem. Phys. 2023, 23, 8899–8919. [Google Scholar] [CrossRef]
  62. Bíl, M.; Andrášik, R.; Janoška, Z. Identification of hazardous road locations of traffic accidents by means of kernel density estimation and cluster significance evaluation. Accid. Anal. Prev. 2013, 55, 265–273. [Google Scholar] [CrossRef]
  63. Portal The Star. Malaysia Offered Help to Fight Indonesia Forest Fires, Says Dr M. 2019. Available online: https://www.thestar.com.my/news/nation/2019/09/19/malaysia-offered-help-to-fight-indonesia-forest-fires-says-dr-m (accessed on 11 July 2024).
  64. Fachrie, M. Indonesia’s Forest Fire and Haze Pollution: An Analysis of Human Security. Malays. J. Int. Relat. 2020, 8, 104–117. [Google Scholar] [CrossRef]
  65. Datta, A.; Krishnamoorti, R. Understanding the Greenhouse Gas Impact of Deforestation Fires in Indonesia and Brazil in 2019 and 2020. Front. Clim. 2022, 4, 799632. [Google Scholar] [CrossRef]
  66. Charusombat, P. ASEAN Cooperation on Transboundary Haze Pollution: The Perspective of Institutional Incremental Change. J. Environ. Inf. Sci. 2022, 2, 1–12. [Google Scholar] [CrossRef]
  67. ASEAN Secretariat. Roadmap on ASEAN Cooperation Towards Transboundary Haze Pollution Control with Means of Implementation. 2022. Available online: https://www.researchgate.net/publication/362454611_ASEAN_Agreement_on_Transboundary_Haze_Pollution_Management_in_Mainland_Southeast_Asia (accessed on 13 November 2024).
  68. Suharjo, B.H. Research of Indonesian GHG Emission Assessment from Forest and Land Fires. J. Trop. Silvic. 2022, 13, 14–22. [Google Scholar]
  69. Le Quéré, C.; Jackson, R.B.; Jones, M.W.; Smith, A.J.P.; Abernethy, S.; Andrew, R.M.; De-Gol, A.J.; Willis, D.R.; Shan, Y.; Canadell, J.G.; et al. Temporary reduction in daily global CO2 emissions during the COVID-19 forced confinement. Nat. Clim. Chang. 2020, 10, 647–653. [Google Scholar] [CrossRef]
  70. Cail, S.; Criqui, P. Carbon dioxide emissions by the four largest world emitters: Past performance and future scenarios for China, USA. Europe and India. EAERE Mag. 2021, 11, 15–23. [Google Scholar]
  71. Jackson, R.B.; Friedlingstein, P.; Le Quéré, C.; Abernethy, S.; Andrew, R.M.; Canadell, J.G.; Ciais, P.; Davis, S.J.; Deng, Z.; Liu, Z.; et al. Global fossil carbon emissions rebound near pre-COVID-19 levels. Environ. Res. Lett. 2022, 17, 031001. [Google Scholar] [CrossRef]
  72. Ahmed, K.; Stern, D.I. China’s carbon emissions trend after the pandemic. Environ. Chall. 2023, 13, 100787. [Google Scholar] [CrossRef]
  73. Long, Y.; Yoshida, Y.; Li, Y.; Gasparatos, A. Spatial-temporal variation of CO2 emissions from private vehicle use in Japan. Environ. Res. Lett. 2022, 17, 014042. [Google Scholar] [CrossRef]
  74. Abbood, K.; Meszaros, F. Carbon Footprint Analysis of the Freight Transport Sector Using a Multi-Region Input–Output Model (MRIO) from 2000 to 2014: Evidence from Industrial Countries. Sustainability 2023, 15, 7787. [Google Scholar] [CrossRef]
  75. Sohail, M.T.; Ullah, S.; Majeed, M.T.; Usman, A. Pakistan management of green transportation and environmental pollution: A nonlinear ARDL analysis. Environ. Sci. Pollut. Res. 2021, 28, 29046–29055. [Google Scholar] [CrossRef] [PubMed]
  76. Georgatzi, V.V.; Stamboulis, Y.; Vetsikas, A. Examining the determinants of CO2 emissions caused by the transport sector: Empirical evidence from 12 European countries. Econ. Anal. Policy 2019, 65, 11–20. [Google Scholar] [CrossRef]
  77. Koçak, S.; Banday, T.P.; Awan, A. Is the environmental Kuznets curve valid for transport sector in Pakistan? New evidence for non-renewable energy and urbanization using the QARDL approach. Environ. Sci. Pollut. Res. 2023, 31, 46194–46206. [Google Scholar] [CrossRef] [PubMed]
  78. Kriswandanu, A.R.; Muhtadi, M.A.; Suprayitno, E.; Ahmaniyah, A.; Wardita, Y. Effects of Urbanization, Transport Infrastructure, Air Quality, and Health Outcomes on the Quality of Life of Jakarta City Population. J. Geosains West Sci. 2023, 1, 54–63. [Google Scholar] [CrossRef]
  79. Xiaoqi, T.; Leon-Garcia, A. Autonomous Mobility and Energy Service Management in Future Smart Cities: An Overview. In Proceedings of the 4th International Conference on Universal Village (UV), Boston, MA, USA, 21–24 October 2018; pp. 1–6. [Google Scholar] [CrossRef]
  80. Chen, Y.; Gu, Y.; Huang, Z.; Zhao, T.; Guo, L. An Urban Bus Network Generation Algorithm Based on Particle Swarm Optimization and Force Field Properties. J. Adv. Transp. 2022, 2022, 6369217. [Google Scholar] [CrossRef]
  81. Yusoff, I.; Ng, B.-K.; Azizan, S.A. Towards sustainable transport policy framework: A rail-based transit system in Klang Valley, Malaysia. PLoS ONE 2021, 16, e0248519. [Google Scholar] [CrossRef]
  82. Chen, W.; Wu, X.; Xiao, Z. Impact of Built Environment on Carbon Emissions from Cross-District Mobility: A Social Network Analysis Based on Private Vehicle Trajectory Big Data. Sustainability 2023, 15, 10930. [Google Scholar] [CrossRef]
  83. Sanchez, E.R.; Raghavan, S.; Wu, C. Data-Driven Traffic Reconstruction and Kernel Methods for Identifying Stop-and-Go Congestion. In Proceedings of the Tackling Climate Change with Machine Learning: Workshop at NeurIPS, and Computational Sustainability, New Orleans, LA, USA, 15 December 2023. [Google Scholar] [CrossRef]
  84. Komnos, D.; Nur, J.; Tansini, A.; Ktistakis, M.A.; Suarez, J.; Krause, J.; Fontaras, G. The Evolution of Conventional Vehicles’ Efficiency for Meeting Carbon Neutrality Ambition. In Proceedings of the CO2 Reduction for Transportation Systems Conference, Turin, Italy, 12–13 June 2024; pp. 1–10. [Google Scholar] [CrossRef]
  85. Liu, X.; Al-Qadi, I.L. Mechanistic Excess Fuel Consumption of a 3D Passenger Vehicle on Rough Pavements. J. Transp. Eng. Part B Pavements 2023, 149, 04022065. [Google Scholar] [CrossRef]
  86. Plati, C.; Pomoni, M.; Drainakis, A.; Loizos, A. Integrating roughness data to assess greenhouse gas emissions within pavement management decision-making. In Proceedings of the 7th International Conferenceon Road and Rail Infrastructure, Pula, Croatia, 11–15 May 2022; pp. 427–433. [Google Scholar] [CrossRef]
  87. Khahro, S.H.; Kumar, D.; Siddiqui, F.H.; Ali, T.H.; Raza, M.S.; Khoso, A.R. Optimizing Energy Use, Cost and Carbon Emission through Building Information Modelling and a Sustainability Approach: A Case-Study of a Hospital Building. Sustainability 2021, 13, 3675. [Google Scholar] [CrossRef]
  88. Raza, M.S.; Khahro, S.H.; Memon, S.A.; Ali, T.H.; Memon, N.A. Global trends in research on carbon footprint of buildings during 1971–2021: A bibliometric investigation. Environ. Sci. Pollut. Res. 2021, 28, 63227–63236. [Google Scholar] [CrossRef]
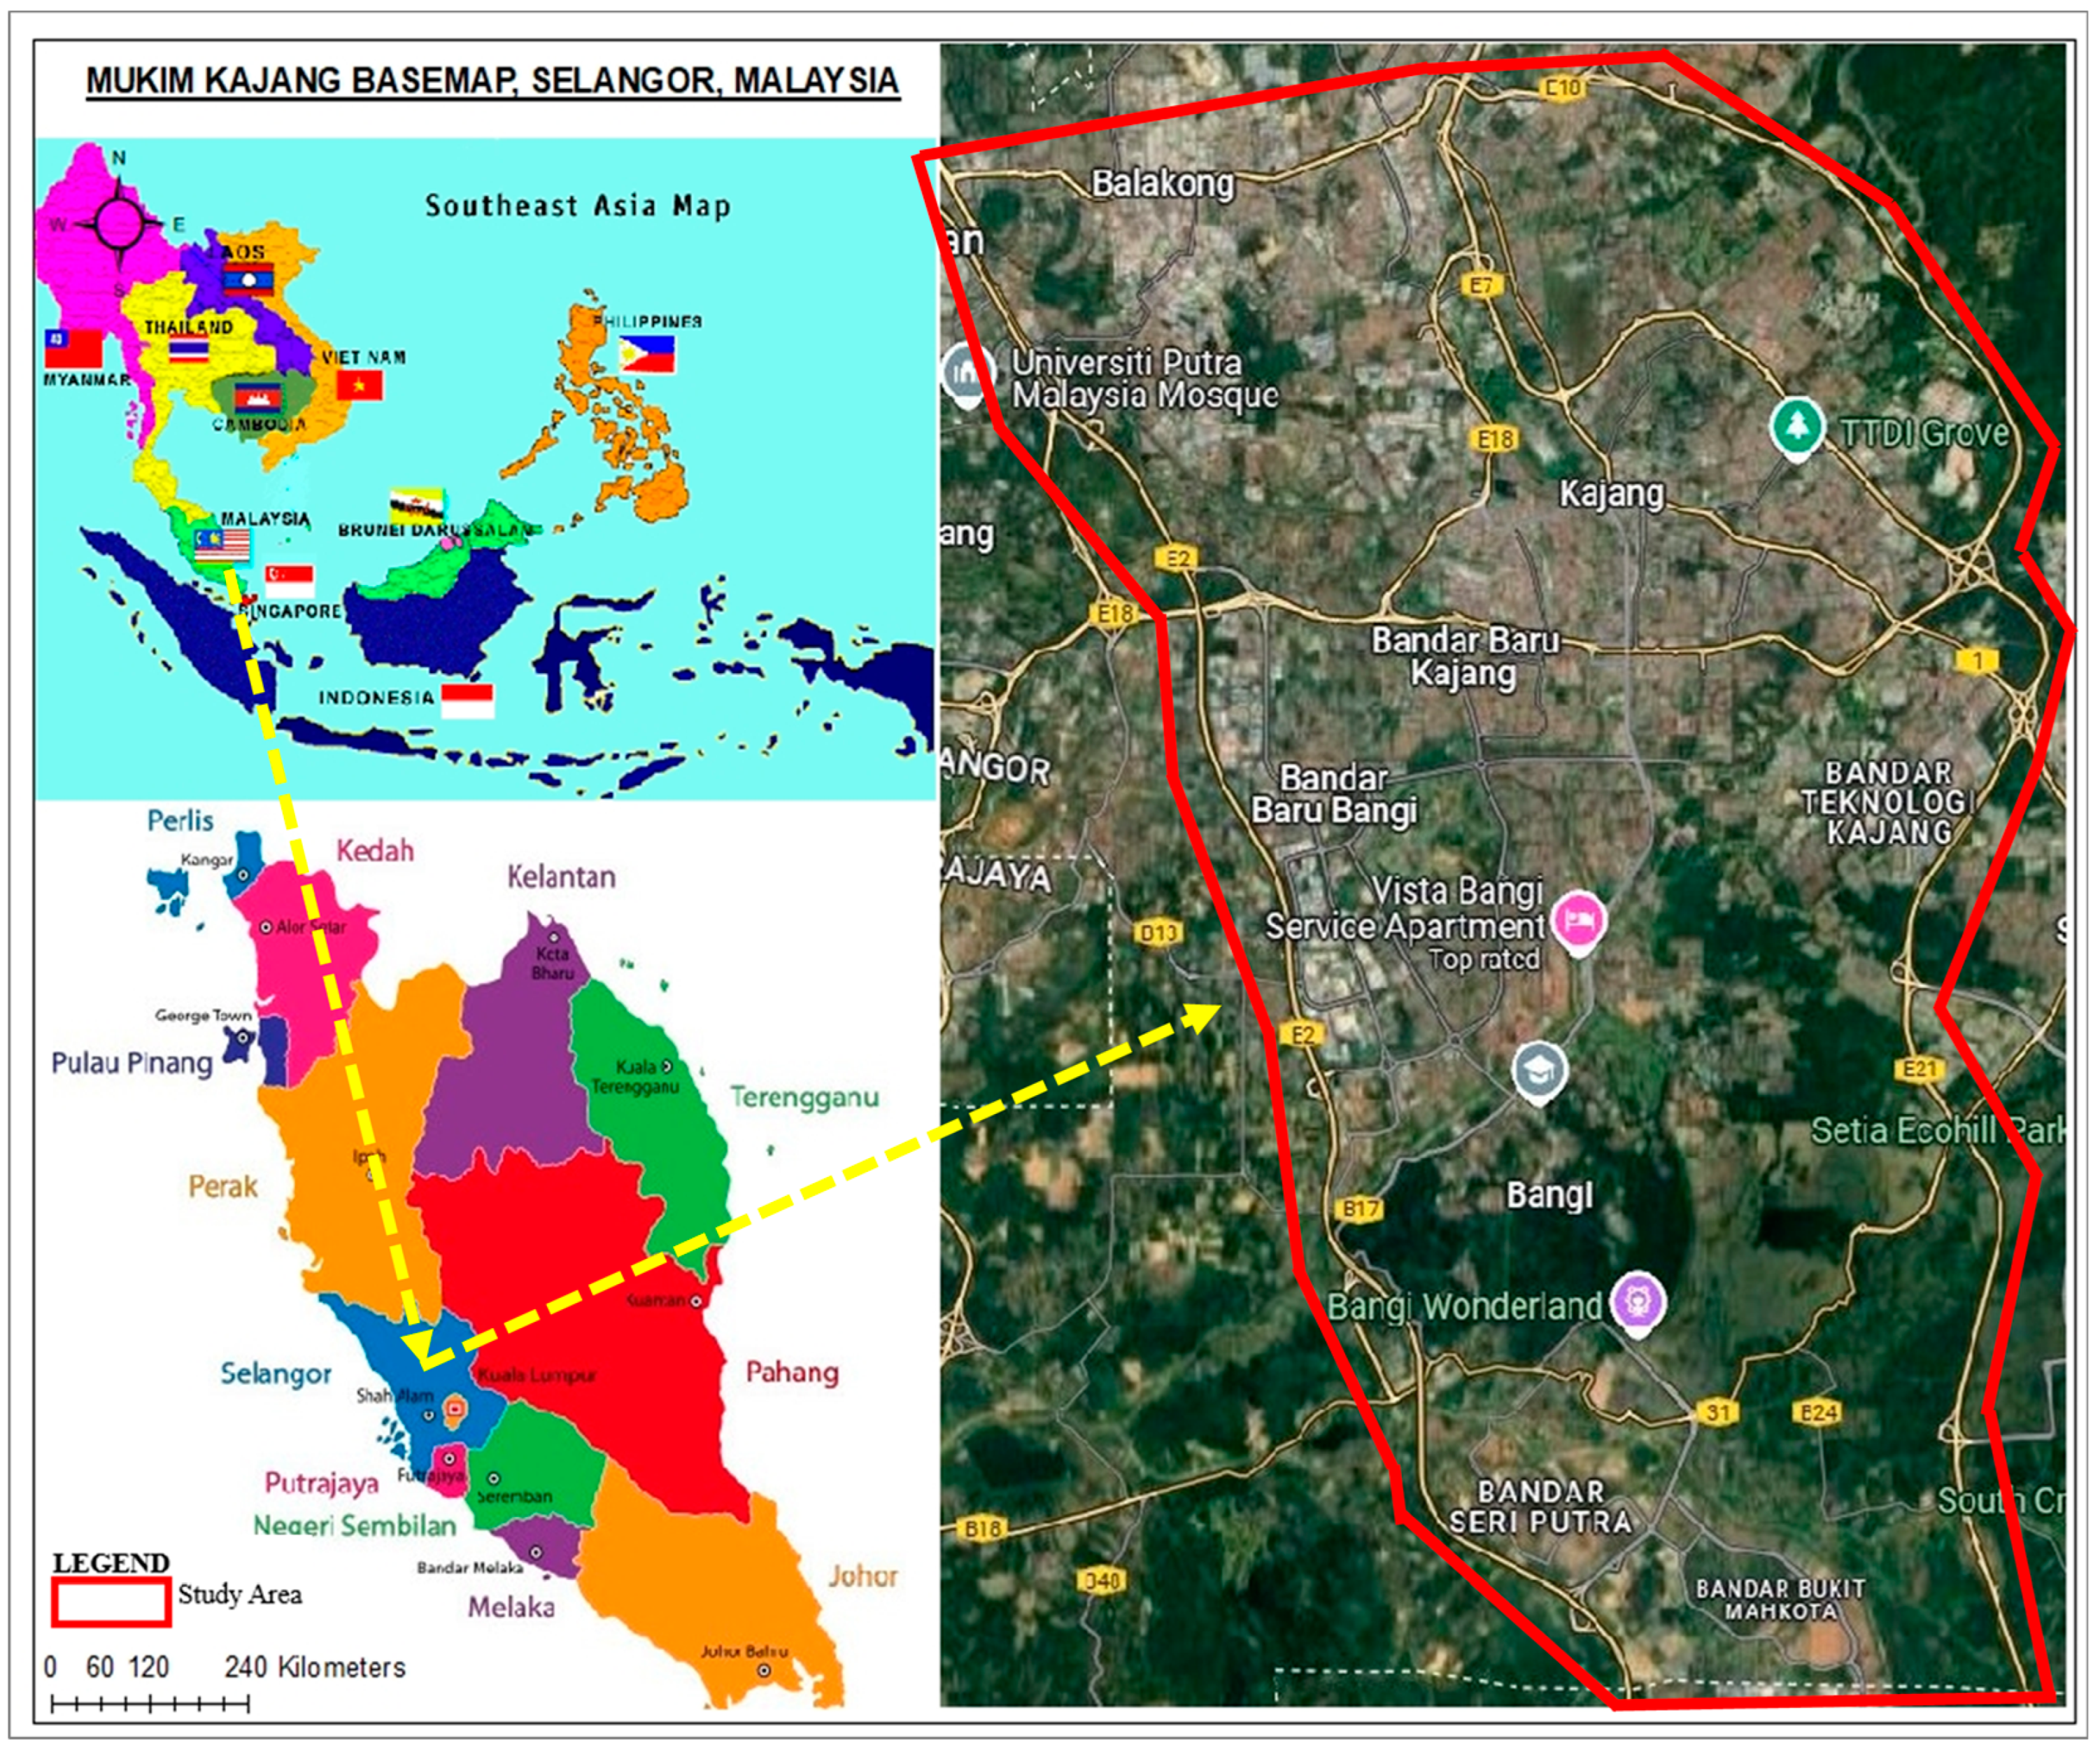
Figure 1. Mukim Kajang basemap.
Sustainability 16 10765 g001
Figure 2. GIS-based technical framework for CO2 emissions analysis and mapping.
Sustainability 16 10765 g002
Figure 3. Monthly average tropospheric CO2 total column (mol/m2) from 2019 to 2022.
Sustainability 16 10765 g003
Figure 4. Spatial–temporal pattern of annual CO2 emissions from 2019 to 2022.
Sustainability 16 10765 g004
Figure 5. Annual average of CO2 emissions from vehicles for 2019 to 2022.
Sustainability 16 10765 g005
Figure 6. Spatial–temporal pattern of annual CO2 emissions from vehicles.
Sustainability 16 10765 g006
Table 1. Characterization of CO2 vs. CO.
COCharacterizationCO2
CO is a combination of carbon atom (one) and oxygen atom (one); it is toxic and is produced when there is incomplete combustion of coal, fossil fuels, etc.DefinitionCO2 is also a combination of carbon atom (one) and oxygen atom (two); it is produced by animals and humans in the process of breathing, and is also obtained by the complete combustion of fossil fuels, coal, etc.
28 g/molMolecular Mass44 g/mol
Covalent bond and coordinate bond referred to as triple covalent bondType of BondCovalent bond
Does not naturally occur in the atmosphereOccurrenceNaturally occurs in the atmosphere
It is a flammable gas, causes fatal toxicity, and has an impact on the central nervous system, lungs, and bloodCriteriaIt is a non-flammable gas, rarely poisonous, and has an impact on the respiratory system
Source: [58].
Disclaimer/Publisher’s Note: The statements, opinions and data contained in all publications are solely those of the individual author(s) and contributor(s) and not of MDPI and/or the editor(s). MDPI and/or the editor(s) disclaim responsibility for any injury to people or property resulting from any ideas, methods, instructions or products referred to in the content.