

Integrated Simulation of Groundwater Flow and Nitrate Transport in an Alluvial Aquifer Using MODFLOW and MT3D: Insights into Pollution Dynamics and Management Strategies

 ,
,  and
and
Abstract
1. Introduction
2. Materials and Methods
2.1. Study Area
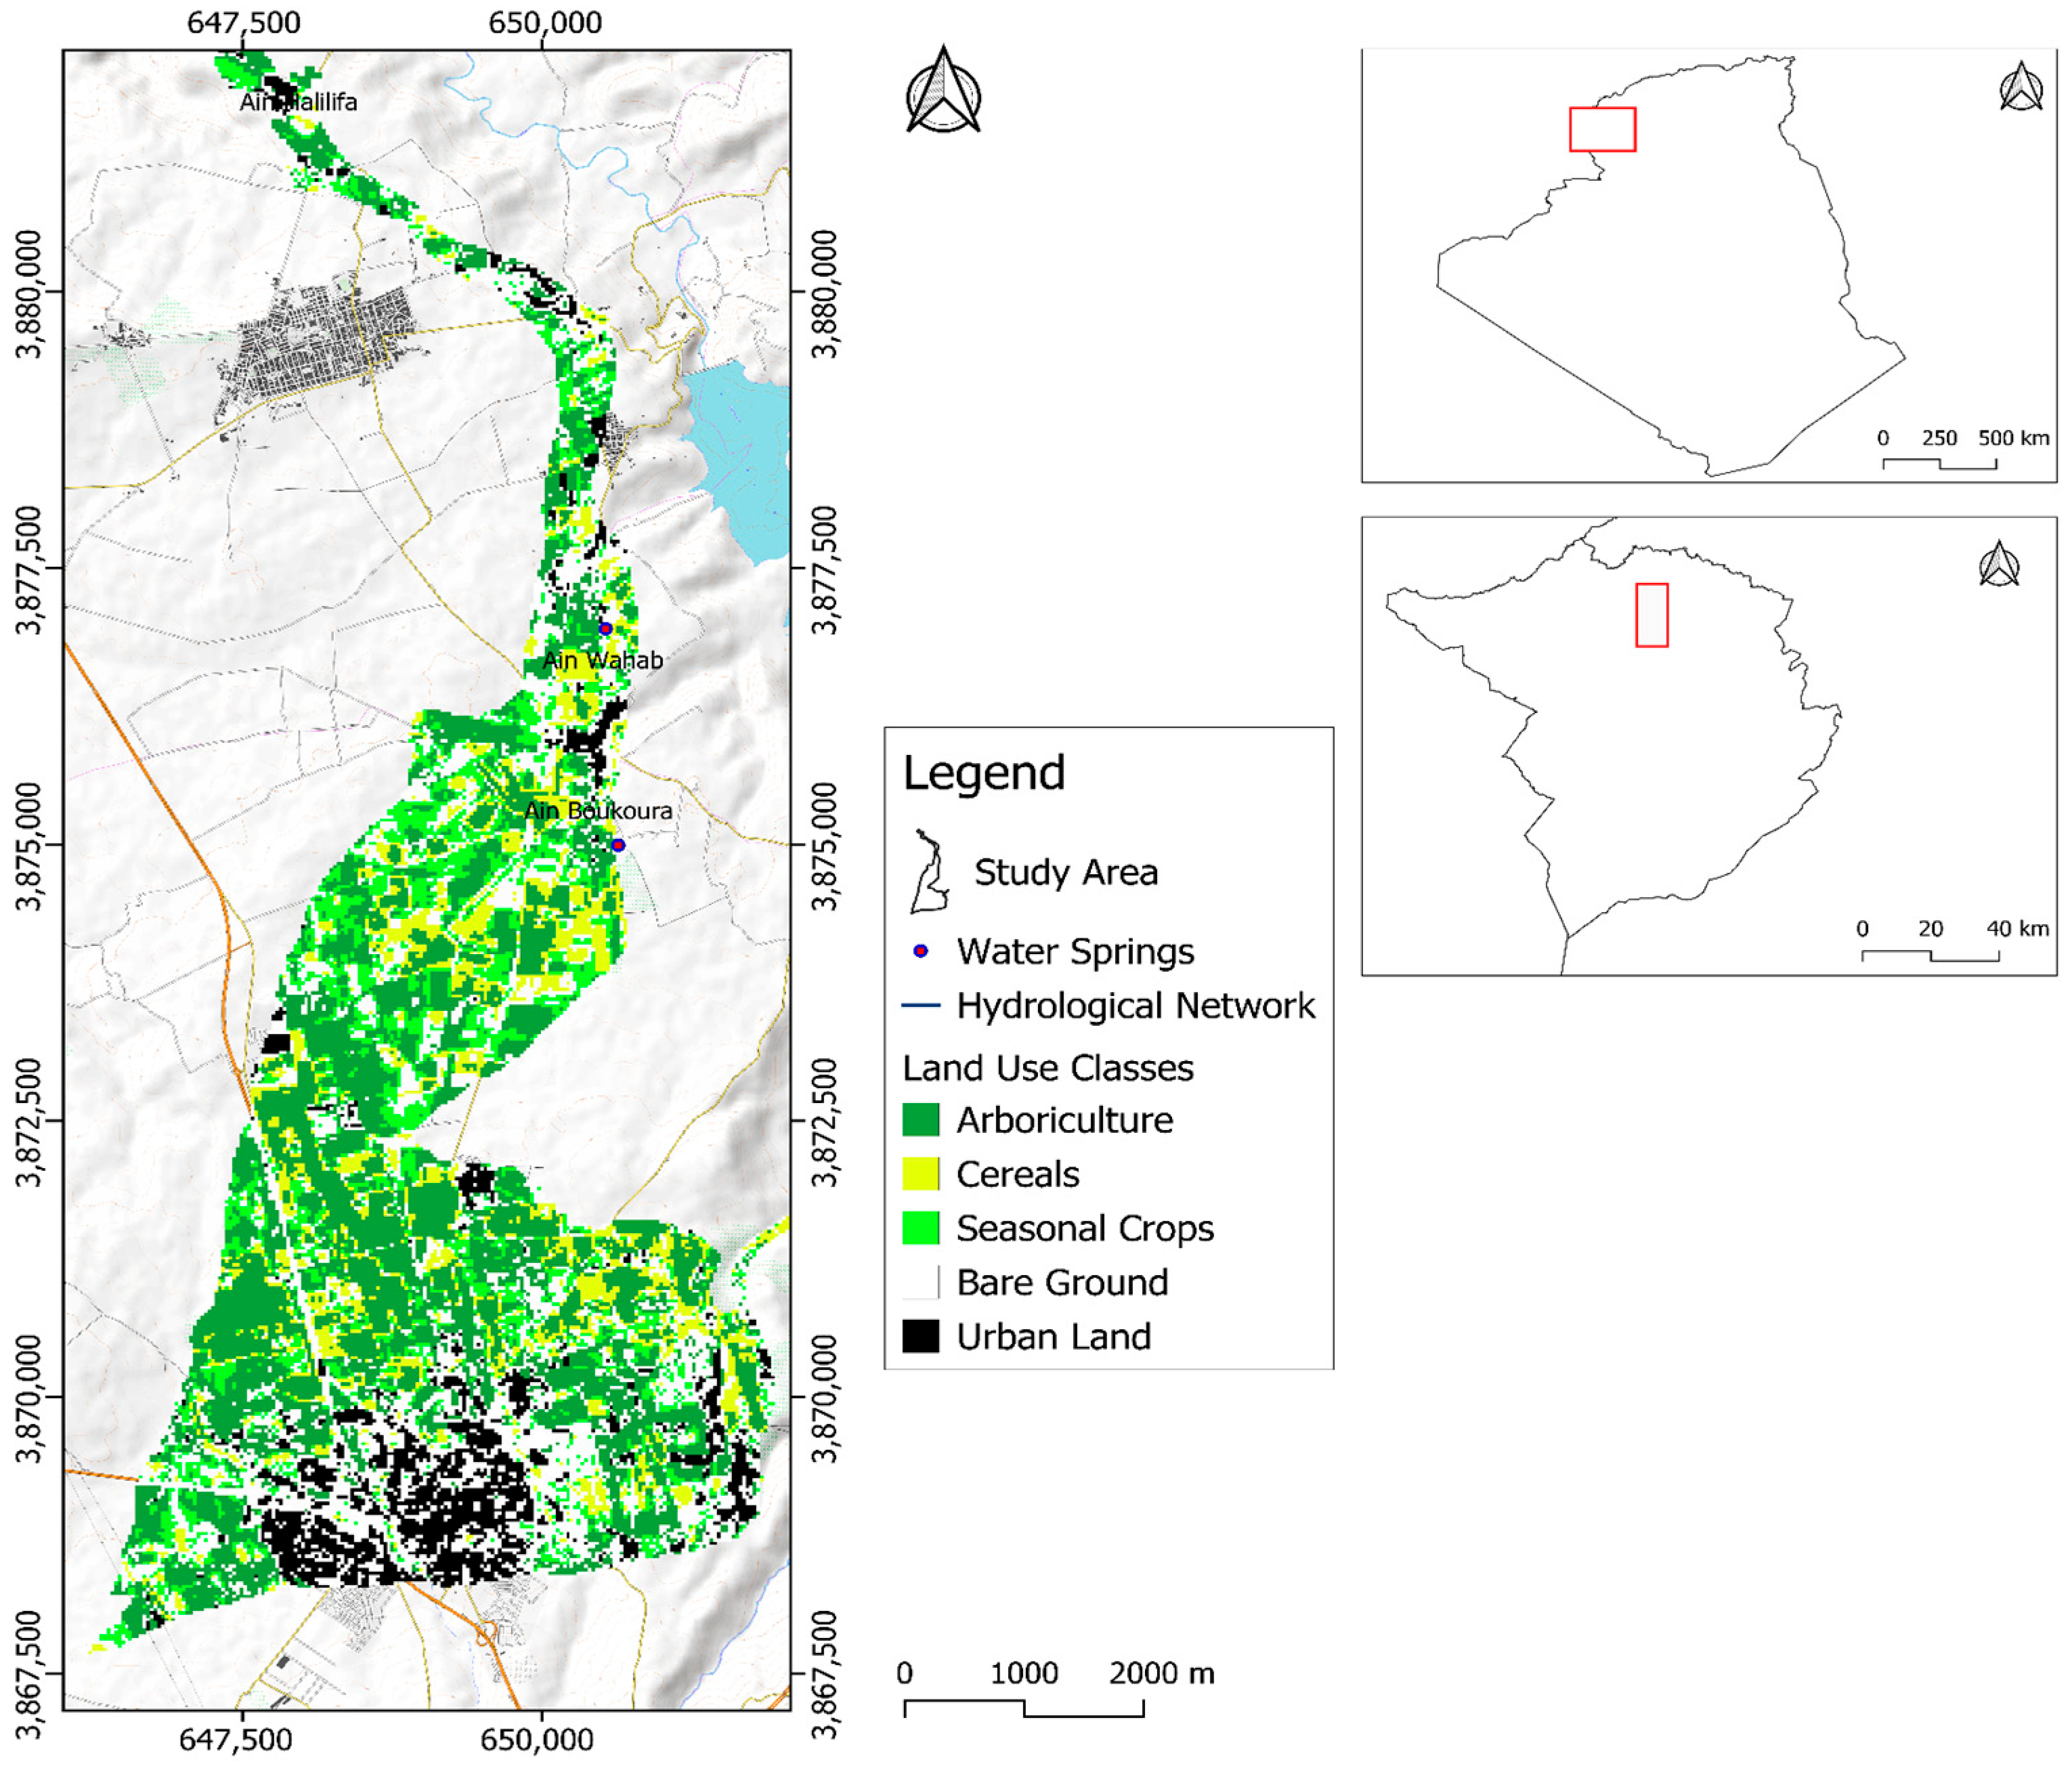
2.1.1. Location, Climate and Land Use
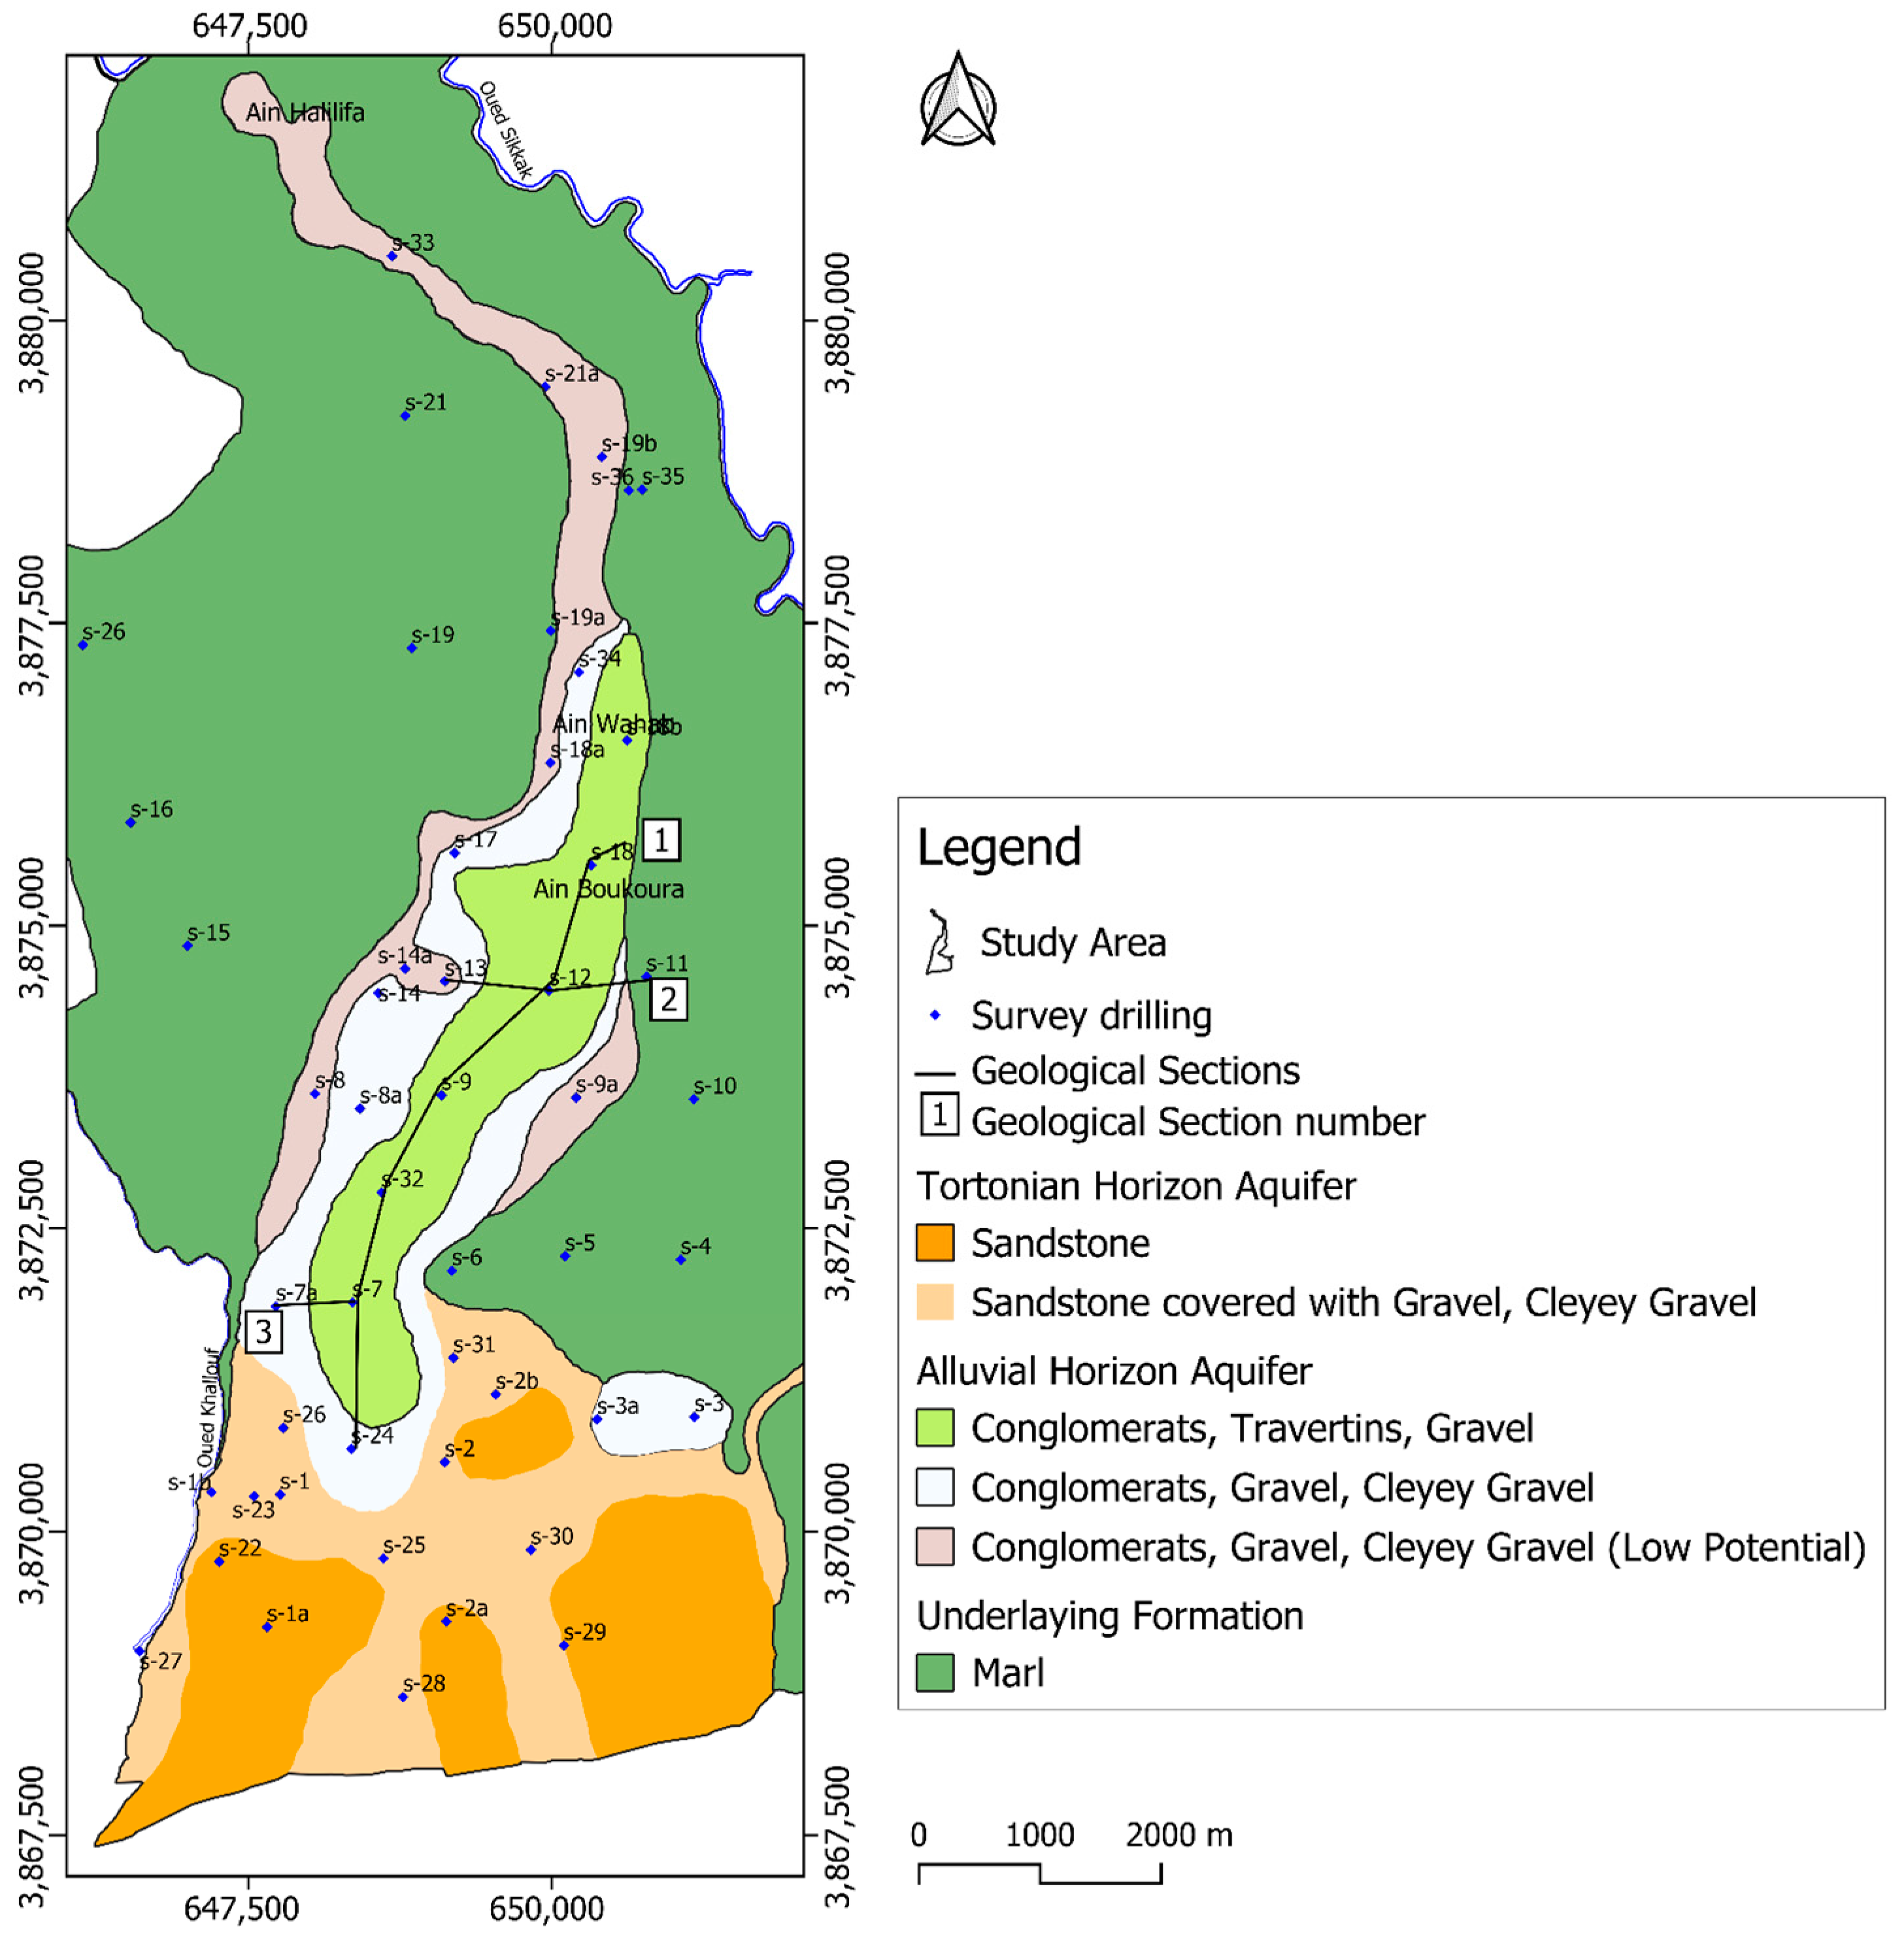
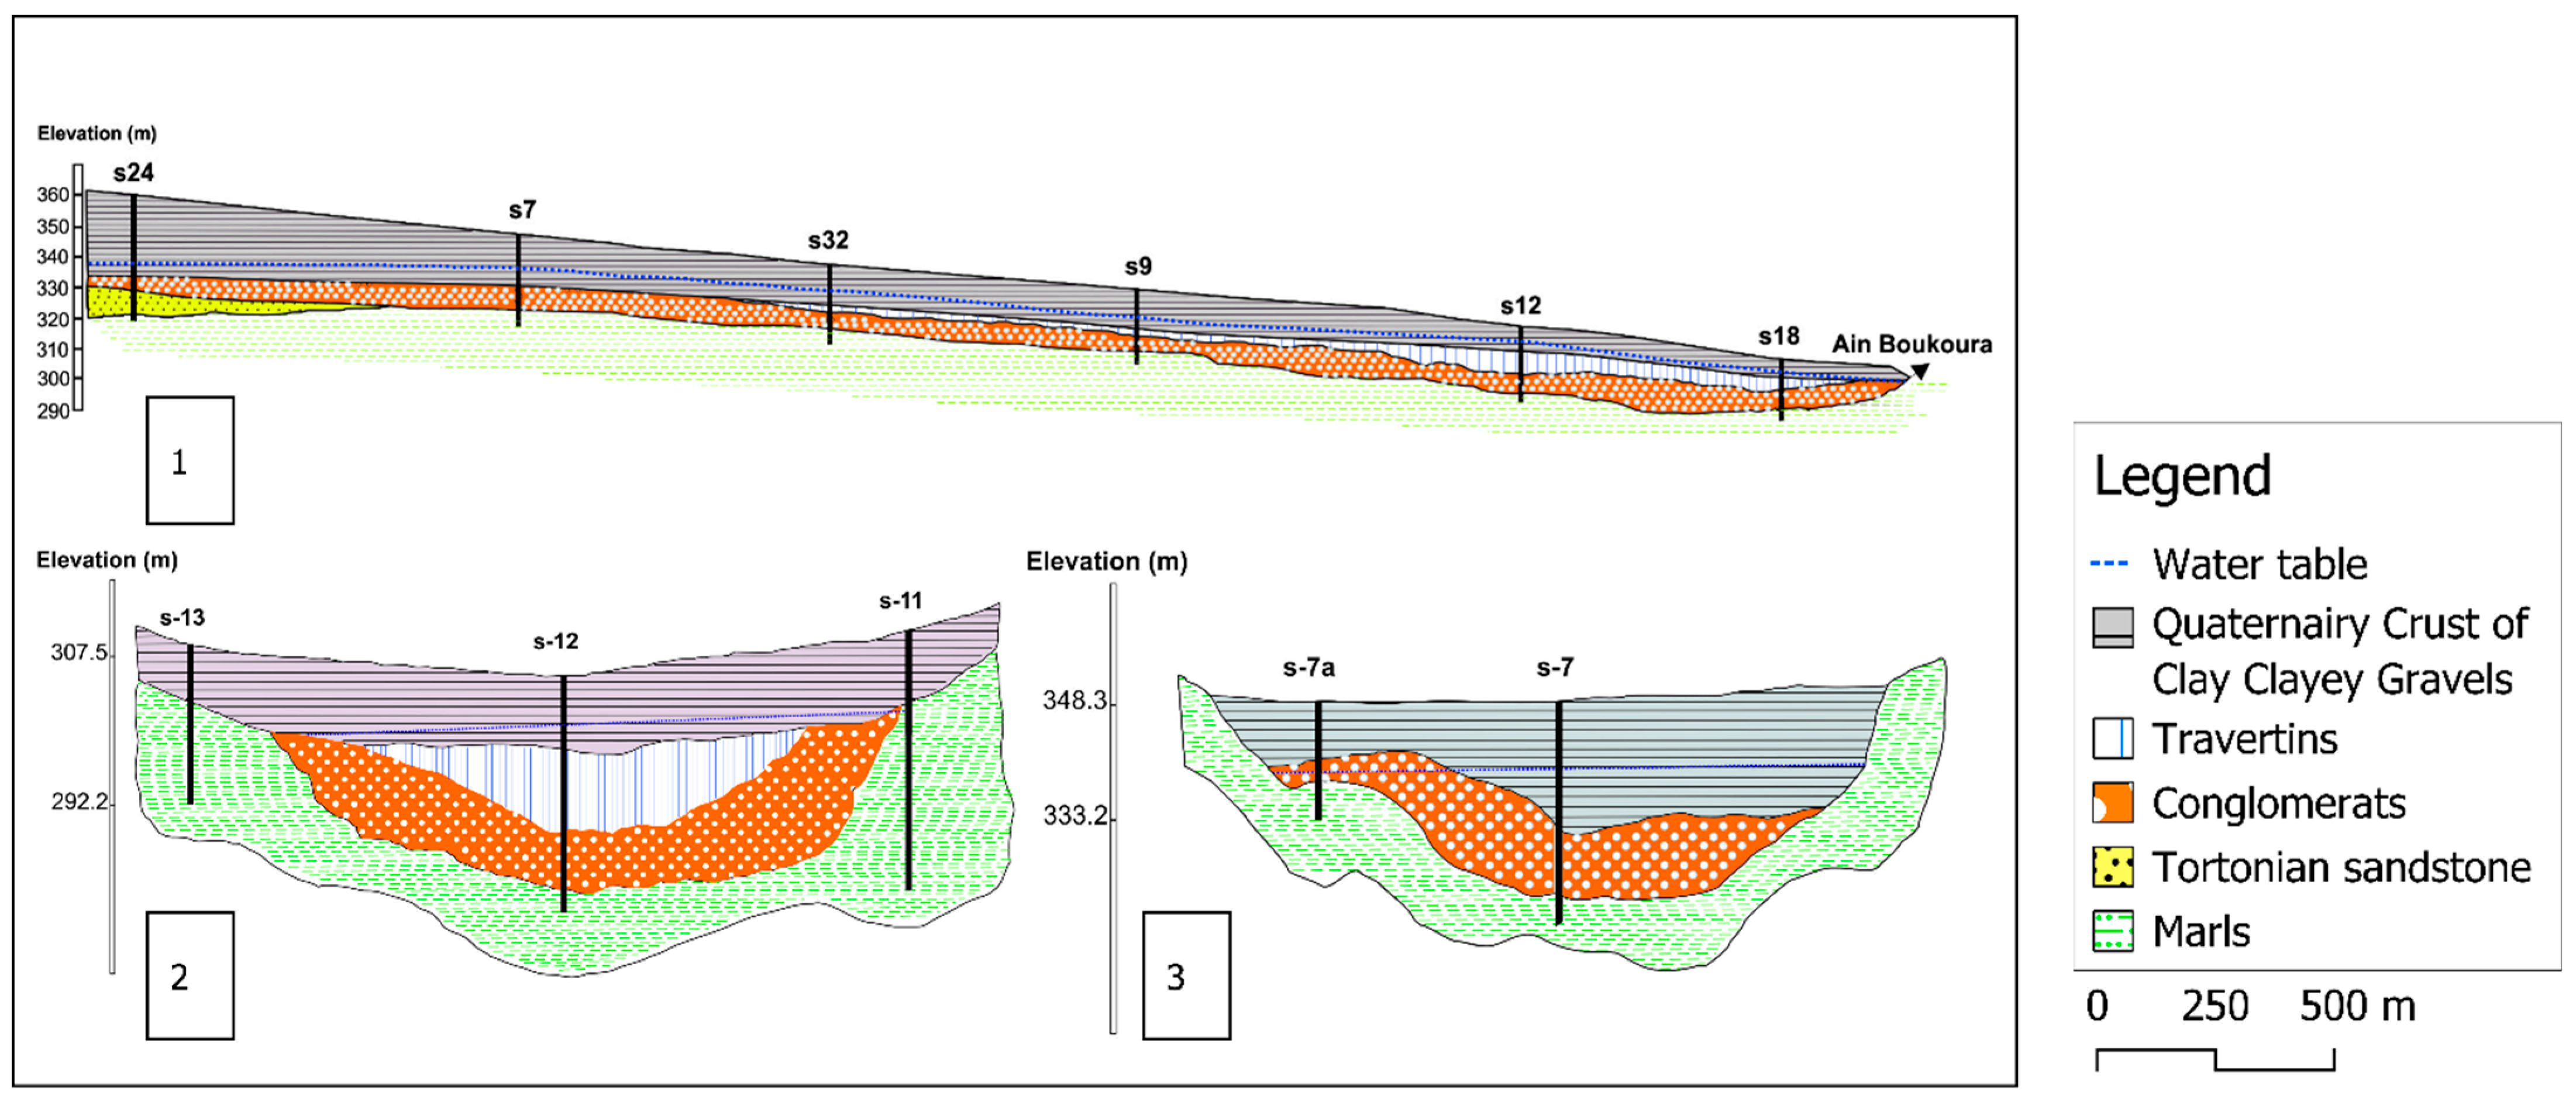
2.1.2. Geological and Hydrogeological Settings
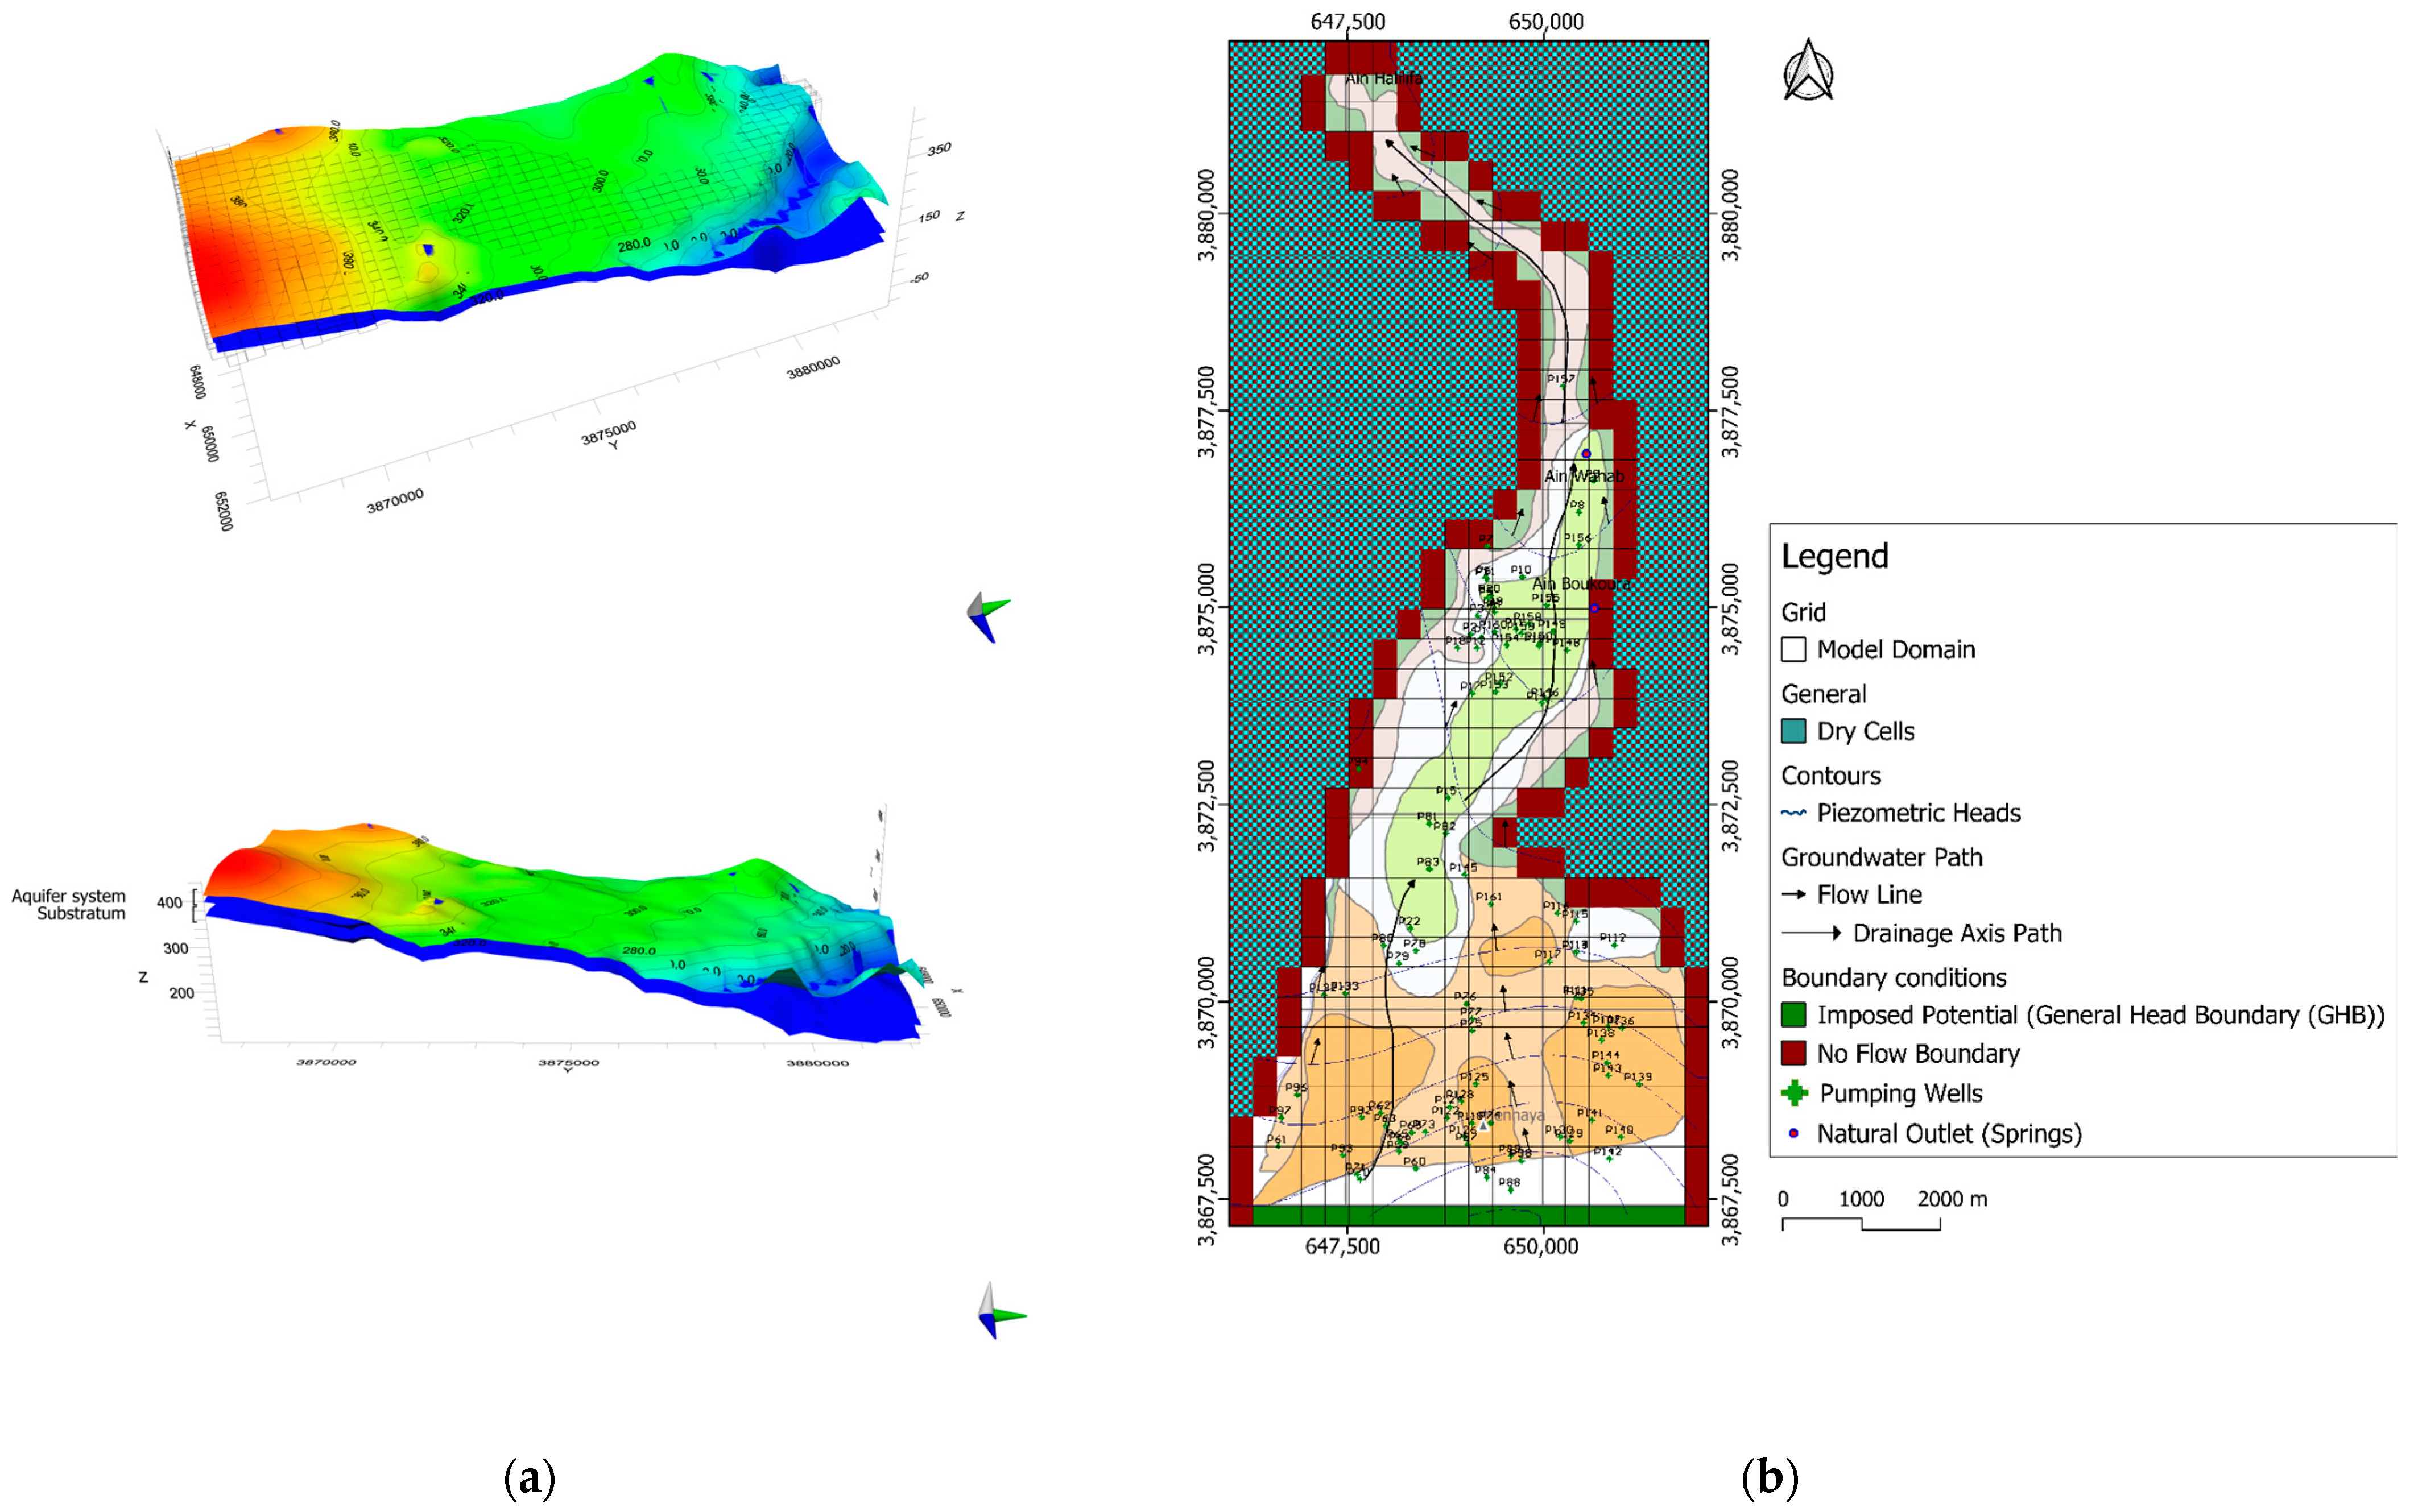
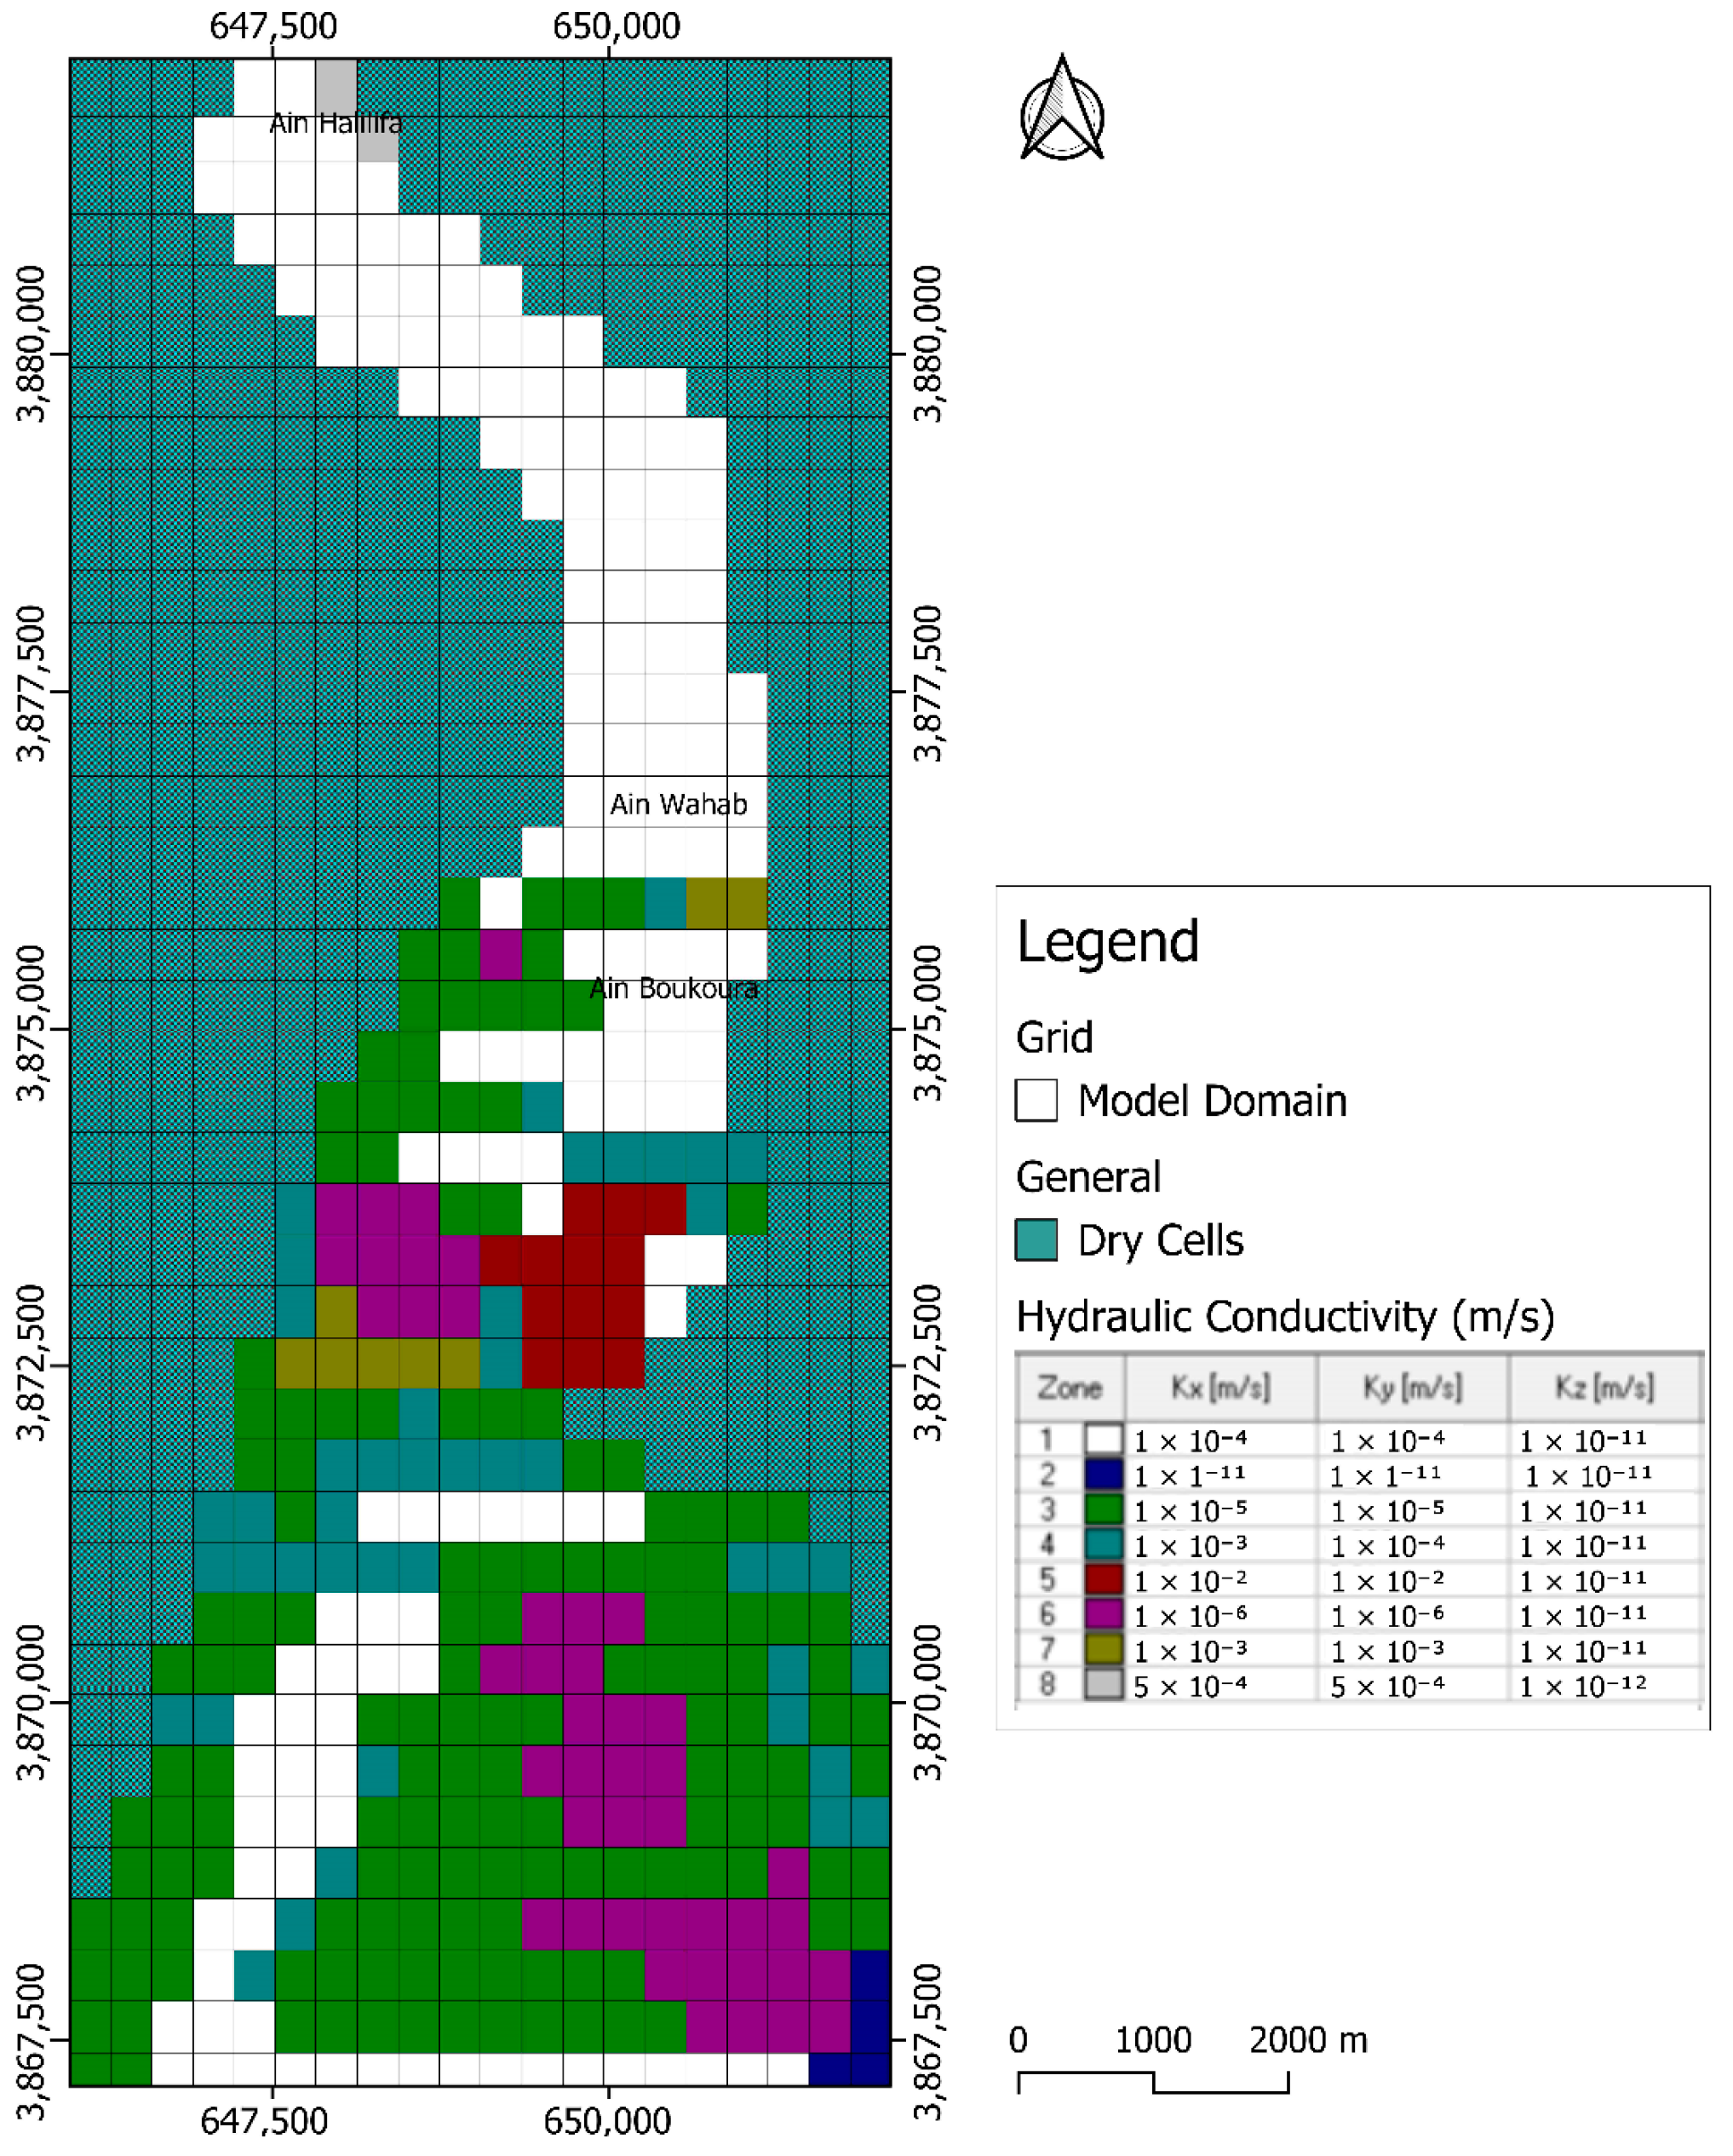
2.2. Groundwater Flow Model
- Effective Porosity ():
- 2.
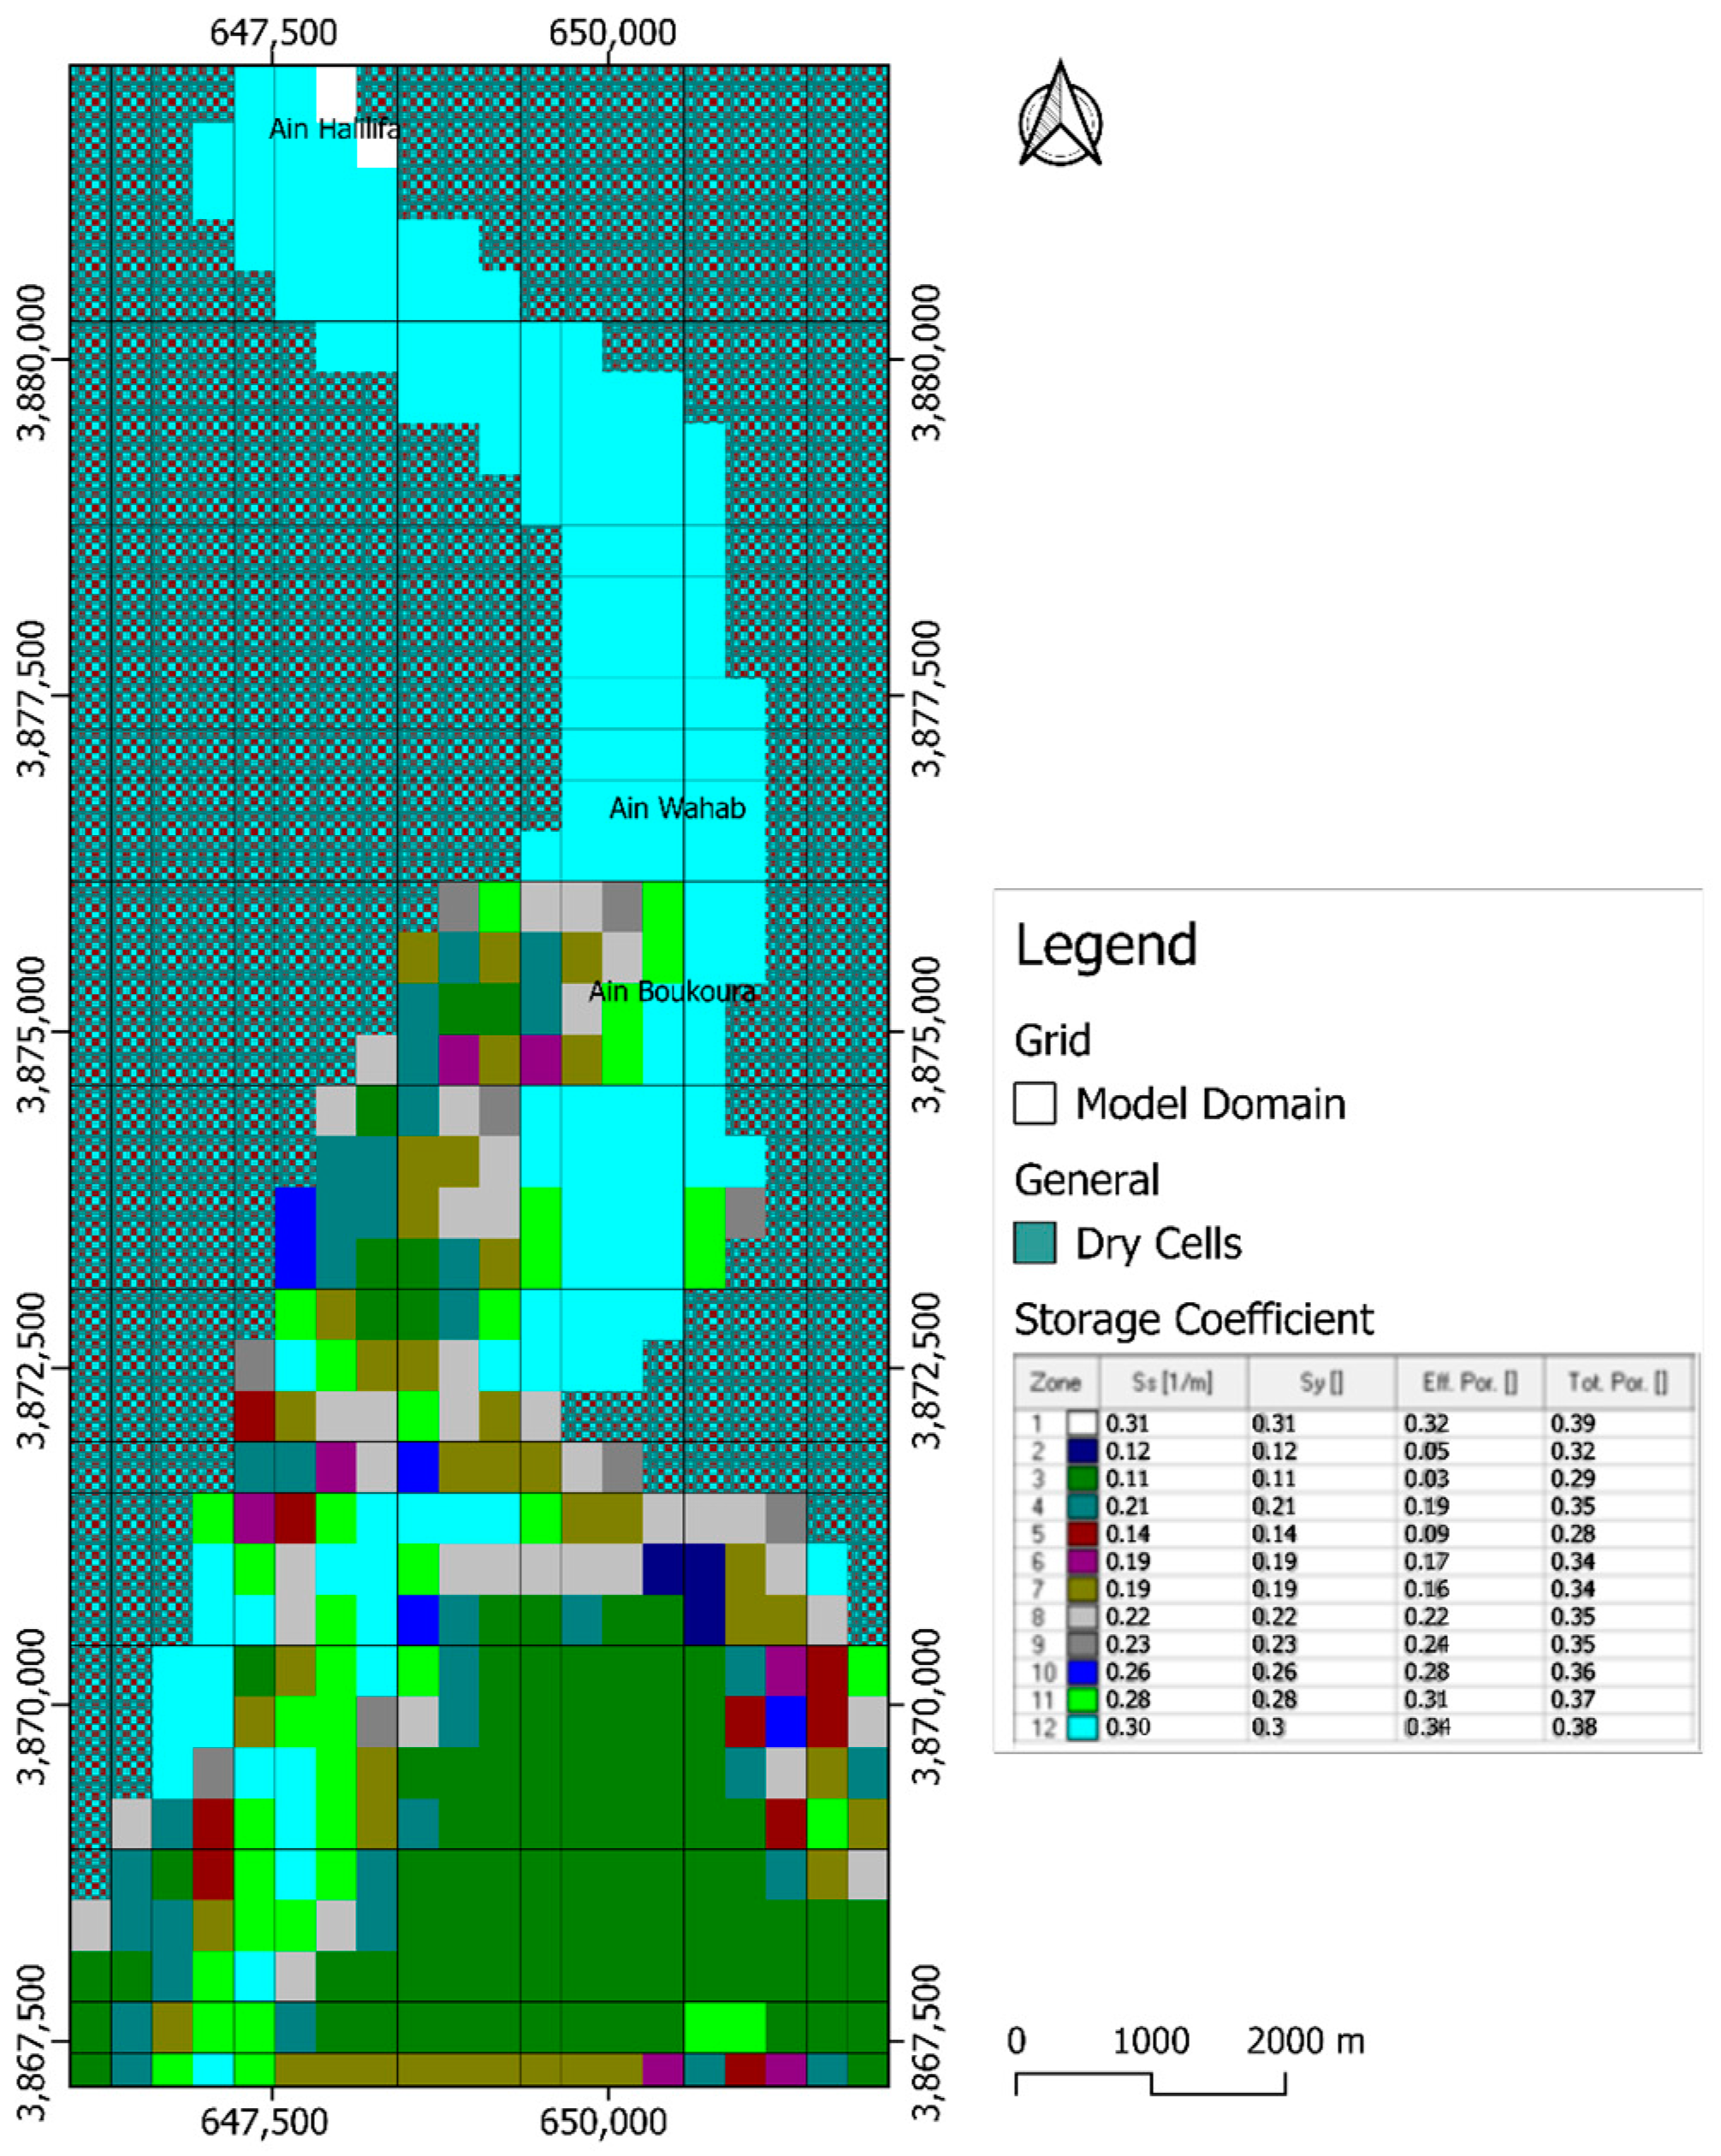
- Storage Coefficient ():
- 2.
- Specific Yield ():
2.3. Nitrate Transport Model
2.4. Long-Term Nitrate Pollution Simulation
3. Results and Discussion
3.1. Numerical Flow Dynamics and Model Insights
3.1.1. Steady-State
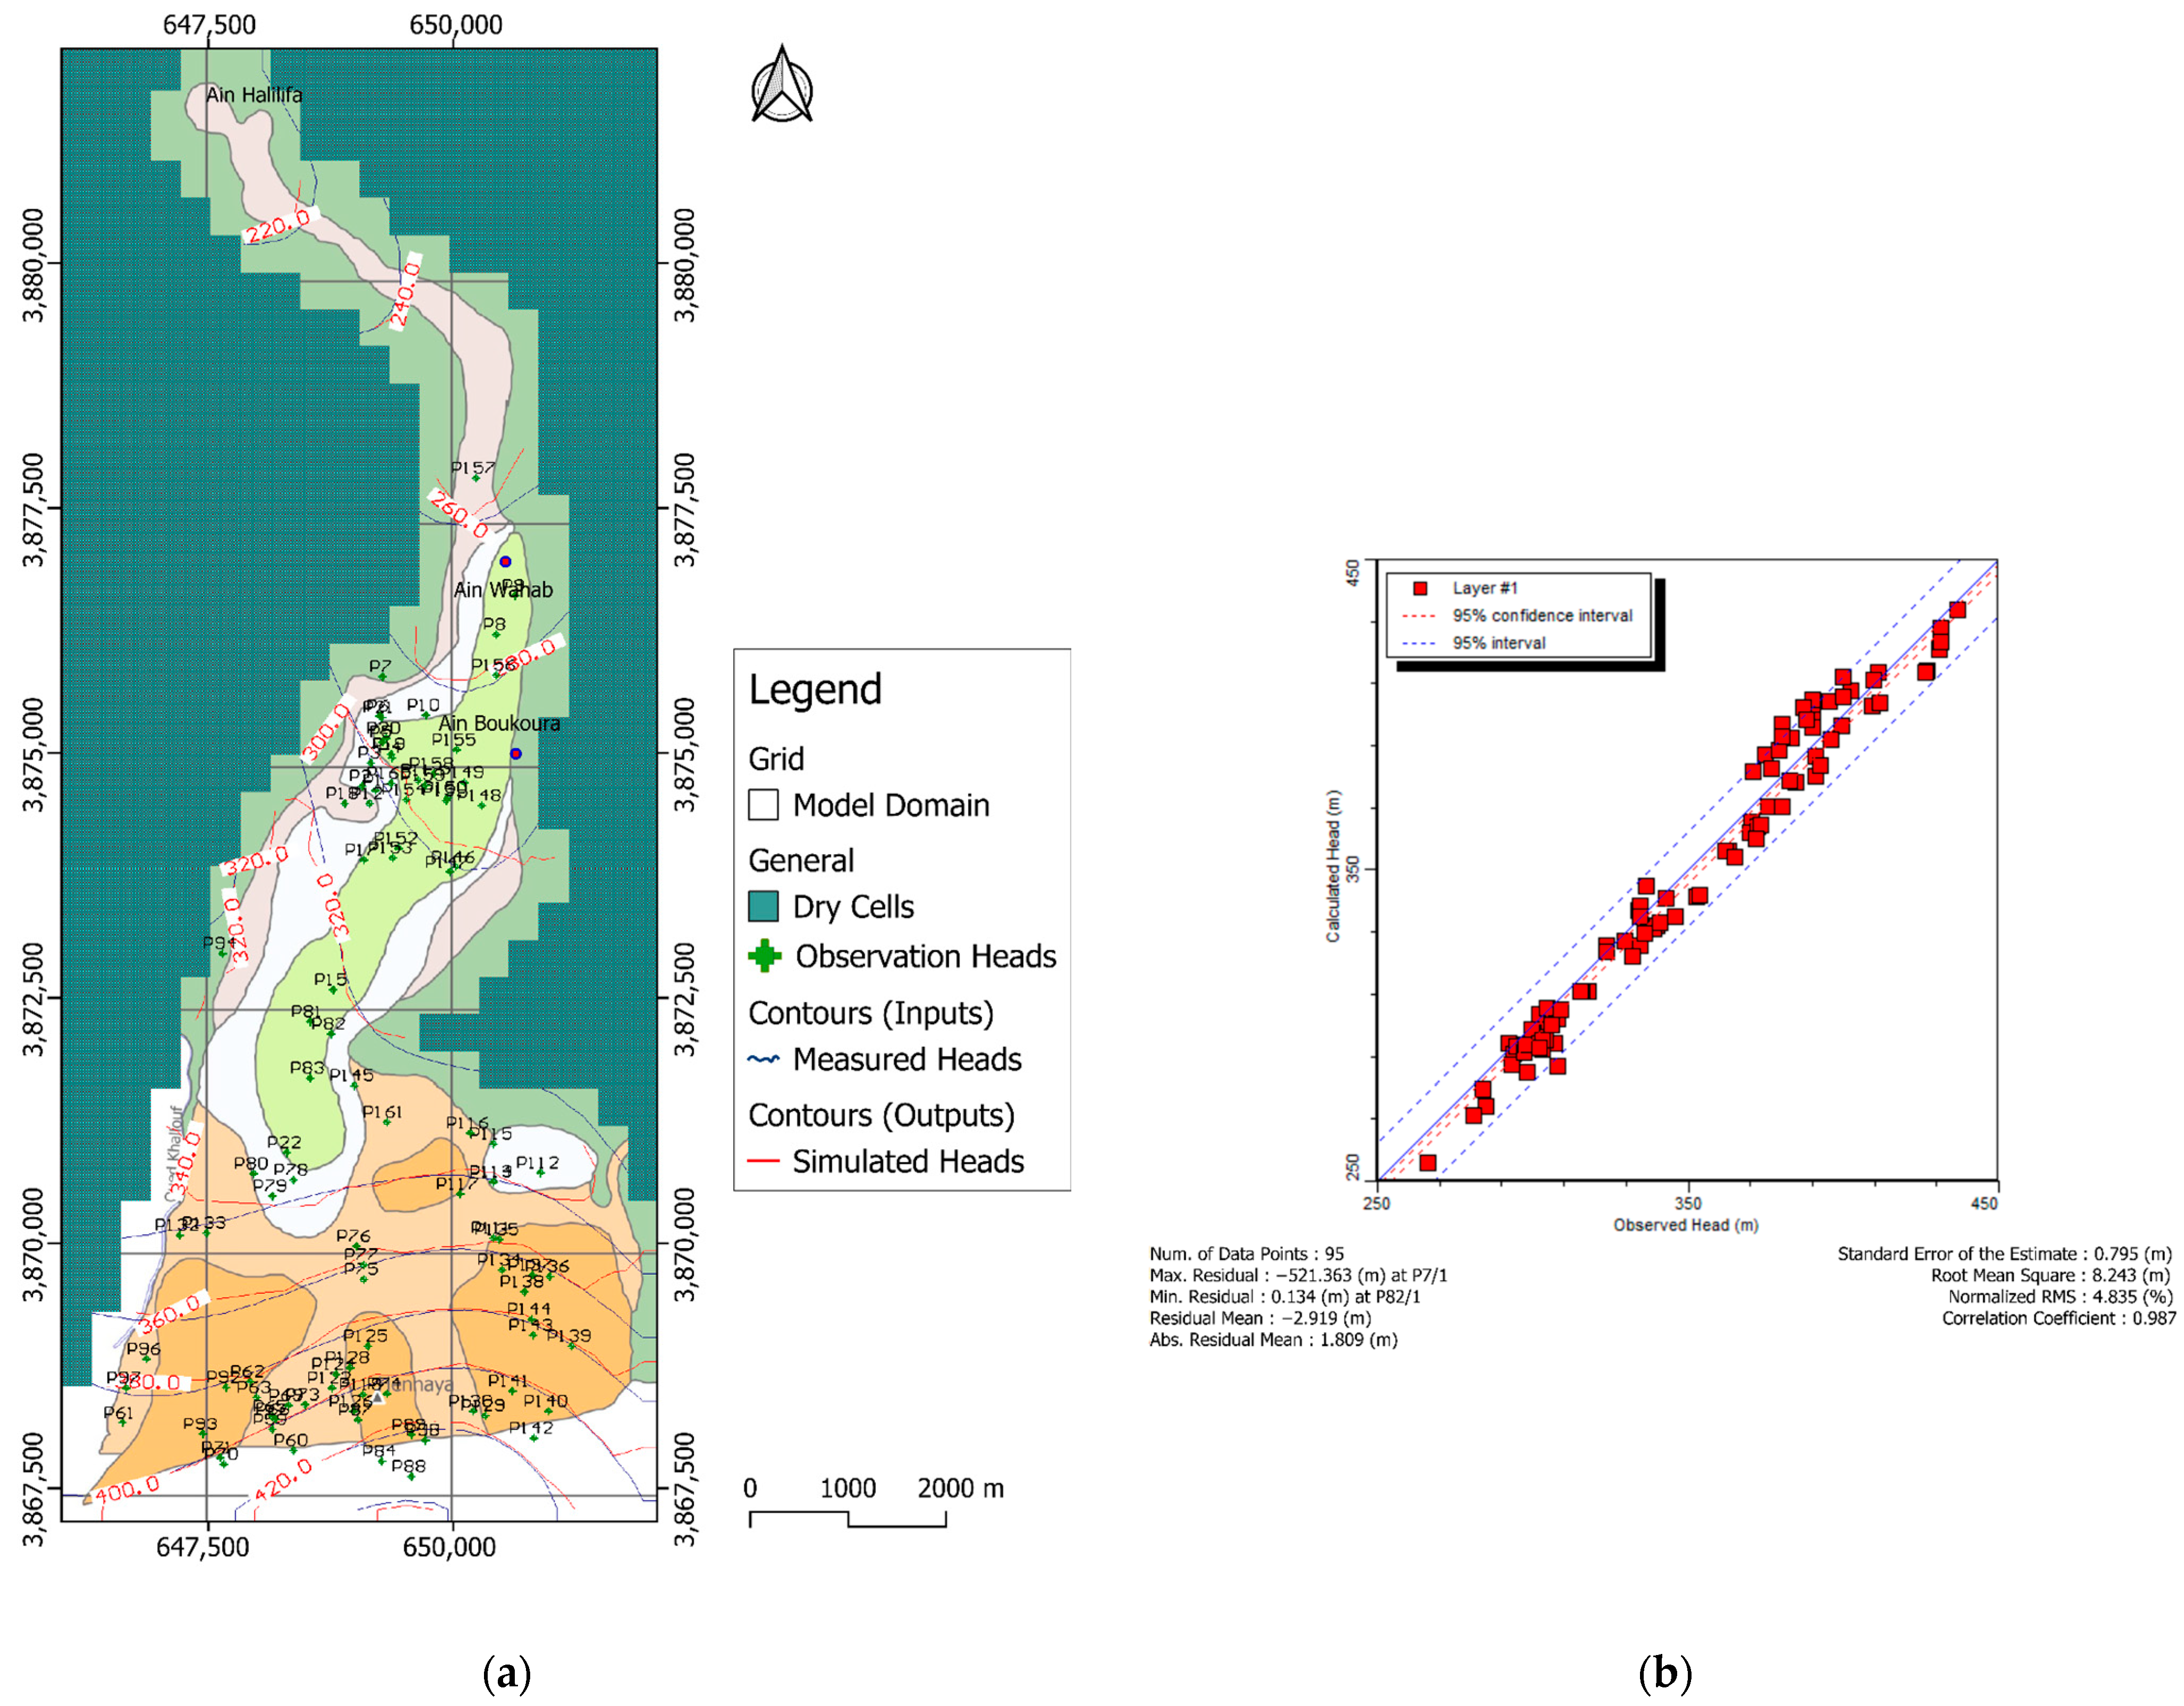
3.1.2. Transient State
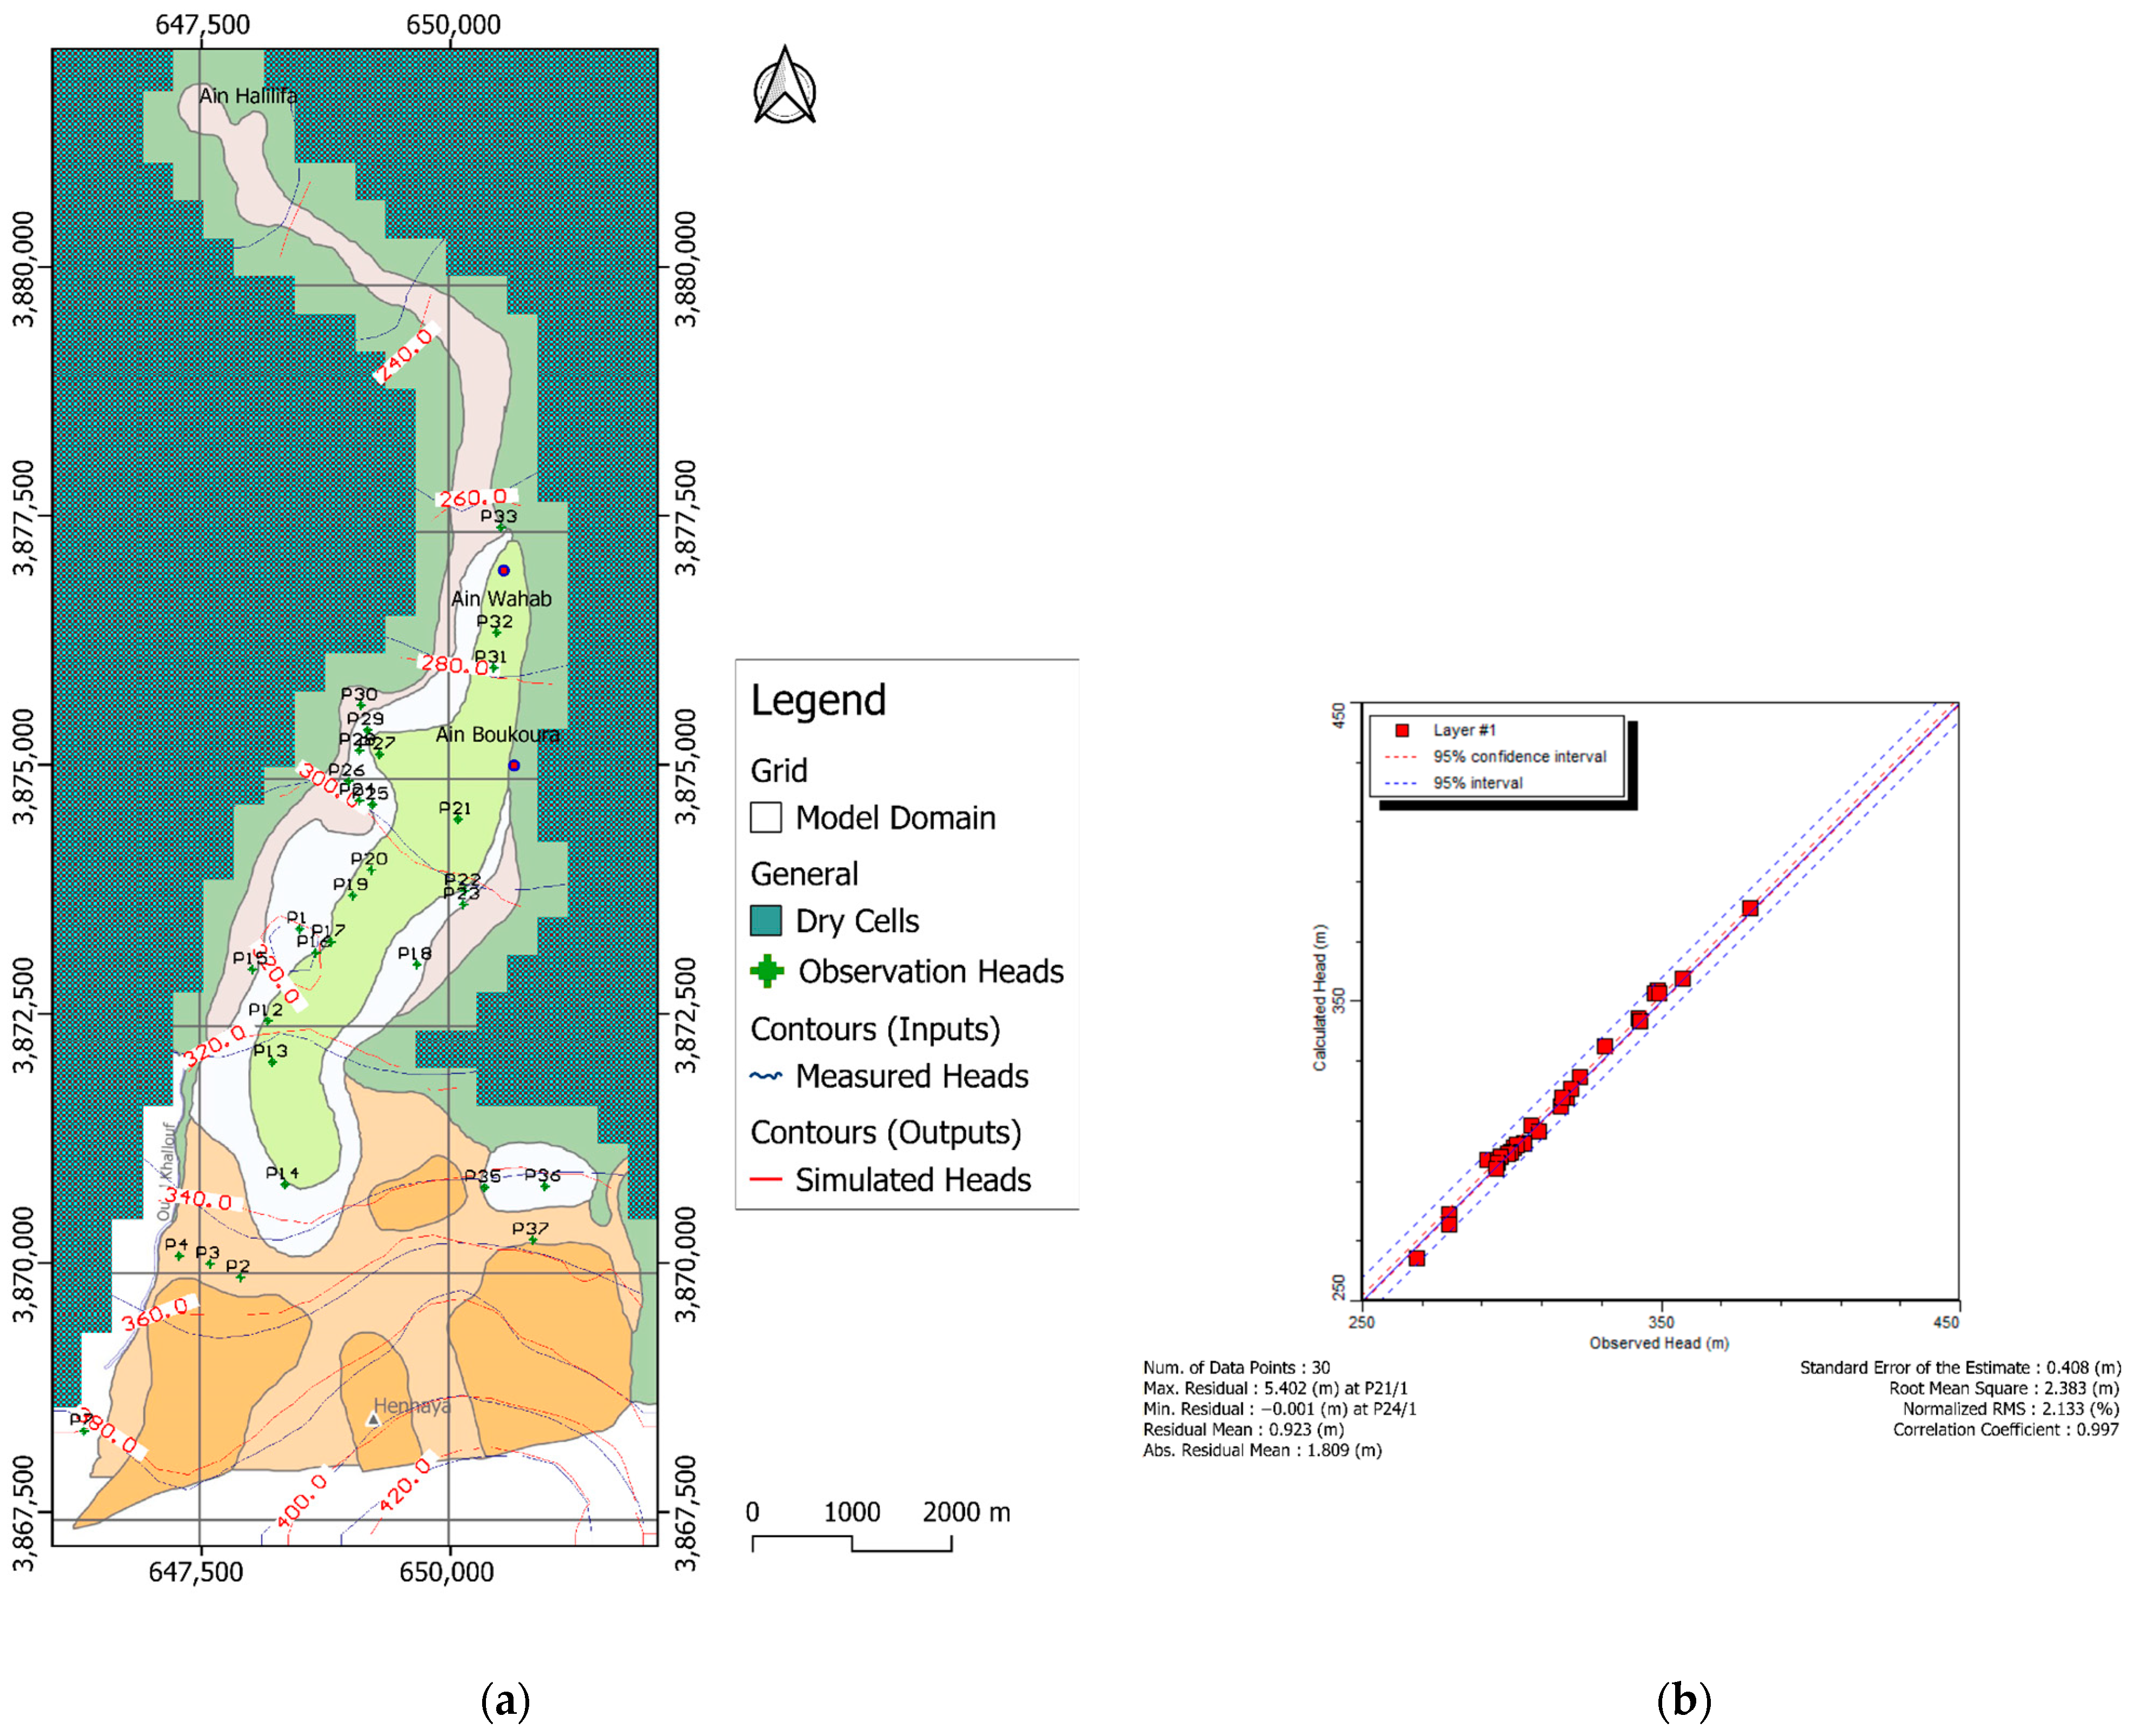
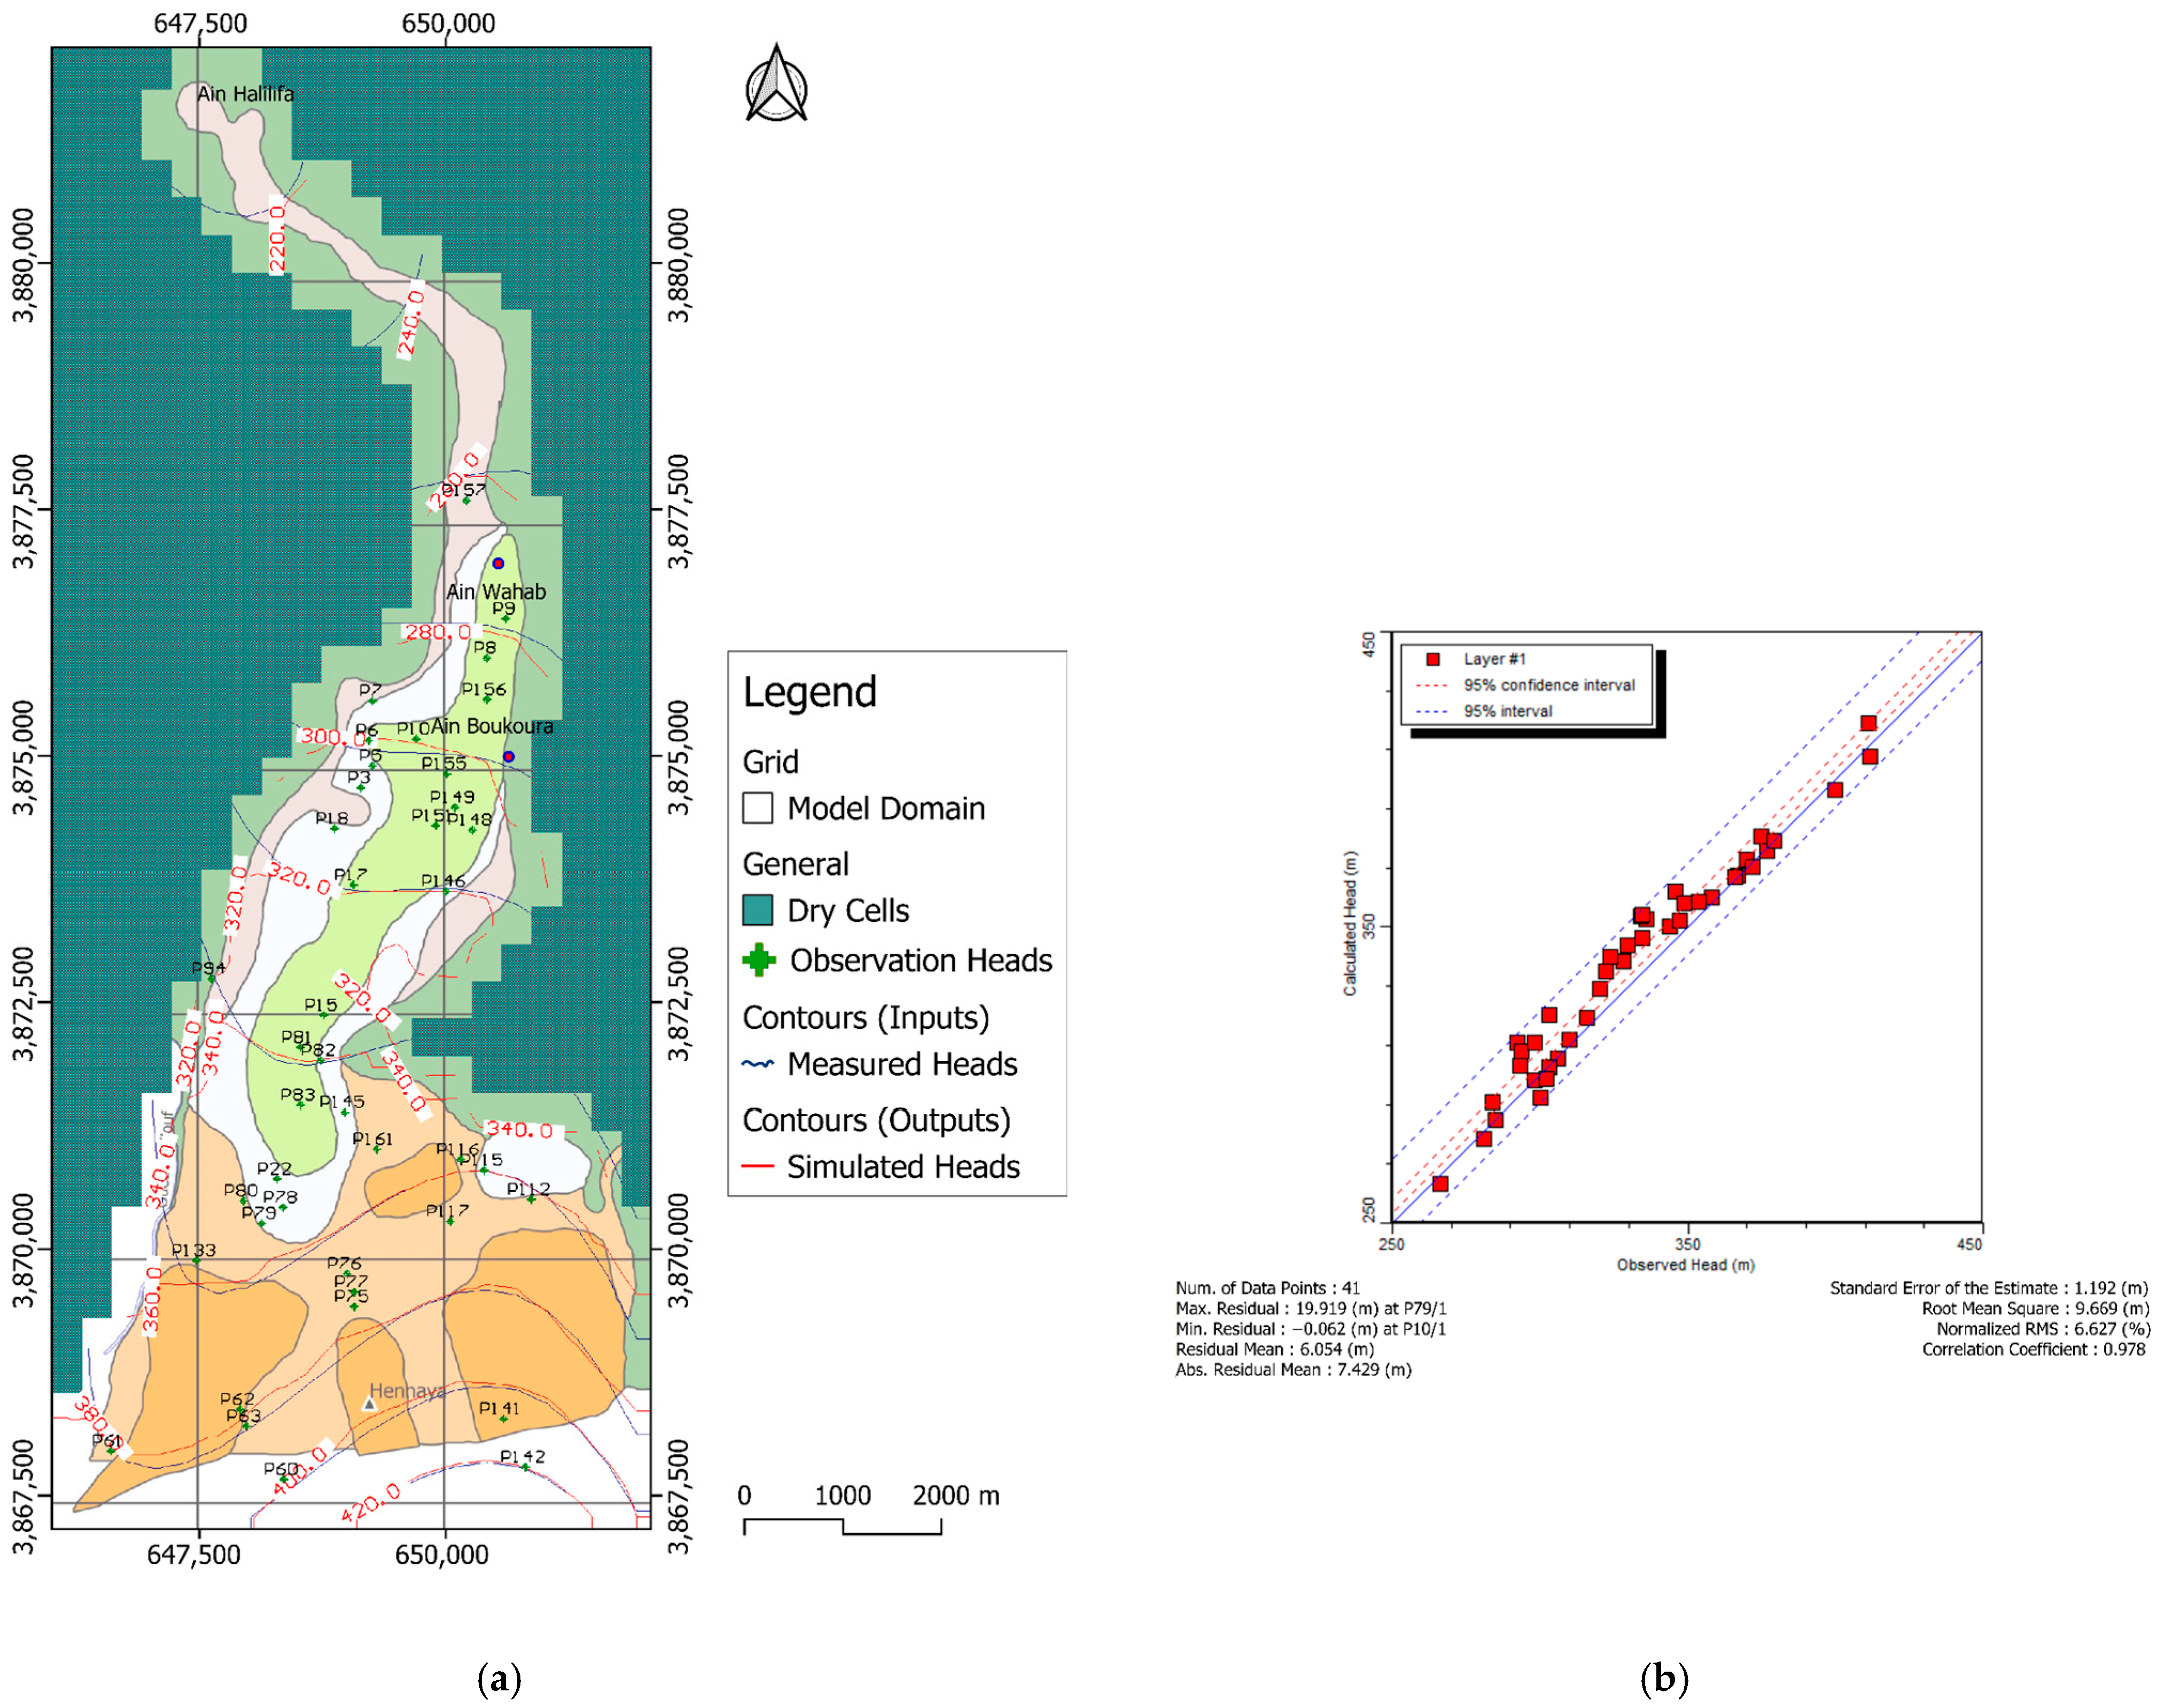
3.1.3. Model Validation
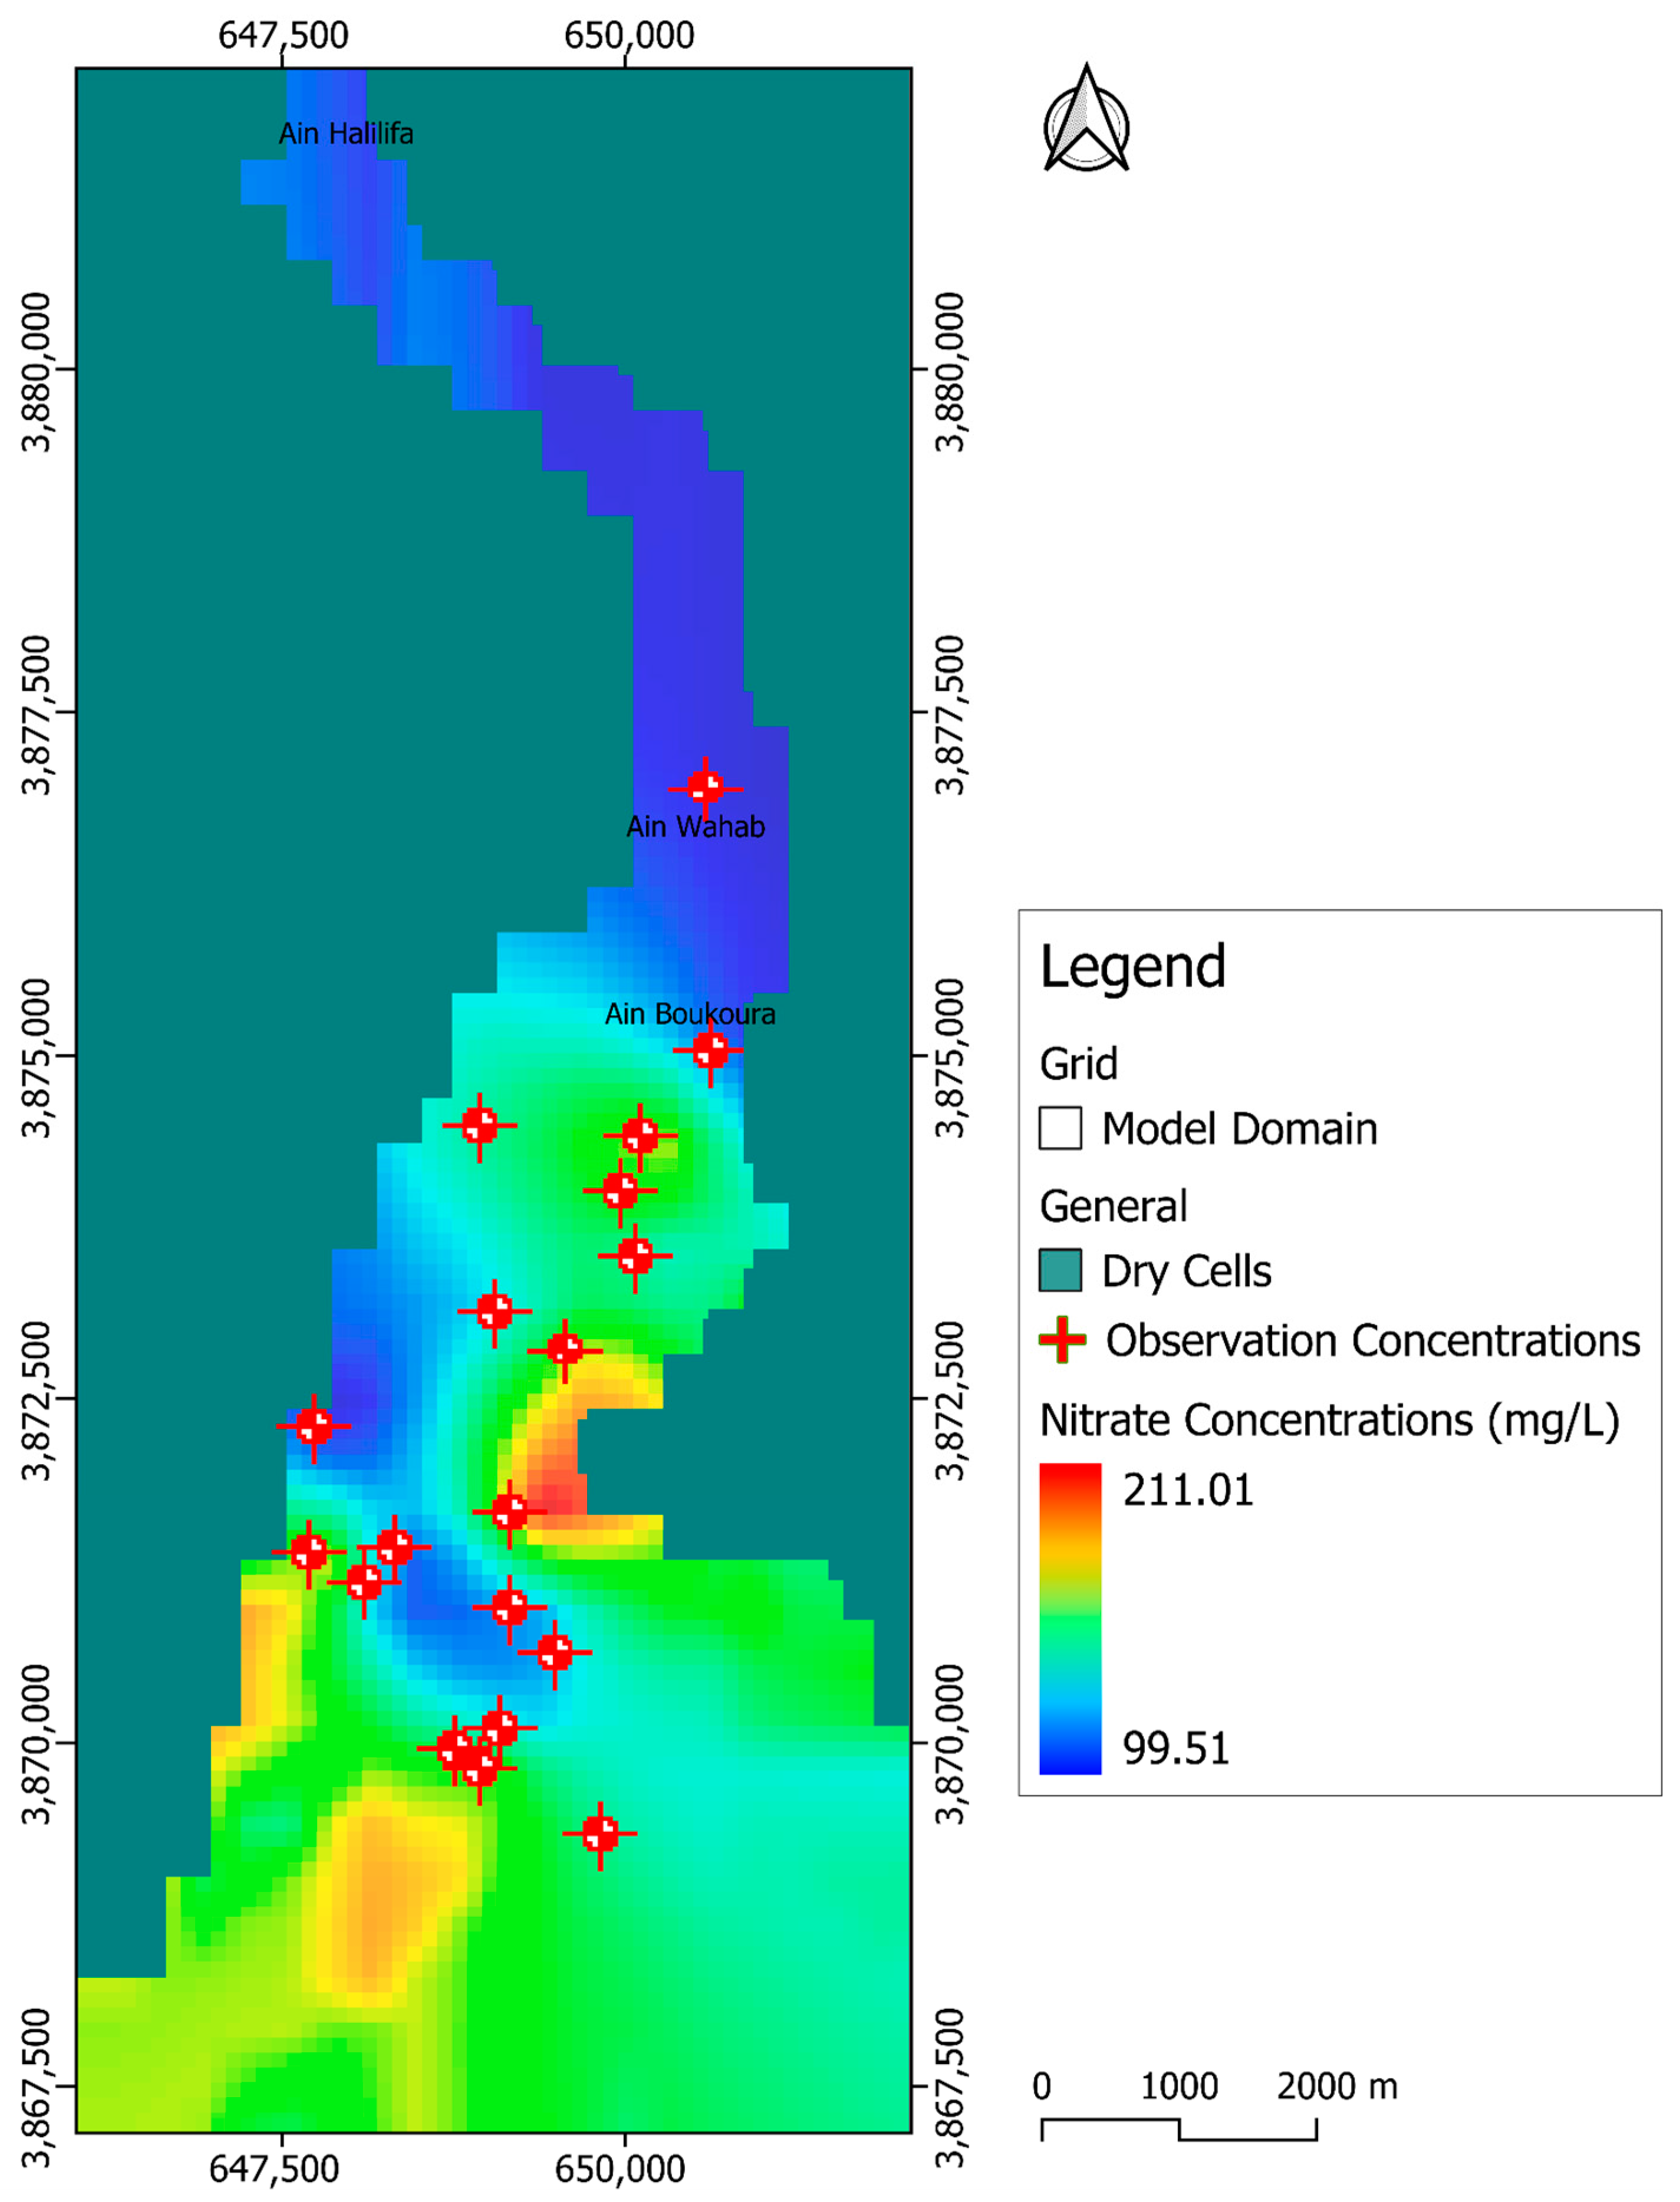
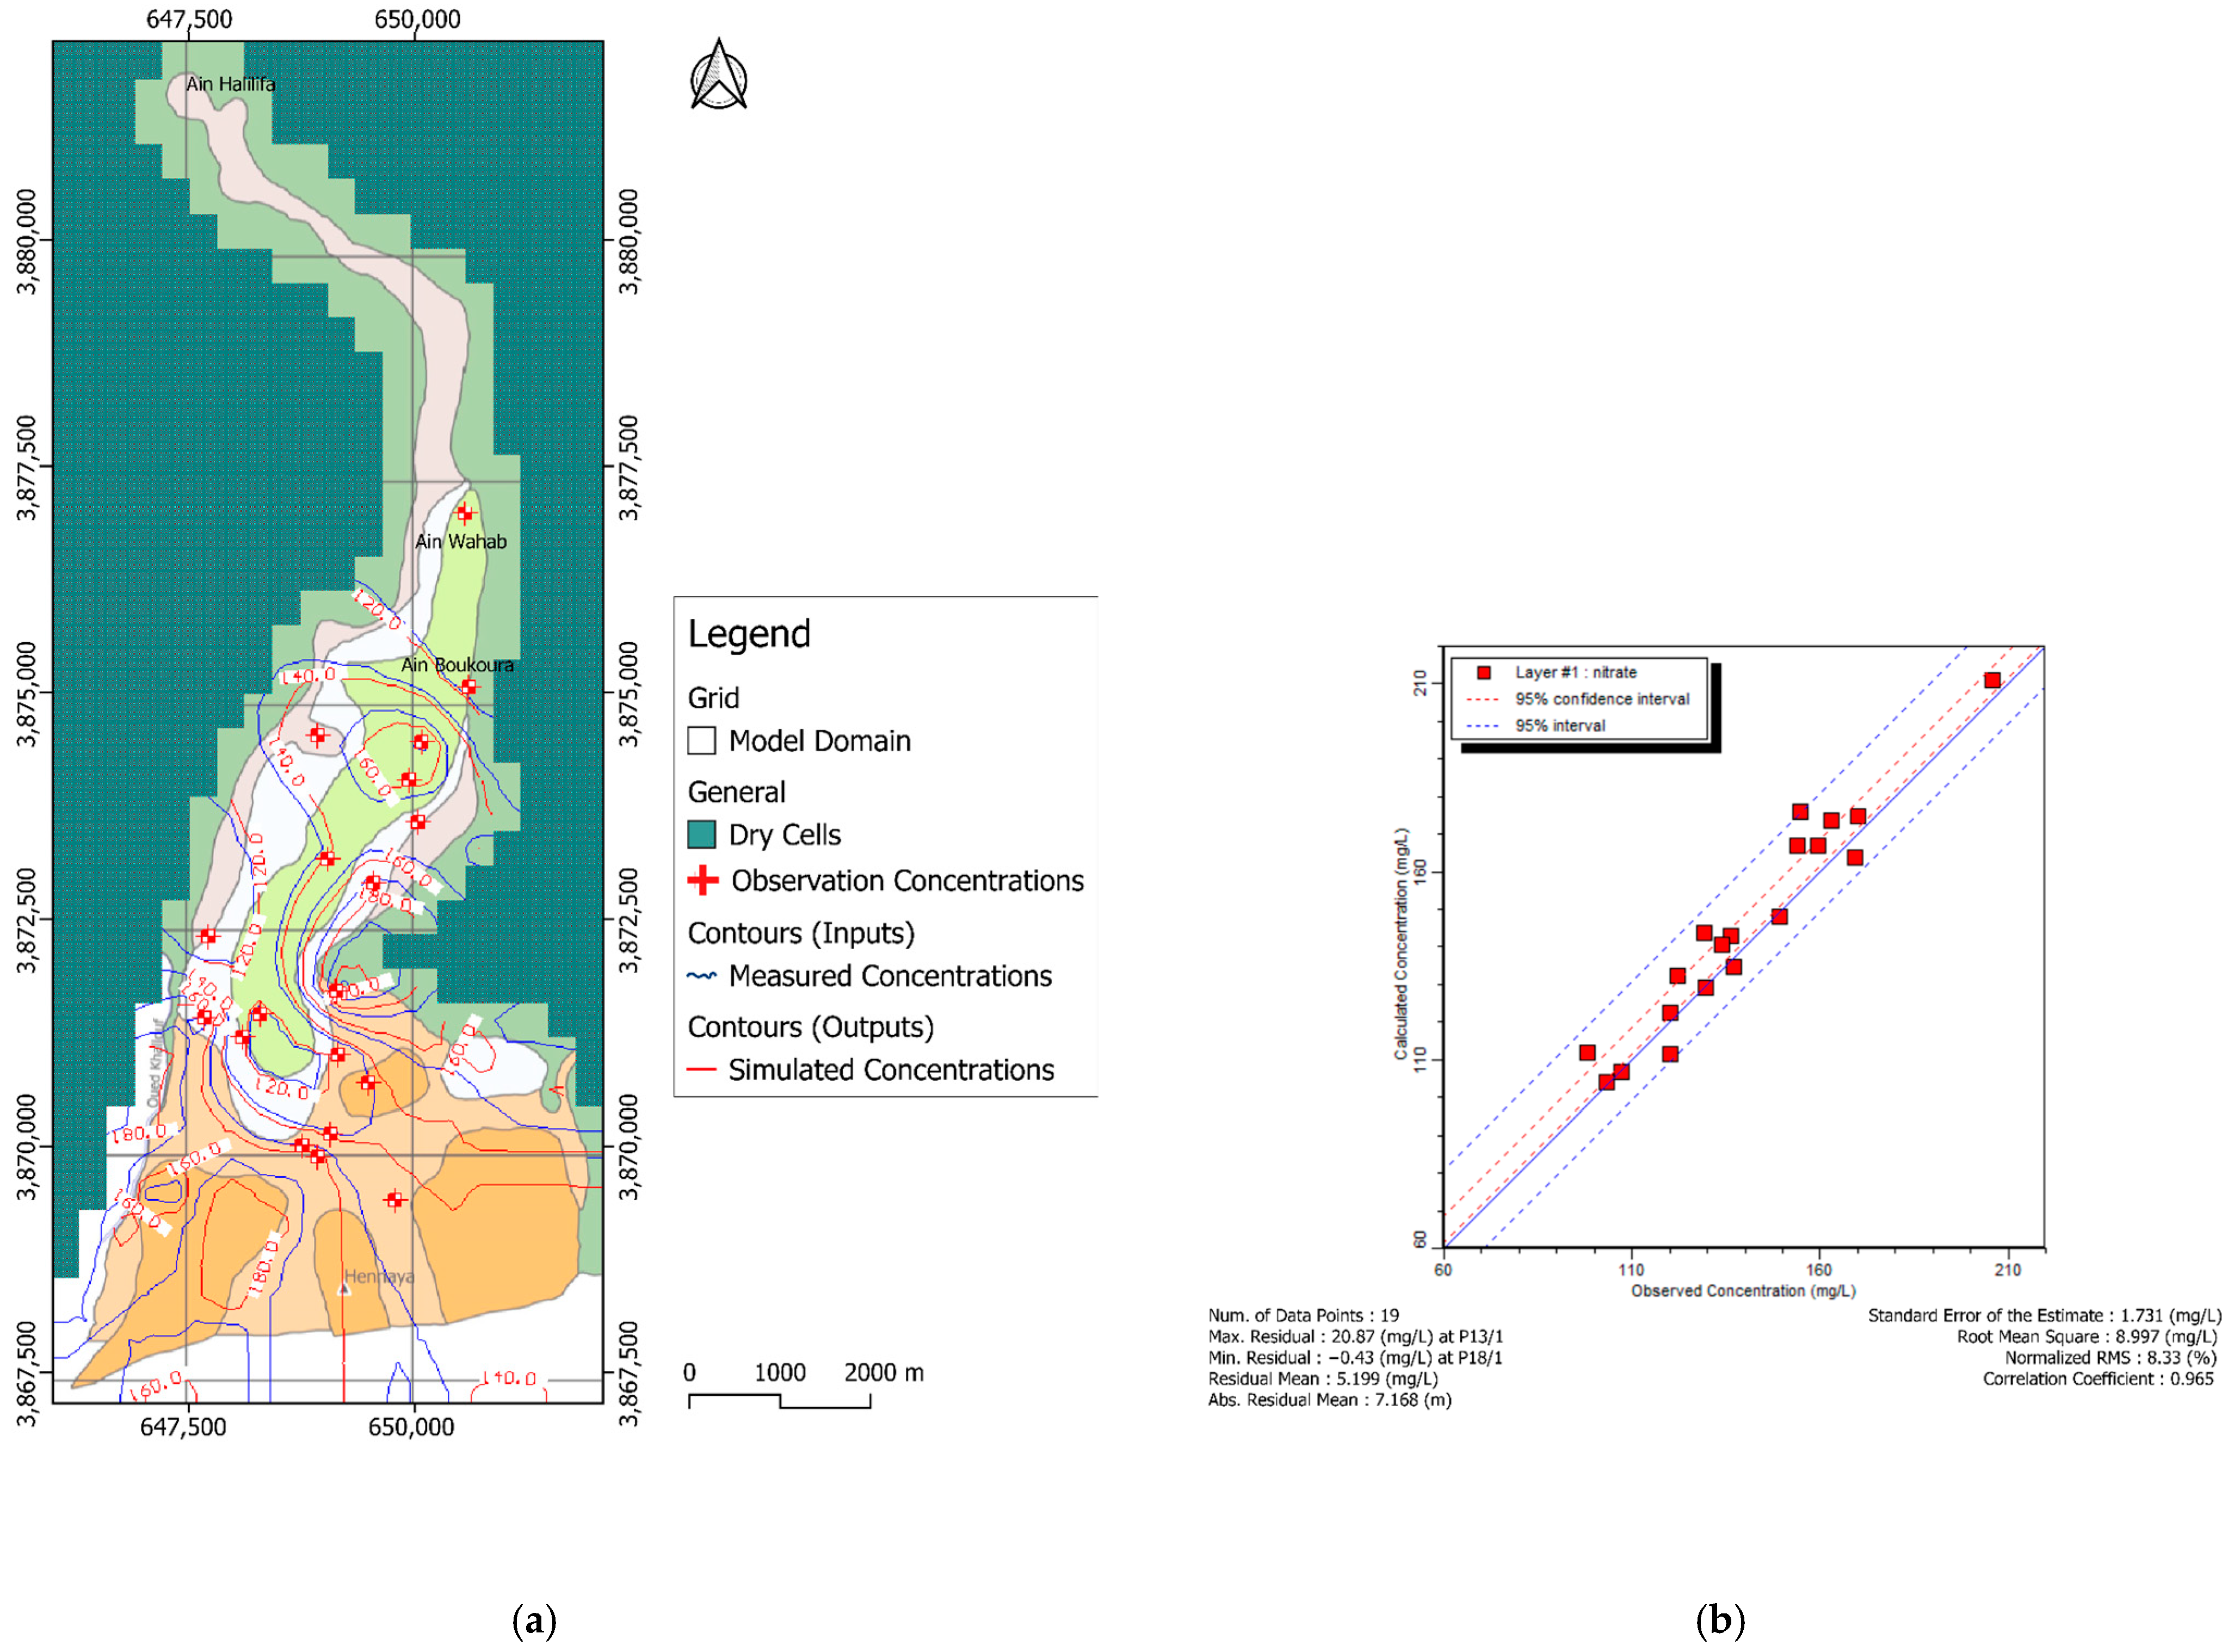
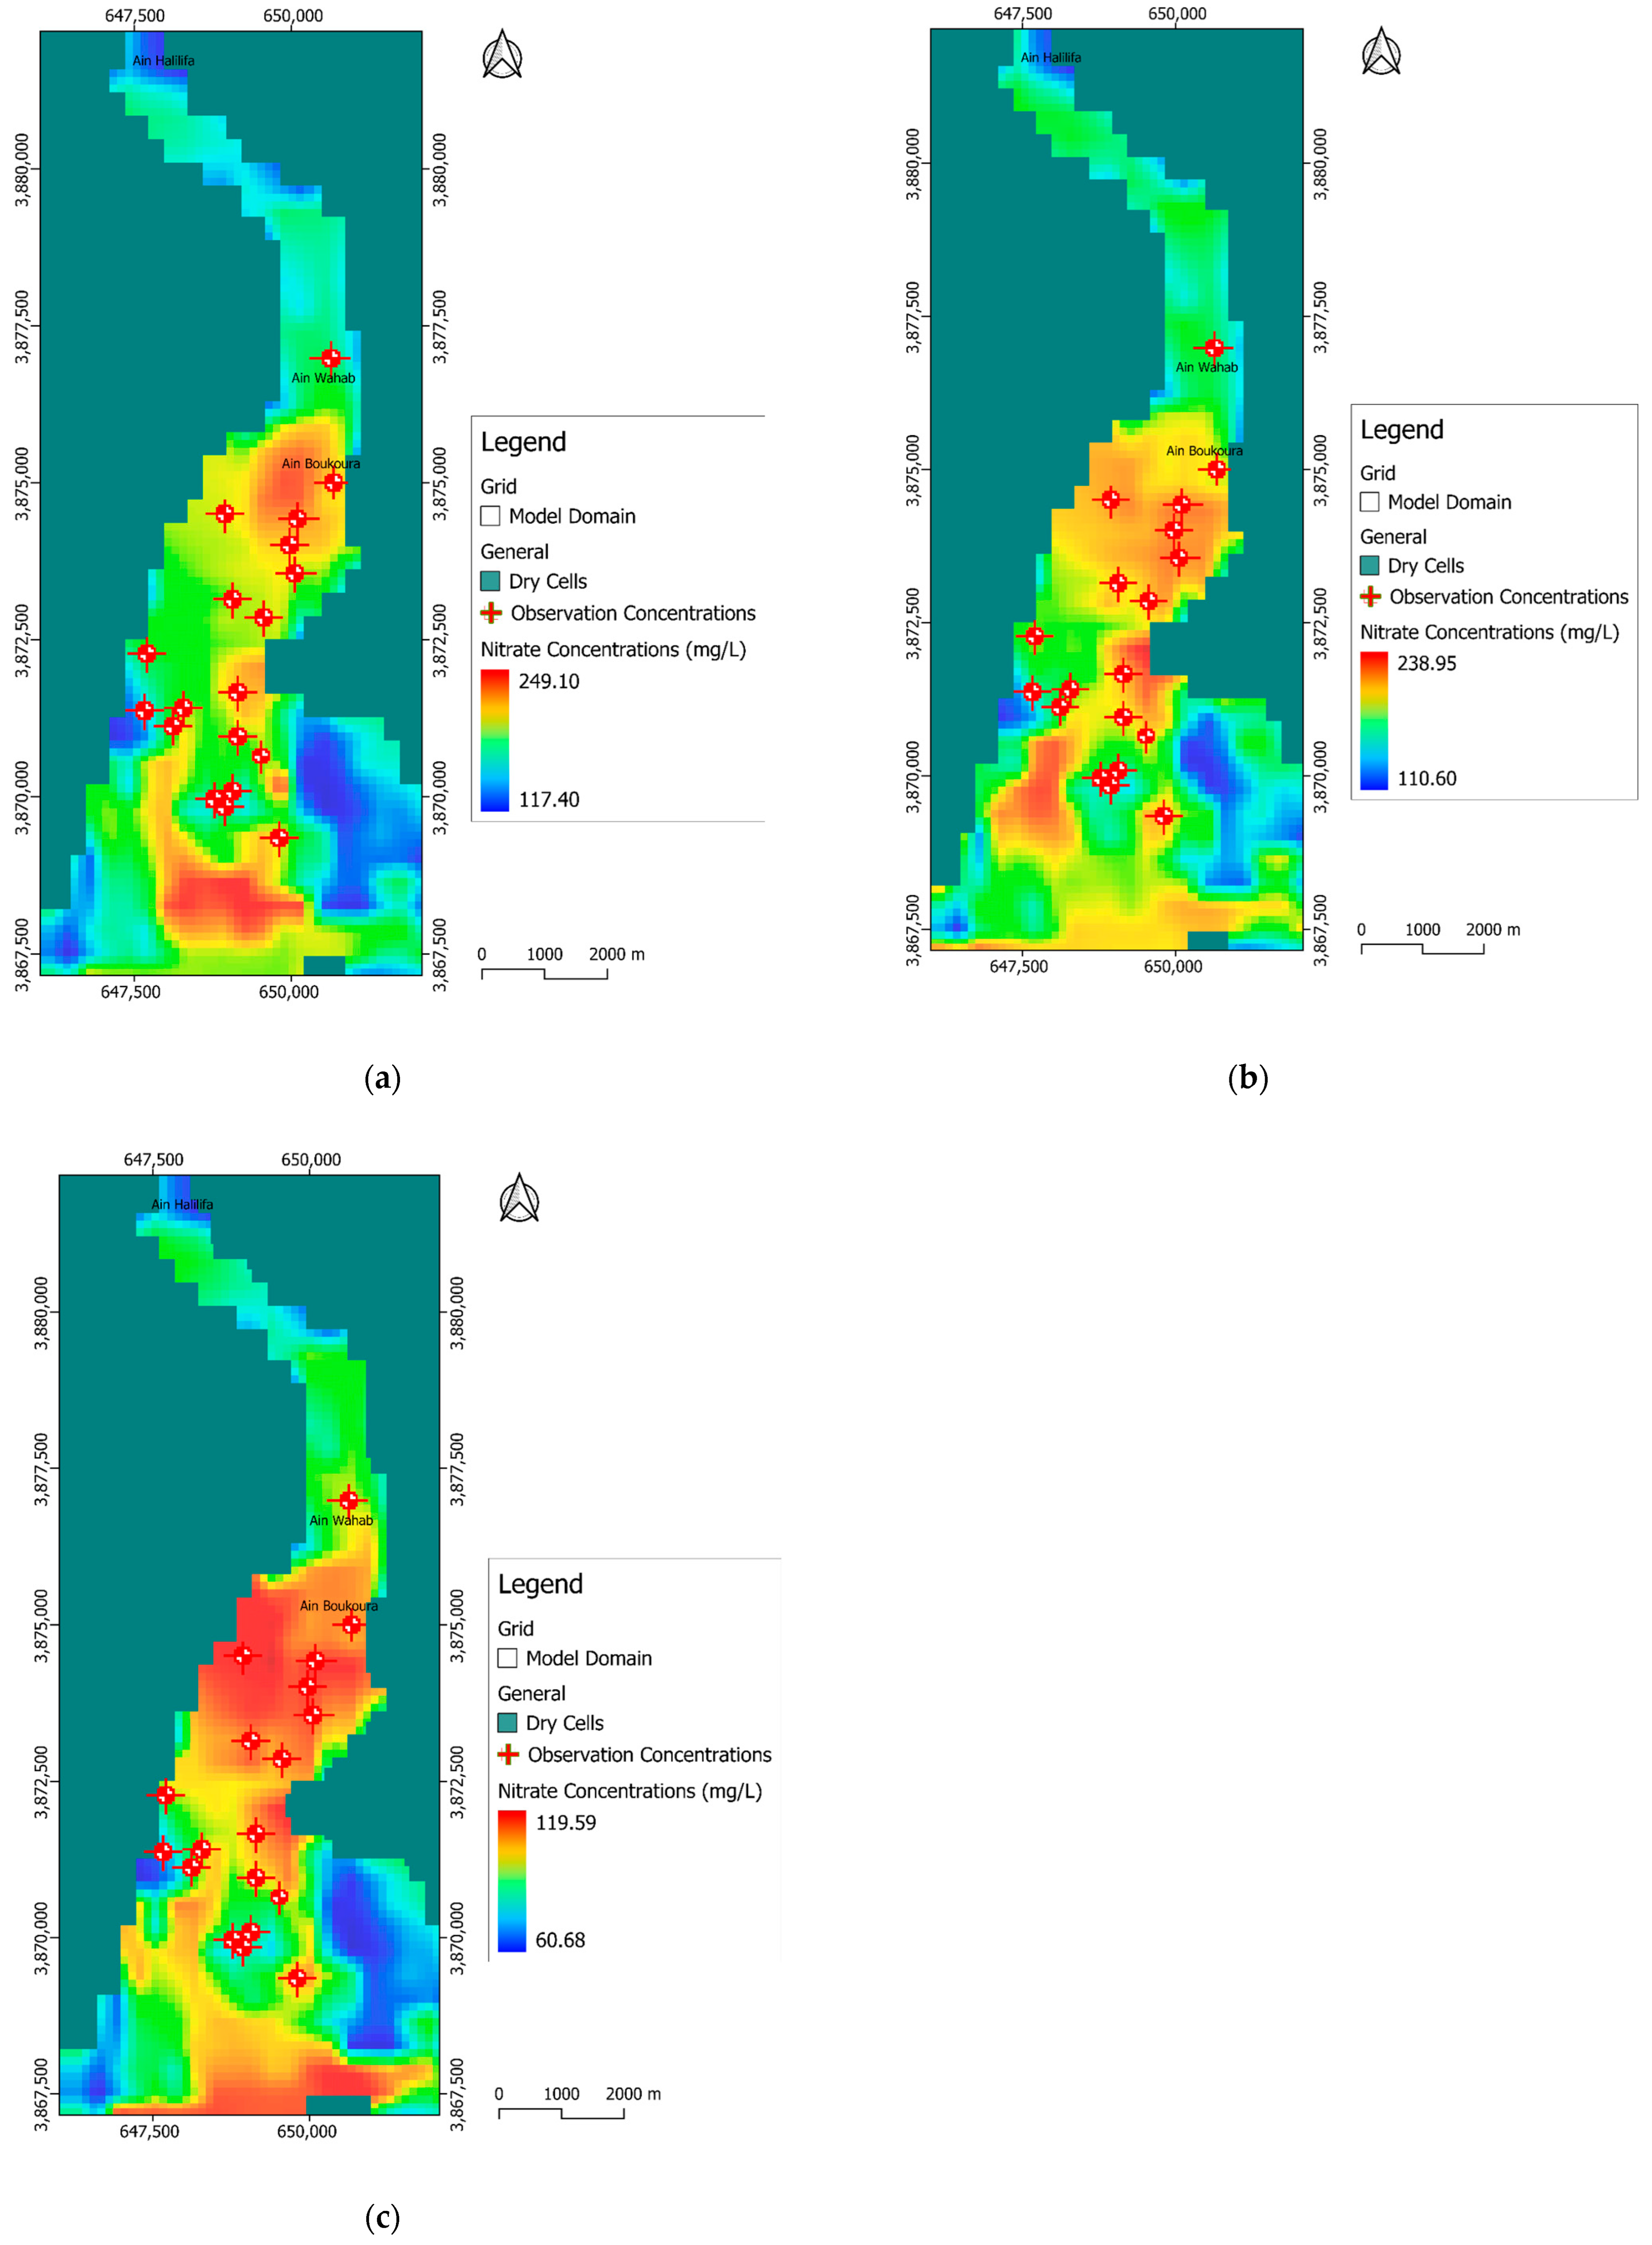
3.2. Nitrate Migration Mechanism Analysis
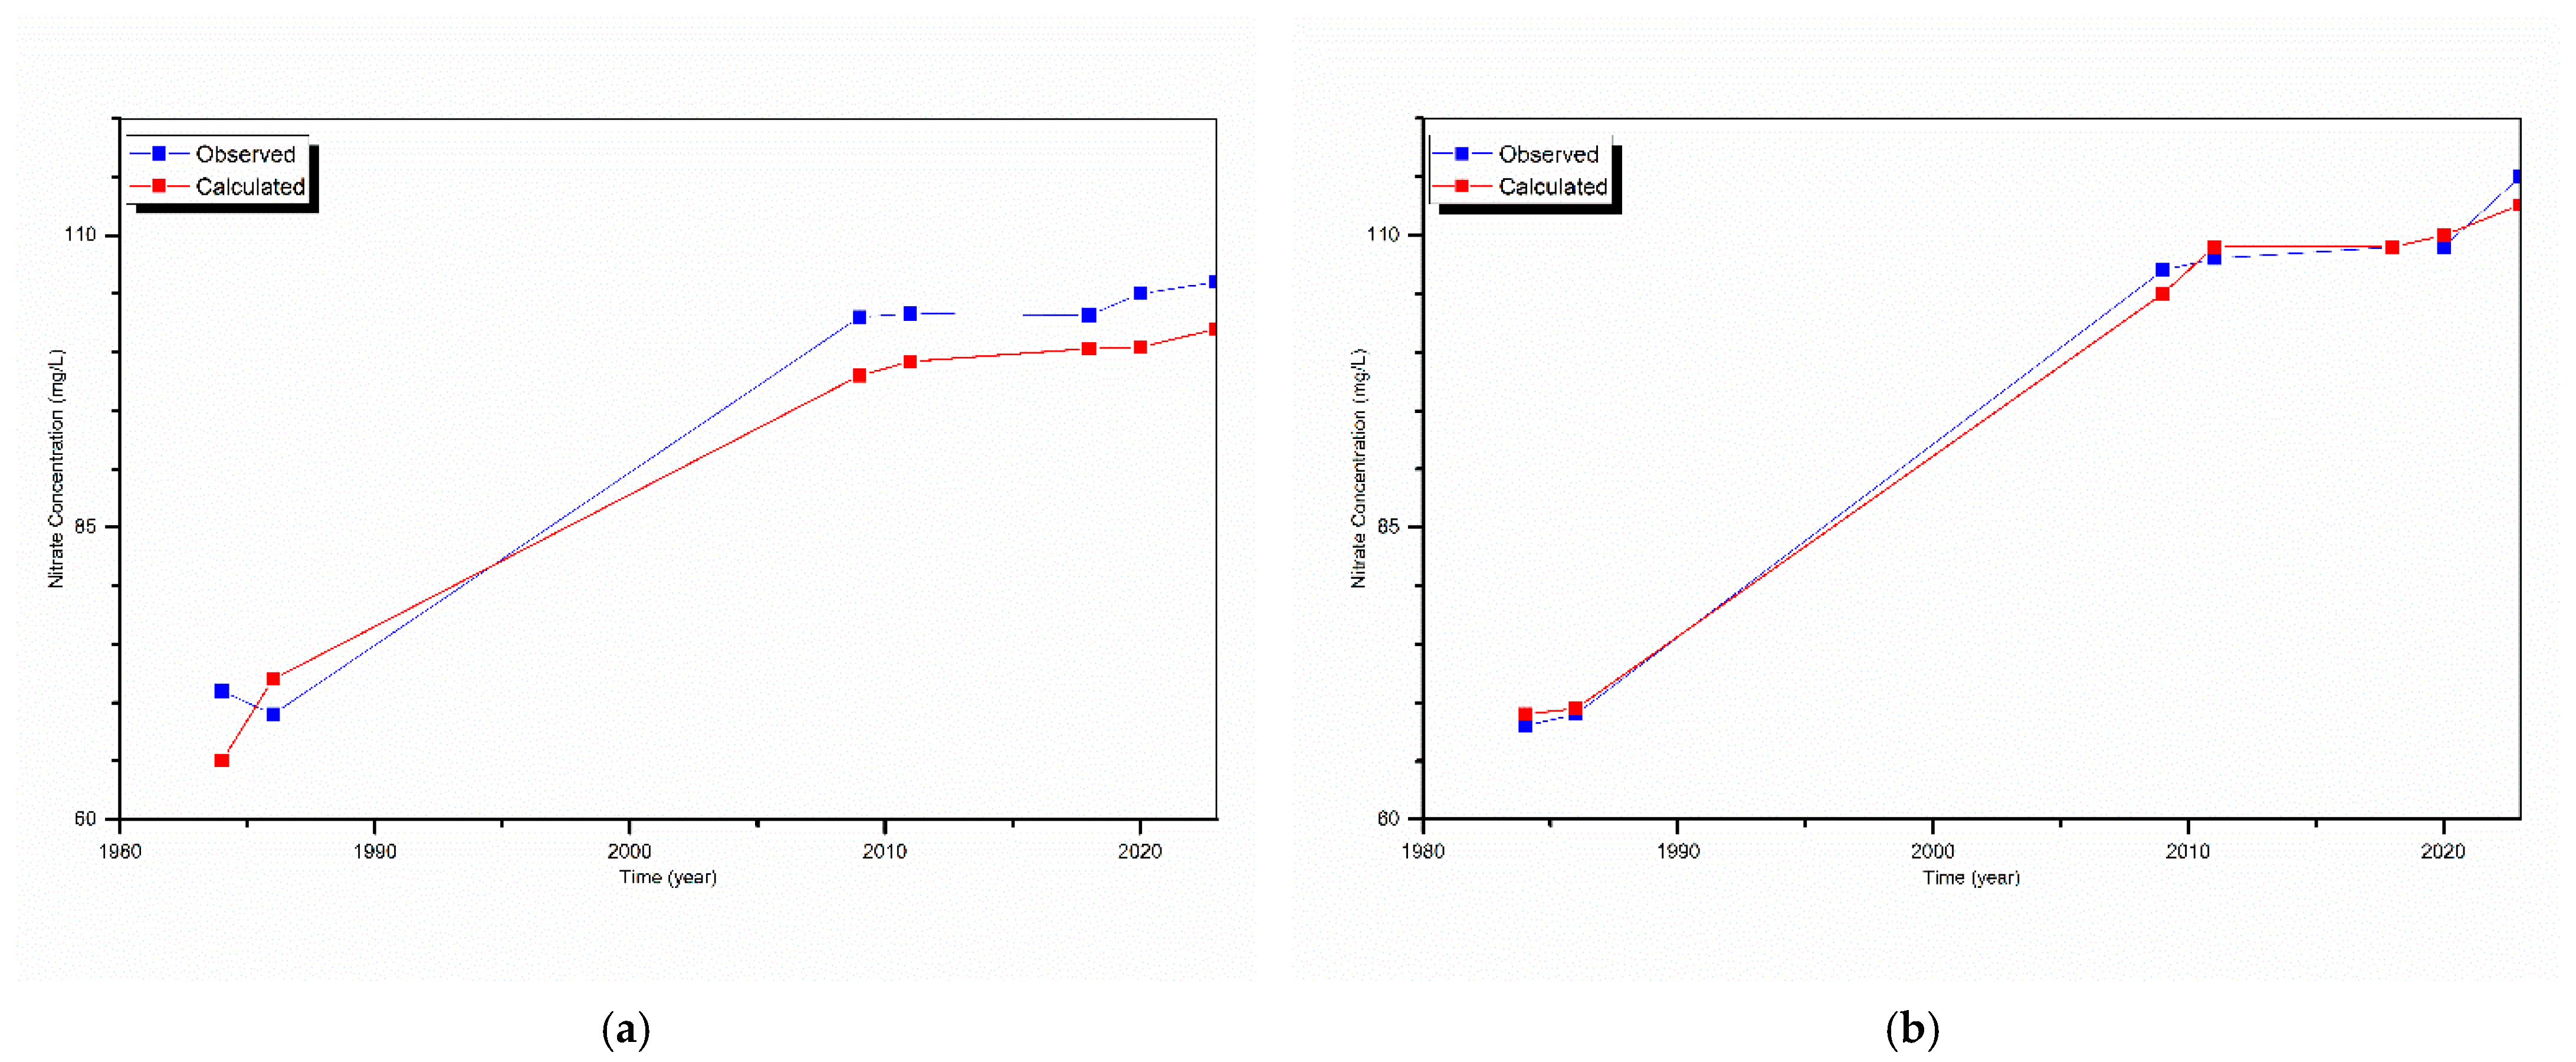
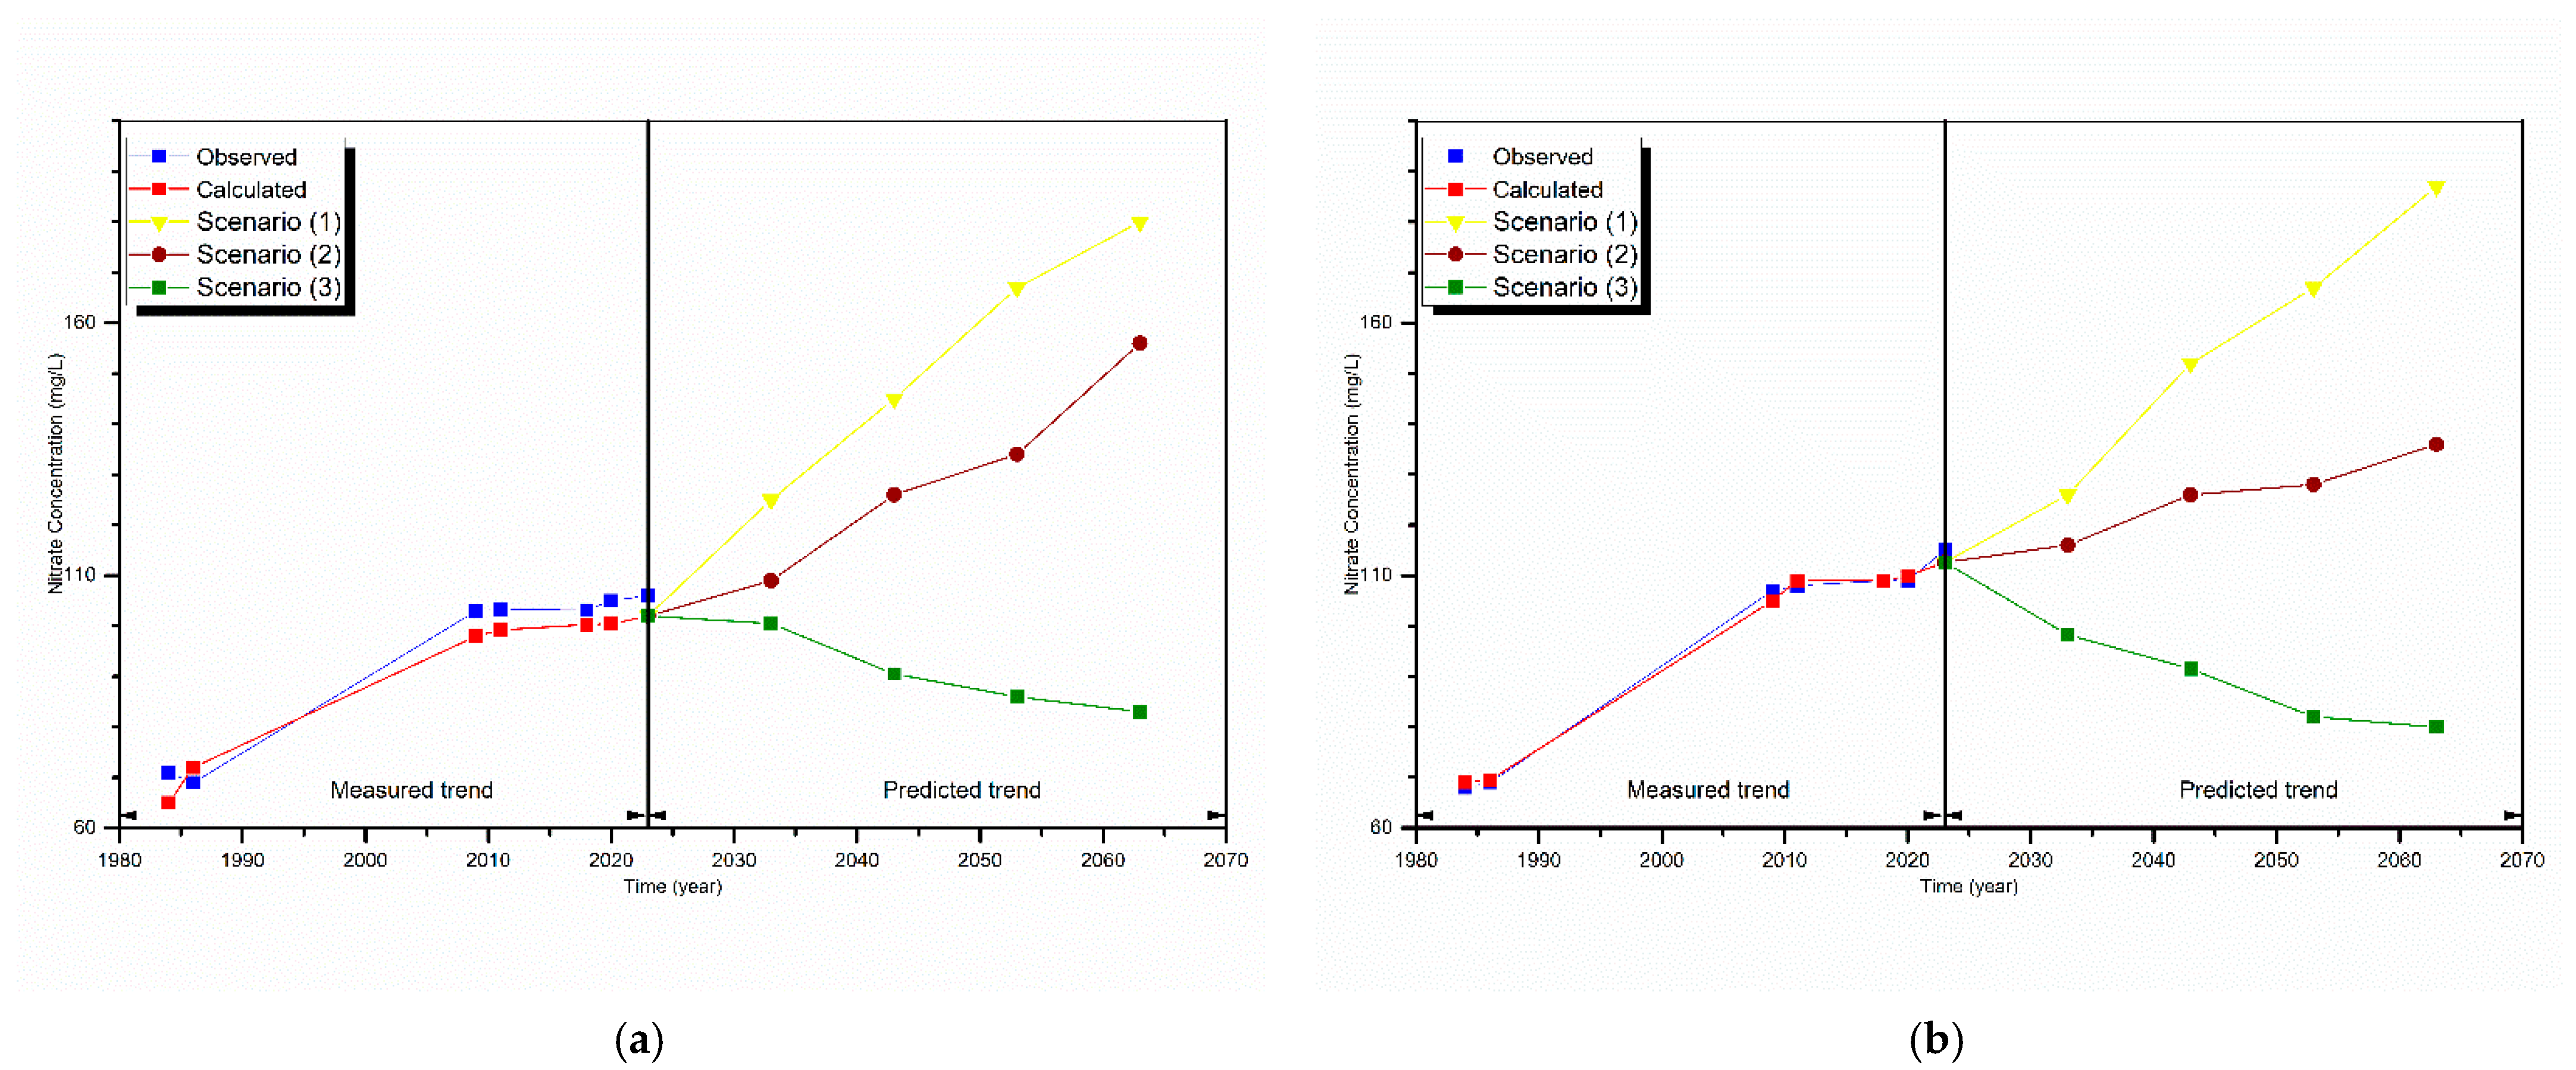
3.3. Future Nitrate Contamination Prediction
- Calibrating model parameters with greater precision;
- Identifying potential sources of uncertainty;
- Quantifying the model’s predictive reliability;
- Establishing confidence intervals for key hydrological parameters.
- Spatial heterogeneity of geological formations;
- Variability in hydraulic conductivity;
- Simplifications in boundary condition representations;
- Potential measurement errors in field data collection.
4. Conclusions
- Developing more sophisticated predictive models integrating high-resolution data and artificial intelligence algorithms to refine the understanding of pollution dynamics;
- Studying potential remediation technologies, such as phytoremediation and nitrate treatment methods, to accelerate the restoration of groundwater quality in the Hennaya plain;
Author Contributions
Funding
Institutional Review Board Statement
Informed Consent Statement
Data Availability Statement
Acknowledgments
Conflicts of Interest
References
- Fienen, M.N.; Arshad, M. The international scale of the groundwater issue. In Integrated Groundwater Management: Concepts, Approaches and Challenges; Springer: Cham, Switzerland, 2016; pp. 21–48. [Google Scholar] [CrossRef]
- Velis, M.; Conti, K.I.; Biermann, F. Groundwater and human development: Synergies and trade-offs within the context of the sustainable development goals. Sustain. Sci. 2017, 12, 1007–1017. [Google Scholar] [CrossRef] [PubMed]
- Carrard, N.; Foster, T.; Willetts, J. Groundwater as a source of drinking water in southeast Asia and the Pacific: A multi-country review of current reliance and resource concerns. Water 2019, 11, 1605. [Google Scholar] [CrossRef]
- Siebert, S.; Burke, J.; Faures, J.-M.; Frenken, K.; Hoogeveen, J.; Döll, P.; Portmann, F.T. Groundwater use for irrigation—A global inventory. Hydrol. Earth Syst. Sci. 2010, 14, 1863–1880. [Google Scholar] [CrossRef]
- Bouarfa, S.; Derdour, A.; Okkacha, Y.; Almaliki, A.H.; Jodar-Abellan, A.; Hussein, E.E. Sedimentological investigation of the potential origin and provenance of sand deposits in an arid area: A case study of the Ksour Mountains Region in Algeria. Arab. J. Geosci. 2022, 15, 1460. [Google Scholar] [CrossRef]
- Ait Naceur, H.; Igmoullan, B.; Namous, M. Machine learning-based optimization of flood susceptibility mapping in semi-arid zone. DYSONA-Appl. Sci. 2025, 6, 145–159. [Google Scholar]
- Famiglietti, J.S. The global groundwater crisis. Nat. Clim. Chang. 2014, 4, 945–948. [Google Scholar] [CrossRef]
- Han, D.; Tong, X.; Currell, M.J.; Cao, G.; Jin, M.; Tong, C. Evaluation of the impact of an uncontrolled landfill on surrounding groundwater quality, Zhoukou, China. J. Geochem. Explor. 2014, 136, 24–39. [Google Scholar] [CrossRef]
- Burri, N.M.; Weatherl, R.; Moeck, C.; Schirmer, M. A review of threats to groundwater quality in the anthropocene. Sci. Total Environ. 2019, 684, 136–154. [Google Scholar] [CrossRef]
- Derdour, A.; Jodar-Abellan, A.; Ghoneim, S.S.; Almaliki, A.; Hussein, E.E.; Pardo, M.Á. Groundwater quality assessment for sustainable human consumption in arid areas based on GIS and water quality index in the watershed of Ain Sefra (SW of Algeria). Environ. Earth Sci. 2023, 82, 510. [Google Scholar]
- Greer, F.R.; Shannon, M.; Nutrition, C.o.; Health, C.o.E. Infant methemoglobinemia: The role of dietary nitrate in food and water. Pediatrics 2005, 116, 784–786. [Google Scholar] [CrossRef]
- Ward, M.H.; Jones, R.R.; Brender, J.D.; De Kok, T.M.; Weyer, P.J.; Nolan, B.T.; Villanueva, C.M.; Van Breda, S.G. Drinking water nitrate and human health: An updated review. Int. J. Environ. Res. Public Health 2018, 15, 1557. [Google Scholar] [CrossRef] [PubMed]
- Hosni, A.; Derdour, A.; Nouri, T.; Moussaoui, T.; Zahi, F.; Reghais, A.; Jodar-Abellan, A.; Pardo, M.Á. Cultivating sustainability: A multi-assessment of groundwater quality and irrigation suitability in the arid agricultural district of Dzira (Ksour Mountains, Algeria). Environ. Monit. Assess. 2024, 196, 886. [Google Scholar] [CrossRef] [PubMed]
- WHO. Guidelines for Drinking-Water Quality: Incorporating the First and Second Addenda; World Health Organization: Geneva Switzerland, 2022.
- Bian, Z.; Wang, Y.; Zhang, X.; Li, T.; Grundy, S.; Yang, Q.; Cheng, R. A review of environment effects on nitrate accumulation in leafy vegetables grown in controlled environments. Foods 2020, 9, 732. [Google Scholar] [CrossRef] [PubMed]
- Bondonno, C.P.; Zhong, L.; Bondonno, N.P.; Sim, M.; Blekkenhorst, L.C.; Liu, A.; Rajendra, A.; Pokharel, P.; Erichsen, D.W.; Neubauer, O. Nitrate: The Dr. Jekyll and Mr. Hyde of human health? Trends Food Sci. Technol. 2023, 135, 57–73. [Google Scholar] [CrossRef]
- Ridder, W.; Oehme, F. Nitrates as an environmental, animal, and human hazard. Clin. Toxicol. 1974, 7, 145–159. [Google Scholar] [CrossRef]
- Alhamd, A.D.; Ibrahim, M.A. Unveiling soil and groundwater salinity dynamics and its impact on date palm yield in Southern Basrah, Iraq. DYSONA-Appl. Sci. 2024, 5, 25–32. [Google Scholar]
- Rashid, M.; Bera, S.; Banerjee, M.; Medvinsky, A.B.; Sun, G.-Q.; Li, B.-L.; Sljoka, A.; Chakraborty, A. Feedforward control of plant nitrate transporter NRT1. 1 biphasic adaptive activity. Biophys. J. 2020, 118, 898–908. [Google Scholar] [CrossRef]
- Ameen, M.H.; Jumaah, H.J.; Khursheed, N.K. An analysis of hydrologic dynamics in Hamrin Lake, Iraq using remote sensing and GIS techniques. DYSONA-Appl. Sci. 2025, 6, 96–103. [Google Scholar]
- Iammarino, M.; Berardi, G.; Vita, V.; Elia, A.; Conversa, G.; Di Taranto, A. Determination of nitrate and nitrite in Swiss chard (Beta vulgaris L. subsp. vulgaris) and wild rocket (Diplotaxis tenuifolia (L.) DC.) and food safety evaluations. Foods 2022, 11, 2571. [Google Scholar] [CrossRef]
- McDonald, M.G.; Harbaugh, A.W. A Modular Three-Dimensinal Finite-Difference Groundwater Flow Model; U.S. Geological Survey Publication: Charleston, SC, USA, 1988. [Google Scholar]
- Harbaugh, A.W.; McDonald, M.G. Programmer’s Documentation for MODFLOW-96, an Update to the US Geological Survey Modular Finite-Difference Ground-Water Flow Model; US Geological Survey, Branch of Information Services: Reston, VI, USA, 1996. [Google Scholar]
- Wang, H.; Gao, J.-e.; Zhang, S.-l.; Zhang, M.-j.; Li, X.-h. Modeling the impact of soil and water conservation on surface and ground water based on the SCS and visual modflow. PLoS ONE 2013, 8, e79103. [Google Scholar] [CrossRef]
- Perović, M.; Zuber-Radenković, V.; Zorić, M. Feasibility of Groundwater Extraction in Nitrate-Impacted Groundwater Source in Serbia: Hydrodynamic Modeling and Nitrate Tracing. Water 2024, 16, 2105. [Google Scholar] [CrossRef]
- Zheng, C.; Wang, P.P. MT3DMS: A Modular Three-Dimensional Multispecies Transport Model for Simulation of Advection, Dispersion, and Chemical Reactions of Contaminants in Groundwater Systems. In Documentation and User’s Guide; Alabama University: Tuscaloosa, AL, USA, 1999. [Google Scholar]
- Zheng, C.; Hill, M.C.; Cao, G.; Ma, R. MT3DMS: Model use, calibration, and validation. Trans. ASABE 2012, 55, 1549–1559. [Google Scholar] [CrossRef]
- Correa-González, A.; Hernández-Bedolla, J.; Martínez-Cinco, M.A.; Sánchez-Quispe, S.T.; Hernández-Hernández, M.A. Assessment of Nitrate in Groundwater from Diffuse Sources Considering Spatiotemporal Patterns of Hydrological Systems Using a Coupled SWAT/MODFLOW/MT3DMS Model. Hydrology 2023, 10, 209. [Google Scholar] [CrossRef]
- Suk, H. Modified Mixed Lagrangian–Eulerian Method Based on Numerical Framework of MT3DMS on Cauchy Boundary. Groundwater 2016, 54, 508–520. [Google Scholar] [CrossRef]
- Vengust, A.; Koroša, A.; Urbanc, J.; Mali, N. Development of Groundwater Flow Models for the Integrated Management of the Alluvial Aquifer Systems of Dravsko polje and Ptujsko polje, Slovenia. Hydrology 2023, 10, 68. [Google Scholar] [CrossRef]
- Raheem, A.; Ahmad, I.; Arshad, A.; Liu, J.; Rehman, Z.U.; Shafeeque, M.; Rahman, M.M.; Saifullah, M.; Iqbal, U. Numerical Modeling of Groundwater Dynamics and Management Strategies for the Sustainable Groundwater Development in Water-Scarce Agricultural Region of Punjab, Pakistan. Water 2024, 16, 34. [Google Scholar] [CrossRef]
- Sidiropoulos, P.; Tziatzios, G.; Vasiliades, L.; Mylopoulos, N.; Loukas, A. Groundwater Nitrate Contamination Integrated Modeling for Climate and Water Resources Scenarios: The Case of Lake Karla Over-Exploited Aquifer. Water 2019, 11, 1201. [Google Scholar] [CrossRef]
- Bemmoussat, A.; Adjim, M.; Bensaoula, F. Irrigation with treated wastewaters and the protection of Hennaya groundwater–Tlemcen, Algeria. J. Water Land Dev. 2019, 43, 19–27. [Google Scholar] [CrossRef]
- Hayane, S.M. Contribution à L’étude Géologique et Hydrogéologique du Bassin Versant de L’oued Sikkak (région de Tlemcen). Ph.D. Thesis, University of Tlemcen, Tlemcen, Algeria, 1983. [Google Scholar]
- Baba Hamed, K.; Bouanani, A.; Abdelali, T.; Bekkouche, A. Modele transitoire de la nappe des alluvions de la plaine d’hennaya (Tlemcen, NW–Algérie). J. L’eau L’Environ. 2005, 4, 7–17. [Google Scholar]
- Bemmoussat, A.; Adjim, M.; Bensaoula, F. Etude des eaux souterraines de la plaine d’Henaya (bassin de la Tafna-NW Algerien). LARHYSS J. 2014, 18, 36–76. [Google Scholar]
- Derdour, A.; Bouarfa, S.; Kaid, N.; Baili, J.; Al-Bahrani, M.; Menni, Y.; Ahmad, H. Assessment of the impacts of climate change on drought in an arid area using drought indices and Landsat remote sensing data. Int. J. Low-Carbon Technol. 2022, 17, 1459–1469. [Google Scholar] [CrossRef]
- Collignon, B. Hydrogéologie Appliquée des Aquifères Karstiques des Monts de Tlemcen (Algérie). Ph.D. Thesis, University of Avignon, Avignon, France, 1986. [Google Scholar]
- Guiguer, N.; Franz, T. Visual MODFLOW, User’s Manual; Waterloo hydrogeologic Inc.: Waterloo, ON, Canada, 1996. [Google Scholar]
- Woessner, W.W.; Poeter, E.P. Hydrogeologic Properties of Earth Materials and Principles of Groundwater Flow; The Groundwater Project: Guelph, ON, Canada, 2020. [Google Scholar]
- Domenico, P.A.; Schwartz, F.W. Physical and Chemical Hydrogeology; John Wiley & Sons: Hoboken, NJ, USA, 1997. [Google Scholar]
- Chapuis, R.P.; Aubertin, M. On the use of the Kozeny Carman equation to predict the hydraulic conductivity of soils. Can. Geotech. J. 2003, 40, 616–628. [Google Scholar] [CrossRef]
- Hong, B.; Li, X.a.; Wang, L.; Li, L.; Xue, Q.; Meng, J. Using the effective void ratio and specific surface area in the Kozeny–Carman equation to predict the hydraulic conductivity of loess. Water 2019, 12, 24. [Google Scholar] [CrossRef]
- Schäfer, G.; Lincker, M.; Sessini, A.; Carletti, A. Numerical Groundwater Model to Assess the Fate of Nitrates in the Coastal Aquifer of Arborea (Sardinia, Italy). Water 2024, 16, 2729. [Google Scholar] [CrossRef]
- Shakeri, R.; Nassery, H.R.; Ebadi, T. Numerical modeling of groundwater flow and nitrate transport using MODFLOW and MT3DMS in the Karaj alluvial aquifer, Iran. Environ. Monit. Assess. 2023, 195, 242. [Google Scholar] [CrossRef]
- Abesh, B.F.; Anderson, J.T.; Hubbart, J.A. Using MODFLOW to Model Riparian Wetland Shallow Groundwater and Nutrient Dynamics in an Appalachian Watershed. Water 2024, 16, 1772. [Google Scholar] [CrossRef]
- Anderson, M.P.; Woessner, W.W.; Hunt, R.J. Applied Groundwater Modeling: Simulation of Flow and Advective Transport; Academic Press: Cambridge, MA, USA, 2015. [Google Scholar]
- Morway, E.D.; Feinstein, D.T.; Hunt, R.J.; Healy, R.W. New Capabilities in MT3D-USGS for Simulating Unsaturated-Zone Heat Transport. Groundwater 2023, 61, 330–345. [Google Scholar] [CrossRef]
- Almasri, M.N.; Kaluarachchi, J.J. Assessment and management of long-term nitrate pollution of ground water in agriculture-dominated watersheds. J. Hydrol. 2004, 295, 225–245. [Google Scholar] [CrossRef]
- Doherty, J. Calibration and Uncertainty Analysis for Complex Environmental Models; Watermark Numerical Computing: Brisbane, Australia, 2015; Volume 227. [Google Scholar]
- Bougherira, N.; Hani, A.; Toumi, F.; Haied, N.; Djabri, L. Impact des rejets urbains et industriels sur la qualité des eaux de la plaine de la Meboudja (Algérie). Hydrol. Sci. J. 2017, 62, 1290–1300. [Google Scholar] [CrossRef]
- Gelhar, L.W.; Welty, C.; Rehfeldt, K.R. A critical review of data on field-scale dispersion in aquifers. Water Resour. Res. 1992, 28, 1955–1974. [Google Scholar] [CrossRef]
- Fetter, C.W.; Boving, T.; Kreamer, D. Contaminant Hydrogeology; Waveland Press: Long Grove, IL, USA, 2017. [Google Scholar]
- Zhang, H.; Xu, W.L.; Hiscock, K.M. Application of MT3DMS and geographic information system to evaluation of groundwater contamination in the Sherwood Sandstone Aquifer, UK. Water Air Soil Pollut. 2013, 224, 1438. [Google Scholar] [CrossRef]
- Bagherzadeh, S.; Nobandegani, A.F.; Rahimi, Z.; Derakhshan, Z.; Rajabi, S.; Shirgahi, F.; Mohammadpour, A. Predicting the alleviation of nitrate contamination in aquifers by conducting management scenarios using the PMWIN software: Application in the Andimeshk plain, Iran. Groundw. Sustain. Dev. 2023, 20, 100883. [Google Scholar] [CrossRef]

| Material Type | Hydraulic Conductivity (m/Day) | ) | ) | ) |
|---|---|---|---|---|
| Gravel | 100–1000 | 0.13–0.25 | 0.05–0.10 | 0.20–0.30 |
| Coarse Gravel | 10–100 | 0.18–0.25 | 0.10–0.20 | 0.15–0.25 |
| Fine Sand | 1–10 | 0.30–0.35 | 0.20–0.30 | 0.10–0.20 |
| Silty Sand | 0.1–1 | 0.15–0.25 | 0.30–0.40 | 0.01–0.10 |
| Sandstone | 0.001–0.1 | 0.10–0.20 | 0.40–0.50 | 0.01–0.10 |
| Clay | 0.000001–0.001 | 0.05–0.10 | 0.50–0.60 | 0.001–0.05 |
| Inflows | Rates (m3/Day) | Outflows | Rates (m3/Day) |
|---|---|---|---|
| Southern part | 35,400.62 | Northern part | 10,922.14 |
| Storage | 23,052.68 | Discharge | 41,321.25 |
| Recharge | 4322.27 | Pumping | 10,540.80 |
| Total | 62,775.57 | Total | 62,784.19 |
| Land Use Group | Agriculture | Wastewater | ||
|---|---|---|---|---|
| LU class | Seasonal crops | Arboriculture | Cereals | Urban areas |
| Area (ha) | 828.8 | 725.2 | 518 | 420 |
| Scenario 1 | ||||
| kg N/ha/yr | 160 | 180 | 30 | 17.6 |
| kg N/yr | 132,608 | 130,536 | 15,540 | 7392 |
| Total t N/yr | 278.684 | 7.392 | ||
| Scenario 2 | ||||
| kg N/ha/yr | 160 | 180 | 30 | - |
| kg N/yr | 132,608 | 130,536 | 15,540 | - |
| Total t N/yr | 278.684 | - | ||
| Scenario 3 | ||||
| kg N/ha/yr | 80 | 90 | 15 | 17.6 |
| kg N/yr | 66,304 | 65,268 | 7770 | 7392 |
| Total t N/yr | 139.342 | 7.392 | ||
Disclaimer/Publisher’s Note: The statements, opinions and data contained in all publications are solely those of the individual author(s) and contributor(s) and not of MDPI and/or the editor(s). MDPI and/or the editor(s) disclaim responsibility for any injury to people or property resulting from any ideas, methods, instructions or products referred to in the content. |
© 2024 by the authors. Licensee MDPI, Basel, Switzerland. This article is an open access article distributed under the terms and conditions of the Creative Commons Attribution (CC BY) license (https://creativecommons.org/licenses/by/4.0/).
Share and Cite
Laoufi, A.; Boudjema, A.; Guettaia, S.; Derdour, A.; Almaliki, A.H. Integrated Simulation of Groundwater Flow and Nitrate Transport in an Alluvial Aquifer Using MODFLOW and MT3D: Insights into Pollution Dynamics and Management Strategies. Sustainability 2024, 16, 10777. https://doi.org/10.3390/su162310777
Laoufi A, Boudjema A, Guettaia S, Derdour A, Almaliki AH. Integrated Simulation of Groundwater Flow and Nitrate Transport in an Alluvial Aquifer Using MODFLOW and MT3D: Insights into Pollution Dynamics and Management Strategies. Sustainability. 2024; 16(23):10777. https://doi.org/10.3390/su162310777
Chicago/Turabian StyleLaoufi, Abdessalam, Abderezzak Boudjema, Sabrine Guettaia, Abdessamed Derdour, and Abdulrazak H. Almaliki. 2024. "Integrated Simulation of Groundwater Flow and Nitrate Transport in an Alluvial Aquifer Using MODFLOW and MT3D: Insights into Pollution Dynamics and Management Strategies" Sustainability 16, no. 23: 10777. https://doi.org/10.3390/su162310777
APA StyleLaoufi, A., Boudjema, A., Guettaia, S., Derdour, A., & Almaliki, A. H. (2024). Integrated Simulation of Groundwater Flow and Nitrate Transport in an Alluvial Aquifer Using MODFLOW and MT3D: Insights into Pollution Dynamics and Management Strategies. Sustainability, 16(23), 10777. https://doi.org/10.3390/su162310777