Abstract
Sailing vessel navigators always want to receive state-of-the-art prompt and accurate marine weather-forecasting services. However, the weather-routing services by private sectors are expensive. Further, forecasting results from public institutes are usually free, and they are not in real-time or numerical modes, so they are not quite suitable for small-size or offshore vessels. In this study, an intelligent system was constructed for delivering sea forecasting at specific areas according to the navigator’s order. The system can automatically obtain web-based forecasting charts issued from multi-source meteorological agencies and convert the regional information into numerical text at requested points. During this step, several intelligent algorithms, like the OpenCV digital image processing algorithm and the YOLO wind vector deep learning recognition method, were applied. By applying this state-of-the-art system, navigators on board do not need to download different institutional graphics (usually with large stream bytes) to explore the future states of the sea surface in a specific area in the sailing route but can obtain the multi-source text forecasting information just by sending the area coordinates to a designated email address. The field tests confirmed that this auto-intelligent system could assist the navigator within a few minutes and thus greatly enhance the navigation safety with minor text-based communication costs. It is expected that by improving the efficiency of marine services and bringing in more artificial intelligence technology, maritime security would be more sustainable.
1. Introduction
Weather elements, especially strong surface winds, are important factors to consider during marine navigation. Modern maritime transportation considers weather navigation as a necessity, and it can be adopted by three optimized modes: onshore weather navigation (referred to as shore navigation), ship-based weather navigation (referred to as self-navigation), and ship–shore integrated navigation [1,2]. Currently, onshore navigation has relatively mature navigation technology and working systems, while the level of automatic navigation is constantly improving [3]. Pure ship-based weather navigation relies greatly on the senior officers’ personal experiences and was adopted during the decades when ship–shore communication was slow and expensive; therefore, it is very hard to implement this navigation technique with reduced satellite communication costs. Ship–shore integrated navigation also offers many advantages, such as helping the captain to fully understand the intention of onshore alignment and maximizing cooperation with the shore navigation company to complete the navigation task. The use of automatic navigation can reduce the complicated communication and telegraph services of shore guidance and save navigation costs; it is an inevitable trend for future development.
Large vessels typically followed climatology-based pre-set routes or applied commercial meteorological navigation services (better known as weather routing, mostly solved by the A* algorithm) to receive a recommended route [4,5,6]. Weather-routing services are currently obligatory for transoceanic voyages, since providers prioritize navigation safety and economic purposes by considering various weather- and ship-related factors [7,8]. However, the recommended route may not always satisfy the captain’s preferences due to these competing considerations [9]. Moreover, weather-routing services are mostly expensive and have been dominated by a few private sectors. Most inland river, offshore, or short-distance voyages will not adopt weather-routing services, but this approach can pose a high risk if the ship encounters sudden severe weather conditions. For instance, the inland cruise ship, the “Oriental Star”, overturned in 2015 and claimed 442 lives [10]; this was the deadliest shipwreck accident in Chinese history since 1949. Even with advanced technology, deadly ship overturn accidents still happen. It was estimated that in 2020, 2021, and 2022, there were 24, 13, and 20 small ships that sunk or were overturned due to rough weather or rough sea conditions, claiming 140, 62, and 99 deaths or missing persons, respectively [11,12,13]. These facts show that sustainable weather navigation services are greatly needed.
In practice, small-size ships and particular types of offshore engineering vessels are vulnerable to sudden strong winds. The navigators in these types of vessels do not need a delicate and expensive transoceanic weather-routing service, nor a synoptic analysis from regional weather charts, but a 24/7, fast-responding sea condition prediction service at specific areas on sailing routes. Currently, these services are not available, at least in most offshore areas of the northwestern Pacific.
In this study, on the basis of a simple model created ten years ago, an intensified and very complicated sustainable sea forecasting system was developed, aiming to fill the gap between basic self-navigation and expensive commercial weather-routing services, i.e., providing an innovative, real-time, and multi-source professional weather-consulting solution with almost no cost. The most innovative aspects of the new system are as follows: converting conventional forecasting graphics into digital formats through a deep learning image process, serving the navigator at the pixel level, and flexibly responding to multiple requests from navigators on board. After preliminary field tests, it has been proved that this concept is feasible.
This paper is organized as follows. Section 2 describes the methodology and literature, Section 3 summaries the data sources, Section 4 presents the methods to retrieve forecasting information from shaded graphics, Section 5 shows how to retrieve wind vectors using the YOLO algorithm, Section 6 illustrates the field tests on board, and Section 7 draws conclusions and presents future considerations.
2. Related Work and Methodology
Our approach contained two parts. First, we improved an auto-response pilot system to retrieve multi-source prediction charts. Then, we applied several artificial intelligence methods to this system to retrieve detailed prediction values at specific areas on sailing routes.
2.1. Previous Auto-Response System
Currently, a modern vessel navigator can obtain many marine wind and wave forecasts from various sources. However, few of them are seaman-oriented, auto-responsive, and non-regional. In real-time marine wind and wave prediction methods, most designers have focused on producing state-of-the-art accurate forecasts and releasing them to the ship navigator at a routine frequency [14]. In many cases, the raw hydro-met forecasting data are retrieved from Numerical Weather Prediction (NWP) products, and statistical rendering or other mathematical algorithms like quantile-to-quantile and persistence methods are applied to improve the prediction accuracy [15,16]. Recently, Ou et al. [17] proposed a hybrid seasonal trend decomposition with loess (STL) decomposition deep neural network to perform efficient offshore wind speed forecasting. However, these forecasting systems were seldom user-oriented and often did not respond immediately when there was an urgent need over the sea.
Jian et al. [18] designed an automatic but non-intelligent forecasting system for surface wind speed at marine fixed points. The core raw data were retrieved from the European Center for Medium Weather Forecasting (ECMWF) numerical product and sent to ships through the Beijing ground station server (Figure 1). Testing showed that it took 13 min (or 30 min) to receive a return email onboard by using an International Maritime Satellite organization (INMARST) F station (or C station). However, there were many factors beyond control that made the system unable to provide continuous service. One of the reasons is that too many servers were adopted in Europe, the USA, and China, and the connections between those servers were slow and unstable, resulting in long waiting times or even a failure to respond. In addition, it was difficult to acquire a long-term non-commercial forecasting license from ECMWF.
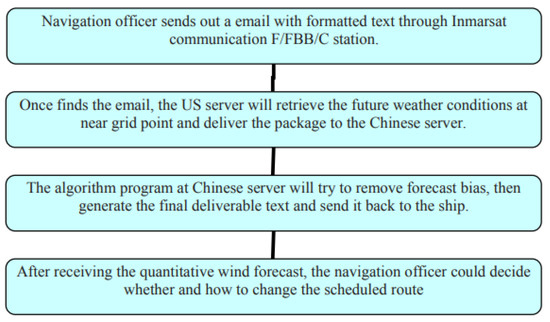
Figure 1.
Flow chart of the auto-forecast pilot system in Jian et al. [18].
To avoid the above shortcomings, hereby an innovative, comprehensive, and intelligent algorithm-incorporated system was re-built to combine all calculations and modules into a single server. By using various raw numerical model results or prediction charts issued by multiple institutions, we can obtain the latest forecasting, extract necessary weather-related information at specific points, and return them back to the ship navigator according to email-based requests. The entire process would be automatically executed within a few minutes. In general, the system significantly optimizes sea area positioning forecasts and reduces the error value of the weather forecast model, which helps vessel navigators prevent adverse weather events and ensure navigation safety and sustainability.
Besides ship users, this system can also be applied by offshore platforms in weather-sensitive work or tugging navigation. In the northern part of the South China Sea, the wind velocity observation showed an obvious linearity with the raw numerical forecasting value when the lead time was within 24–48 h (Figure 2). Based on this, a simple statistical linear regression correction was applied for offshore China.
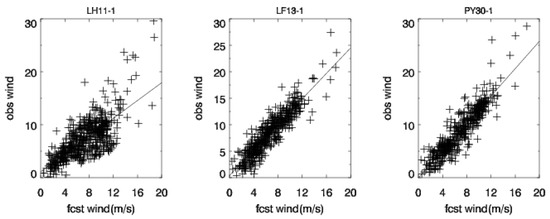
Figure 2.
Scatter point diagrams of three offshore platforms’ wind velocity observations versus the raw ECMWF forecasts at 24–48 h lead time. Over 500 wind data points were collected twice a day during March-November 2012.
2.2. Pixel Reading through OpenCV Image Processing
Besides raw global dynamic model prediction, most official institutes issue wind and wave predictions in graphic mode free of charge. Therefore, one of the challenging problems is to convert the regional forecast results into a specific area forecast, which is what seamen want most. This study applied an artificial intelligence method, with OpenCV as the reading algorithm, to retrieve the wind speed and wave height from shaded charts at the pixel level.
OpenCV is a widely used open-source computer vision library that provides many functions and tools for image and video processing and can be used in many programming languages such as C++, Python, and Java. OpenCV can help developers solve various computer vision problems, including object detection, face recognition, image segmentation, motion tracking, and more. OpenCV was developed by Intel in 1999 and has now become the foundation of many computer vision applications [19]. In this study, it was feasible to apply OpenCV to retrieve the pixel color at the sailing route point and convert it into wind scale or wave heights, since most of the online forecasting graphics are in color shade mode.
2.3. Wind Vector Recognition by YOLO Deep Learning Algorithm
With the rapid application and expansion of deep learning in computer vision, related target detection methods have gradually replaced the traditional handcrafted feature design and become a research hotspot in various industries. The early target detection algorithms relied heavily on manual feature extraction, traversed the image through sliding windows, and finally determined the target class by classifiers. However, these methods have some limitations, such as high computational time, slow speed, high error rate, and strong subjectivity [20]. In contrast, object detection algorithms based on deep learning offer high operational efficiency, fast processing speed, and superior detection accuracy, making them suitable for real-time detection. The use of computer vision and convolutional neural network (CNN) has become the dominant approach for multi-purpose target detections. Deep learning target detection algorithms can be divided into one-stage and two-stage. Two-stage algorithms first generate a region proposal and then subject it to CNN for target classification and position regression. Typical models include R-CNN [21], Fast R-CNN [22], and Faster R-CNN [23]. This method achieves high detection accuracy but with relatively slow speed, so it is not investigated in this study. In contrast, the one-stage algorithm directly classifies and predicts the position of targets without generating region boxes, represented by SSD [24], the YOLO series [25], etc. It provides a fast detection speed but with reduced accuracy [26]. It should be noted that since its first release in 2015, the YOLO-Based Deep Learning Models for Object Detection have been updated rapidly, especially in recent years. For instance, YOLOv3, v4, v5, v6, v7, and v8 were released in April 2018, April 2020, May 2020, June 2022, July 2022, and January 2023, from four different research groups. When the study began in 2021, the latest YOLO models, i.e., YOLOv4 and YOLOv5, were applied to detect wind vectors from Japanese 24 h and 48 h surface weather forecast charts, reflecting the regional marine wind scales. YOLOv7 and YOLOv8, released recently, focused on the aspects of pedestrians, damaged racks, and fracture detection [27].
2.3.1. YOLO4
YOLOv4 is a deep learning-based target detection algorithm that achieves recognition of objects in an image by analyzing the image in multiple stages using a convolutional neural network.
Stage 1: Feature Extraction.YOLOv4 uses convolutional neural network (CNN) to extract the features of the image. CNN does this by continuously convolving, pooling, and non-linear activation of the image to abstract the most important features in the image [28].
Phase 2: Image Pyramid. In order to cover objects of different sizes, YOLOv4 uses the image pyramid technique, where the image is sampled at multiple resolutions. This allows the model to recognize both small and large objects.
Phase 3: Object Detection.YOLOv4 uses a technique called Multi-Channel Prediction (MCP), which performs object detection through different prediction layers. Each layer corresponds to a different resolution to recognize objects of different sizes.
Phase 4: Object Recognition.YOLOv4 uses a Softmax classifier to recognize objects in an image by assigning each object to a predefined category.
YOLOv4 does this by dividing the image into multiple grids of different sizes and then using a convolutional neural network to detect the presence of an object within each grid and the location of the object. Each grid detects multiple different boxes, and each box predicts the class and confidence of the object it contains [29]. YOLOv4 improves on previous versions of YOLO to increase accuracy and speed. It uses more convolutional layers and uses more data augmentation techniques to train the model to improve its ability to recognize complex images. During the training process, the YOLOv4 model is validated by continuously modifying the network weights to minimize the prediction error and by cross-validation to verify the accuracy of the model. Finally, the model will predict the bounding box of the target on the test data and the accuracy of the model is evaluated using the IoU of the predicted bounding box versus the true bounding box.
2.3.2. YOLOv5
The model of YOLOv5 consists of three parts: a feature extraction network, a feature pooling layer, and a multitask prediction layer. The feature extraction network consists of a series of convolutional layers used to extract features from the original image. Connecting multiple feature extraction layers into a fully connected network allows more features to be extracted, making the model more effective in extracting useful information. The feature pooling layer is used to pool features from the original input image and map the features to a specific spatial scale so that the multitask prediction layer can better handle the input features. Finally, the multitask prediction layer converts the features into predictions of object categories and detection frames for object detection purposes. The model principle of YOLOv5 is based on feature extraction from images, where the objects in the image are extracted and used as inputs to the model [30]. YOLOv5 uses convolutional neural networks (CNNs) for feature extraction, where the network structure of the convolutional neural network uses a multi-layer network consisting of a feed-forward network and a feedback network consisting of multiple layers, each with a different convolutional kernel and pooling layer. It builds a three-layer deep neural network that receives features from the output of the feature extraction module and uses these features to predict the target’s localization information. It is implemented through a special multi-task learning framework where each task has a separate output layer to predict the output of each localization task.
When the input image enters the network, the model decomposes the image into small chunks and uses a specialized convolutional kernel to convolve each chunk of the image, and then passes through a pooling layer where the convolved features are aggregated to extract features from the image. The output features of each layer are passed on to the next layer, then the model can extract features from the image in depth, thus obtaining more accurate object detection results.
After the network training is completed, the model splits the image into several chunks and detects each chunk to determine whether it contains an object. When an object is detected, the model calculates the bounding box of the object and gives the class and confidence level of the object.
2.3.3. YOLOv5s
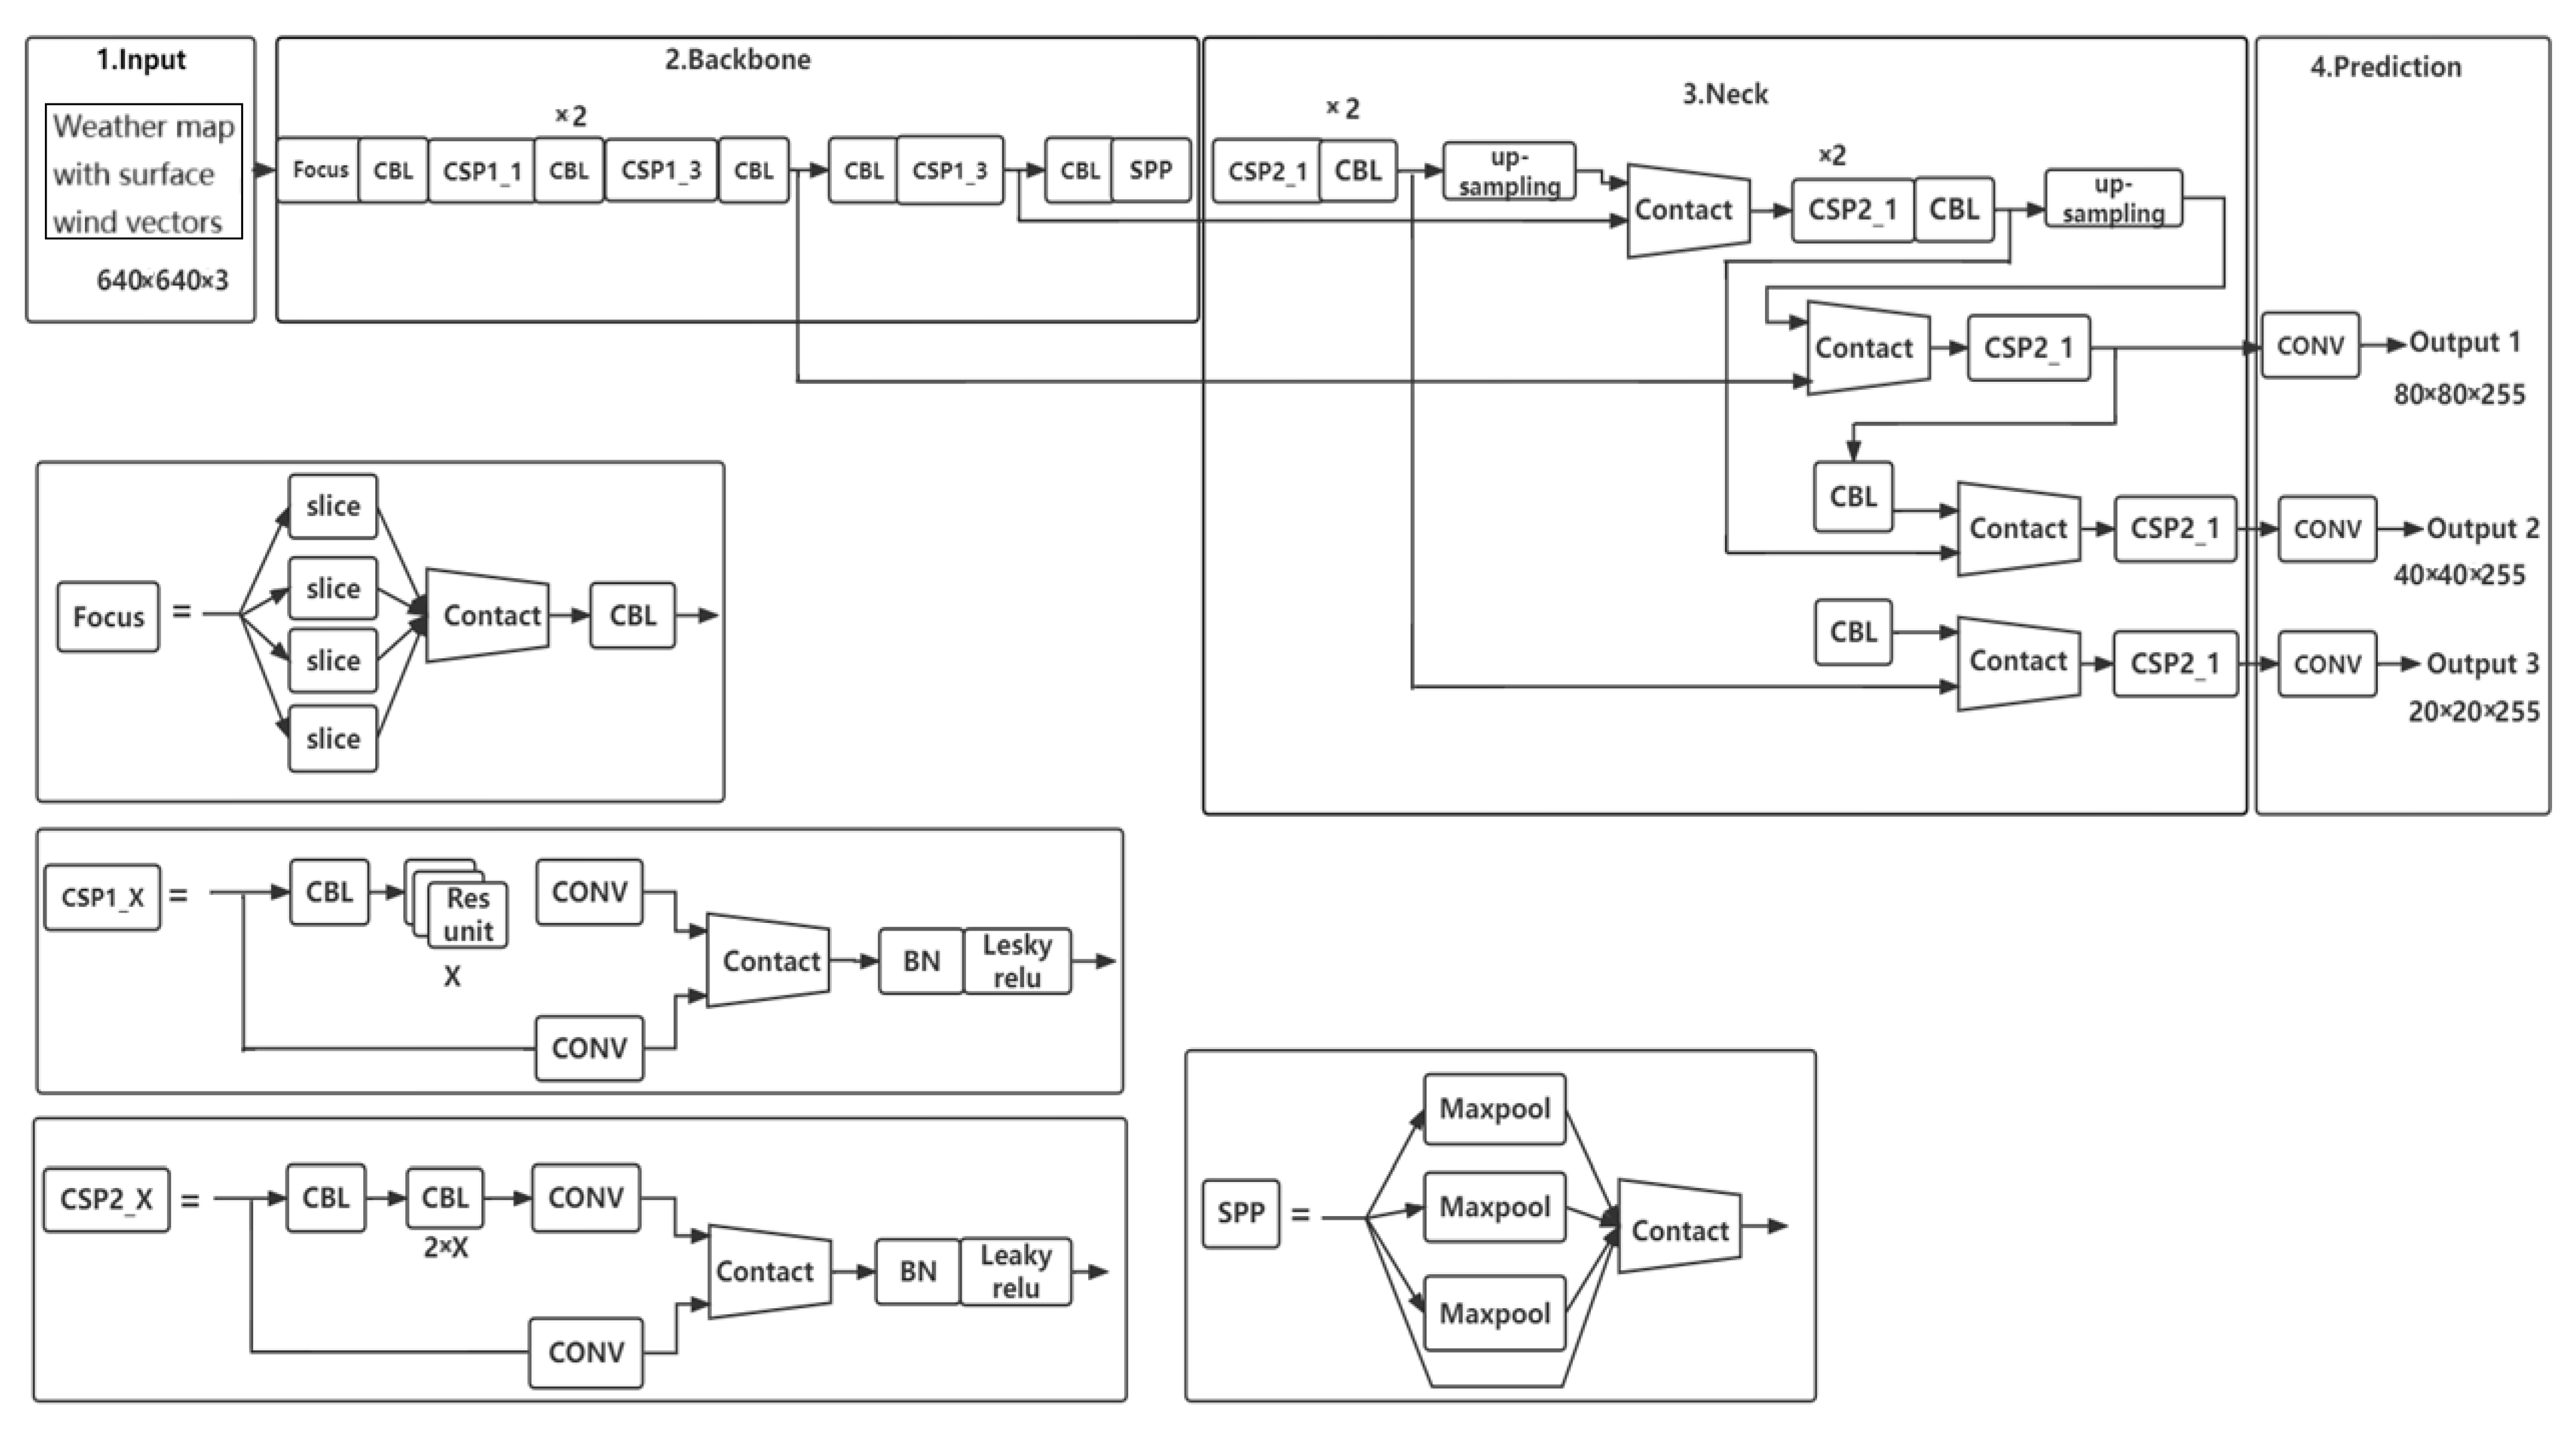
YOLOv5s is the smallest and fastest version of the YOLOv5 algorithm. Due to the advantages in both size and computation speed, it was chosen in our experiment. The specific structure diagram is shown in Figure 3. The backbone network is composed of Focus structure and CSP structure, mainly used to extract target features [31]. To prevent information loss during down-sampling, the model uses letterboxing to adaptively resize the 2392 × 2048 × 3 image to a 640 × 640 × 3 image. The Focus module then converts the resized image into a 320 × 320 × 32 feature map, by performing a slice operation on the image. In contrast to a regular CBL, the CSP structure [32] divides the original input into two branches, which are processed separately with convolutional operations to reduce the number of channels. One of the branches then undergoes a Bottleneck × N operation, and the two branches are subsequently merged to ensure that the input and output of the Bottleneck CSP are of equal size. This enables the model to obtain richer feature information through local cross-layer fusion while reducing computational complexity. The CSP1_X and CSP2_X structures shown in Figure 3 illustrate this approach. The SPP module in YOLOv5s borrows the idea of SPPNet, which uses convolutional kernels with uniform stride but different sizes to implement SPP. A uniform stride means that the output feature map size is the same, and only the sensitivity to different regions varies. After concatenation, a 1 × 1 convolution is used to fuse the features. During the object detection process, the model extracts multiple feature layers and a total of three feature layers are extracted. Each feature layer divides the entire image into small grids, with each grid point responsible for detecting an area. Finally, predictions are made based on the feature results, resulting in three prediction maps with sizes of 80 × 80 × 255, 40 × 40 × 255, and 20 × 20 × 255.

Figure 3.
YOLOv5s frame in wind vector recognition.
3. Meteorological Data Sources and Acquisition
3.1. Global Forecast System and the Navigators’ Association
As one of the top NWP products, the GFS (Global Forecast System) model is generated by NOAA (National Oceanic and Atmospheric Administration), a scientific institution under the US (United States) Department of Commerce that focuses on marine and atmospheric environment research [33]. GFS can extract open meteorological data based on individual needs, and there are alternative data sources available, including CMC GEM (Canadian Global Environmental Model), the US Navy NAVGEM (Navy Global Environmental Model), the French ARPEGE (Action de Recherche Petite Echelle Grande Echelle) model, and the German DWD ICON (Deutscher Wetterdienst Icosahedral Nonhydrostatic) model. The accuracy of the data from these authoritative institutions is guaranteed.
GFS’s domain encompasses the entire world, with a one-by-one degree resolution, a time span of 0–180 h, and an update frequency of every 3 h. After basic linear regression, the GFS wind forecast performs similarity with ECMWF results. Additionally, the Navigators’ Association has developed a free Grib service for seafarers called MailASail Weather service. This service is provided by communication operator MailASail and provides meteorological data through email, file transfer protocol, and browser-based platforms. MailASail offers navigators a free service that can be accessed through email, file transfer protocol, and web browsers. Once the GFS model forecast data undergo processing, a corresponding table featuring longitude and latitude wind speeds is generated.
3.2. Professional Meteorological Agencies
The raw numerical product described in Section 3.1, though it has many advantages, has shortcomings too. Therefore, our system also acquires graphic-based hydrometeorological forecast information from four major public agencies and one foreign private meteorological service company. The characteristics of their prediction models are outlined in Table 1. To automate the process of accessing hydrometeorological information from the websites listed in Table 1, we utilized a web crawler [34] to search the corresponding webpages, convert the obtained source code into a ‘BeautifulSoup’ object, save the contents under the obtained path, and schedule execution times according to the node’s meteorological forecast update schedule.

Table 1.
Marine forecasting institutions adopted in this study.
3.3. Interactive Mail Automation
In the era of big data, rapid developments in network and information technology have led to the widespread application of artificial intelligence (AI) technologies across various industries. Email automation is a crucial means of communication and office work, but limited communication conditions on ships and marine platforms make it difficult to use network terminals as easily as on land. To ensure user convenience and minimize bandwidth usage and cost, our design utilizes cloud services and email interaction methods to access, receive, process, and send various data information.
The Python standard library offers modules such as Zmail and smtplib for implementing the SMTP protocol and sending emails. It also includes email modules to aid in constructing email formats. However, the smtplib module can pose complex issues like server letter rejection, and the need to determine the server’s address and port number and parse the email structure. To minimize complications and streamline the process, our design adopted the Zmail module. This module features simple code and automatically fills in header information that might cause server letter rejection, as well as performing automatic server address and port number detection.
The system extracts the latest meteorological data required from Navigators’ Association SailMail, which are loaded as an attachment in the mail. To optimize the mail retrieval process, we established receiving rules in the mailbox, where mail from weather@mailasail.com is stored in a specific folder. This not only reduces the time spent traversing all mailboxes but also promptly detects the most recent mail sent by the Navigators’ Association. To realize two-way communication between Webmail and E-mail clients, the read email is marked as ‘read’, and the system uses the IMAP protocol to download attachments.
4. Graphic Forecasting Data Retrieval
4.1. Classification and Storage of Weather Forecast
To obtain the correct weather forecast map, the system initially performs a simple classification of the image based on various attributes. These include binary byte, tuple, file type, color, brightness, and resolution, among others. For instance, when retrieving pictures from the China National Meteorological Center, we eliminate any unnecessary ones with binary bytes greater than 100,000. Subsequently, the remaining pictures undergo classification according to different tuples. A tuple with [7937953] represents a wind forecast map, a tuple with [6988603] indicates a sea fog forecast map, and a tuple with [7168603] represents a strong convection forecast map. Finally, the pictures are sorted based on time and saved in predetermined folders.
For weather forecast maps that are too similar to be classified based on image attributes, a grid-based Kmeans algorithm was adopted [35]. The traditional Kmeans algorithm needs to go through the whole dataset. The grid-based Kmeans algorithm is an improved Kmeans clustering algorithm. It reduces computational complexity by dividing the dataset into grids, reducing the memory usage, and thereby improving the efficiency of the algorithm. The maps are first standardized and cropped to eliminate any abnormalities. Next, K centers are randomly selected, and each image is assigned to the nearest center. These cluster centers then compete with each other to adjust their positions so that their distance from the maximum possible data is less than the distance from other cluster centers. The center of each category is recalculated after this competition. This process is repeated until the change in each type of center triggers a pre-set threshold, thus completing the picture classification.
4.2. Interpolation to Obtain the Wind Speed or Wave Height
When it comes to predicting wind speed at specific points on sailing routes, accuracy is crucial, even if the points do not fall precisely on the grid coordinate. To overcome this challenge, we use the interpolation method to calculate the nearest coordinate point and determine the corresponding wind speed. After conducting a comparison between the cubic spline interpolation method and the bilinear interpolation method [36], using some data, we obtained both original and interpolated data through two-dimensional and three-dimensional visualization. Our findings revealed that the results obtained from bilinear interpolation were rough when the data were scarce, whereas the results were smoother with cubic spline interpolation. Consequently, the system selects cubic spline interpolation for processing data.
Spline is a formula defined by segments. There are n + 1 points and n intervals. The cubic spline equation satisfies the following three conditions:
- (1)
- In each segmentation interval is a cubic polynomial.
- (2)
- Satisfy .
- (3)
- , , and are continuous in the interval. Therefore, the curve is smooth.
Therefore, n cubic polynomial segments can be written as:
4.3. Coordinate Transformation of Forecast Map
Since the earth is an irregular pear-shaped sphere with a slightly wider equator and a slightly flat pole, its surface is a curved surface that cannot be flattened. It is necessary to use certain mathematical rules to convert the longitude and latitude lines into a plane. Taking Mercator projection and Lambert projection as examples, this paper expounds the coordinate transformation of the forecast map.
As shown in Figure 4a,b, wind forecast maps with Mercator projection need the conversion of longitude and latitude coordinates (x, y) to make the coordinate points correspond to pixel points one by one due to the phenomenon of latitude gradual lengthening [37].
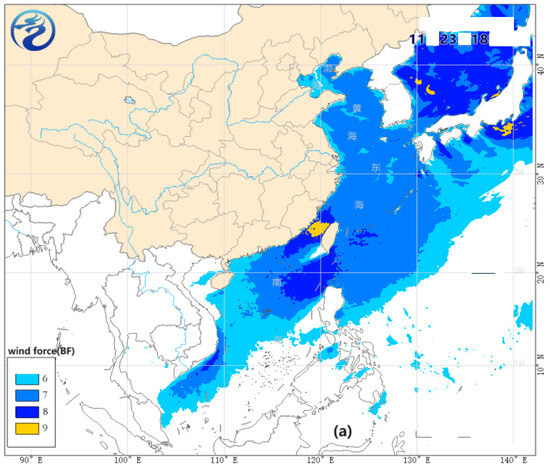
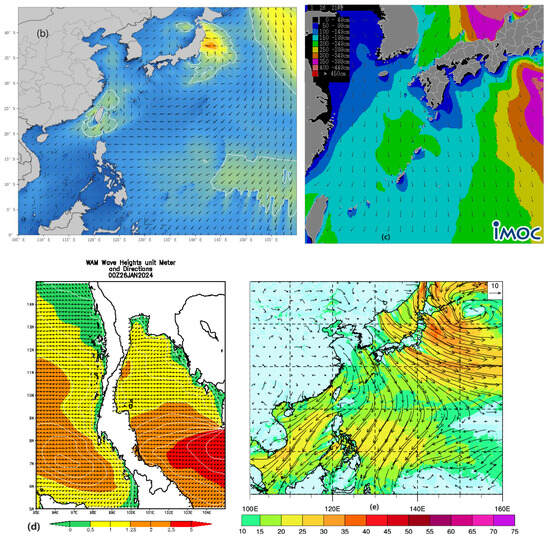
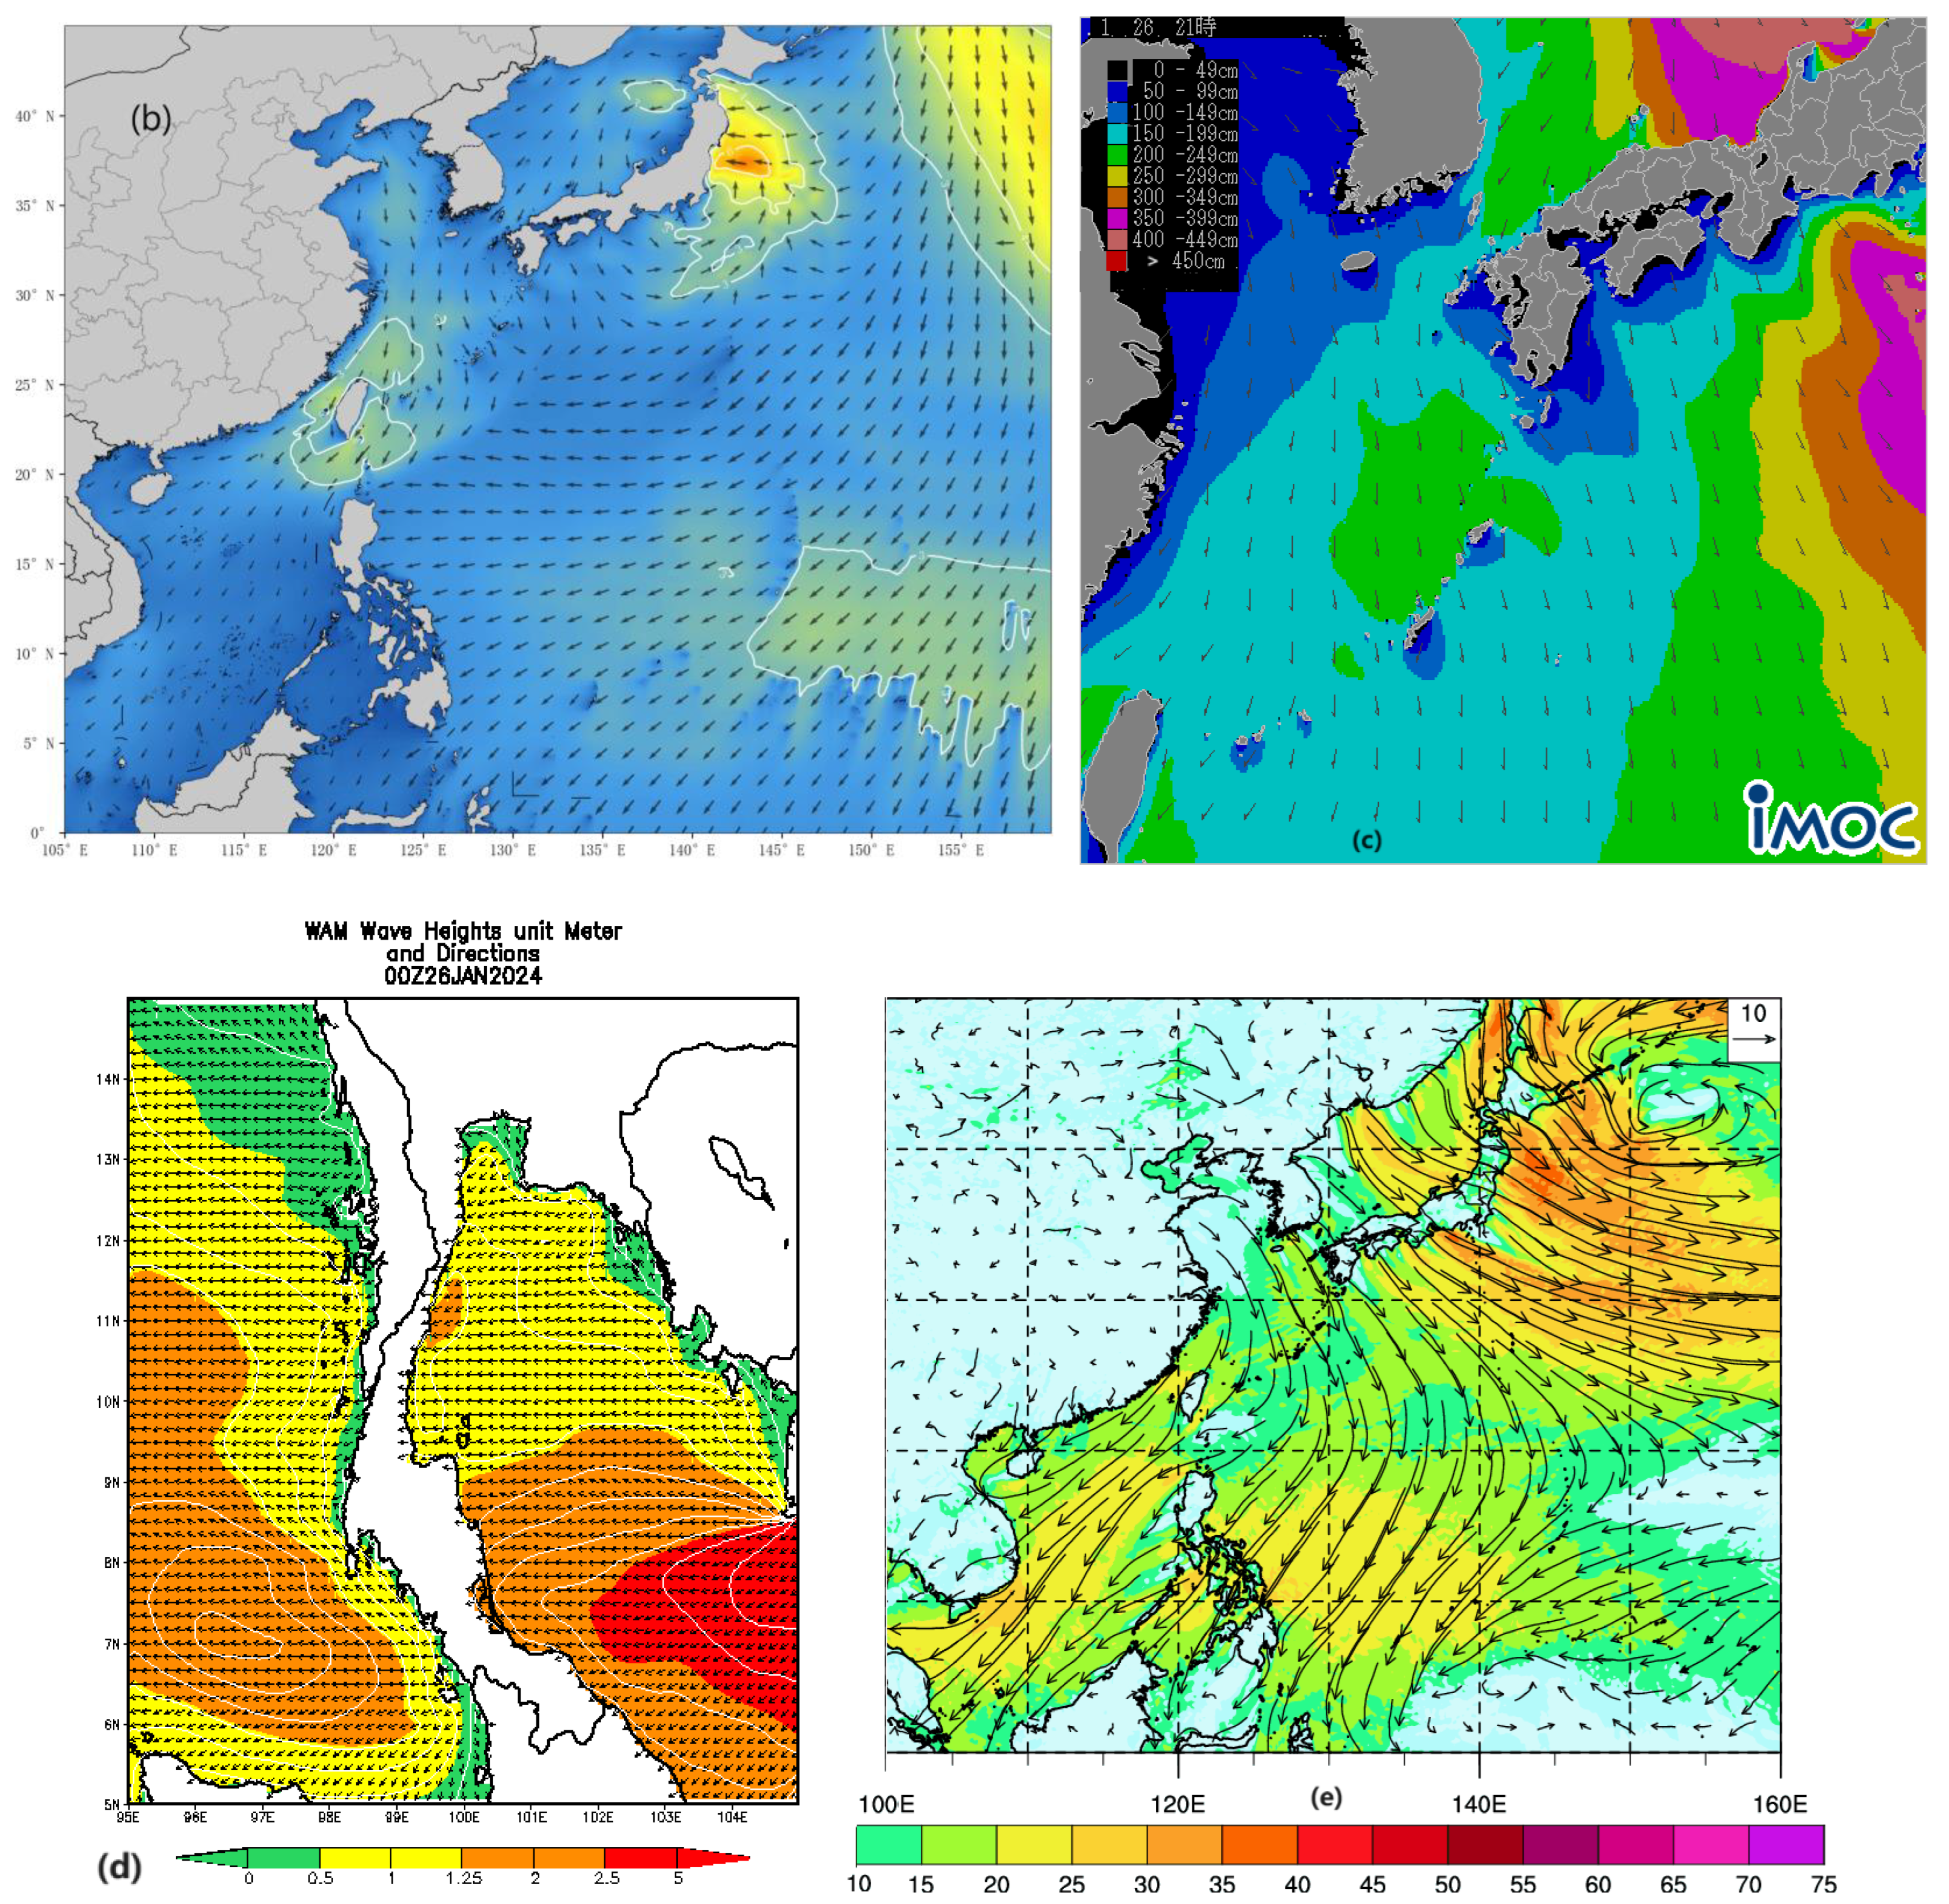
Figure 4.
Wind or wave forecast graphics from (a) Chinese National Meteorological Center on 18Z23 December 2023, (b) Chinese National Marine Environmental Forecasting Center on 00Z22 January 2024, (c) Japan Meteorological Agency on 21Z26 January 2024, (d) Thai Meteorology Department on 00Z26 January 2024, and (e) one USA private forecasting corporation on 00Z26 January 2024.
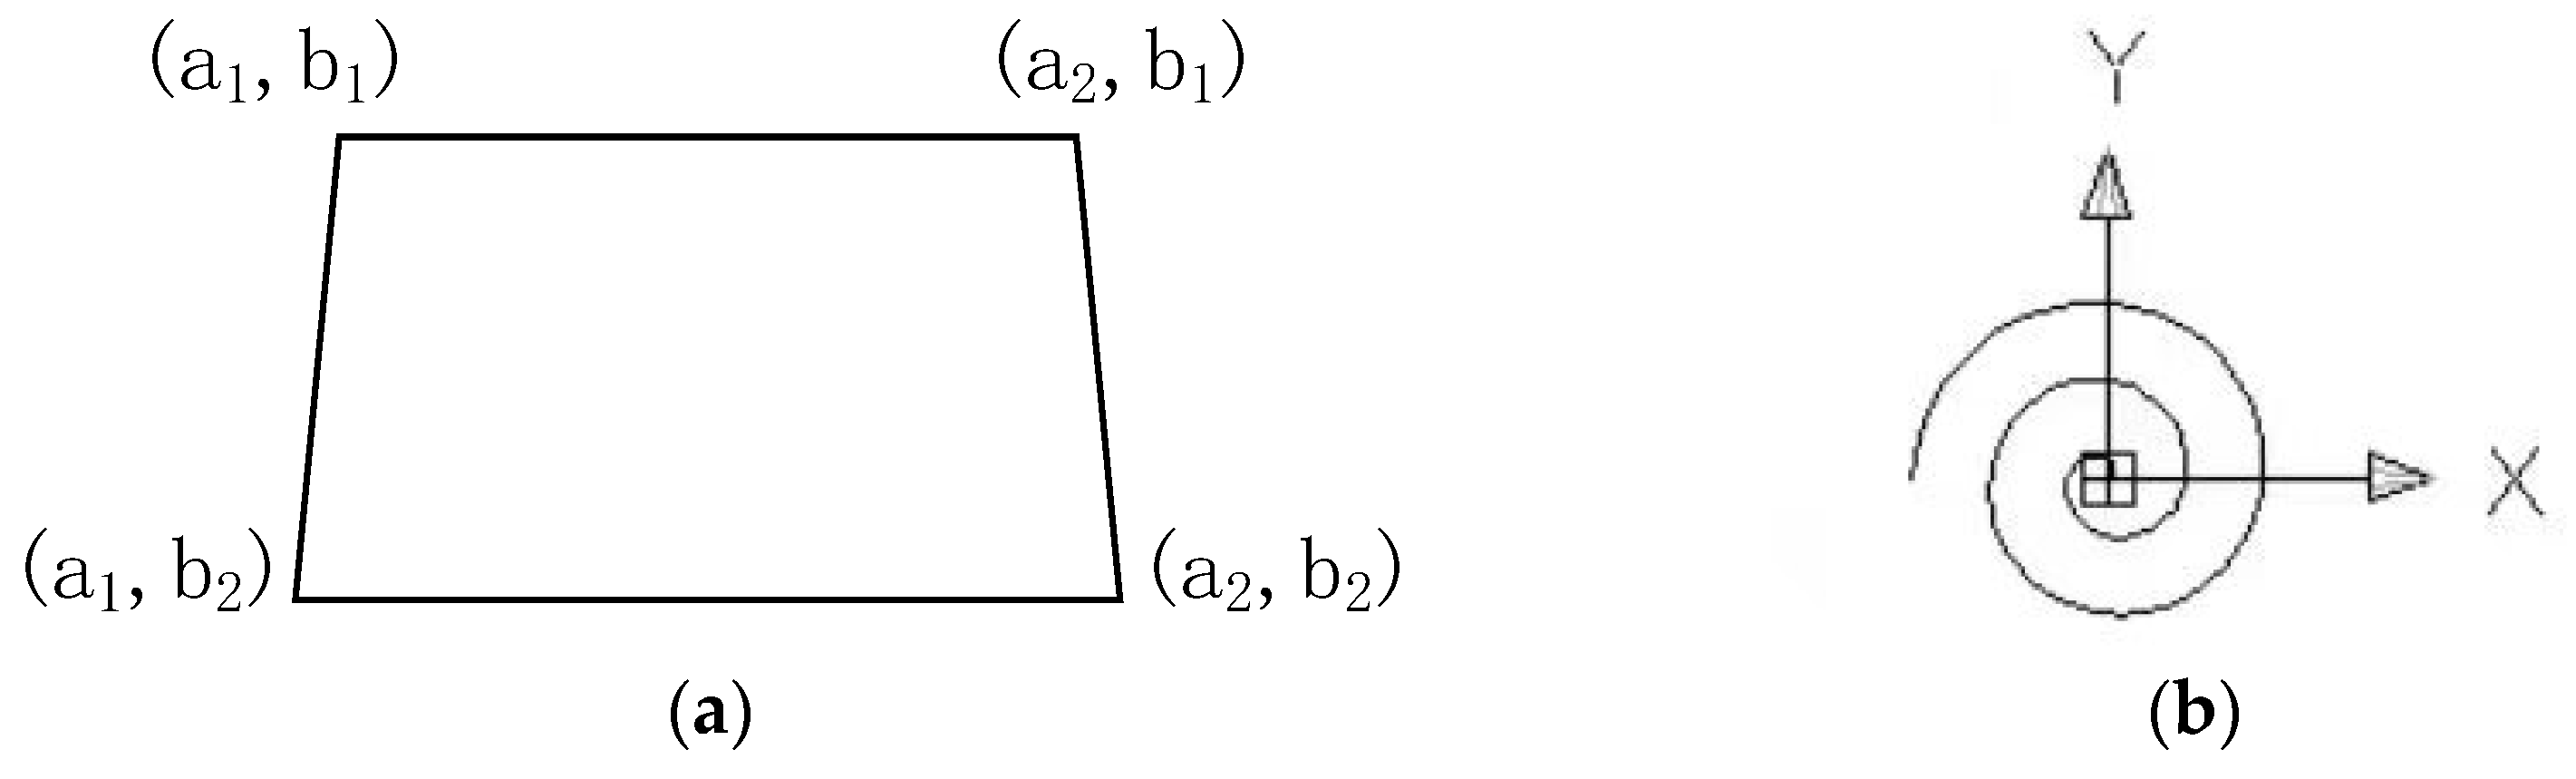
For the wind forecast map with Lambert projection, as shown in Figure 4b, the pixel matrix arrangement corresponding to longitude and latitude coordinates (x, y) was calculated by using the variable-rate interpolation method. Divide the picture into several coordinate systems according to the grid lines in the figure and approximate the coordinate changes in each grid to equal scale changes. Let the four angular coordinates of the grid where the longitude and latitude coordinates are located be (a1, b1), (a2, b1), (a1, b2), (a2, b2), and the corresponding pixel matrix is arranged as (a11, b11), (a21, b12), (a12, b21), (a22, b22), as shown in Figure 5a.

Figure 5.
(a) Thumbnails of Lambert’s projected sea charts; (b) Archimedes’ spiral.
In addition, special point processing is also required, as shown in Figure 5b. When the selected pixel point is on the grid line of the weather forecast map or on the land, island, and its edge line, the pixel value represented by the point is not corresponding to the wind intensity of the point, so Archimedes’ spiral is used to spread from the point to the surroundings until the nearest pixel point not on the grid line of the weather forecast map or on the land, island, and its edge line is selected.
(Order α = 0, β = 1. The initial value of θ is 0 and π/4 is added each time).
4.4. Pixel Processing of Forecast Image
Combined with the pixel value of the legend of the forecast map, the coordinate points identified by the OpenCV [38] in Python are compared with the pixel value of the pixel points on the weather forecast picture to obtain the forecast results. The main functions of OpenCV are Image Processing and Computer Vision. It provides open-source and optimized basic code for advanced visual research, so as to provide developers with the basis to develop common interfaces to disseminate visual related knowledge.
4.5. System Flow Chart
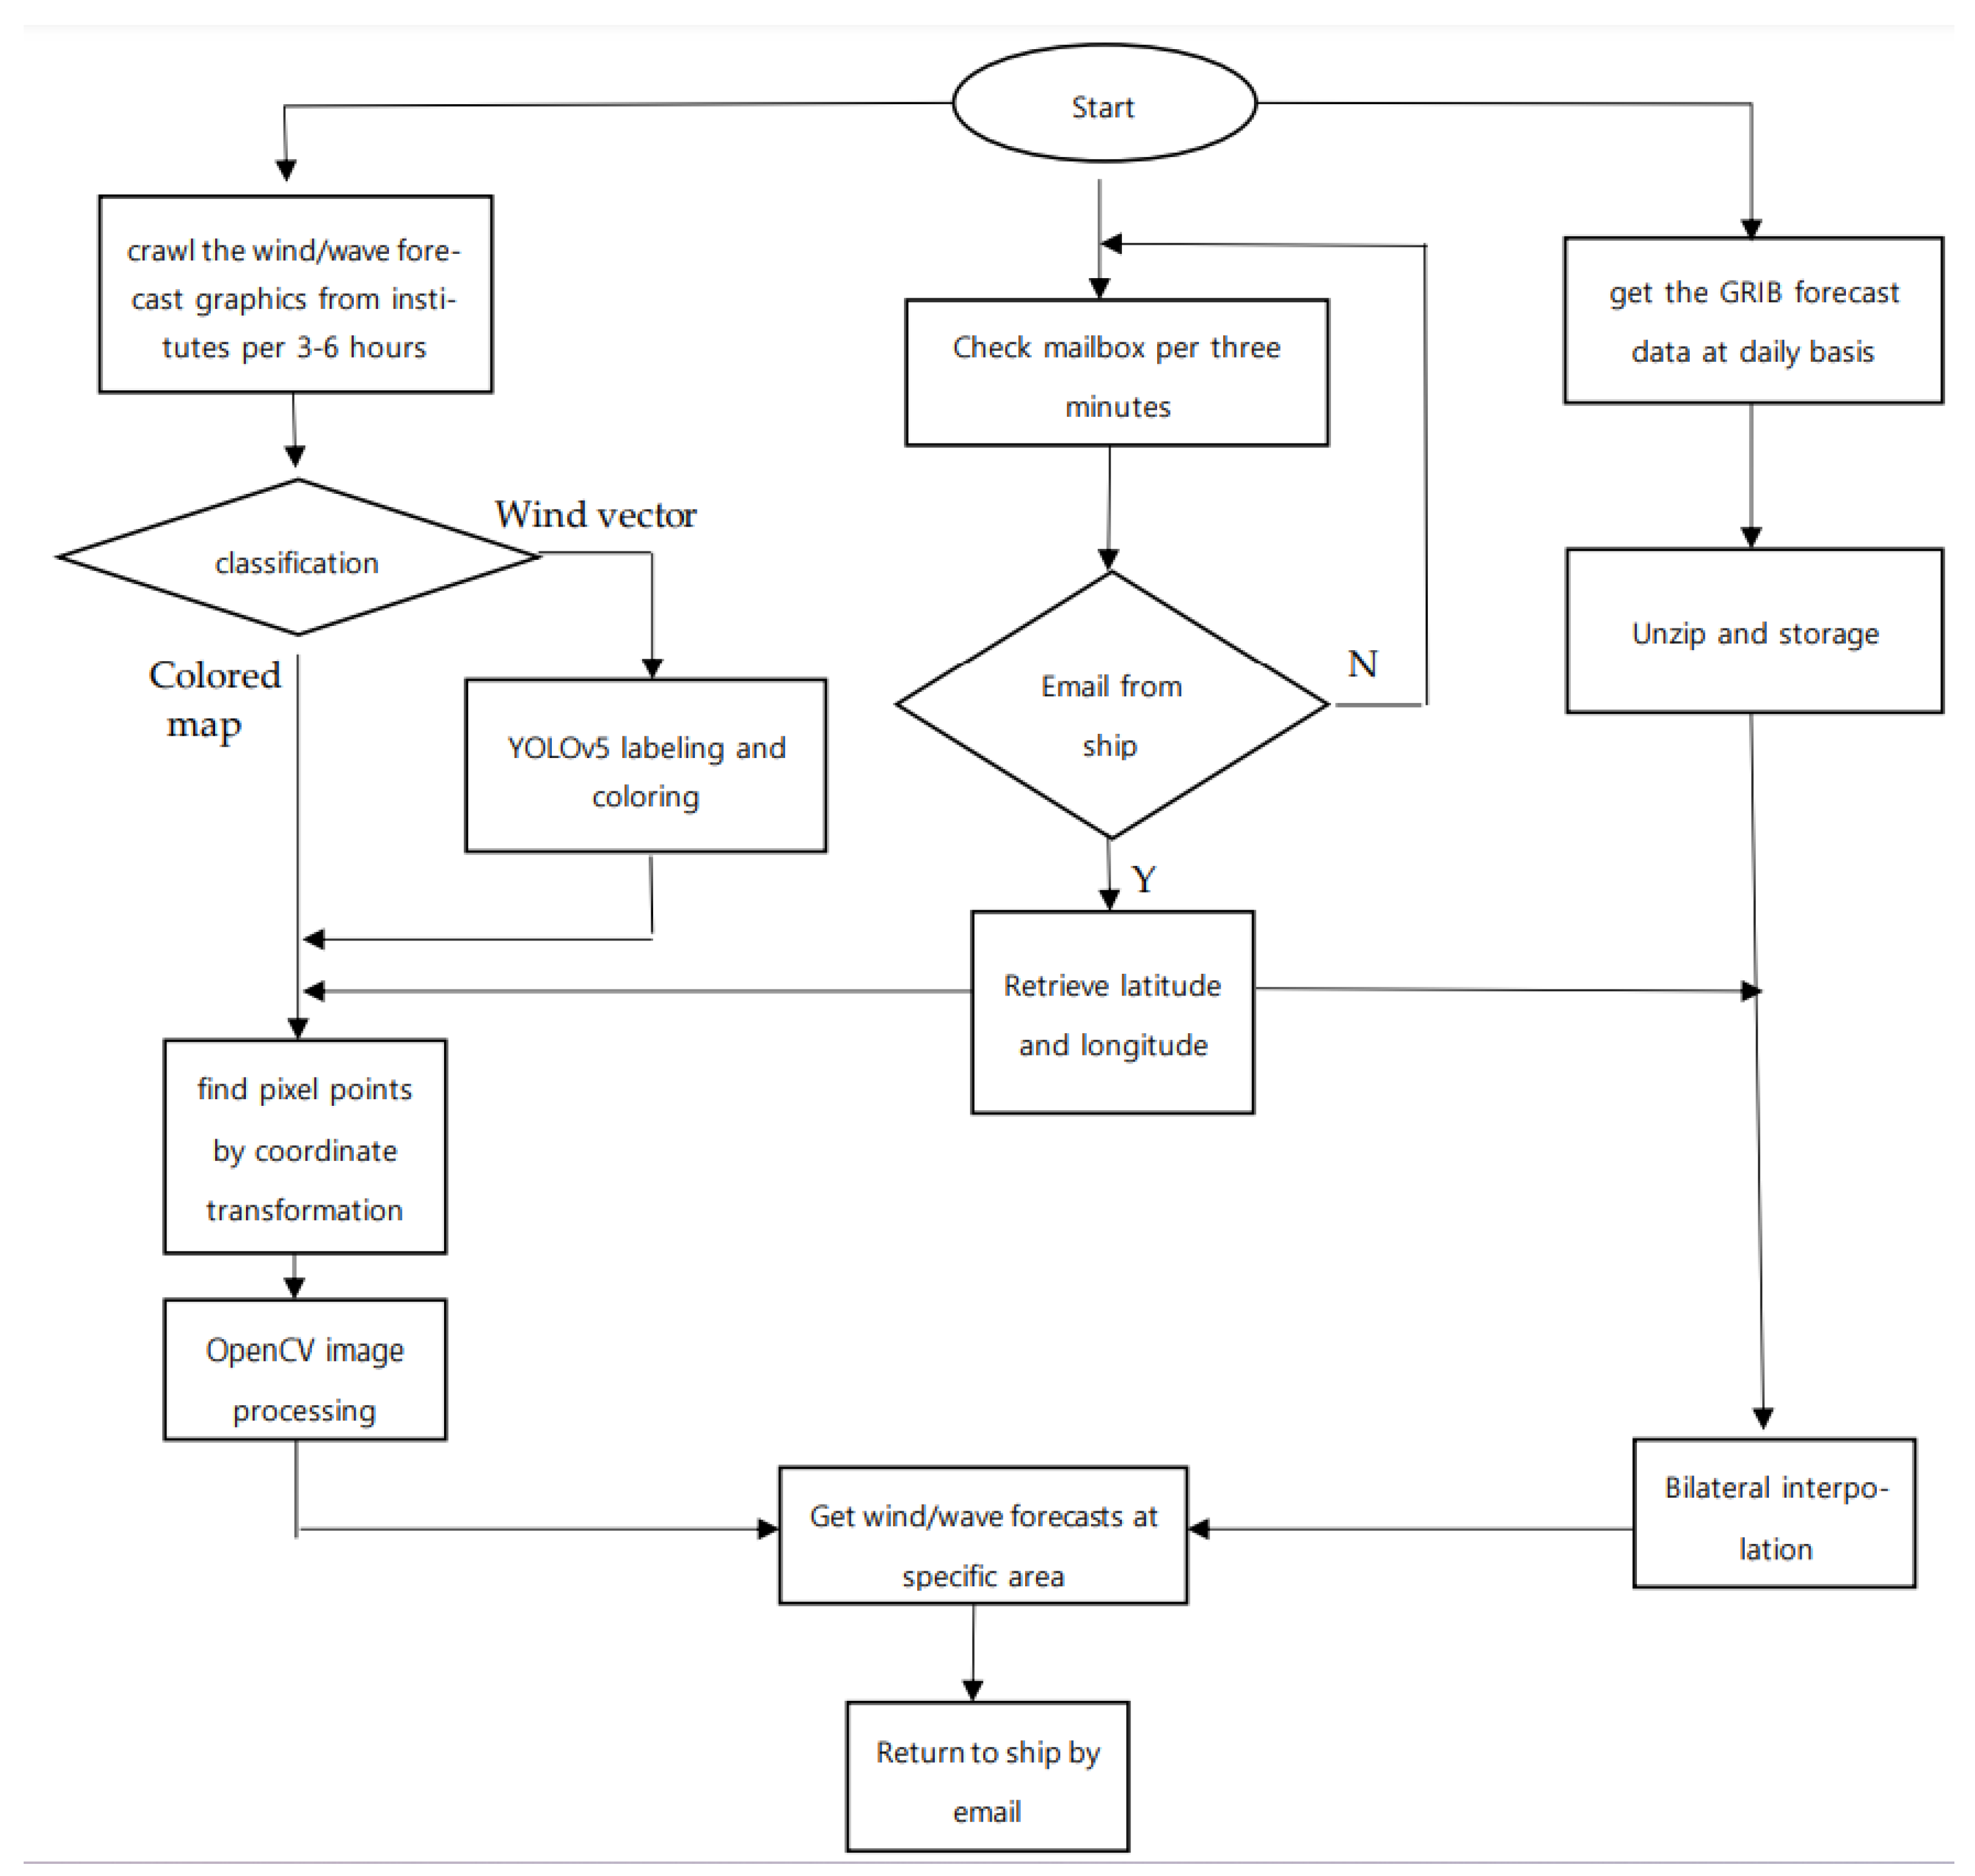
Currently, all of the programs of this system are carried out purely on the server at Dalian Maritime University. The server obtains the latest meteorological data regularly every day according to the time when the forecast agency updates the data. At the same time, it checks the mailbox every 3 min to extract the meteorological forecast content required by the request email, calculates the meteorological changes, and returns to the ship, sending the request email through the maritime satellite communication (Figure 6).
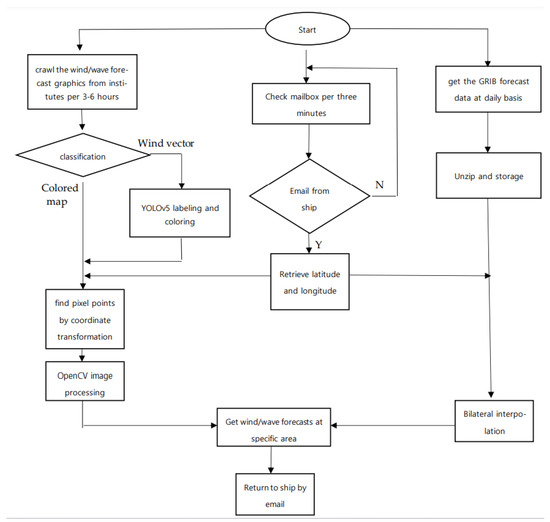
Figure 6.
Flow chart of the auto-intelligent forecasting system.
5. Wind Vector Recognition and Labeling Based on YOLOv5s
5.1. Computation Environment and Data
This experiment was based on the PyTorch framework and trained using a GPU. The operating environment for running the experiment is Python version 3.9, with acceleration provided by CUDA 11.2, and the deep learning framework used is PyTorch 1.9.0. The experimental data collection mainly comes from wind vectors in forecast maps publicly released by the Japan Meteorological Agency, as shown in Figure 7a. The collected image resolution is 2392 × 2048, and the distribution of wind vector targets in the image is arbitrary. The dataset is annotated using the image labeling tool (labeling) and stored in XML file format [39] as the label for image training. The ratio of (training set + validation set) to test set is set at 9:1, and the ratio of training set to validation set is set at 9:1. Wind vector types were divided into six categories, as shown in Table 2.

Figure 7.
(a) Detection result image. (b) Wind loss image after annotation; the areas with wind velocity of 30kt, 35kt, and 40kt are filled with yellow, orange, and red.
Table 2.
Wind vector training statistics.
5.2. Evaluation Standard
This experiment used metrics such as precision (P), recall (R), and mean average precision (mAP) [40] to evaluate the performance of the YOLOv5s algorithm. The specific formulas for each metric are as follows:
In Equations (5)–(7), TP, FP, and FN represent true positive (the sample’s true class is positive and the model predicts a positive result correctly), false positive (the sample’s true class is negative, but the model predicts it as positive, producing an incorrect prediction), and false negative (the sample’s true class is positive, but the model predicts it as negative, producing an incorrect prediction), respectively.
5.3. Wind Vector Recognition by YOLO
The performances of YOLOv4, YOLOv5l, and YOLOv5s models were compared. Under the same dataset and computational environment, the experimental results of each model are shown in Table 3. It can be observed that the improved YOLOv5s model achieved the best detection performance; YOLOv4 provided the best precision value, but was slow and contained a large weight value. Therefore, from the perspective of detection accuracy and speed, the YOLOv5s object detection algorithm was chosen in the experiment, and it was proved to meet the requirements of wind vector recognition.
Table 3.
Comparison of effects of different improvement methods.
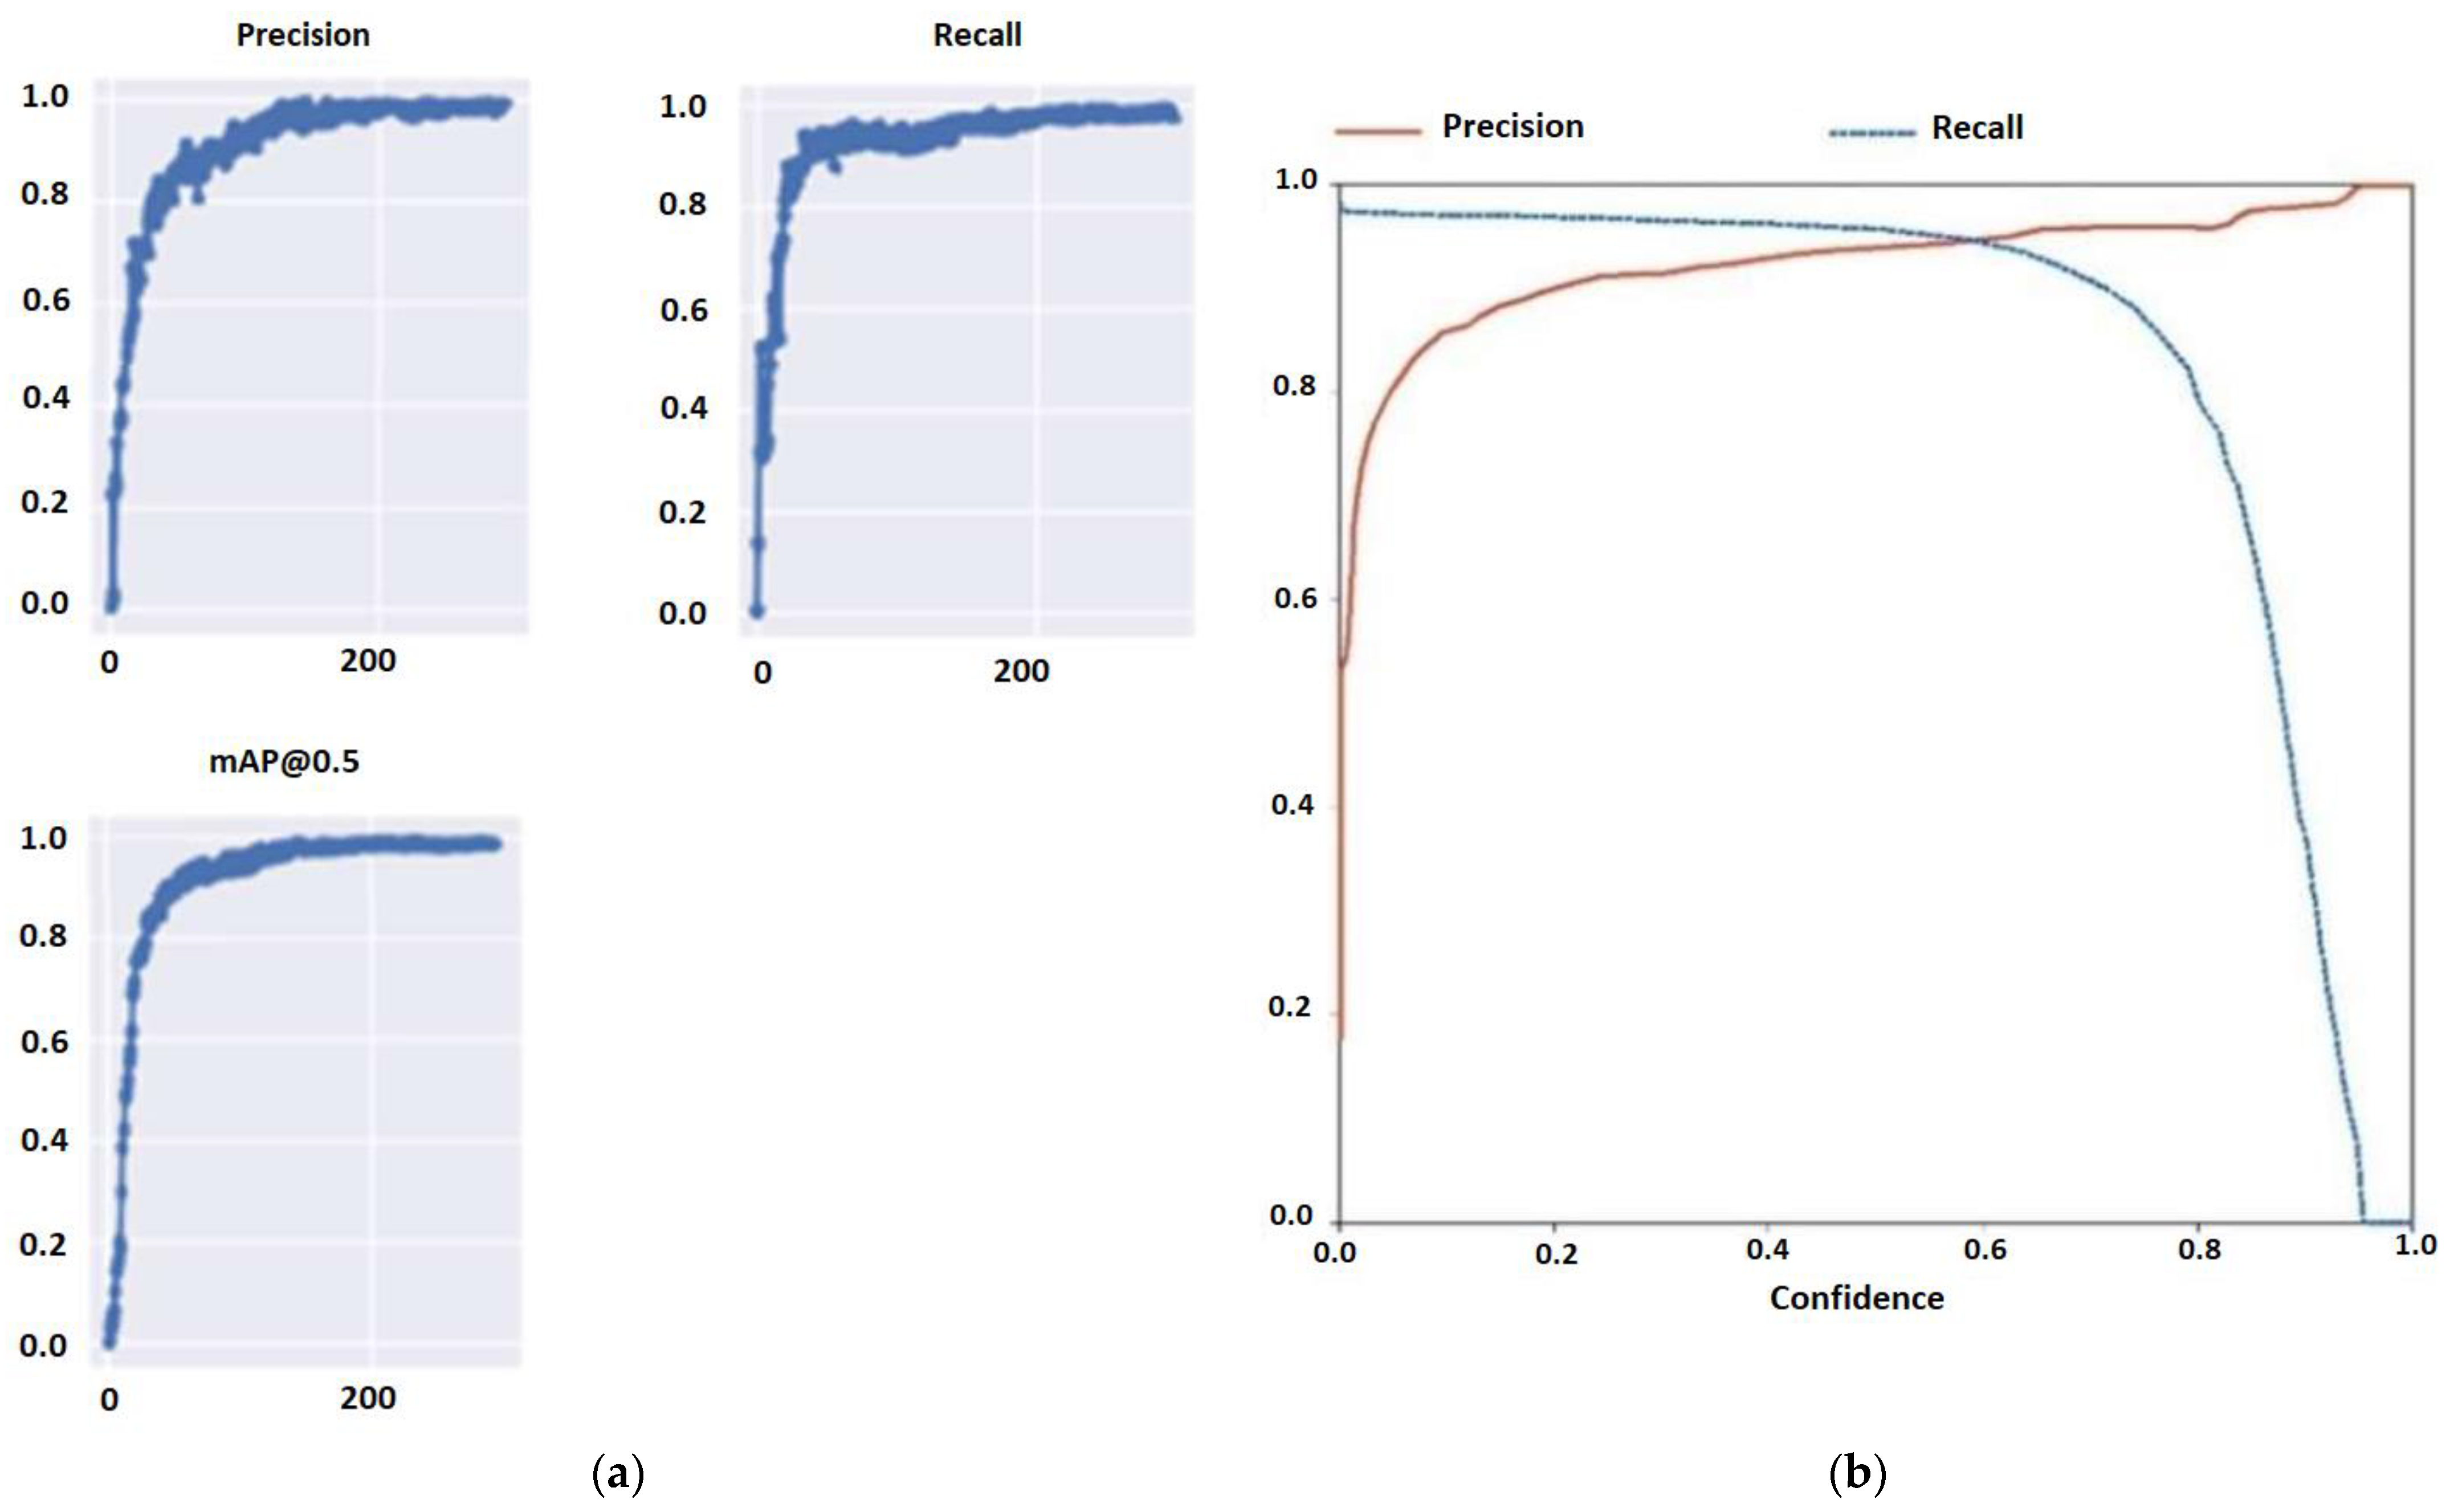
During model training, the maximum training iterations were pre-set to 300. Figure 8 illustrates the training results of one of the best-performing models: YOLOv5s. In Figure 8a, the precision rate, recall rate, and mean average precision (mAP) rapidly increased to around 0.8 within the first 30 epochs. After 200 epochs, the values became steady around 0.95, indicating a stable convergence. Figure 8b shows the precision and recall rate variance related to the confidence level. Based on the intersection point, the confidence threshold value of 0.62 is set for future vector recognition processes.
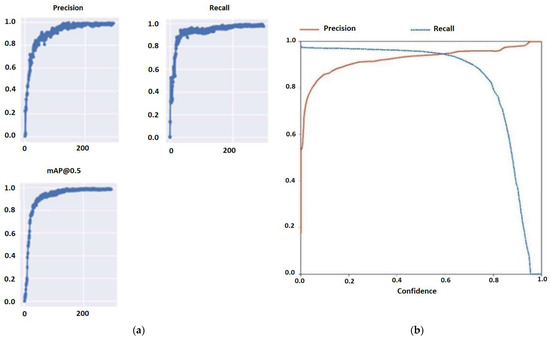
Figure 8.
YOLOv5s training. (a) Precision, recall, and mean average precision (mAP) variation according to the training iterations. (b) Relationship between precision and recall with respect to confidence threshold.
One example of the detection results of the wind vectors in this experiment is shown in Figure 7a, with no missed or false detections and maintaining high confidence levels (the numbers on the small rectangles represent confidence levels). The average detection time per image is 32 milliseconds. After the goal detection in the wind vector image is completed, the program will obtain the position information of the detected bounding boxes, adjust the box size, inject different colors according to the wind force level, and generate a new weather forecast image, as shown in Figure 7b, so that the system can read meteorological forecast information using the methods described in Section 4.
6. Field Tests on the Ships
6.1. Obtain Sea Forecasting via INMARST Stations
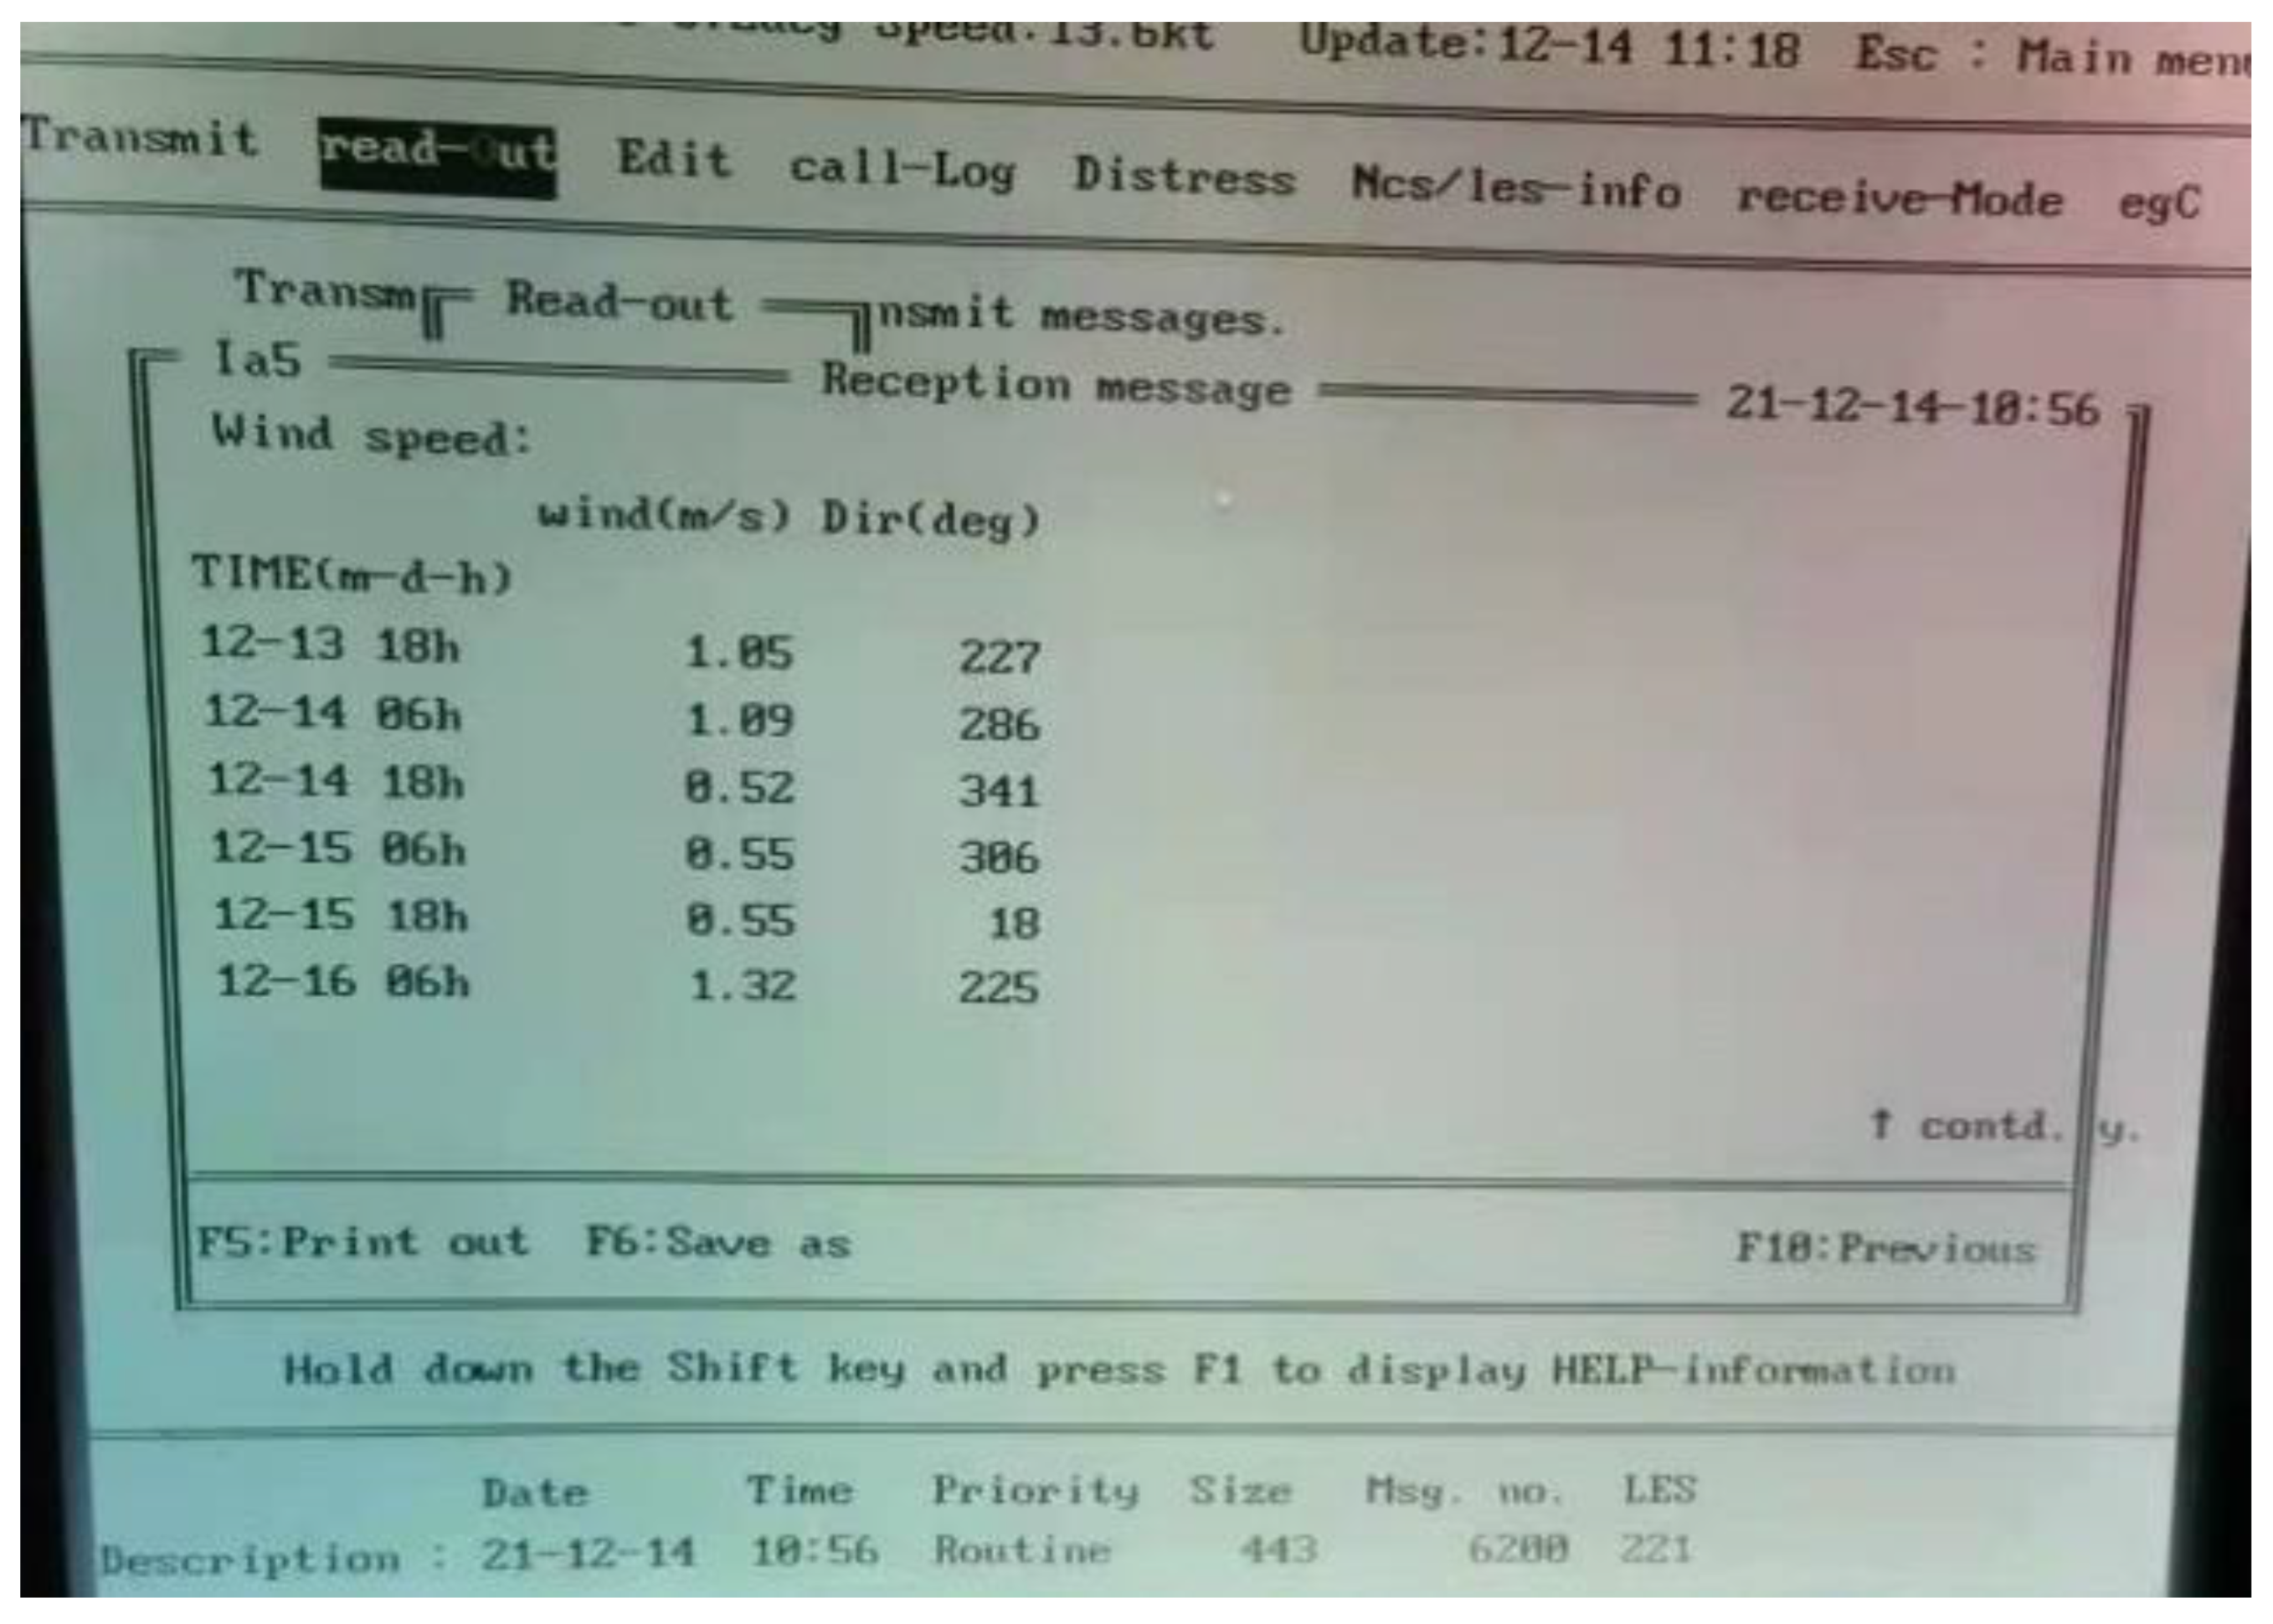
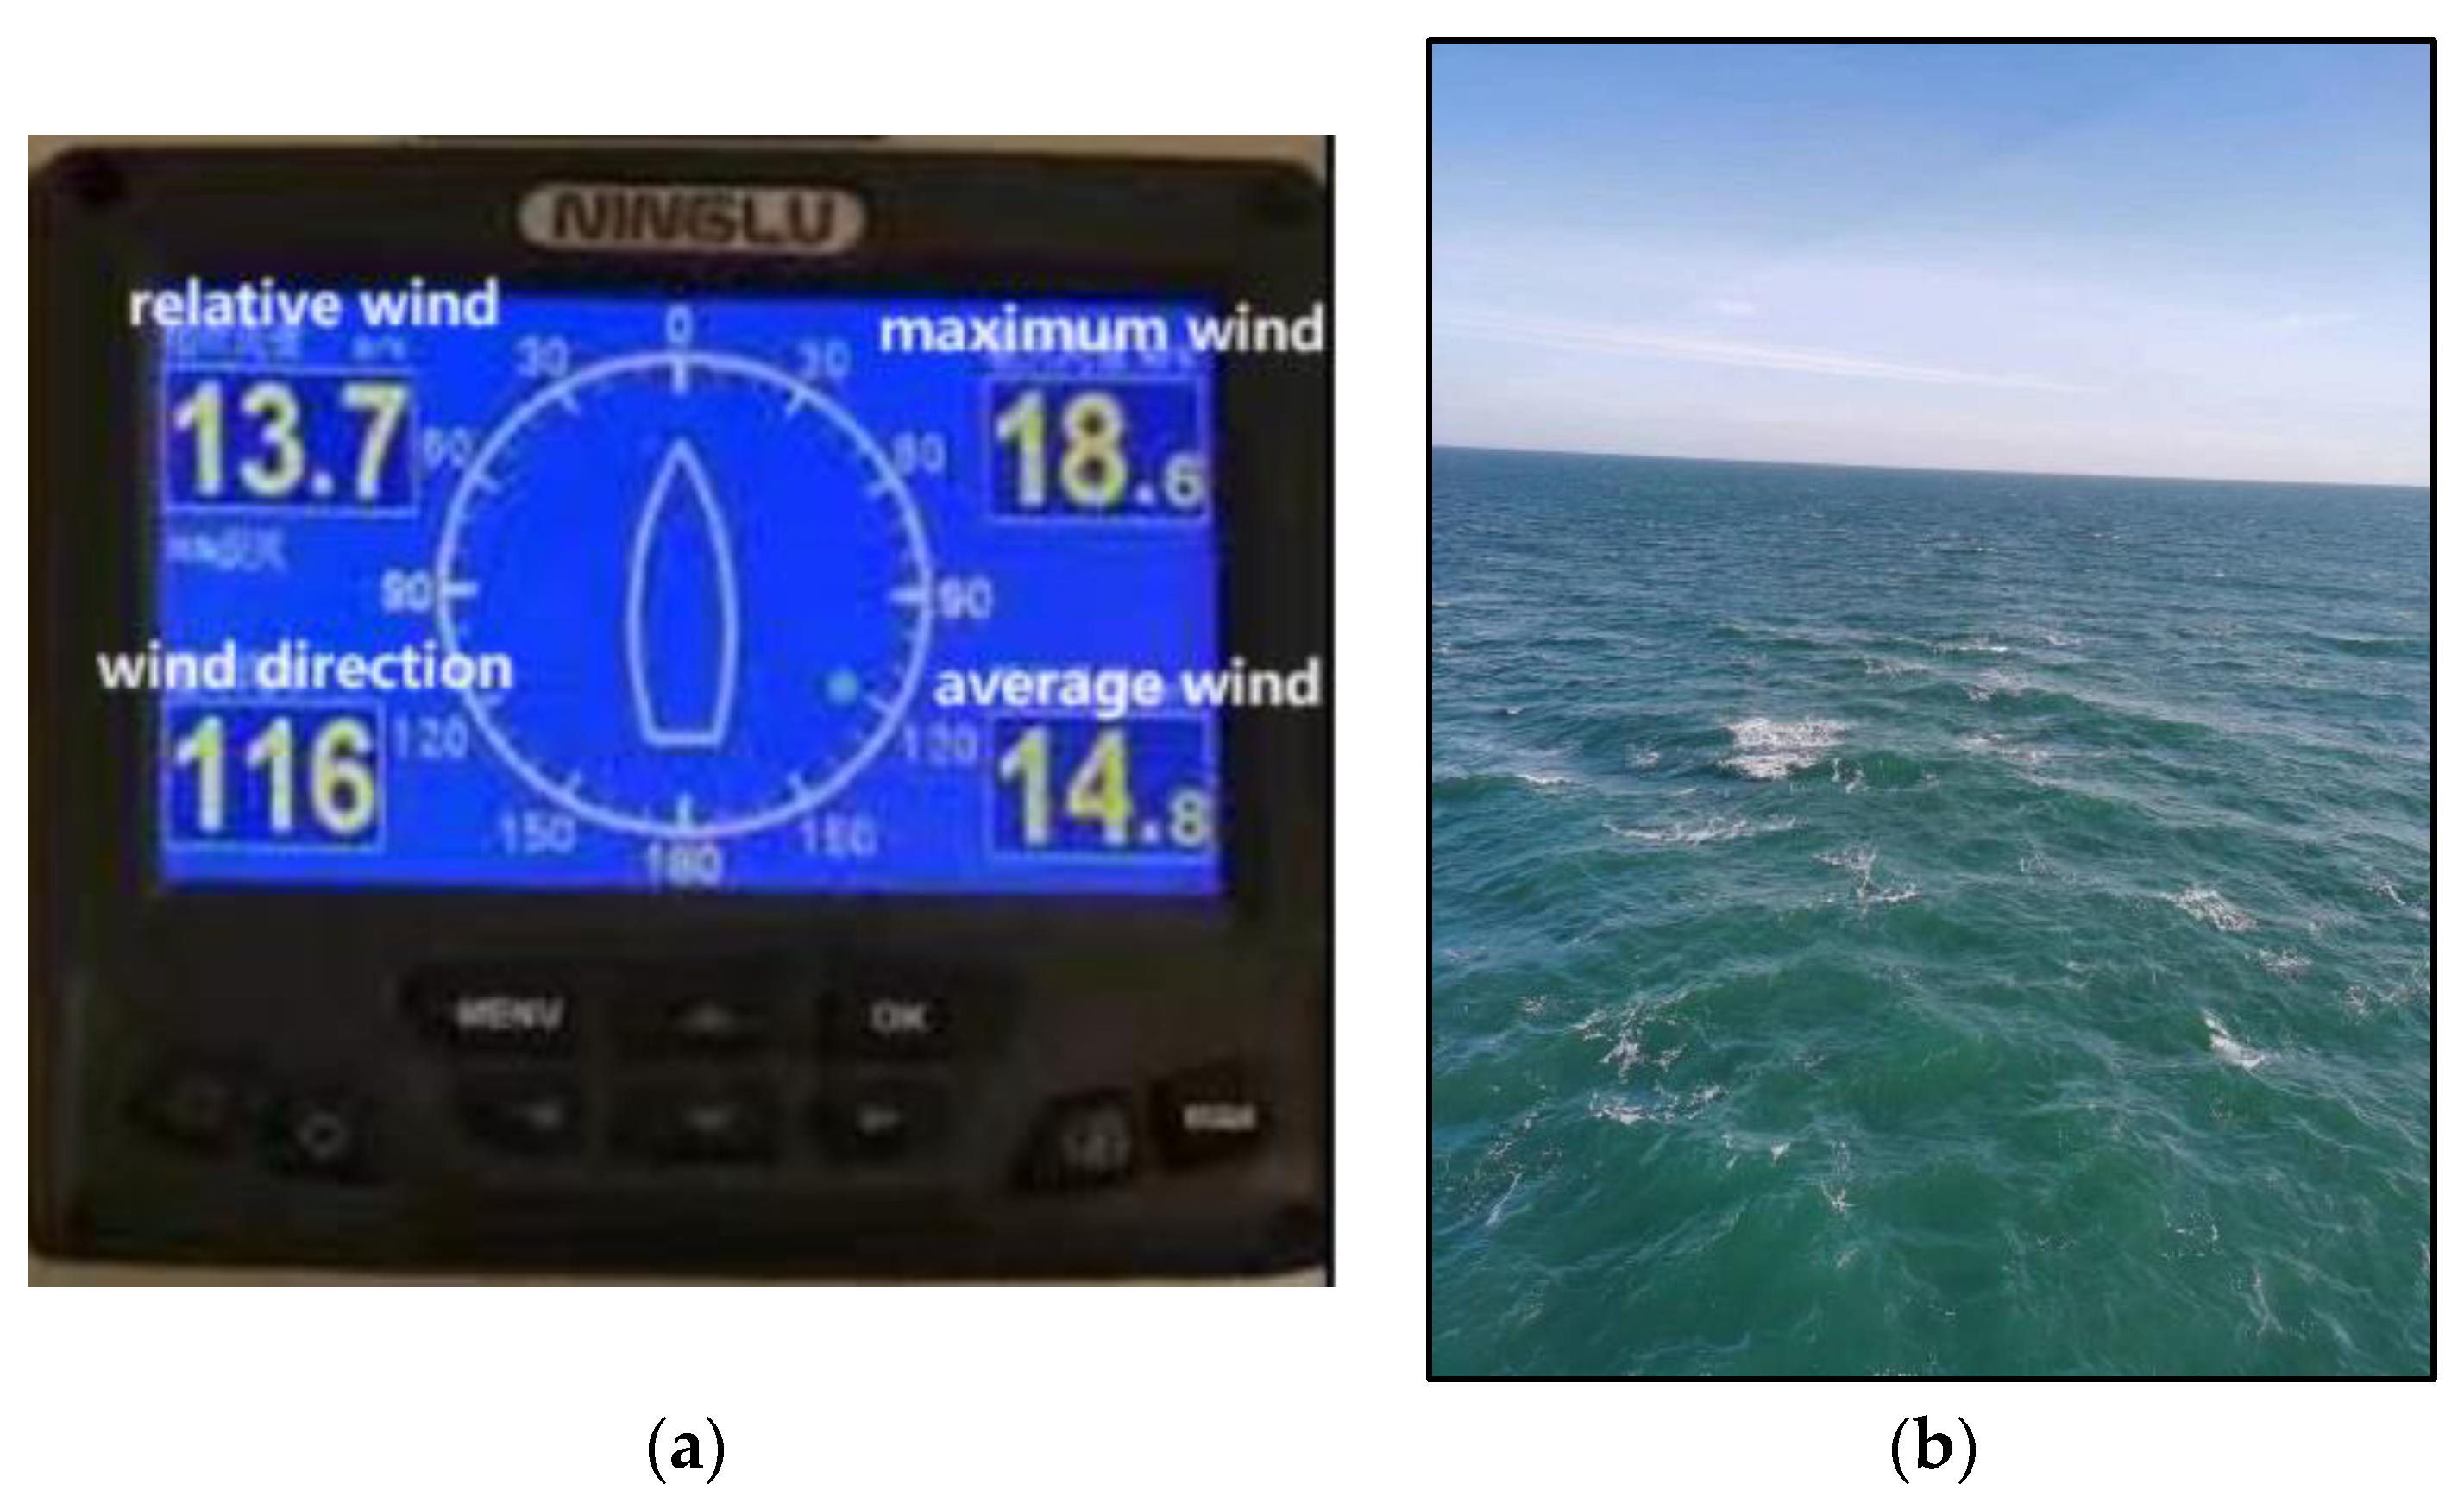
After setting up the intelligent and auto-response system on the server of Dalian Maritime University, multiple ship-based field tests were executed. Three vessels, including the 6300-tonnage training ship ‘Yukun’ from Dalian Maritime University, a 27,000-tonnage bulk carrier ship A (feedback in Figure 9), and an offshore wind power engineering ship B (feedback in Figure 10), volunteered to examinate the land-to-ship communication via INMARST C, F, and FBB stations, respectively.
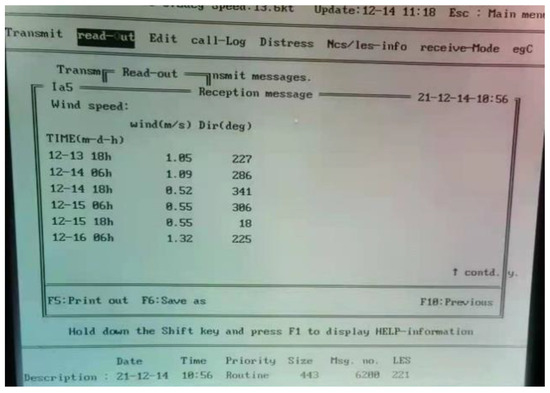
Figure 9.
Field test: snapshot of the INMARSAT-C station screen displaying the returned wind forecasts to ship A after it sent out a location request “120° E, 30° N” on 14 December 2021.

Figure 10.
Field test: forecasts of “WIND 7BF WAVE 50-99CM” returned to ship B in Yellow Sea, China compared with (a) observed wind speed of 14.8 m/s on average and 18.6 m/s at maximum, and (b) wave observation at 200,000 UTC, February 2023.
For comparison, the official NAVTEX weather report, which was free for all vessels across the Yellow Sea region, interaction from the old model by Jian et al. [18], and the interaction from the newly developed model are listed in Table 4. It can be observed that the NAVTEX report is very synoptic, the old model result is digital and concise, and the new model shows the best comprehensive performance.
Table 4.
Sea forecasts from (left) conventional report, (center) old model, and (right) newly developed system.
Multiple types of communication field tests were carried out (Table 5). In the future, this system needs to be applied on more ships and platforms for testing purposes, taking into account the suggestions from senior officers or other requirements based on the actual situation, and making adjustments and improvements accordingly, so that it can operate in a timely and smooth manner under various environmental conditions.
Table 5.
Timetable for email interaction on ship.
6.2. Obtain Forecast Results from Multiple Institutions
The system can also return the sea forecasting results of various national institutions at the same longitude and latitude coordinates, according to the methods described in Section 4, for referral purposes toward ship navigators. In real-time operation, if the requested location exceeds the range or is unreadable, then a format error prompt will be returned to the sender. Otherwise, the system will calculate the meteorological forecast results for agencies from China, Japan, Thailand, and the United States based on the ship’s requirements and send them back to the ship. A sample of multi-source forecasting application is shown in Table 6.
Table 6.
Examples of multi-source sea forecast interaction.
7. Conclusions and Future Research Discussion
7.1. Conclusions: An Automatic System with Artificial Intelligence
With advanced artificial intelligence methods, a real-time automatic response system was built to provide marine wind and wave forecasts in specific areas per request from the sailing ship. The system is capable of running at no cost and giving rapid response in just a few minutes. So far, this system only focuses on the northwest Pacific Ocean for wind and wave prediction, but it can be easily extended to more marine areas and institutional predictions, so a broad sustainable application is expected. In addition, there are also some shortcomings, such as hard language and the inability to achieve route planning.
Based on a numerical weather product and natural language method, Jian et al. [41] carried out a parrel study to convert the raw digital 7-day wind speed forecasts into a natural language description. However, it is not applied to the current forecasting system due to a lack of adequate time series data. In the future, a comprehensive meteorological language database would be expected to provide more humanized meteorological information services by implementing more artificial intelligence methods.
7.2. Future Research: Decision Problem with More Artificial Intelligence Algorithms
This study was performed under the assumption of letting the navigators on board to choose their preferred institutional forecasts, thus skipping the decision problem. In the future, advanced optimization algorithms (e.g., hybrid heuristics, metaheuristics, hyper-heuristics, adaptive algorithms, self-adaptive algorithms, island algorithms, polyploid algorithms) should be applied for challenging decision problems [42,43,44,45,46,47].
Heuristics algorithms, or simple heuristics algorithms, usually adapt to the current problem and try to fully utilize the particularity of this problem without reaching the global optimal solution. Due to their excessive greed, they often fall into a local optimal state. However, due to their efficiency and resource saving, they have already been widely applied in nautical weather routing problems, e.g., A* and greedy algorithm.
Metaheuristic algorithms are problem-independent techniques. Generally speaking, they are not greedy. In fact, they may even accept temporary deterioration of the solution in a specific problem. Metaheuristic algorithms find optimal solutions by modeling natural phenomena (e.g., heredity, ants looking for food, etc.), so they can be considered to simulate the marine navigators looking for a suitable route.
Hyper-heuristics find better solutions for special problems, while metaheuristics do not add any special conditions to find the general solution space for general problems. The particularity of hyper-heuristic algorithms lies in the fact that the space they find is not the solution space, but the heuristic or metaheuristic space.
There are many different domains where advanced optimization algorithms have been applied as solution approaches, such as online learning, scheduling, multi-objective optimization, transportation, medicine, data classification, and others. The proposed approach could be compared to various advanced optimization algorithms.
Author Contributions
Conceptualization, J.J. and Z.S.; methodology, K.S. and Z.S.; software, K.S. and Z.S.; validation, K.S. and Z.S.; formal analysis, K.S. and Z.S.; investigation, J.J.; resources, J.J.; data curation, K.S.; writing—original draft preparation, Z.S.; writing—review and editing, J.J.; visualization, Z.S.; supervision, J.J.; project administration, J.J.; funding acquisition, J.J. All authors have read and agreed to the published version of the manuscript.
Funding
This research was funded by the National Natural Science Foundation of China (Grant Nos. 42261144671, 42361144708, 42030602).
Institutional Review Board Statement
Not applicable.
Informed Consent Statement
Not applicable.
Data Availability Statement
Data are contained within the article.
Conflicts of Interest
The authors declare no conflicts of interest.
Nomenclature
| x | position longitude |
| y | position latitude |
| x1 | position longitude rounding |
| y1 | position latitude rounding |
| R1 | position longitude interpolation scale |
| R2 | position latitude interpolation scale |
| V1 | transverse wind speed |
| V2 | longitudinal wind speed |
| Vt | final wind speed |
| a | constant |
| b | constant |
| X1 | horizontal value of pixel matrix arrangement in Mercator projection chart |
| Y1 | longitudinal value of pixel matrix arrangement in Mercator projection chart |
| X2 | horizontal value of pixel matrix arrangement in Lambert projection chart |
| Y2 | longitudinal value of pixel matrix arrangement in Lambert projection chart |
| k | number of pixels with a length of 1° at any longitude in Mercator projection chart |
| p | number of pixels of equatorial 1 length on Mercator projection chart |
| MP | latitudinal lengthening rate |
| X | pixel point matrix arrangement horizontal values |
| Y | pixel point matrix arrangement vertical values |
| α | constant |
| β | constant |
| θ | variable |
References
- Liu, Y.; Zhang, Q.; Sun, D.M. The Development of E-navigation and Strategy Implementation. In Proceedings of the 1st DMU International Conference on Maritime Education and Training, Dalian, China, 15 October 2016; pp. 142–148. [Google Scholar]
- Luan, X. Fuzzy correction method for marine meteorological navigation data based on artificial neural network. Comput. Informatiz. Mech. Syst. 2019, 2, 123–126. [Google Scholar]
- Pleskachevsky, A.L.; Rosenthal, W.; Lehner, S. Meteo-marine parameters for highly variable environment in coastal regions from satellite radar images. ISPRS J. Photogramm. Remote Sens. 2016, 119, 464–484. [Google Scholar] [CrossRef]
- Hinnenthal, J.; Clauss, G. Robust Pareto-optimum routing of ships utilising deterministic and ensemble weather forecasts. Ships Offshore Struct. 2010, 5, 105–114. [Google Scholar] [CrossRef]
- Vidan, P.; Kasum, J.; Zujić, M. Meteorological Navigation and ECDIS. Promet-Traffic&Trans. 2010, 22, 5. [Google Scholar]
- Zis, T.P.; Psaraftis, H.N.; Ding, L. Ship weather routing: A taxonomy and survey. Ocean. Eng. 2020, 213, 107697. [Google Scholar] [CrossRef]
- Szlapczynska, J.; Szlapczynska, R. Preference-based evolutionary multi-objective optimization in ship weather routing. Appl. Soft Comput. 2019, 84, 105742. [Google Scholar] [CrossRef]
- Sasa, K.; Terada, D.; Shigeaki, S.; Wakabayashi, N.; Ikebuchi, T.; Chen, C.; Takayama, A.; Uchida, M. Evaluation of ship performance in international maritime transportation using an onboard measurement system—In case of a bulk carrier in international voyages. Ocean. Eng. 2019, 84, 294–309. [Google Scholar] [CrossRef]
- Grifoll, M.; Martorell, L.; Castells, M.; Martínez de Osés, F.X. Ship weather routing using pathfinding algorithms: The case of Barcelona—Palma de Mallorca. Trans. Res. Procedia. 2018, 33, 299–306. [Google Scholar] [CrossRef]
- National Investigation Report on “Oriental Star” Shipwreck Incident. 2015. Available online: http://sh.sina.com.cn/news/g/2015-12-30/detail-ifxmxxyq4773338.shtml (accessed on 7 July 2023).
- List of Shipwrecks in 2020. Available online: https://en.wikipedia.org/wiki/List_of_shipwrecks_in_2020 (accessed on 1 January 2024).
- List of Shipwrecks in 2021. Available online: https://en.wikipedia.org/wiki/List_of_shipwrecks_in_2021 (accessed on 1 January 2024).
- List of Shipwrecks in 2022. Available online: https://en.wikipedia.org/wiki/List_of_shipwrecks_in_2022 (accessed on 1 January 2024).
- Bertotti, L.; Cavaleri, L. Wind and wave predictions in the Adriatic Sea. J. Mar. Syst. 2009, 78, S227–S234. [Google Scholar] [CrossRef]
- Webster, P.J.; Jian, J.; Hopson, T.M.; Hoyos, C.D.; Agudelo, P.A.; Chang, H.R.; Curry, J.A.; Grossman, R.L.; Palmer, T.N.; Subbiah, A.R. Extended-range probabilistic forecasts of Ganges and Brahmaputra floods in Bangladesh. Bull. Am. Meteorol. Soc. 2010, 91, 1493–1514. [Google Scholar] [CrossRef]
- Zheng, X.X.; Yang, F. Research of wind speed and wind power forecasting. Adv. Mater. Res. 2012, 347, 611–614. [Google Scholar] [CrossRef]
- Ou, Y.; Xu, L.; Wang, J.; Fu, Y.; Chai, Y. A STL decomposition-based deep neural networks for offshore wind speed forecasting. Wind. Eng. 2022, 46, 1753–1774. [Google Scholar] [CrossRef]
- Jian, J.; Webster, P.J. A new marine auto-response quantitative wind forecast system. Procedia—Social. Behav. Sci. 2013, 96, 1362–1365. [Google Scholar] [CrossRef]
- Pulli, K.; Baksheev, A.; Kornyakov, K.; Eruhimov, V. Real-time computer vision with OpenCV. Commun. ACM 2012, 55, 61–69. [Google Scholar] [CrossRef]
- Nie, G.T.; Huang, H. A Survey of Object Detection in Optical Remote Sensing Images. Acta Anat. Sin. 2021, 47, 1749–1768. [Google Scholar]
- Girshick, R.; Donahue, J.; Darrell, T.; Malik, J. Rich Feature Hierarchies for Accurate Object Detection and Semantic Segmentation. In Proceedings of the 2014 IEEE Conference on Computer Vision and Pattern Recognition (ICCV), Columbus, OH, USA, 23–28 June 2014; pp. 580–587. [Google Scholar]
- Girshick, R. Fast R-CNN. In Proceedings of the 2015 IEEE international Conference on Computer Vision (ICCV), Santiago, Chile, 7–13 December 2015; pp. 1440–1448. [Google Scholar]
- Ren, S.Q.; He, K.M.; Girshick, R.; Sun, J. Faster R-CNN: Towards Real-Time Object Detection with Region Proposal Networks. IEEE Trans. Pattern Anal. Mach. Intell. 2017, 39, 1137–1149. [Google Scholar] [CrossRef] [PubMed]
- Liu, W.; Anguelov, D.; Erhan, D.; Szegedy, C.; Reed, S.; Fu, C.Y.; Berg, A. SSD: Single Shot MultiBox Detector. In Proceedings of the 14th European Conference on Computer Vision, Amsterdam, The Netherlands, 17 September 2016; pp. 21–37. [Google Scholar]
- Redmon, J.; Kumar, S.; Divvala, K.; Girshick, R.; Farhadi, A. You Only Look Once: Unified, Real-Time Object Detection. In Proceedings of the 2016 IEEE Conference on Computer Vision and Pattern Recognition (CVPR), Las Vegas, NV, USA, 27–30 June 2016; pp. 779–788. [Google Scholar]
- Jian, J.; Liu, L.; Zhang, Y.; Xu, K.; Yang, J. Optical Remote Sensing Ship Recognition and Classification Based on Improved YOLOv5. Remote Sens. 2023, 15, 4319. [Google Scholar] [CrossRef]
- Sirisha, U.; Praveen, S.P.; Srinivasu, P.N.; Barsocchi, P.; Bhoi, A.K. Statistical analysis of design aspects of various YOLO-based deep learning models for object detection. Int. J. Comput. Intell. Syst. 2023, 16, 126. [Google Scholar] [CrossRef]
- Huang, Z.X.; Jiang, X.N.; Wu, F.L.; Fu, Y.; Zhang, Y.; Fu, T.J.; Pei, J.Y. An Improved Method for Ship Target Detection Based on YOLOv4. Appl. Sci. 2023, 13, 1302. [Google Scholar] [CrossRef]
- Yu, J.; Zhang, W. Face mask wearing detection algorithm based on improved YOLO-v4. Sensors 2021, 21, 3263. [Google Scholar] [CrossRef] [PubMed]
- Malta, A.; Mendes, M.; Farinha, T. Augmented Reality Maintenance Assistant Using YOLOv5. Appl. Sci. 2021, 11, 4758. [Google Scholar] [CrossRef]
- Zhang, S.L.; Zhang, L.P.; Zeng, W.Q.; Guo, Z.; Fu, Z.Q. Identification and localization of walnut varieties based on YOLOv5. J. Chin. Agric. Mech. 2022, 43, 167. [Google Scholar]
- Wang, C.Y.; Liao, H.Y.; Wu, Y.H.; Chen, P.Y.; Hsieh, J.W.; Yeh, I.H. CSPNet: A new backbone that can enhance learning capability of CNN. In Proceedings of the IEEE/CVF Conference on Computer Vision and Pattern Recognition Workshops, Seattle, WA, USA, 14–19 June 2020; pp. 390–391. [Google Scholar]
- Han, J.; Pan, H.L. Revision of convection and vertical diffusion schemes in the NCEP Global Forecast System. Weather. Forecast. 2011, 26, 520–533. [Google Scholar] [CrossRef]
- Chaitanya, A.; Shetty, J.; Chiplunkar, P. Food Image Classification and Data Extraction Using Convolutional Neural Network and Web Crawlers. Procedia Comput. Sci. 2023, 218, 143–152. [Google Scholar] [CrossRef]
- Rezaee, M.J.; Eshkevari, M.; Saberi, M.; Hussain, O. GBK-means clustering algorithm: An improvement to the K-means algorithm based on the bargaining game. Knowl. Based Syst. 2021, 213, 106672. [Google Scholar] [CrossRef]
- Arjun, B.C.; Prakash, H.N. Multimodal Biometric Recognition: Fusion of Modified Adaptive Bilinear Interpolation Data Samples of Face and Signature using Local Binary Pattern Features. Int. J. Eng. Technol. 2020, 9, 3111–3120. [Google Scholar]
- Wada, T. On some information geometric structures concerning Mercator projections. Phys. A: Stat. Mech. Its Appl. 2019, 531, 121591. [Google Scholar] [CrossRef]
- Zhao, D.Z.; Wang, R.Q.; Wang, W.Z. Research on Path Planning of Mobile Robot Based on Binocular Perception. In Proceedings of the 2019 3rd International Conference on Artificial intelligence, Systems, and Computing Technology (AISCT 2019), Brasilia, Brazil, 12–13 October 2019; pp. 441–446. [Google Scholar]
- Liu, J.; Chen, H.; Wang, Y. Multi-source remote sensing image fusion for ship target detection and recognition. Remote Sens. 2021, 13, 4852. [Google Scholar] [CrossRef]
- Shi, P.; Zhao, Z.; Fan, X.; Yan, X.; Yan, W.; Xin, Y. Remote sensing image object detection based on angle classification. IEEE Access 2021, 9, 118696–118707. [Google Scholar] [CrossRef]
- Jian, J.; Wang, H.; Sun, Z.; Wu, G.; Su, X. Study on Automatic Generation of Marine Wind Forecast Text by Artificial Intelligence. Softw. Eng. 2021, 24, 9–12. [Google Scholar]
- Singh, P.; Pasha, J.; Moses, R.; Sobanjo, J.; Ozguven, E.E.; Dulebenets, M.A. Development of exact and heuristic optimization methods for safety improvement projects at level crossings under conflicting objectives. Reliab. Eng. Syst. Saf. 2022, 220, 108296. [Google Scholar] [CrossRef]
- Fathollahi–Fard, A.M.; Dulebenets, M.A.; Hajiaghaei–Keshteli, M.; Tavakkoli–Moghaddam, R.; Safaeian, M.; Mirzahosseinian, H. Two hybrid meta–heuristic algorithms for a dual–channel closed–loop supply chain network design problem in the tire industry under uncertainty. Adv. Eng. Inform. 2021, 50, 101418. [Google Scholar] [CrossRef]
- Singh, E.; Pillay, N. A study of ant-based pheromone spaces for generation constructive hyper-heuristics. Swarm Evol. Comput. 2022, 72, 101095. [Google Scholar] [CrossRef]
- Dulebenets, M.A. An Adaptive Polyploid Memetic Algorithm for scheduling trucks at a cross-docking terminal. Inf. Sci. 2021, 565, 390–421. [Google Scholar] [CrossRef]
- Chen, M.; Tan, Y. SF-FWA. A Self-Adaptive Fast Fireworks Algorithm for effective large-scale optimization. Swarm Evol. Comput. 2023, 80, 101314. [Google Scholar] [CrossRef]
- Dulebenets, M.A. A Diffused Memetic Optimizer for reactive berth allocation and scheduling at marine container terminals in response to disruptions. Swarm Evol. Comput. 2023, 80, 101334. [Google Scholar] [CrossRef]


Disclaimer/Publisher’s Note: The statements, opinions and data contained in all publications are solely those of the individual author(s) and contributor(s) and not of MDPI and/or the editor(s). MDPI and/or the editor(s) disclaim responsibility for any injury to people or property resulting from any ideas, methods, instructions or products referred to in the content. |
© 2024 by the authors. Licensee MDPI, Basel, Switzerland. This article is an open access article distributed under the terms and conditions of the Creative Commons Attribution (CC BY) license (https://creativecommons.org/licenses/by/4.0/).