Abstract
The corrosion properties of an EN AC AlSi9Cu3(Fe) alloy (reference sample (RS)) and samples produced by recycling chips of RS by direct hot extrusion (DHES) and subsequent thixoforming (TFS) were tested in 0.5 M NaCl solution. The plastic deformation changes the microstructure of RS, and brittle, coarse Si particles and intermetallic compounds (IMCs) were effectively broken into ultrafine-grained particles and redistributed homogeneously into the α-Al matrix in DHES. TFS exhibits a globular structure, and polyhedral clusters rich in Si and IMCs were observed along the grain boundary. Electrochemical measurements combined with surface characterisation show that the microstructure significantly influences the tested samples’ corrosive properties. It was confirmed that corrosion resistance increased in the following order: RS < TFS < DHES. Similarly, the corrosion potential becomes nobler, the corrosion current decreases, the passive area increases, and the oxide layer becomes more stable (higher resistance and thickness). Also, the percentage of the surface affected by corrosion and the volume of pits reduce. The effect of microstructure is particularly pronounced in the level of the corrosion current and the volume of pits formed. The corrosion current of DHES and TFS decreases by 4–5 times, while the pit volume of DHES and TFS decreases by several orders of magnitude compared to RS. The corrosion stability of DHES and TFS in relation to RS is a consequence of the comminution of the Si particles and the IMC. The refined and homogeneous microstructure contributes positively to forming a stable oxide film on DHES and TFS and increases their corrosion resistance in an aggressive environment. The applied recycling method represents an innovative and sustainable process for the recycling of semisolid materials, with lower energy consumption and less greenhouse gas emissions compared to conventional recycling. The fact that the products obtained through recycling have a significantly higher corrosion resistance further increases the economic and environmental impact of the process.
1. Introduction
Aluminium alloys are used globally due to their mechanical properties, conductivity, and low weight. This metal finds extensive use in various industries like automotive, aerospace, construction, and electronics industries [1]. Experts projected a 2–3 times increase in demand for aluminium in finished products by 2050. However, primary aluminium production from bauxite ore is very energy-demanding, leading to significant greenhouse gas emissions (approximately 1% of global greenhouse gas emissions) [2]. Meeting the challenge of reducing emissions by 50% by 2050 while satisfying the growing aluminium demand is a considerable task [3]. However, aluminium alloys can be recycled to reduce pollution and significantly reduce electrical energy consumption [4]. Primary aluminium production requires 31.1 GJ/ton. In contrast, secondary aluminium production uses less than 10 GJ/ton of energy, accounting for 5–10% of the energy used in primary aluminium output, which strongly shifts the balance toward higher sustainability [5,6,7]. This is the reason for the constant growth of the aluminium scrap market, with an average annual growth rate of 6% (from 18 million metric tons of aluminium scrap in 2009 to 33 million metric tons in 2019 available globally) [5]. Aluminium alloys are often produced by traditional casting and finished with the manufacturing process. This production results in enormous aluminium chip waste [8,9]. Traditional methods of recycling aluminium alloy machining waste by remelting lead to the intensive oxidation of small metal scraps, such as chips and filings, with a high area-to-volume ratio, which results in high metal losses during remelting, even up to 40% [10,11,12]. Various methods have been employed to manufacture new products with machine chips to improve recycling efficiency and economy. A sustainable approach for the recycling of aluminium alloy chips through the solid-state recycling process has been proposed. Compared with conventional recycling, the direct conversion of aluminium scrap into a compact metal may result in 40% material, 26–31% energy, and 16–60% labour savings [7]. In most cases, these methods are performed utilising hot extrusion and, in some cases, equal channel angular pressing (ECAP) which typically yields aluminium alloys with satisfying mechanical properties while keeping manufacturing costs relatively low [13,14,15].
However, it should be noted that the solid-state recycling process is limited in its capacity to producing only certain profiles, such as plates and bars. To address these limitations, this research introduced semisolid processes (SSMPs) into the recycling process. SSMP is a method that combines forming and casting and takes place in the temperature range between solidus and liquidus temperature. The main requirement is to obtain a solid globular (non-dendritic) phase surrounded by a liquid phase. In this case, the liquid acts as a lubricant, resulting in better flow, lower viscosity, and forces required to form the raw material [16]. SSMP offers numerous advantages, including lower energy consumption [17], reduced mould wear due to lower shaping temperatures [18], casting without turbulence and thus lower porosity in the castings due to a more viscous mixture [19], and improved mechanical properties [18,20,21,22]. There are many methods to explain the microstructure of the slurry, which can be categorised into two main categories: rheo processes and thixo processes. In the aluminium machining chip waste, the casted dendritic microstructure is highly deformed and distorted, and at the same time, intermetallic compounds (IMCs) are shredded and refined. The manufacturing of chips through machining results in cold work, affecting their entire volume [23]. While it is challenging to quantify the extent of chip deformation precisely, the internal structure typically exhibits characteristics commonly seen in heavily deformed materials.
The heating of the chips leads to significant changes in their microstructure, primarily manifesting itself in a transition from a cold-deformed structure with elongated crystal grains to recrystallised structure with equiaxed crystal grains [24]. By reheating above the solidus temperature, such a highly deformed structure, depending on the alloy, can be transformed into a globular structure, which fulfils the demands to produce the thixo raw material. Therefore, metal scraps should be an excellent starting material for producing thixo raw materials.
Most investigations focus on the mechanical properties and microstructure of the products obtained by direct aluminium recycling and neglect the corrosion properties, which are also very important and should be investigated. Chino et al. [25] compared the mechanical and corrosion properties of aluminium alloy 5083 obtained by solid-state recycling with those of a virgin extrusion produced from the ingot. Solid recycled specimens exhibited an excellent combination of high strength and high elongation to failure at room temperature, which was attributed to the refined microstructure, but lower corrosion properties, attributed to the excessive iron contamination that promoted galvanic corrosion [25]. Several researchers have investigated the influence of ECAP on the corrosion properties of aluminium alloys [26,27,28,29,30,31]. They found that the ECAP processing facilitated passivation, increased the thickness of the oxide layer, and the decreased corrosion rate, which was attributed to the significantly reduced grain size in solid recycled specimens.
The corrosion behaviour of thixoformed Al-Si alloys has been investigated by several authors [32,33,34]. They found out that the dominant corrosion attack in chloride-containing media was pitting corrosion, which developed mainly at the interface between the eutectic Si and the α-Al phase. They found a strong correlation between the size of the volume fraction and the shape of the eutectic Si on the corrosion behaviour of Al-Si alloys.
Zhou et al. [35] found that the recycled 7075-T6 Al alloy sheets exhibited good corrosion resistance to salt spray, and the second precipitates were the main cause of salt spray corrosion. The IMCs of the recycled 7075-T6 alloy are mainly composed of Al7Cu2Fe, (Al,Cu)6(Fe,Cu), and Mg2Si, and the formation of galvanic couples between the second phase particles and the α-Al matrix leads to anodic dissolution. Lin and associates [36] also point out the influence of composition and microstructure on the sensitivity of recycled Al alloys to corrosion attack. The 7XXX series alloys contain IMCs such as MgZn2 and Mg2Si which are anodic with respect to the matrix and Al7Cu2Fe and (Al,Cu)6(Fe,Cu) which are cathodic compared to the matrix. These IMCs represent initiation centres for the corrosion processes. In their study, Arrabal et al. [37] observed that the presence of Fe-rich IMCs in the alloy A356 has a major influence on the corrosion behaviour. They found that corrosion starts at the interface between the α-Al matrix and the Fe-rich IMCs due to microgalvanic corrosion processes. A similar influence of IMCs on the localised forms of corrosion of Al alloys was observed by Akiyama et al. [38], Brunner et al. [39], and Zazi [40]. Monticelli et al. [41] point out that the potential differences between IMCs and the α-Al matrix in the AlSi9Cu3(Fe) alloy can reach up to 400 mV, leading to an intense corrosion attack and localised corrosion forms.
The literature overview shows that corrosion of Al alloys is strongly affected by the type, quantity, and size of IMCs and their distribution. The technique of recycling semisolid metal scrap, which is a promising approach to material and energy savings, significantly changes the microstructure of recycled Al alloys and influences their corrosion behaviour significantly. Therefore, the main objective of this work is to investigate the corrosion properties of Al alloy EN AC AlSi9Cu3(Fe) machining chips recycled by hot extrusion and subsequent thixoforming and compare it with the cast reference sample.
2. Materials and Methods
The alloy selected was EN AC AlSi9Cu3(Fe), which is comparable to EN AC 44000 or A 380 depending on the standard used. The chemical composition of the alloy batch used is listed in Table 1 (this sample served as a reference sample, RS).

Table 1.
Chemical composition of RS.
The machining chips of the RS ingot were obtained on the Spinner VC 560 vertical machining centre. The milling parameters used for the cutting depth, cutting speed, and feed rate were ap = 1.5 mm, vc = 120 m/min, and f = 0.1 mm/tooth, respectively. A dry face milling process was performed to avoid contamination with coolant and lubricant. The aluminium chips were compacted on a hydraulic 1 MN universal press with a force of 300 kN. The result was compacted billets with a diameter of 38 mm and a height of 68 mm. After the compaction step, the chip-based billets were directly hot extruded. The billets were preheated at 450 °C for 20 min and directly hot extruded at 400 °C with an extrusion ratio of 7.1. Round rods with a diameter of 15 mm were produced, which were used as thixo feedstock material, as shown in Figure 1a (the sample at this stage of processing is labelled as DHES).
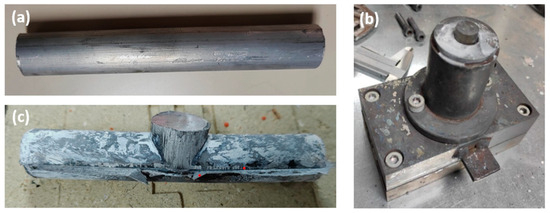
Figure 1.
(a) DHES, (b) SSMP tool, and (c) TFS.
An SSMP tool (Figure 1b) was designed to perform thixoforming. The tool has a vertical channel with a diameter of 16 mm and a height of 120 mm, which intersects with a horizontal channel with a diameter of 15 mm and a length of 90 mm, as shown in Figure 1b. The thixo feedstock bars were heated to the appropriate thixoforming temperature (570 °C; 20 min) and thixoformed in the SSMP tool. The sample was then removed from the SSMP tool and cooled in air, as shown in Figure 1c (the sample is labelled as TFS). According to the previous studies dealing with SSMP of RS, a temperature between 568 °C and 572 °C should be selected to achieve 40% to 50% solid phase in semisolid slurry [42,43].
RS, DHES, and TFS were machined on a universal turning lathe, and metal rods with a diameter of 10 mm were produced. Small cylindrical samples for the electrochemical measurements were cut from the round rods, connected with a copper wire, and embedded in polyacrylate resin so that only one base of the cylinder was exposed to the electrolyte as a working surface. The working surface of the electrode was ground using the Metkon Forcipol 1 V water grinder (Metkon, Bursa, Turkey) with 400 to 2500 grit sandpaper and polished with Presi alumina suspension 0.3 µm (Presi, Eybens, France) and then ultrasonically cleaned with ethanol and deionised water. The corrosion medium was a 0.5 M NaCl solution prepared by dissolving analytical grade NaCl salt (Kemika d.d., Zagreb, Croatia) in deionised water.
The electrochemical measurements were performed using the PAR M273A potentiostat/galvanostat coupled to the PAR M5210 lock-in amplifier (Princeton Applied Research, Oak Ridge, TN, USA). The measurements were carried out in a double-walled 3-electrode glass cell, which allowed connection to a Huber Kiss 6 thermostatic bath (Huber, Berching, Germany) and kept the temperature of the solution constant (20 °C). A saturated calomel electrode (SCE) was used as the reference electrode and a large Pt sheet as the counter electrode. The open circuit potential (OCP) was recorded for 60 min, with data collected every 10 s. Electrochemical impedance spectroscopy (EIS) measurements were performed on the OCP with an interference signal amplitude of 10 mV (rms) and a frequency range from 50 kHz to 30 mHz with an acquisition rate of 5 points per decade. Potentiodynamic polarisation (PD) tests were performed at a scanning rate of 0.5 mV s−1, starting at 250 mV below the OCP and ending at −400 mV.
The characterisation of the RS, DHES, and TFS surface prior to the electrochemical measurements was performed using an optical microscope in conjunction with scanning electron microscopy (SEM) and energy dispersion spectroscopy (EDS). For optical microscopy, the samples were electrolytically etched with Barker’s reagent (2.5% HBF4 in water) at 23 V for 1–2 min. The microstructure was characterised with polarised light using an Olympus BX61 optical microscope. SEM/EDS analyses were performed using the Thermo Scientific Quattro S field emission scanning electron microscope (FEG SEM, Hillsboro, OR, USA) in conjunction with the Ultim Max 65 SSD energy dispersive X-ray spectrometer from Oxford Instruments and the Aztec software platform ver. 6.0 (Abingdon, UK).
The surface of the tested samples was also analysed after the PD measurements. The condition of the corroded surface was analysed using the MXFMS-BD optical microscope (Ningbo Sunny Instruments Co., Ningbo, Zhejiang, China) and SEM/EDS analysis. In addition, the depth of pitting corrosion was investigated using the Profilm3D optical 3D profilometer (KLA Corporation, Milpitas, CA, USA). Prior to these investigations, a layer of corrosion products was removed from the electrode surface (the electrodes were immersed in deionised water, cleaned in an ultrasonic bath for 5 min, and dried in a laboratory dryer at 25 °C).
3. Results and Discussion
3.1. Materials Characterisation
Figure 2 shows the microstructure of the tested samples. RS shows a characteristic dendritic microstructure of primary α-Al surrounded by an acicular morphology of the eutectic phase (composed of Si and IMCs) (Figure 2a). However, the plastic deformation of the machining chips changes the microstructure of the sample, whereby the dendritic microstructure disappears completely, and the crystal grains are considerably fragmented. These changes can be seen in DHES (Figure 2b), which has a very uniform microstructure with refined crystal grains and IMCs.
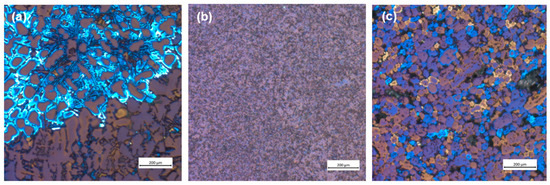
Figure 2.
Optical microscopy analysis of the (a) RS, (b) DHES, and (c) TFS.
However, the aim is to obtain a TFS directly from RS machining chip scrap (without remelting), and the confirmation of the qualitatively obtained sample is the globular (spherical) microstructure. As can be seen, TFS has a round, globular microstructure with an average globule size of about 50 µm (Figure 2c).
It is well known that the microstructure of various Al-Si alloys contains a matrix of dendritic α-Al surrounded by a eutectic (or polyhedral) Si phase and various secondary phases or IMCs, which are additionally enriched with Fe and Cu [37,38,39,40,41]. Such a complex structure has a significant influence on the mechanical and corrosive properties of the tested material. To better analyse the microstructure and determine the distribution and composition of the IMCs, the investigated samples were examined using SEM/EDS analysis. Figure 3 shows the surface texture of RS, DHES, and TFS at different magnifications (with the indicated area where the EDS analysis was performed; ochre rectangle, Table 2).
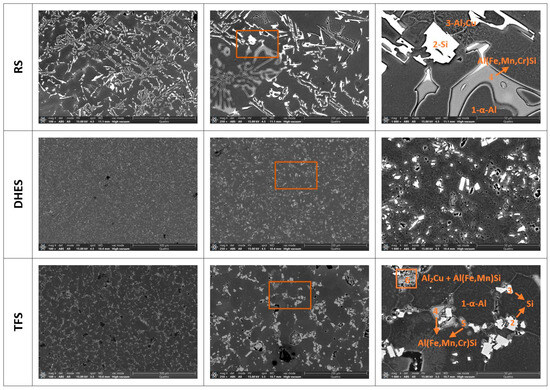
Figure 3.
SEM image for RS, DHES, and TFS with labelled parts of the EDS analysis (ochre-colured rectangle) with assumed phases according to the EDS analysis.
Table 2.
Elemental composition in marked positions of the surface of RS and TFS.
As can be seen in Figure 3, separate Si phases form on the RS around the dendritic α-Al (dark areas, spectrum 1) in the form of large coarse clusters of “flecks” and needle-like formations (white formations, spectrum 2), then Cu-rich phases (wrinkled structure, spectrum 3) and needle-like IMC formations, which are rich in Fe, Mn, Cr, and Si (greyish structures, spectrum 4).
In DHES, the eutectic Si and other IMCs are highly refined. DHES is produced directly from machining chips of RS, whereby the material undergoes several stages of plastic deformation. In the first step, i.e., the machining of RS ingots, chips are produced, and the material is subjected to severe deformation (the crystal grains and the intermetallic phases are cut into smaller pieces). The chips are then compacted in the second step in the form of a roller, which causes further deformation of the material and refinement of the crystal grains and coarse Si phases, as well as other IMCs. Finally, the DHE process produces a chip-based semifinished product (or DHES). It can be observed that the eutectic Si and IMCs are highly comminuted and uniformly distributed in the α-Al matrix, and the overall microstructure of the alloy is extremely homogeneous.
By reheating the DHES in the semisolid region and thixoforming in the SSMP tool, such a highly deformed structure is transformed into a globular TFS structure, which was confirmed by the development of circular boundaries between the individual α-Al phases (observed at a magnification of 1000×). It can also be observed that the α-Al phases have a diameter of ≈50 µm and that polyhedral and refined IMCs (instead of needles) accumulate along their boundaries.
3.2. Corrosion Behaviour
Electrochemical methods, i.e., OCP, EIS, and PD, were used to investigate the corrosion resistance of RS in 0.5 M NaCl at different stages of its recycling (plastic deformations through DHE and TF steps).
Figure 4 shows the change in the OCP curve during exposure of the test samples to NaCl solution for 1 h. Although the OCP curves are similar for all samples, RS shows certain differences. During the first 10 min, the RS potential rises sharply from −1.0 V to a value of about −0.9 V, after which it remains more or less constant with slight fluctuations. These changes can be attributed to the forming of a surface oxide layer in contact with the aqueous solution. The plastic deformation causes a potential shift in the positive direction. DHES and TFS behave similarly and very quickly reach a stable OCP value (−0.86 V for DHES and −0.88 V for TFS). Since the established OCP value represents the balance between the formation and dissolution of the surface passive film during exposure to the electrolyte solution, it is obvious that plastic deformation has a positive influence on material stability under spontaneous corrosion conditions.
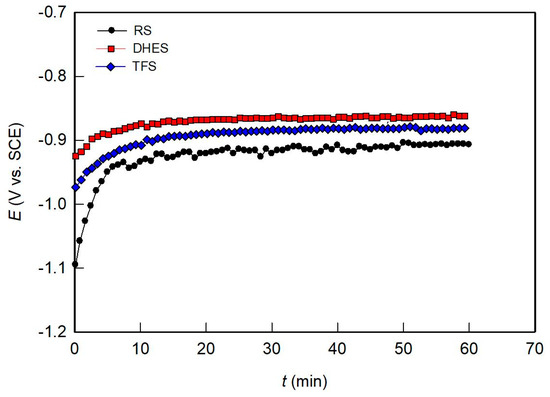
Figure 4.
Evolution of OCP over time for RS, DHES, and TFS in 0.5 M NaCl solution.
Due to its high sensitivity and non-destructive nature, EIS is an indispensable method for characterising the phase boundary between electrode and electrolyte. When analysing the results obtained (EIS spectra), the phase boundary is described by the electrical equivalent circuit (EEC), which can provide additional information on the mechanism of the corrosion process.
Figure 5 shows the Nyquist and Bode diagrams recorded after 60 min of OCP stabilisation of RS, DHES, and TFS in NaCl solution. The Nyquist diagrams show the existence of two depressed capacitive loops for all investigated samples (Figure 5a). The size and diameter of the capacitive semicircles are significantly larger for DHES and TFS than for RS, indicating increased corrosion resistance. In the Bode plots (Figure 5b), the capacitive properties of all samples are highlighted in a wide frequency range (at f < 1 kHz). The pronounced double capacitive behaviour of the investigated systems is determined by two Bode lines (with constant slope) and two-phase angles. It can be observed that the total impedance (|Z|), the maximum phase angles, and the peak area are larger for DHES and TFS compared to RS, confirming the favourable influence of plastic deformation on the corrosion resistance of the Al alloy.
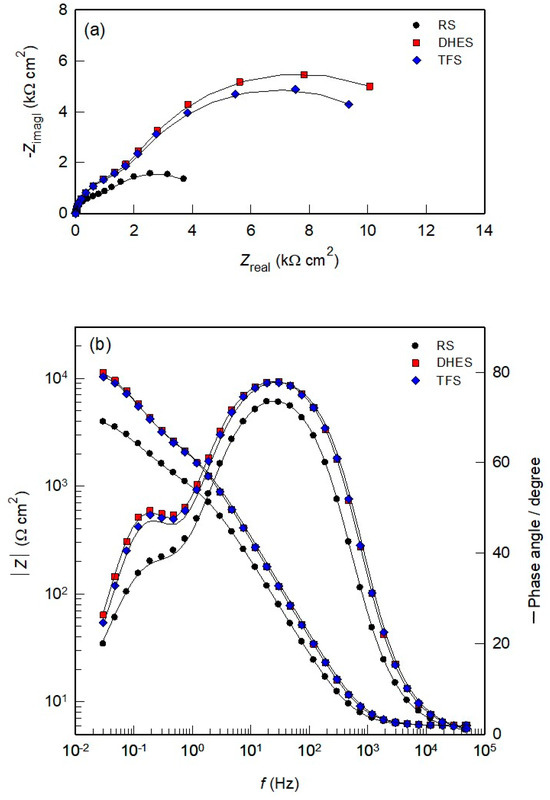
Figure 5.
(a) Nyquist and (b) Bode plots for RS, DHES, and TFS in 0.5 M NaCl solution.
Figure 5 shows the best-fit curves with the assumed EEC (Figure 6; χ2 < 10−3), which consists of two-time constants and is often used to describe the corrosion behaviour of Al alloys subjected to plastic deformation [44,45,46].
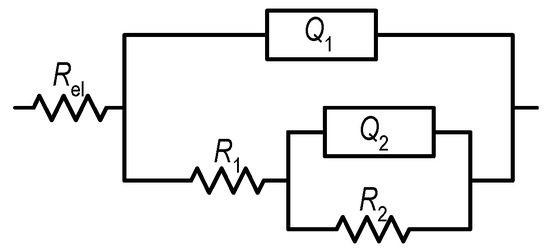
Figure 6.
The EEC model used to fit the EIS data.
The proposed EEC consists of resistance elements (R) and constant phase elements (CPE) as follows: electrolyte resistance (Rel ≈ 6 Ω cm2), surface layer resistance (R1), charge transfer resistance (R2), CPE of the surface layer (Q1), and CPE of the double layer (Q2). According to the size of the coefficients n1 and n2, the CPEs in the EEC represent the deviation of the capacitance from the ideal behaviour [47]. The calculated EEC parameters for the examined samples are listed in Table 3.
Table 3.
Parameters of the EEC for RS, DHES, and TFS in 0.5 M NaCl solution.
For RS, the values of R1 and R2 are 1.36 kΩ cm2 and 3.35 kΩ cm2, respectively, due to the formation of a surface oxide layer. In comparison, the samples that were subjected to plastic deformation have significantly higher values for the parameters R1 and R2. For example, the R1 values for DHES and TFS are 3.21 and 3.02 kΩ cm2, while the R2 values for the same samples are 10.52 and 9.41 kΩ cm2, which is about three times higher than for RS.
In parallel (Table 3), the capacitance of the surface layer (Q1) is lower than the capacitance of the double layer (Q2) for all samples. With plastic deformation, the capacitance of both layers (surface and double layer) decreased. Since the capacitance is inversely proportional to the thickness, the direction of the mentioned changes indicates that the resistance and thickness of the oxide layers on the observed samples increase in this order: RS < THS < DHES.
The results obtained show that the refined and homogeneous microstructure contributes positively to the formation of a stable oxide film on DHES and TFS and increases their corrosion resistance in an aggressive environment. Interestingly, slightly worse oxide films are formed on TFS (lower R1 and R2 values, higher Q1 and Q2 values) than on DHES, which can be attributed to the accumulation of polyhedral IMCs along the α-Al phase boundaries (Figure 3).
The PD curves of RS, DHES, and TFS in 0.5 M NaCl solution over a wider potential range are shown in Figure 7, while the corrosion parameters (the corrosion potential, Ecorr, the corrosion current density, icorr, the pitting potential, Epit) determined by analysing the polarisation curves are listed in Table 4.
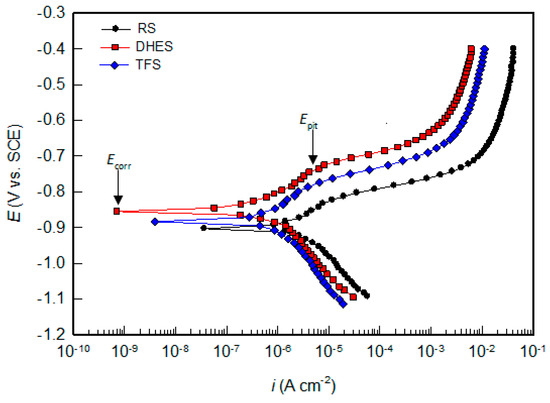
Figure 7.
PD curves for RS, DHES, and TFS in 0.5 M NaCl solution.
Table 4.
Corrosion parameters for RS, DHES, and TFS in 0.5 M NaCl solution.
The starting point for analysing the results obtained is the inflexion point on the PD curve, where the cathodic current changes to the anodic current and is determined by Ecorr (indicated by an arrow in Figure 7) and the corresponding value of icorr.
In general, Ecorr becomes nobler with increasing plastic deformation, while icorr decreases (Table 4). Although the influence of plastic deformation of RS (i.e., chips obtained by machining RS) on the Ecorr shift is very small (≈40 mV), icorr decreases by 4–5 times (from 3.50 to 0.67 µA cm−2 for DHES and 0.98 µA cm−2 for TFS).
In addition, pitting corrosion occurs in all samples, as indicated by the increase in current at the breakpoint in the anodic branch of the PD curve (indicated by an arrow in Figure 7). The potential of the predetermined breaking point (also known as pitting potential, Epit) shifts to the anode side as the degree of material deformation increases. In addition, material deformation (by DHE and TF) leads to a larger potential difference (ΔE) between Epit and Ecorr (ΔE = Epit − Ecorr) is an indicator of the pitting initiation rate; the higher it is, the slower the pitting initiation rate [48,49,50].
According to the literature, the natural oxide film formed on the surfaces of various Al-Si alloys has the properties of an n-type semiconductor [29,30,51], which favours the adsorption of Cl− ions and the formation of soluble chlorides and causes pitting corrosion. Higher ΔE with lower icorr content (Table 4) shows that oxide films with better protective properties (higher resistance and thickness) are formed on deformed samples, which is consistent with the results of the EIS measurements. Based on the results of the electrochemical measurements, it can be generally stated that the corrosion resistance of the tested materials increases in the following sequence: RS < TFS < DHES.
3.3. Surface Analysis after Corrosion Measurements
After reaching the upper limit of anodic polarisation (of −0.4 V), the RS, DHES, and TFS surfaces were examined by optical microscopy and SEM/EDS analysis. It should be emphasised that the corrosion products were not removed from the surface of the samples after the PD measurements.
The optical micrographs (Figure 8) show clear differences in the corrosion damage on the examined samples, with the largest damage on the surface of RS and the smallest on the surface of DHES. This condition is a consequence of the fact that a finer structure (resulting from deformation) increases the corrosion stability of the material.
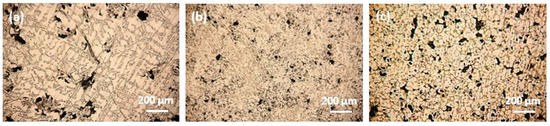
Figure 8.
Optical microscopy images of the electrode surfaces after PD measurements in NaCl: (a) RS, (b) DHES, and (c) TFS.
To better determine the morphology and investigate the influence of the microstructure (i.e., different stages of plastic deformation by DHE and subsequent TF) on corrosion during recycling of the alloy EN AC AlSi9Cu3(Fe), a SEM/EDS analysis was performed. Figure 9 shows the SEM images of the analysed samples at different magnifications (magnification areas are marked with rectangles), while Figure 10, Figure 11 and Figure 12 show the EDS mapping analysis of the corroded surfaces. As expected, anodic polarisation causes the highest damage to the RS at the same magnification. The damage is distributed over the entire surface and is mostly located near the separated Si phases and the IMCs. At higher magnifications, a layer of corrosion products (oxides) is more clearly visible above the damaged metal surface, which was confirmed by the EDS analysis (Figure 10).
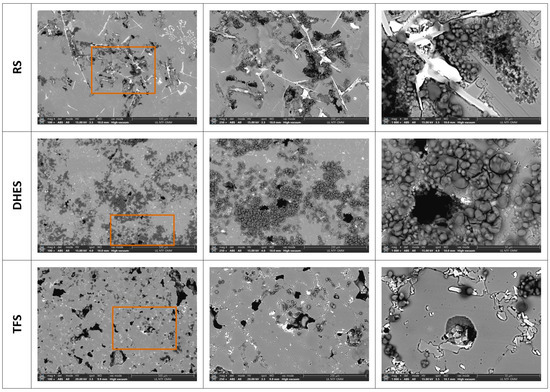
Figure 9.
SEM image of RS, DHES, and TFS surfaces (at magnifications of 100×, 250×, and 1000×) after PD measurements in NaCl (with marked magnification range).
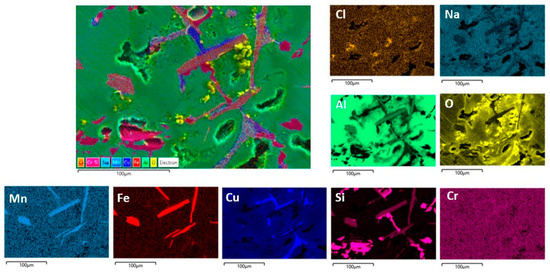
Figure 10.
SEM/EDS mapping analysis of the RS surface after PD measurements in NaCl solution.
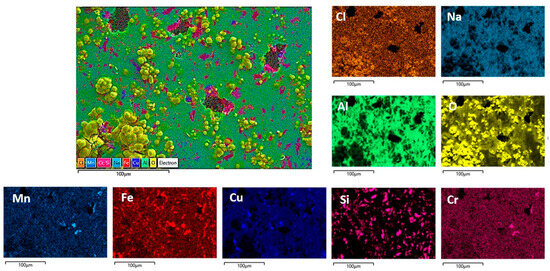
Figure 11.
SEM/EDS mapping analysis of the DHES surface after PD measurements in NaCl solution.
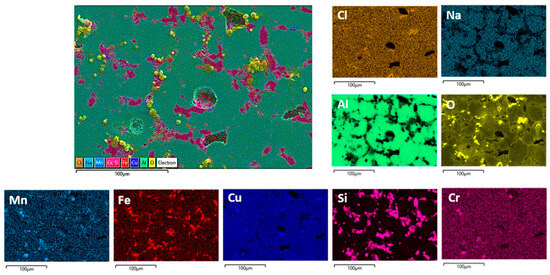
Figure 12.
SEM/EDS mapping analysis of the TFS surface after PD measurements in NaCl solution.
The centre of Figure 10 shows the observed SEM image of RS, while the smaller images show the distribution of the individual elements on the surface. As can be seen, the surface of RS exhibits a complex multiphase microstructure consisting of α-Al phases, and numerous intermetallic phases with isolated areas of high Si, Cu, Fe, Mn, and Cr content are observed. The colours corresponding to these elements overlap in different ways (and in different proportions) at certain locations, indicating the formation of different IMCs. Cu appears mainly as an independent phase in α-Al, while the distribution of Fe completely overlaps with the distribution of Mn and partially with Cr. The distribution of Si is not close to any element (except in some places where it coincides with Fe, Mn, and Cr), which indicates the presence of eutectic Si particles. So, according to the results obtained and in agreement with the literature, the formation of Al2Cu and various Fe-containing phases (AlFeSi, Al(Fe,Mn,Cr)Si) with Si is possible [37,38,39,40,41]. The greatest surface damage has been observed in the vicinity of intermetallic phases rich in Cu and Fe, which is associated with a higher oxygen content (i.e., the formation of Al2O3 due to the Al dissolution).
Aluminium alloys are subject to pitting corrosion and intergranular corrosion in aggressive environments, and the conditions for their formation are similar from an electrochemical point of view. As can be seen in Figure 3, the intermetallic RS phases (Cu- and Fe-rich phases and eutectic Si particles) are locally distributed around the dendritic α-Al phase. These phases are more noble than α-Al and can form micro galvanic cells. Due to the differences in electrochemical potential, the interface between these phases is susceptible to pitting corrosion and further intergranular corrosion. The intermetallic phases are more noble than aluminium and support the cathode reaction (hydrogen evolution or oxygen reduction) in the corrosion process and accelerate the corrosion of the surrounding α-Al matrix [31,38,39,41]. According to Monticelli et al. [41], the most efficient cathodic areas in AlSi9Cu3(Fe) alloy are the Al2Cu phase, nobler than the α-Al matrix by about +400 mV. The Fe-rich phases are about +300 mV nobler than the matrix. The potential difference between the eutectic Si particles and the matrix is about +250 mV, but their cathodic activity is lower due to the high overpotential for the reduction reaction.
Pitting corrosion therefore primarily attacks aluminium near the Cu- and Fe-rich phases, and then the Si phases (dangerous combination of large cathode/small anode) form an oxide layer at the edges of the pits that seals the hole. Due to the autocatalytic process (with an increase in acidity and chloride ion content in the pits), corrosion progresses along the grain boundary and penetrates into the deeper layers of the material [49,52,53,54], which can also be seen in Figure 9 and Figure 10.
It was found that the localised corrosion correlates more strongly at the boundaries of die-parting line zones than with neighbouring ones. This is probably due to the continuous network formed by the morphology of the cathodic Al2Cu phase and/or the higher initial levels of Cu and Cr (and thus higher amounts of Cu- and Fe-rich (with Cr) IMCs). The studies of the impact of intermetallic particle size and distribution on pitting corrosion have shown that the presence of the isolated intermetallic particles was inadequate to initiate a stable pitting activity on the alloy surface [41,55,56,57]. Conversely, the existence of these particles in groups or clusters, that form a continuous network in the material (which is also the case in this work), can promote the development of more active pitting.
The morphology of the corroded surfaces of DHES and TFS is also shown in Figure 9. Compared to RS, these samples (at the same magnification) show a less damaged surface (pits or cracks) and a more uniform oxygen distribution, which is particularly pronounced in DHES (Figure 9 and Figure 11). The SEM/EDS results are consistent with the electrochemical measurements, which showed that DHES and TFS have a nobler OCP, a lower corrosion current, and a more stable oxide film than RS.
During the formation of DHES, the RS machining chips undergo a series of deformations (mechanical cutting, compaction, extrusion at elevated temperature with dimensional changes), during which the eutectic Si and intermetallic phases are significantly refined and uniformly redistributed into the fine-grained α-Al matrix so that the resulting DHES microstructure is homogeneous and refined (Figure 3). In this way, a larger number of galvanic microcells are formed between ultrafine Si particles (or IMCs) and α-Al grains, resulting in a favourable small cathode/large anode combination and reducing the susceptibility to pitting corrosion [28]. It should not be forgotten that this process generates a larger number of grain boundaries, a greater proportion of unbalanced grain boundaries, dislocations, and residual stresses in the machined sample. According to the literature, the aforementioned phenomena in the different plastic deformations provide favourable conditions for the formation of stable, compact, and denser oxide films that increase the corrosion resistance of Al [58,59] and Al–Si alloys [28,29,30,31,38,60] in NaCl solution, which was confirmed by SEM/EDS for the DHES (Figure 9 and Figure 11) (in addition to the electrochemical tests). As can be seen in Figure 2 and Figure 3, Si and IMCs are finely dispersed and uniformly distributed in the fine-grained α-Al phase. After anodic polarisation, some small pits can be seen, while the oxide layer largely covers the surface of the sample.
Reheating DHES in a semisolid temperature range and thixoforming in the SSMP tool achieves the desired globular (spherical) TFS structure (Figure 2), which is confirmed by the development of clear circular boundaries between individual α-Al phases (Figure 3). Polyhedral IMC was also observed to accumulate along the boundaries of the α-Al phases, which influences the slightly poorer corrosion resistance of TFS compared to DHES. As can be seen from Figure 9 and Figure 12, the anodic polarisation of TFS leads to the occurrence of pitting corrosion near areas rich in Cu, Fe, or Si and IMCs. A larger amount of oxygen was observed along the damaged parts of the surface.
Electrochemical measurements and SEM/EDS analysis showed that all samples are subject to corrosion attack and that the percentage of surface affected by corrosion is highest in RS. Indeed, RS has a very inhomogeneous structure with a large proportion of cathodic phases, i.e., coarse (flecked and needle-like) Si and IMCs in a less noble α-Al matrix. This RS structure contributes to the development and progression of pitting corrosion by creating a dangerous combination of large cathode/small anode. The plastic deformation reduces the size of all particles and thus the ratio of the surface area of the noble IMCs and Si particles (cathode) relative to the less noble α-Al phase (anode), which significantly improves the material’s resistance to pitting corrosion. In other words, reducing the ratio between the surface area of the cathode and the anode (Ac/Aa) facilitates the passivation of the material and improves the corrosion resistance [28], which increases for the tested materials in the following order: RS < TFS < DHES.
However, information on actual damage (i.e., the depth, width, and volume of pits) can be obtained by recording the surface topography with an optical profiler. To obtain more accurate data, layers of corrosion products were removed from the surface immediately before the measurement. The non-contact 3D profilometer analysis technique is an ideal, user-friendly method for maximising surface investigation when pitting analysis is required, and it also offers the advantages of combined 2D and 3D capability.
The shape, size, and density of the pits were strongly influenced by the type of plastic deformation of the EN AC AlSi9Cu3(Fe) alloy, e.g., as-cast only, DHE, or TF conditions. The anodic polarisation of RS led to the development of large and rough surface damage of different depths and widths which occurred around the cathodic phases (Si and IMCs) according to SEM/EDS analysis. In addition, there is a large amount of damage on the surface with an average depth of 70–100 μm and a width of about 200 μm, which is interconnected with large and rough damage (Figure 13a). Additional analyses showed that the volume of the pits is 1,464,000 μm3 (position 1) and 1,377,000 μm3 (position 2), while the total surface damage is 41%. On the other hand, individual extremely deep (up to 250 μm) but somewhat narrower (up to 100 μm) pits can also be observed (Figure 13b; most likely formed by dissolution in the α-Al matrix with separation of cathodic Cu or Si phases). Many shallow and narrow pits can be observed under such coarse damage. The volume of the deepest pit (position 3) is 1,683,000 μm3, and the surface damage is 20.84%.
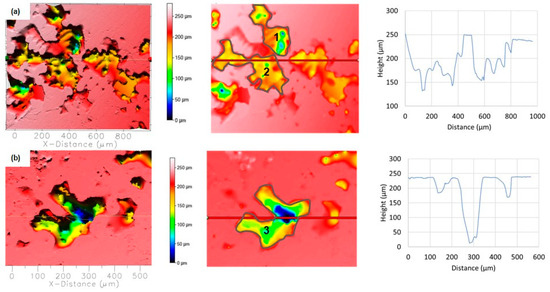
Figure 13.
Topographic view of the two different segments of the corroded RS surfaces in NaCl solution after PD measurement: (a) several connected pits, (b) single deep pits. The depth and width of the pits are determined along the red lines, while the locations where the volume of the pits is determined are marked with numbers.
Electrochemical measurements and SEM/EDS analysis showed that the surface of DHES is covered with an oxide layer that adheres well to the surface and remains stable even after anodic polarisation. However, after removal of the oxide layer, a surface with a large number of tiny pits can be seen. Figure 14 shows that the pits have an average width of ≈10 μm and a maximum depth of ≈13 μm. The surface is 27.77% damaged overall. Additionally, the marked part of the surface (almost half of the DHES damaged sections) has a pit volume of 10,600 μm3, which is two orders of magnitude smaller than that of RS. The results obtained indirectly confirm the highly separated and refined microstructure of DHES and as mentioned above, the corrosion stability of the sample.
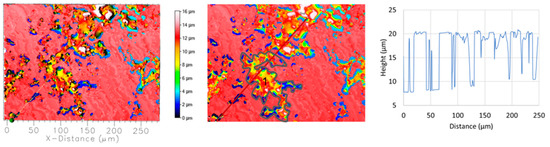
Figure 14.
Topographic view of the segment of DHES corroded surfaces in NaCl solution after PD measurement. The depth and width of the pits are determined along the red lines, while the location where the volume of the pits is determined is labelled with number 1.
Subsequent heating of DHES in the semisolid temperature range transforms the highly deformed microstructure into a globular structure, and refined IMCs accumulates at the grain boundary of the α-Al phase. The topography of two different segments of the corroded surface for TFS is shown in Figure 15.
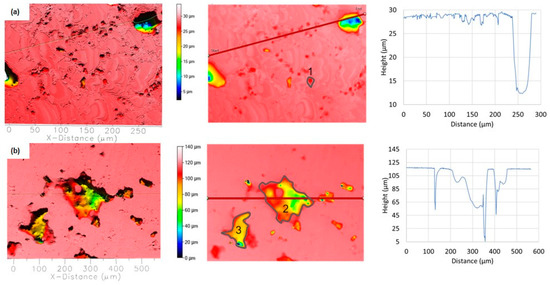
Figure 15.
Topographic view of the two different segments of TFS corroded surfaces in NaCl solution after PD measurement: (a) small pits along the grain boundary and (b) connected deep pits. The depth and width of the pits are determined along the red lines, while the locations where the volume of the pits is determined are labelled with numbers.
A series of tiny round pits with a maximum depth of up to 3 µm and a width of up to 5 µm can be seen along the grain boundary (Figure 15a). The volume of such pits is about 155 μm3 (position 1), and the total surface damage is 10.6%. In addition, larger corrosion areas can be observed with a width of around 200 µm, which, according to the image, were probably formed by the coalescence of individual smaller pits (Figure 15b; at the locations of the accumulation of polyhedral clusters rich in Si, Cu, and IMCs along the α-Al grain boundary). At the same time, individual pits with a depth of up to ≈60 µm and a width of around 100 µm as well as narrow breakthroughs in the sample depth of ≈60 µm and ≈120 µm were detected. In this case, the volume of the pits marked in Figure 15b is 293,500 μm3 (position 2) and 119,600 μm3 (position 3), which is an order of magnitude less compared to RS, while the total surface damage is 14.64%.
There are strong correlations between the microstructure, the corrosion rate, and the corrosion morphology of the analysed samples. The measurements carried out in this work indicate the importance of optical profilometry analysis in revealing the above relationships.
The aforementioned analysis confirmed that the groups or clusters of cathodic phases (i.e., coarse (flecked and needle-like) Si and Cu and Fe intermetallic phases), forming a continuous network in the material, could stimulate the active dissolution and significant damage of RS (pits are connected, spread, and penetrate into the depth of the sample). It was also found that the presence of isolated cathodic intermetallic particles, as well as the finely chopped microstructure, is not sufficient to develop a stable pitting activity on the alloy surface [41,55,56,57].
Plastic deformation of RS machining chips results in the formation of a homogeneous and refined DHES microstructure. In this case, profilometry analysis suggests changes in corrosion morphology. Extremely shallow and small damage is evenly distributed over the surface, indicating that the DHES is subject to general corrosion. Reheating DHES in a semisolid temperature range and thixoforming achieves the desired globular TFS structure, as well as the accumulation of polyhedral IMCs along the boundaries of spherical α-Al phases, which according to profilometry analysis (in addition to the general form of corrosion) causes the appearance and development of local corrosion.
As described in the introduction, secondary aluminium production is necessary because of its economic and ecological benefits. The direct conversion of aluminium chips into semifinished products can eliminate the cost of the remelting process and reduce CO2 emissions. The idea presented in this paper could therefore be described as an innovative process for recycling semisolid aluminium materials that consumes less energy and emits fewer greenhouse gasses into the atmosphere than conventional recycling. The fact that the semifinished products obtained through recycling have a significantly higher corrosion resistance is an additional advantage for the ecological acceptance of the process presented as the cost and environmental impact of corrosion are reduced and the sustainability of aluminium materials is improved. Namely, when analysing the effects of corrosion on society, three factors are usually considered: financial costs, environmental pollution, and direct effects that cause damage or death. For instance, the most recent corrosion research conducted in the United States (by NACE International and the U.S. Federal Highway Administration) found that the direct annual cost of metal corrosion in the country is USD 276 billion, equivalent to 3.1% of GDP [61]. Therefore, the presented method helps to reduce the cost and environmental impact of corrosion and improve the sustainability of materials.
Further research is planned to ensure that the process of recycling semisolid aluminium materials is fully justified from a technical point of view. Metallographic analyses will be carried out to determine the average globule size and the shape factor of the samples. In addition, the mechanical properties (e.g., compressive strength, hardness, tensile strength) and the electrical conductivity of the samples will be tested.
4. Conclusions
In this work, machining chips of the alloy EN AC AlSi9Cu3(Fe) were successfully recycled into thixoformed material using an innovative direct process without remelting (plastic deformations through DHE and TF steps).
DHES has a homogeneous microstructure with a high degree of fineness of α-Al matrix, the Si phase, and the IMCs. TFS has a globular structure with a globule size of about 50 µm, and polyhedral clusters rich in Si and IMCs were observed along the grain boundary.
Electrochemical measurements in combination with SEM/EDS and surface topography analyses showed that all samples are subject to corrosion attack, with corrosion resistance increasing in the following order: RS < TFS < DHES. Likewise, the corrosion potential becomes more noble, the corrosion current decreases, the passive area increases, and the oxide layer becomes more stable (higher resistance and thickness). The percentage of the surface affected by corrosion, and the volume of pits also decreases.
The improved corrosion stability of DHES and TFS (compared to RS) is due to reduced Si particles and IMCs. In fact, the refined and homogeneous microstructure contributes positively to the formation of a stable oxide film on DHES and TFS and increases their corrosion resistance in an aggressive environment.
Author Contributions
Conceptualisation, S.G., J.K. and I.D.L.; methodology, S.G., L.V., J.K. and A.N.; software, L.V., J.K., A.N. and B.L.; validation, S.G., L.V., J.K., A.N. and B.L.; formal analysis, S.G., J.K. and A.N.; investigation, S.G., L.V., J.K., A.N. and I.D.L.; resources, L.V., J.K., A.N., I.D.L. and B.L.; data curation, S.G., L.V., A.N. and J.K.; writing—original draft preparation, S.G., J.K. and I.D.L.; writing—review and editing, S.G., L.V., J.K, A.N., I.D.L. and B.L.; visualisation, S.G., J.K. and A.N.; supervision, S.G., L.V., J.K., A.N., I.D.L. and B.L.; project administration, S.G. and B.L.; funding acquisition, S.G., L.V. and B.L. All authors have read and agreed to the published version of the manuscript.
Funding
This work was financially supported by the Croatian Science Foundation through the project recycling of aluminium alloys in the solid and semisolid state (IP-2020-02-8284).
Institutional Review Board Statement
Not applicable.
Informed Consent Statement
Not applicable.
Data Availability Statement
The data presented in this study are available on request from the corresponding author.
Conflicts of Interest
The authors declare no conflicts of interest.
References
- Varshney, D.; Kumar, K. Application and use of different aluminium alloys with respect to workability, strength and welding parameter optimization. Ain Shams Eng. J. 2021, 12, 1143–1152. [Google Scholar] [CrossRef]
- Brough, D.; Jouhara, H. The aluminium industry: A review on state-of-the-art technologies, environmental impacts and possibilities for waste heat recovery. Int. J. Thermofluids 2020, 1–2, 100007. [Google Scholar] [CrossRef]
- Cullen, J.M.; Alloweood, J.M. Mapping the global flow of aluminum: From liquid aluminum to end-use goods. Environ. Sci. Technol. 2013, 47, 3057–3064. [Google Scholar] [CrossRef] [PubMed]
- Stacey, M. Aluminium Recyclability and Recycling—Towards Sustainable Cities; Cwningen Press: Nottingham, UK, 2015. [Google Scholar]
- Raabe, D.; Ponge, D.; Uggowitzer, P.J.; Roscher, M.; Paolantonio, M.; Liu, C.; Antrekowitsch, H.; Kozeschnik, E.; Seidmann, D.; Gault, B.; et al. Making sustainable aluminum by recycling scrap: The science of “dirty” alloys. Prog. Mater. Sci. 2022, 128, 100947. [Google Scholar] [CrossRef]
- Bogdanoff, T.; Tiryakioglu, M.; Liljenfors, T.; Jarfors, A.E.W.; Seifeddine, S.; Ghassemali, E. On the effectiveness of rotary degassing of recycled Al-Si alloy melts: The effect on melt quality and energy consumption for melt preparation. Sustainability 2023, 15, 5189. [Google Scholar] [CrossRef]
- Shamsudin, S.; Lajis, M.A.; Zhong, Z.W. Solid state recycling of light metals: A review. Adv. Mech. Eng. 2016, 8, 1–23. [Google Scholar] [CrossRef]
- Paraskevas, D.; Vanmeensel, K.; Vleugels, J.; Dewulf, W.; Deng, Y.; Duflou, J.R. Spark plasma sintering as a solid-state recycling technique: The case of aluminum alloy scrap consolidation. Materials 2014, 7, 5664–5687. [Google Scholar] [CrossRef] [PubMed]
- Kumar, N.; Bharti, A. Review on powder metallurgy: A novel technique for recycling and foaming of aluminium-based materials. Powder Metall. Met. Ceram. 2021, 60, 52–59. [Google Scholar] [CrossRef]
- Haase, M.; Tekkaya, A.E. Recycling of aluminum chips by hot extrusion with subsequent cold extrusion. Procedia Eng. 2014, 81, 652–657. [Google Scholar] [CrossRef]
- Haraldsson, J.; Johansson, M.T. Review of measures for improved energy efficiency in production-related processes in the aluminium industry—From electrolysis to recycling. Renew. Sustain. Energy Rev. 2018, 93, 525–548. [Google Scholar] [CrossRef]
- Duflou, J.R.; Tekkaya, A.E.; Haase, M.; Welo, T.; Vanmeensel, K.; Kellens, K.; Dewulf, W.; Paraskevas, D. Environmental assessment of solid state recycling routes for aluminium alloys: Can solid state processes significantly reduce the environmental impact of aluminium recycling? CIRP Ann. Manuf. Technol. 2015, 64, 37–40. [Google Scholar] [CrossRef]
- Moungomo, J.B.M.; Kouya, D.N.; Songmene, V. Aluminium machining chips formation, treatment & recycling: A review. Key Eng. Mater. 2016, 710, 71–76. [Google Scholar] [CrossRef]
- Shamsudin, S.; Zhong, Z.W.; Rahim, S.N.A.; Lajis, M.A. The influence of temperature and preheating time in extrudate quality of solid-state recycled aluminum. Int. J. Adv. Manuf. Technol. 2017, 90, 2631–2643. [Google Scholar] [CrossRef]
- Krolo, J.; Lela, B.; Dumanić, I.; Kozina, F. Statistical analysis of combined ECAP and heat treatment for recycling aluminium chips without remelting. Metals 2019, 9, 660. [Google Scholar] [CrossRef]
- Vaz, M.; De Souza Neto, E.A.; Muñoz-Rojas, P.A. Advanced Computational Materials Modelling: From Classical to Multi-Scale Techniques; Wiley-VCH: Weinheim, Germany, 2011. [Google Scholar]
- Jiao, L.; Wang, X.; Qian, Y.; Liang, Z.; Liu, Z. Modelling and analysis for the temperature field of the machined surface in the face milling of aluminium alloy. Int. J. Adv. Manuf. Technol. 2015, 81, 1797–1808. [Google Scholar] [CrossRef]
- Salleh, M.S.; Omar, M.Z.; Syarif, J.; Mohammed, M.N. An overview of semisolid processing of aluminium alloys. ISRN Mater. Sci. 2013, 2013, 679820. [Google Scholar] [CrossRef]
- Zhu, M.; Jian, Z.; Yang, G.; Zhou, Y. Effects of T6 heat treatment on the microstructure, tensile properties, and fracture behavior of the modified A356 alloys. Mater. Des. 2012, 36, 243–249. [Google Scholar] [CrossRef]
- Ragab, K.A.; Bouazara, M.; Bouaicha, A.; Allaoui, O. Microstructural and mechanical features of aluminium semi-solid alloys made by rheocasting technique. Mater. Sci. Technol. 2017, 33, 646–655. [Google Scholar] [CrossRef]
- Krolo, J.; Lela, B.; Ljumović, P.; Bagavac, P. Enhanced mechanical properties of aluminium alloy EN AW 6082 recycled without remelting. Teh. Vjesn. 2019, 26, 1253–1259. [Google Scholar] [CrossRef]
- Kim, D.H.; Kim, J.H.; Kobayashi, E. Enhanced mechanical properties of Al-Si-Cu-Mg(-Fe) alloys by a deformation-semisolid extrusion process. Mater. Sci. Eng. A 2021, 825, 141667. [Google Scholar] [CrossRef]
- Czerwinski, F. Magnesium Injection Molding; Springer: New York, NY, USA, 2008. [Google Scholar]
- Czerwinski, F. The oxidation behaviour of an AZ91D magnesium alloy at high temperatures. Acta Mater. 2002, 50, 2639–2654. [Google Scholar] [CrossRef]
- Chino, Y.; Mabuchi, M.; Otsuka, S.; Shimojima, K.; Hosokawa, H.; Yamada, Y.; Wen, C.; Iwasaki, H. Corrosion and mechanical properties of recycled 5083 aluminum alloy by solid state recycling. Mater. Trans. 2003, 44, 1284–1289. [Google Scholar] [CrossRef]
- Taha, M.A.; Abbas, A.T.; Benyahia, F.; Alharbi, H.F.; Guitian, B.; Novoa, R. Enhanced corrosion resistance of recycled aluminium alloy 6161 chips using hot extrusion followed by ECAP. J. Chem. 2019, 2019, 3658507. [Google Scholar] [CrossRef]
- Krolo, J.; Gudić, S.; Vrsalović, L.; Lela, B.; Dadić, Z. Fatigue and corrosion behavior of solid-state recycled aluminium alloy EN AW 6082. J. Mater. Eng. Perform. 2020, 29, 4310–4321. [Google Scholar] [CrossRef]
- Gebril, M.A.; Omar, M.Z.; Mohamed, I.F.; Othman, N.K. Microstructural evaluation and corrosion resistance of semisolid cast A356 alloy processed by equal channel angular pressing. Metals 2019, 9, 303. [Google Scholar] [CrossRef]
- Jiang, J.H.; Ma, A.B.; Lu, F.M.; Saito, N.; Watazu, A.; Song, D.; Zhang, P.; Nishida, Y. Improving corrosion resistance of Al–11mass%Si alloy through a large number of ECAP passes. Mater. Corros. 2011, 62, 848–852. [Google Scholar] [CrossRef]
- Jiang, J.; Ma, A.; Song, D.; Yang, D.; Shi, J.; Wang, K.; Zhang, L.; Chen, J. Anticorrosion behavior of ultrafine-grained Al-26 wt% Si alloy fabricated by ECAP. J. Mater. Sci. 2012, 47, 7744–7750. [Google Scholar] [CrossRef]
- Orłowska, M.; Ura-Bińczyk, E.; Olejnik, L.; Lewandowska, M. Effect of microstructural features on the corrosion behavior of severely deformed Al–Mg–Si alloy. Mater. Corros. 2020, 72, 868–878. [Google Scholar] [CrossRef]
- Bastidas, J.M.; Forn, A.; Torres, C.L.; Baile, M.T.; Polo, J.L. Pitting corrosion of A357 aluminium alloy obtained by semisolid processing. Mater. Corros. 2001, 52, 691–696. [Google Scholar] [CrossRef]
- Masuku, E.P.; Möller, H.; Curle, U.A.; Pistorius, P.C.; Li, W. Influence of surface liquid segregation on corrosion behavior of semi-solid metal high pressure die cast aluminium alloys. Trans. Nonferrous Met. Soc. China 2010, 20, 837–841. [Google Scholar] [CrossRef]
- Tahamtan, S.; Fadavi Boostani, A. Quantitative analysis of pitting corrosion behavior of thixoformed A356 alloy in chloride medium using electrochemical techniques. Mater. Des. 2009, 30, 2483–2489. [Google Scholar] [CrossRef]
- Zhou, B.; Liu, B.; Zhang, S.; Lin, R.; Jiang, Y.; Lan, X. Microstructure evolution of recycled 7075 aluminum alloy and its mechanical and corrosion properties. J. Alloys Compd. 2021, 879, 160407. [Google Scholar] [CrossRef]
- Lin, R.; Liu, B.; Zhang, J.; Zhang, S. Microstructure evaluation and properties of 7075 aluminium alloy recycled from scrap aircraft aluminium alloys. J. Mater. Res. Technol. 2022, 19, 354–367. [Google Scholar] [CrossRef]
- Arrabal, R.; Mingo, B.; Pardo, A.; Mohedano, M.; Matykina, E.; Rodríguez, I. Pitting corrosion of rheocast A356 aluminium alloy in 3.5 wt.% NaCl solution. Corros. Sci. 2013, 73, 342–355. [Google Scholar] [CrossRef]
- Akiyama, E.; Zhang, Z.; Watanabe, Y.; Tsuzaki, K. Effect of severe plastic deformation on the corrosion behaviour of aluminium alloys. J. Solid State Electrochem. 2009, 13, 277–282. [Google Scholar] [CrossRef]
- Brunner, J.G.; Birbilis, N.; Ralston, K.D.; Virtane, S. Impact of ultrafine-grained microstructure on the corrosion of aluminium alloy AA2024. Corros. Sci. 2012, 57, 209–214. [Google Scholar] [CrossRef]
- Zazi, N. Effect of heat treatments on the microstructure, hardness and corrosion behavior of nondendritic AlSi9Cu3(Fe) cast alloy. Mater. Sci. 2013, 19, 258–263. [Google Scholar] [CrossRef][Green Version]
- Monticelli, C.; Zanotto, F.; Balbo, A.; Grassi, V.; Fabrizi, A.; Timelli, G. Corrosion behavior of high-pressure die-cast secondary AlSi9Cu3(Fe) alloy. Corros. Sci. 2022, 209, 11077948. [Google Scholar] [CrossRef]
- Hirt, G.; Kopp, R. Thixoforming: Semi-Solid Metal Processing; Wiley-VCH: Weinheim, Germany, 2009. [Google Scholar]
- Birol, Y. Forming of AlSi8Cu3Fe alloy in the semi-solid state. J. Alloys Compd. 2009, 470, 183–187. [Google Scholar] [CrossRef]
- Arthanari, S.; Jang, J.C.; Shin, K.S. Corrosion behavior of high pressure die cast Al-Ni and Al-Ni-Ca alloys in 3.5% NaCl solution. Corros. Sci. Technol. 2017, 16, 100–108. [Google Scholar] [CrossRef]
- Arthanari, S.; Jang, J.C.; Shin, K.S. Corrosion studies of high pressure die-cast Al-Si-Ni and Al-Si-Ni-Cu alloys. J. Alloys Compd. 2018, 749, 146–154. [Google Scholar] [CrossRef]
- Xavier, M.G.C.; Freitas, B.J.M.; Koga, G.Y.; Spinelli, J.E. Effects of Ni and Co on the corrosion resistance of Al-Si-Cu-Zn-Fe alloys in NaCl solution. Metals 2022, 12, 645. [Google Scholar] [CrossRef]
- Barsoukov, E.; Macdonald, J.R. Impedance Spectroscopy, Theory, Experiment, and Applications; John Wiley & Sons, Inc.: Hoboken, NJ, USA, 2005. [Google Scholar]
- Tait, W.S. An Introduction to Electrochemical Corrosion Testing for Practicing Engineers and Scientists; Pair O Docks Publications: Racine, WI, USA, 1994. [Google Scholar]
- Kelly, R.G.; Schully, J.R.; Shoesmith, D.W.; Buchheit, R.G. Electrochemical Techniques in Corrosion Science and Engineering; Marcel Dekker, Inc.: New York, NY, USA, 2003. [Google Scholar]
- Gudić, S.; Nagode, A.; Šimić, K.; Vrsalović, L.; Jozić, S. Corrosion behavior of different types of stainless steel in PBS solution. Sustainability 2022, 14, 8935. [Google Scholar] [CrossRef]
- Chung, M.K.; Choi, Y.S.; Kim, J.G.; Kim, Y.M. Effect of the number of ECAP pass time on the electrochemical properties of 1050 Al alloys. Mater. Sci. Eng. A 2004, 366, 282–291. [Google Scholar] [CrossRef]
- Buchheit, R.G.; Wall, F.D.; Stoner, G.E.; Moran, J.P. Anodic dissolution-based mechanism for the rapid cracking, pre-exposure phenomenon demonstrated by aluminium–lithium–copper alloys. Corrosion 1995, 51, 417–428. [Google Scholar] [CrossRef]
- Schweitzer, P.E. Fundamentals of Corrosion: Mechanisms, Causes, and Preventative Methods; CRC Press: New York, NY, USA, 2009. [Google Scholar]
- Revie, R.W. Uhlig’s Corrosion Handbook; John Wiley & Sons, Inc.: Hoboken, NJ, USA, 2011. [Google Scholar]
- Hughes, A.E.; Boag, A.; Glenn, A.M.; McCulloch, D.; Muster, T.H.; Ryan, C.; Luo, C.; Zhou, X.; Thompson, G.E. Corrosion of AA2024-T3 Part II: Co-operative corrosion. Corros. Sci. 2011, 53, 27–39. [Google Scholar] [CrossRef]
- Liao, C.M.; Olive, J.M.; Gao, M.; Wei, R.P. In-situ monitoring of pitting corrosion in aluminium alloy 2024. Corrosion 1998, 54, 451–458. [Google Scholar] [CrossRef]
- Ralston, K.D.; Birbilis, N.; Weyland, M.; Hutchinson, C.R. The effect of precipitate size on the yield strength-pitting corrosion correlation in Al–Cu–Mg alloys. Acta Mater. 2010, 58, 5941–5948. [Google Scholar] [CrossRef]
- Song, D.; Ma, A.B.; Jiang, J.H.; Lin, P.H.; Yang, D.H. Corrosion behaviour of ultrafine grained industrial pure Al fabricated by ECAP. Trans. Nonferrous Met. Soc. China 2009, 19, 1065–1070. [Google Scholar] [CrossRef]
- Ralston, K.D.; Fabijanic, D.; Birbilis, N. Effect of grain size on corrosion of high purity aluminium. Electrochim. Acta 2011, 56, 1729–1736. [Google Scholar] [CrossRef]
- Wang, X.; Nie, M.; Wang, C.T.; Wang, S.W.; Gao, N. Microhardness and corrosion properties of hypoeutectic Al–7Si alloy processed by high-pressure torsion. Mater. Des. 2015, 83, 193–202. [Google Scholar] [CrossRef]
- Koch, G.; Brongers, M.; Tompson, N.; Virmani, Y.P.; Payer, J. Corrosion Costs and Preventive Strategies in the United States; Report No. FHWA-RD-01-156; NACE International: Houston, TX, USA, 2002. [Google Scholar]


Disclaimer/Publisher’s Note: The statements, opinions and data contained in all publications are solely those of the individual author(s) and contributor(s) and not of MDPI and/or the editor(s). MDPI and/or the editor(s) disclaim responsibility for any injury to people or property resulting from any ideas, methods, instructions or products referred to in the content. |
© 2024 by the authors. Licensee MDPI, Basel, Switzerland. This article is an open access article distributed under the terms and conditions of the Creative Commons Attribution (CC BY) license (https://creativecommons.org/licenses/by/4.0/).