Article

Analytical Modeling of Unsaturated Soil Shear Strength during Water Infiltration for Different Initial Void Ratios

by
Daniel Batista Santos
,
Patrícia Figuereido de Sousa
and
André Luís Brasil Cavalcante
*
Department of Civil and Environmental Engineering, University of Brasília, Brasília 70910-900, DF, Brazil
*
Author to whom correspondence should be addressed.
Sustainability 2024, 16(4), 1394; https://doi.org/10.3390/su16041394
Submission received: 5 December 2023 / Revised: 1 February 2024 / Accepted: 1 February 2024 / Published: 7 February 2024

Abstract

:
Unsaturated soil mechanics, when applied to determine the soil shear strength, are crucial for accurately evaluating the safety of geotechnical structures affected by seasonal moisture variations. Over the past decades, multiple models have been formulated to predict the behavior of unsaturated soils in terms of water flow and shear strength individually. Building upon these foundational studies, this research introduces a model that couples an analytical solution for one-dimensional water infiltration with an unsaturated shear strength model. This model further incorporates the impact of void ratio fluctuations on soil properties and state variables related to shear strength. A parametric analysis is conducted to evaluate the effects of the initial void ratio on a representative soil profile during a water infiltration event. The model presented in this paper integrates various concepts from the field of unsaturated soil mechanics and is applicable to any homogeneous soil where expansion/collapse effects are negligible. It demonstrates how shear strength might be underestimated when using a saturated soil approach. Conversely, it may also lead to an overestimation of safety conditions if the soil approaches a saturated or dry state. The proposed model offers a more accurate prediction of unsaturated soil shear strength. It is useful for determining transient safety factors in geotechnical structures. Furthermore, when combined with field-installed instrument monitoring, this model contributes significantly to the functionality, safety, cost-effectiveness, and sustainability of geotechnical structures and projects.

1. Introduction

The soil shear strength value is required to determine the geotechnical stability of many structures, such as landfills, slopes, retaining structures, and foundations. Despite more than a century of research, the development of a universal method for determining soil shear strength continues to be an elusive goal [1]. Given that soil moisture content undergoes frequent changes due to the hydrological cycle, the associated soil shear strength can exhibit significant fluctuations [2,3,4]. Additionally, in many tropical regions worldwide, the superficial soil layer remains permanently unsaturated due to a deep groundwater table. Thus, the unsaturated soil modeling approach becomes essential for soil strength analysis.
As experimental research on unsaturated soils is generally costly, time-consuming, and difficult to conduct [5], the reliance on empirical, semi-empirical, and analytical mathematical strength models becomes crucial for predicting the mechanical behavior of unsaturated soils [6]. However, some models may disregard features of the complex unsaturated soil behavior that leads to inaccuracy. Therefore, a poor prediction of the soil behavior induces a deficient applicability of material resources, whether overestimating (inducing failure and damage to the environment) or underestimating (overstating the use of material resources) the safety condition of the geotechnical structure.
Given the historical and recent numbers of environmental and human casualties from landslides [7,8,9], for example, it is vital to understand the phenomena within the unsaturated soil for a sustainable engineering practice. Several authors have studied the effects of infiltration and rain on the instability of unsaturated soils [4,10,11,12,13,14,15,16]. Addressing these phenomena is inherently challenging due to their pronounced non-linearity. Several studies [17,18,19,20,21,22,23,24,25] have modeled variations in shear strength due to moisture fluctuations. However, none of these studies have analytically incorporated more complex factors such as variations in the initial void ratio. Recently, Cavalcante and Zornberg [26] developed an analytical solution for the Richards equation, which rigorously models the water flow in porous media. Also, Costa and Cavalcante [27] modeled the soil–water retention curve (SWRC) variation with the void ratio. Lu et al. [28] formulated the soil shear strength from the SWRC based on thermodynamic principles, and Zhai et al. [29] incorporated the capillary effect. Based on these main studies, this article aims to couple these models to predict the soil shear strength variation due to water infiltration for different initial void ratios. This modeling should offer valuable insights for decision making in geotechnical engineering practice. Developing more complex and realistic models has the potential to lead to more cost-effective and safer civil engineering projects. This approach can reduce material and human resource requirements, thereby contributing to the advancement of sustainable engineering practices.

2. Literature Review

2.1. Unsaturated Water Retention and Water Flow

The Richards equation [30] models the unsaturated transient flow through porous media based on the principles of the conservation of mass and continuity. For the unidimensional vertical (in the z-direction) flow, the equation can be written in terms of the volumetric water content (θ, L3L−3) [26]:
θ t = θ z D z ( θ ) θ z a s ( θ ) θ z
where t = time (T); Dz = hydraulic diffusivity (L2T−1); and as = advective velocity (LT−1). This highly non-linear equation usually requires a numerical solution [2]. Alternatively, simplifications regarding the problem geometry and boundary conditions can be applied, as demonstrated by Cavalcante and Zornberg [26].
The linearization of the Richards equation implies the adoption of the hydraulic diffusivity and the advective velocity as constant values. Consequently, variations in the water content within the soil do not affect these properties.
θ t = θ z D z θ z a s θ z
The advantages of Equation (2) to describe the unsaturated flow are: (i) the possibility of analytical solutions for different initial and boundary conditions and, (ii) the direct correspondence between the equations of water infiltration, water retention, and hydraulic conductivity, as shown by Cavalcante and Zornberg [26].
Cavalcante and Zornberg [26] linearized the Richards equation with the following expressions for the SWRC and the k-function (which denotes the unsaturated hydraulic conductivity function, kz):
k z ( θ ) = k s θ θ r θ s θ r
ψ ( θ ) = 1 δ ln θ θ r θ s θ r
where ψ = soil suction (ML−1T−2); δ = fitting hydraulic parameter (M−1LT2); θs = saturated volumetric water content (L3L−3); θr = residual volumetric water content (L3L−3); and ks = saturated hydraulic conductivity (LT−1).
Cavalcante and Zornberg [26] present four analytical solutions. The most straightforward solution contemplates a semi-infinite soil column with one initial condition and two boundary conditions, as described ahead.
Given a constant moisture (θ0 = θ(0, t)) imposed at the top of a semi-infinite soil column (∂θ(∞, t)/∂z = 0) and an initially uniform moisture along the depth (θi = θ(z, 0)), the analytical solution for the one-dimensional water flow is [26]:
θ ( z , t ) = θ i + ( θ 0 θ i ) A ( z , t )
A ( z , t ) = 1 2 erfc z a s t 2 D z t + 1 2 exp a s z D z erfc z + a s t 2 D z t
where Dz = ks/(δ(θsθr)γw) and as = ks/(θsθr). Thus, the dimensionless function A(z,t) can be rewritten in terms of ks and δ directly:
A ( z , t ) = 1 2 erfc z k s t ( θ s θ r ) 2 k s t δ γ w θ s θ r + 1 2 exp δ γ w z erfc z + k s t ( θ s θ r ) 2 k s t δ γ w θ s θ r
For the case of soils where θr = 0 and given that the saturated volumetric water content corresponds numerically to the soil’s porosity, Equation (5) can be rewritten in terms of the void ratio (e), using θs = n = e/(1 + e):
θ ( z , t ) = θ i + ( θ 0 θ i ) 2 erfc z k s t ( 1 + e ) e 2 k s t ( 1 + e ) δ γ w e + exp δ γ w z erfc z + k s t ( 1 + e ) e 2 k s t ( 1 + e ) δ γ w e
Figure 1 illustrates the effect of variation in the δ value in the main hydraulic curves of the soil. As mentioned before, δ is the only fitting parameter for the SWRC for the analytical solution of water infiltration from Cavalcante and Zornberg [26]. The lower the δ value, the higher the suction applied to remove the water from the soil (Figure 1a) and to reduce the soil’s hydraulic conductivity (Figure 1b), a trait commonly observed in fine-grained soils. Also, a lower δ value increases the hydraulic diffusivity (Dz), allowing a deeper water infiltration for the same saturated hydraulic conductivity (Figure 1c).

2.2. Void Ratio Effect on Water Retention and Unsaturated Hydraulic Conductivity

The air-entry value (ψaev, ML−1T−2) of the SWRC delimits the zone where the air phase becomes continuous in the drying process (decrescent water content). From the tangent lines in the initial segment and the inflection point of the SWRC [31,32], one can deduce from Equation (4) the air-entry value, as in Equation (9) below [27]. Figure 2 illustrates these elements in the SWRC. Also, adopting an empirical power law for ψaev related to the void ratio (e), as in Equation (10) (a, ML−1T−2, and b, dimensionless, are fitting parameters), the relation in Equation (11) is achieved [27].
ψ a e v = exp ( 1 exp ( 1 ) ) δ
ψ a e v = a e b
δ ( e ) = e b exp ( 1 exp ( 1 ) ) a
Admitting that θr is not dependent on the void ratio and that θs is numerically equivalent to the soil porosity, the SWRC in Equation (4), controlled by θs and δ, can be adjusted for different void ratios. This adjustment yields the soil–water retention surface, which is calibrated using only two fitting parameters (a and b) [27].
The pore size distribution curve can be deduced from the Young–Laplace equation considering the contact angle null between the water and the soil particles. For the SWRC defined by Equation (4), the cumulative function for the pore size distribution is deduced as [33]:
d S / d ( log r ) = 2 ( θ s θ r ) ln ( 10 ) δ σ w exp ( ( 2 δ σ w / r ) ) r θ s
where r is the equivalent pore radius [L] and σw = 0.07275 kN/m is the water surface tension. This specific value of the water surface tension is representative of standard conditions, namely, a temperature of 20 °C and the absence of significant solutes [34]. Despite this, the value has shown a good agreement with experimental data on soil porosimetry [33,35]. It is important to note that this value does not influence the shear strength; rather, it affects only the pore size distribution curve.
Based on simplifications regarding the geometry of the soil particles and the soil pores, the Kozeny–Carman equation [36,37] estimates the hydraulic conductivity of saturated soils for different void ratios:
k s = C e 3 1 + e
where C [LT−1] is a constant for each soil that varies with the fluid kinematic viscosity, the specific surface area of the soil particles, the particles’ shape, and the particles’ density. Some interaction between the soil particles and the water can arise for each soil mineralogy in more fine-grained soils, so the Kozeny–Carman formulation can perform well only for coarse-grained soils [38,39]. Ren et al. [40] proposed an extension of Equation (13) by adding the single dimensionless parameter m:
k s = C e 3 m + 3 ( 1 + e ) 5 3 m + 1 ( 1 + e ) m + 1 e m + 1 4 3
The dimensionless m parameter is related to the fraction of water within soil pores that are immobile due to its adsorption on the soil particles. For a greater m value, a greater fraction of the water remains immobile within the soil voids with a decreasing degree of saturation. Ren et al. [40] demonstrated that, when using m = 0 for sandy soils, m = 1 for silty soils, and m = 1.5 for clayey soils, Equation (14) predicts well the saturated hydraulic conductivity for a wide range of clayey, silty, and sandy soils. Over 1100 saturated hydraulic conductivity data for more than 30 different soils were tested, fitting well most of the data within an interval between 1/3 and 3 times the measured value—a good performance given the known high variability regarding soil hydraulic conductivity. Also, when m = 0, Equation (14) returns to the expression in Equation (13). This highlights the consistency of the model, emphasizing scenarios where all the water within the soil is mobile—a characteristic typically found in coarse-grained soils with inert particles.

2.3. Unsaturated Soil Shear Strength

The shear strength of unsaturated soils is fundamentally linked to the water content within the void spaces of the porous medium and, consequently, to the corresponding matric suction. This establishes an indirect but significant relationship between the unsaturated shear strength and the soil–water retention curve (SWRC). An analysis of the experimental data on shear strength from the existing literature indicates a nonlinear correlation between soil suction and shear strength. The observed increase in shear strength as the soil desaturates is attributed to the rise in matric suction, which, in turn, strengthens the cohesive forces among the soil particles [5]. The extension of the Mohr–Coulomb failure criterion for unsaturated soils requires the use of two independent stress state variables: net normal stress (σua) and matric suction (uauw) [2]. Following Bishop [41], Lu et al. [28] derived the equation below for the unsaturated soil shear strength, analogous to other studies [5,29,42,43]. Lu et al. [28] disregarded the contractile skin effect (the water–air interface) and adopted the effective degree of saturation (Se instead of degree of saturation S only) to nullify the contribution of the shear strength in the residual zone of the SWRC (high suction values), where the water phase is essentially discontinuous in the pores.
τ = c + [ ( σ u a ) + S e ( u a u w ) ] tan ϕ
S e = S S r z 1 S r z
where c’ = effective cohesion (ML−1T−2); σ = total normal stress (ML−1T−2); ϕ’ = angle of internal friction (°); and Srz = residual degree of saturation (dimensionless), which delimits the residual zone in the SWRC (corresponding to the suction ψrz in Figure 2). Inherently, this covers the classical saturated principle of effective stress, where S = 1 and ua = 0.
Zhai et al. [29] enhanced the unsaturated shear strength model by including the contribution of the capillarity effect within the soil. This effect arises due to surface tension at the air–water interface, conceptualizing the contractile skin as the porous medium’s fourth phase. By integrating the Young–Laplace equation with the pore size distribution from the SWRC, they deduced the following equation for the capillary contribution:
c s = i = m N 1 π ψ i ψ m 2 arcsin ψ m ψ i ψ i ψ m 2 1 ψ m S ( ψ i + 1 ) S ( ψ i )
where cs is the additional cohesion (ML−1T−2); ψi is the equivalent suction (ML−1T−2) corresponding to a specific pore radius in capillary theory; ψm = (uauw) is the soil matric suction (ML−1T−2); and S(ψ) is the degree of saturation (dimensionless) corresponding to the suction ψ.
Consequently, the equation for unsaturated shear strength is:
τ = c + ( σ u a ) + S e ( u a u w ) tan ϕ + c s
The second term inside the square brackets in Equation (18) was referred to by the authors as the additional normal stress due to soil suction. This is primarily because it is multiplied by the effective internal friction angle, in contrast to the additional cohesion component.
Santos et al. [44] coupled the shear strength model of Lu et al. [28] and the transient infiltration model of Cavalcante and Zornberg [26] to analyze the transient bearing capacity of a single pile. The main idea was to express the shear strength’s state variables in terms of the volumetric water content.
Using S(z, t) = θ(z, t)/θs, one can obtain the transient effective degree of saturation as in Equation (19). The transient suction can be calculated directly from Equation (4) as in Equation (20) below.
S e ( z , t ) = S ( z , t ) S r z 1 S r z
ψ ( z , t ) = 1 δ ln θ ( z , t ) θ r ( θ s θ r )
The transient total vertical stress can be deduced as in Equation (22) from the physical indices related to the soil unit weight (represented as γ, ML−2T−2) in Equation (21).
γ ( z , t ) = γ d + γ w θ ( z , t )
where γd is the dry unit weight (ML−2T−2) and γw is the water unit weight (ML−2T−2). Assuming no external load on the soil surface, the vertical stress at a point within the soil is the cumulative load exerted by all overlying strata. This can be mathematically expressed as:
σ ( z , t ) = 0 z γ ( z , t ) d z
By incorporating Equations (19), (20), and (22) into Equation (18), Santos et al. [44] formulated the transient unsaturated shear strength as:
τ ( z , t ) = c + [ σ ( z , t ) + S e ( z , t ) ψ ( z , t ) ] tan ϕ

3. Unsaturated Shear Strength Modeling for Different Initial Void Ratios

Besides the shear strength expressed in terms of the volumetric water content, as in Santos et al. [44], this modeling formulates the void ratio dependency of the soil properties and the state variables that affect the shear strength.
From a known initial void ratio (ei) and the corresponding initial saturated hydraulic conductivity (ksi), the Kozeny–Carman formulation allows for estimating the hydraulic conductivity for another initial void ratio value (e), as in Equation (24), excluding the need for the C parameter. However, since this formulation is only applicable to coarse-grained soils, the generalized equation from Ren et al. [40] can be used as well, as in Equation (25). Thus, using Equations (11) and (26) and the relation θs(e) = e/(1 + e), the infiltration model (Equation (5)) can be made for different initial void ratios, or θ = θ(z,t,e), followed by the corresponding suction (ψ = ψ(z,t,e)) and the degree of saturation (S = S(z,t,e) = θ(z,t,e)/θs(e)). Other studies [38,39] have proposed more accurate models to predict the hydraulic conductivity with the void ratio. However, the advantage of Equation (25) is that it needs only one measurement of hydraulic conductivity (ksi) for a known void ratio (ei). If more hydraulic conductivity data for a specific soil are available, more sophisticated models can be implemented to obtain ks(e).
k s ( e ) = k s i e 3 1 + e 1 + e i e i 3
k s ( e ) = k s i e 3 m + 3 ( 1 + e ) 5 3 m + 1 ( 1 + e ) m + 1 e m + 1 4 3 ( 1 + e i ) 5 3 m + 1 ( 1 + e i ) m + 1 e i m + 1 4 3 e i 3 m + 3
k z ( z , t , e ) = k s ( e ) θ ( z , t , e ) θ r θ s ( e ) θ r
ψ ( z , t , e ) = 1 δ ( e ) ln θ ( z , t , e ) θ r θ s ( e ) θ r
The θ(z,t,e) function can be adapted from Equation (7) by considering the void ratio dependency for both ks (Equation (25)) and δ (Equation (11)), obtaining:
A ( z , t , e ) = 1 2 erfc z k s ( e ) t ( θ s ( e ) θ r ) 2 k s ( e ) t δ ( e ) γ w θ s ( e ) θ r + 1 2 exp δ ( e ) γ w z erfc z + k s ( e ) t ( θ s ( e ) θ r ) 2 k s ( e ) t δ ( e ) γ w θ s ( e ) θ r
The intersection point of the tangent lines on the inflection point and the residual zone of the SWRC (in linear-log scale) defines the residual suction value, denoted as ψrz [31,32]. The water phase is essentially discontinuous in the residual zone [5], and it was assumed that the water could not transfer stress between particles for both additional cohesion (cs) and additional normal stress (ψSe). For the SWRC in Equation (4), one can obtain that ψrz = exp(1)/δ (refer to Appendix A for details). Thus, the soil saturation function can be written by:
S r z ( e ) = θ s ( e ) θ r exp ( exp ( 1 ) ) + θ r θ s ( e )
S e ( z , t , e ) = S ( z , t , e ) S r z ( e ) 1 S r z ( e )
From the physical indices, the dry unit weight can be derived from a known initial dry unit weight (γdi) related to the initial θs (θsi = ei/(1 + ei)). This relationship can be expressed as:
γ d ( e ) = γ d i 1 θ s i ( 1 θ s ( e ) )
Consequently, the transient total vertical stress is formulated as:
σ ( z , t , e ) = 0 z [ γ d ( e ) + γ w θ ( z , t , e ) ] d z
The additional cohesion in Equation (17) was modified to a continuous function, converting the sum into an integral (for a detailed derivation, see Appendix B). The upper limit i = Nψi = ψN of the sum in Equation (17) was modified to correspond to the residual suction, so the additional cohesion does not contribute within the residual zone. This is analogous to the additional normal stress due to the use of the effective degree of saturation. The applied suction, ψm, is equivalent to ψ(z, t) in this context. Implementing the void ratio dependency, the transient additional cohesion is as follows:
c s ( z , t , e ) = 1 π ψ ( z , t , e ) θ s ( e ) θ r θ s ( e ) δ ( e ) × ψ ( z , t , e ) ψ r ψ i ψ ( z , t , e ) 2 arcsin ψ ( z , t , e ) ψ i ψ i ψ ( z , t , e ) 2 1 exp ( ψ i δ ( e ) ) d ψ i
Finally, substituting Equations (27), (30), (32), and (33) into Equation (18), the transient unsaturated shear strength is given by:
τ ( z , t , e ) = c + σ ( z , t , e ) + ψ ( z , t , e ) S e ( z , t , e ) tan ϕ + c s ( z , t , e )
Equation (34) represents the transient unsaturated shear strength function for different depths varying with the initial void ratio of the medium. In this proposed model, the shear strength gain under unsaturated conditions is composed of two parts: one is related to the greater proximity between the grains (due to the normal stress) and the other is related to the increase in capillary tension (represented by the additional cohesion). A pivotal advancement in this model is the possibility of analytically estimating the reduction in shear strength during a rainfall event that causes water infiltration into the soil and, consequently, an increase in the degree of saturation.
In a fully saturated approach, where the groundwater table is assumed to be at the soil surface, Equation (34) simplifies to Equation (35), as presented below.
τ s a t ( z , e ) = c + γ d ( e ) + γ w θ s ( e ) γ w z tan ϕ

4. Shear Strength Variation Simulation

This section presents parametric analyses of the state variables that compose the unsaturated shear strength. The modeling parameters for the soil were: ei = 0.49; θr = 0.02; ksi = 5·10−5 m/s; γdi = 16.2 kN/m³; c’ = 8 kPa; ϕ = 26°; a = 1.06 kPa; and b = 4. The m parameter in Equation (25) was considered as 0, corresponding to sandy soil [40]. The boundary conditions for the water infiltration into a semi-infinite soil column were θ0 = θs; θi = 0.30θs. These parameters represent a saturation condition applied on the soil surface and an initial moisture condition close to the residual zone in the SWRC.

4.1. Effect of Suction for Different Void Ratios

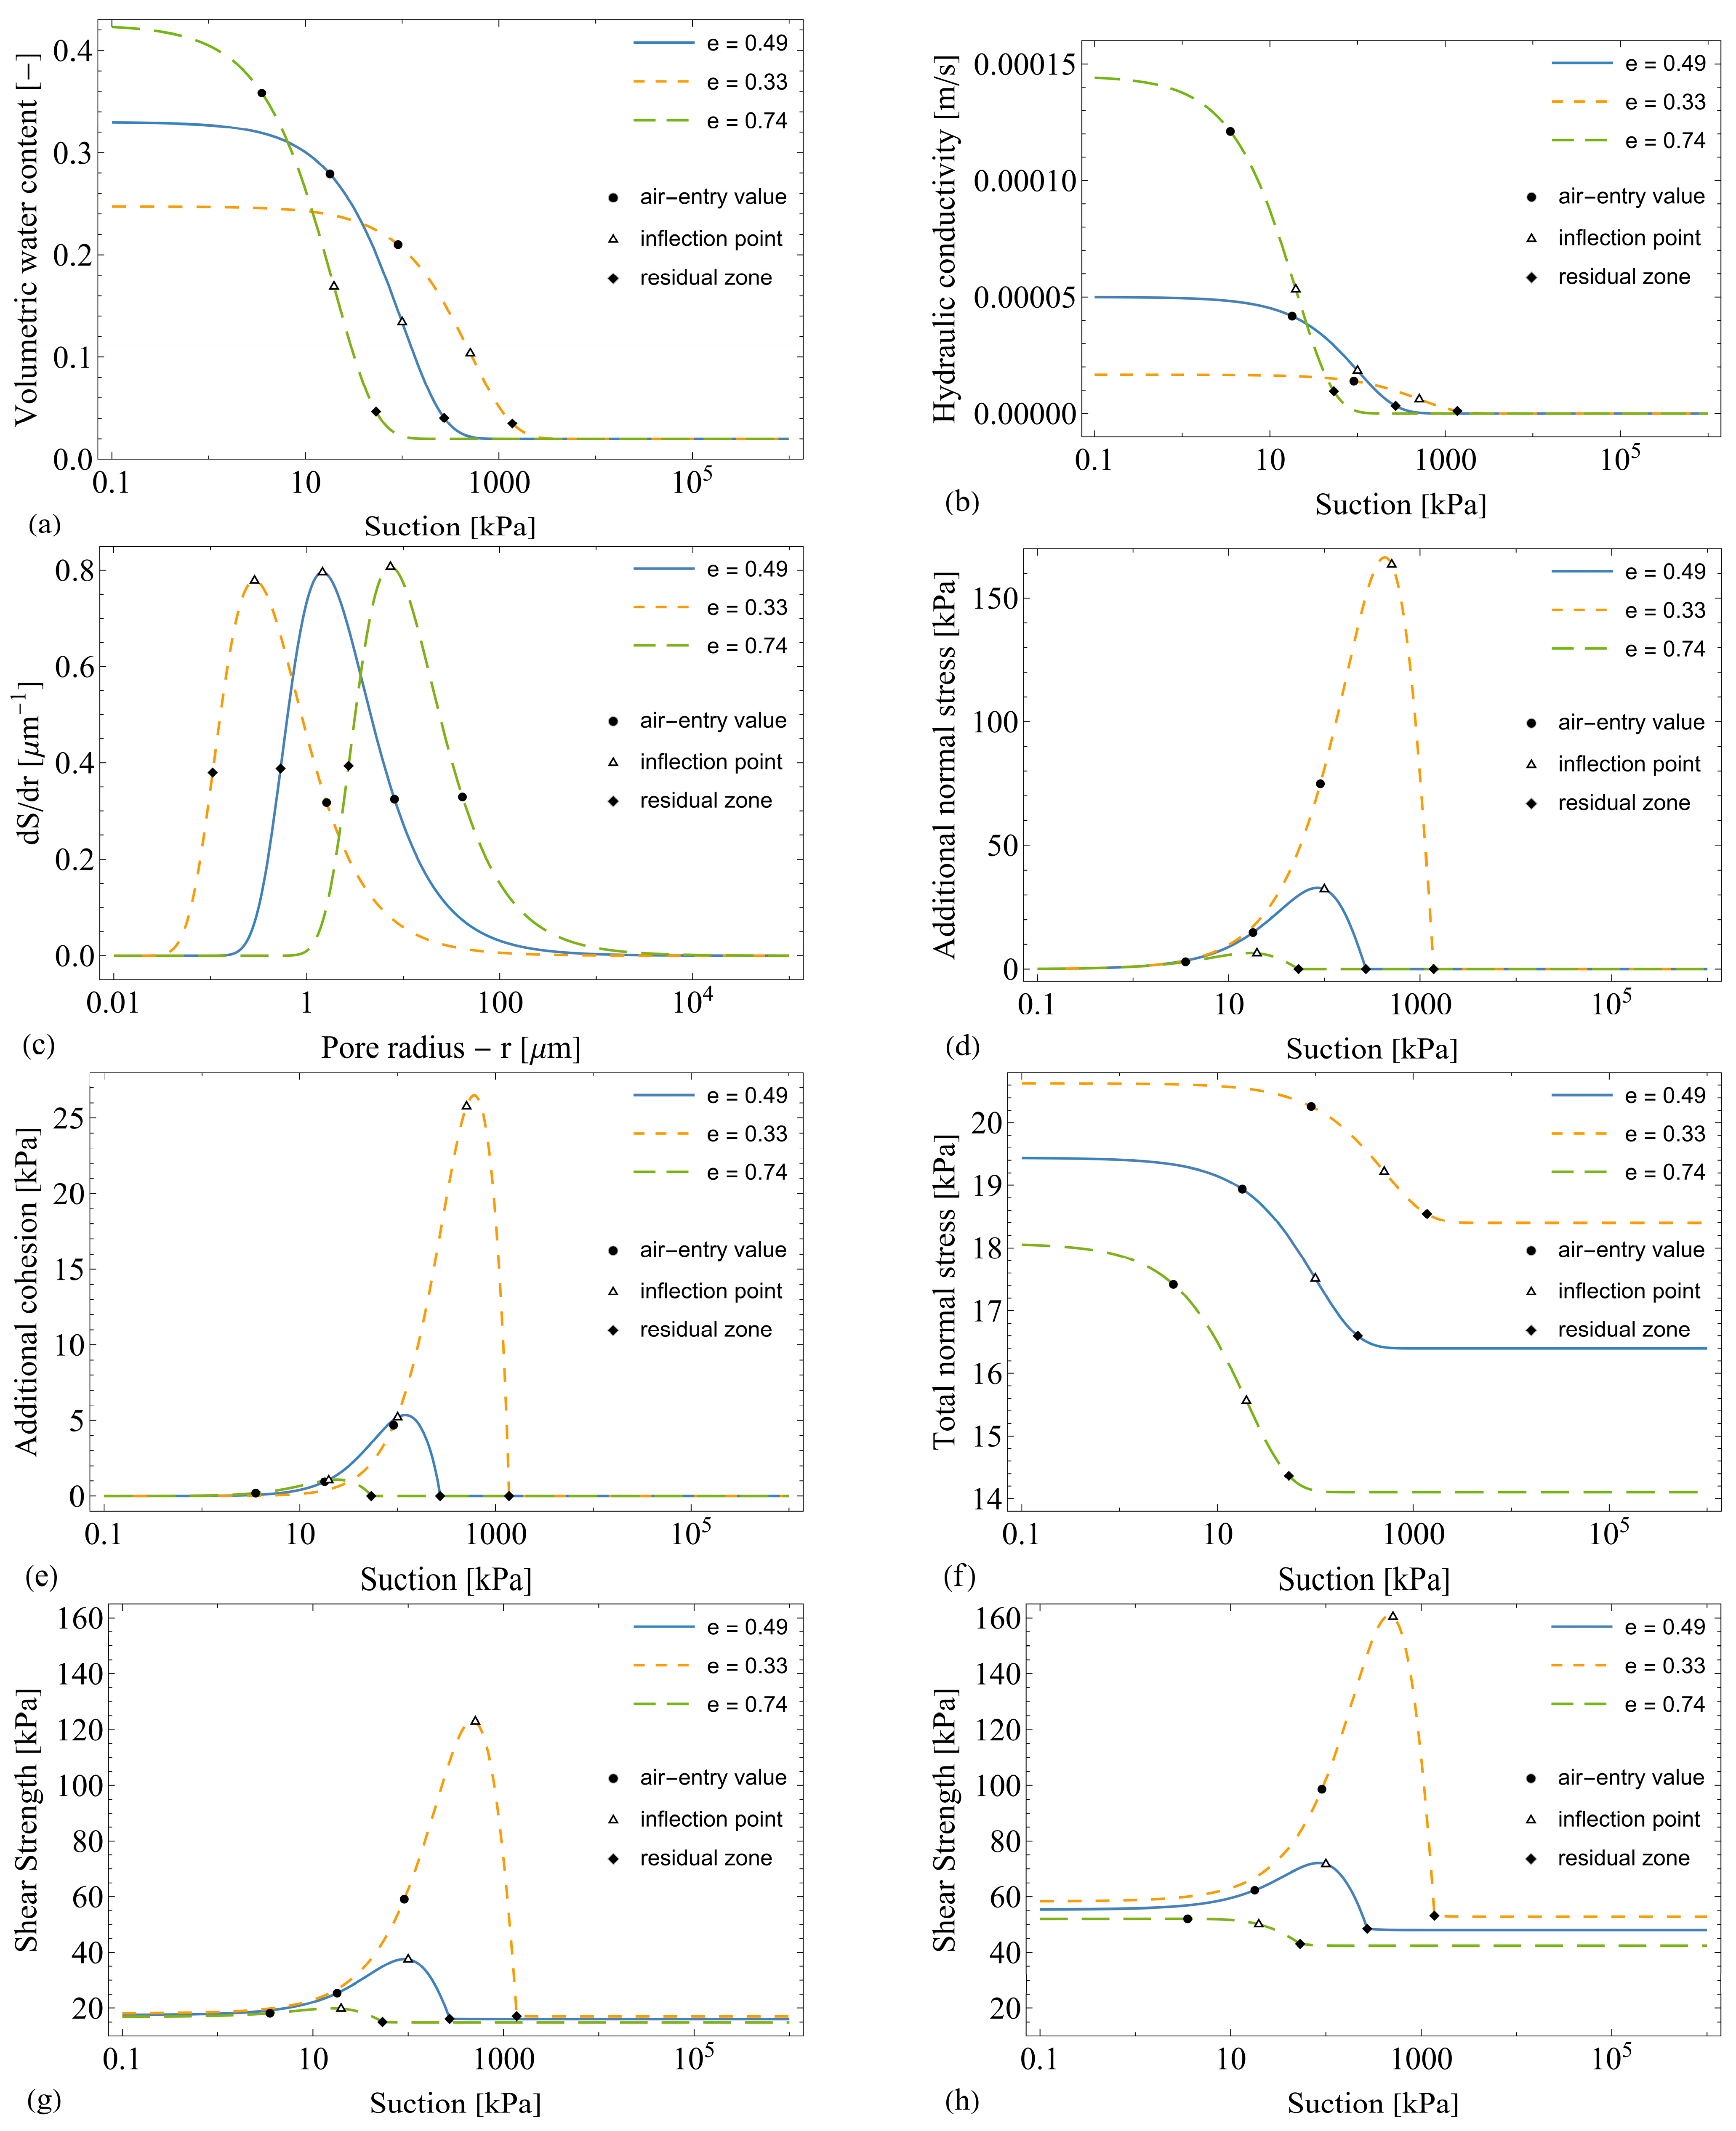
Figure 3a shows the effect of the void ratio on the soil’s water retention capacity. A decrease in the void ratio (e.g., due to compaction) reduces the soil porosity while increasing the suction corresponding to all the notable points (air-entry value, inflection point, and residual point). This occurs because the suction value at these points is inversely proportional to δ. Thus, the change in the soil capacity to retain the water arising from changes in the void ratio can be quantified.
In the k-function depicted in Figure 3b, the capillary barrier effect is observed: the smaller the void ratio, the greater the hydraulic conductivity for higher suction values, despite the reduction in the saturated hydraulic conductivity.
The pore size distribution curve, illustrated in Figure 3c, emphasizes the corresponding change in the SWRC from the initial void ratio (ei = 0.49) to a denser state (e = 0.33) or a looser one (e = 0.74). The overall shape is maintained, while the curve is dislocated horizontally with a slight change in the peak. A denser soil state (smaller pore radius) of the soil causes: (i) a horizontal displacement to the left, proportional to the reduction in the δ value; and (ii) a decrease in the peak frequency due to the reduction in the porosity [33]. Accordingly, the shortcoming of the employed SWRC is the specific distribution for the pores within the soil: if the cumulative function for the pore size distribution is either more dispersed or restricted around the peak, the soil tends to give a poor adjustment in the SWRC. This could reduce the applicability of the analytical solution for the transient water infiltration and, consequently, for the transient unsaturated shear strength.
Figure 3d,e demonstrate the increase in the unsaturated part of the shear strength with a reduction in the void ratio. This increase is greater for suction values near the inflection point of the SWRC. The suction at the peak of the additional normal stress differs from the inflection point seen in the SWRC, because the effective degree of saturation is defined in this study with the Srz (residual zone) rather than Sr = θr/θs, as in other studies [5,28,43]. Similarly, the same effect occurs in the additional cohesion defined in the present model, restricted for suction values in the residual zone. A smaller void ratio favors a higher additional normal stress for the whole suction range, but the additional cohesion may be smaller for a smaller void ratio in the suction interval below the air-entry value. Both the additional cohesion and normal stress tend to zero close to saturation and equal zero in the residual zone, so the shear strength in the present model does not grow infinitely with an increase in suction, which is physically consistent. Therefore, only the water in the macropores contributes towards the unsaturated shear strength, so the failure occurs connecting the macropores. This may suit even bimodal soils where the micropores do not provide shear resistance, assuming the failure is exclusively within the macropores’ domain. It is worth noticing that the value of air entry into the micropores marks the point where the soil shear strength can be represented again by the Mohr–Coulomb failure criterion for dried soils.
Figure 3f shows the total normal (vertical) stress at a 1 m depth, considering a uniform suction (or water content) above this depth. The change in this state variable with suction corresponds to the unit weight variation with the water content between a dry and a saturated state (high and low suction range, respectively). The normal stress increases with a reduction in suction, because a greater water content in the soil increases the specific weight of the medium. Thus, the effect of a more compacted soil over the shear strength variables can be quantified. All these variables that are affected by the water content increase their contribution towards the shear strength, considering the effect of cohesion (c’) and the internal frictional angle (ϕ) are unchanged.
Figure 3g,h show the effect of the void ratio on the unsaturated shear strength for the depths of 1 m and 5 m, respectively (considering a constant suction above these depths). These two figures are plotted in the same vertical scale to illustrate the depth effect: the overall shear strength increases due to the increase in the normal stress, only since the suction here is constant along the depth (so both the additional cohesion and the additional normal stress remain the same for any depth). For the same reason, the difference between the curves for different void ratios increases along the depth too. Comparing these two figures, the influence of the stress history on the soil shear strength can be observed, since, at greater depths, the soil is subjected to greater load from the weight of the upper layer and, consequently, it bears a higher shear strength value.
For denser soils (smaller void ratio), the gain in the shear strength can be significant even for greater depths (around two thirds of the shear strength in Figure 3h for e = 0.33 is due to the unsaturated part of the shear strength). In engineering practice, this condition can lead to an overestimation of the soil stability, generating safety concerns during moisture fluctuations.
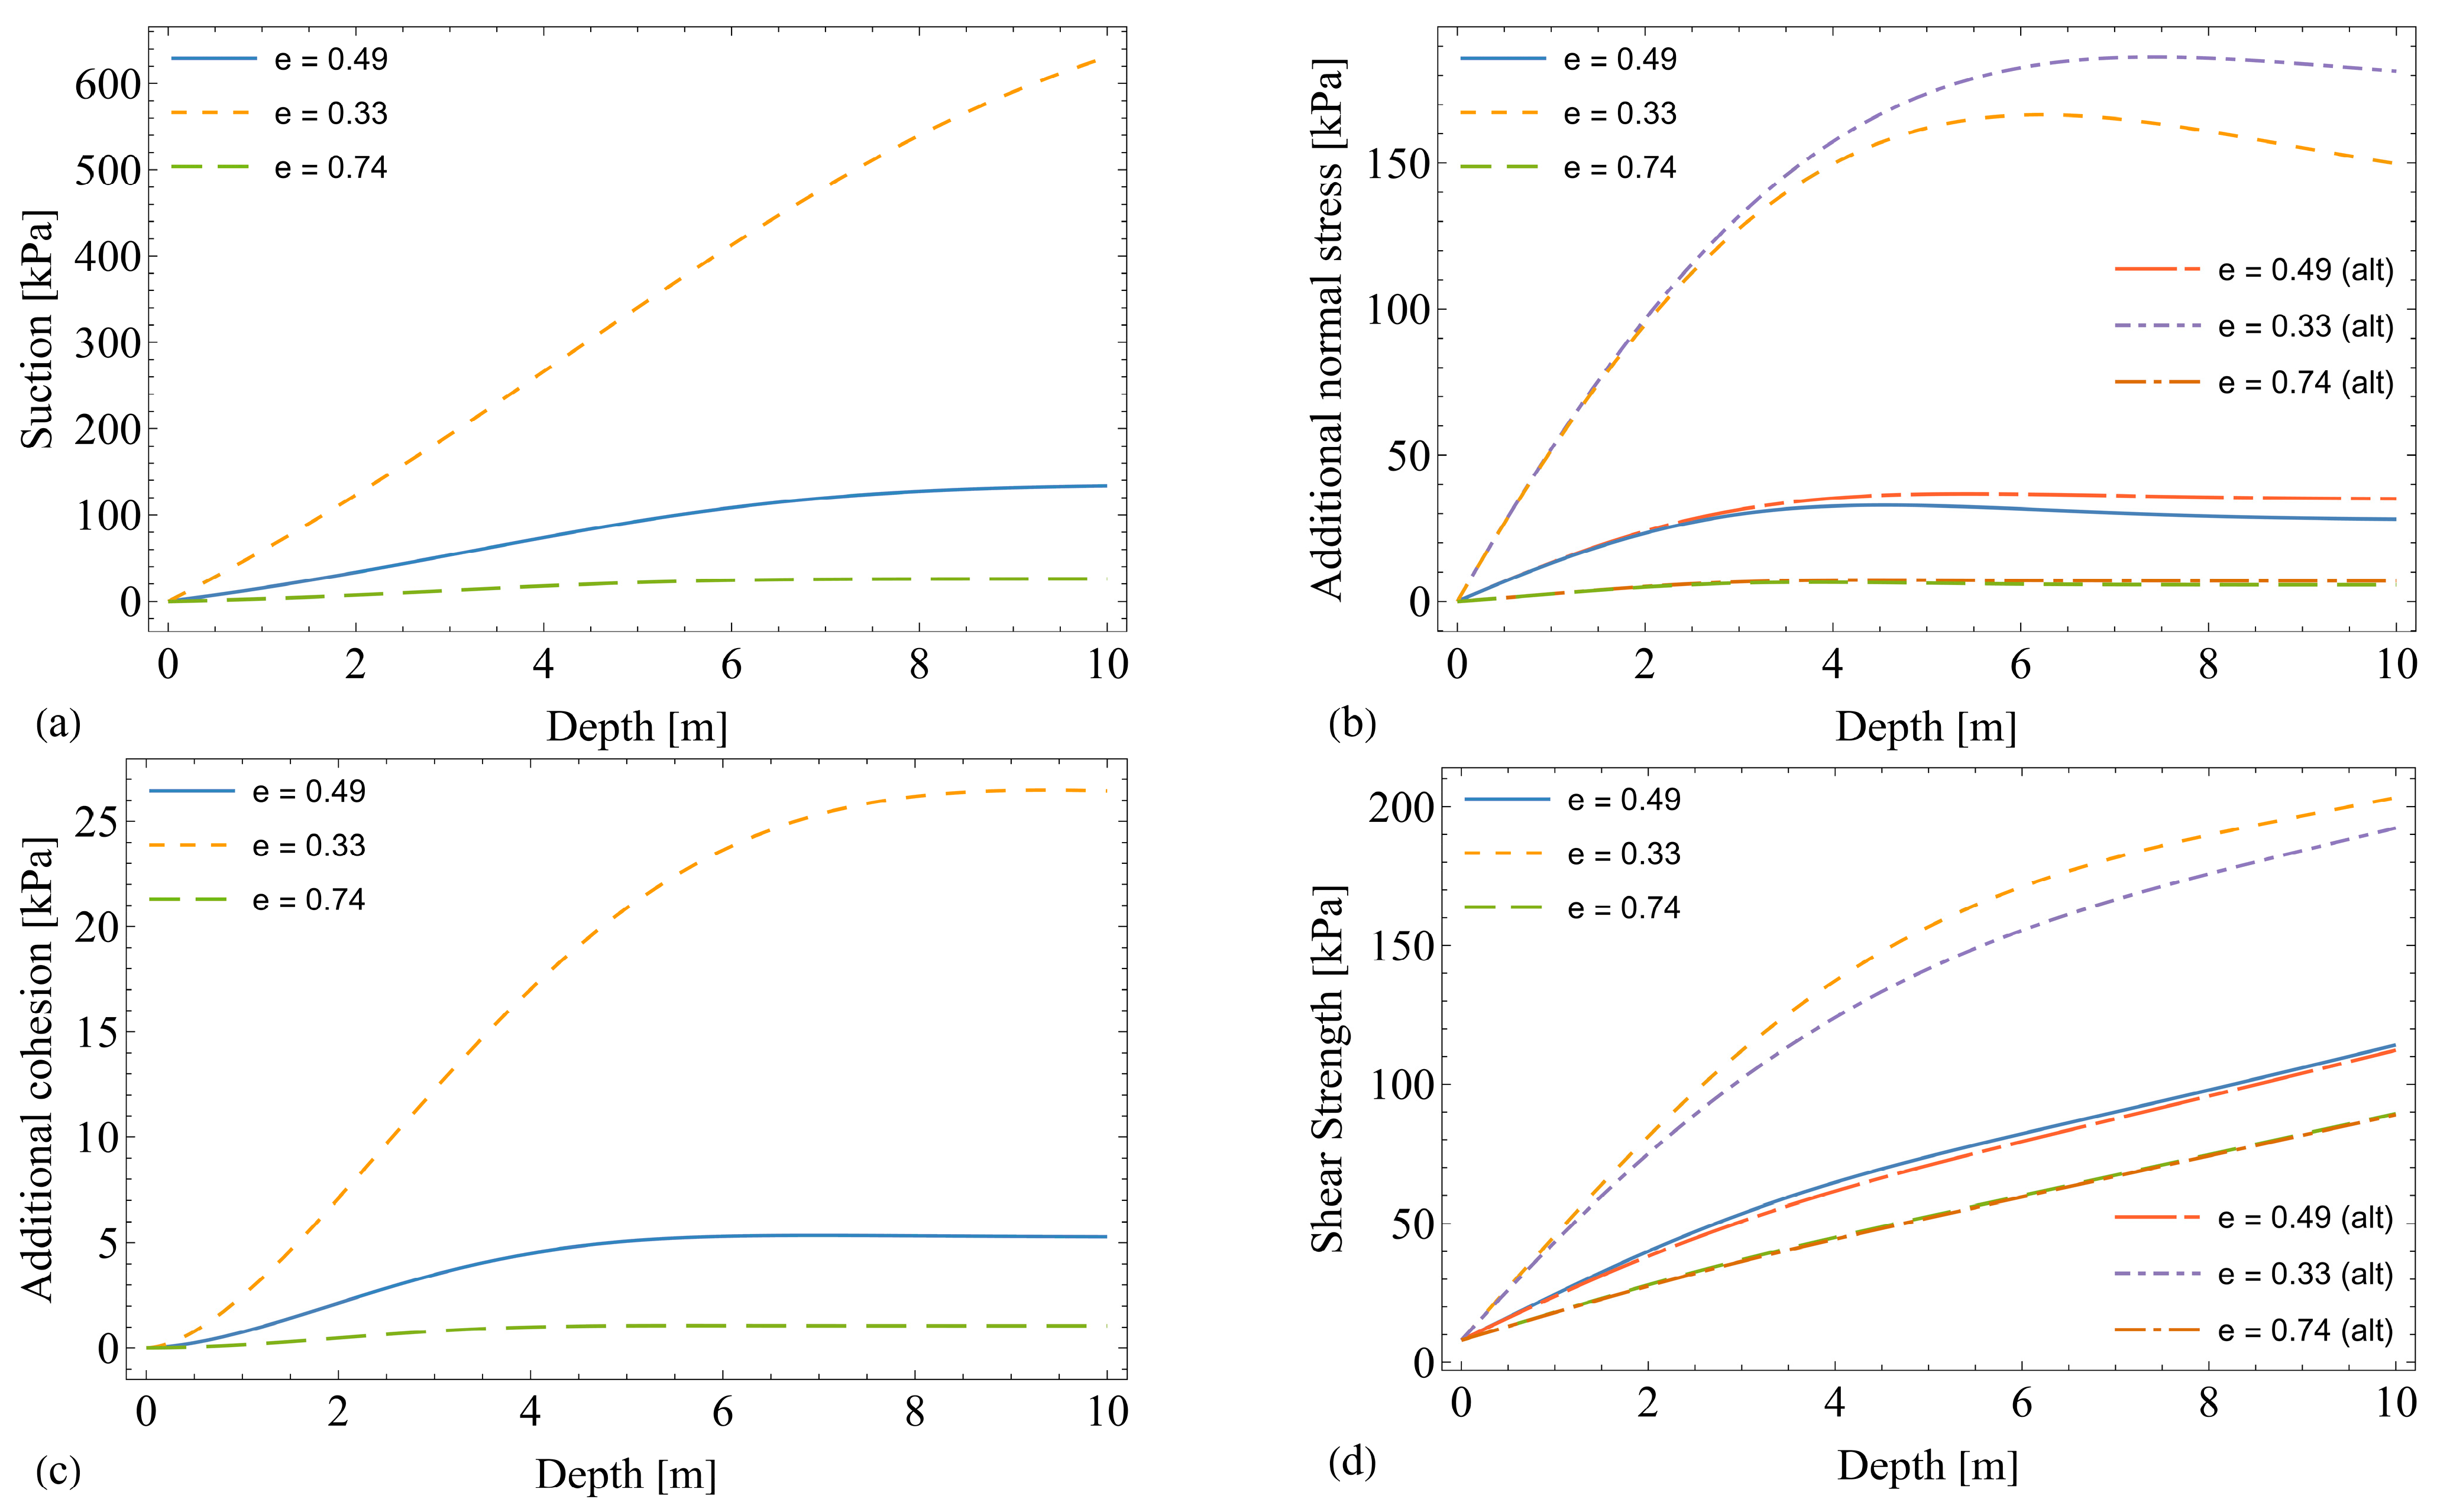
Figure 4 shows an alternative plot considering also the shear strength model adopted in typical studies [5,28]. There are two differences in this alternative unsaturated shear strength formulation: (i) the additional cohesion from Zhai et al. [29] is null; and (ii) the residual zone restraint in the effective degree of saturation is Sr = θr/θs, instead of the Srz value defined by Equation (29). In the alternative approach, the resulting additional normal stress is significantly greater for suction values beyond the air-entry value and it is not limited by the residual zone (Figure 4a). Conversely, the present model generates a higher shear strength peak (around the inflection point of the SWRC) for considering the additional cohesion, while it remains smaller than the alternative shear strength model when approaching the residual zone (Figure 4b).
As mentioned before, the residual zone restraint applied in the present model presumes that the water content in the micropores does not affect the shear failure surface. This assumption should be verified for each case in engineering practice if experimental data are available. Moreover, the soil here is considered as a continuum, and usually, a statistical approach is required to treat the soil explicitly as a multi-phase material [45,46]. In any case, by using the SWRC from Equation (4), the present modeling allows for the prediction of the unsaturated shear strength for different void ratios.

4.2. Effect of Water Infiltration for Different Initial Void Ratios

Figure 5 shows the infiltration simulation results for the shear strength state variables under the initial void ratio condition (ei = 0.49). Figure 5a shows the decrease in the soil suction due to the water infiltration. The slight total vertical stress variation (Figure 5b) arises from the small relative variation in the soil unit weight due to wetting. Following the definition from Equation (32), the total normal stress can only increase during infiltration, since external loads are not considered in this model. However, load addition formulas can be easily included in the model, enabling predictions for the strength due to punctual and distributed loads. An example would be:
σ t o t a l ( z , t ) = σ ( z , t ) + Δ σ E X T ( z )
where ΔσEXT(z) is the external load effect (ML−1T−2) for a specified depth z.
The behavior of the additional normal stress (ψSe, Figure 5c) and the additional cohesion (Figure 5d) follows the suction behavior, but with a visible peak when the suction approaches the inflection point of the corresponding SWRC. Thus, since the initial soil moisture condition (θi) corresponds to a suction value greater than the inflection point and the unsaturated part of the shear strength increases first to decrease after, following the same behavior for decreasing suction depicted in Figure 5d,e.
The unsaturated shear strength (Figure 5e,f) is reduced after a short period in the shallow domain due to its saturation. At deeper strata, the shear strength increases with time (initially) as a result of the peak behavior of both the additional normal stress and the additional cohesion. However, as infiltration persists, the shear strength remains higher than that initially due to the increase in the total vertical stress close to saturation, (like the intermediate depth from 8,0 to 10,0 m in this simulation). The shear strength loss is then critical for smaller depths, especially because the relative contribution of the total normal stress towards the shear strength becomes greater with depth (as observed and discussed in Figure 3g,h). It was not possible to notice the loss of shear strength in the deepest layer, because it remains relatively unaffected by the moisture front within the considered simulation duration.
Figure 6 shows the void ratio effect on the shear strength state variables after 1 h of water infiltration. The void ratio reduction delays the water breakthrough (Figure 6a), leading to higher suction values maintained during a longer period. Accordingly, higher additional normal stress and cohesion persist (Figure 6b,c), as expected from the prior discussion. This effect arises from the reduction in the area for the passage of the water flow, decreasing the hydraulic conductivity and, consequently, delaying the moisture front’s progression.
Since both the additional normal stress and cohesion are close to zero for the looser soil (e = 0.74), the corresponding soil shear strength in Figure 6d is basically due to the effective cohesion and total normal stress. Conversely, a more compacted soil (e = 0.33) can maintain a much higher shear strength. Since the relative increase in total stress with a smaller void ratio is usually less than 20%, due to the corresponding increase in the unit weight, the main difference arises due to the suction contribution. Hence, the influence of the void ratio on the transient flow and the unsaturated shear strength is enlightened.
Figure 6 also displays the use of the alternative shear strength model from Vanapalli et al. [5]. A denser soil (e = 0.33) retains a higher suction and a greater value for the alternative additional normal stress. However, since the suction range remains far from the residual zone in this simulation, the predicted unsaturated shear strength for the present model always remains greater than the alternative model. Disregarding effects such as softening or hardening for the load conditions applied, the use of both models allows for an evaluation of the minimum and maximum shear strength values expected for the soil investigated, which can facilitate a more accurate prediction of factors of safety and a better use of resource materials in geotechnical engineering.
From the plot in Figure 6d, Figure 7 elucidates how adopting a fully saturated approach can significantly underestimate the soil shear strength. When using Equation (35) for the calculation, where the groundwater table is assumed to be at the soil surface, it becomes evident that the void ratio primarily influences only the total stress term, thereby exerting a minor impact on the saturated shear strength, as depicted in Figure 7a. In the case of denser soil (e = 0.33), Figure 7b reveals that the unsaturated shear strength can be at least three times greater than its saturated counterpart at depths exceeding 1.0 m. Following one hour of water infiltration in a looser soil state (e = 0.74), the simulation shows that neither the additional normal stress nor the additional cohesion contribute significantly. Nevertheless, the unsaturated shear strength remains at least 1.7 times greater, as shown in Figure 7b. Therefore, in regions where the groundwater table is consistently deep, adhering to a fully saturated state model may lead to the unnecessary consumption of natural resources, in contrast to an optimized design that incorporates an unsaturated approach.
A surface plot in Figure 8 enlightens the behavior of the transient suction during the water infiltration and the resultant transient shear strength (the latter plotted on the same scale for better comparison). In agreement with Figure 3a and Figure 6a, the initial water content condition leads to a higher transient suction for a lower initial void ratio (Figure 8a,c).
Comparing Figure 8b,d, the peak contribution on the shear strength (when the suction approaches the inflection point value) is more pronounced for a denser state (as in Figure 3g). However, this effect is attenuated along the depth for a greater period, where the shear strength only decreases, as in Figure 3g,h. This occurs due to the corresponding smoothing in the suction surface, which follows from the diffusive part of the unsaturated water flow overlapping the advective flow, correlated with a minor δ value.
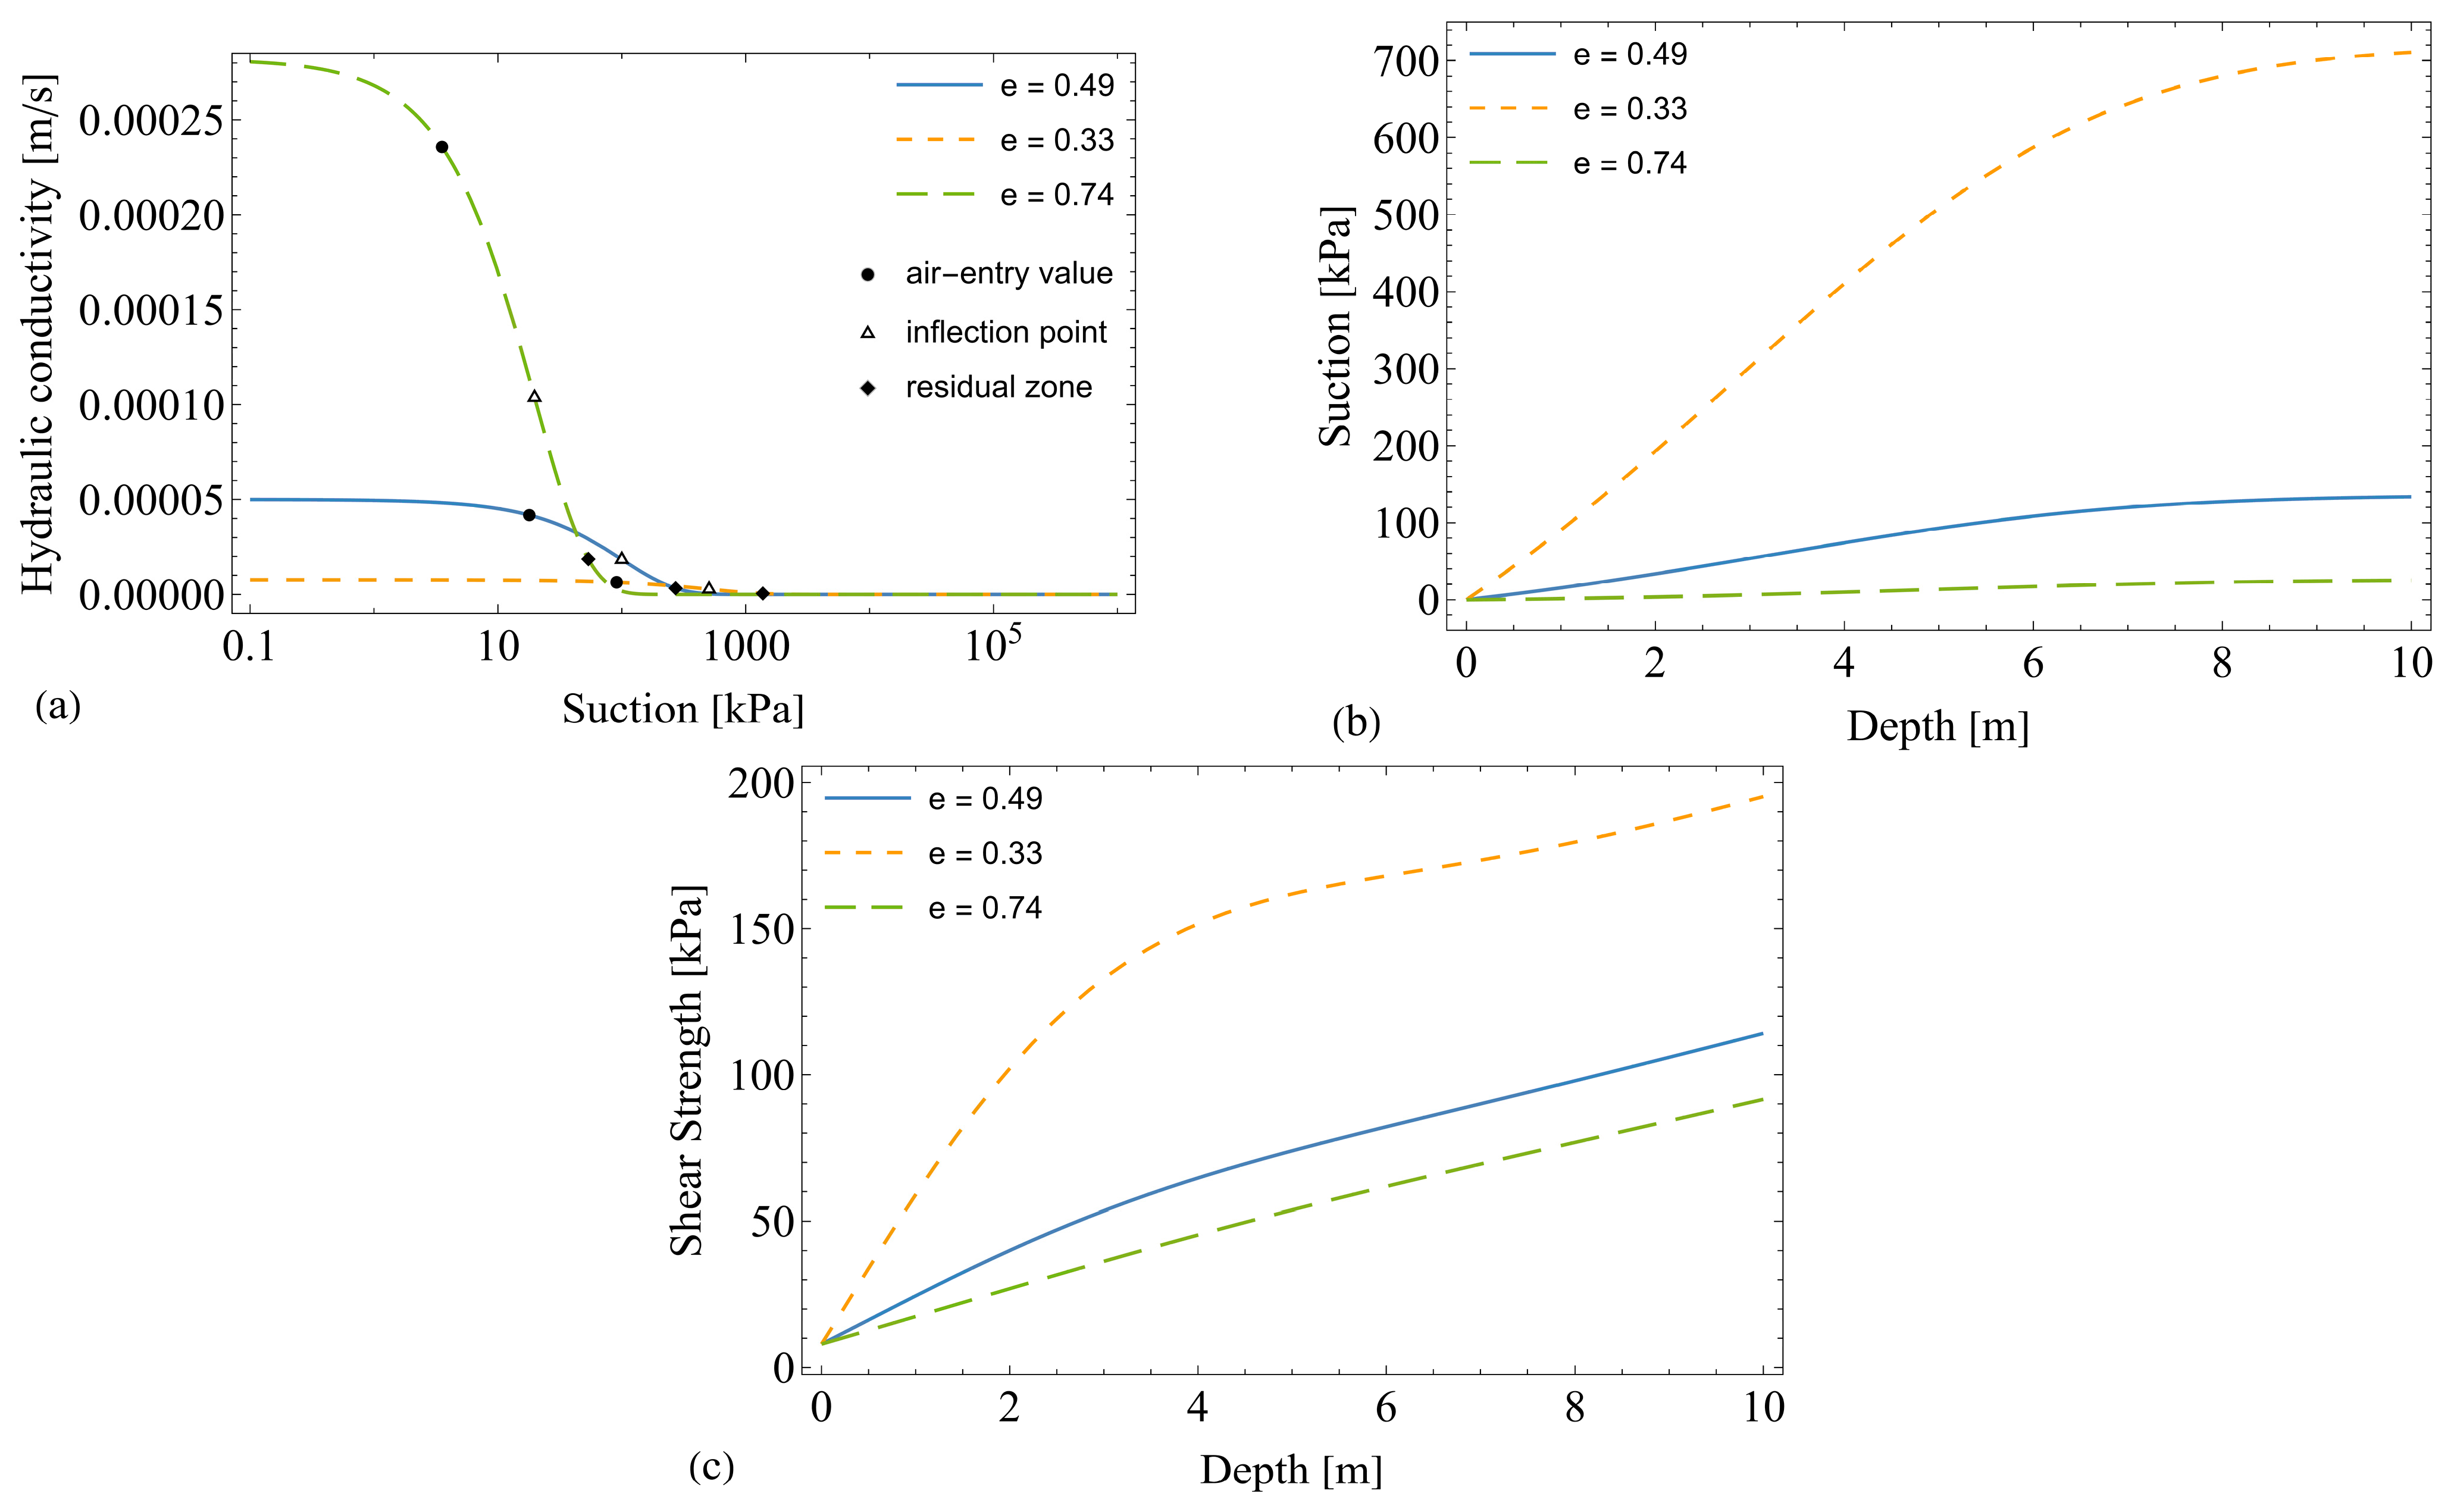
By adjusting the parameter m, one can simulate the water infiltration effect for a soil capable of retaining water (immobile) on the particles’ surface. Assuming the same parameters for the previous simulation, except for m = 1, Figure 9 illustrates this scenario.
Compared to m = 0, using m = 1 causes a larger variation in the saturated hydraulic conductivity (Figure 9a): a higher value for the looser soil (e = 0.74) and a lower value for the denser soil (e = 0.33). As the advective velocity is proportional to the saturated hydraulic conductivity, the infiltration is delayed for a denser state and intensified for a looser state, respectively, corresponding to a higher and a lower suction, as shown in Figure 9b. However, Figure 9c shows only a slight change in the unsaturated shear strength for e = 0.74 and e = 0.49. Even for the denser soil (e = 0.33), the gain in the shear strength is subtle when compared to Figure 6d. Thus, the m has a limited effect on the resultant transient shear resistance for the soil parameters adopted, where the advective part of the water flow does not overrun the diffusive one.

4.3. Concluding Remarks

The simulation was conducted using typical geotechnical parameters for a theoretical soil. Despite varying the initial void ratios and testing different soil parameters, no significant deviation from the presented results was observed; the overall behavior remained within the same order of magnitude. It is important to note that, given the soil–water retention curve (SWRC) data for two known void ratios and the saturated hydraulic conductivity corresponding to a specific void ratio, the unsaturated shear strength behavior can be accurately predicted under various water infiltration scenarios and degrees of compaction.
A key limitation of the current model is its applicability to homogeneous soils that are situated above any phreatic zone. Nevertheless, the model is specifically designed for regions where soils remain unsaturated throughout the lifespan of geotechnical structures such as landfills, natural slopes, and foundations. Consequently, this model allows for an optimized design of such structures, in contrast to the commonly used fully saturated approach in engineering practice. As a result, this model makes a significant contribution towards reducing material waste in sustainable engineering and minimizing environmental impact.
This model does not consider the effect of hysteresis associated with the SWRC, which would also suggest that there might be two shear strength envelopes, one corresponding to drying conditions and another corresponding to wetting conditions. The applicability of the models used in this study for shear strength, unidimensional water infiltration, and water retention was demonstrated in previous studies [27,29,33,40]. Then, disregarding expansive or collapsible soils (where the soil is sensitive to water content variation), the present model should be able to predict the transient shear strengths for different compaction conditions. Compared to existing models, the primary advantages of the current study include: (i) the utilization of closed-form equations, which simplifies implementation, and (ii) the ability to analytically incorporate the effect of the void ratio into the unsaturated shear strength during water infiltration.
The results presented here demonstrate the efficacy of the coupled models in simulating the unsaturated shear resistance of a soil layer along the depth, varying with time for different void ratio conditions. The accuracy of the current model relies upon the congruence between the soil–water retention curve (SWRC) fitting curve and the corresponding experimental data for the soil being investigated. Although the SWRC formulation used may not suit every soil type, it allows for an analytical method for the sensibility analysis of a practical shear strength variation problem, valuable at least for preliminary problem investigations. Subsequently, numerical modeling for water infiltration can be further refined using an SWRC with improved data fitting, optimized in conjunction with the analytical modeling presented here.

5. Conclusions

The failure of geotechnical structures due to soil saturation can lead to severe socio-environmental consequences, including the loss of human lives and irreparable environmental damage. To prevent such failures, it is essential to employ predictive models that account for the current and future behavior of these structures under varying local climatic conditions. These conditions can affect the saturation level of the porous medium. By measuring transient safety factors, these models can help to assess the structure’s stability or identify the need for corrective actions to ensure the safety, functionality, and sustainability of the construction or civil structure. In this context, the model developed in this study is particularly valuable, as it straightforwardly incorporates the effects of water infiltration and variations in the initial void ratio on the unsaturated shear strength of the soil.
The present modeling accuracy depends mainly on the adherence of the SWRC over the experimental data using only the fitting parameter δ (for each void ratio). Even though it might not be universally applicable to all soil types, the modeling framework offers a quantitative prediction of the soil strength behavior during a water infiltration event. Ultimately, the proposed analytical and closed-form equations can be easily implemented for an efficient and reliable model to foresee the complex behavior of an unsaturated soil layer subjected to the hydrological cycle.
The main contribution of the present modeling is that, given the SWRC, the shear strength parameters, and the saturated hydraulic conductivity for a known void ratio, the unsaturated shear strength fluctuations during water infiltration can be evaluated for different void ratios. The parametric analysis conducted here shows the potential of the proposed model to assess the safety condition for the design of different geotechnical structures, taking into account the variations in the soil water content and initial void ratio. The use of both the present model, which adapts the additional cohesion and the residual zone contribution from the Zhai et al. [29] model, and the Vanapalli et al. [5] model, which disregards the additional cohesion but does not restrict the contribution in the residual zone, allows for defining an interval for the shear strength range to facilitate accurate predictions of the unsaturated soil behavior. Thus, the present modeling contributes towards a low-cost design for the better use of material resources in sustainable engineering.

Author Contributions

Conceptualization, D.B.S.; formal analysis, D.B.S.; funding acquisition, D.B.S.; investigation, D.B.S. and P.F.d.S.; methodology, D.B.S.; software, D.B.S.; supervision, A.L.B.C.; validation, D.B.S. and P.F.d.S.; writing—original draft, D.B.S. and A.L.B.C.; writing—review and editing, P.F.d.S. and A.L.B.C. All authors have read and agreed to the published version of the manuscript.

Funding

This study was financed by the Foundation for Research Support of the Federal District (FAPDF, Grant 00193-00001959/2023-19). The authors also acknowledge the Coordination for the Improvement of Higher Education Personnel—Brazil (CAPES)—Finance Code 001 (Grant 88887.661632/2020-00), the support of the National Council for Scientific and Technological Development (CNPq Grants 435962/2018-3, 159613/2019-1, 137828/2019-5, 147055/2020-2 and 305484/2020-6), and the University of Brasília.

Data Availability Statement

All data, models, and codes that support the findings of this study are available from the corresponding author upon reasonable request.

Conflicts of Interest

The authors declare no conflicts of interest.

Appendix A. Residual Suction

The SWRC is plotted on a semi-logarithmic scale (Figure 2). By using the arithmetic scale with the substitution ψ = 10x, the inflection point can be determined with the second derivative of the Equation (A1), with respect to x equaling zero:
θ ( ψ ) = ( θ s θ r ) exp ( δ ψ ) + θ r
θ ( x ) = θ s θ r δ ln 10 2 10 x exp δ 10 x δ 10 x + 1 = 0
Thus, the x variable at the inflection point (xinf) is:
x i n f = log 1 / δ
and, consequently, the suction at the inflection point is ψinf = 1/δ. Confirming that the third derivative at this position is non-zero ensures that xinf is truly the inflection point:
θ ( x ) = 10 x exp ( 10 x δ ) δ 1 3 10 x δ + 10 2 x δ 2 θ s θ r ln ( 10 ) 3   θ ( x inf ) = θ s θ r ln ( 10 ) 3 / exp ( 1 ) 0
The slope of the tangent line at the inflection point (mi) can be found with the first derivative of Equation (A1), with respect to x evaluated at the inflection point:
θ ( x ) = ( θ s θ r ) δ exp ( δ 10 x ) 10 x ln 10   θ ( x inf ) = m i = ( θ s θ r ) ln 10 / exp ( 1 )
The y-intercept (or linear coefficient) of the tangent line at the inflection point (ni) can be calculated as follows:
θ ( x inf ) = ( θ s θ r ) / exp ( 1 ) + θ r = m i x inf + n i   n i = ( θ s θ r ) ln 1 / δ + ( θ s θ r ) + θ r exp ( 1 ) / exp ( 1 )
Given the exponential form in the inverse function of Equation (A1), a constant tangent line on the residual zone emerges only when ψ approaches infinity (or x tends towards infinity), exhibiting a null slope:
m r = lim x θ ( x ) = lim x δ exp ( δ 10 x ) 10 x ln 10 = 0
The corresponding y-intercept (or linear coefficient) is:
n r = lim x θ ( x ) = lim x exp ( δ 10 x ) + θ r = θ r
Finally, the intersection of the two tangent lines at a specific point xrz gives that:
m i x r z + n i = m r x r z + n r x r z = n r n i m i   x r z = log ( exp ( 1 ) ) + log ( 1 / δ )
Consequently, the resultant residual suction is described by:
10 x r z = ψ r z = exp ( 1 ) / δ

Appendix B. Continuous Function for the Additional Cohesion

One can acknowledge that ψm = (uauw) and ψi = ψN, with 0 ≤ ψmψrz. Another convenient manipulation is:
S ( ψ i + 1 ) S ( ψ i ) = s ( ψ i ) ( ψ i + 1 ψ i ) = s ( ψ i ) Δ ψ i
The modulus is applied because the term represents a probability [29] and, by definition, it must be non-negative. The term s(ψi) is the slope of the secant line given by:
s ( ψ i ) = S ( ψ i + 1 ) S ( ψ i ) / ( ψ i + 1 ψ i )
Given the above, the Equation (17) can be rewritten as:
c s ( ψ m ) = 1 π ψ m i = m N ψ i ψ m 2 arcsin ψ m ψ i ψ i ψ m 2 1 s ( ψ i ) Δ ψ i   = 1 π ψ m i = m N f ( ψ i ) s ( ψ i ) Δ ψ i
where the term inside square brackets was simplified to a function f(ψi). The sum then becomes a Riemann’s sum, which is converted into an integral applying the following limit:
c s ( ψ m ) = lim Δ ψ i 0 1 π ψ m i = m N f ( ψ i ) s ( ψ i ) Δ ψ i = 1 π ψ m ψ m ψ r f ( ψ ) S ( ψ ) d ψ
where S’(ψi) is the same limit applied to Newton’s quotient given by Equation (A12), resulting in the derivative of the degree of saturation with respect to the suction. From Equation (A1) and S(ψ) = θ(ψ)/θs, it was obtained that:
S ( ψ ) = θ s θ r δ exp ( δ ψ ) / θ s
Since S’(ψ) ≤ 0, then |S’(ψ)| = (θsθr)δexp(–δψ)/θs. Finally, the additional cohesion can be evaluated for an applied matric suction ψm as follows:
c s ( ψ m ) = 1 π ψ m θ s θ r θ s δ ψ m ψ r z ψ ψ m 2 arcsin ψ m ψ ψ ψ m 2 1 exp ( δ ψ ) d ψ
Replacing ψ by ψi (a dummy variable) and ψm by ψ(z, t, e) to contemplate the void ratio dependency during transient water flow, the function cs(z, t, e) was obtained, as in Equation (33).

References

  1. Stefanow, D.; Dudziński, P.A. Soil Shear Strength Determination Methods—State of the Art. Soil. Tillage Res. 2021, 208, 104881. [Google Scholar] [CrossRef]
  2. Fredlund, D.G.; Rahardjo, H.; Fredlund, M.D. Unsaturated Soil Mechanics in Engineering Practice; Wiley: Hoboken, NJ, USA, 2012; ISBN 9781118133590. [Google Scholar]
  3. Dantas, A.P.d.N.; Cavalcante, A.L.B. Evaluation of Antecedent Rainfall Effects in the Analysis of the Probability of Transient Failure in Unsaturated Slopes. MATEC Web Conf. 2021, 337, 3016. [Google Scholar] [CrossRef]
  4. Costa, K.R.C.B.d.; Dantas, A.P.d.N.; Cavalcante, A.L.B.; Assis, A.P.d. Probabilistic Approach to Transient Unsaturated Slope Stability Associated with Precipitation Event. Sustainability 2023, 15, 15260. [Google Scholar] [CrossRef]
  5. Vanapalli, S.K.; Fredlund, D.G.; Pufahl, D.E.; Clifton, A.W. Model for the Prediction of Shear Strength with Respect to Soil Suction. Can. Geotech. J. 1996, 33, 379–392. [Google Scholar] [CrossRef]
  6. Tran, T.P.A.; Fredlund, D.G. Verification of the Fredlund (2019) Unsaturated Shear Strength Function. Geosciences 2021, 11, 151. [Google Scholar] [CrossRef]
  7. Macedo, E.S.d.; Sandre, L.H. Deaths from Landslides in Brazil: 1988 to 2022. Rev. Bras. Geol. Eng. Ambient. 2022, 12, 110–117. [Google Scholar]
  8. Ben Sim, K.; Lee, M.L.; Wong, S.Y. A Review of Landslide Acceptable Risk and Tolerable Risk. Geoenviron. Disasters 2022, 9, 3. [Google Scholar]
  9. Petley, D. Global Patterns of Loss of Life from Landslides. Geology 2012, 40, 927–930. [Google Scholar] [CrossRef]
  10. Ng, C.W.W.; Shi, Q. Influence of Rainfall Intensity and Duration on Slope Stability in Unsaturated Soils. Q. J. Eng. Geol. 1998, 31, 105–113. [Google Scholar] [CrossRef]
  11. Ray, R.L.; Jacobs, J.M.; de Alba, P. Impacts of Unsaturated Zone Soil Moisture and Groundwater Table on Slope Instability. J. Geotech. Geoenviron. Eng. 2010, 136, 1448–1458. [Google Scholar] [CrossRef]
  12. Cho, S.E.; Lee, S.R. Instability of Unsaturated Soil Slopes Due to Infiltration. Comput. Geotech. 2001, 28, 185–208. [Google Scholar] [CrossRef]
  13. Batali, L.; Andreea, C. Slope Stability Analysis Using the Unsaturated Stress Analysis. Case Study. Proc. Procedia Eng. 2016, 143, 284–291. [Google Scholar]
  14. Oh, S.; Lu, N. Slope Stability Analysis under Unsaturated Conditions: Case Studies of Rainfall-Induced Failure of Cut Slopes. Eng. Geol. 2015, 184, 96–103. [Google Scholar] [CrossRef]
  15. Zhang, X.; Wang, H.; Gao, Z.; Xiang, K.; Zhai, Q.; Satyanaga, A.; Chua, Y.S. Evaluation of the Performance of the Horizontal Drain in Drainage of the Infiltrated Water from Slope Soil under Rainfall Conditions. Sustainability 2023, 15, 14163. [Google Scholar] [CrossRef]
  16. Toli, A.; Giudici, M. Modeling Water Flow in Variably Saturated Porous Soils and Alluvial Sediments. Sustainability 2023, 15, 15723. [Google Scholar] [CrossRef]
  17. Wu, X.; Vanapalli, S.K. Three-Dimensional Modeling of the Mechanical Behavior of a Single Pile in Unsaturated Expansive Soils during Infiltration. Comput. Geotech. 2022, 145, 104696. [Google Scholar] [CrossRef]
  18. Liu, Y.; Vanapalli, S.K. Mechanical Behavior of a Floating Model Pile in Unsaturated Expansive Soil Associated with Water Infiltration: Laboratory Investigations and Numerical Simulations. Soils Found. 2021, 61, 929–943. [Google Scholar] [CrossRef]
  19. Liu, Y.; Vanapalli, S.K. Modified Shear Displacement Method for Analysis of Piles in Unsaturated Expansive Soils Considering Influence of Environmental Factors. Int. J. Geomech. 2022, 22, 04022069. [Google Scholar] [CrossRef]
  20. Tan, M.; Vanapalli, S.K. Foundation Bearing Capacity Estimation on Unsaturated Soil Slope under Transient Flow Condition Using Slip Line Method. Comput. Geotech. 2022, 148, 104804. [Google Scholar] [CrossRef]
  21. Kong, X.; Cai, G.; Cheng, Y.; Zhao, C. Numerical Implementation of Three-Dimensional Nonlinear Strength Model of Soil and Its Application in Slope Stability Analysis. Sustainability 2022, 14, 5127. [Google Scholar] [CrossRef]
  22. Nguyen, T.S.; Likitlersuang, S. Reliability Analysis of Unsaturated Soil Slope Stability under Infiltration Considering Hydraulic and Shear Strength Parameters. Bull. Eng. Geol. Environ. 2019, 78, 5727–5743. [Google Scholar] [CrossRef]
  23. Kim, Y.; Jeong, S.; Kim, J. Coupled Infiltration Model of Unsaturated Porous Media for Steady Rainfall. Soils Found. 2016, 56, 1071–1081. [Google Scholar] [CrossRef]
  24. Kumar, S.; Kumar, A. Effect of Infiltration on Single-Pile and Monopile–Raft Foundation Embedded in Unsaturated Sand. Int. J. Geomech. 2023, 23, 04022288. [Google Scholar] [CrossRef]
  25. Aventian, G.D.; Satyanaga, A.; Sagu, A.; Serikbek, B.; Pernebekova, G.; Aubakirova, B.; Zhai, Q.; Kim, J. Analytical and Finite-Element-Method-Based Analyses of Pile Shaft Capacity Subjected to Rainfall Infiltration. Sustainability 2024, 16, 313. [Google Scholar] [CrossRef]
  26. Cavalcante, A.L.B.; Zornberg, J.G. Efficient Approach to Solving Transient Unsaturated Flow Problems. I: Analytical Solutions. Int. J. Geomech. 2017, 17, 04017013. [Google Scholar] [CrossRef]
  27. Costa, M.B.A.d.; Cavalcante, A.L.B. Novel Approach to Determine Soil–Water Retention Surface. Int. J. Geomech. 2020, 20, 4020054. [Google Scholar] [CrossRef]
  28. Lu, N.; Godt, J.W.; Wu, D.T. A Closed-Form Equation for Effective Stress in Unsaturated Soil. Water Resour. Res. 2010, 46, W05515. [Google Scholar] [CrossRef]
  29. Zhai, Q.; Rahardjo, H.; Satyanaga, A.; Dai, G. Estimation of Unsaturated Shear Strength from Soil–Water Characteristic Curve. Acta Geotech. 2019, 14, 1977–1990. [Google Scholar] [CrossRef]
  30. Richards, L.A. Capillary Conduction of Liquids through Porous Mediums. J. Appl. Phys. 1931, 1, 318–333. [Google Scholar] [CrossRef]
  31. Zhai, Q.; Rahardjo, H. Determination of Soil-Water Characteristic Curve Variables. Comput. Geotech. 2012, 42, 37–43. [Google Scholar] [CrossRef]
  32. Soltani, A.; Azimi, M.; Deng, A.; Taheri, A. A Simplified Method for Determination of the Soil–Water Characteristic Curve Variables. Int. J. Geotech. Eng. 2017, 13, 316–325. [Google Scholar] [CrossRef]
  33. Costa, M.B.A.d.; Cavalcante, A.L.B. Bimodal Soil–Water Retention Curve and k-Function Model Using Linear Superposition. Int. J. Geomech. 2021, 21, 04020054. [Google Scholar] [CrossRef]
  34. Tschapek, M.; Scoppa, C.O.; Wasowski, C. The Surface Tension of Soil Water. J. Soil. Sci. 1978, 29, 17–21. [Google Scholar] [CrossRef]
  35. Otalvaro, I.F.; Neto, M.P.C.; Delage, P.; Caicedo, B. Relationship between Soil Structure and Water Retention Properties in a Residual Compacted Soil. Eng. Geol. 2016, 205, 73–80. [Google Scholar] [CrossRef]
  36. Kozeny, J. Uber Kapillare Leitung Der Wasser in Boden. Sitzungsber. Akad. Wiss. Wien. 1927, 136, 271–306. [Google Scholar]
  37. Carman, P.C. Fluid Flow through Granular Beds. Trans. Inst. Chem. Eng. 1937, 15, 32–48. [Google Scholar] [CrossRef]
  38. Costa, A. Permeability-Porosity Relationship: A Reexamination of the Kozeny-Carman Equation Based on a Fractal Pore-Space Geometry Assumption. Geophys. Res. Lett. 2006, 33, L02318. [Google Scholar] [CrossRef]
  39. Wang, M.; Wang, J.; Xu, G.; Zheng, Y.; Kang, X. Improved Model for Predicting the Hydraulic Conductivity of Soils Based on the Kozeny-Carman Equation. Hydrol. Res. 2021, 52, 719–733. [Google Scholar] [CrossRef]
  40. Ren, X.; Zhao, Y.; Deng, Q.; Kang, J.; Li, D.; Wang, D. A Relation of Hydraulic Conductivity—Void Ratio for Soils Based on Kozeny-Carman Equation. Eng. Geol. 2016, 213, 89–97. [Google Scholar] [CrossRef]
  41. Bishop, A.W. The Principle of Effective Stress. Tek. Ukebl. 1959, 39, 859–863. [Google Scholar]
  42. Jommi, C. Remarks on the Constitutive Modeling of Unsaturated Soils. In Experimental Evidence and Theoretical Approaches in Unsaturated Soils; Tarantino, A., Mancuso, C., Eds.; Balkema: Rotterdam, The Netherlands, 2000; pp. 139–153. ISBN 9058091864. [Google Scholar]
  43. Cavalcante, A.L.B.; Mascarenhas, P.V.S. Efficient Approach to Modeling Unsaturated Soils Shear Strength Using the Soil Water Retention Curve. Acta Geotech. 2021, 16, 3177–3186. [Google Scholar] [CrossRef]
  44. Santos, D.B.; Lemos, M.A.d.C.; Cavalcante, A.L.B. Transient Unsaturated Shaft Resistance of a Single Pile during Water Flow. MATEC Web Conf. 2021, 337, 03007. [Google Scholar] [CrossRef]
  45. Li, K.Q.; Li, D.Q.; Liu, Y. Meso-Scale Investigations on the Effective Thermal Conductivity of Multi-Phase Materials Using the Finite Element Method. Int. J. Heat. Mass. Transf. 2020, 151, 119383. [Google Scholar] [CrossRef]
  46. Li, K.Q.; Liu, Y.; Yin, Z.Y. An Improved 3D Microstructure Reconstruction Approach for Porous Media. Acta Mater. 2023, 242, 118472. [Google Scholar] [CrossRef]
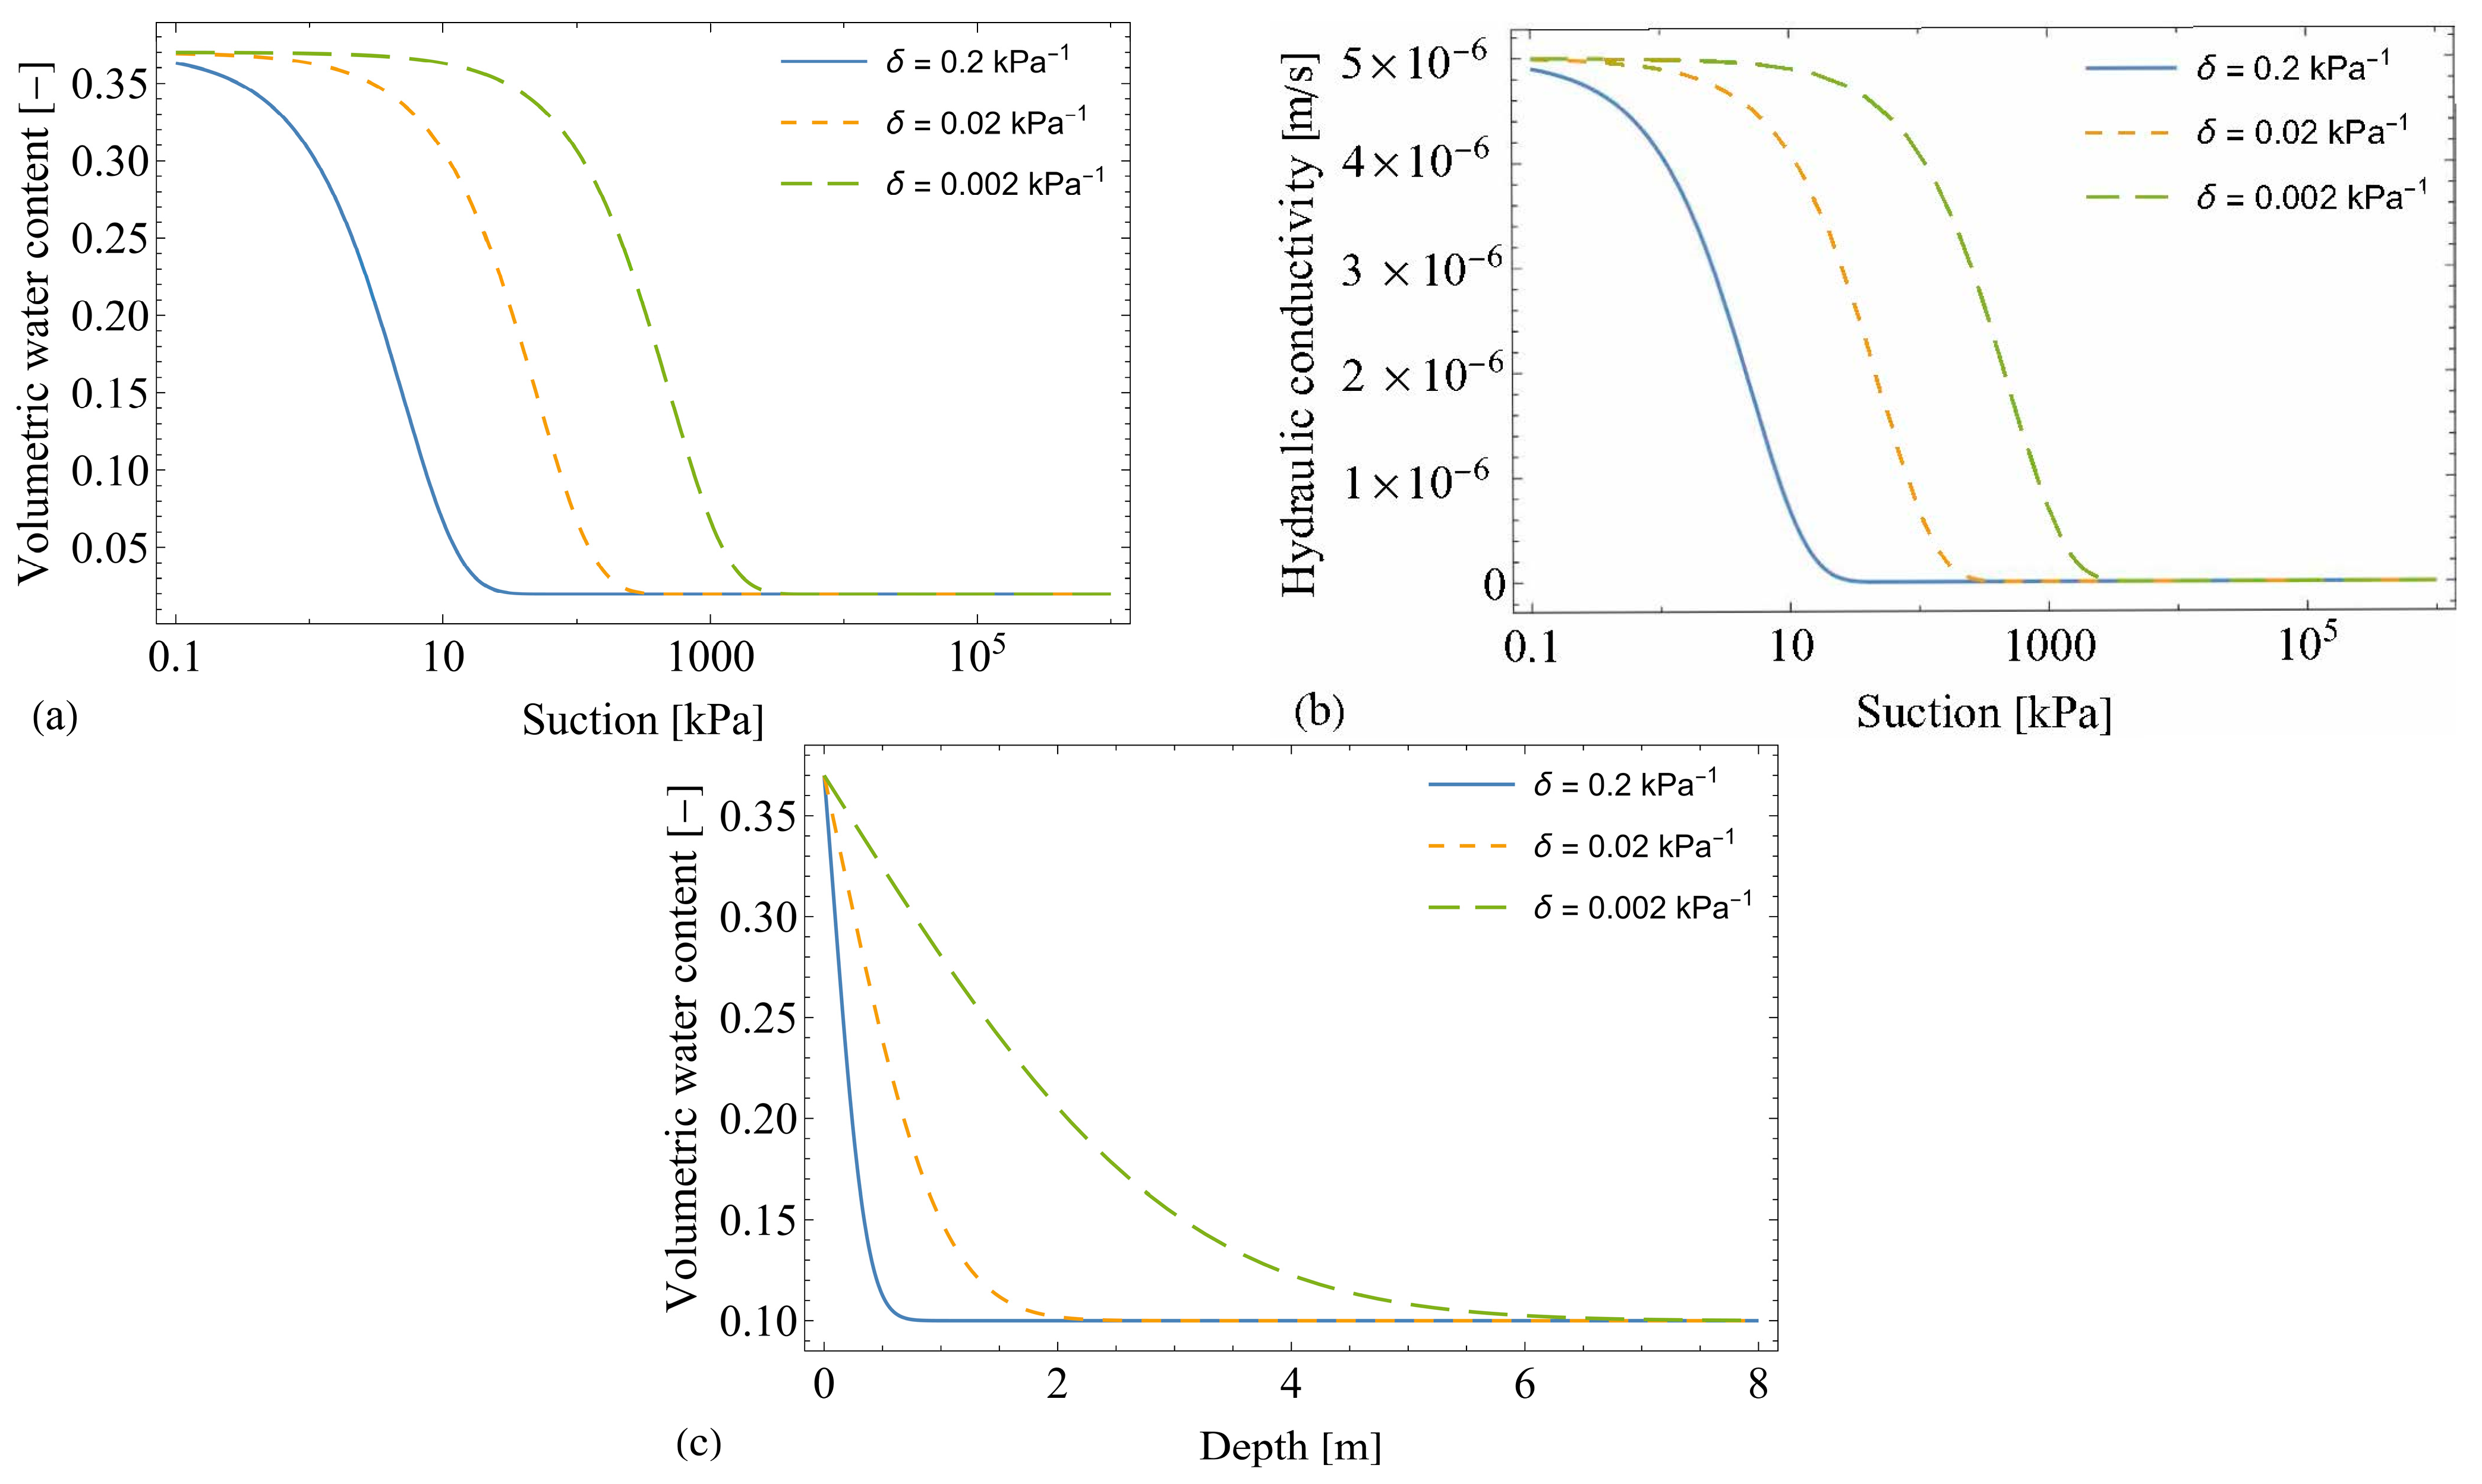
Figure 1. Effect of the hydraulic fitting parameter δ on (a) volumetric water content, (b) hydraulic conductivity, and (c) transient volumetric water content after one hour of infiltration (θ0 = θs = 0.37, θr = 0.02, θi = 0.10, and ks = 5 × 10⁻⁶ m/s).
Sustainability 16 01394 g001
Figure 2. Graphical scheme of the SWRC highlighting its air-entry value and residual zone (θs = 0.40; θr = 0.04; and δ = 0.05 kPa−1).
Sustainability 16 01394 g002
Figure 3. SWRC (a) and k-function (b) for different void ratios in the same soil; pore size distribution (c); effect of the suction in the additional normal stress (d) and the additional cohesion (e) for different void ratios; total normal stress (f) and unsaturated shear strength for the depth of 1 m (g); and unsaturated shear strength for the depth of 5 m (h).
Sustainability 16 01394 g003
Figure 4. Comparison of the present model (Equation (34)) with the Vanapalli et al. [5] model for the additional cohesion (a) and unsaturated shear strength for the depth of 1 m (b). The Vanapalli et al. [5] model is indicated by “alt” in this figure.
Sustainability 16 01394 g004
Figure 5. Water infiltration effect along depth on the suction (a), the shear strength components (bd), and the shear strength itself varying with depth (e) and time (f).
Sustainability 16 01394 g005
Figure 6. Void ratio effect along depth on the suction (a), additional normal stress (b), additional cohesion (c), and unsaturated shear strength after 1 h of water infiltration (d). The Vanapalli et al. [5] model is indicated by “alt” in this figure.
Sustainability 16 01394 g006
Figure 7. Comparison between a fully saturated approach and the unsaturated shear strength after 1 h of water infiltration: (a) shear strength value and (b) ratio between the unsaturated approach over the saturated one.
Sustainability 16 01394 g007
Figure 8. Transient suction during water infiltration and the corresponding unsaturated shear strength for the initial void ratio, ei = 0.49 (a,b), and the denser soil, e = 0.33 (c,d).
Sustainability 16 01394 g008aSustainability 16 01394 g008b
Figure 9. Void ratio effect for a silty soil (m = 1) on the k-function (a), the suction for a transient water infiltration of 1 h (b), and the corresponding transient unsaturated shear strength (c).
Sustainability 16 01394 g009
Disclaimer/Publisher’s Note: The statements, opinions and data contained in all publications are solely those of the individual author(s) and contributor(s) and not of MDPI and/or the editor(s). MDPI and/or the editor(s) disclaim responsibility for any injury to people or property resulting from any ideas, methods, instructions or products referred to in the content.