Article

Integrating Firefly and Crow Algorithms for the Resilient Sizing and Siting of Renewable Distributed Generation Systems under Faulty Scenarios

by
Abdullrahman A. Al-Shamma’a
1,
Hassan M. Hussein Farh
1,* and
Khalil Alsharabi
2
1
Electrical Engineering Department, College of Engineering, Imam Mohammad Ibn Saud Islamic University, Riyadh 11564, Saudi Arabia
2
Electrical Engineering Department, College of Engineering, King Saud University, Riyadh 11421, Saudi Arabia
*
Author to whom correspondence should be addressed.
Sustainability 2024, 16(4), 1521; https://doi.org/10.3390/su16041521
Submission received: 9 January 2024 / Revised: 7 February 2024 / Accepted: 8 February 2024 / Published: 10 February 2024
(This article belongs to the Section Energy Sustainability)

Abstract

:
This study aimed to optimize the sizing and allocation of renewable distributed generation (RDG) systems, with a focus on renewable sources, under N-1 faulty line conditions. The IEEE 30-bus power system benchmark served as a case study for us to analyze and enhance the reliability and quality of the power system in the presence of faults. The firefly algorithm (FFA) combined with the crow search (CS) optimizer was used to achieve optimal RDG sizing and allocation through solving the optimal power flow (OPF) under the most severe N-1 faulty line. The reason for hybridization lies in leveraging the global search capabilities of the CS optimizer for the sizing and allocation of RDGs and the local search proficiency of the FFA for OPF. Two severe N-1 faulty conditions—F27-29 and F27-30—were separately applied to the IEEE 30-bus distribution system. The most severe N-1 faulty line of these two faulty lines was F27-30, based on a severity ranking index including both the voltage deviation index and the overloading index. Three candidate buses, namely 27, 29, and 30, were considered in the optimization process. Our methodology incorporated techno-economic multi-objectives, encompassing overall costs, power losses, and voltage deviation. The optimizer can eliminate the impractical buses/solutions automatically while remaining the practical one. The results revealed that optimal RDG allocation at bus 30 effectively alleviated line overloading, ensuring compliance with the line flow limit, reducing costs, and enhancing voltage profiles, thereby improving system performance under N-1 faulty conditions compared to the equivalent case without RDGs.

1. Introduction

1.1. Motivation and Incitement

Renewable distributed generation (RDG) systems entail the production of electricity through utilizing renewable energy sources, such as solar power, wind power, hydropower, and biomass, situated in proximity to the point of consumption, frequently within residential, commercial, or industrial premises. RDG systems wield substantial significance and influence over the energy paradigm, concurrently mitigating greenhouse gas emissions, CO2, and lessening reliance on fossil fuels [1,2,3]. This dual impact yields techno-economic and environmental advantages for both utilities and consumers, fostering sustainability, mitigating climate change, and enhancing air quality. Also, they enhance energy independence through allowing consumers to produce their own electricity, reducing reliance on the traditional centralized utilities and systems and providing greater energy independence. This can be especially important during power outages or grid disruptions. RDG systems can also enhance the resilience of the power grid by reducing its vulnerability to large-scale outages. When integrated into the grid, RDG systems exhibit resilience by providing power to critical loads, even during grid failures. Simultaneously, localized electricity generation minimizes transmission and distribution losses associated with the long-distance transportation of electricity [4]. This approach enhances the voltage profile and overall system efficiency [5,6,7]. Realizing these diverse benefits is contingent on the precise allocation and sizing of Distributed Generators (DGs) within power system networks. Conversely, inadequate allocation and sizing may exacerbate power losses, potentially compromising the efficacy of the electricity infrastructure, leading to diminished quality, instability, and unreliability [8,9].
In brief, RDGs are not just about generating electricity; they are about shaping a more sustainable, resilient, and equitable energy future. They empower individuals and communities to make a positive impact on the planet while enjoying financial benefits and energy independence. Embracing RDGs is not just a choice; it is an opportunity to be part of a global movement toward a cleaner, more sustainable energy future. On the other hand, RDGs encourage research and development in renewable energy technologies, leading to improvements in efficiency, cost-effectiveness, and energy storage solutions.

1.2. Literature Review and Research Gap

Utility companies and grid operators carefully plan and monitor their systems to minimize the impact of N-1 faults by installing DGs at optimal places through solving the optimal power flow problem using various optimization techniques [1]. They may also employ various strategies, including load shedding, network reconfiguration, and controlled switching, to mitigate voltage problems and maintain system stability. Additionally, advanced grid technologies and automation systems can help in responding to and managing N-1 faults more effectively to minimize their impact on voltage profiles and overall system reliability. Diverse optimization techniques have been developed and applied to address the optimal power flow (OPF) challenges associated with RDGs. These methodologies can be categorized into three groups: soft computing approaches, traditional methods, and analytical methods. Each category has advantages and disadvantages. Although analytical methods are precise, non-iterative, and computationally efficient, their applicability to numerous DGs and goals is restricted because of their local solution vulnerability. Analytical formulae have been used in previous research [10,11,12,13,14,15] to estimate the optimal placement and size of a single Distributed Generator with a single goal in mind—minimizing power losses in the power network. Traditional methods include sequential quadratic programming, dynamic programming, ordinal optimization, OPF, linear programming, non-linear programming, and continuous power flow [16]. Conversely, global solution identification is a strong suit for soft computing approaches, which are categorized under artificial intelligence (AI) and bio-inspired (BI) optimization. Artificial neural networks (ANNs), fuzzy logic control (FLC), genetic algorithms (GAs) [17,18,19], and differential evolution (DE) [20] are some of the methods used in AI-based optimization. BI-based methods include the following: ant colony, artificial bee colony, simulated annealing, intelligent water drop, cuckoo search optimization, teach learning-based optimization [20], the shuffled frog leaping algorithm [16], bonobo optimizer, particle swarm optimization (PSO), and the artificial ecosystem optimizer [21,22,23].
The determination of the optimal allocation and sizing for Distributed Generators (DGs) is contingent on the predefined objective functions established by designers and planners. These functions, whether single- or multi-objective, encompass technical and/or economic goals and are subject to various equality and inequality constraints. Previous studies [20,24,25,26,27,28,29,30] have predominantly concentrated on technical objectives, encompassing power losses (both active and reactive), power system load capability, voltage deviations, voltage stability, and emissions from generating units. In contrast, other investigations [18,31,32,33,34] have emphasized economic objectives, including fuel costs, active and reactive power costs, and the investment costs associated with optimal DGs, often overlooking technical considerations.

1.3. Novelty and Contributions

The imperative need to enhance the technical and economic performance of power systems, particularly under both normal and abnormal/faulty conditions, necessitates the achievement of the optimal sizing and siting of Distributed Generators (DGs). This study focuses on the optimal sizing and siting of Renewable Distributed Generators (RDGs) within a standard distribution system under N-1 line outage contingency or faulty conditions, specifically within the IEEE 30-bus power system benchmark. The key objectives and contributions of this study are as follows:
A thorough examination and assessment of the sizing and siting of RDGs are conducted under N-1 faulty line conditions, specifically focusing on faulty lines F27-29 and F27-30 within the IEEE 30-bus power distribution system, which cause overloading issues. The severity ranking index, which considers both voltage deviation and overloading, was employed to determine the most severe N-1 faulty line.
The utilization of the firefly algorithm combined with the crow search optimizer to achieve optimal RDG sizing and allocation by solving the OPF problem under the most severe N-1 line (F27-30) with three candidate buses 27, 29, and 30 (nearest buses to faulty line F27-30).
The optimization process incorporates multiple techno-economic objectives, including overall costs, power losses, and voltage deviation. The hybrid optimizer eliminates impractical solutions automatically, retaining practical ones, thus enhancing both global search capabilities and local search proficiency.
The findings obtained indicate that the optimal allocation and sizing of DGs at bus 30 effectively alleviated line overloading in scenarios F27-30 and F27-29, ensuring compliance with the line flow limit. Furthermore, it led to a reduction in total costs and enhancements in the voltage profile compared to an equivalent case without RDGs.

2. Description of the IEEE 30-Bus Distribution System under N-1 Faulty Conditions

In this study, two severe N-1 faulty conditions were applied to the IEEE 30-bus power distribution system separately, as shown in Figure 1. The two severe N-1 faulty lines under study are F27-29 and F27-30, as illustrated in Figure 1. Fx-y means that the line between bus x and y is out of service, and so on. Table 1 provides a summary of the data for the IEEE-30 bus power distribution network utilized in this study.
The logical steps followed to address the two N-1 faulty line conditions under study (with and without RDGs) can be summarized as follows:
  • Apply a line outage or fault to the line between bus 27 and 29 (F27-29) and the line between bus 27 and 30 (F27-29) separately.
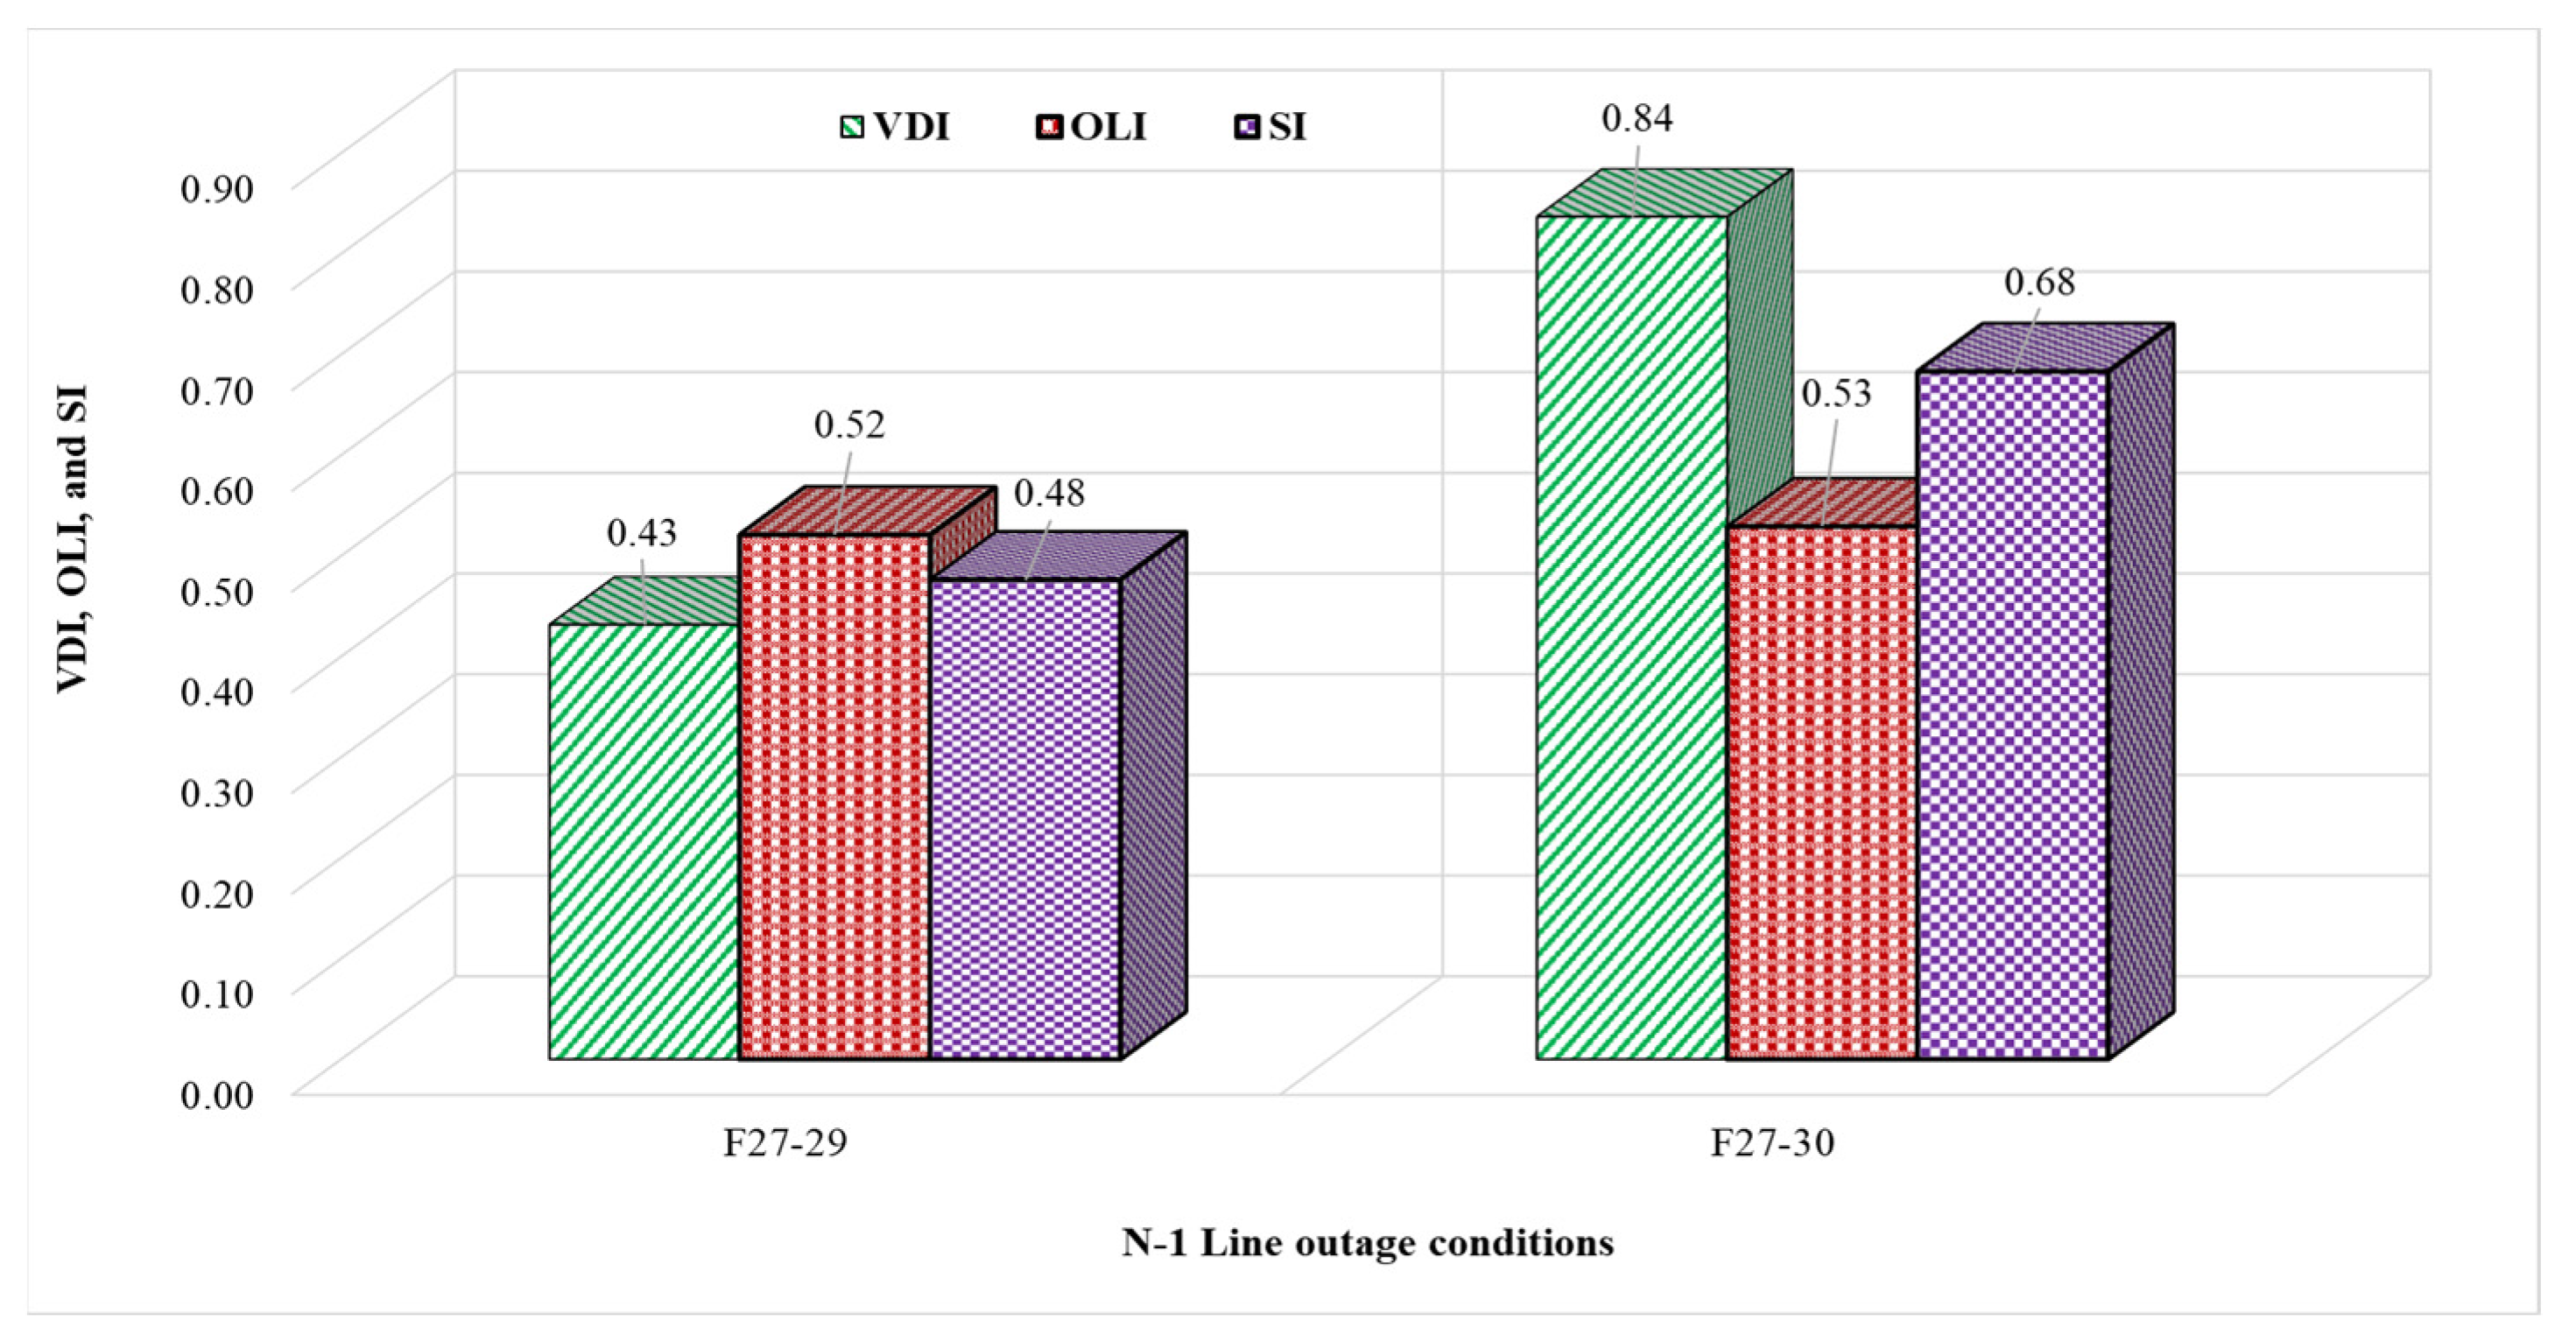
  • Identify the most critical N-1 faulty line among F27-29 and F27-30 by employing the severity index (SI). The SI comprises two weighted indices: the voltage deviation index (VDI) and the overloading index (OLI). The VDI provides insights into the power system’s quality, whereas the OLI provides insights into its reliability. Consequently, the SI serves as an assessment tool for both the reliability and quality of the power system and can be defined as follows [4]:
S I = w O L I · O L I + w V D I · V D I  
The weights assigned to OLI and VDI, denoted as w O L I and w V D I , respectively, are constrained within the range of [0, 1]. The summation of both w O L I and w V D I   equals unity. Therefore, w O L I = w V D I = 0.5 was assumed in this study. The mathematical formulas for OLI and VDI are expressed as follows [23,35]:
O L I = N = 1 N B r       S i N       S i m a x  
V D I = i = 1 N b u s V i       V i r e f       V i r e f
where the real and maximum MVA limit values for line i are S i N and S i N , respectively. NBr is the number of branches, and V i   and V i r e f are the voltage at load, its actual and reference values, respectively.
Table 2 and Figure 2 show the VDI, OLI, and SI calculations for the two N-1 faulty lines under study: F27-29 and F27-30. As shown in Table 2, the occurrence of fault F27-29 causes an overloading% on the line between buses 27–30 of 104.5%, while the occurrence of F27-30 causes an overloading% on the line between buses 27–29 of 105.9%. Both F27-29 and F27-30 cause overloading for each other. The existence of overloaded lines due to the N-1 line outage provides an initial indication about the severity of this line outage and the unreliability of the power system. The most severe N-1 faulty line can be determined based on the SI, which represents a combination of the OLI and VDI. As shown in Table 2 and Figure 2, the most severe N-1 faulty line is F27-30, which has a higher SI compared to F27-29.
3.
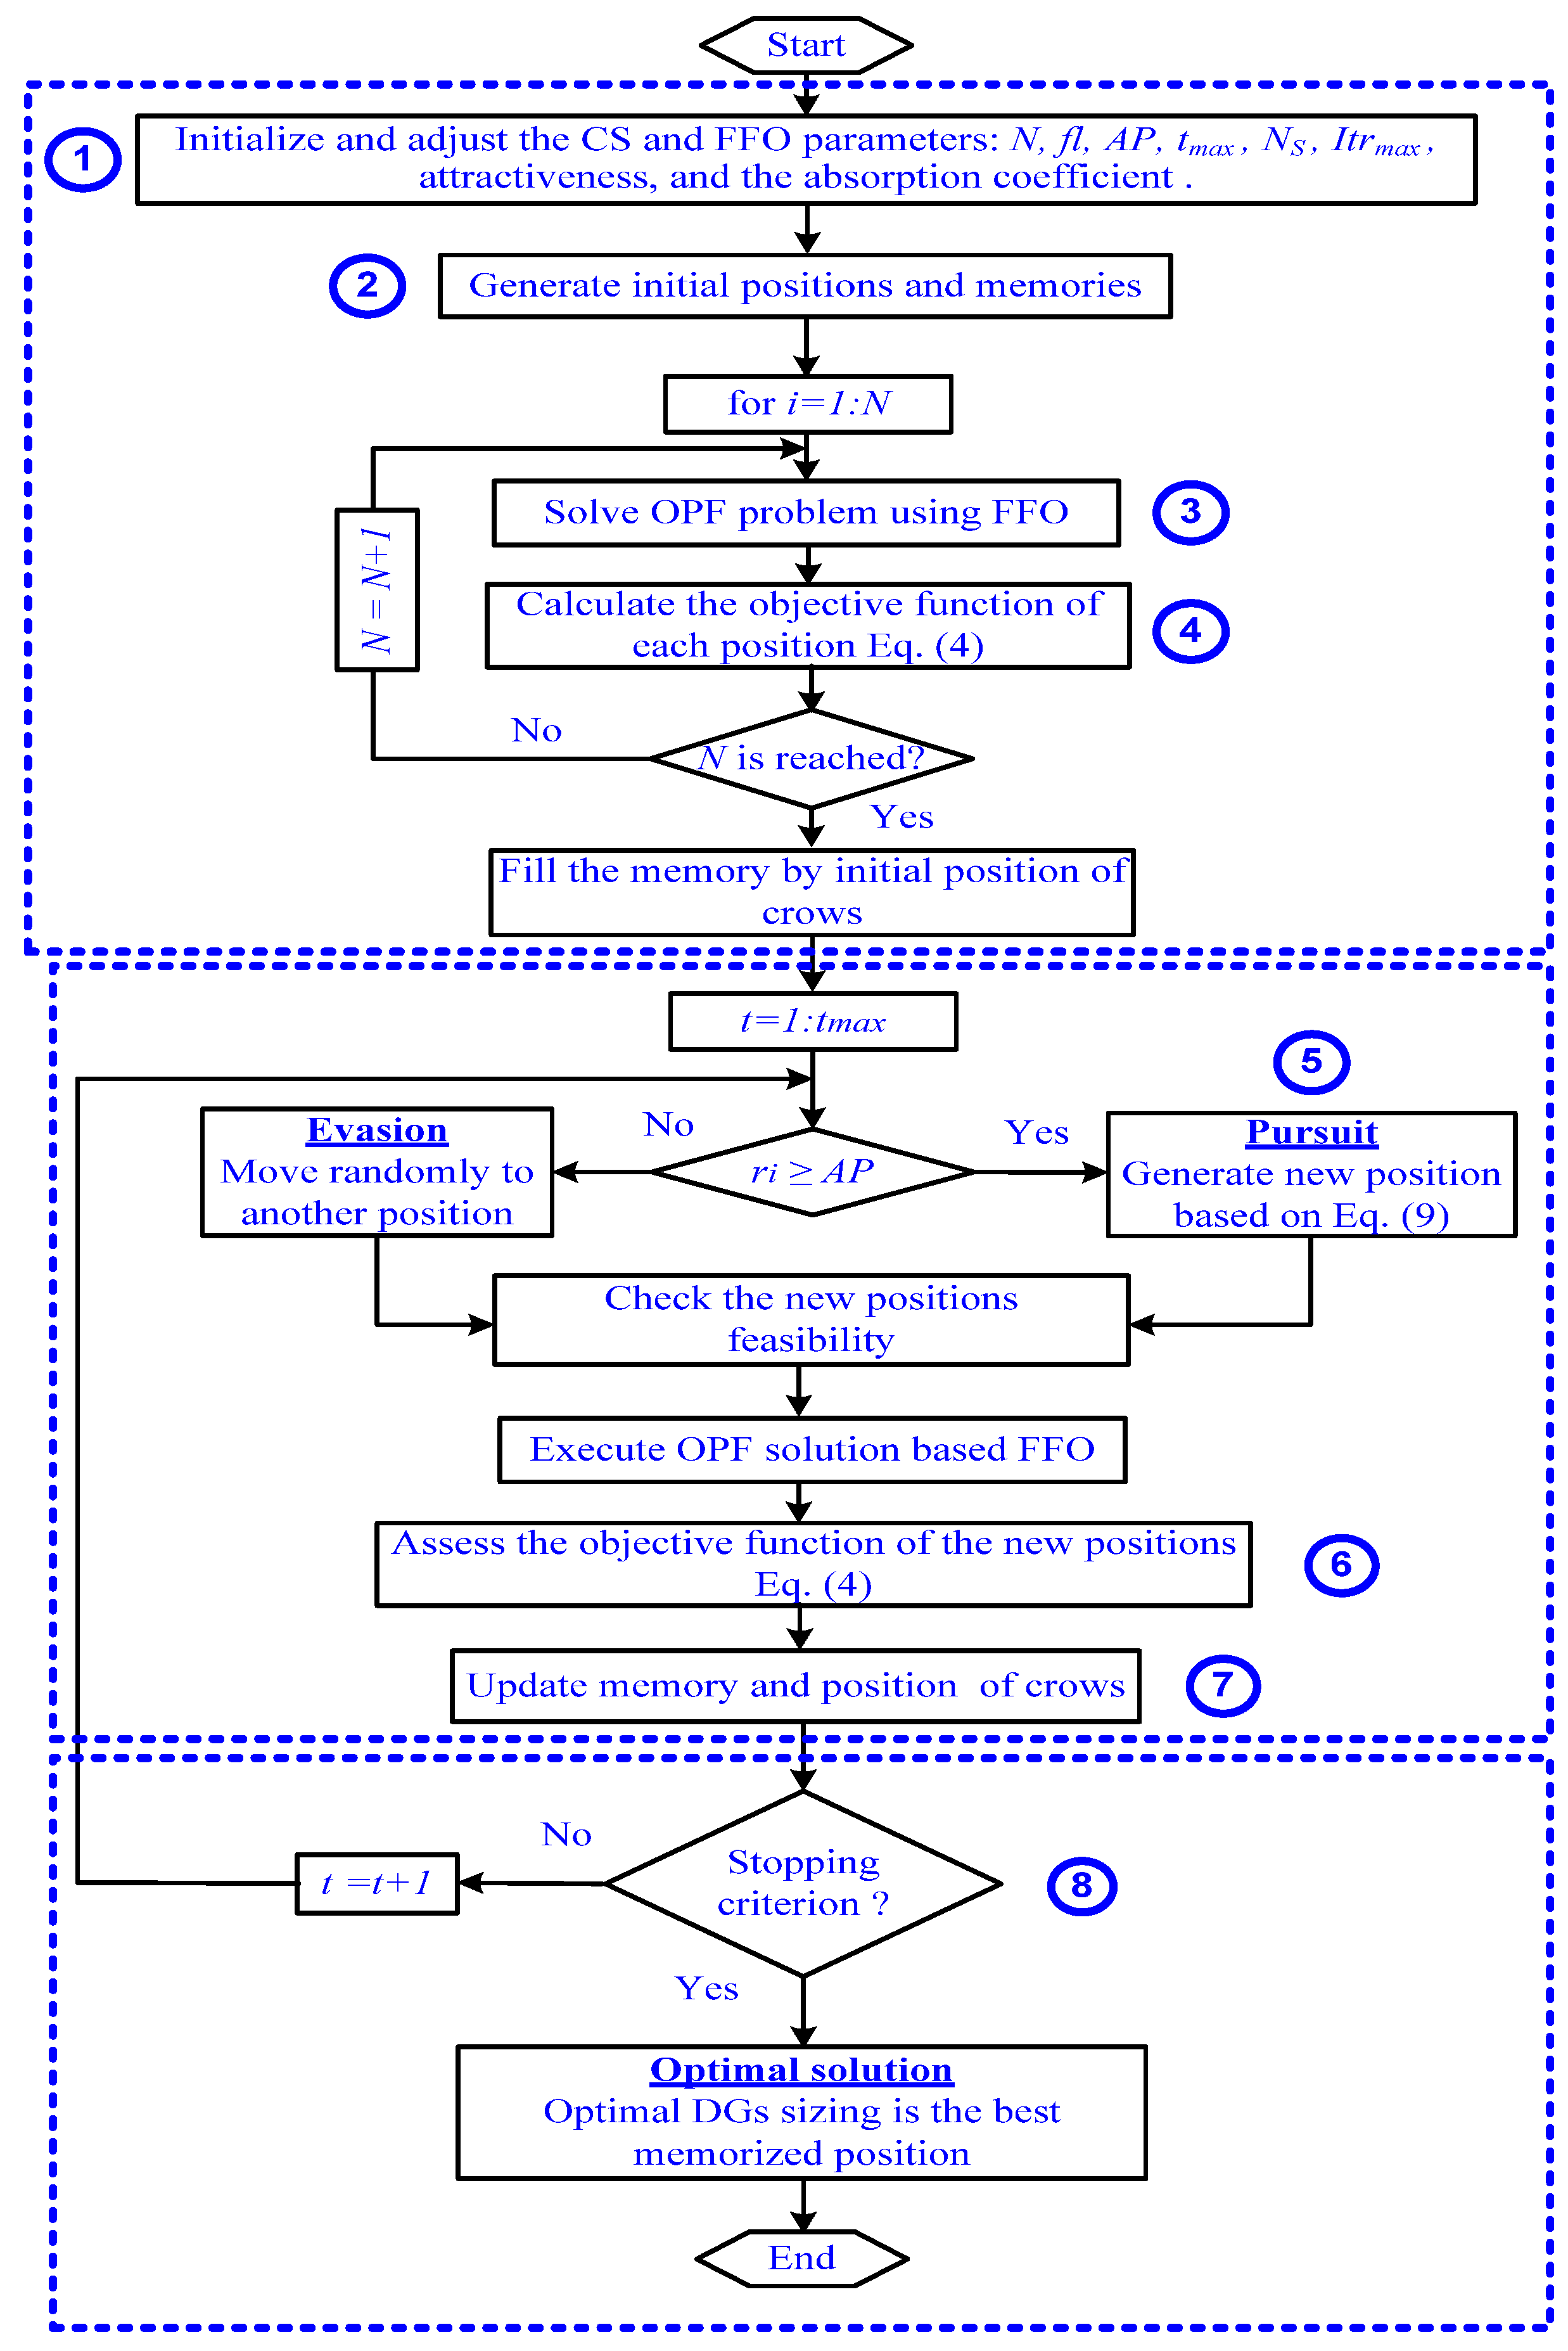
Solve the OPF optimization problem under the most severe N-l line (F27-30) with three candidate buses (27, 29, and 30, i.e., the nearest buses to faulty line F27-30) using the firefly algorithm combined with the crow search optimizer. Using the firefly algorithm in combination with the crow search optimizer can eliminate the impractical buses/solutions while retaining the practical one. As a result, the combination of the firefly algorithm and crow search optimizer is used to achieve optimal RDG siting and sizing.
4.
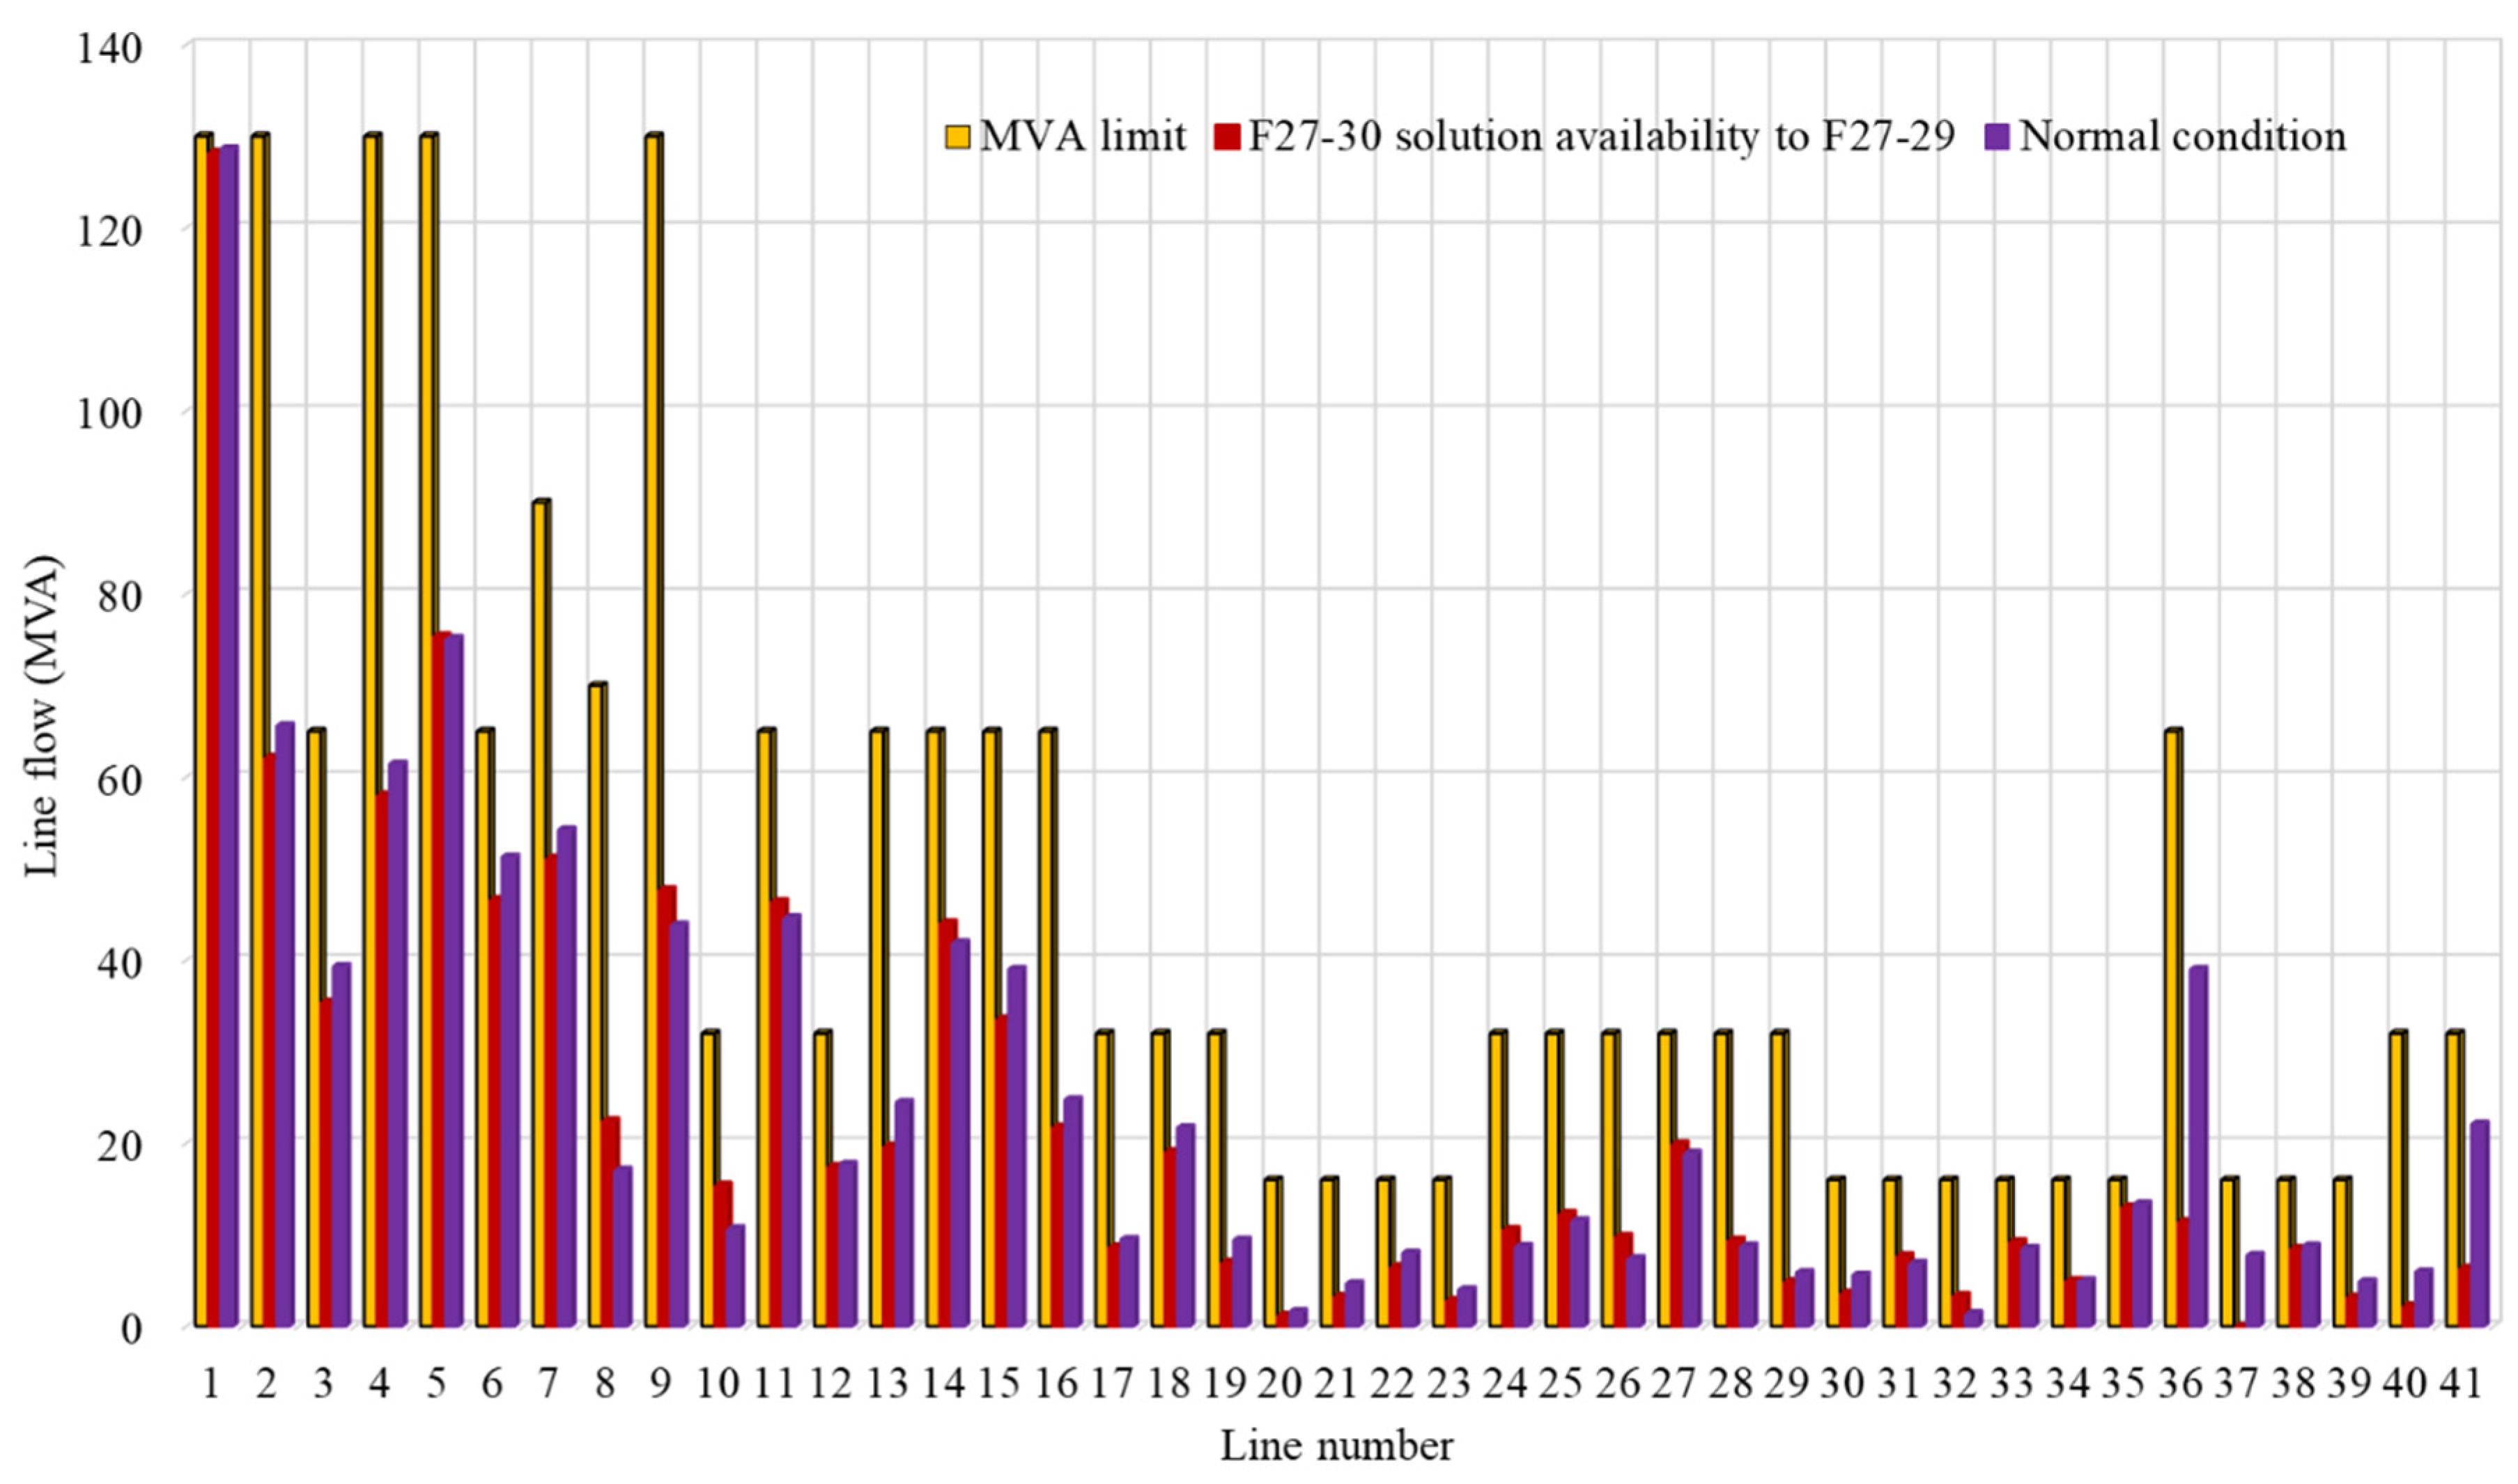
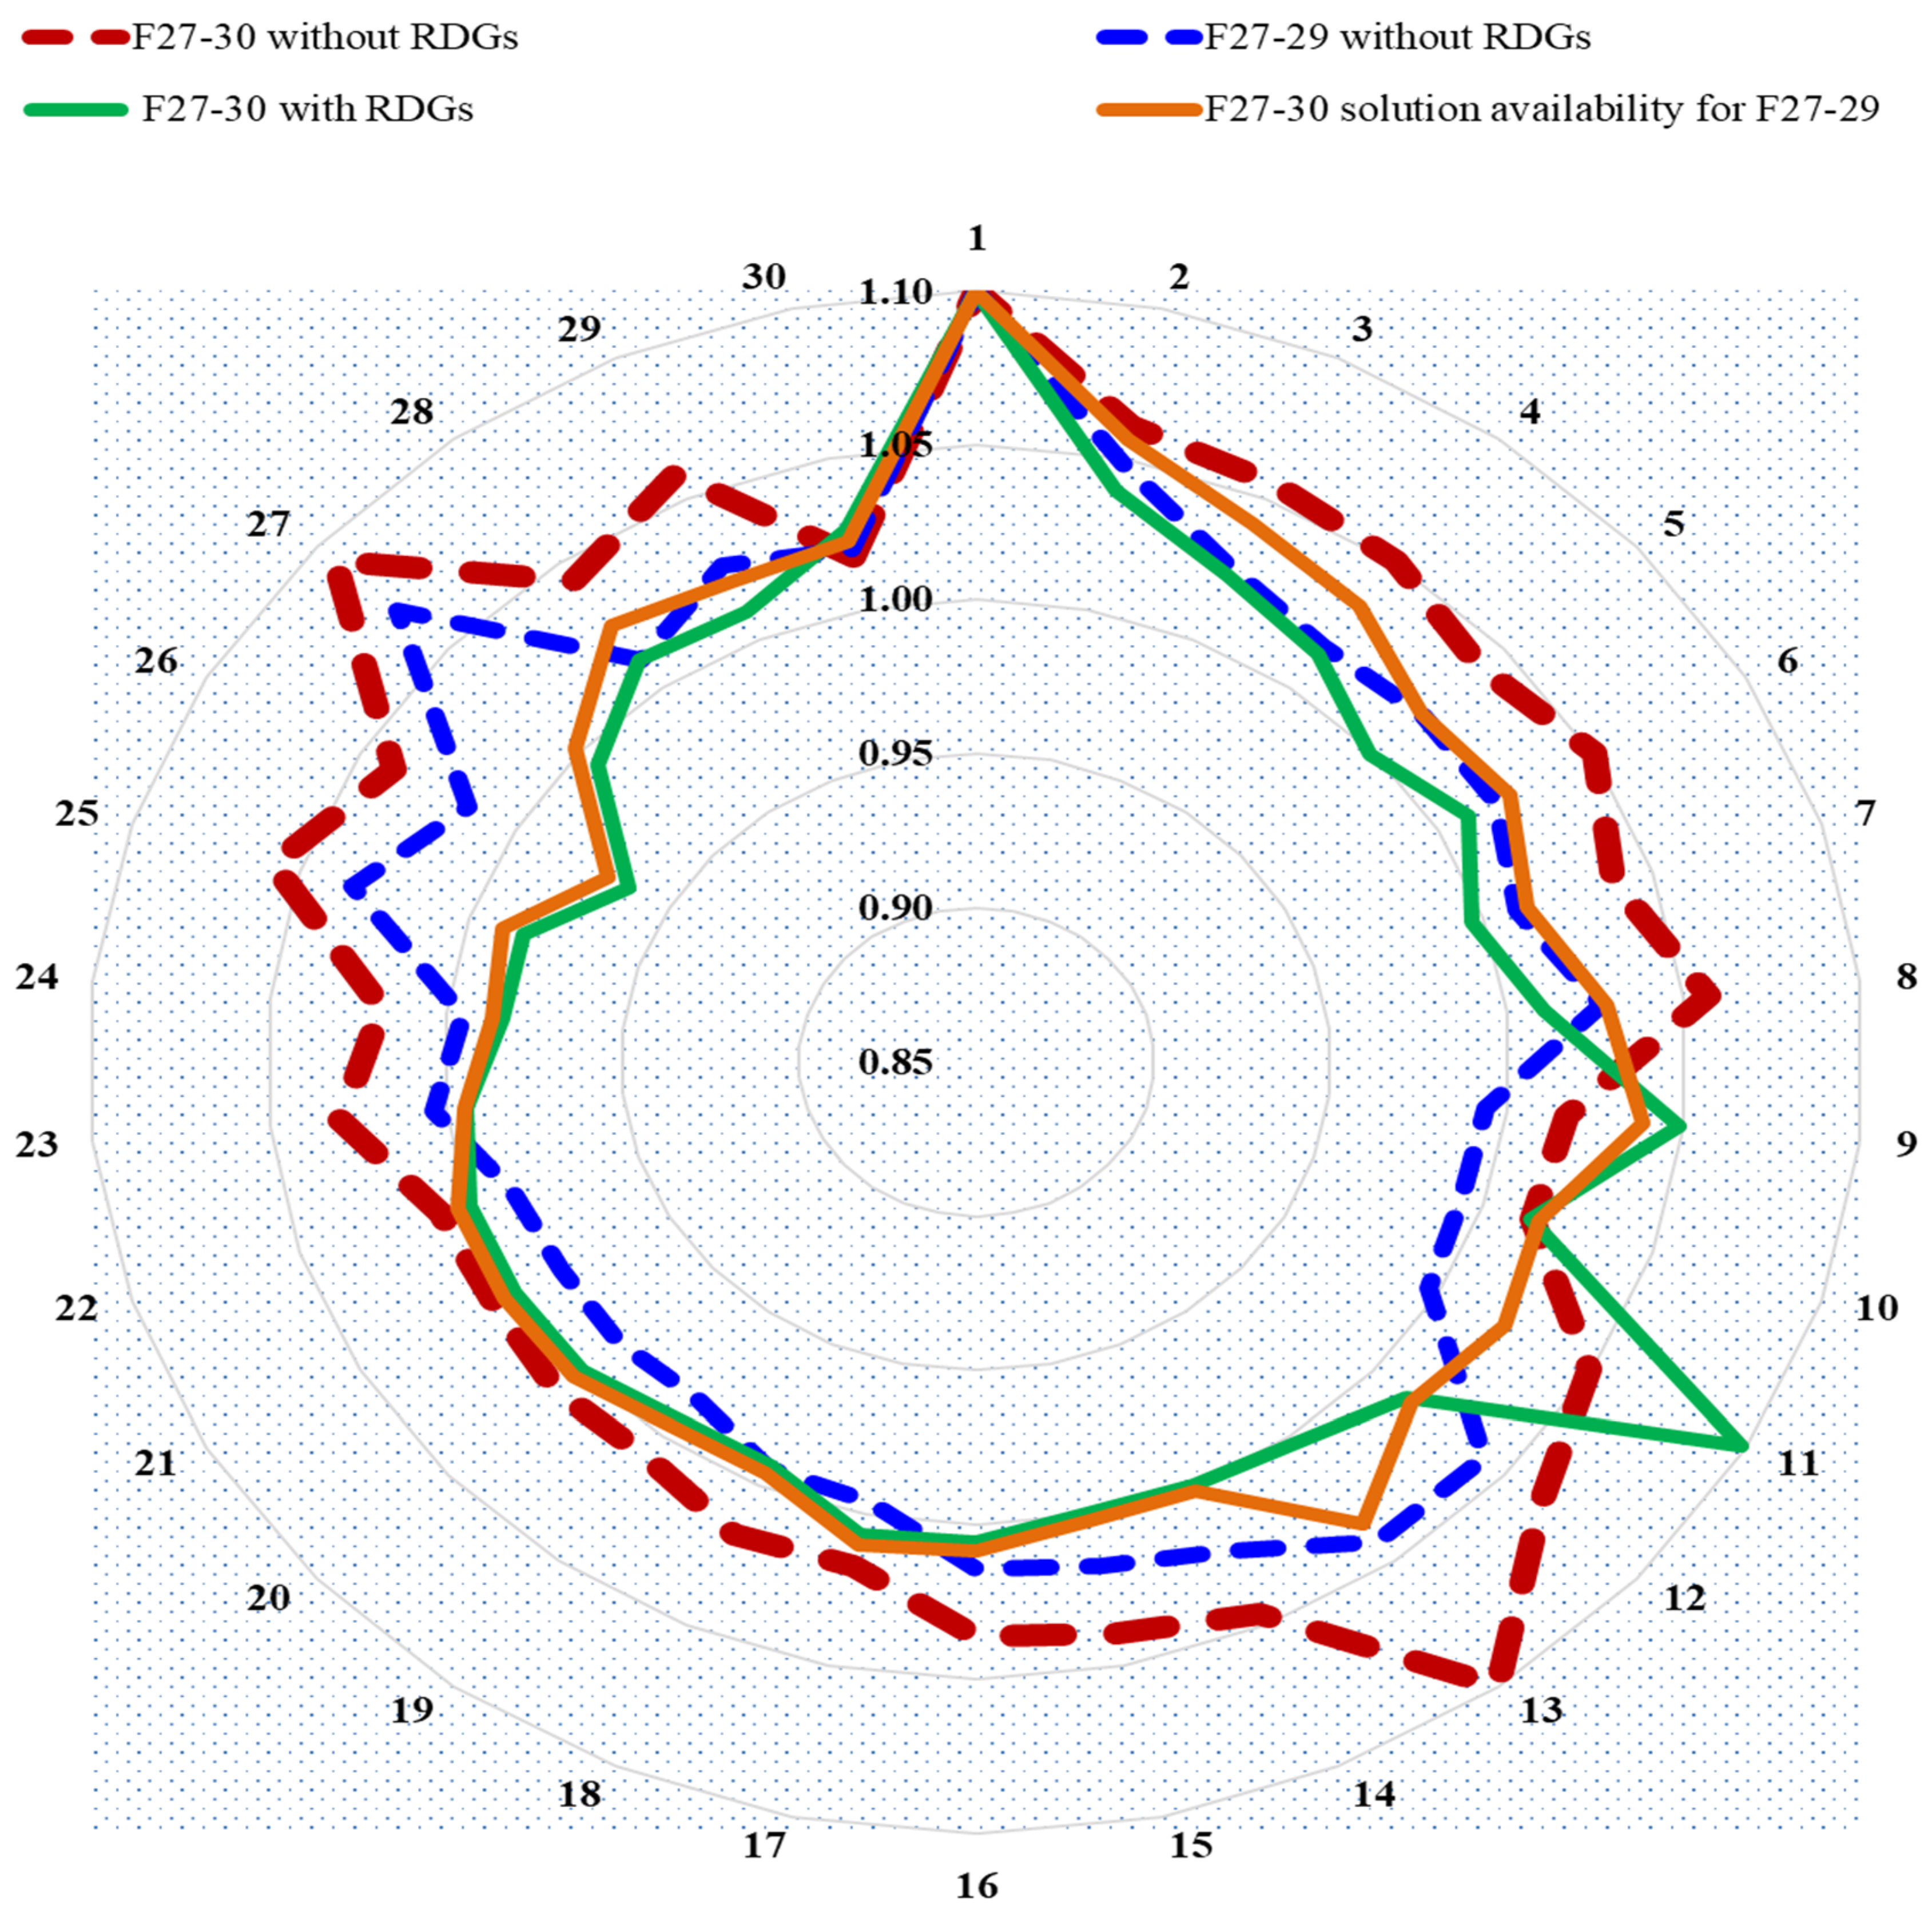
Check the OPF solution availability with F27-30 to other N-l faulty lines (F27-29) in terms of transmission line loading percent and voltage profile.

3. Hybrid CS-FFA Approach for Optimal RDG Sizing and Siting under N-1 Faulty Line Conditions

The decision to explore a hybrid algorithm stems from the distinctive characteristics of two powerful optimization techniques—CS and FFA. The characteristics of each optimizer and how their integration contributes to the overall efficiency of the hybrid CS-FFA algorithm is summarized as follows:
Global Searching Efficiency of the Crow Search Optimizer (CS):
The CS optimizer is known for its ability to perform efficient global searches across the solution space. In the context of RDG sizing and allocation, where the optimal locations and capacities are spread across the entire power system, the global search capabilities of the CS optimizer become particularly valuable. The CS optimizer employs the social behavior of crows, utilizing information-sharing mechanisms to explore diverse regions of the solution space simultaneously. This characteristic is crucial for identifying potential optimal solutions for RDG allocation under N-1 faulty line conditions, where the impact on the entire system needs to be considered.
Local Searching Efficiency of the Firefly Algorithm (FFA):
The FFA excels in local search proficiency, making it well suited for fine-tuning solutions, especially in the context of solving the optimal power flow (OPF) problem. When dealing with N-1 faulty line conditions, precision in addressing the impact on specific buses and lines is essential. The FFA’s ability to iteratively refine solutions locally enhances the precision needed to optimize power flow in the vicinity of the faulty line. This local search proficiency aids in achieving solutions that mitigate overloading and enhance voltage profiles, addressing the operational challenges associated with faulty line conditions.
Synergy between the CS optimizer and FFA:
Integrating the CS optimizer and FFA into a hybrid approach leverages the complementary strengths of each algorithm. The CS optimizer’s global search efficiently explores the vast solution space, providing a diverse set of potential solutions. The FFA, with its local search proficiency, then refines and optimizes these solutions, focusing on the specific details required for addressing the OPF problem in the presence of N-1 faulty lines. The synergy between these two algorithms allows the hybrid CS-FFA approach to benefit from the best of both worlds—exploring globally to find promising regions and refining locally to achieve precise and optimal solutions.
We combined crow search and firefly optimizers to address the OPF problem with multiple RDGs designated for the most problematic buses of the IEEE 30-bus test system, as well as to ascertain the benefits of both the CS and FFA methods (discussed above). The crow search optimizer was combined with the firefly optimizer to solve the OPF problem with three candidate buses—27, 29, and 30—under N-1 faulty conditions. This OPF problem, which includes these three candidate buses, was solved to establish their size using a multi-objective formula that encompass overall costs ( C T o t ), power losses ( P L o s s ) , and voltage deviation ( V D ) , as shown below:
F o b j = M i n w 1 · C T o t + w 2 · P L o s s + w 3 · V D + P e n a l t y
where w1, w2, and w3 represent the weights of the three functions CTot, PLoss, and VD, respectively.
A flowchart of the CS algorithm was integrated with the FFA, as depicted in Figure 3, and the procedural steps for implementing this hybrid algorithm are expounded in the subsequent section.
Step 1: The initialization of the CS and FFA parameters, along with the definition of the IEEE 30-bus power distribution system data utilized in this study. The CS parameters encompass flock size (N), flight length (fl), awareness probability (AP), and iteration number (tmax), whereas the FFA parameters include attractiveness ( β o ) and the absorption coefficient ( γ ) .
Step 2: The crows’ location and memory should be initialized.
The beginning positions, solutions, and sizes of the RDGs for N crows with a particular dimension d are generated at random in the following manner:
X =   x 1 1       x 2 1         .     .     .       x d 1   x 1 2       x 2 2       .     .     .       x d 2 .             .           .     .     .         .   .             .           .     .     .         . .             .           .     .     .         . x 1 N       x 2 N     .     .     .       x d N
Each crow (of all N crows) has its memory (M) initialized as follows:
M =     M 1 1       M 2 1           .     .     .       M d 1     M 1 2       M 2 2         .     .     .       M d 2 .             .                 .     .     .           .   .             .                 .     .     .           . .             .                 .     .     .           . M 1 N       M 2 N         .     .     .         M d N
Step 3: OPF solution based on FFA.
Following the generation of crow locations representing the sizes of the three Distributed Generators (DGs) using CS in the outer loop, FFA is employed to address the OPF problem by incorporating the sizing of three DGs. The multi-objective function mentioned earlier in Equation (4) guides this process. The hybrid CS-FFA approach automatically eliminates unfeasible solutions, retaining an effective and feasible solution. The optimal sizing of DGs is achieved by minimizing the objective function value.
Given that the attractiveness of a firefly is proportionate to the light intensity observed by nearby fireflies, the attractiveness (b) of a firefly can be expressed as a function of the Cartesian distance (r) between the fireflies:
β = β 0   e x p ( γ r 2 )
A firefly’s (i) attraction to another, more desirable (brighter) firefly (j) is determined as follows:
x i t + 1 = x i t + β 0   e x p γ r i j 2 x j t x i t + α ε
In the above formula, α represents the randomization parameter, and ε is a vector of random values drawn from a Gaussian distribution. Following all generations, the firefly with the maximum brightness, corresponding to the best fitness value, is identified as the optimal solution to the problem.
Step 4: Evaluate the objective function.
Evaluate the objective function with multiple objectives for each crow.
Step 5: Generate new locations for all crows.
Crows generate new locations in the search area according to the following rules:
Assume crow i intends to generate a new location; hence, it follows crow j to identify the location of stored food. If crow j is unaware of it, crow i accomplishes its goal.
If crow j observes that crow i is tailing it, crow j deceives crow i by moving randomly to a different location.
At the t + 1 iteration, the new position of crow i is determined based on the preceding two states and can be expressed as follows [4]:
x i t + 1 = x i t + r i f l m j t x i t                                             i f   r i     A P M o v e   t o   r a n d o m   p o s i t i o n                                   i f   r i < A P  
where x i t + 1 is the new position of crow i, and x i t is its previous position.
The feasibility of each crow’s new position is assessed, and the crow adjusts its position if the new location is deemed practical. In cases where the new position is not feasible, the crow retains its current location and does not transition to the proposed one.
Step 6: Evaluate the objective function.
For each new position, assess the objective function encompassing multiple objectives to evaluate the quality of its location.
Step 7: Update the crows’ memories.
The crows’ memories are updated using the following formula:
m i t + 1 = x i t + 1                                   i f   f o b j x i t + 1 > f o b j ( m i t )   m i t                                       O t h e r w i s e                                                          
where f o b j x i t + 1   is the new objective function value;   f o b j m i t is the prior objective function value.
Step 8: Determination of termination criteria.
The procedure concludes upon the completion of all iterations, achieving the optimal sizing of DGs at the most critical bus line(s) based on the minimal objective function.

4. Simulation Results and Discussion

This study presents an analysis of the IEEE 30-bus power system when operating under N-1 faulty line conditions. The specific scenario involves two distinct faults, namely F27-29 and F27-30, which result in overloading on the transmission lines connecting buses 27–30 and bus 27–29, respectively. Our findings are as follows:
A. N-1 Fault occurrence:
F27-29: This fault occurs between buses 27 and 29.
F27-30: This fault occurs between buses 27 and 30.
B. Overloading Percentage:
When fault F27-29 occurs, it causes an overloading of 104.5% on the line between buses 27–30; line number 38; Figure 4a.
When fault F27-30 occurs, it causes an overloading of 105.9% on the line between buses 27–29; line number 37; Figure 4b.
C. Reciprocal Overloading:
Both faults, F27-29, and F27-30, exhibit a reciprocal impact, causing overloading that not only affects their respective lines but also influences the other line, as depicted in Figure 4.
Figure 4. The pre-/post-contingency line flow without RDGs: (a) F27-29; (b) F27-30.
Sustainability 16 01521 g004
Based on this information, it appears that there may be a complex interplay between the faults and the power flow in the network. Overloading on transmission lines can lead to various issues, including voltage instability and potential equipment damage. To mitigate these problems, some important considerations in power system operation should be made:
  • Network Resilience and Reinforcement: The fact that both faults cause overloading on the other line suggests a lack of redundancy or alternative paths for power flow. In a well-designed power grid, there should be multiple routes for electricity to flow, allowing for a certain degree of fault tolerance (N-1 reliability). Therefore, in this study, the authors considered upgrading or reinforcing the network by adding new renewable DGs at the critical buses to create redundancy and reduce the likelihood of overloading during faults.
  • Protection Coordination: Overloading can lead to equipment damage or outages. It is crucial to ensure that protective devices such as circuit breakers and relays are coordinated correctly to isolate the faulty section of the network without causing cascading failures.
  • Load Shedding and Control: During fault conditions, automated load shedding or generation control may be necessary to alleviate overloading and maintain system stability. These control actions should be designed to prioritize critical loads.
  • Fault Analysis: Conduct a detailed analysis of fault currents and study the coordination of protection devices (relays, CBs) to ensure they operate correctly during faults.
In summary, the reciprocal overloading caused by F27-29 and F27-30 highlights the need for a robust system design through applying one of the above-mentioned strategies. This includes optimal DG sizing and allocation, proper protection coordination, fault analysis, and potential network reinforcement to ensure reliable and stable operation, even in the presence of faults. In this study, the authors focused on optimal DG sizing and allocation at the most critical bus lines.
The following part of this manuscript discusses the use of a hybrid approach comprising the use of the crow search optimizer and firefly algorithm in combination (CS-FFA) to solve the OPF problem via the integration of RDGs at three candidate buses, specifically buses 27, 29, and 30. Our analysis was performed under the most critical N-1 fault scenarios involving faulty lines F27-29 and F27-30. The hybrid CS-FFA approach has been designed to automatically eliminate unfeasible solutions. This is crucial to ensure that the DGs are placed only where they can effectively contribute to system stability and reliability. Table 3 shows OPF problem solutions without and with RDGs under faulty lines F27-29 and F27-30, respectively. These solutions can be achieved by utilizing the hybrid CS-FFA technique to address multiple objectives (power losses, voltage deviation, and total cost). This will help us to highlight the benefits of optimal DG sizing and allocation under N-1 faulty lines. The hybrid CS-FFA approach was used to solve the OPF problem with RDGs at three candidate buses; 27, 29, and 30 under the most critical N-1 faulty line; F27-30. The hybrid CS-FFA approach eliminates unfeasible solutions automatically (no DGs on buses 27 and 29) and retains the effective and feasible solutions (DG at bus number 30). The optimal sizing of the DG at bus 30 (24.8478 MW) was attained through the attainment of the minimum objective function value. On the other hand, the optimal DG allocation at bus 30 under The -1 faulty line reduced the power losses, voltage deviation, and total cost compared to that without RDGs, as shown in Table 3.
Figure 5 shows the pre-contingency (normal condition) and post-contingency line flow under the F27-30 faulty line with RDGs at bus 30 compared to the MVA limit. This figure shows how optimal DG allocation and sizing reduced the transmission line overloading under F27-30 and how this mitigated and solved the overloading problem under F27-29. The insertion of RDGs at bus 30 reduced the overloading occurrence on line 27–29 (line 38) to ensure it was within the MVA limit. On the other hand, the availability of the F27-30 solution (insertion of RDGs at bus 30) mitigates the consequences of faulty cases; under F27-29 (line 37), there are not any occurrences of overloading on any line in particular (line 38: F27-30), as shown in Figure 6.
To evaluate the efficacy of the DG sizing and allocation method under N-1 faulty line conditions in terms of TLL improvement, the transmission line loading percentage (TLL%) was calculated. The TLL% is used to assess the impact of DGs on the loading of transmission lines. The goal is to maintain transmission lines within safe operational limits while integrating DGs into the power system. The TLL% is a ratio that quantifies the loading condition of transmission lines in a power system. It can be calculated by dividing the actual line flow (Sli) by the maximum line flow limit ( S l i m a x ) for all transmission lines.
Here is how TLL% is used in this context:
Base Condition: The TLL% is first calculated for all transmission lines without DG units, representing the system’s initial or base condition. This serves as a reference point.
With DG Units: The TLL% is then recalculated for all transmission lines with DG units installed, considering the specific N-1 faulty line scenarios (e.g., F27-29 or F27-30). This reflects the system’s condition with DG integration.
TLL% and DG Impact: The TLL% provides a direct measure of how much the transmission lines are being utilized concerning their maximum capacity. A decrease in the TLL% indicates that the transmission lines are operating at a lower percentage of their maximum capacity, which can be beneficial. Lower TLL% values prove that there is a lower risk of overloading transmission lines, voltage instability, and other operational issues. When the TLL% decreases with the integration of DG units, it implies that the DG units are helping to alleviate line congestion and improve the system’s capacity to accommodate generation and demand.
For the above-mentioned purposes, the TLL % was calculated and plotted for all transmission lines without DG units under F27-29 or F27-30 and with DG units under F27-30 (Most severe N-1 faulty line), and the results are shown in Figure 7. The efficacy and availability of DG allocation at bus 30 under F27-30 has been tested and checked in terms of TLL%. In comparison to the N-1 faulty lines (F27-29 or F27-30) without DG units, the TLL% falls with the insertion of DG units into the power distribution network regardless of the sizing and siting method, as shown in Figure 7. The placement of DGs at bus 30 reduced the overloading of 104.5% on the line between buses 27–30 (line number 37); a reduction also occurred without DGs when fault F27-29 occurred (see Figure 7). On the other hand, the insertion of DGs at bus 30 reduced the overloading of 105.9% on the line between buses 27–29 (line number 38); a reduction also occurred without DGs when fault F27-30 occurred (see Figure 7).
When there is an N-1 fault in a power system like in our fault cases (F27-29 or F27-30), it means that one transmission line has failed or is undergoing maintenance, and the system is operating with one less transmission line than normal. This situation can have significant effects on the voltage profile of the power system, depending on various factors, including the system’s configuration, the location of the fault, and the ability to reroute power. As shown in Figure 8, under F27-29 or F27-30 without RDGs, voltage rise occurred at some buses. This is because power is rerouted through other paths, and the reduced impedance in these paths can result in higher voltage levels. On the other hand, voltage stability is a critical aspect of power system operation. As shown in Figure 8, an N-1 fault (F27-29 or F27-30) affects voltage stability by altering the balance between generation and load. The system was already operating near its stability limits, and the loss of one transmission line pushed it closer to instability. Therefore, as shown in Figure 8, the insertion of the RDGs under N-1 faulty line (F27-30) not only improved the voltage profile in comparison with the same case without RDGs but also improved the voltage profile in the occurrence of the F27-29 fault.
Table 4 presents the performance indicators of the CS-FFA algorithm based on 50 runs. The minimum and maximum values showcase the algorithm’s ability to find diverse solutions. The mean value reflects the central tendency, providing an average assessment of the algorithm’s optimization capabilities. The standard deviation indicates the variability in objective function values, offering insights into the algorithm’s stability and consistency. The elapsed time, averaging 29.06 s, highlights the computational efficiency of the CS-FFA algorithm. Together, these indicators provide a comprehensive evaluation of the algorithm’s performance, supporting its credibility and demonstrating both optimization effectiveness and computational efficiency across multiple runs.
In recent years, advanced optimization algorithms, including self-adaptive algorithms and hyper heuristics, have demonstrated remarkable effectiveness across diverse domains, such as online learning, scheduling, multi-objective optimization, transportation, medicine, and data classification [36,37]. Their adaptability to complex decision problems has led to innovative solutions and improved efficiency in real-time decision-making processes. Considering the successes in these domains, the decision problem addressed in this study, involving the optimal sizing and allocation of RDGs under N-1 faulty line conditions, holds promise for the application of advanced optimization algorithms. The adaptability and versatility of these algorithms, when integrated and compared with the proposed Firefly–Crow Search Optimizer (CS-FFO), could offer valuable insights into their suitability for enhancing the resilience and performance of power distribution systems. This discussion underscores the broader context of our study and highlights potential avenues for extending the optimization methodology.

5. Conclusions

This study involved a comprehensive analysis of renewable distributed generator (RDG) sizing and siting under N-1 faulty line conditions, focusing on reliability and quality aspects and the IEEE 30-bus power system benchmark. Two severe N-1 faulty scenarios, namely F27-29 and F27-30, were applied to the power distribution system, with F27-30 being identified as the most severe based on a severity ranking index considering both voltage deviation and overloading. Through leveraging the firefly algorithm in combination with the crow search optimizer, the optimal power flow (OPF) problem for the most severe line (F27-30) at candidate buses 27, 29, and 30 was addressed. This hybrid CS-FFA algorithm efficiently eliminated unfeasible solutions, resulting in an effective and feasible solution with a Distributed Generator (DG) being allocated to bus 30. The optimal sizing of the DG at bus 30 (24.8478 MW) was decided by minimizing the multiple tecno-economic objectives (overall costs, power losses, and voltage deviation). The results demonstrated a reduction in line overloading for both F27-30 and F27-29, bringing them within the line flow limit. Additionally, this optimal DG allocation reduced total costs and enhanced the voltage profile compared to scenarios without RDGs. All possible N-1 faulty conditions will be studied in our future work, with our ultimate aim being the determination of the optimal DG sizing at the optimal location to mitigate the negative impacts of all expected N-1 faulty conditions.

Author Contributions

Conceptualization, A.A.A.-S. and H.M.H.F.; methodology, A.A.A.-S. and H.M.H.F.; software, A.A.A.-S., H.M.H.F. and K.A.; validation, A.A.A.-S. and H.M.H.F.; formal analysis, A.A.A.-S., H.M.H.F. and K.A.; investigation, A.A.A.-S. and H.M.H.F.; resources, A.A.A.-S. and H.M.H.F.; data curation, A.A.A.-S., H.M.H.F. and K.A.; writing—original draft preparation, A.A.A.-S. and H.M.H.F.; writing—review and editing, A.A.A.-S., H.M.H.F. and K.A.; visualization, A.A.A.-S. and H.M.H.F.; supervision, A.A.A.-S. and H.M.H.F.; project administration, A.A.A.-S. and H.M.H.F.; funding acquisition, A.A.A.-S. and H.M.H.F. All authors have read and agreed to the published version of the manuscript.

Funding

This work was supported and funded by the Deanship of Scientific Research at Imam Mohammad Ibn Saud Islamic University (IMSIU) (grant number IMSIU-RG23065).

Institutional Review Board Statement

Not applicable.

Informed Consent Statement

Not applicable.

Data Availability Statement

The data presented in this study are available on request from the corresponding author.

Conflicts of Interest

The authors declare no conflict of interest.

References

  1. Zangiabadi, M.; Feuillet, R.; Lesani, H.; Hadj-Said, N.; Kvaløy, J.T. Assessing the performance and benefits of customer distributed generation developers under uncertainties. Energy 2011, 36, 1703–1712. [Google Scholar] [CrossRef]
  2. Soroudi, A.; Ehsan, M. A distribution network expansion planning model considering distributed generation options and techo-economical issues. Energy 2010, 35, 3364–3374. [Google Scholar] [CrossRef]
  3. Bracco, S.; Dentici, G.; Siri, S. Economic and environmental optimization model for the design and the operation of a combined heat and power distributed generation system in an urban area. Energy 2013, 55, 1014–1024. [Google Scholar] [CrossRef]
  4. Farh, H.M.; Al-Shaalan, A.M.; Eltamaly, A.M.; Al-Shamma’a, A.A. A novel severity performance index for optimal allocation and sizing of photovoltaic distributed generations. Energy Rep. 2020, 6, 2180–2190. [Google Scholar] [CrossRef]
  5. Mahdad, B.; Srairi, K. Adaptive differential search algorithm for optimal location of distributed generation in the presence of SVC for power loss reduction in distribution system. Eng. Sci. Technol. Int. J. 2016, 19, 1266–1282. [Google Scholar] [CrossRef]
  6. Hung, D.Q.; Mithulananthan, N. Multiple distributed generator placement in primary distribution networks for loss reduction. IEEE Trans. Ind. Electron. 2013, 60, 1700–1708. [Google Scholar] [CrossRef]
  7. Ghasemi, M.; Pavel, T.; Eva, T.; Mohsen, Z. Gaussian bare-bones Levy circulatory system-based optimization for power flow in the presence of renewable units. Eng. Sci. Technol. Int. J. 2023, 47, 101551. [Google Scholar] [CrossRef]
  8. Montoya, O.D.; Gil-González, W.; Orozco-Henao, G. Vortex search and Chu-Beasley genetic algorithms for optimal location and sizing of distributed generators in distribution networks: A novel hybrid approach. Eng. Sci. Technol. Int. J. 2020, 23, 1351–1363. [Google Scholar] [CrossRef]
  9. Kayal, P.; Chanda, C. Placement of wind and solar based DGs in distribution system for power loss minimization and voltage stability improvement. Int. J. Electr. Power Energy Syst. 2013, 53, 795–809. [Google Scholar] [CrossRef]
  10. Hung, D.Q.; Mithulananthan, N.; Bansal, R. Analytical strategies for renewable distributed generation integration considering energy loss minimization. Appl. Energy 2013, 105, 75–85. [Google Scholar] [CrossRef]
  11. Lakum, A.; Vasundhara, M. A novel approach for optimal placement and sizing of active power filters in radial distribution system with nonlinear distributed generation using adaptive grey wolf optimizer. Eng. Sci. Technol. Int. J. 2021, 24, 911–924. [Google Scholar] [CrossRef]
  12. Hung, D.Q.; Mithulananthan, N.; Bansal, R.C. Analytical Expressions for DG Allocation in Primary Distribution Networks. IEEE Trans. Energy Convers. 2010, 25, 814–820. [Google Scholar] [CrossRef]
  13. Gözel, T.; Hocaoglu, M.H. An analytical method for the sizing and siting of distributed generators in radial systems. Electr. Power Syst. Res. 2009, 79, 912–918. [Google Scholar] [CrossRef]
  14. Viral, R.; Khatod, D. An analytical approach for sizing and siting of DGs in balanced radial distribution networks for loss minimization. Int. J. Electr. Power Energy Syst. 2015, 67, 191–201. [Google Scholar] [CrossRef]
  15. Rambabu, T.; Prasad, P.V. Optimal placement and sizing of DG based on power stability index in radial distribution system. In Proceedings of the 2014 International Conference on Smart Electric Grid (ISEG), Guntur, India, 19–20 September 2014; IEEE: Piscataway, NJ, USA, 2014; pp. 1–5. [Google Scholar]
  16. Prakash, P.; Khatod, D.K. Optimal sizing and siting techniques for distributed generation in distribution systems: A review. Renew. Sustain. Energy Rev. 2016, 57, 111–130. [Google Scholar] [CrossRef]
  17. Al-Shamma’a, A.A.; Alturki, F.A.; Farh, H.M. Techno-economic assessment for energy transition from diesel-based to hybrid energy system-based off-grids in Saudi Arabia. Energy Transit. 2020, 4, 31–43. [Google Scholar] [CrossRef]
  18. Rahmani-Andebili, M. Simultaneous placement of DG and capacitor in distribution network. Electr. Power Syst. Res. 2016, 131, 1–10. [Google Scholar] [CrossRef]
  19. Gampa, S.R.; Das, D. Optimum placement and sizing of DGs considering average hourly variations of load. Int. J. Electr. Power Energy Syst. 2015, 66, 25–40. [Google Scholar] [CrossRef]
  20. Mohanty, B.; Tripathy, S. A teaching learning based optimization technique for optimal location and size of DG in distribution network. J. Electr. Syst. Inf. Technol. 2016, 3, 33–44. [Google Scholar] [CrossRef]
  21. Farh, H.M.; Al-Shamma’a, A.A.; Al-Shaalan, A.M.; Alkuhayli, A.; Noman, A.M.; Kandil, T. Technical and economic evaluation for off-grid hybrid renewable energy system using novel bonobo optimizer. Sustainability 2022, 14, 1533. [Google Scholar] [CrossRef]
  22. Bouhouras, A.S.; Sgouras, K.I.; Gkaidatzis, P.A.; Labridis, D.P. Optimal active and reactive nodal power requirements towards loss minimization under reverse power flow constraint defining DG type. Int. J. Electr. Power Energy Syst. 2016, 78, 445–454. [Google Scholar] [CrossRef]
  23. Omotoso, H.O.; Al-Shaalan, A.M.; Farh, H.M.; Al-Shamma’a, A.A. Techno-economic evaluation of hybrid energy systems using artificial ecosystem-based optimization with demand side management. Electronics 2022, 11, 204. [Google Scholar] [CrossRef]
  24. Poornazaryan, B.; Karimyan, P.; Gharehpetian, G.; Abedi, M. Optimal allocation and sizing of DG units considering voltage stability, losses and load variations. Int. J. Electr. Power Energy Syst. 2016, 79, 42–52. [Google Scholar] [CrossRef]
  25. Hassan, A.S.; Sun, Y.; Wang, Z. Multi-objective for optimal placement and sizing DG units in reducing loss of power and enhancing voltage profile using BPSO-SLFA. Energy Rep. 2020, 6, 1581–1589. [Google Scholar] [CrossRef]
  26. Moradi, M.; Abedini, M. A novel method for optimal DG units capacity and location in Microgrids. Int. J. Electr. Power Energy Syst. 2016, 75, 236–244. [Google Scholar] [CrossRef]
  27. Borges, C.L.; Falcao, D.M. Optimal distributed generation allocation for reliability, losses, and voltage improvement. Int. J. Electr. Power Energy Syst. 2006, 28, 413–420. [Google Scholar] [CrossRef]
  28. Zeinalzadeh, A.; Mohammadi, Y.; Moradi, M.H. Optimal multi objective placement and sizing of multiple DGs and shunt capacitor banks simultaneously considering load uncertainty via MOPSO approach. Int. J. Electr. Power Energy Syst. 2015, 67, 336–349. [Google Scholar] [CrossRef]
  29. Alanazi, A.; Alanazi, T.I. Multi-Objective Framework for Optimal Placement of Distributed Generations and Switches in Reconfigurable Distribution Networks: An Improved Particle Swarm Optimization Approach. Sustainability 2023, 15, 9034. [Google Scholar] [CrossRef]
  30. Abdel-mawgoud, H.; Kamel, S.; Ebeed, M.; Aly, M.M. An efficient hybrid approach for optimal allocation of DG in radial distribution networks. In Proceedings of the 2018 International Conference on Innovative Trends in Computer Engineering (ITCE), Aswan, Egypt, 19–21 February 2018; IEEE: Piscataway, NJ, USA, 2018; pp. 311–316. [Google Scholar]
  31. Mena, A.J.G.; García, J.A.M. An efficient approach for the siting and sizing problem of distributed generation. Int. J. Electr. Power Energy Syst. 2015, 69, 167–172. [Google Scholar] [CrossRef]
  32. Ullah, Z.; Wang, S.; Radosavljević, J.; Lai, J. A Solution to the Optimal Power Flow Problem Considering WT and PV Generation. IEEE Access 2019, 7, 46763–46772. [Google Scholar] [CrossRef]
  33. Biswas, P.P.; Suganthan, P.; Amaratunga, G.A. Optimal power flow solutions incorporating stochastic wind and solar power. Energy Convers. Manag. 2017, 148, 1194–1207. [Google Scholar] [CrossRef]
  34. Elattar, E.E. Optimal Power Flow of a Power System Incorporating Stochastic Wind Power Based on Modified Moth Swarm Algorithm. IEEE Access 2019, 7, 89581–89593. [Google Scholar] [CrossRef]
  35. Ismail, B.; Wahab, N.I.A.; Othman, M.L.; Radzi, M.A.M.; Vijyakumar, K.N.; Naain, M.N.M. A Comprehensive Review on Optimal Location and Sizing of Reactive Power Compensation Using Hybrid-Based Approaches for Power Loss Reduction, Voltage Stability Improvement, Voltage Profile Enhancement and Loadability Enhancement. IEEE Access 2020, 8, 222733–222765. [Google Scholar] [CrossRef]
  36. Chen, M.; Tan, Y. SF-FWA: A Self-Adaptive Fast Fireworks Algorithm for effective large-scale optimization. Swarm Evol. Comput. 2023, 80, 101314. [Google Scholar] [CrossRef]
  37. Singh, P.; Pasha, J.; Moses, R.; Sobanjo, J.; Ozguven, E.E.; Dulebenets, M.A. Development of exact and heuristic optimization methods for safety improvement projects at level crossings under conflicting objectives. Reliab. Eng. Syst. Saf. 2022, 220, 108296. [Google Scholar] [CrossRef]
Figure 1. N-1 faulty cases under study for the IEEE 30-bus power distribution system.
Sustainability 16 01521 g001
Figure 2. The severity performance/ranking index for the two N-l faulty lines: F27-29 and F27-30.
Sustainability 16 01521 g002
Figure 3. Flowchart depicting the hybrid CS-FFA approach designed to address the OPF problem with DGs located at critical buses.
Sustainability 16 01521 g003
Figure 5. The pre-/post-contingency line flow under the F27-30 faulty line with RDGs at bus 30.
Sustainability 16 01521 g005
Figure 6. The availability of the F27-30 solution and its effect on faulty case F27-29.
Sustainability 16 01521 g006
Figure 7. The TLL % for the IEEE 30-bus power system benchmark under F27-29 and F27-30 with/without RDGs.
Sustainability 16 01521 g007
Figure 8. The voltage profile for the IEEE 30-bus power system benchmark under F27-29 and F27-30 with/without RDGs.
Sustainability 16 01521 g008
Table 1. A summary of the IEEE 30-bus power distribution system’s data.
ElementsNumbersDescription
Buses 30-
Lines or Branches 41-
Thermal generators 6Buses 1 (slack), 2, 5, 8, 11, and 13
Candidate buses 27, 29, and 30
Shunt VAR compensations9Exists at buses 10, 12, 15, 17, 20, 21, 23, 24, and 29
Transformer with tap changer4As illustrated in Figure 1, in between bus 6 and 9, bus 6 and 10, bus 4 and 12, and bus 28 and 27.
Control variables24-
Total load demand 283.4 MW, 126.2 MVAr
Bus voltage limits24[0.95–1.1] p.u.
Table 2. N-1 faulty lines under study.
N-l Faulty LinesLine OverloadedOverloading %VDIOLISI
F27-29L27-30104.50.430.520.48
F27-30L27-29105.90.840.530.68
Table 3. Solving the OPF problem without and with RDGs under faulty lines, respectively, utilizing the hybrid CS-FFA approach.
Cases
(With 25% Load Increase)
F27-30
(Without RDGs)
F27-29
(Without RDGs)
F27-30
(With RDGs)
F27-30
(With RDGs) Solution Availability for F27-29
Active power generation (MW)PG1195.8832194.6555190.7187192.1811
PG267.942868.966353.553859.8507
PG538.6242 29.022023.883225.0275
PG818.6940 22.484334.704230.3884
PG1124.3639 24.716315.846517.7960
PG1322.150428.371622.811416.0069
PDG27--------
PDG29--------
PDG30----24.847824.8478
Generator voltages (p.u)VG11.101.101.101.10
VG21.06091.04831.03941.0561
VG51.04091.01830.99901.0183
VG81.05731.02691.01091.0281
VG111.04940.99691.09871.0214
VG131.09961.04191.00251.0348
Transformer tap setting (p.u)T6-91.05831.02350.94690.9305
T6-101.05991.02791.01780.9996
T4-120.98940.91410.96851.0379
T28-270.91060.90001.02151.0215
Shunt VAR compensators (MVAr)QC100.73731.83171.65832.6411
QC123.60986.5815 × 10−43.11973.4400
QC152.24453.99864.42324.9198
QC173.34883.41351.43953.2175
QC200.98920.08983.74464.3734
QC210.83720.99751.50513.9971
QC233.35661.5487 × 10−44.70562.8811
QC241.84152.62820.92350.7264
QC294.25314.00453.01972.0162
Total cost ($/h)1.2911 × 1031.2250 × 103979.38976.66
Power losses (MW)13.409113.966212.115711.8485
Voltage Deviation0.83700.43160.28080.3482
Objective function ($/h)1.7200 × 1031.5837 × 1031.2718 × 1031.2774 × 103
Table 4. Performance indicators of the CS-FFA algorithm based on 50 runs.
AlgorithmPerformance IndicatorsElapsed Time
(Seconds)
MinMaxMeanSTD.
CS-FFA 1.2405 × 1031.3056 × 1031.2715 × 10314.3129.06
Disclaimer/Publisher’s Note: The statements, opinions and data contained in all publications are solely those of the individual author(s) and contributor(s) and not of MDPI and/or the editor(s). MDPI and/or the editor(s) disclaim responsibility for any injury to people or property resulting from any ideas, methods, instructions or products referred to in the content.

