Article

Pluvial Flood Susceptibility in the Local Community of the City of Gospić (Croatia)

1
Department of Geography, University of Zadar, 23000 Zadar, Croatia
2
Department for Ecology, Agriculture and Aquaculture, University of Zadar, 23000 Zadar, Croatia
*
Author to whom correspondence should be addressed.
Sustainability 2024, 16(4), 1701; https://doi.org/10.3390/su16041701
Submission received: 15 November 2023 / Revised: 27 January 2024 / Accepted: 9 February 2024 / Published: 19 February 2024

Abstract

:
Pluvial flooding (PF), resulting from intense short-duration rainfall events, is challenging in urban areas amidst climate change and rapid urbanization. Identifying flood-prone zones and implementing collaborative mitigation strategies with the local population are crucial aspects of PF management. This study aims to enhance the understanding of urban PF in Croatia by collecting historical PF data, creating the GIS-MCDA susceptibility model, and conducting a risk perception survey for the study area of Gospić. Susceptibility zones were generated utilizing topographical, environmental, and hydrological criteria using the AHP method. To examine the risk perception, a face-to-face survey was conducted among 5% of the city’s population (N = 64). Five factors were defined: (F1) risk awareness, (F2) anthropogenic and (F3) natural causes of PF, (F4) potential consequences, and (F5) preparedness. The reliability of the questionnaire was very high (>0.71). Most respondents believe they are ill-equipped to defend against flooding independently and express a lack of confidence in the measures taken by local authorities. The highly susceptible zones encompass not only agricultural areas but also residential zones of city. Among all respondents, 36% live in a flood-prone area and half of them have no flood insurance or other mitigation measures. Incorporating locals’ suggestions and problems, mitigation measures were proposed. Results from this research can be a starting point for further research in Croatia and can provide guidelines for decision-makers in implementing a risk mitigation strategy.

1. Introduction

Nowadays, the impact of climate change on the environment is becoming increasingly evident. Altered precipitation patterns, frequent floods, rising sea levels, and extreme weather events have already begun to affect local communities [1,2,3]. The higher frequency and intensity of rainfall has increased the severity of pluvial flooding (PF) issues. PF is triggered by short-duration intensive rainfall and occurs when the amount of water from rainfall surpasses urban drainage system capacity and the soil’s capacity for absorption [4]. This issue is most pronounced in urban areas with insufficient urban drainage systems and a high percentage of impervious surfaces. European regions are experiencing an increased frequency of PF, and examples of multiple-affected cities are Rome [5], Palermo [6], Poreč [7], Paris, London, Berlin [8], and Gospić [9]. PF is called an ‘invisible hazard’ because it can occur in areas far removed from water bodies, where flooding is not typically expected [4]. This type of flood is complex to predict, and without the implementation of adequate long-term mitigation measures, they cumulatively cause massive material damage to local communities [10,11].
Comprehensive flood risk management (FRM) includes identifying flood-prone areas, mapping historical flood locations, communicating the risk with residents, and implementing long-term mitigation measures [10,12]. Susceptibility mapping is typically used to identify prone areas, i.e., to assess the predisposition of an area to the hazard occurrence without predicting the exact time of the event or assessing the damage [13]. The most common predisposing factors of PF are related to the topographical, hydrological, climatological, environmental, and anthropogenic characteristics of drainage basins [12,14]. Collecting and maintaining accurate historical flood location data supports more precise susceptibility modeling. It provides a valuable foundation for informed decision-making and disaster preparedness [12].
The perception of flood risk is an essential component of FRM plans and is considered a broader aspect of the social construct of risk [15,16]. Understanding flood risk perception is crucial for effective risk communication, providing insights into residents’ preparedness, and helping identify potential community vulnerabilities and disparities [17,18,19,20]. It has been analyzed in various research papers [10,19,20,21,22,23,24], identifying its key determinants and influence on individual behaviors and attitudes. Contrary to expert risk estimation, which relies on mathematical models, public perception is influenced mainly by qualitative factors such as the severity of consequences, the sense of control, and the recency and perceived frequency of the hazard [21]. Risk perception generally encompasses examining people’s awareness, emotions, and behavior concerning hazards [21].
Croatia has been continuously impacted by heavy rainfall in specific regions; despite this impact, there is still a lack of scientific research, legal regulations, and guidelines surrounding PF management [25]. Furthermore, no official and systematic data collection system is in place to record the critical locations and impacts of PF. Therefore, this research aims to contribute to understanding PF in Croatia by collecting historical pluvial flood data, modeling the susceptibility zones, and analyzing the risk perception among the local population. The research was carried out as part of the Interreg-PEPSEA (Protecting the Enclosed Parts of the Adriatic Sea from Pollution) project and focused on Gospić City (Croatia), an urban area grappling with the growing challenges of PF due to intense rainfall events. While established models exist for PF susceptibility assessment, our research seeks to contribute by implementing a GIS-MCDA methodology in a regional context, providing a nuanced understanding of local community attitudes toward flood risks. Through a synergy of susceptibility modeling, a detailed public perception survey, and the creation of a historical PF cadaster, our study offers a unique perspective that aims to bridge gaps in flood risk management. Importantly, this integration serves as a foundation for tailored mitigation strategies and addressing the specific needs of the study area. The proposed risk mitigation measures, derived from the analysis, represent a crucial step toward developing flood management strategies in a regional context. Results from this research can be a starting point for further research in Croatia and for developing guidelines for decision-makers (local authorities) to implement a risk mitigation strategy.

2. Study Area

The city of Gospić (Figure 1) is located at 44° N and 15° E in the central part of the Lika river basin [9]. Gospić, with a population of 11,464 residents [26], exhibits a blend of land use patterns featuring a predominantly rural landscape (agriculture and forestry). The whole drainage basin of Gospić encompasses an area of 238 km2. The hydrography of the basin includes the Novčica River with tributaries Bogdanica, Lika, Jadova, and Otešica [27].
Winters in this region are moderately cold and influenced by cold continental air masses from the interior [28]. There are two rainfall maxima: the primary is in late autumn, and the secondary is in the spring. Total precipitation is highest in November and lowest in July (Table 1). There are significant seasonal variations regarding the river water level, i.e., high water levels occur in winter and extremely low levels (nearly dry-dried up) in summer [9]. Gospić has experienced multiple instances of pluvial and fluvial flooding, as evidenced by developing a pluvial flood cadaster within the framework of the STREAM project. Most are flooded agricultural fields, roads, and house basements. This comprehensive dataset underscores the pressing need for effective flood risk management and mitigation strategies in the region.

3. Materials and Methods

This research aimed to contribute to understanding PF in Croatia through modeling PF susceptibility zones and analyzing risk perception among the residents of Gospić. The methodology is divided into two main parts: (1) GIS-Multi-Criteria Decision Analysis (GIS-MCDA), and (2) survey-based public perception research. Each approach consists of a series of sequential steps.

3.1. Public Perception of Pluvial Floods Risk

The survey research process comprised the following: (1) questionnaire construction, (2) survey administration to the selected sample population through face-to-face interviews, (3) data entry, database creation, and geocoding, (4) statistical analysis, and (5) interpretation (Figure 2).
The database was created based on a public perception survey conducted in October 2022. The survey included 5% of the city population (N = 64), and data were obtained via face-to-face interviews using standardized questionnaires (Appendix A). To ensure the representative nature of the research sample, the selection process involved stratification based on relevant demographic variables.
This step aimed to account for variations in perceptions and experiences related to PF. Exclusion criteria were defined to maintain data integrity. Respondents who did not complete the questionnaire (did not answer all questions) were excluded from the study. The addresses of respondents were geocoded using Google Earth mapping tools and inserted into the GIS.

3.2. Questionnaire Design

To assess the awareness and preparedness of Gospić residents regarding pluvial flooding, a standardized questionnaire consisting of 31 items was employed (Appendix A). The questionnaire was structured into five factors:
  • F1 Awareness of the Pluvial Flood Risk: Questions were focused on familiarity with PF and evaluating the risk level associated with various facets, such as respondents’ homes, drinking water sources, agricultural areas, urban infrastructure, material property, tourism, and others. A Likert scale ranging from 1 (insignificant) to 5 (high) was utilized.
  • F2 Anthropogenic Causes of Pluvial Floods: The respondents’ perceptions of human-induced causes of PF were explored, particularly urbanization, excessive concrete construction, lack of green spaces, inadequate pumping stations, and lack of maintenance of stormwater drainage systems. Participants rated their agreement on a scale from 1 (absolute disagreement) to 5 (absolute agreement).
  • F3 Natural Causes of Pluvial Floods: Respondents also evaluated the influence of natural factors such as topographic conditions, soil characteristics, and climate change on PF occurrence.
  • F4 Consequences of Pluvial Floods in the Future: This section gauged participants’ expectations regarding the future impact of PF. They provided opinions about a potential increase in the frequency of heavy rainfall events. Furthermore, they expressed expectations of material damage, awareness, and financial investments in flood prevention over the next decade.
  • F5 Preparedness for Pluvial Floods: This section focused on respondents’ knowledge of how to respond during PF and their level of preparedness. Participants self-evaluated their preparedness on a scale of 1 (insufficient) to 5 (excellent). Additionally, they expressed their views on various PF-related factors and their perceived roles and responsibilities in prevention and protection.
To better understand created factors, socio-demographic data were collected: gender, age, employment, education level, type of residential property (building or house), ownership status (owner or else), the purpose of the property, total housing financial income, elevation of property, living floor, surrounding infrastructure, and ownership of the basement.

Statistical Methods

Statistical analyses (descriptive and inferential) were performed using SPSS Statistics (26.0) software. Descriptive statistics (mean, standard deviation) were presented to understand variability and significance within the factors. Additionally, minimum, and maximum values were included to understand the spread better. To ascertain whether the measurement scales are viable instruments for gauging the attitudes and opinions of respondents, Cronbach’s Alpha coefficient was calculated [29]:
= k k 1 1 i = 1 k σ i 2 σ T 2
where:
  • k is the number of items on the scale,
  • σ i 2 is the variance of each item, and
  • σ T 2 is the total variance of all the items.
The distribution of the variables was examined using the Kolmogorov–Smirnov and Shapiro–Wilk tests. The Shapiro–Wilk test is appropriate for small sample sizes (<50), but can also handle larger sample sizes, while the Kolmogorov–Smirnov test is used specifically for samples larger than 50 [30]. The null hypothesis for both tests states that data are taken from the normally distributed population. To correct the significance value, the Lilliefors Significance Correction is used.
The type of distribution determined whether to use parametric or non-parametric tests to compare two or more independent variables with socioeconomic traits. A chi-square test was used to examine the differences between categorical variables from a random sample and evaluate the fit between expected and observed results.

3.3. GIS-MCDA Pluvial Flood Susceptibility Model

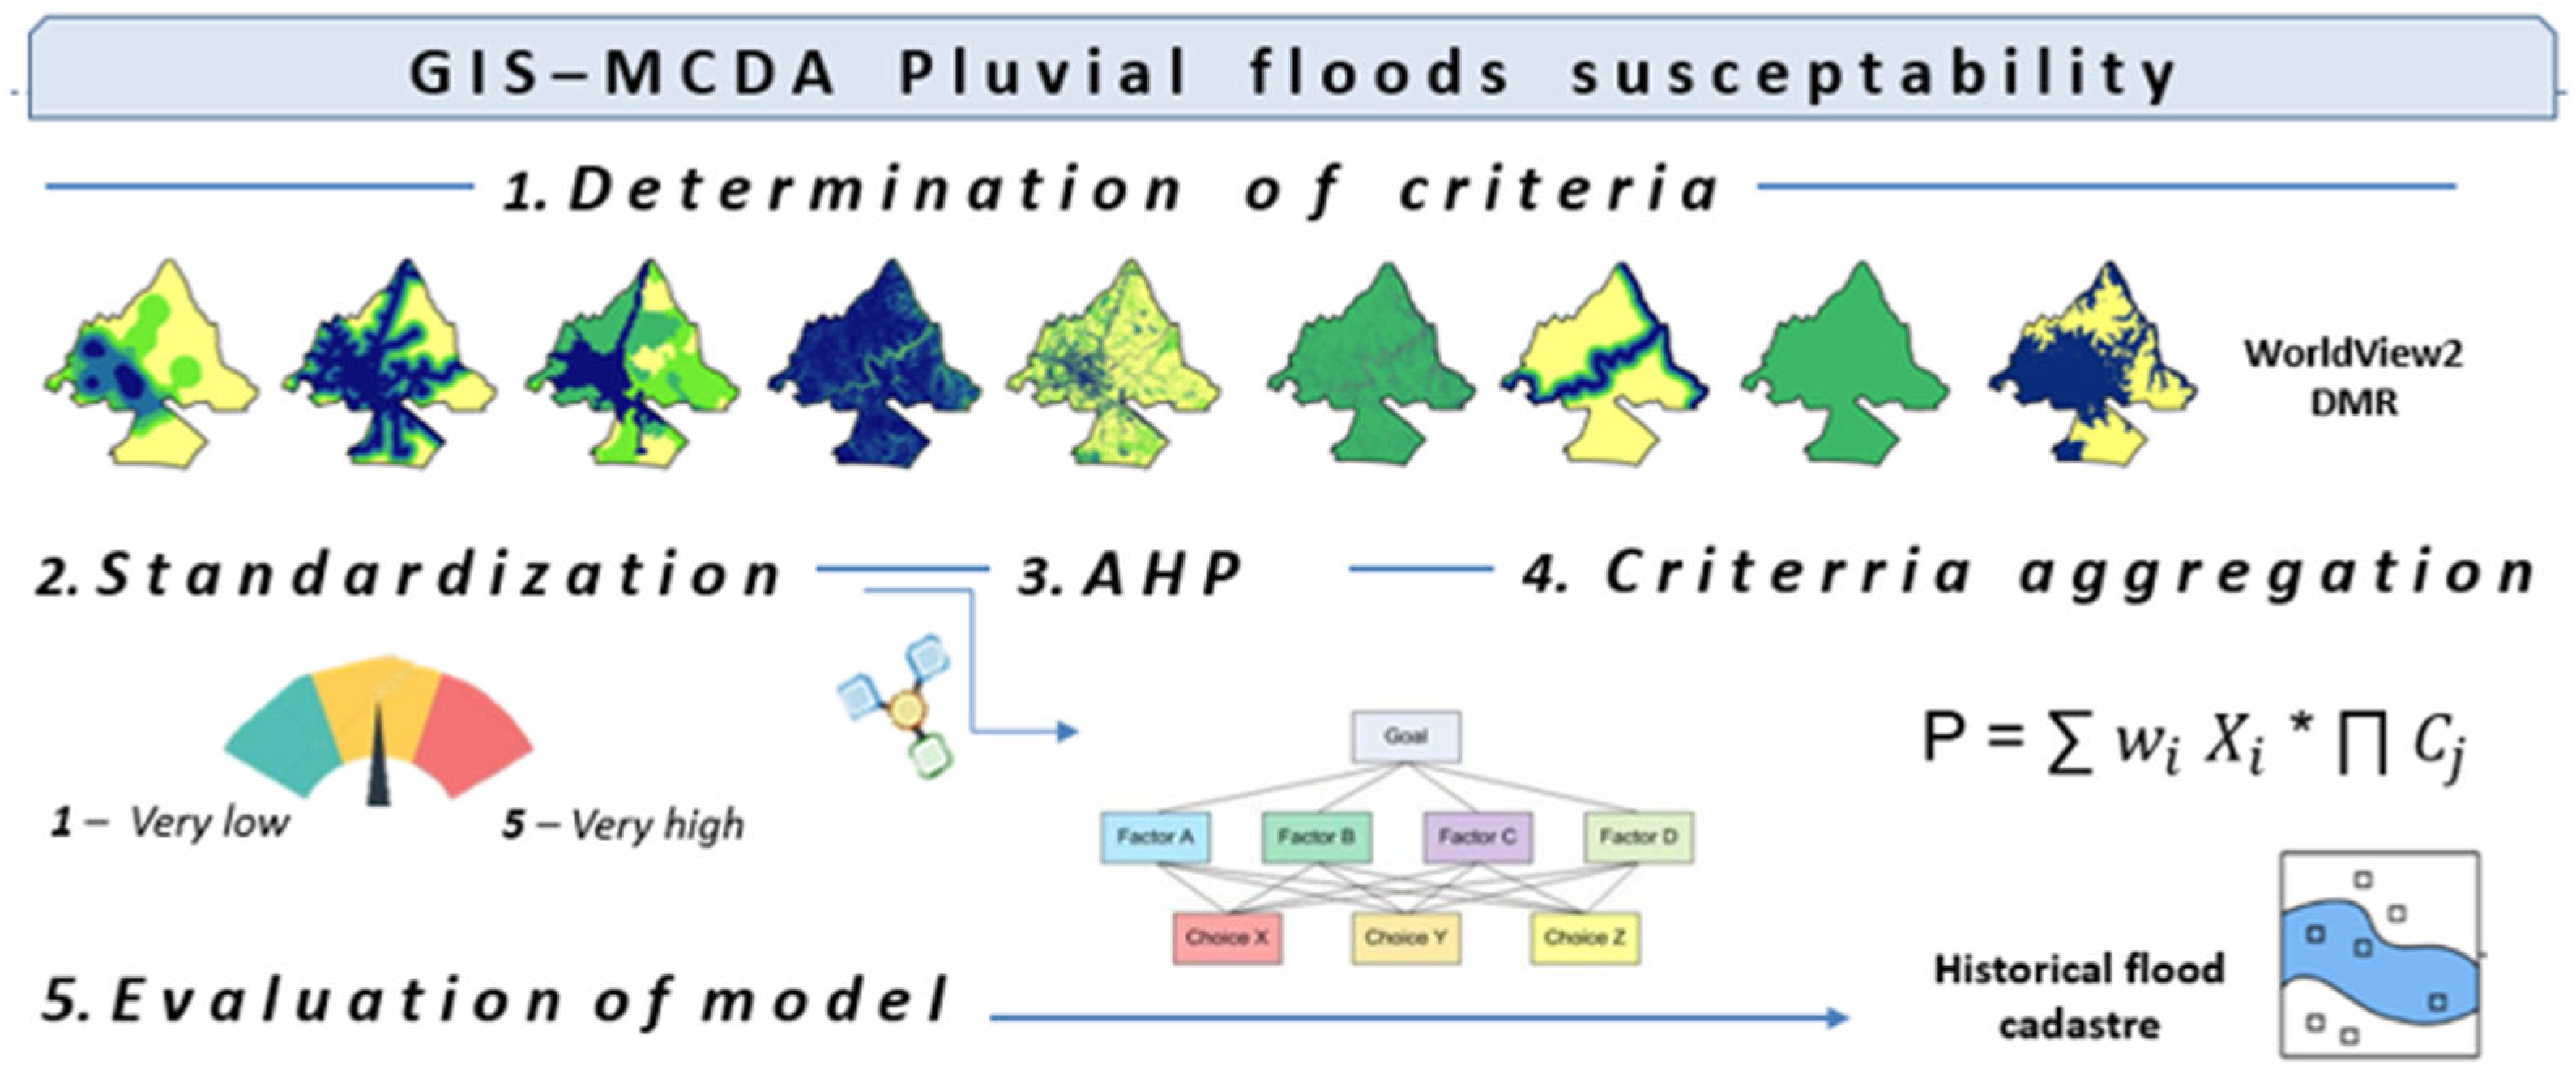
The GIS-MCDA (Geographic Information System-Multi-Criteria Decision Analysis) process is a structured methodology that encompasses six key steps [31]. These steps are crucial for modeling and evaluating the susceptibility of an area to potential floods. The workflow, as depicted in Figure 3, includes problem/goal definition, determination of criteria, criteria standardization, calculation of weighting coefficients, criteria aggregation, and a final evaluation of the model.
For PF modeling, commonly determined criteria are associated with ground morphology, topographical features, environmental characteristics, and hydrology features of the study area [5,12,32,33,34,35]. Additionally, some authors recommend using the spatial density of past pluvial floods [12,36]. Based on relevant literature, the PF model in the present study was created based on 11 predisposing criteria: elevation (ELV), slope (SLO), planar curvature (PLAN), stream distance (SD), stream power index (SPI), land cover (LULC), road distance (RD), normalized difference vegetation index (NDVI), historical PF density (FD), drainage density (DD), topographic wetness index (TWI), and topographic ruggedness index (TRI) (Figure 3).
Land cover (LC) is one of the primary criterion in determining susceptibility to floods [32,37], with various land cover types having distinct infiltration capacities. Impervious surfaces (e.g., buildings, roads) escalate surface water flow, while green areas mitigate flow through higher infiltration capacity [38]. Urbanization, agriculture, deforestation, and anthropogenic activities amplify PF susceptibility.
Furthermore, SLO affects the velocity of water flow, i.e., steeper slopes are prone to torrential flows, while flat areas are more susceptible to water accumulation [37]. PLAN influences the convergence and divergence of surface water flow within a basin [39]. Laterally convex surfaces with negative values are considered highly susceptible [34].
Anthropogenic elements like roads, composed of impermeable materials, also greatly impact PF. During intense rainfall, roadways function like a river channel, effectively channeling and directing water flow. Consequently, areas adjacent to road networks are more likely to be flooded.
DD is a typically used parameter which indicates water flow accumulation, and TWI facilitates the identification of water-saturated areas [40]. SPI measures the potential erosion power of surface water flow [39].
Elevation is a commonly utilized parameter known for its inverse relationship with flood susceptibility. In broad terms, areas at lower elevations are more susceptible to floods, as flood frequency tends to rise with decreasing elevation [39].
The quality of the final model is intricately tied to the quality of the input data. The digital elevation model (DEM) serves as the fundamental digital representation of topography [37]. Consequently, all topographical parameters (elevation (ELV), slope (SLO), planar curvature (PLAN), along with specific hydrological parameters (stream power index (SPI)), were derived from the DEM within the ArcMap environment. The official Croatian digital terrain model (DTM), established by the State Geodetic Administration with a spatial resolution of 0.5 m, was utilized to derivate these criteria (Figure 3). To generate LC, Worldview 2 multispectral imagery (8-band) and maximum likelihood classification algorithms were used (Figure 4).
Standardization of criteria was applied from 1 (very low susceptibility) to 5 (very high susceptibility) using the Jenks classification method [41]. An analytical hierarchical process (AHP) was used to calculate the weights for each criterion, reflecting their respective contributions to PF susceptibility (Table 2). The model’s accuracy was validated based on historical flood data using the confusion matrix.
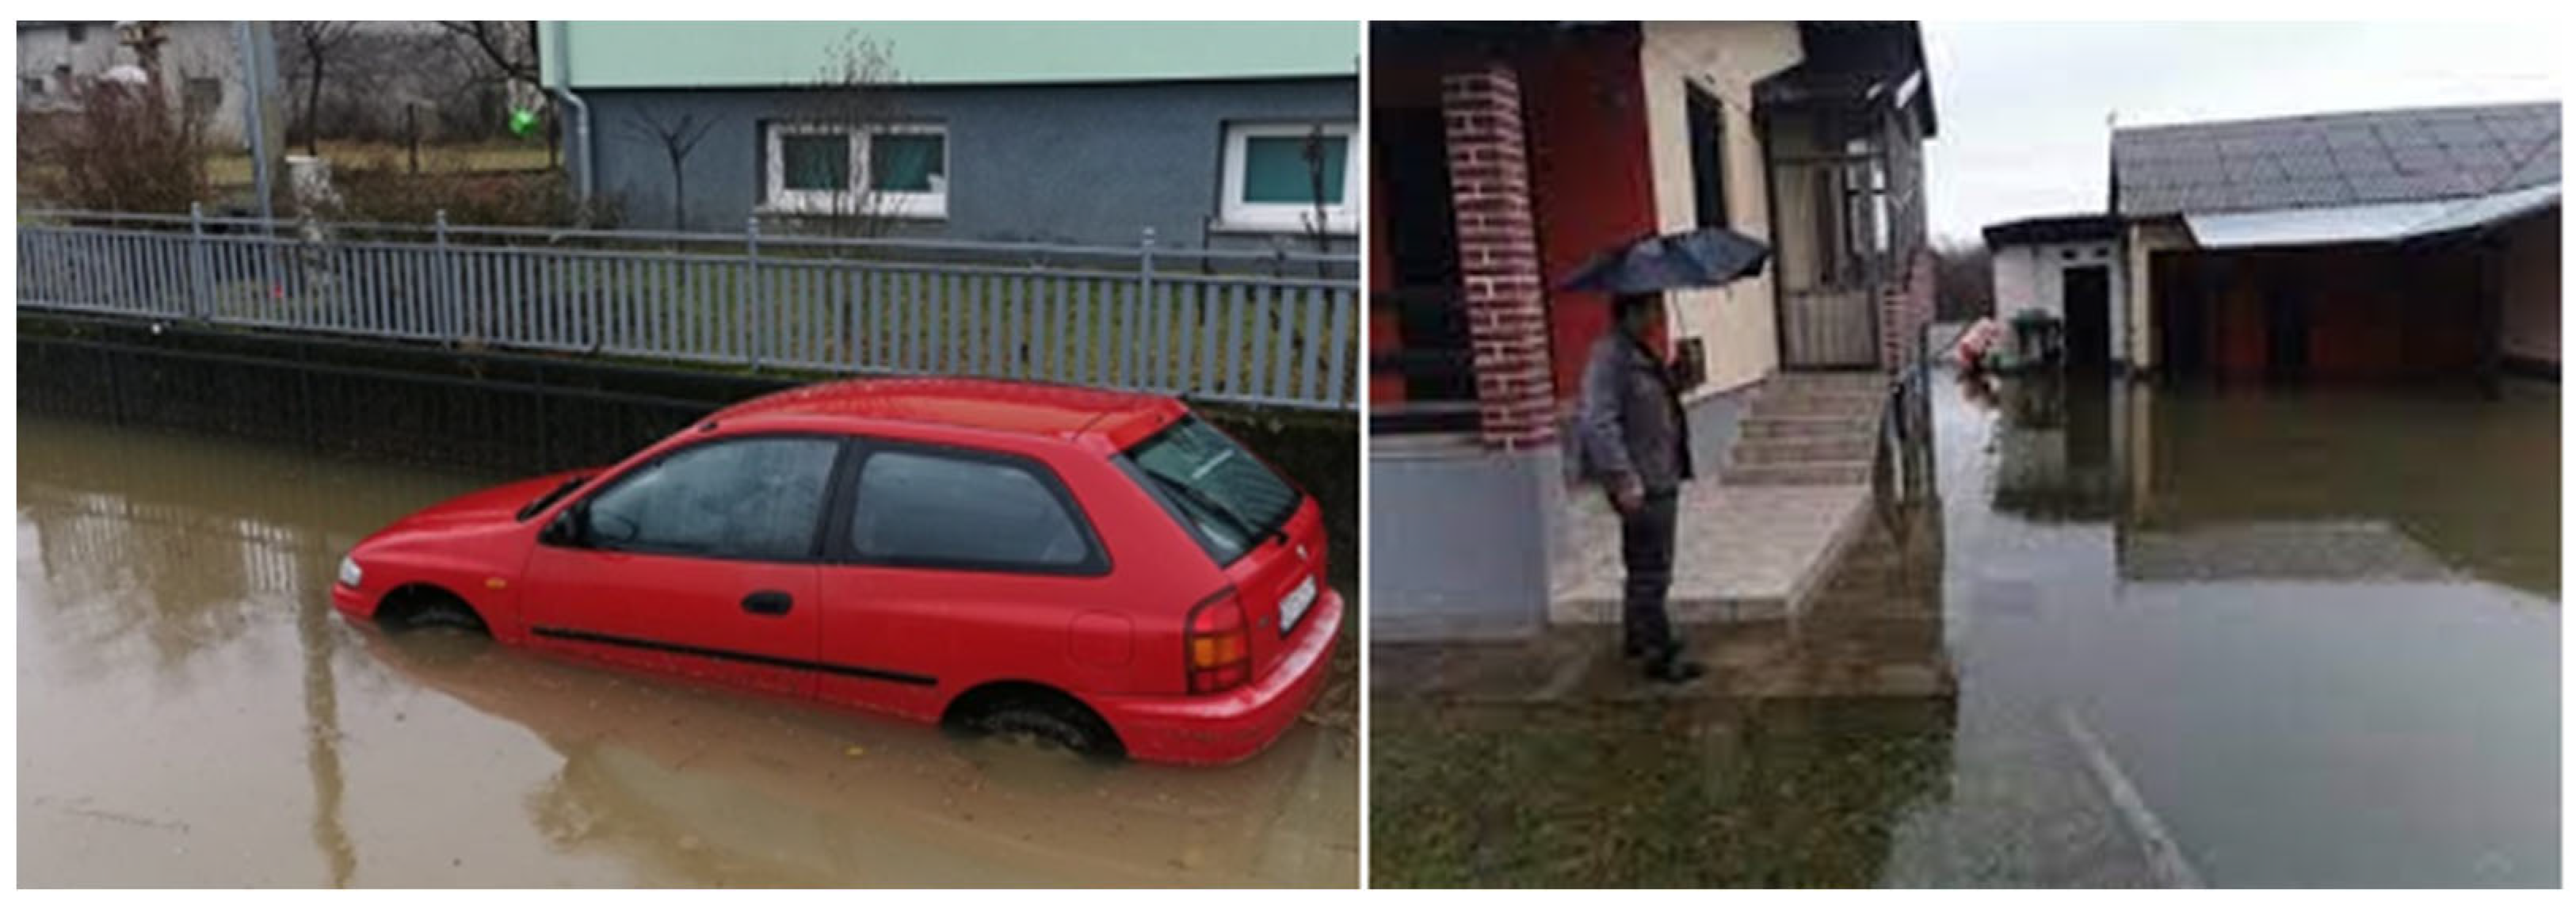
Within FRM, historical information is all data that enables the description and analysis of past flood events. This includes quantitative data, such as event dates or measurements related to the event, as well as factors like the intensity of the occurrence or the resulting damage. Sources of flood information encompass all documents associated with the occurrence (evidence, photographs, videos, graphics, etc.) (Figure 5).
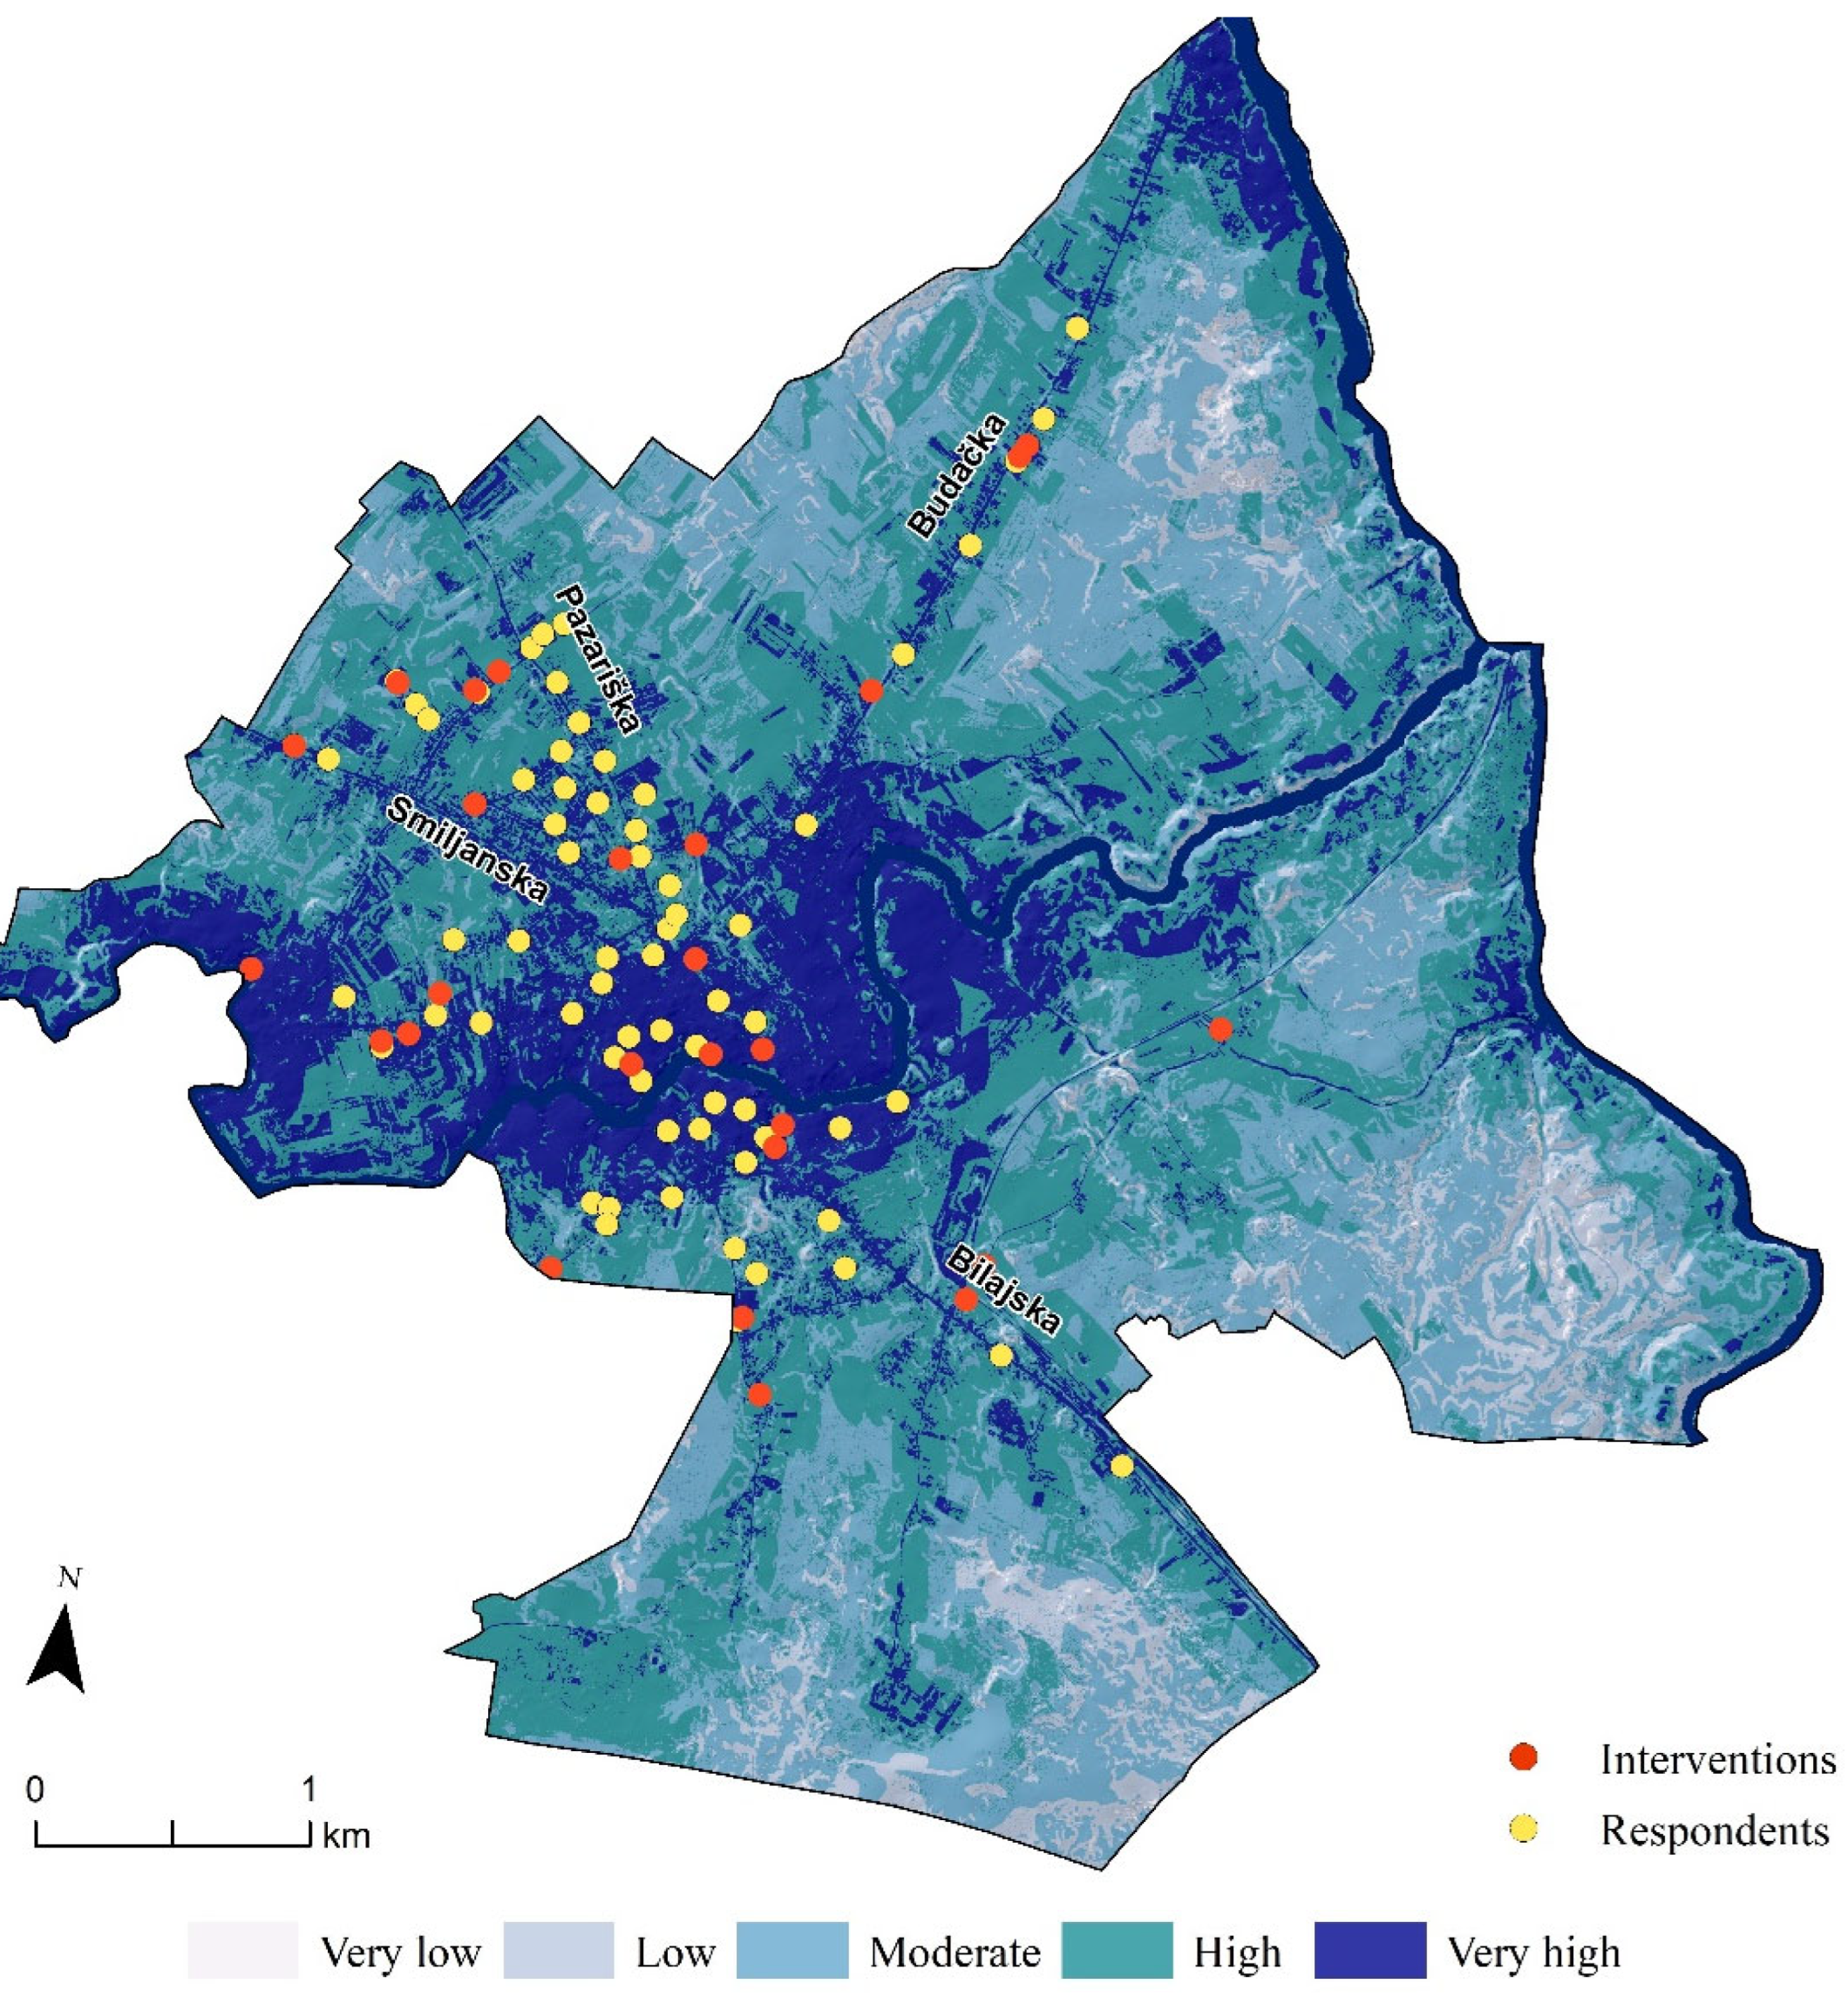
Historical PF data were collected from various sources, including public fire brigades, civil protection agencies, municipal institutions, and internet sources. During floods, firefighting units are deployed to assist the local population. After each intervention, they record essential data presented in Figure 6 as PF interventions. Participants mapped flood zones on an aerial image, which was later digitized and integrated into the GIS database (Figure 6).

4. Results and Discussion

4.1. Public Perception of Risk

Socio-economics Characteristics of Population

The gender distribution within the population was evenly split, with 54% of the respondents being male, while 46% were female. The respondents represented a range of age groups, with the most significant proportion (78%) falling within the age group of 18 to 59. Educational backgrounds within the population showed variation; a small fraction (2%) of respondents had not completed elementary school, while a substantial proportion (46%) had completed university education.
The majority (72%) of respondents were employed, 15% were retired, 7% were unemployed, and the rest were students. This reflects the diverse workforce representation in the sample. Income levels in the respondents’ households varied, with approximately 52% reporting average monthly incomes between 550 and 1500 euros. About 14% of respondents had incomes below 550 euros. Furthermore, a significant number (72%) of respondents resided in single-family houses; 52% had basements. Regarding the surroundings of their homes, 70% of the respondents reported that their residences are adjacent to or near green spaces, indicating the prevalence of nature over impermeable surfaces. Investigating personal experience with PF showed that 20% of respondents had experienced PF consequences in the form of property damage within the last 20 years. Regarding neighbourhood incidents, 44% of respondents reported that PF had occurred in their streets, while 30% had no prior experience with such flood events.

4.2. Public Perception of Risk

Statistical Analysis

Cronbach’s Alpha value for the observed factors was higher than 0.7, suggesting a solid internal consistency within each factor, so grouping was based on predefined categories (Table 3. Awareness of PF (F1) had the highest reliability of 0.9. There are slight differences when examining central tendencies and variations within the observed factors.
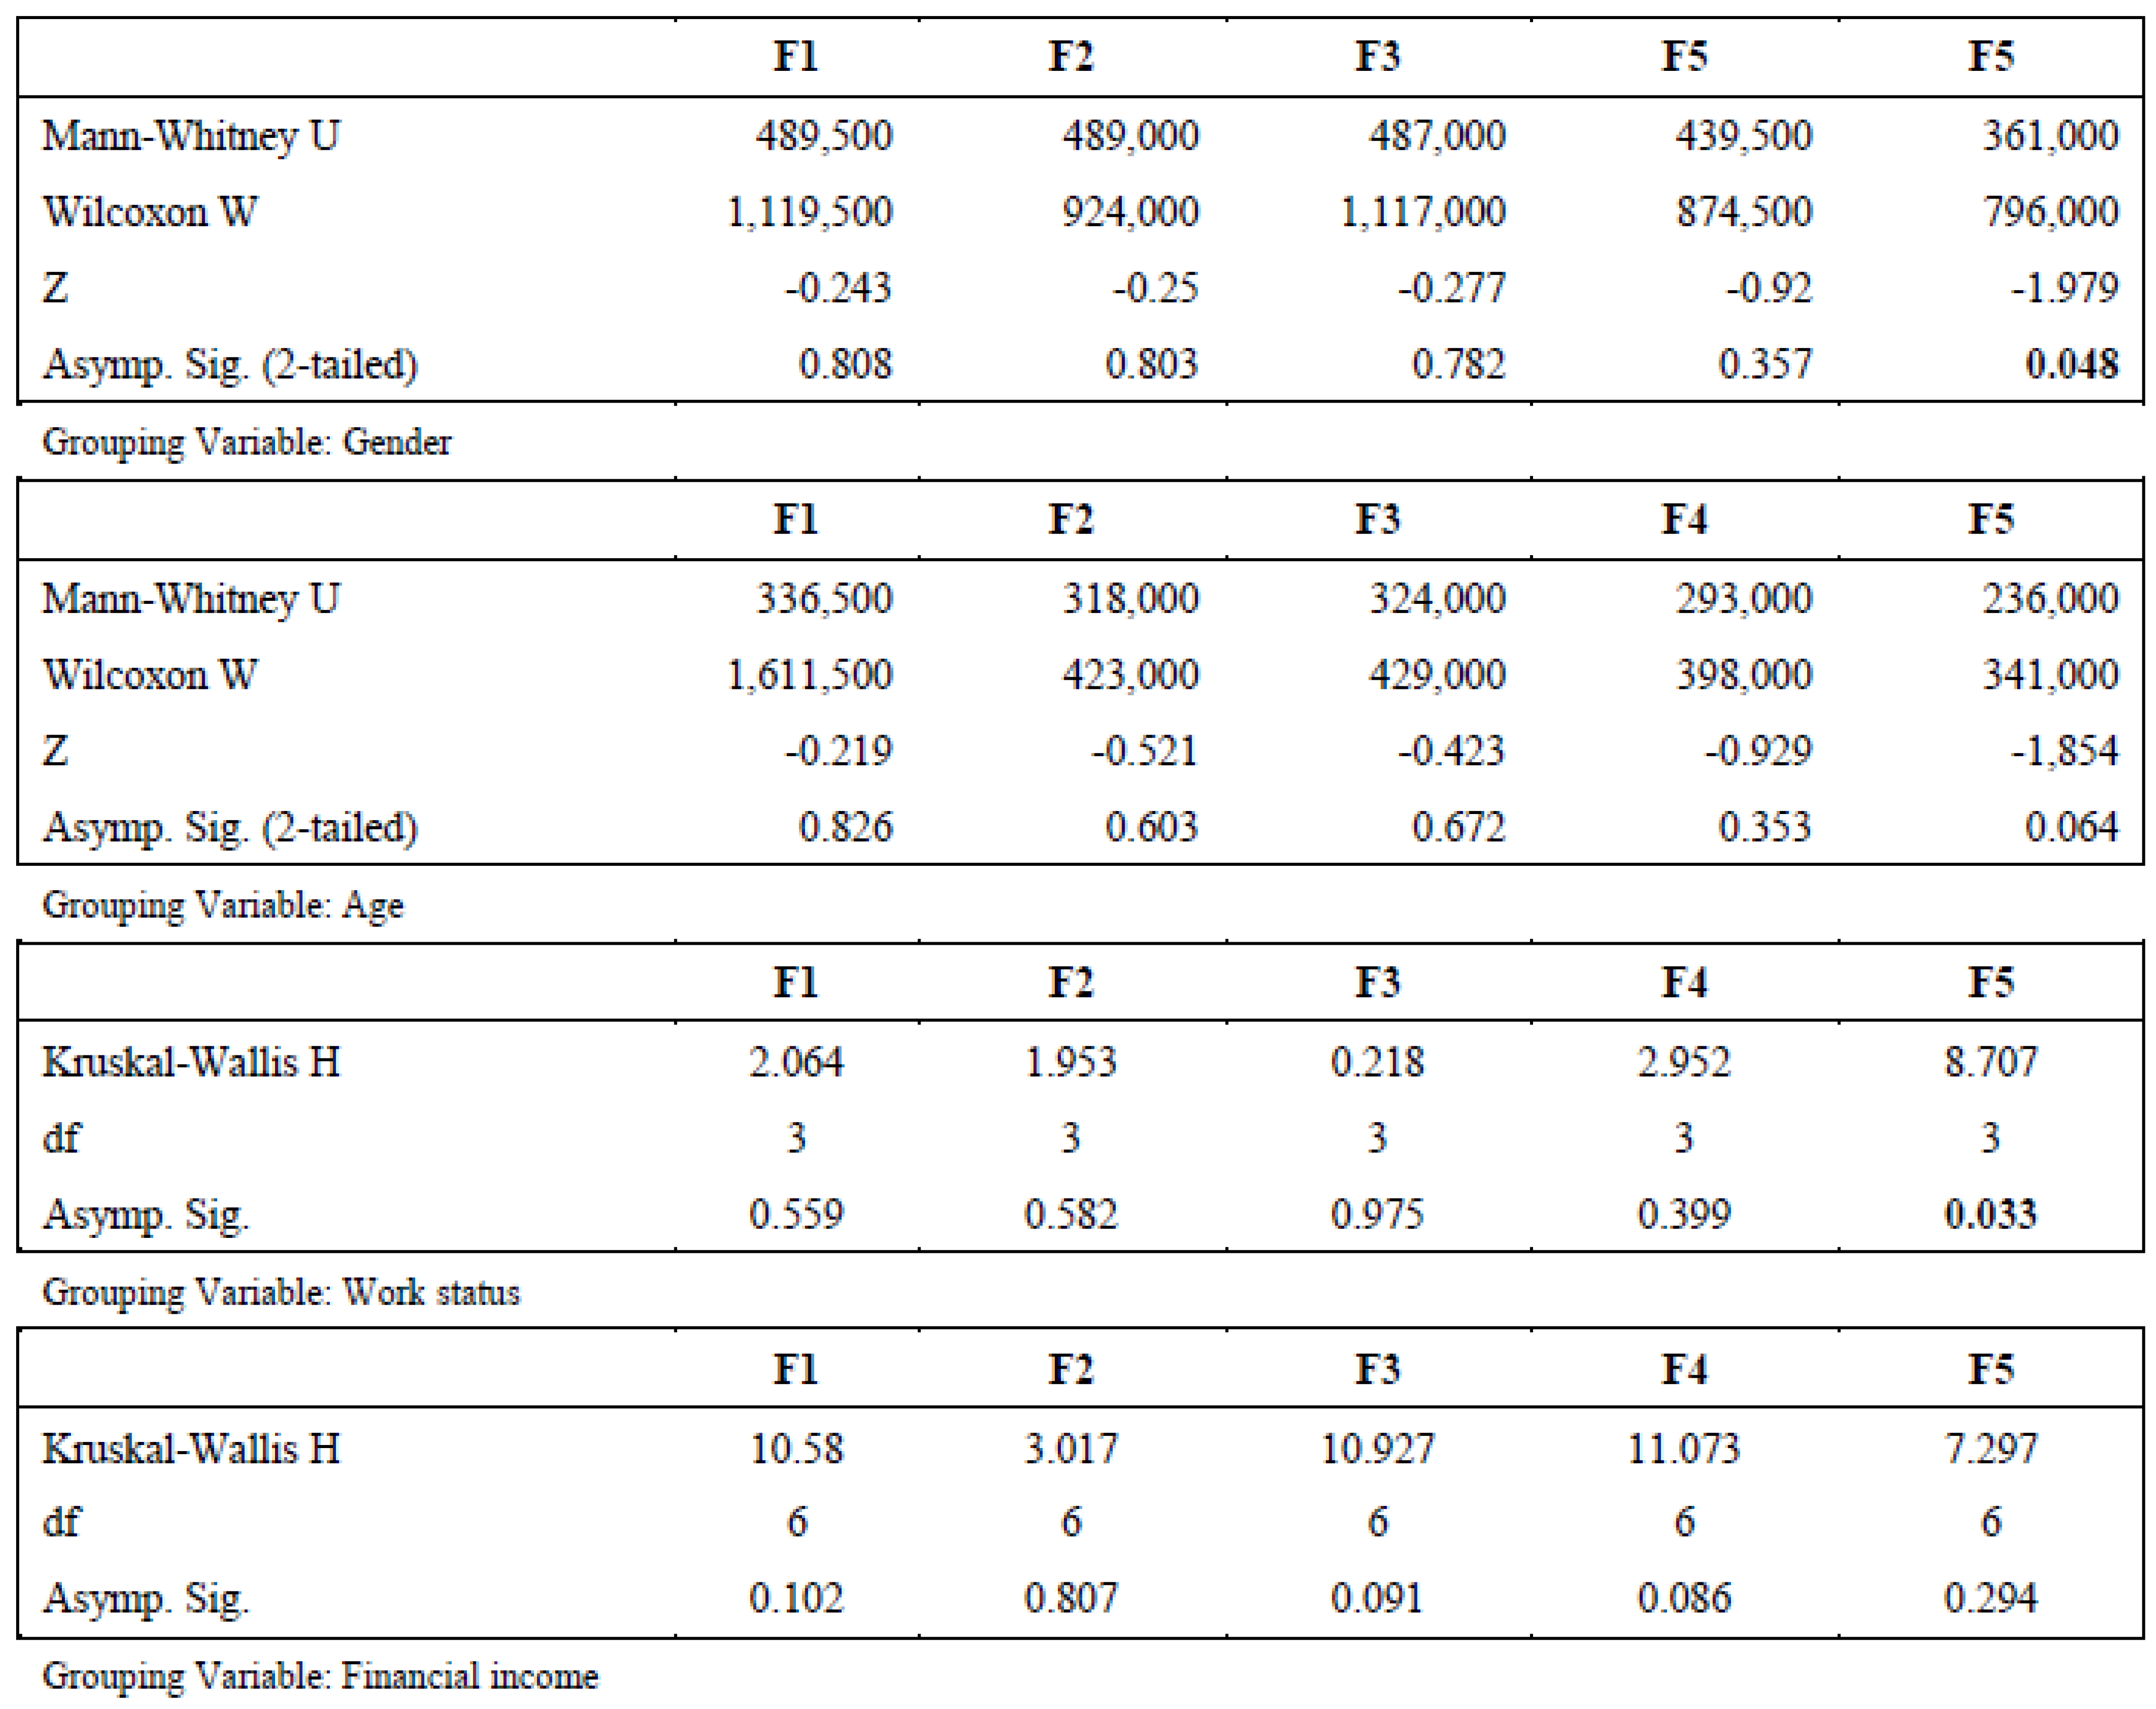
Considering demographic variables, the analysis resulted in significant differences based on gender and work status regarding factor F5. However, no significant differences were found based on age, education, or monthly income for the observed variables (Figure 7).
The overall awareness (F1) among respondents was moderate (2.77), but maximum values showed that some respondents have a high level (5) of awareness. Generally, the respondents showed low familiarity (1.42) with the concept of PF, with a standard deviation of 0.497. In addition, respondents often confused the concepts of pluvial and fluvial floods, frequently equating them. The majority (73%) believe they do not live in an area at high risk of PF. However, participants were moderately concerned regarding material property (3.28), urban infrastructure (3.20), and agricultural areas (3.20). There was less concern about risk for tourism (2.15), cultural heritage (2.38), and potential secondary effects like soil erosion or landslides (2.4). To better understand these findings, it is crucial to explain that Gospić is not highly urbanized, and agricultural lands predominate within its drainage basin. Given its location along a river that flows through the city, the local population is well-acquainted with the occasional flooding of these arable areas. Moreover, Gospić is not a tourist-centric city; its residents do not currently derive significant income from tourism, so the potential repercussions of PF are expected to be insignificant. The risk to respondents’ homes was estimated as relatively low (2.37), but the max values showed that 12.3% perceived a very high (5) risk to their homes.
Factor F2 had the highest average value (3.318), showing an awareness of human activities contributing to floods. This factor also displayed a relatively low standard deviation (0.75), indicating that responses were closely clustered around the mean. The leading causes of PF were the outdated stormwater drainage system (4.41) and a lack of maintenance of the stormwater drainage system (4.1). Additionally, some respondents further emphasized that in their streets, manholes are often blocked by leaves and branches, causing frequent flooding during moderate rainfall. The field survey also confirmed this. Compared to this, a moderate problem was seen with excessive concrete (3.35) and urbanization (3.11), while population density had very little or no influence (2.03). This population perception aligns with the fact that the settlement area is not densely built and is a demographically depressed area with a significant proportion of elderly residents characterized by depopulation processes [42].
The overall perception of F3 was moderate, with a mean score of 3.06. According to the respondents, soil type (2.54) and topographic conditions (2.65) were perceived to be moderately susceptible to pluvial floods. Respondents associated the occurrence of PF with climate change, with the highest mean score of 3.86 and a standard deviation of 1.223, showing consistency.
Considering F4, respondents generally held moderate expectations regarding an increase in heavy rainfall frequency (3.26), material damages to urban areas (3.15), public awareness (2.88), and financial investments (2.72) in PF prevention over the next ten years. The score relating to increased damage to respondents’ homes was 2.55, with a standard deviation of 1.358. However, while some respondents anticipated lower future changes, others had higher expectations, as reflected by the varying standard deviations.
F5 was assessed through the degree of agreement with specific statements. Notably, 60% of the respondents had not insured their property against floods. Regarding the statement that decision-makers have taken adequate measures for pluvial flood protection, respondents generally disagreed (2.15) and believed that certain institutions should do more in the context of prevention. The awareness of how to behave in case of hazard was moderate (2.89), with a relatively high standard deviation (1.425). This means that some respondents may be more informed and prepared than others. Additionally, respondents neither agreed nor disagreed (3.03) with the statement that there are sufficient manholes and drainage channels in their streets. However, a notable group strongly agreed regarding the insufficiency of drainage systems and the lack of manholes in their streets (20%). Furthermore, most respondents (73%) believed they were ill-equipped to defend against flooding independently and expressed a lack of confidence in the adequacy of risk mitigation measures taken by decision-makers. This underscores the need for improved flood risk communication and infrastructure measures.
Kolmogorov-Smirnov and Shapiro-Wilk tests were used to assess the normality of the distribution of variables. Results for the factors F1, F2, F3, and F5 suggested that there is no sufficient evidence to claim that the data were not normally distributed (Table 4). However, results for F4 suggested that the data may not be normally distributed, so non-parametric tests that are not sensitive to normality assumptions were used.
Mann-Whitney U, Wilson W, and Kruskal-Wallis H tests were used to determine significant differences in the observed indicators. Results showed no statistically significant differences in the observed factors based on age or education level, financial income per month, or ownership of the basement. However, there was a statistically significant difference in F5 (0.048) based on gender, with male participants showing higher preparedness. There was also a statistically significant difference in F5 based on employment status (0.033). The ranks were higher for unemployed persons. Significance was also observed in F1, awareness of PF, based on the building the respondent lived in. The respondents who were living in family houses had lower awareness.
The Chi-square test (Table 5) assessed the statistical significance of the relationship between various categorical variables concerning different statements or assertions. In the case of the following assertions, no significant associations were found with the tested variables:
  • Assessment of the threat to respondents’ homes
  • Familiarity with the concept of PF
  • Willingness to invest more personal financial resources in improving drainage systems.
  • Taken preventive measures on personal property in the last ten years.
  • The impact of PF on the quality of life
However, Table 5 presents the results of the Chi-square tests, which indicated significant relationships between certain categorical variables. An analysis of property insurance against PF damage revealed a significant association with the living floor type. Specifically, residents on the first floor were more likely to have flood insurance than those on the second and third floors.
The assessment of the willingness to transform concrete yard areas into green surfaces showed a significant relationship with the surrounding infrastructure, i.e., residents who already live near green spaces are more inclined to embrace such transformations. The evaluation of PF susceptibility based on property elevation demonstrated a significant association with higher ranks for people living in elevated and hilly areas.
Compared to the study [7,34], it is evident that the public awareness of flood risk in the population of Gospić is lower than that of the respondents in Poreč. However, the level of preparedness is similar in both cities. In both cases, survey participants expressed doubt regarding the adequacy of measures taken by decision-makers. Respondents in both cities also pointed out the issue of inadequate maintenance of stormwater drainage systems. In Poreč, statistical significance was observed concerning gender and the perception of anthropogenic causes.

4.3. GIS-MCDA Pluvial Flood Susceptibility

The created historical PF database for Gospić consisted of 26 critical locations. Flooding affects the ground floors of houses, basements, parking places, streets, and agricultural areas. In these locations, frequent firefighting interventions are utilized, such as water pumping and the construction of check dams. The GIS-MCDA was evaluated through a historical flood cadaster (26 locations) and resulted in a high accuracy and precision percentage of 78%, a recall of 100%, and an F1-score of 90%. Moreover, significant correspondence is noticed when comparing these results with the study [9], which centered on modeling potential flood depths and risk in Gospić. The high susceptibility zones closely matched regions with substantial flood depth in their model.
GIS-MCDA revealed that the most widespread type of PF susceptibility zone within Gospić City was a moderate susceptibility zone, covering approximately 36% of the area (Figure 8). These areas included various land uses–residential, commercial, and industrial. High susceptibility zones comprised 11% of the city and predominantly comprised agricultural land, forests, and meadows. However, some urban parts in the high susceptibility zones also included specific streets and residential properties. The most susceptible streets were Katarine Zrinski, Žabička, Smiljanska and Budačka. Still, the susceptibility is not uniform along the entire street lengths, i.e., the highest susceptibility was concentrated in specific sections characterized by low-incline, concave terrain with small sinks. Several residential properties along these streets have experienced firefighting interventions focused on removing the water buildup in basements and lower-level areas of these houses.
Comparing respondents’ locations with PF zones, it was noticed that 36% reside within the area characterized by the highest susceptibility to pluvial floods. Among these respondents, 17% had a direct experience with flooding. In comparison, 46% had an indirect experience, i.e., they were acquainted with someone residing in the same city or street who had encountered PF-related issues. The study on pluvial flood susceptibility in Gospić has elucidated suggestions for future research. This includes incorporating machine learning methods, enabling a more nuanced understanding of the impact of individual parameters on pluvial flood susceptibility, thereby enhancing the overall methodology.

5. Conclusions

The GIS-MCDA model indicates that most of the study area falls within zones of moderate susceptibility to PF, with a 10% coverage of very high susceptibility areas, mainly comprising agricultural land, meadows, forests, and some residential properties. Notably, 36% of the surveyed individuals reside in the highest susceptibility zones, with 17% reporting property damage within the past decade.
Statistical analysis has demonstrated robust internal consistency within each factor in the questionnaire. All factors have moderate mean values, i.e., awareness, causes of PF, expectations of consequences, and preparedness are moderate. Notably, the factor with the lowest mean value is awareness of risk, characterized by a limited familiarity with the concept of PF and a low-risk assessment of homes and properties. Given Gospić’s location near a river, residents often conflate the idea of pluvial and fluvial floods, expressing more significant concern about river overflow. Anthropogenic causes, with the highest mean score and low variability, are perceived as the primary contributors to PF.
Most respondents believe they are ill-equipped to defend against flooding independently and express a lack of confidence in the adequacy of risk mitigation measures taken by decision-makers. Still, 60% of respondents, of which 36% live in the most PF-susceptible zones, have not insured their properties against floods. A significant association was discovered between property insurance and the living floor, i.e., individuals residing on the first floor are more likely to possess flood insurance. Additionally, significant differences in preparedness are notable based on gender and employment status, with male and unemployed participants showing higher levels. Furthermore, residents residing near existing green spaces seem more inclined to embrace specific preventive measures.
The prevailing attitude is that decision-makers have inadequately addressed mitigation measures and that certain institutions must take more proactive roles in prevention and public awareness efforts. Respondents highlighted critical concerns, including the aging and lack of maintenance of stormwater drainage systems. Additionally, there are deficiencies in the existing legislative framework for spatial planning in Croatia, allowing construction permits to be issued irrespective of the natural flood-prone conditions.
Considering these findings, we recommend the following actions for decision-makers:
-
Invest in the restoration and enhancement of drainage systems.
-
Maintain existing infrastructure, including manholes and drainage channels, regularly.
-
Systematic documentation of pluvial flood events in the form of pluvial flood cadasters.
-
Implement amendments to urban planning documents to regulate construction in flood-prone areas.
-
Improve communication regarding flood risks and protective infrastructure measures.
-
Undertake structural measures, such as canal construction and riverbed regulation.
These measures are crucial in bolstering the preparedness and protection of Gospić against pluvial floods and heightening awareness and readiness among its residents regarding the risks and consequences associated with flooding. For future research, we suggest incorporating machine learning methods to determine individual parameters’ influence on pluvial flood occurrences more precisely. These enhancements will enable more accurate susceptibility modeling, reducing subjectivity in assigning weighting factors and increasing the relevance of results for the specific regional area.

Author Contributions

Conceptualization, S.Š. and R.M.; methodology, S.Š., R.M. and M.M., software: S.Š. and R.M, validation: R.M., formal analysis, S.Š. and R.M., writing—original draft preparation: S.Š., R.M. and M.M, writing—review and editing, R.M., M.M. and R.M. visualization. All authors have read and agreed to the published version of the manuscript.

Funding

This research was funded by the Italy-Croatia cross-border cooperation program 2014–2022 under the Interreg project Strategic Development of Flood Management (STREAM).

Institutional Review Board Statement

Not applicable.

Informed Consent Statement

Informed consent was obtained from all subjects involved in the study.

Data Availability Statement

The collected data is available upon request from the user.

Conflicts of Interest

The authors declare no conflict of interest.

Appendix A

              Pluvial flood risk in the city of Gospić (Croatia)                                                    
  • Dear,
    We are surveying to explore residents’ opinions regarding risk, experience, and preparedness for floods resulting from heavy rainfall (pluvial floods). The research is part of the STREAM project—Strategic Development of Flood Management—in a partnership between Croatian and Italian institutions. The survey is anonymous, and there is no need to provide your full name. Please help us with responses to contribute to the research. Thank you so much for your attention and participation.
    Address:________________________________________________________
    F1 Awareness of the Pluvial Flood Risk
  • Are you familiar with floods caused by heavy rainfall (pluvial floods)?
    □ YES 2□ NO
2.
I live in an area with a high risk of pluvial floods.
□ YES 2□ NO
3.
How often do pluvial floods occur in your town?
□ once a year
□ several times a year
□ once every five years
□ once every ten years
□ do not occur
4.
On a scale of 1 to 5, please rate the level of risk for the following statements (1—insignificant; 2—moderately significant; 3—significant; 4—very significant; 5—high)
12345
Risk of floods from heavy rainfall as a threat to your home
Risk of floods from heavy rainfall as a threat to drinking water sources
Risk of floods from heavy rainfall as a threat to agricultural areas
Risk of floods from heavy rainfall as a threat to human health
Risk of floods from heavy rainfall as a threat to human life
Risk of floods from heavy rainfall as a threat to residential structures
Risk of floods from heavy rainfall as a threat to city infrastructure
Risk of floods from heavy rainfall as a threat to material possessions
Risk of floods from heavy rainfall as a threat to the occurrence of secondary events (erosion, landslides, rockfalls, etc.)
Risk of floods from heavy rainfall as a threat to tourism
Risk of floods from heavy rainfall as a threat to cultural heritage
  • F2 Anthropogenic and F3 Natural Causes of Pluvial Floods
5.
On a scale of 1 to 5, please rate what you believe is the leading cause of pluvial floods (1—completely disagree; 2—disagree; 3—neither agree nor disagree; 4—agree; 5—agree entirely)
12345
Urbanisation
Excessive concrete development
Lack of green spaces
Insufficient pumping stations
Absence of a stormwater drainage system
Lack of maintenance of stormwater drainage systems
Outdated stormwater drainage system
Population density
Natural and artificial water flow barriers
Topographic conditions
Soil
Lack of investments in drainage systems
Climate change
6.
In your opinion, during which season is the greatest risk for pluvial floods?
1□ Spring    2□ Summer    3□ Autumn    4□ Winter
7.
Which city district or street in your town is particularly vulnerable to pluvial floods?
____________________________________________________________________
  • F4 Consequences of Pluvial Floods in the Future
8.
On a scale of 1 to 5, please rate your agreement with the occurrence of the following statements. (1—strongly disagree, 2—disagree, 3—neither agree nor disagree, 4—agree, 5—strongly agree)
12345
In the next ten years, the frequency of heavy rainfall in my area will increase.
The material damages caused by heavy rainfall in my area will increase in the next ten years.
In the next ten years, I expect material damage to my property due to the consequences of rainfall.
In the next ten years, the awareness of pluvial floods among the population will increase.
In the next 10 years, greater financial resources will be invested in improving, preventing, and protecting against pluvial floods.
  • F5 Preparedness for Pluvial Floods
9.
How much do you agree with the statement that citizens can take private initiatives to reduce the risk of pluvial floods?
(1—Strongly disagree, 2—Disagree, 3—Neither agree nor disagree, 4—Agree, 5—Strongly agree)
1□ 2□ 3□ 4□ 5□
10.
Which of the listed measures for mitigating pluvial floods is most necessary?
□ Changes in the legislative framework in spatial planning documentation during the construction of residential buildings and infrastructure (e.g., elevating structures to a higher level, increasing the proportion of undeveloped green areas around buildings, mandatory construction of drainage channels, etc.)
□ Amendments to the Water Act and related sub-legislation
□ Construction of a rainwater drainage system for the entire city area
□ Construction of stormwater grates along roadways
□ Utilization of green infrastructure measures (stormwater wells, green roofs, rain gardens, etc.)
□ Optimization of a combination of construction and non-construction measures
□ More frequent maintenance and cleaning of the existing stormwater drainage system
□ Other ___________________________________________
11.
Do you believe conducting education and information campaigns for citizens about pluvial floods is necessary? 1□ YES 2□ NO
12.
Would you invest more personal financial resources every month to improve the stormwater drainage system in your city? 1□ YES 2□ NO
13.
Would you convert a part of your concrete/asphalt-covered backyard into a green or permeable surface to reduce stormwater runoff? 1□ YES 2□ NO
14.
Your previous experience with pluvial floods has been:
□ Directly (I have personally been affected by a flood)
□ Indirectly (I know people from the city who have been affected by a flood)
□ I have no experience
15.
In the last ten years, have you taken measures to prevent and protect your property against the possibility of pluvial floods?
□ YES □ NO
16.
Has any damage from pluvial floods on your property in the last ten years?
□ YES □ NO
17.
Has any damage from pluvial floods to the infrastructure near your residential property in the last ten years?
□ YES □ NO
18.
To what extent do pluvial floods affect your quality of life:
(1—Not at all, 2—Do not affect, 3—Neither affect nor do not affect, 4—Affect, 5—Completely affect)
1□ 2□ 3□ 4□ 5□
19.
Is your property insured against damage caused by flooding?
□ YES □ NO
20.
How much money have you invested in the last five years to prevent and protect your property against the possibility of pluvial floods?
□ 0 HRK □ 1–150 EUR □ 150–700 EUR □ more than 700 EUR
On a scale from 1 to 5, rate how informed you are on behaving during a pluvial flood.
(1—Insufficient, 2—Adequate, 3—Good, 4—Very good, 5—Excellent)
1□ 2□ 3□ 4□ 5□
21.
On a scale of 1 to 5, rate the extent you agree with the given statements (1—completely disagree, 5—agree entirely).
12345
1.    Can you defend yourself independently against pluvial floods?
2.    Are your fellow citizens aware of the danger of pluvial floods?
3.    Is there a developed flood defence system for your city?
4.    Will the local community help you in the event of damage caused by pluvial floods?
5.    Are local authorities sufficiently engaged in informing the population about the danger of pluvial floods?
6.    Is the responsibility for flood defence on the individual?
7.    Is the responsibility for flood defence on the local community?
8.    Have decision-makers taken all necessary measures regarding protection from pluvial floods?
9.    Is there sufficient drainage manholes, channels, drains, grids, etc., installed in your street?
10.    Does the flood early warning system need improvement?
11.    Does the evacuation of stormwater to the ultimate recipient (watercourse, sea, lake) need improvement?
12.    Is the construction of retention basins and other structures (e.g., stormwater rotors) needed?
13.    Is the implementation of structural measures needed (reconstruction, construction of levees, channels, retention basins, river remediation, riverbed regulation, etc.)?
14.    Is the implementation of non-structural measures needed (planning, design, preparedness measures, environmental issues, financing, etc.)?
15.    Is it necessary to identify priority areas susceptible to pluvial floods?
16.    Is a flood risk management plan, hazard map, and other relevant documentation needed to inform citizens about preparation and recovery from pluvial floods?
  • Socio-demographic data
22.
Gender: 1□ Female 2□ Male
23.
Age:
□ 0–14
□ 15–59
□ >60
24.
Education:
□ No formal education 3□ elementary education
□ secondary education
□ undergraduate studies
□ graduate studies or equivalent
□ doctoral education
25.
Employment status:
1□ Employed 2□ Unemployed 3□ Retired 4□ Student
26.
Monthly household income:
□ Up to 530 EUR
□ 530 to 560 EUR
□ 560 to 1600 EUR
□ 210 to 2100 EUR
□ 2100 to 2700 EUR
□ More than 2700 EUR
□ Prefer not to answer
27.
According to its purpose, the property you live in is:
□ Residential
□ Residential and commercial (business space)
□ Residential and agricultural (for renting)
□ Residential, commercial, and agricultural
28.
Your housing status is:
□ Owner/buyer of property without a mortgage/loan
□ Owner/heir of property without a mortgage/loan
□ Tenant, paying rent to a private individual
□ Accommodation without paying rent (at parents’, partner’s, etc.)
□ Owner/buyer with a mortgage/loan
□ Tenant paying rent in a social/municipal apartment
□ Other
29.
Does your residential property have a basement? 1□ YES 2□ NO
30.
You live:
□ On the ground floor
□ On the first floor
□ On the third floor or higher
31.
At your property, the predominant infrastructure is:
□ Green infrastructure (all types of green areas)
□ Gray infrastructure (parking lots, paved areas, garages, etc.)

References

  1. Banholzer, S.; Kossin, J.; Donner, S. The Impact of Climate Change on Natural Disaster. In Reducing Disaster: Early Warning Systems for Climate Change; Dordrecht, The Netherlands, 2014; ISBN 978-94-017-8597-6. pp. 21–49. Available online: https://eprints.gla.ac.uk/162145/ (accessed on 24 October 2023).
  2. The Potential Impacts of Climate Variability and Change on Health Impacts of Extreme Weather Events in the United States. Environmental Health Perspectives. Volume 109, No. Suppl. 2. Available online: https://ehp.niehs.nih.gov/doi/abs/10.1289/ehp.109-1240666 (accessed on 8 January 2024).
  3. Trenberth, K.E. Changes in Precipitation with Climate Change. Clim. Res. 2011, 47, 123–138. [Google Scholar] [CrossRef]
  4. Houston, D.; Werritty, A.; Bassett, D.; Geddes, A.; Hoolachan, A.; McMillan, M. Pluvial (Rain-Related) Flooding in Urban Areas: The Invisible Hazard; Joseph Rowntree Foundation: London, UK, 2011. [Google Scholar]
  5. Di Salvo, C.; Ciotoli, G.; Pennica, F.; Cavinato, G.P. Pluvial Flood Hazard in the City of Rome (Italy). J. Maps 2017, 13, 545–553. [Google Scholar] [CrossRef]
  6. Francipane, A.; Pumo, D.; Sinagra, M.; La Loggia, G.; Noto, L.V. A Paradigm of Extreme Rainfall Pluvial Floods in Complex Urban Areas: The Flood Event of 15 July 2020 in Palermo (Italy). Nat. Hazards Earth Syst. Sci. 2021, 21, 2563–2580. [Google Scholar] [CrossRef]
  7. Siljeg, S.; Milosevic, R.; Pandja, L. Public Perception of the Urban Pluvial Floods Risk-Case Study of Porec (Croatia). J. Geogr. Inst. Jovan Cvijic SASA 2022, 72, 147–158. [Google Scholar] [CrossRef]
  8. Feng, Y.; Sester, M. Extraction of Pluvial Flood Relevant Volunteered Geographic Information (VGI) by Deep Learning from User Generated Texts and Photos. ISPRS Int. J. Geo-Inf. 2018, 7, 39. [Google Scholar] [CrossRef]
  9. Krvavica, N.; Šiljeg, A.; Horvat, B.; Panđa, L. Pluvial Flash Flood Hazard and Risk Mapping in Croatia: Case Study in the Gospić Catchment. Sustainability 2023, 15, 1197. [Google Scholar] [CrossRef]
  10. Netzel, L.M.; Heldt, S.; Engler, S.; Denecke, M. The Importance of Public Risk Perception for the Effective Management of Pluvial Floods in Urban Areas: A Case Study from Germany. J. Flood Risk Manag. 2021, 14, e12688. [Google Scholar] [CrossRef]
  11. Douglas, I.; Garvin, S.; Lawson, N.; Richards, J.; Tippett, J.; White, I. Urban Pluvial Flooding: A Qualitative Case Study of Cause, Effect and Nonstructural Mitigation: Urban Pluvial Flooding. J. Flood Risk Manag. 2010, 3, 112–125. [Google Scholar] [CrossRef]
  12. Pham, B.T.; Phong, T.V.; Nguyen, H.D.; Qi, C.; Al-Ansari, N.; Amini, A.; Ho, L.S.; Tuyen, T.T.; Yen, H.P.H.; Ly, H.-B.; et al. A Comparative Study of Kernel Logistic Regression, Radial Basis Function Classifier, Multinomial Naïve Bayes, and Logistic Model Tree for Flash Flood Susceptibility Mapping. Water 2020, 12, 239. [Google Scholar] [CrossRef]
  13. Swain, K.C.; Singha, C.; Nayak, L. Flood Susceptibility Mapping through the GIS-AHP Technique Using the Cloud. ISPRS Int. J. Geo-Inf. 2020, 9, 720. [Google Scholar] [CrossRef]
  14. Khosravi, K.; Shahabi, H.; Pham, B.T.; Adamowski, J.; Shirzadi, A.; Pradhan, B.; Dou, J.; Ly, H.-B.; Gróf, G.; Ho, H.L.; et al. A Comparative Assessment of Flood Susceptibility Modeling Using Multi-Criteria Decision-Making Analysis and Machine Learning Methods. J. Hydrol. 2019, 573, 311–323. [Google Scholar] [CrossRef]
  15. Siegrist, M.; Gutscher, H. Natural Hazards and Motivation for Mitigation Behavior: People Cannot Predict the Affect Evoked by a Severe Flood. Risk Anal. 2008, 28, 771–778. [Google Scholar] [CrossRef]
  16. Renn, O. Concepts of Risk: An Interdisciplinary Review Part 1: Disciplinary Risk Concepts. GAIA Ecol. Perspect. Sci. Soc. 2008, 17, 50–66. [Google Scholar] [CrossRef]
  17. Brilly, M.; Polic, M. Public Perception of Flood Risks, Flood Forecasting and Mitigation. Nat. Hazards Earth Syst. Sci. 2005, 5, 345–355. [Google Scholar] [CrossRef]
  18. Birkholz, S.; Muro, M.; Jeffrey, P.; Smith, H.M. Rethinking the Relationship between Flood Risk Perception and Flood Management. Sci. Total Environ. 2014, 478, 12–20. [Google Scholar] [CrossRef]
  19. Oubennaceur, K.; Chokmani, K.; Lessard, F.; Gauthier, Y.; Baltazar, C.; Toussaint, J.-P. Understanding Flood Risk Perception: A Case Study from Canada. Sustainability 2022, 14, 3087. [Google Scholar] [CrossRef]
  20. Pluvial Flooding: New Approaches in Flood Warning, Mapping and Risk Management—Falconer—2009—Journal of Flood Risk Management—Wiley Online Library. Available online: https://onlinelibrary.wiley.com/doi/full/10.1111/j.1753-318X.2009.01034.x?casa_token=nZkPaijH2lEAAAAA%3AGpFyBWauNGYfmi39SRY4u2lcBzbRXxtWnJoWml0EAnZ5cNLdtZoeAfGGfZG_Wf_MM2bWGAHrBF-ncLQ04A (accessed on 8 January 2024).
  21. Kellens, W.; Terpstra, T.; De Maeyer, P. Perception and Communication of Flood Risks: A Systematic Review of Empirical Research. Risk Anal. 2013, 33, 24–49. [Google Scholar] [CrossRef]
  22. Schmitt, T.G.; Scheid, C. Evaluation and Communication of Pluvial Flood Risks in Urban Areas. WIREs Water 2020, 7, e1401. [Google Scholar] [CrossRef]
  23. Lechowska, E. What Determines Flood Risk Perception? A Review of Factors of Flood Risk Perception and Relations between Its Basic Elements. Nat. Hazards 2018, 94, 1341–1366. [Google Scholar] [CrossRef]
  24. Pagneux, E.; Gísladóttir, G.; Jónsdóttir, S. Public Perception of Flood Hazard and Flood Risk in Iceland: A Case Study in a Watershed Prone to Ice-Jam Floods. Nat. Hazards 2011, 58, 269–287. [Google Scholar] [CrossRef]
  25. Cibilić, A.; Barbalić, D.; Rubinić, J.; Karleuša, B.; Krvavica, N. Heavy Rain Flood Risk Management—RAINMAN Project. 2019. Available online: https://www.researchgate.net/publication/333747035_Heavy_Rain_Flood_Risk_Management_-_RAINMAN_Project (accessed on 24 October 2023).
  26. Popis 2021. Available online: https://dzs.gov.hr/naslovna-blokovi/u-fokusu/popis-2021/88 (accessed on 24 October 2023).
  27. Pejnović, D. Režim tekućica kao indikator općih hidrogeografskih obilježja Like. Hrvat. Geogr. Glas. 1991, 53, 41–55. [Google Scholar]
  28. Pejnović, D. Prilog poznavanju obilježja klime i klimatska regionalizacija Like. Acta Geogr. Croat. 1990, 25, 1–21. [Google Scholar]
  29. Cronbach, L.J. Coefficient Alpha and the Internal Structure of Tests. Psychometrika 1951, 16, 297–334. [Google Scholar] [CrossRef]
  30. Mishra, P.; Pandey, C.; Singh, U.; Gupta, A.; Sahu, C.; Keshri, A. Descriptive Statistics and Normality Tests for Statistical Data. Ann. Card. Anaesth. 2019, 22, 67. [Google Scholar] [CrossRef]
  31. Domazetović, F.; Šiljeg, A.; Lončar, N.; Marić, I. Development of Automated Multicriteria GIS Analysis of Gully Erosion Susceptibility. Appl. Geogr. 2019, 112, 102083. [Google Scholar] [CrossRef]
  32. Vojtek, M.; Vojteková, J. Flood Susceptibility Mapping on a National Scale in Slovakia Using the Analytical Hierarchy Process. Water 2019, 11, 364. [Google Scholar] [CrossRef]
  33. Lin, L.; Wu, Z.; Liang, Q. Urban Flood Susceptibility Analysis Using a GIS-Based Multi-Criteria Analysis Framework. Nat. Hazards 2019, 97, 455–475. [Google Scholar] [CrossRef]
  34. Šiljeg, A.; Šiljeg, S.; Milošević, R.; Marić, I.; Domazetović, F.; Panđa, L. Multi-Hazard Susceptibility Model Based on High Spatial Resolution Data—A Case Study of Sali Settlement (Dugi Otok, Croatia). Environ. Sci. Pollut. Res. 2023. [Google Scholar] [CrossRef]
  35. Lin, J.; Zhang, W.; Wen, Y.; Qiu, S. Evaluating the Association between Morphological Characteristics of Urban Land and Pluvial Floods Using Machine Learning Methods. Sustain. Cities Soc. 2023, 99, 104891. [Google Scholar] [CrossRef]
  36. Gudiyangada Nachappa, T.; Tavakkoli Piralilou, S.; Gholamnia, K.; Ghorbanzadeh, O.; Rahmati, O.; Blaschke, T. Flood Susceptibility Mapping with Machine Learning, Multi-Criteria Decision Analysis and Ensemble Using Dempster Shafer Theory. J. Hydrol. 2020, 590, 125275. [Google Scholar] [CrossRef]
  37. Haque, M.N.; Siddika, S.; Sresto, M.A.; Saroar, M.M.; Shabab, K.R. Geo-Spatial Analysis for Flash Flood Susceptibility Mapping in the North-East Haor (Wetland) Region in Bangladesh. Earth Syst. Environ. 2021, 5, 365–384. [Google Scholar] [CrossRef]
  38. Choudhury, K.N.; Yabar, H.; Mizunoya, T. GIS and Remote Sensing-Based Spatiotemporal Analysis of Cumulative Flood Risk over Bangladesh’s National Highways. Asia-Pac. J. Reg. Sci. 2022, 6, 335–364. [Google Scholar] [CrossRef]
  39. Arabameri, A.; Saha, S.; Chen, W.; Roy, J.; Pradhan, B.; Bui, D.T. Flash Flood Susceptibility Modelling Using Functional Tree and Hybrid Ensemble Techniques. J. Hydrol. 2020, 587, 125007. [Google Scholar] [CrossRef]
  40. Conforti, M.; Aucelli, P.P.C.; Robustelli, G.; Scarciglia, F. Geomorphology and GIS Analysis for Mapping Gully Erosion Susceptibility in the Turbolo Stream Catchment (Northern Calabria, Italy). Nat. Hazards 2011, 56, 881–898. [Google Scholar] [CrossRef]
  41. North, M.A. A Method for Implementing a Statistically Significant Number of Data Classes in the Jenks Algorithm. In Proceedings of the 2009 Sixth International Conference on Fuzzy Systems and Knowledge Discovery, Tianjin, China, 14–16 August 2009; Volume 1, pp. 35–38. [Google Scholar]
  42. Croatian Bureau of Statistics. Popis stanovništva 2021 [Census 2021]. 2021. Available online: https://popis2021.hr/ (accessed on 24 October 2023).
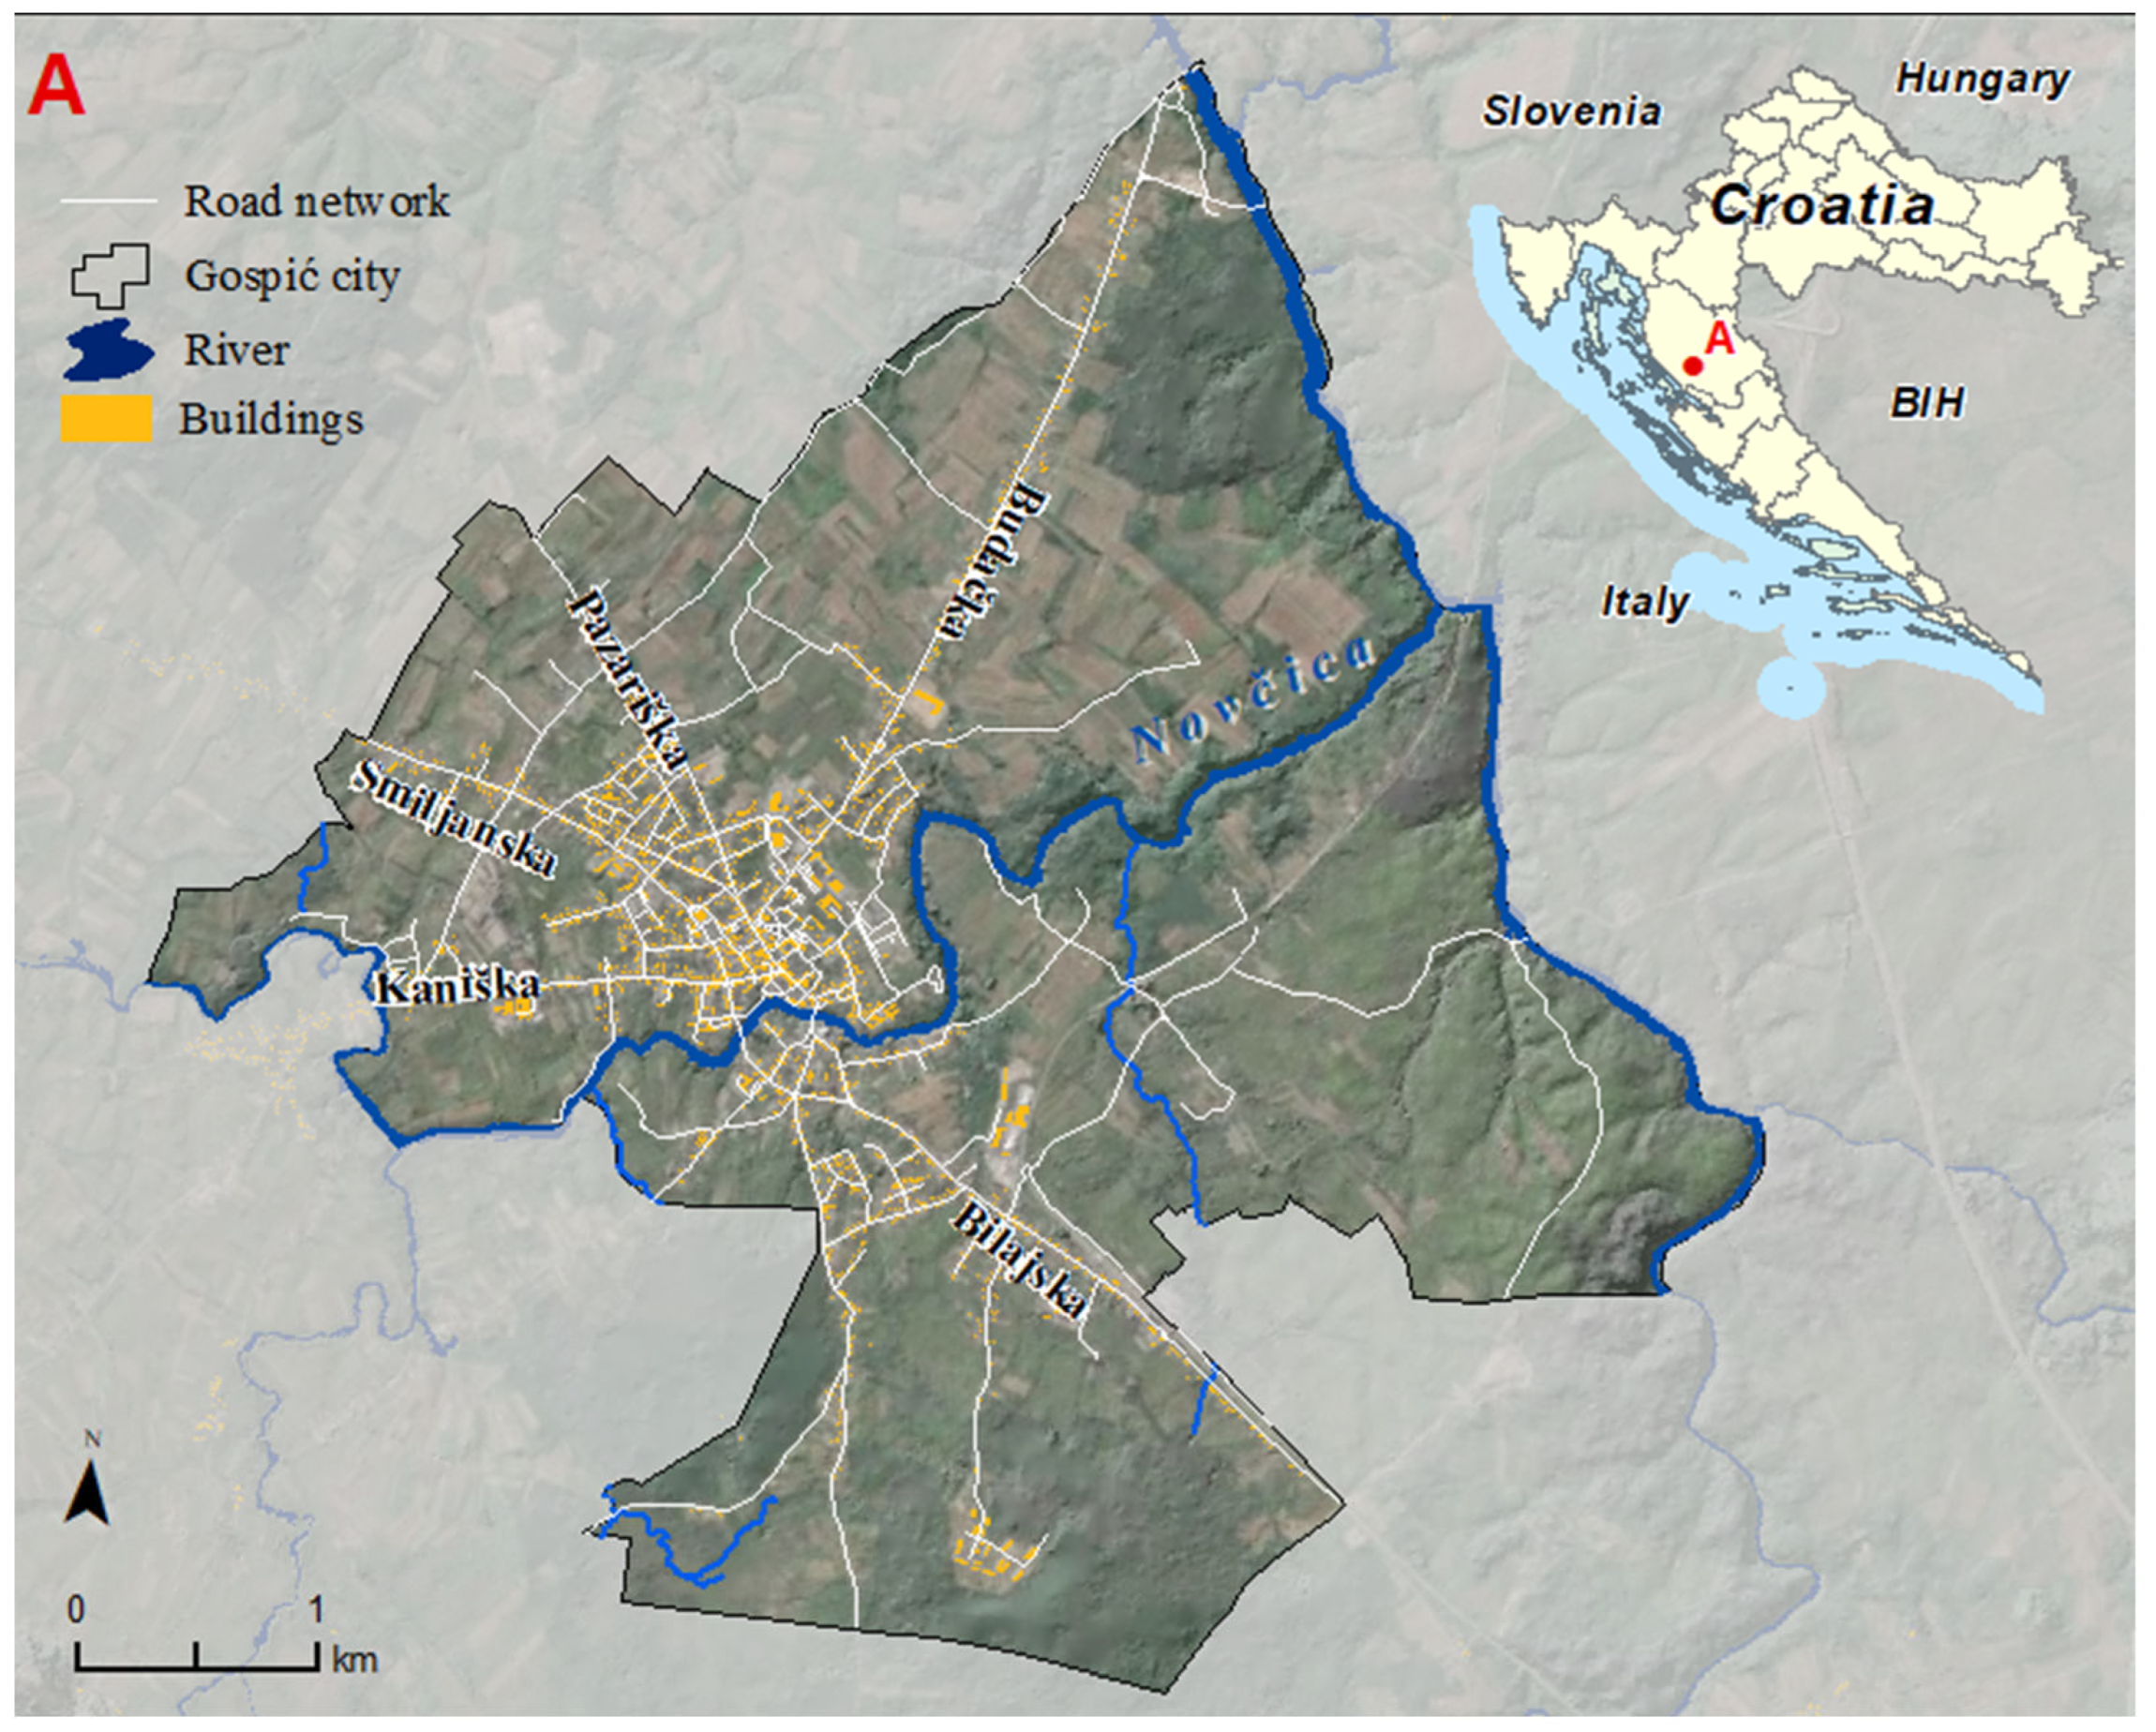
Figure 1. Study area—Gospić city (A).
Sustainability 16 01701 g001
Figure 2. GIS-MCDA methodology workflow.
Sustainability 16 01701 g002
Figure 3. Generated GIS-MCDA criteria.
Sustainability 16 01701 g003
Figure 4. Land cover (LC) model and digital elevation model (DEM).
Sustainability 16 01701 g004
Figure 5. Pluvial floods in Gospić—derived from newspapers: https://www.lika-express.hr/ (accessed on 26 December 2021).
Sustainability 16 01701 g005
Figure 6. PF cadastre—database of historical PF locations.
Sustainability 16 01701 g006
Figure 7. Comparison of socio-economic variables and factors (F1–F5).
Sustainability 16 01701 g007
Figure 8. GIS-MCDA Pluvial Flood Susceptibility Model.
Sustainability 16 01701 g008
Table 1. Average monthly temperature and precipitation values for the city of Gospić from 1857 to 2021. Drawn from the National Hydrometeorological Institute (DHMZ).
Jan FebMarAprMayJunJulAugSepOctNovDec
Air temperature
Mean [C°]−1.7−0.33.98.513.216.919.118.414.19.34.50.2
Precipitation
Total (mm)114.5114.4111.1118.8109.795.57182.4134.7185.6191.1165.8
Max snow (cm)1052851106224---32595100
Table 2. The Analytical Hierarchical Process (AHP) pairwise comparison matrix.
FDLCSLOPLANRDSDDDTWITRISPINDVIELVwok
FD1223334888890.241
LC1/2111222355550.129
SLO1/2112223334470.135
PLAN1/311/21112323450.092
RD1/31/21/21112333350.086
SD1/31/21/21113579350.117
DD1/41/21/31/21/21/31233230.057
TWI1/81/31/31/31/31/51/2122130.038
TRI1/81/51/31/21/31/71/31/213120.033
SPI1/81/51/41/31/31/91/31/21/31120.025
NDVI1/81/51/41/41/31/31/2111110.028
ELV1/81/51/71/51/51/51/31/31/21/2110.019
1
λmax12.603
CI0.055
CR0.036
Historical Pluvial Flood Data Collection.
Table 3. Mean values by factors (median) and the indicator of their dispersion.
F1 F2F3 F4 F5
Mean2.773.323.062.913.13
Sd0.9990.750.8970.950.539
Minimum11.561.611.69
Maximum5554.44.81
Cronbach′s α0.9130.7610.6760.7650.72
Table 4. Distribution normality testing.
FactorKolmogorov-SmirnovaShapiro-Wilk
StatisticdfSig.StatisticdfSig.
F1 Awareness0.095640.200 *0.966640.076
F2 Anthropogenic caus.0.098640.200 *0.983640.53
F3 Natural causes0.102640.0960.965640.064
F4 Consequences0.123640.0180.94640.004
F5 Preparedness0.096640.200 *0.963640.052
* The lower bound of the true significance.
Table 5. Chi-square—statistically significant values.
Is your property insured against pluvial flood damage?
YES NO
N%N%
Living floorGround 829.62362.2p = 0.028
1st floor1659.31335.1df = 2
3d floor311.112.7χ2 = 7.181
Total2710037100
Would you transform your concreted part of the yard into a green surface to increase infiltration?
Surrounding infrastructureGreen areas3088.21446.7p = 0.000
Impermeable 411.81653.3df = 1
Total3410030100χ2 = 12.818
Do you live in an area highly susceptible to PF?
Property elevationLowland531.200p = 0.000
Moderately elevated 212.51838df = 2
Hilly terrain956.33063χ2 = 17.477
Total 1610048100
Chi square
Disclaimer/Publisher’s Note: The statements, opinions and data contained in all publications are solely those of the individual author(s) and contributor(s) and not of MDPI and/or the editor(s). MDPI and/or the editor(s) disclaim responsibility for any injury to people or property resulting from any ideas, methods, instructions or products referred to in the content.