Abstract
City health examinations are integral to China’s urban planning, construction, and management. They effectively identify potential risks and vulnerabilities in urban development, ensuring safety resilience—a critical component. This resilience enhances the city’s ability to withstand internal and external shocks, promoting the safety of urban residents and fostering sustainable city development. Drawing on the Japanese disaster prevention strategy, the disaster prevention life circle emerges as a rescue and protection system during urban disasters, fortifying urban safety resilience. However, smaller and mid-sized cities, constrained by limited resources, significantly need to catch up in disaster prevention planning. Consequently, bolstering safety resilience in these cities becomes a pressing concern. This study focuses on Lindian County in Heilongjiang Province as the urban area under consideration for resilient city objectives. Leveraging the ArcGIS network analysis tool, we optimize the placement of emergency shelters, aligning with urban disaster assessments and the equilibrium of disaster prevention facility supply and demand. Accessibility analysis of emergency shelters was conducted using the Gaussian two-step floating catchment area method. Ultimately, we integrate the range of demand points assigned to each shelter, along with the effective land area reflecting the supply of shelters, as weights into a weighted Voronoi diagram. This diagram is combined with a reference to the entire region to delineate the disaster prevention life circle. Findings reveal that, under the premise of minimizing government construction costs while maximizing coverage and evacuation utilization rates, the optimal resident emergency congregate shelters in the study area are 8, with 98 emergency evacuation and embarkation shelters. Striking a balance between disaster prevention facility supply and demand and regional accessibility, the urban area of Lindian County is segmented into 3 resident disaster prevention life circles and 24 emergency disaster prevention life circles. The objective of this study is to optimize shelter siting and establish disaster prevention life circles in diverse urban areas. This endeavor aims to bolster urban resilience and foster sustainable urban development.
1. Introduction
As an important work to comprehensively evaluate the development and construction of China’s cities, formulate countermeasures, and optimize urban development goals, the city health examination embodies the spirit of General Secretary Xi Jinping’s important directive on the establishment of a mechanism for the city health examination [1]. In 2024, China will systematically conduct comprehensive city health examinations in cities at the prefecture level and above to manage urban issues systematically [2]. Safety resilience, as one of the core elements of the city health examination, has received extensive attention from the state and society. In recent years, the rapid growth of cities and the increasingly intricate climate change scenarios pose novel challenges and demands for urban disaster prevention and mitigation. Globally, countries strive to establish robust and resilient comprehensive urban disaster prevention systems, achieving notable progress in research [3]. Notably, Japan’s mature disaster prevention life circle system has become a vital element in Japan’s disaster prevention planning after years of construction and development. The disaster prevention life circle was originally a spatial plan focused on schools. It’s surrounded by fire-resistant buildings and green spaces, creating a zone to prevent fires from spreading. Communities and organizations conduct disaster prevention education and drills, improving neighbor cooperation. This integrates disaster prevention with urban planning, enhancing community disaster preparedness [4]. The “Spatial Planning Guidance: Community Life Unit”, released and implemented by the Ministry of Natural Resources on 1 July 2021, is China’s inaugural national standard for planning, offering technical guidance and standardization requirements [5]. This standard explicitly advocates for cities to formulate graded spatial response strategies for emergency shelters, emergency access, and disaster prevention facilities based on the hierarchical arrangement of “15 min, 5–10 min”. This document’s publication has achieved convergence for the Japanese disaster prevention life circle planning system to be applied in our country. One of the important factors is that it emphasizes the community-based disaster prevention and mitigation model, which is naturally related and similar to the contents of our community life unit system. As the foundational unit meeting the diverse needs of urban and rural residents in China, the community life unit plays a fundamental and comprehensive role in normal circumstances and during disasters. It serves as a crucial spatial component for urban disaster prevention and mitigation. Emergency shelters as a resettlement measure for victims of emergencies are also a central element of the disaster prevention life circle. Their rational distribution of resources in geospatial space can improve the allocation of resources within the city, reduce emergency response time, promote timely relief and community cohesion, and enhance urban resilience during disasters [6,7]. With the integration of the concept of resilient cities into China, there has been a growing perspective that resilience can be enhanced through the gradual transformation and adaptation of spatial configurations or functions to effectively mitigate disaster risks and associated uncertainties [8]. Based on this, we believe that the spatial distribution of disaster prevention shelters, if more reasonable, will also enhance the resilience of the city.
The term “resilience” finds its etymological roots in the Latin word “resilio”, signifying “to spring back” or “to return to its original state [9].” It has undergone varied applications and developments across different disciplines. In the field of industrial safety in the physical environment, Francesco Simone et al. [10] have devoted particular focus to safeguarding cyber-physical systems (CPSs). They have introduced a methodology known as system-theoretic process analysis for security (STPA-Sec) to assess and evaluate the security and resilience of such systems. Antonio De Nicola and others [11] concentrate on the disparity between process descriptions and real-world work practices. They introduce a novel resilience metric termed “allostatic load” to evaluate mismatches and organizational tensions in managing technological processes within networked societies. Mario Di Nardo and others [12] investigated the resilience of the railroad network, especially in case of failures on high-capacity railroad lines, by means of a system analysis approach and proposed a simulation-based model to quantify the system recovery, and finally compared the results with the acceptable thresholds. These studies exemplify their application and feasibility in actual industrial environments and in the management of urban infrastructures, thereby enhancing the safety and resilience of urban systems. Within the realm of disaster management, Mariya Dimitrova and others [13] introduce a novel, comprehensive disaster risk reduction (DRR) framework. They uncover trends and disparities in DRR interventions among various regions and income brackets, while also identifying potential issues in specific domains, through an analysis of data derived from the 2019 Cities100 report. This helps to provide ideas for reducing the impact of natural hazards on human society and the natural environment and for increasing the resilience of communities through integrated disaster risk management and reduction. In 2024, Na-Yoon Kim and others [14] conducted an assessment of disaster resilience in a Korean metropolitan area utilizing the DEA method. They analyzed pivotal factors influencing resilience, encompassing socioeconomic characteristics and infrastructure conditions. These findings are pivotal for comprehending urban resilience dynamics and formulating effective disaster management strategies. Several scholars have investigated the optimal spatial arrangement of disaster prevention and sheltering sites as well as delineating responsibility areas. Chen Xuanxian et al. [15] utilized the disaster risk assessment coefficient as a weight, constructing an optimization model for mountainous urban refuge sites. Xuanfeng Zhang et al. [16] first proposed a method to combine the supply of emergency shelters with the demand of the surrounding population and provided a quantitative research tool for the planning and selection of emergency shelters for residents. Zhou Aihua et al. [17] evaluated the reasonableness of emergency shelter layouts in Beijing’s central city using the community scale and the Gaussian two-step floating catchment area method. These studies have enriched the framework system for optimizing the siting of disaster prevention and evacuation sites, taking into account elements such as disaster risk assessment, site accessibility, and population needs, and have laid the foundation for further research. Li Gang et al. [18] proposed using the radius of coverage as the weight and employing the weighted Voronoi diagram method to technically partition areas of emergency congregate sheltering service spatially, serving as the foundation for evacuation site planning. Yunjia Ma et al. [19] developed a model for evaluating regional emergency congregate sheltering services with constraints on shelter capacity, evacuation-needed populations, and street integrity, and used a weighted Voronoi diagram algorithm to determine the range of optimal emergency shelters. The above studies are of great significance in promoting the building of resilient cities in China. Their research results help to identify and assess the disaster risks of cities according to local conditions and supplement the research methods of urban spatial analysis for future research. However, there are still some deficiencies in the current relevant research. First, in previous studies on urban resilience for disaster prevention, most of them chose large cities as case studies, and there are obvious deficiencies in the research and practical application of small towns. In the process of urbanization, county towns play a key role in bridging urban and rural areas [20]. However, China’s emphasis on speed over quality in the early stages of development has caused many small and medium-sized cities to suffer from imperfect standards for urban disaster prevention facilities, mismatches between safety needs and resources, and a lack of integrated planning. Secondly, in previous pre-disaster assessments, most of them only considered the impact of one disaster and lacked specificity for the study cities, which may have led to a lack of research on urban resilience and disaster prevention [21]. In light of current research, this paper focuses its attention on the urban area of Lindian County. With the ultimate goal of building a resilient city, it delves into the selection of urban disaster prevention shelters and the establishment of a disaster prevention life cycle. This exploration takes into account the supply–demand relationship between shelter facilities and population demand as well as government construction costs. The aim is to offer fresh perspectives and technical guidance for the construction and optimization of refuge sites and disaster prevention lifecycles in small-to-medium-sized cities. This, in turn, will facilitate the advancement of resilient city development, enhance community disaster preparedness and mitigation capabilities, and promote sustainable growth.
2. Materials and Methods
2.1. Study Area
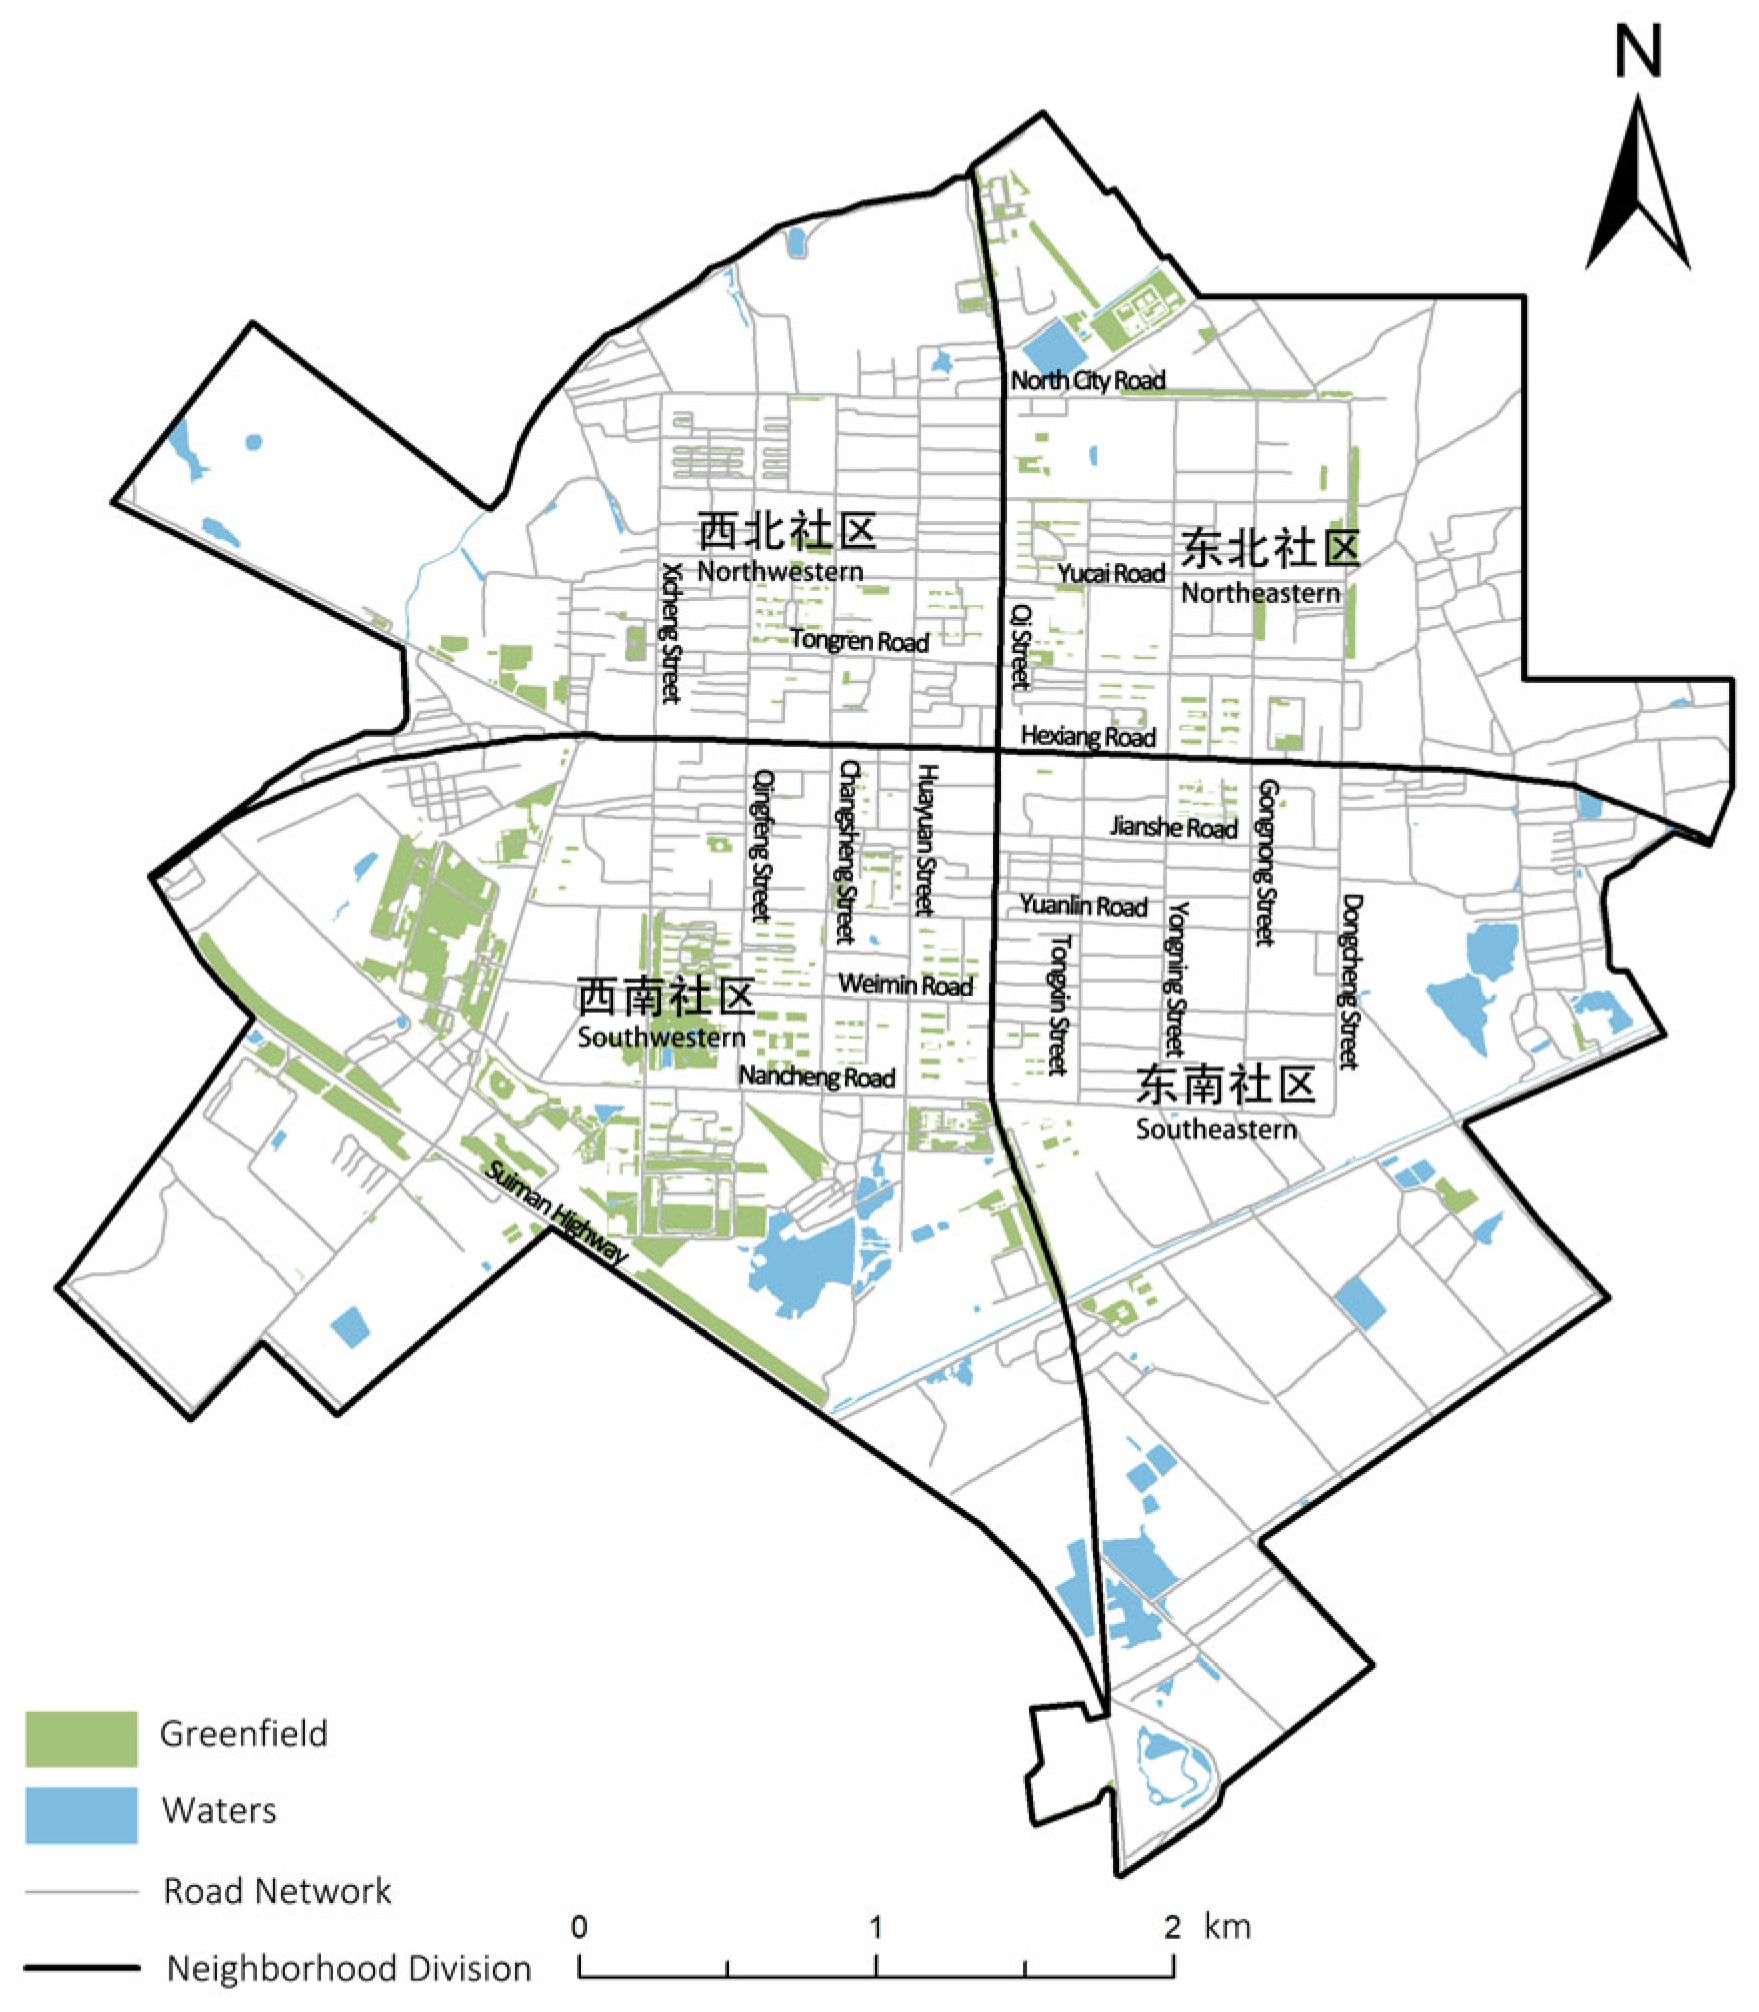
The urban area of Lindian County is situated in Daqing City, Heilongjiang Province, covering an expanse of 18.25 km2. It hosts a resident population of 59,000, yielding a population density of 3233 people/km2. This urban zone is bifurcated into two sectors, namely the new and old urban areas, encompassing four communities in the northwest, southwest, northeast, and southeast. Particularly noteworthy is the substantial squatter area within the southeast community, situated in the older part of the city. In this locale, most dwellings exhibit aged construction, characterized by simple structures, narrow thoroughfares, high population density, underdeveloped infrastructure, limited public green spaces, an overall substandard living environment, and pronounced security and fire hazards (Figure 1). By analyzing the contents of the planning documents published on the official website of the Lindian County Government, it is known that Lindian County is situated in the Fuyu-Mingshui rupture zone, which experienced a 5.1 magnitude earthquake on 25 July 2005. The region experiences a temperate continental climate, with an average annual rainfall of 420 mm. Rainfall distribution is spatial and temporal, exhibiting geographical variations and concentrating predominantly in the flood season from June to September, constituting 70% of the annual rainfall. This climatic pattern makes the area susceptible to disasters such as “spring drought, summer floods, early fall frost”. The city faces additional challenges due to the inadequate drainage capacity of the rainwater pipe network, making it highly prone to urban flooding disasters. Lindian County, located in northeastern China, faces challenges common to cities undergoing construction and development phases. These challenges include urban population outflow, aging demographics, inadequate infrastructure, insufficient urban greenery, underdeveloped transportation networks, relative lag in information infrastructure development and information technology application, as well as difficulties in policy implementation and resource allocation. These factors contribute to uncertainties in the event of a disaster. The choice of Lindian County as the focus of this study is driven by its universality and representativeness, reflecting issues encountered by similar cities.
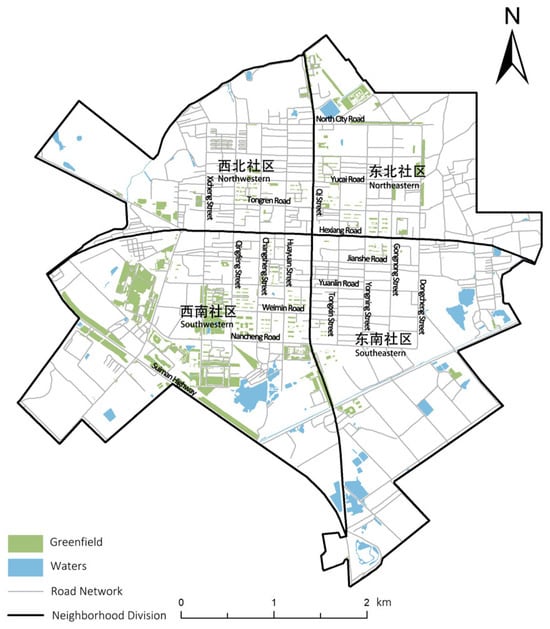
Figure 1.
Study area.
2.2. Data Sources and Processing
Lindian County is susceptible to two primary hazards: earthquakes and urban flooding. Drawing from insights garnered from previous research [22,23], this study utilizes building height data and DEM (digital elevation model) data for pre-disaster assessment. Overlay analysis is conducted with road network data to evaluate the impact of disasters on roads. Additionally, after reviewing numerous studies on the two-step floating catchment area method [24,25], this paper opts to employ land area and population raster data as indicators of supply and demand.
2.2.1. Road Network Vector Data and Points of Interest Data
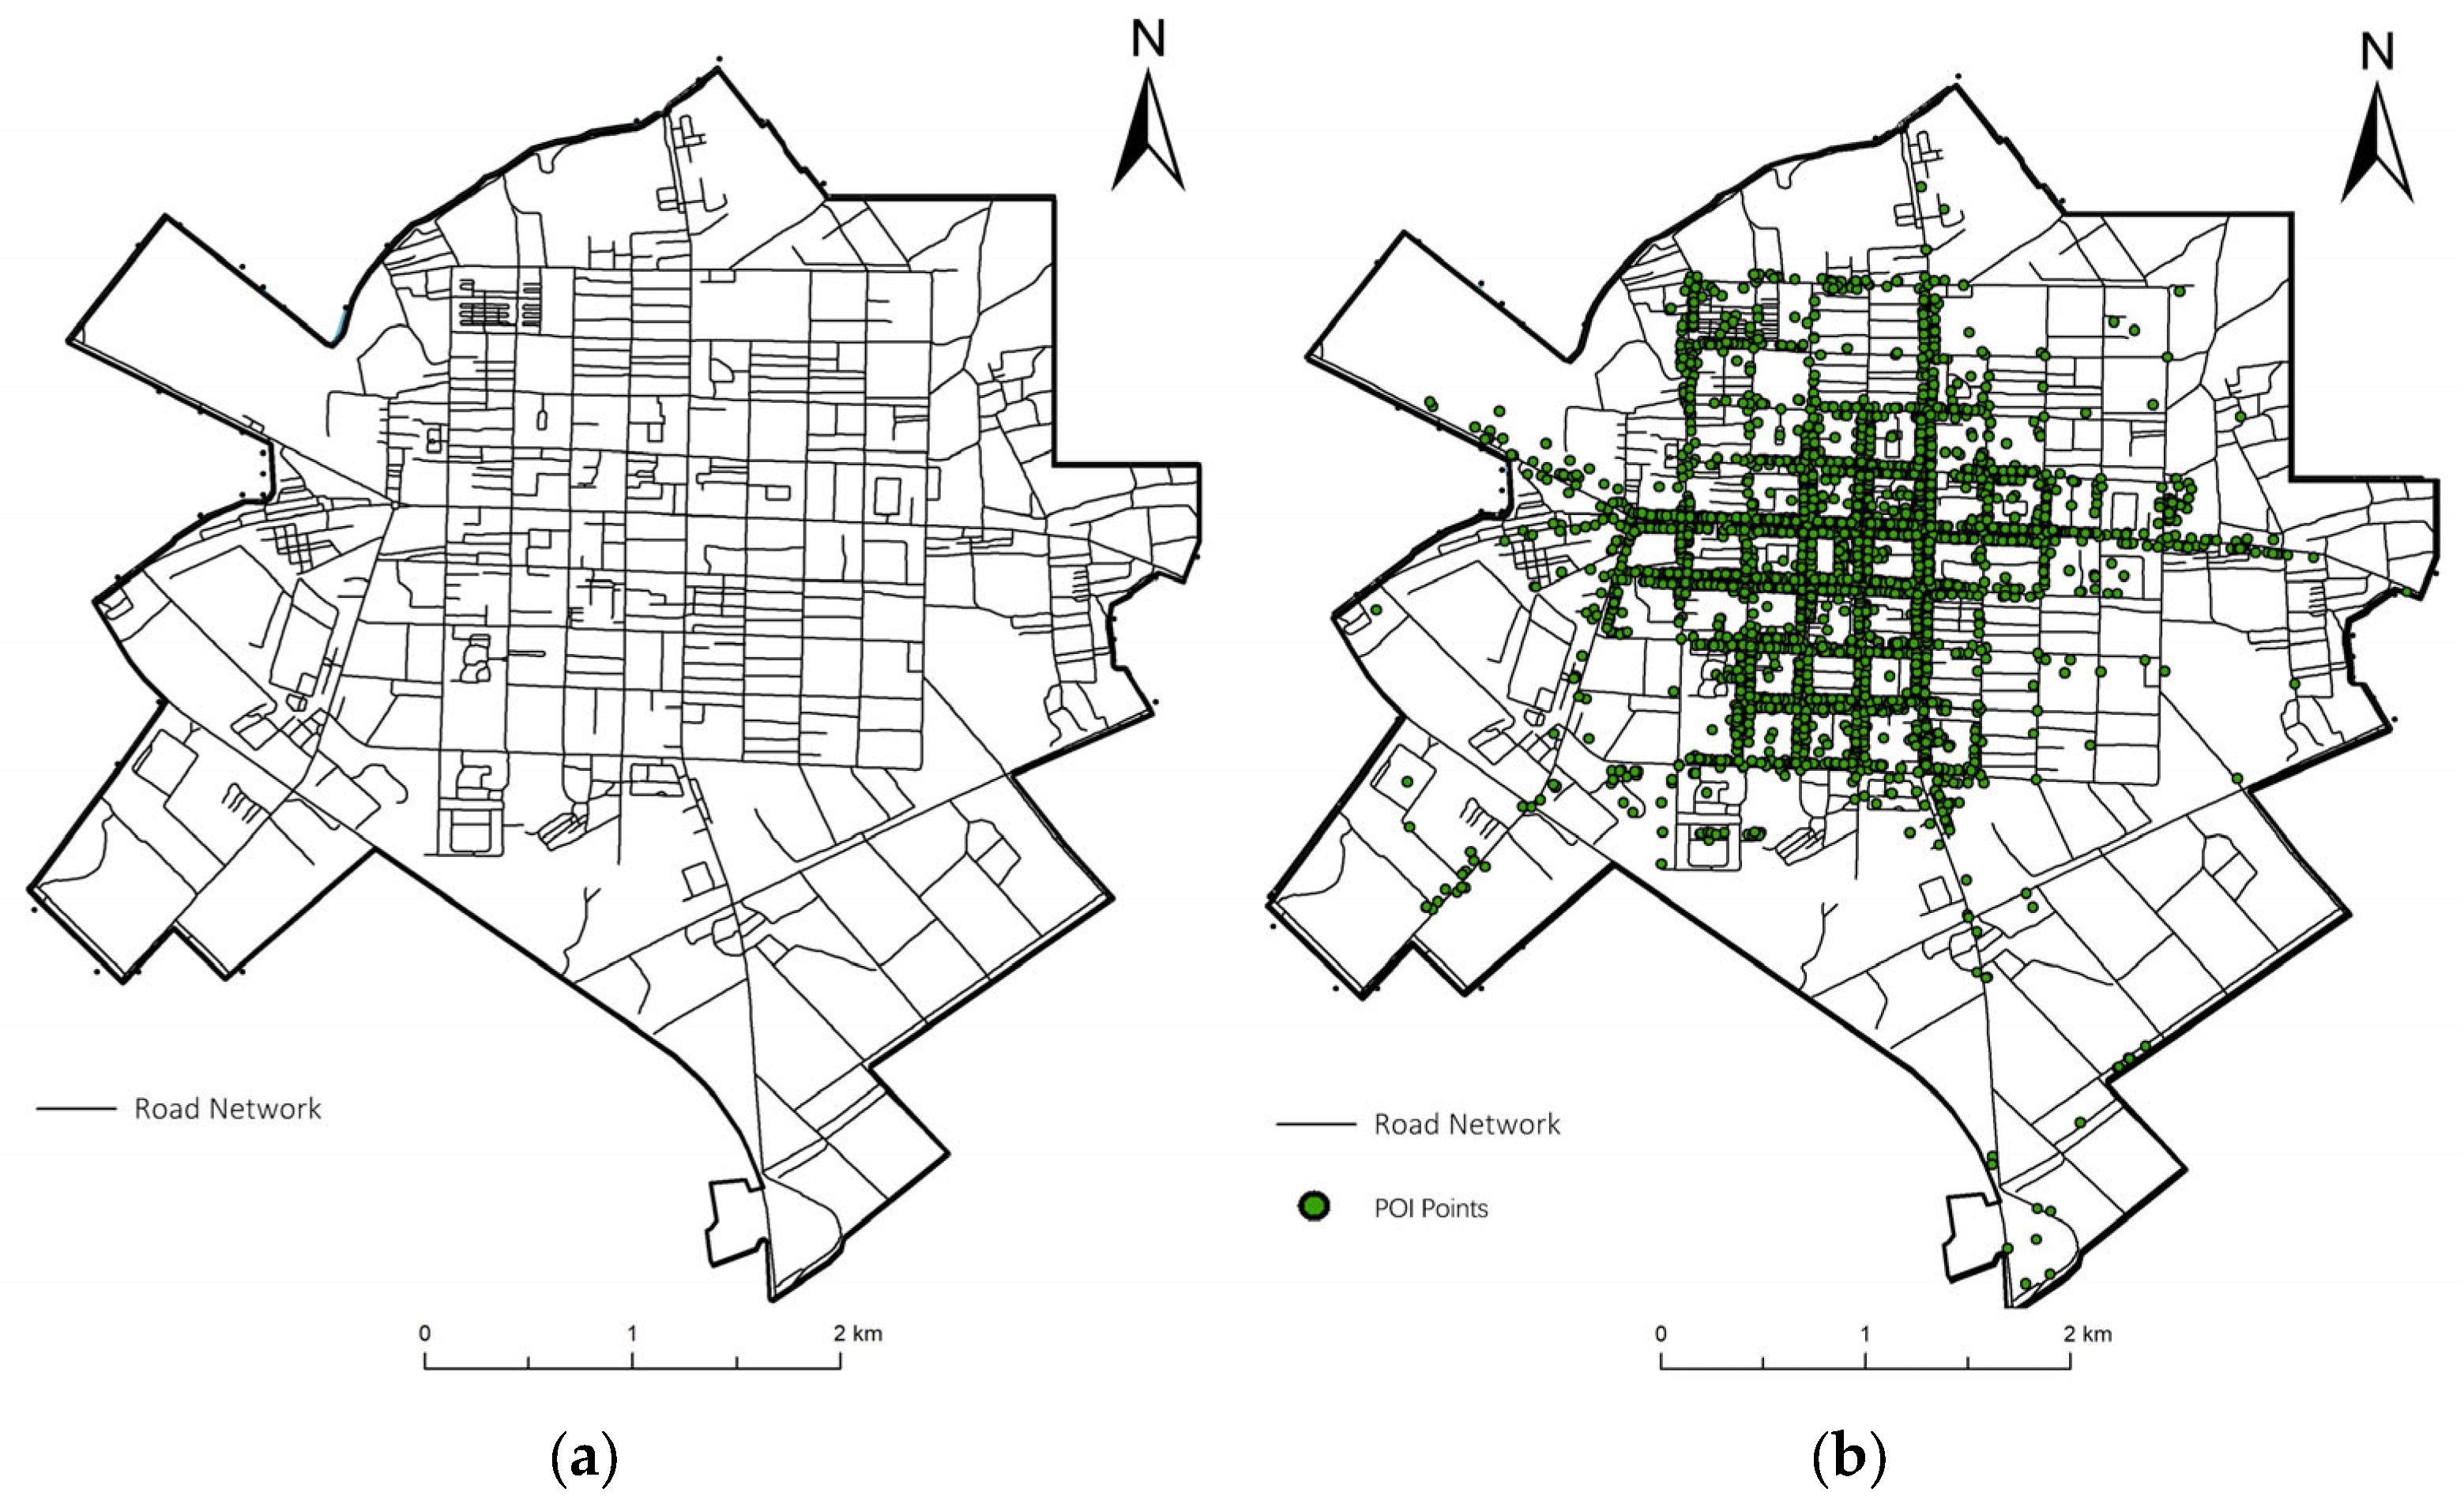
The establishment of the road network holds paramount importance in this study. It furnishes a structured framework for the search process, enhancing the efficacy of the search algorithm in traversing the search space. Roadway network data, sourced from OpenStreetMap (OSM), underwent importation into GIS for topology validation and processing, facilitating the construction of network analysis models (Figure 2). In the context of evacuation site selection and accessibility analysis, we can assess the impact of disaster risk on the road network and compute the time cost associated with road access during disasters. This enables a more precise simulation of real-world movement and path selection.
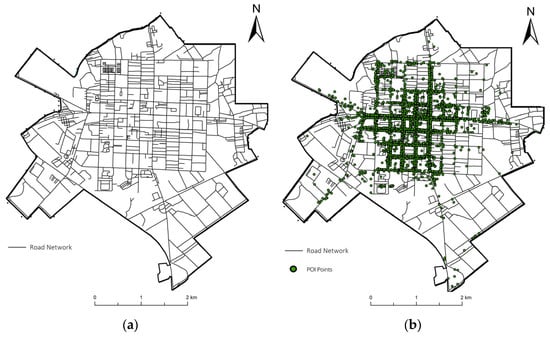
Figure 2.
Road network (a); distribution of point-of-interest data (b).
Point of interest (POI) data typically denotes data points representing specific locations or places within a GIS. In this study, POI data were acquired by interfacing with a map website, resulting in a total of 4650 POI data points of diverse types (Figure 2). Subsequently, within the urban area, eligible POI data underwent screening to identify candidate shelter sites, aligning with the criteria outlined in the Spatial Planning Guidance: Community Life Unit.
2.2.2. Population Raster Data
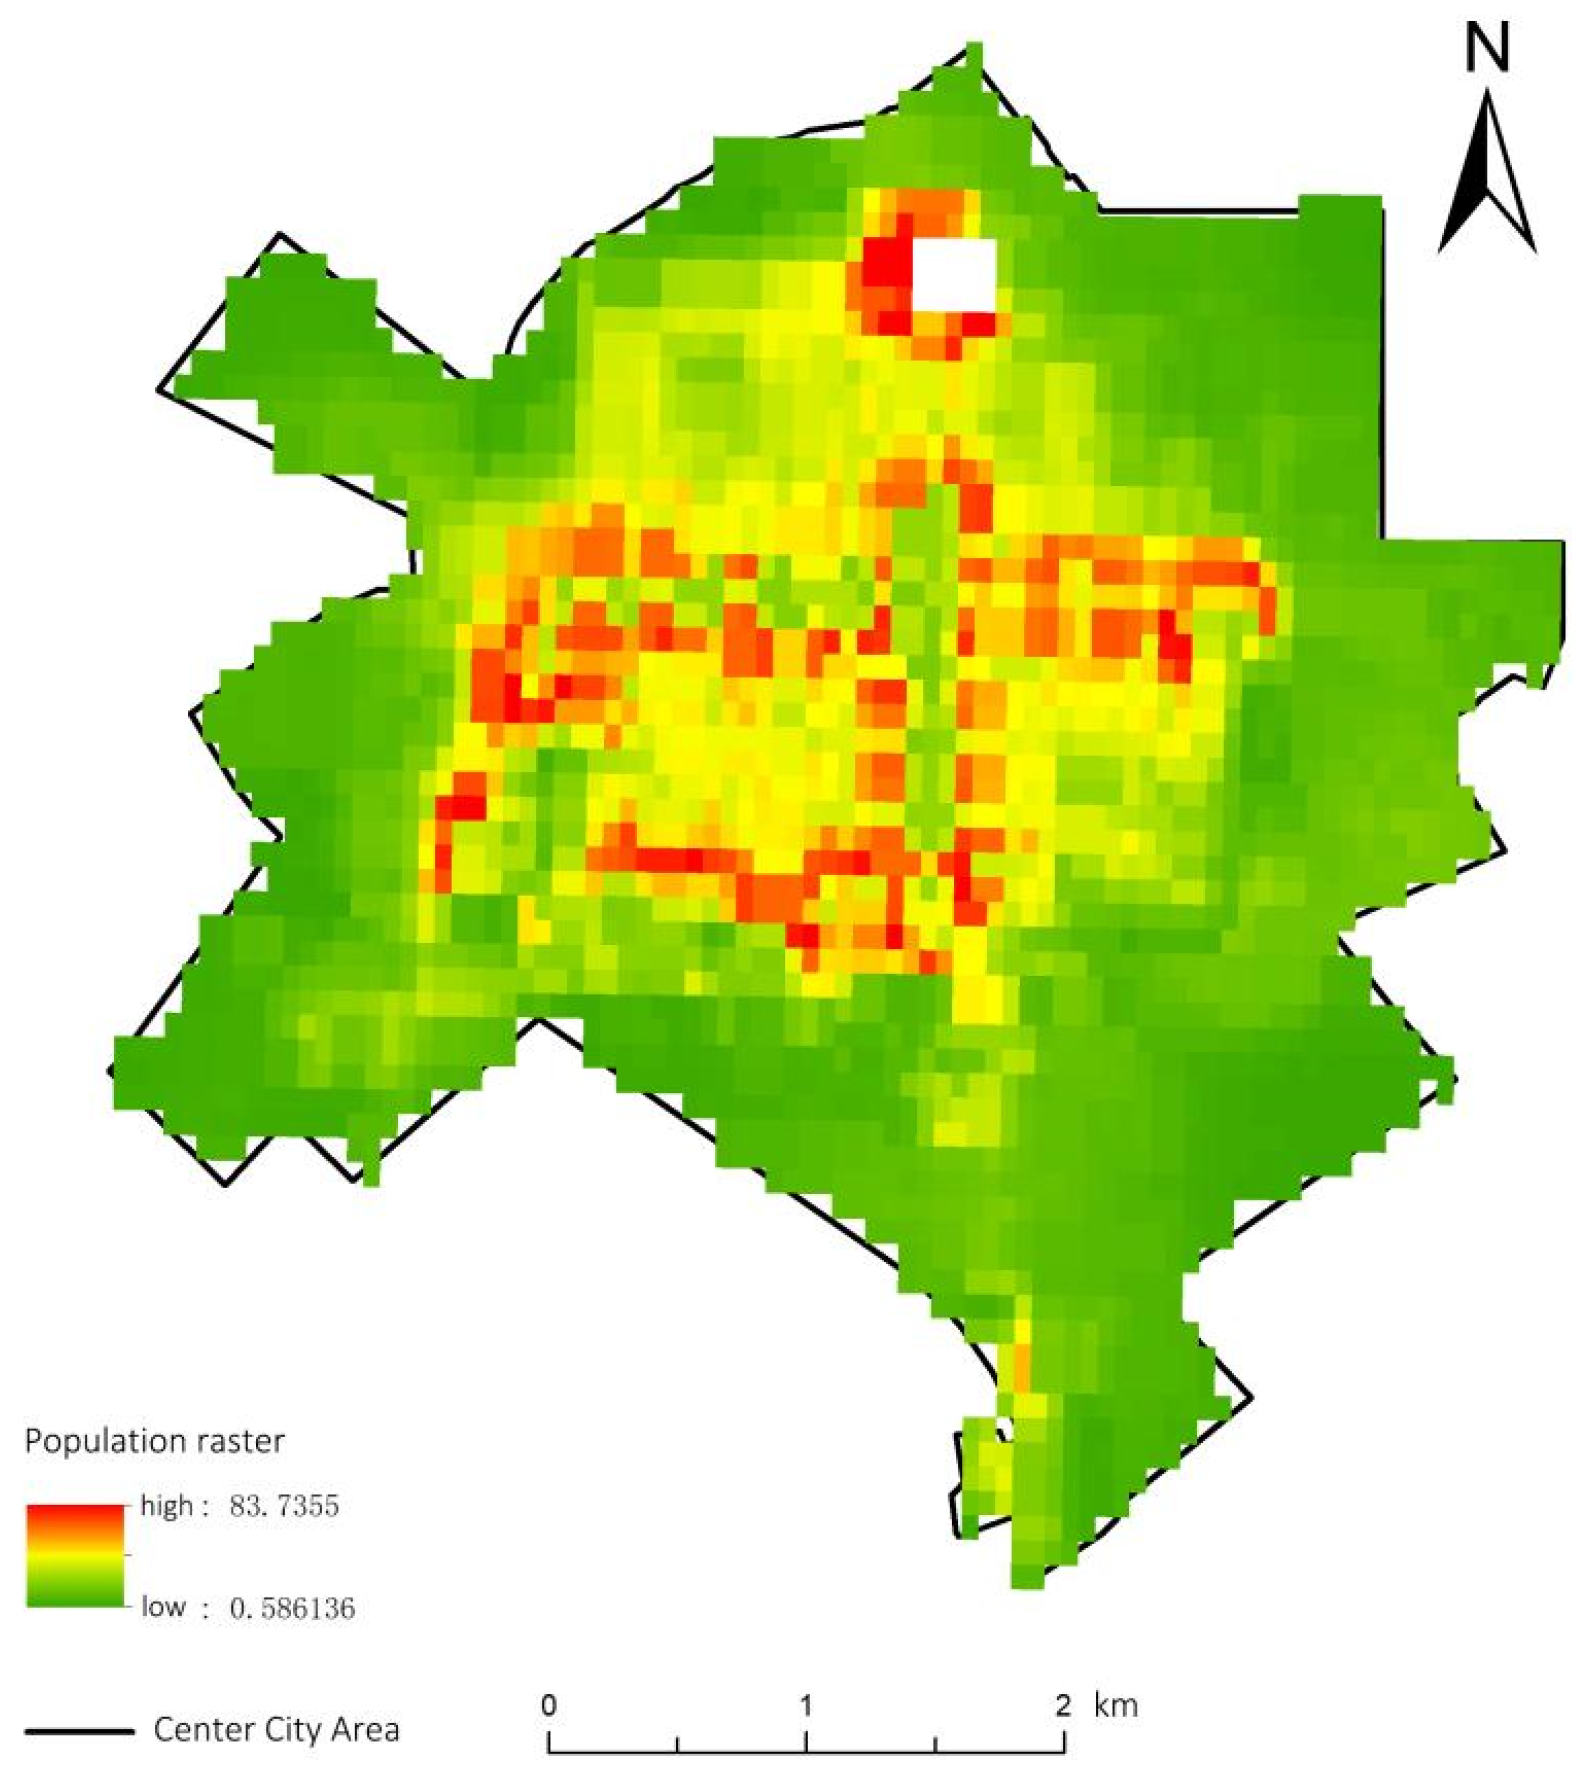
When incorporating demographic data into spatial analysis or interdisciplinary research, geoscientific investigations often encounter the challenge of the “variable meta-question”, hindering convenient visualization and spatial analysis [26,27]. Therefore, this paper opts for the 2020 population raster data with 100 m accuracy from the official WorldPop website as the primary basis for analysis. Bai et al. [28] evaluated and compared estimation accuracies using Cnpop, GPW, GRUMP, and WorldPop with boundary and census data at the city level. The study results indicate that WorldPop demonstrates the highest estimation accuracy. In this study, the population raster data from WorldPop underwent correction based on the seventh national census data for urban areas in Lindian County (Figure 3), aiming to align it more closely with the actual population distribution in urban areas (Table 1). After the population data were corrected, a 100 × 100 grid was created with the same resolution as the WorldPop population raster data, and the population data were extracted into the surface and point elements of the grid to be used as demand data for this study.

Figure 3.
Population raster map of the urban area based on the corrected 7C population data.

Table 1.
Population data for each community based on corrected 7C population data.
2.2.3. Area of Interest Data and Site Area Data
Area of interest data (AOI), usually refers to data used in geographic information systems (GIS) to represent a specific area or location. Through GIS technology, AOI data can be visualized in the form of maps, making the analysis and decision-making process more efficient and precise. Tianditu is a comprehensive geographic information service website built by the National Bureau of Surveying, Mapping, and Geographic Information. Users can view information on geographic locations, water systems, natural resources, population, etc. as well as maps and images of provinces, cities, and counties. The 2020 version of Tianditu is the latest version of the platform. In this paper, AOI data of building contours, water systems, and green spaces are obtained by crawling the Tianditu website.
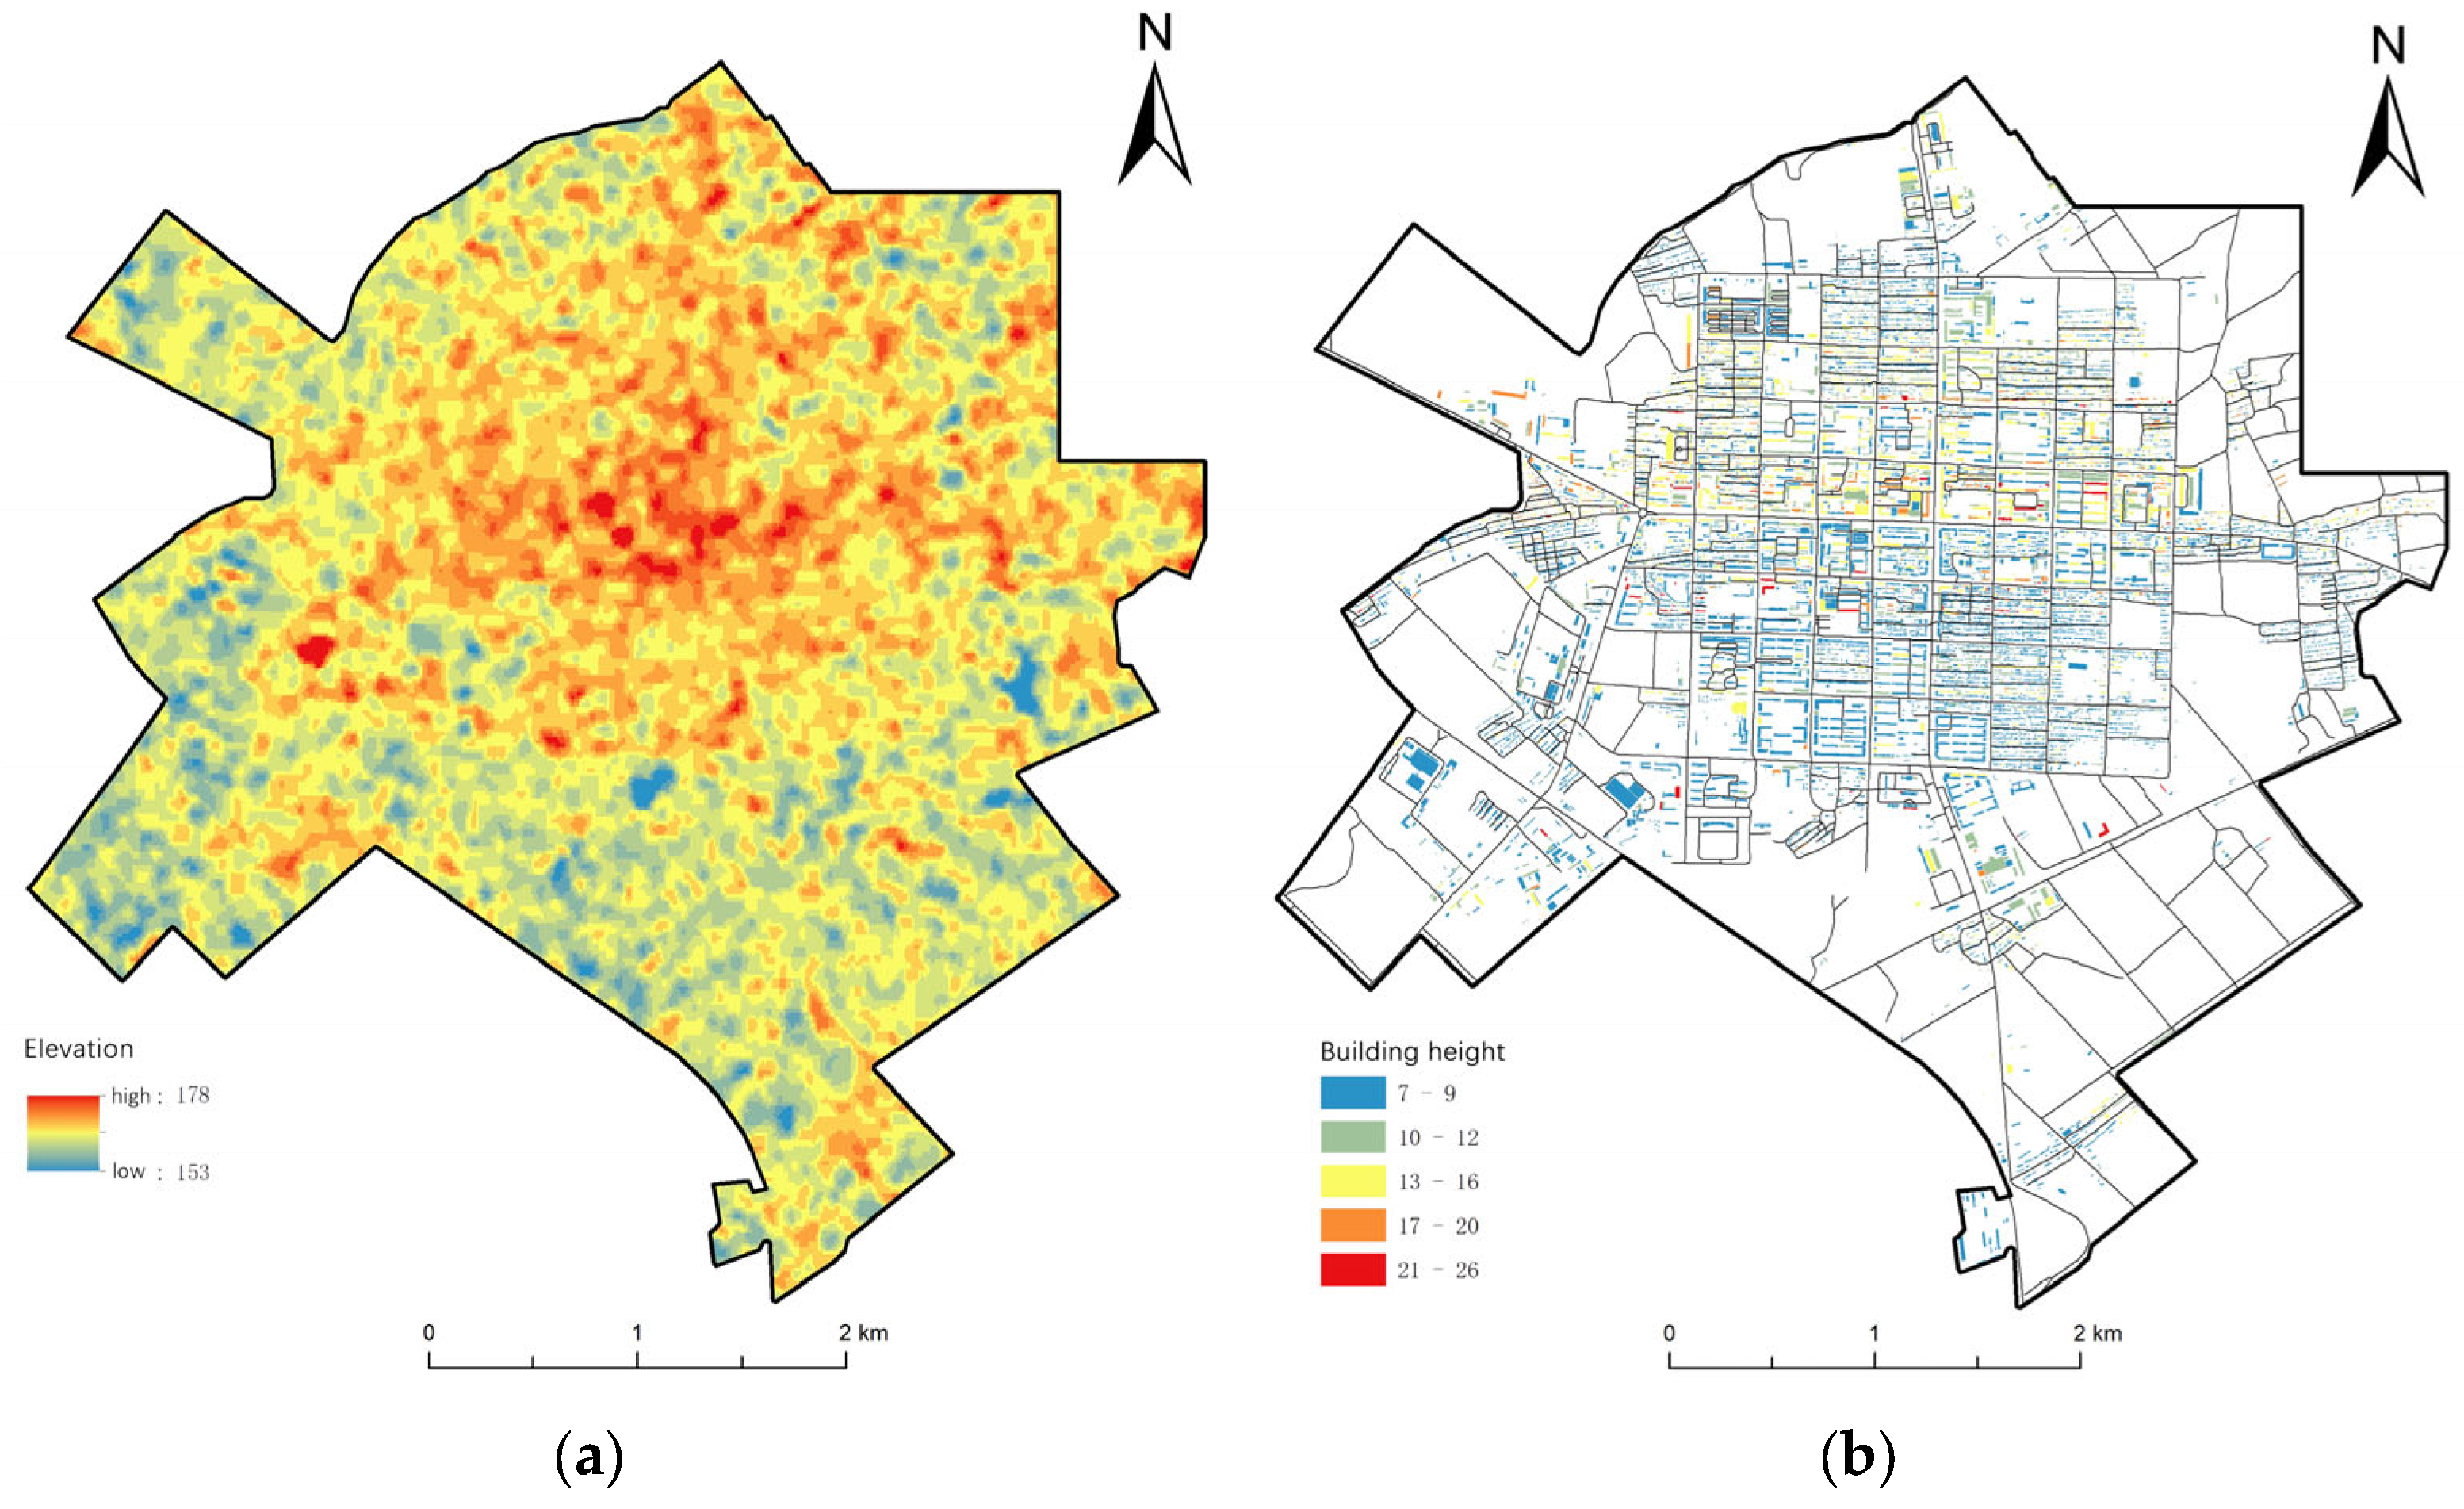
2.2.4. Digital Elevation Model Data and Building Height Data
The digital elevation model (DEM) is widely used in flood analysis. By combining DEM with hydrological modeling, flood propagation and inundation extent under different rainfall events can be simulated. Additionally, DEMs can help identify potential flood risk areas—through analyzing DEM data, it is possible to identify low-lying areas and areas near rivers that are more prone to flooding under extreme weather events. With accurate topographic data (Figure 4), decision-makers and planners can better understand and predict flooding behavior, leading to more scientifically sound countermeasures.
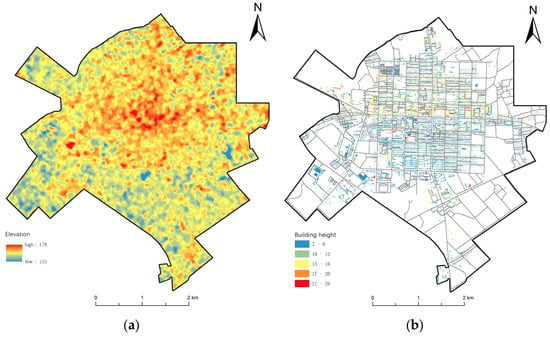
Figure 4.
Elevation (a); building height (b).
The building height data was released by China’s original 10-m resolution building heights, constructed using multi-source Earth observation data and machine learning techniques, by the team led by Wanben Wu from the School of Life Sciences at Fudan University. This dataset is adaptable to China’s complex urban structure at the national scale and has a strong correlation with actual building observations [29]. The data year of this dataset is 2020, and the data coordinates are in the projected coordinate system of WGS_1984_UTM. However, before applying this data, the practical problem of a large number of squatter settlements in the southeastern neighborhoods of the urban area was taken into account. Since shantytowns often consist of rudimentary temporary structures, such as shacks and improvised houses, their actual scale is less than the 10 m resolution. Therefore, in order to meet the needs of the analysis, the dataset was resampled at 1 m resolution. Finally, the height data are spatially connected to the building vector surfaces to obtain a map showing the distribution of buildings with height data in the urban area (Figure 4).
2.3. Research Methods
2.3.1. ArcGIS Network Analysis and Location Assignment
ArcGIS network analysis uses datasets or services to address various network problems, including finding the shortest paths, nearest facility points, and service areas. Within this framework, GIS location assignment tackles the challenge of selecting a specific number of facility points from a set of potential locations. The primary aim is to ascertain M candidate facility points and N demand points under given weights, along with identifying a subset of candidate facility points denoted as P. Subsequently, the objective is to determine the shortest distance from each demand point to the candidate facility points, minimizing the sum of weighted distances from each of the N points to their nearest M point [30].
Effectively guiding residents of areas needing shelter during a disaster is crucial for delineating areas of emergency congregate sheltering service for emergency shelters. Consequently, this paper employs the minimization of the facility point model, incorporating capacity constraints within GIS location allocation. This approach seeks to determine the optimal location and quantity of emergency shelters within the study area, offering a reference framework for delineating areas of emergency congregate sheltering service.
2.3.2. Reachability Evaluation of Gaussian Two-Step Floating Catchment Area Method Based on Time Cost
This paper employs the accessibility calculation method for emergency shelters, drawing inspiration from the work of Tong De and others [31]. Building upon the conventional Gaussian two-step floating catchment area method for the accessibility calculation model based on distance cost, we substitute time cost for distance cost. The time cost is represented by the travel time between demand and supply points, providing a more comprehensive reflection of road accessibility during a disaster, accounting for factors such as accessibility, traffic congestion, and other real-world considerations.
Initially, resident emergency congregate shelters and emergency evacuation and embarkation shelter centers of mass are extracted and designated as supply points (j) for emergency shelters. The restricted passage time (t0) for people reaching the shelters is adopted as the radius of the search domain (j). The population within the search domain (j) is aggregated, and weights are assigned using a Gaussian function, adhering to the law of distance attenuation. The summation of these weights results in the computation of Rj, reflecting the supply and demand ratio. The formula is as follows:
Let Dk represent the population of each demand unit k, and tkj denote the transportation time required between location k and location j. In emergency shelters with multiple entrances, selecting the demand unit to the nearest entrance is contingent on the transportation time, where demand unit k must fall within the search domain (tkj < t0). Furthermore, Sj is the land area of the emergency shelters. The Gaussian decay function G(tij) addresses spatial friction concerns. Its specific form is expressed as follows:
Subsequently, each population location i is designated as a demand point. A road network, with a time t0 as a radius, is established to define the search domain I for the route to the emergency shelter. Emergency shelter j is identified within this search domain, and the Gaussian decay function is applied to the emergency shelter’s supply and demand ratio Rj. The resulting summation assesses the spatial accessibility of the emergency shelter for the population at network point i, based on the time cost. A higher value signifies a greater degree of accessibility.
2.3.3. Weighted Voronoi Diagram
The weighted Voronoi polygon is a point-based zoning method that not only considers the relative positions between points but also adjusts the shape and size of the zoning area based on the weights assigned to the points. The fundamental principle of this method involves utilizing the inverse distance weighting method to generate a raster. This involves calculating the distance from each point to neighboring regions through the inverse of map algebra. Subsequently, each region’s area or radiation range is allocated based on its cost or influence [32]. Presently, the weighted Voronoi diagram has demonstrated significant theoretical and practical advancements. Particularly in handling spatial data, it has evolved into an effective tool for exploring discrete regional data, addressing various issues such as service scope delineation and layout analysis [33]. This paper aims to unveil the importance and influence of different regions by constructing weighted Voronoi polygons. This, in turn, seeks to establish a foundation for delineating the service scope of emergency shelters.
3. Results
3.1. Road Traffic Network Model in Times of Disaster
3.1.1. Assessing the Risk of Urban Building Collapse
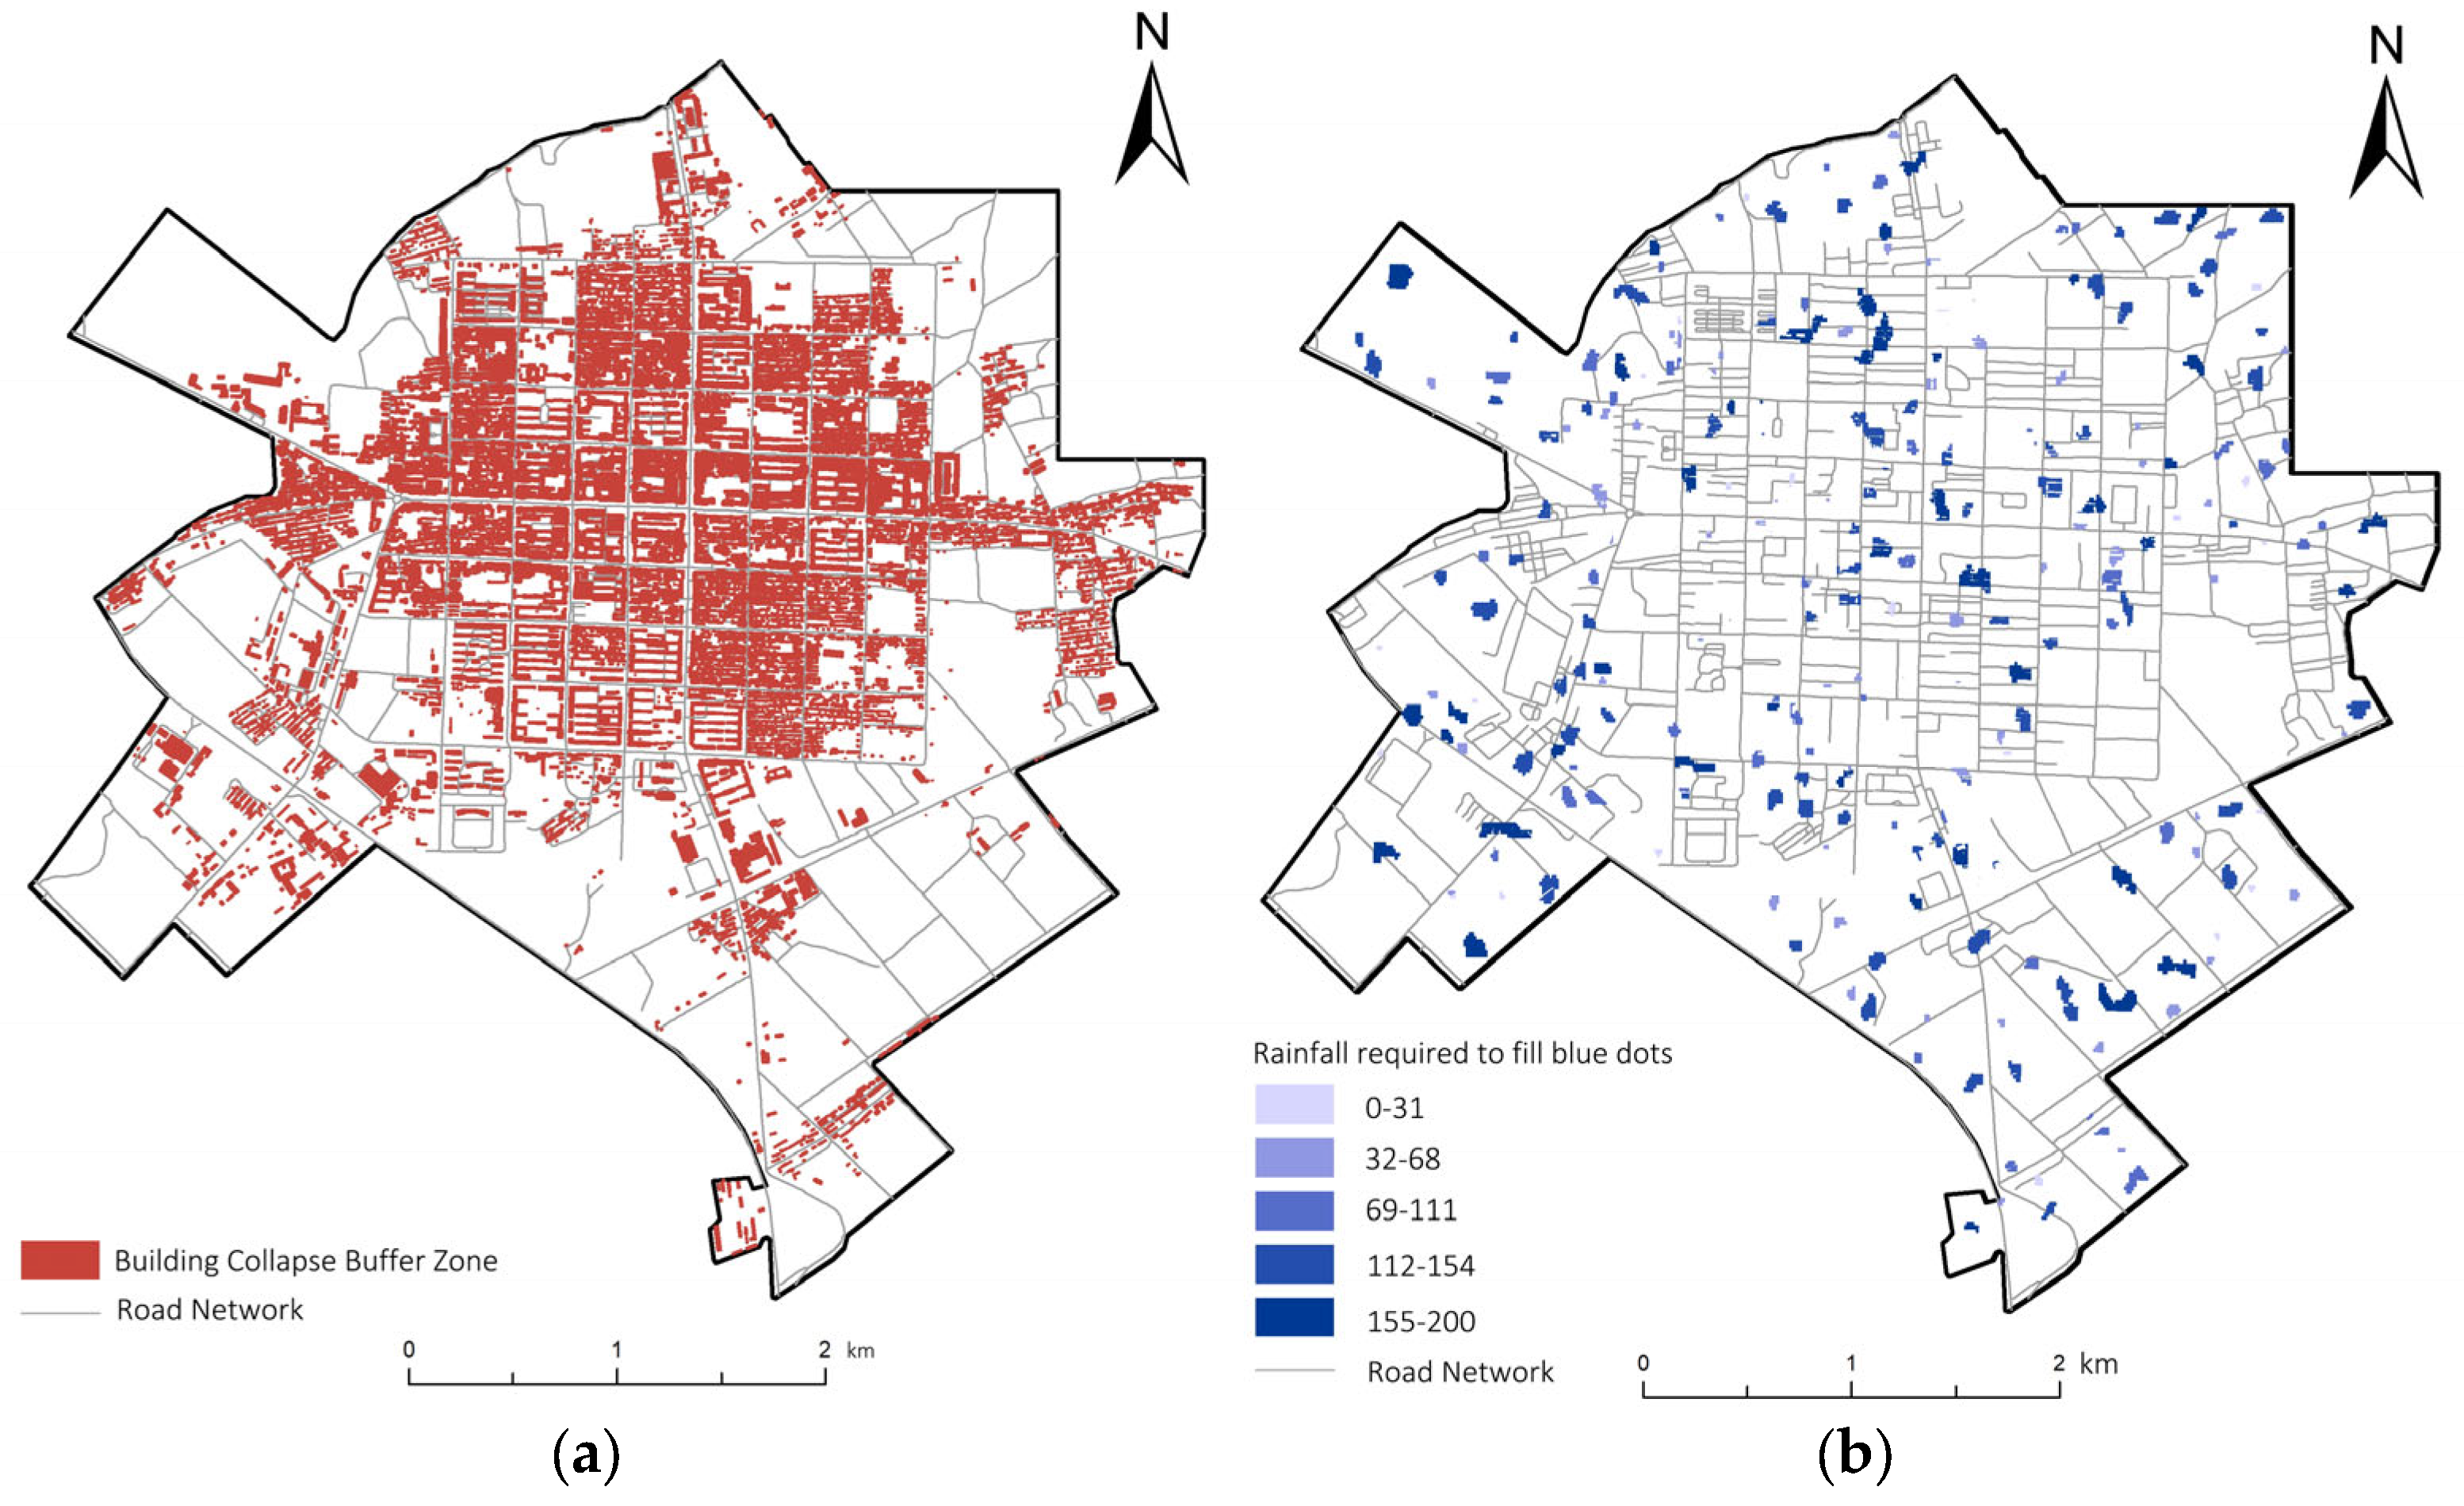
Evaluating building collapse risk in urban areas is paramount in urban planning and safety management. This intricate process necessitates meticulous analysis and processing of building height data. In order to enhance the accuracy of our assessment of the risk of building collapse, we refer to a technique commonly used in the demolition of buildings in China—the directional tipping method. This method is designed to bring down a building in a safe and orderly manner. In this method, a collapse site larger than 2/3 to 3/4 of the building height is usually reserved. Therefore, in this study, 2/3 of the building height was selected as the collapse area for the buffer zone analysis. This analytical approach delineates the potential impact of building collapses in urban areas, thereby furnishing critical decision support for urban planners and emergency responders (Figure 5).
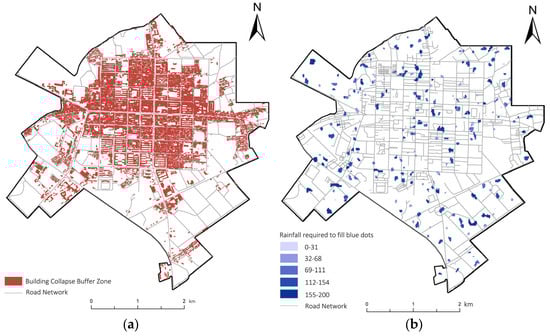
Figure 5.
Extent of the impact of building collapse in urban areas (a); regional distribution of flood risk in urban areas (b).
3.1.2. Assessment of Flooding Hazards in Urban Areas
It is imperative to pinpoint urban areas susceptible to storm flooding. This study employs precise 12.5-m elevation data and ArcGIS 10.7 software to identify regions prone to flooding during heavy rainfall. Typically, these vulnerable areas encompass depressions or catchments susceptible to inundation, posing threats to nearby structures. Before analysis, the projected coordinate system and raster resolution of diverse data sets need harmonization. Given the 12.5-m resolution of DEM data and the lower resolution of many building data boundaries, a uniform and smaller 1-m raster resolution is selected for resampling the DEM data.
The analysis unfolds as follows: The “Fill” tool eradicates depressions below the vertical resolution of the DEM, generating a SmallSinksFilled layer. Subsequently, the “Fill Depression” tool yields an AlISinksFilled layer without setting a Z limit. Subtracting SmallSinksFilled from AlISinksFilled produces the blue point depth layer, BSDepths. Using the Conditional Function, raster values in BSDepths greater than 0 are set to 1, and those equal to 0 to NoData, yielding the preliminary blue point depth layer, PreBS. This layer delineates areas likely to flood during heavy rainfall. However, blue point depth alone does not fully reflect flood risk. Areas with deeper blue dots, indicating more significant rainfall accumulation, are less susceptible to flooding than those with shallower dots. Calculating the rainfall needed to fill each blue dot during a rainstorm enhances flood risk assessment.
Each catchment or local watershed in the landscape has an associated catchment area. The rainfall volume required to fill a blue point is derived by calculating the volume of the blue point and its catchment area. Converting buildings to the building raster, BldgRaster, and obtaining the “Blue Points without Buildings” layer creates BSRegions through merging and unique numbering. Calculating the depths of unfilled and filled depressions facilitates determining blue spot capacity. After these analyses, the BSRegions are converted to the surface element, BSPoly, fused to the blue spot, and the blue spot polygon with ID is selected based on the “Connection” field, yielding a blue spot with capacity and rainfall. The China Meteorological Administration (CMA) defines “heavy rainfall” as precipitation totaling 100–249.9 mm within a 24-h period, based on precipitation intensity [34]. Therefore, this study extracted the portion of rainfall less than 200 mm needed to address the blue dots from the flood hazard assessment results, identifying areas with significant impacts from urban flooding. The resulting map visually represents flood vulnerability, with lighter blue areas indicating higher susceptibility (Figure 5). The results yielded a total of 273 flood-affected areas within the city. These areas compared to other blue dots form waterlogging more quickly and need to be focused on.
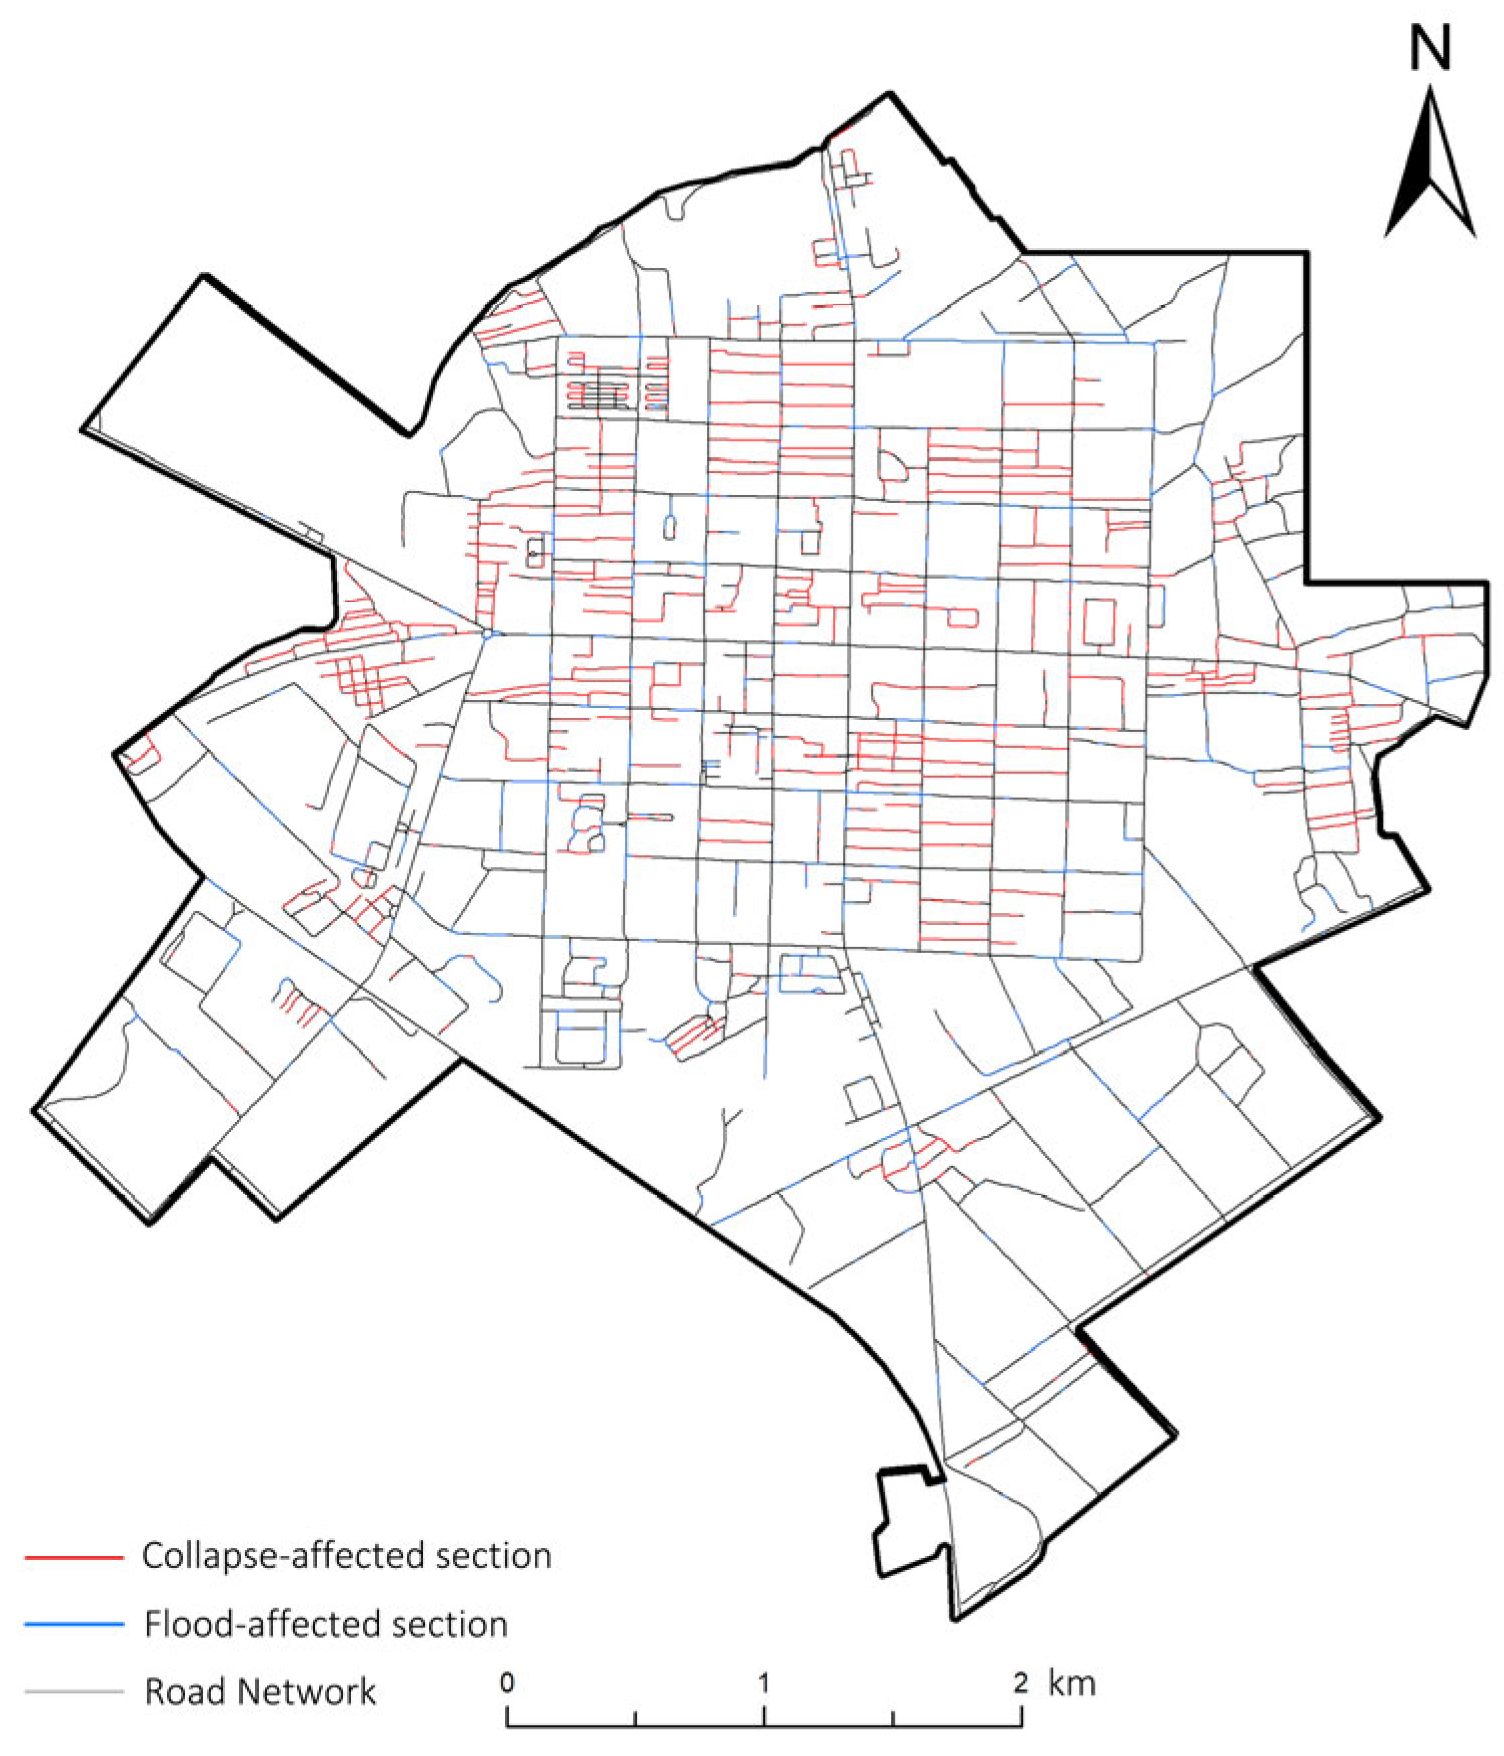
3.1.3. Constructing a Road Network Model with Time Cost for Disaster Time
Primarily, this study established the existing road network in the urban area of Lindian County using the curated OpenStreet road data in ArcGIS software. Considering the potential impact of urban building collapse, flooded areas, and the actual road width, two adjustment methods—buffer zone analysis and superposition analysis—were employed to refine the existing road network [35]. Acknowledging the risk of transportation paralysis in the event of a large-scale evacuation [36], walking was designated as the primary mode of evacuation and escape. Adult walking speed, generally ranging from 4 to 4.5 km/h [35], was considered. Recognizing the reduced mobility of older people and children and the heightened complexity of roads during disasters, the walking speed for seeking refuge was constrained to 2 km/h. Additionally, given the potential complications in road conditions during disasters, the speed of people seeking shelter in areas affected by collapse and flooding was limited to 1 km/h. These considerations determined residents’ walking times on each road section, incorporating time costs, and a disaster relief road network model was formulated (Figure 6). The analysis of the results showed that the total length of the road network in the urban area of Lindian County was 182,094 m, of which the total length of the road section affected by building collapse was 46,982 m, accounting for 25.80% of the total length of the road network, and the total length of the road section affected by waterlogging was 23,900 m, accounting for 13.13% of the total length of the road network. This means that 38.93% of the road sections in the urban area are potentially affected by area-specific disaster risks.
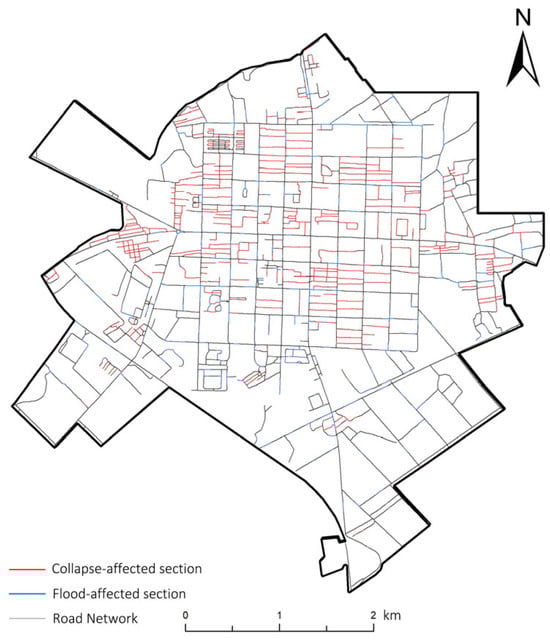
Figure 6.
Disaster-time road network modeling in urban areas including time cost.
This modeling framework is a crucial reference for rescue teams, ensuring swift and effective responses to disasters and facilitating rapid rescue efforts.
3.2. Optimizing the Location of Emergency Shelters
3.2.1. Selection of Potential Emergency Shelters
Following the regulations stipulated in the Standard for Comprehensive Urban Disaster Prevention Planning (Table 2), and considering the urban land scale and resident population size, the objective is to establish a comprehensive system of disaster prevention and evacuation sites in the metropolitan area of Lindian County. This system encompasses two hierarchical levels: resident emergency congregate shelters and emergency evacuation and embarkation shelters. It addresses both short-term and medium-term needs, ensuring residents have appropriate evacuation options in the face of diverse natural disasters. Land resources allocated for resident emergency congregate shelters primarily include primary and secondary schools, squares, stadiums, and other open spaces. Meanwhile, land resources designated for emergency evacuation and embarkation shelters comprise community gardens, centralized green areas in neighborhoods, parking lots, and similar regions. The selection of disaster prevention and evacuation sites considers factors like structural safety, capacity, accessibility, community functions, and infrastructure support. Primary and secondary schools, plazas, and stadiums are chosen as medium-term urban evacuation sites due to their structural safety, regular maintenance, and spacious layouts. These sites offer open spaces for evacuation and sheltering, equipped with necessary infrastructure like water supply and electricity for evacuees. Additionally, they are resilient to flooding due to efficient drainage systems. Furthermore, these locations are dispersed throughout the city, ensuring convenient access for urban residents during evacuations. Their selection fosters mutual assistance among community residents, enhancing disaster response efficiency and cohesion.
Table 2.
Classification and control requirements for emergency shelters at all levels.
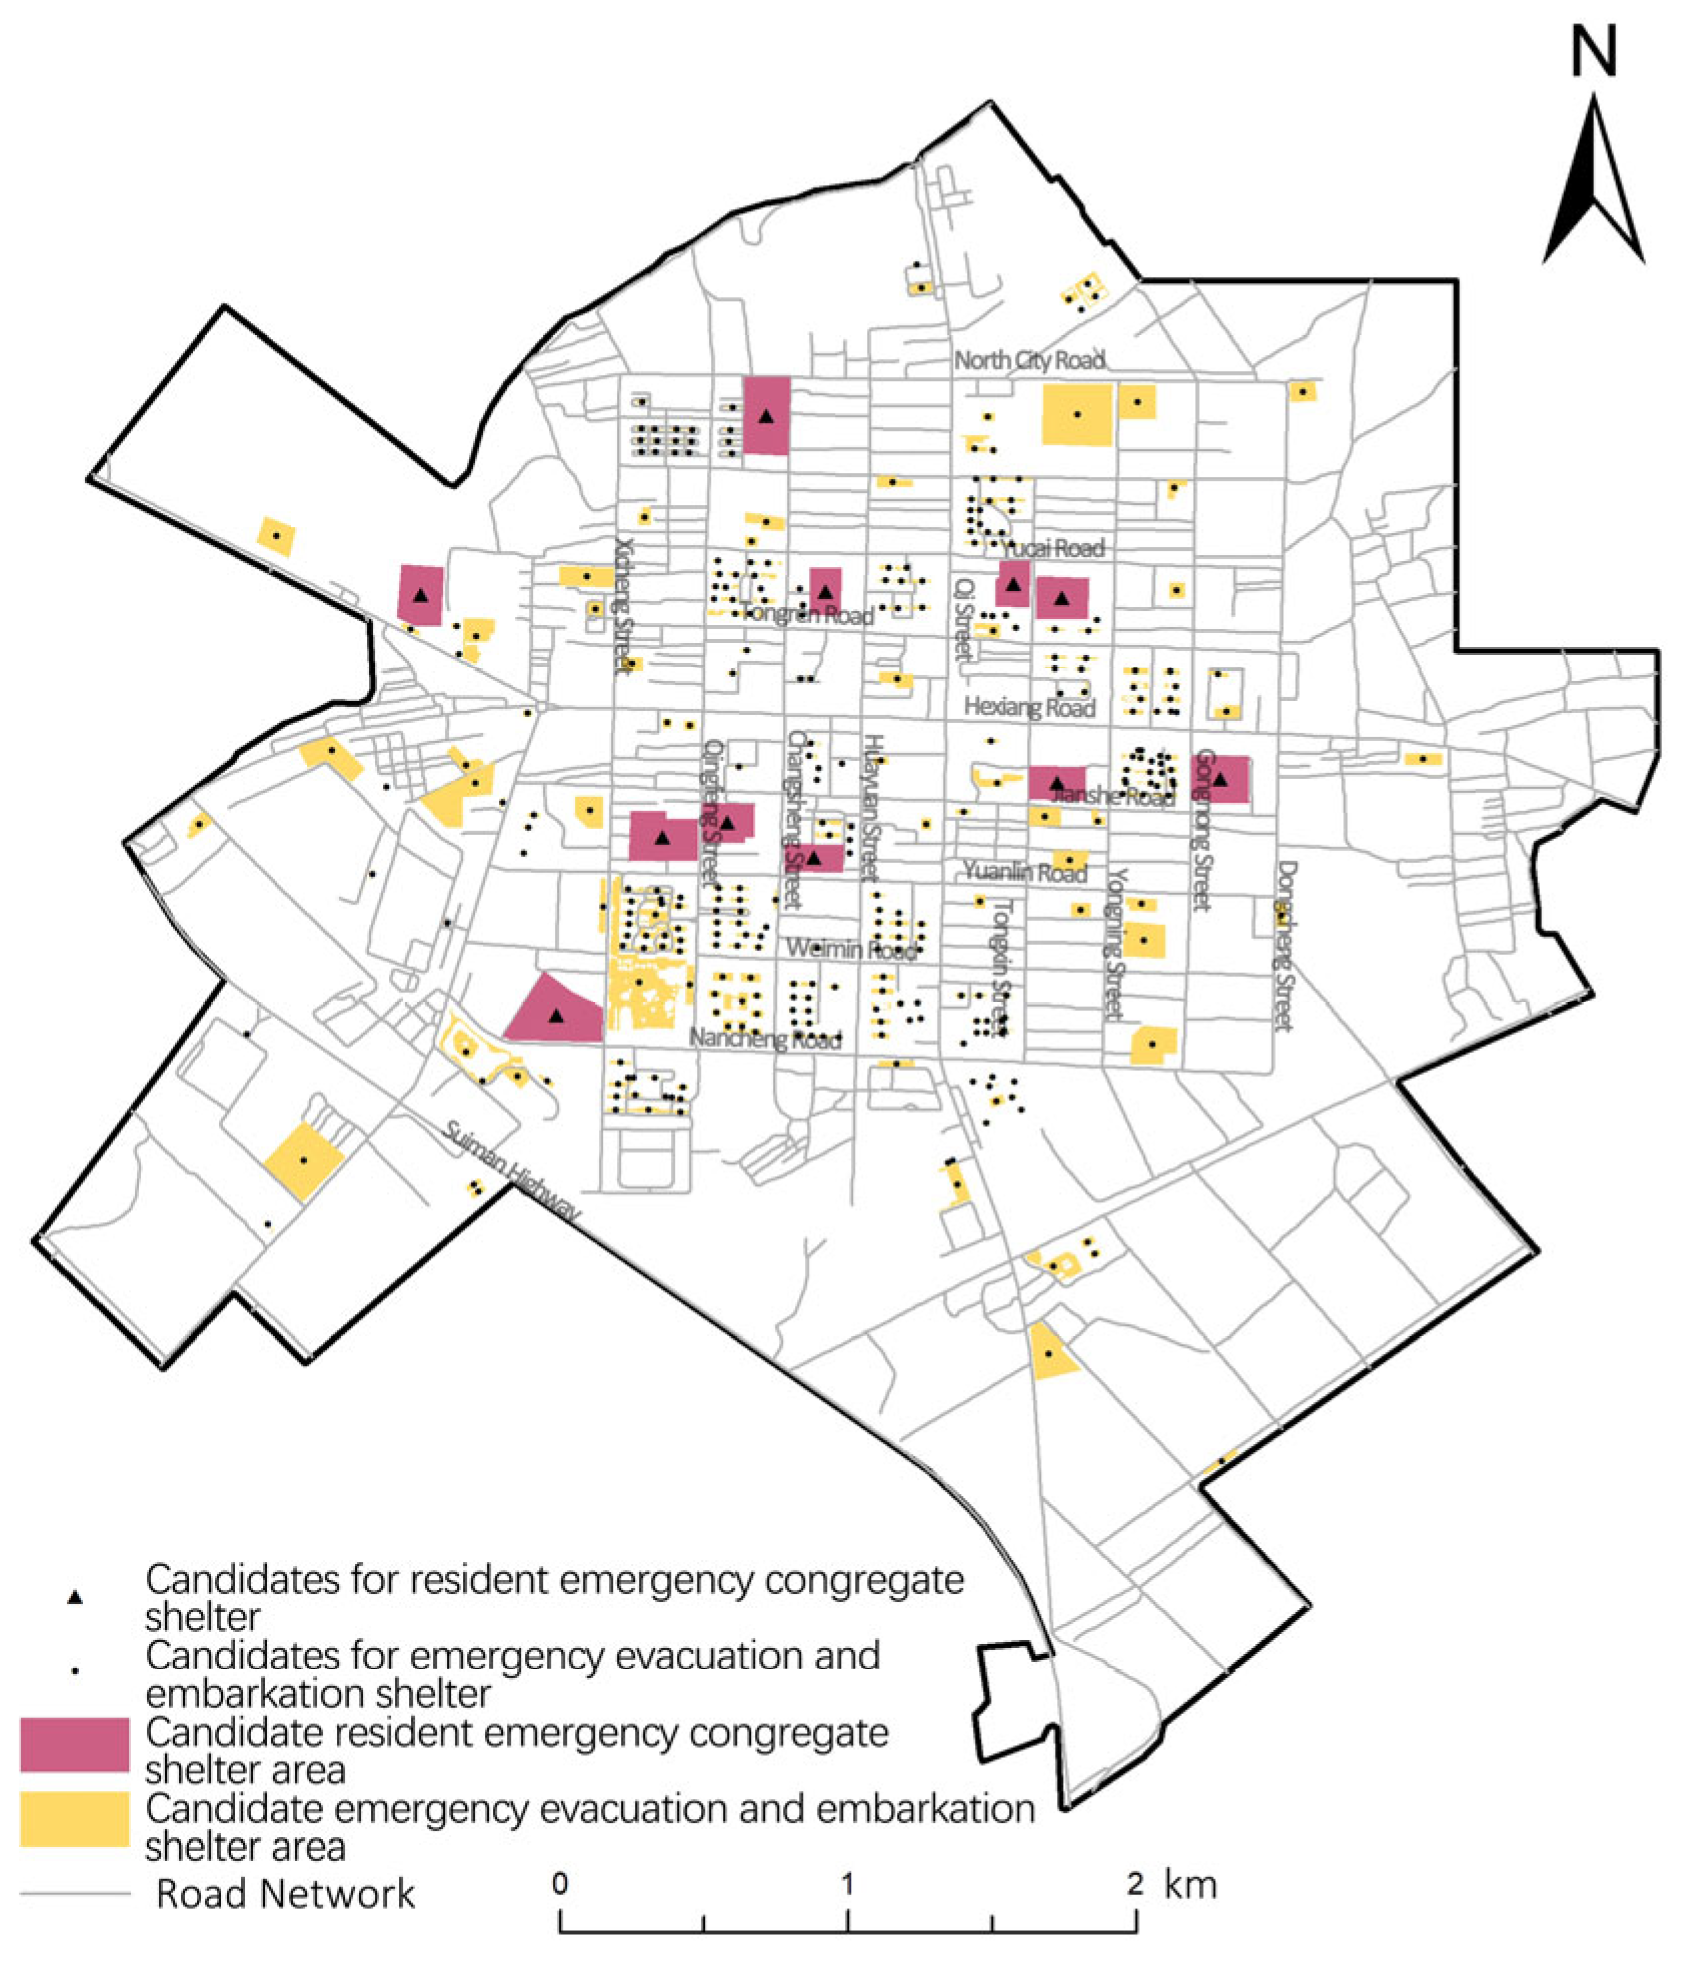
Based on the scale regulations outlined in the Spatial Planning Guidance: Community Life Unit (Table 3), the eligible parcels from the POI data and AOI data in the previous section were meticulously identified. This process led to the final identification of 11 candidate parcels suitable for use as resident emergency congregate shelters and 313 parcels suitable for use as emergency evacuation and embarkation shelters (Figure 7).
Table 3.
Recommendations for the allocation of service elements for public safety configurations in urban community living areas.
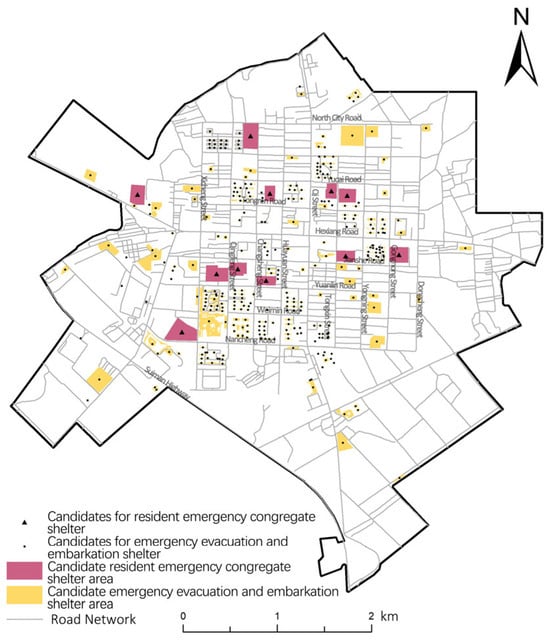
Figure 7.
Distribution of potential emergency shelters in the study area.
3.2.2. Optimizing the Location of Emergency Shelters
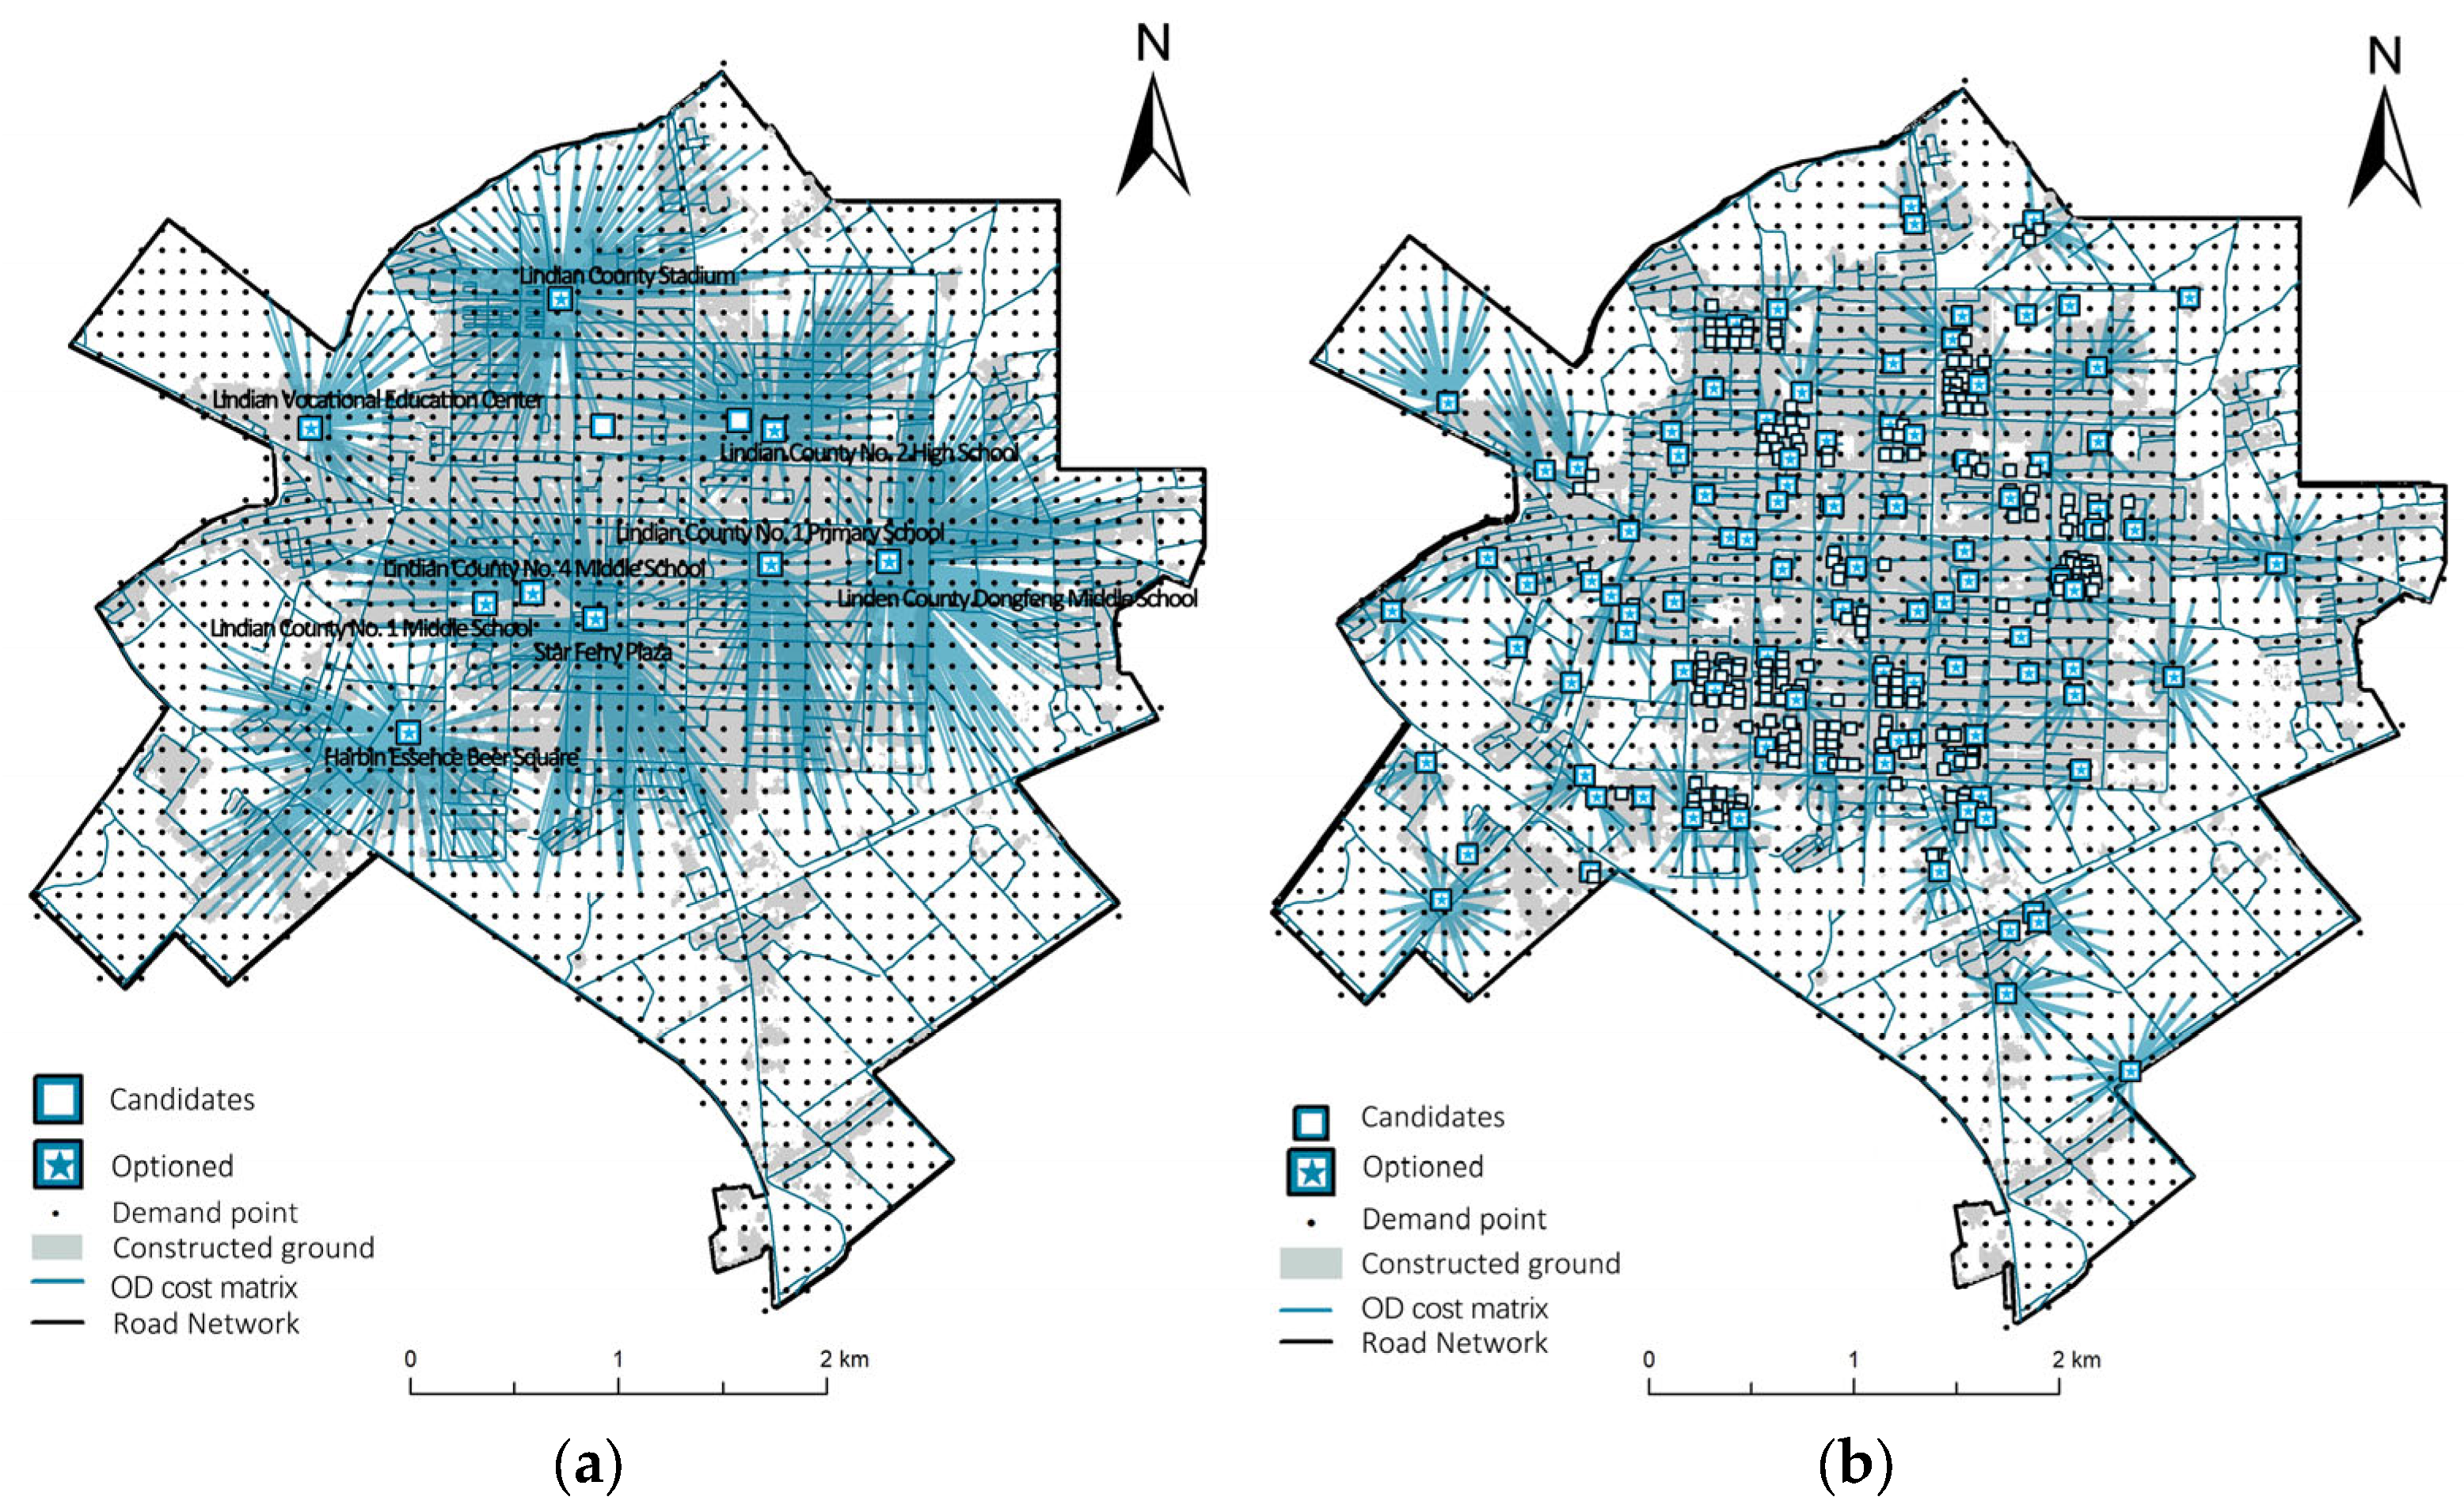
The study employed GIS’s location assignment function in tandem with road network modeling during disasters to ascertain optimal locations for places of emergency shelters. Together with population data, alternative resident emergency congregate shelters and fishing network sites were integrated into facility and demand points, respectively. Impedance was configured as travel time (minutes) to minimize the number of facility points to optimize facility usage, enhance evacuation and sheltering services, and reduce the construction cost of urban disaster prevention buildings. The impedance from the request point to the facility point simulated residents fleeing to a fixed shelter, with an impedance interruption set to 60 min (2000 m). Based on GIS analysis, nine selected shelters were initially identified (Figure 8). However, upon scrutinizing the data, it was noted that only one demand site was assigned to the first, middle school in Lindian County, accommodating just 36 people and relatively close to the candidate site, the fourth middle school in Lindian County. Considering government construction costs, the candidate point of the first middle school in Lindian County was excluded, resulting in eight resident emergency congregate shelters (Table 4).

Figure 8.
Results of location allocation for resident emergency congregate shelters (a); results of location allocation for emergency evacuation and embarkation shelters (b).
Table 4.
Information on preferred places of resident emergency congregate shelters in urban areas.
Similarly, alternative emergency evacuation and embarkation shelters were incorporated as facility points, and population fishing net points were included as demand points, with impedance interruptions set to 15 min (500 m). This initial setup identified 98 emergency evacuation and embarkation shelters (Figure 8). Based on the OD time-cost matrix obtained from the spatial allocation calculation, the average travel time from the point of need to the various levels of evacuation places in each community under the walking mode was calculated (Table 5). The average walking time for the population in the urban areas of Lindian County to reach fixed and emergency shelters is 32.4 min and 7.5 min, respectively. Concurrently, these emergency shelters meet the immediate emergency housing needs of 70% of the local population and an overall long-term stable housing capacity of 40% of the population group [37] (Table 6).
Table 5.
Timetable for access to places of shelter by point of need under the walking mode.
Table 6.
Optimal number of people to be covered by shelters at all levels and coverage rates.
3.3. Accessibility Analysis of Emergency Shelters Based on Gaussian Two-Step Floating Catchment Area Method
On the ArcGIS 10.7 platform, we employed the Gaussian two-step floating catchment area method to evaluate the spatial accessibility of emergency shelters. Enhancing accessibility metric precision, we utilized the OD cost matrix to gauge time cost, replacing the linear gap between supply and demand locations. Aligning with the scale requirements of the Spatial Planning Guidance: Community Life Unit for two tiers of the disaster prevention life circle and considering actual traffic conditions, as reflected in the road network model developed in the preceding section for disaster scenarios, we set the service time cost for emergency evacuation and embarkation shelters at 15 min and for resident emergency congregate shelters at 60 min. This adjustment aimed to maximize the search range for disaster prevention and sheltering services.
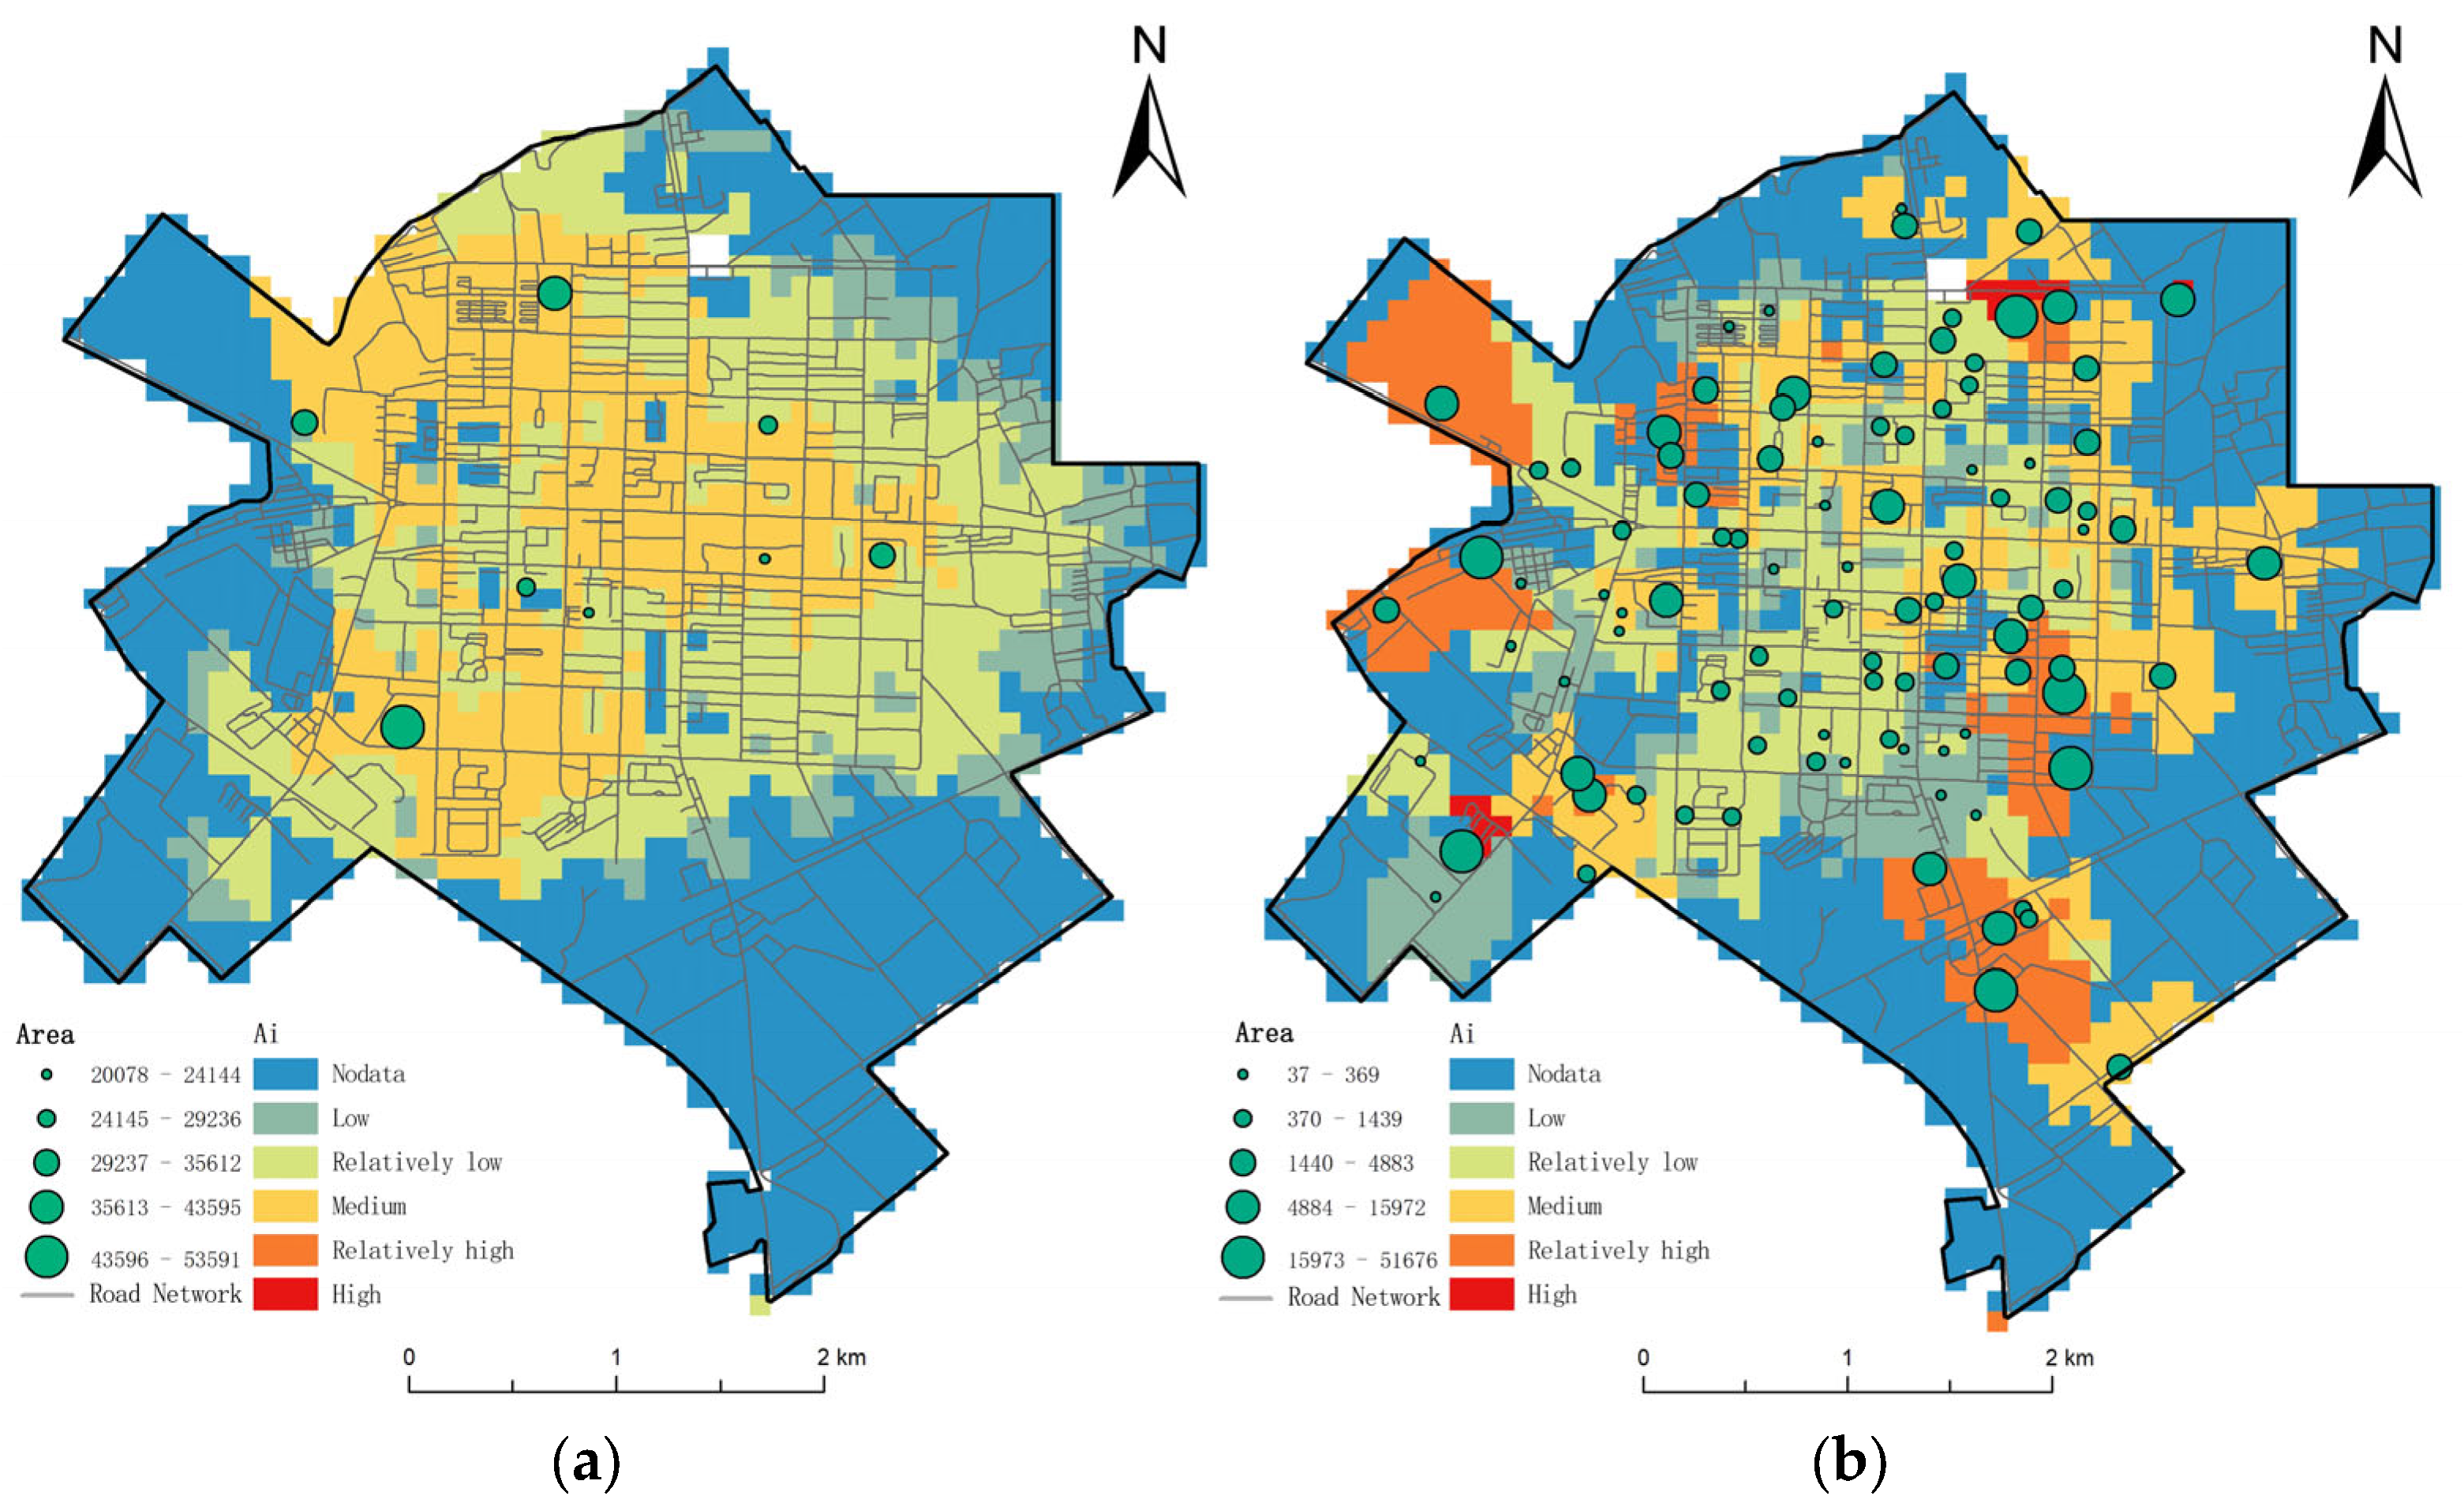
In calculating accessibility, emphasis was placed on the size of emergency shelters on the supply side. Drawing from a prior optimal site selection study, we identified eight resident emergency congregate shelters and 98 emergency evacuation and embarkation shelters. Substituting data on the supply and demand sides of these shelters in the urban area of Lindian County, along with the OD cost, into the calculation formula, we obtained the accessibility of shelters. Geometric interval classification better reflects geospatial continuity, typically resulting in improved visualization and aiding in better understanding and interpretation of geospatial data. Therefore, the accessibility results were integrated into the fishing net surface data, and geometric intervals were utilized to classify the area and accessibility of emergency shelters into five categories. The visualization results are depicted in Figure 9.
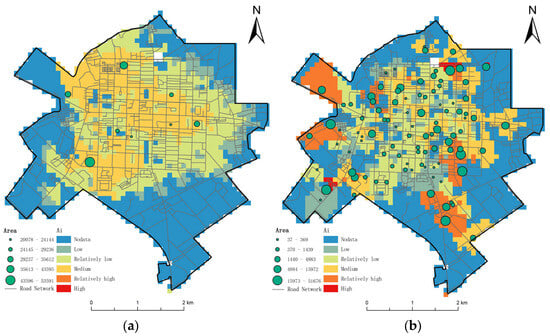
Figure 9.
Accessibility results for resident emergency congregate shelters (a); accessibility results for emergency evacuation and embarkation shelters (b).
3.3.1. Evaluation of the Accessibility of Resident Emergency Congregate Shelters
Setting the threshold at 60 min, the analysis in Figure 9a shows that the spatial accessibility of resident emergency congregate shelters in the urban area of Lindian County exhibits a radial spatial pattern in general, with a decreasing trend from the center to the surrounding areas step by step. Among them, the inaccessible area of the entire central urban area, that is, the area with 0 accessibility, accounts for 42.25%, mainly distributed on the edge of the urban area, i.e., a large area of cultivated land and farmland. Overlaying this with the building land surface elements within the urban area reveals that the unreachable area in the construction land is only 18.28%. The remaining 81.72% of the unreachable area is cropland, so this component was not analyzed in more depth. Screening out the unreachable areas, 45.94% of the urban area has low spatial accessibility to fixed places of refuge, mainly in the northeast and southeast neighborhoods. The percentage of resident emergency congregate shelters with average or above spatial accessibility in the urban area is 40.13%, mainly distributed in the northwest community, southwest community, and a small area around the resident emergency congregate shelters in the northeast and southeast communities. Taking the jurisdiction of each community as the boundary, the overall spatial accessibility of resident emergency congregate shelters is highest in the northwest community and lowest in the southeast community. In the Northwest community, 68.91% of the resident emergency congregate shelter accessibility is average or above, while in the Southeast community, the percentage is only 17.55%. The northwest community has large-scale evacuation sites such as the county gymnasium and the Lindian County Vocational Education Center, and the population size and road network distribution are more reasonable, balancing supply and demand. Meanwhile, the southeast community, as an old urban area, has a large number of shantytowns. Although there are space resources such as Dongfeng Elementary School and No.1 Elementary School, most of the internal buildings are old houses with a long history, the infrastructure is old and worn out, and the roads are narrow and worn out. In a scenario that only simulates the collapse of buildings during an earthquake, the percentage of affected roadways in shantytowns in the Southeast community is as high as 20.83%. More seriously, the uneven development of the city has led to a very high population density in the Southeast Community and a crowded living environment for the residents. As a result, the two fixed shelters in the Southeast Community only serve a very small portion of the surrounding area. In the southwest community, the spatial accessibility level of the resident emergency congregate shelters is 45.25% of the general and above, and the percentage of the population that can satisfy the demand for evacuation is 48.53%. As a new area, the Southwest Community has been developed and built for a relatively short period of time, but due to its high development speed and quality, it has built abundant resources of disaster prevention and evacuation space, and its population has reached 36.78% of the total population of the urban area, making it the community with the largest population. Taking into account the long-term development of the city, considering the projected 2035 urban area population of 80,000 people, as disclosed on the official website of the Lindian County government, the service capacity of the selected resident emergency congregate shelters adequately meets both the current and future evacuation needs of urban residents, reflecting the resilience of city construction. As these chosen emergency shelters predominantly rely on schools, green areas, etc., planning, construction, and maintenance must adhere to the stipulations outlined in “Earthquake Emergency Evacuation Site and Supporting Facilities” (GB 21734-2008 [38]). This encompasses provisions for temporary evacuation facilities, medical rescue, and epidemic prevention facilities.
3.3.2. Evaluation of Accessibility of Emergency Evacuation and Embarkation Shelters
Setting the threshold at 15 min, the analysis in Figure 9b shows that, similar to the spatial pattern in Figure 9a, the spatial accessibility of emergency evacuation and embarkation shelters in the urban area of Lindian County also exhibits a radial spatial pattern in general, albeit with a more noticeable tendency to scatter along the road network. Among them, the unreachable area, representing the area with 0 accessibility, accounts for 45.13% of the entire central urban area, primarily distributed at the edge of the urban area, with sporadic distributions also observed in the center of the urban area. Once again, when superimposed on the ground elements of the built-up area within the urban area, it is found that 21.84% of the built-up area is unreachable. The remaining 78.16% of the unreachable areas are cropland. Filtering out the unreachable areas, 29.90% of the urban area has low spatial accessibility to emergency evacuation and embarkation shelters, primarily in the southwest, northwest, and northeast neighborhoods. The percentage of the urban area with average and above spatial accessibility to emergency evacuation and embarkation shelters is 52.52%, primarily distributed in the central part of the northwest community, the northeast community, and the peripheral areas of the four communities. Based on the boundaries of each community, the overall level of spatial accessibility to emergency evacuation and embarkation shelters is the highest in the Southeast Community and the lowest in the Northwest Community. In the Southeast community, 57.74% of the emergency evacuation and embarkation shelters had average or above spatial accessibility, while in the Northwest community, the percentage was 48.25%. The choice of emergency shelters is mainly based on community gardens, centralized green spaces in small areas, and parking lots. Although the service capacity and scope of these locations may be lower than that of emergency gathering shelters for residents, their wide distribution is conducive to rapid evacuation and gathering of residents.
3.4. Delineation of Disaster-Proof Life Circle Area Based on Weighted Voronoi Diagrams
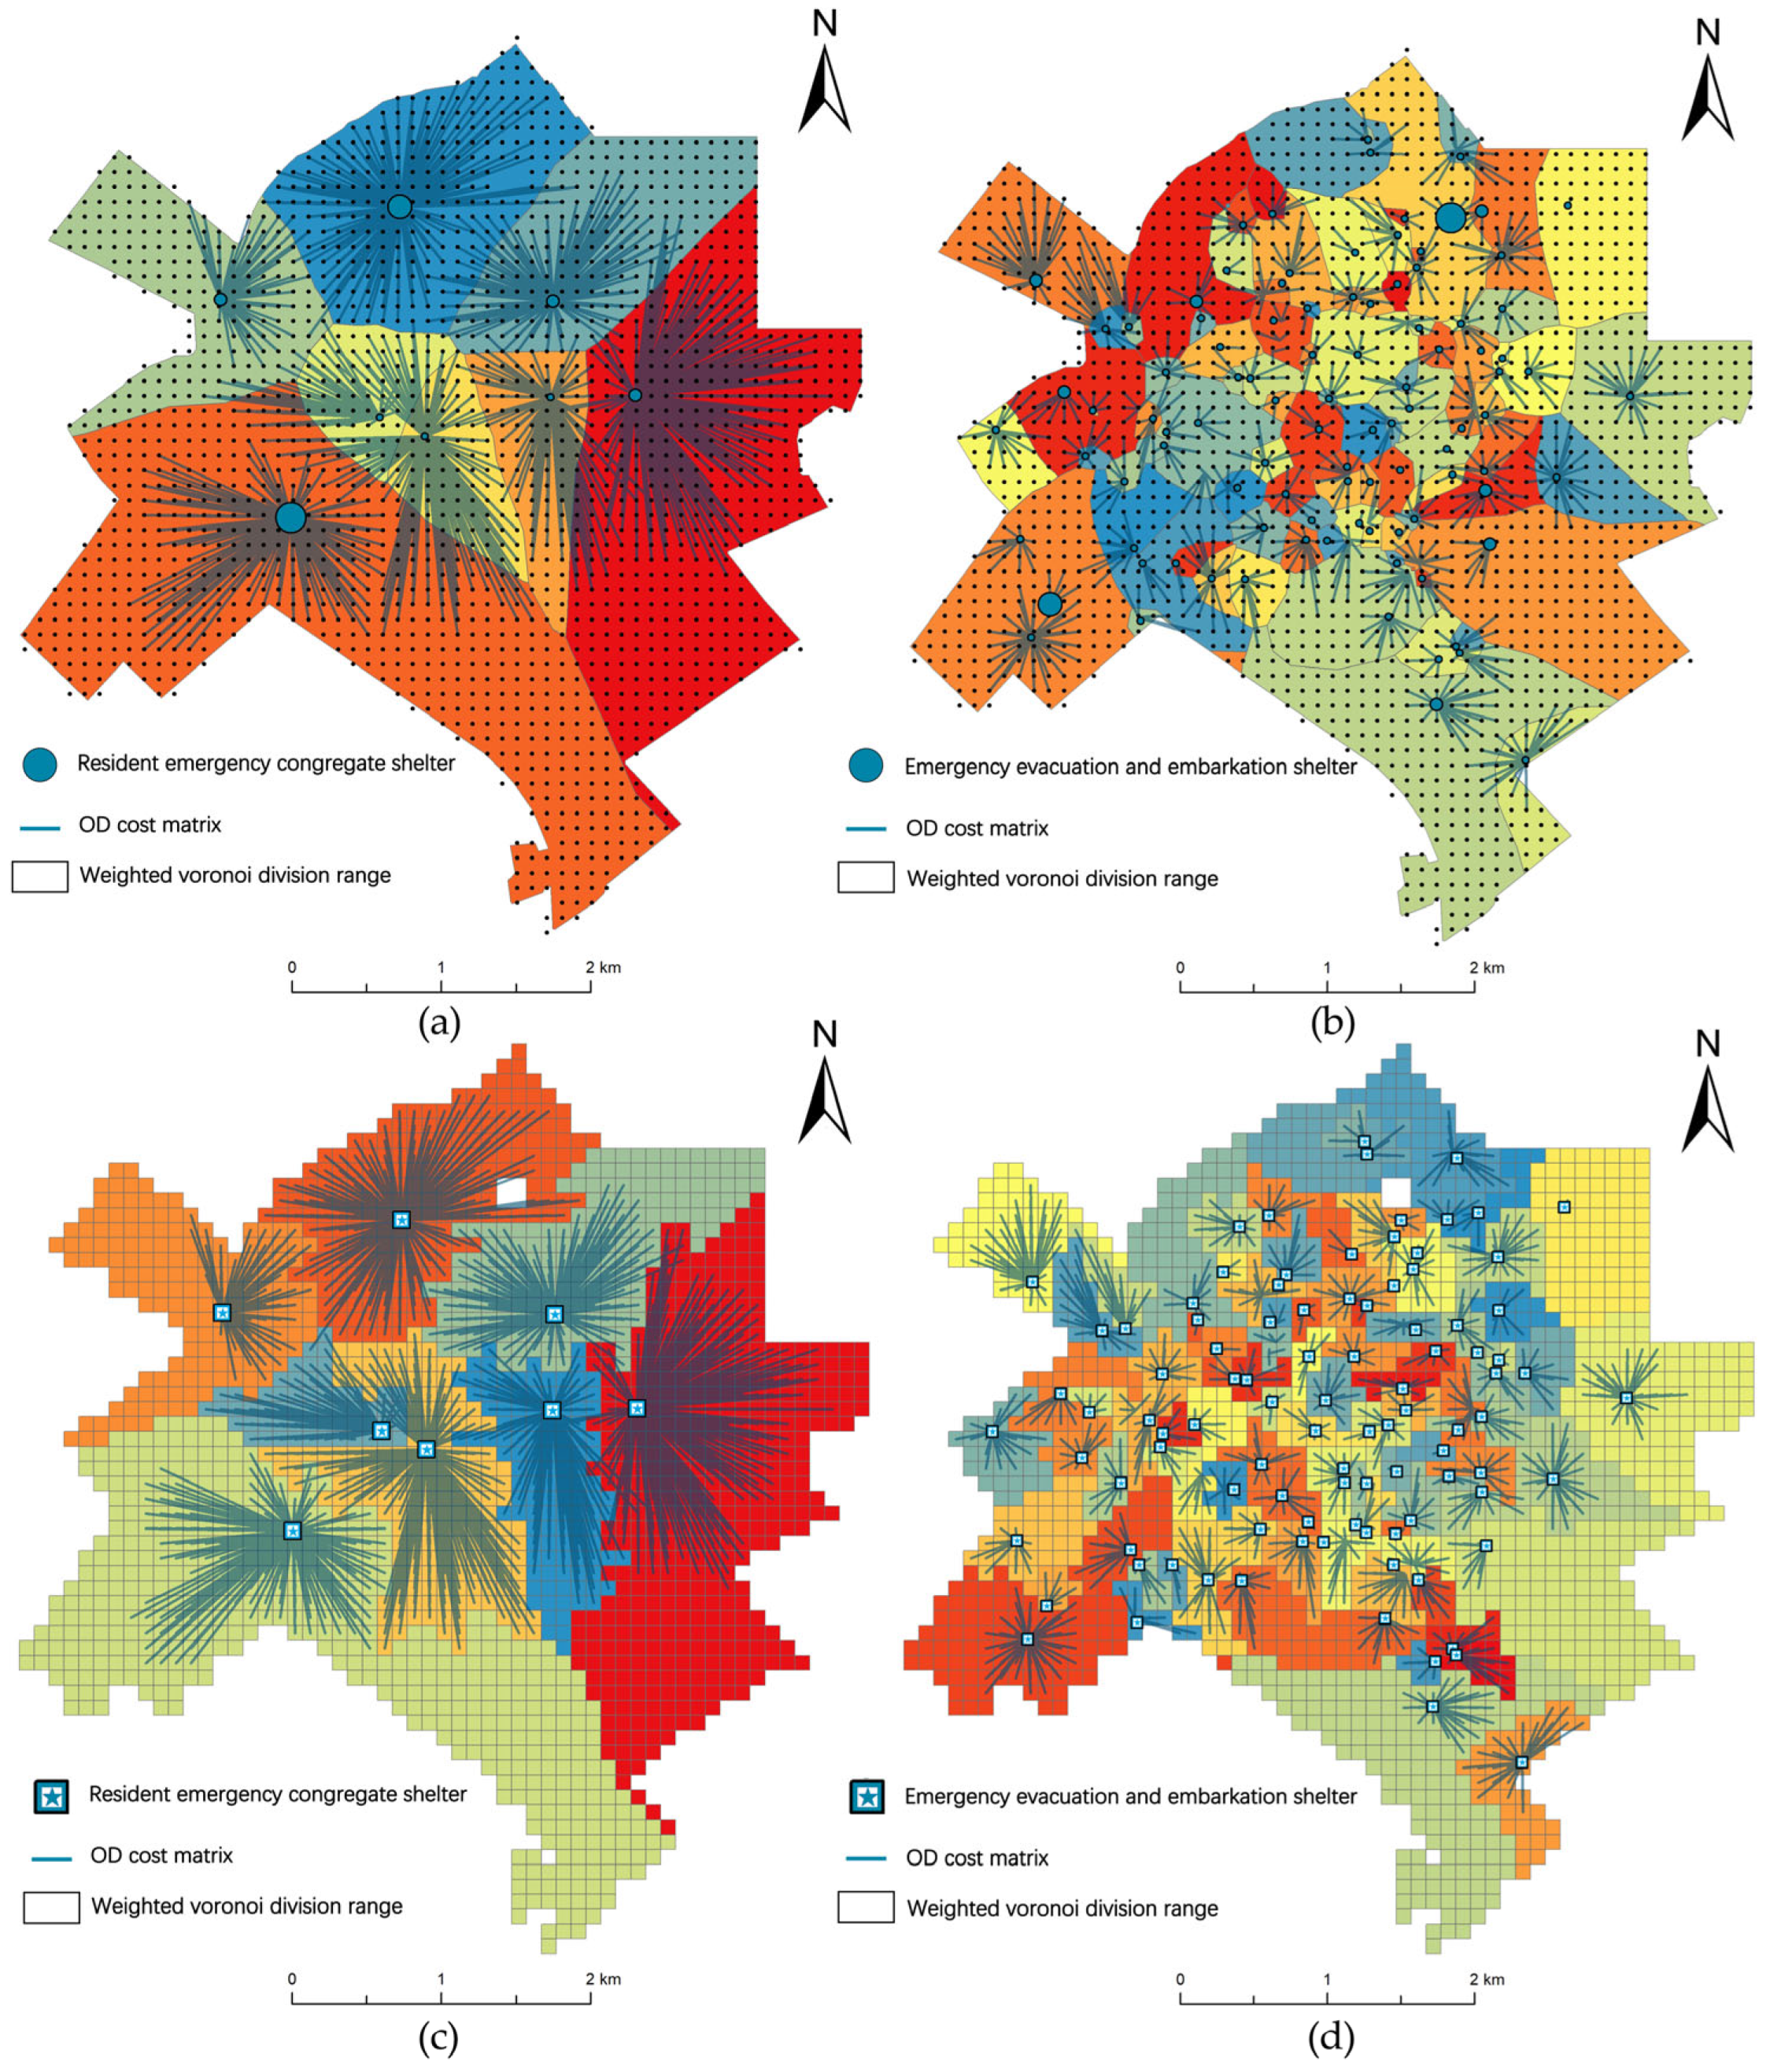
In applying the two-step floating catchment area method, the OD cost matrix tool is utilized. The OD time-cost matrix represents the cost of traveling between an origin and a destination, where cost is usually defined as distance or time. This study delineates the service area by establishing a threshold based on time or cost and visualizing the result to depict the area reachable within a specific time from the Origin [39]. However, while this method can visualize the supply and demand of shelters and the boundaries of the service area, its delineation ability does not fully meet the requirements for managing such a large scale of land use in urban areas. Therefore, in this study, the cost allocation function of ESRI’s ArcGIS 10.7 software was utilized to divide the geospatial space by using the effective land area of the site, representing the supply capacity of disaster prevention and evacuation sites, as a weighted Voronoi weight. The combination of both methods provides a more comprehensive and accurate service area delineation. The OD cost matrix is initially used to determine the basic framework of the service area, and then the weighted Voronoi diagram is applied to adjust the boundaries of the service area to reflect the competition between refuge sites and service areas. Initially, the point elements of places of refuge with the effective land area are substituted into the inverse distance weighting method tool. Since the result of inverse distance weighting is obtained based on the weights, the larger its value, the stronger the supply service capacity of the refuge places. Conversely, the higher the cost, the less cost-effective it is, and the larger the value, the less impact it has. Therefore, the inverse of the results obtained is used here. Finally, by substituting the point elements and raster data into the cost allocation tool, a weighted Voronoi diagram based on the supply capacity of emergency shelters is obtained (refer to Figure 10).
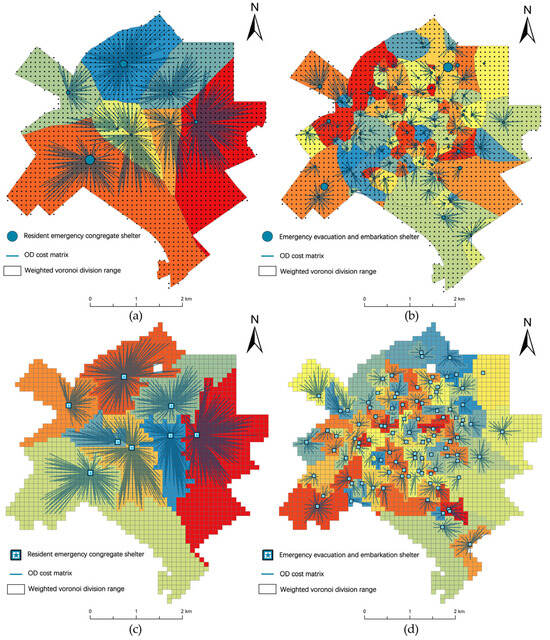
Figure 10.
Weighted Voronoi diagram results for resident emergency congregate shelters (a); weighted Voronoi diagram results for emergency evacuation and embarkation shelters (b); scope of service results for resident emergency congregate shelters based on OD cost matrix combined with weighted Voronoi (c); scope of service results for emergency evacuation and embarkation shelters based on OD cost matrix combined with weighted Voronoi (d).
When delineating disaster-prevention living areas for residents, considering both the size of the area and the impact of administrative divisions is crucial. The size of the area significantly influences the resources and space available for disaster prevention measures. Administrative divisions also play a vital role as they affect coordination and management during disasters. After careful consideration, Lindian County’s urban area was divided into three resident disaster prevention life circles, each with a clear administrative scope. Natural factors like topography and hydrology, along with road transportation, were key considerations as they directly impact emergency evacuation and relief material transportation. Therefore, these factors must be thoroughly considered to ensure each disaster prevention life circle benefits from optimal natural conditions and convenient road access.
The revision of disaster prevention living area delineation constitutes a complex and pivotal decision-making process. This revision process is informed by various factors, including the size of the areas, administrative divisions, natural conditions, and the impact of road transportation. The outcome of this revision has resulted in the division of Lindian County’s urban area into 3 resident disaster prevention life circles and 24 emergency disaster prevention life circles (Figure 11). The average area of resident disaster prevention life circles is calculated to be 608.39 hectares, while that of emergency disaster prevention life circles is 76.10 hectares on average.
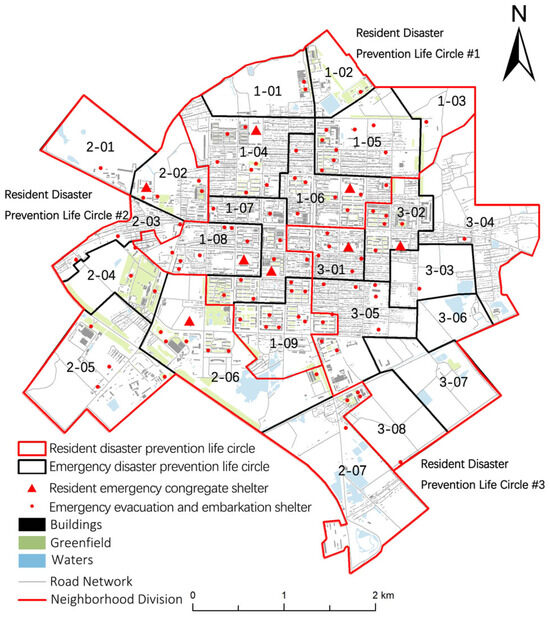
Figure 11.
Lindian County disaster prevention life circle delineation results.
The establishment of disaster prevention life circle systems is crucial for urban spatial organization. These systems ensure life and property safety and meet basic needs during disasters. Moreover, delineating these areas not only aids in efficient disaster response and resource allocation but also enhances urban community resilience and sustainability against environmental hazards. Therefore, meticulous consideration of various factors in the revision process underscores its significance in improving disaster preparedness and risk mitigation in urban areas.
4. Discussion
When planning and selecting fixed and emergency shelters in urban areas, several critical factors must be meticulously considered to ensure their effectiveness and utility. Firstly, they should be positioned away from hazardous sources like earthquake faults and flood plains, ensuring structural integrity to provide a secure refuge environment, alongside convenient transportation links and accessibility. Secondly, evacuation sites must possess sufficient capacity to accommodate a large number of affected residents and be adequately equipped with emergency supplies. Additionally, the implementation of effective management and maintenance protocols is imperative. Community participation emerges as a pivotal factor in enhancing housing utilization efficiency and residents’ resilience to disasters, warranting encouragement for participation in the planning and management process. By integrating these considerations and fostering collaboration between urban planning, emergency management, and other relevant sectors, it can be ensured that shelters play a pivotal role in mitigating the impacts of natural disasters and ensuring residents’ safety.
It is crucial to recognize the positive impact of urban green spaces in mitigating earthquakes and floods. Serving as natural buffers, green spaces can slow down the rate and intensity of seismic wave transmission, thereby reducing the risk of building damage. Simultaneously, they mitigate the risk of urban flooding by absorbing and storing rainwater and reducing runoff. Additionally, green spaces help to maintain the ecological balance of the city, providing habitats for biodiversity and increasing the ecosystem’s resilience to natural disasters. Throughout the urban area of Lindian County, there is a significant shortage of green spaces larger than medium size, which hampers efforts to mitigate the impact of disasters. However, we note that there is a large amount of inefficiently utilized open space in the urban area due to unbalanced and insufficient urban development. Therefore, we encourage both the government and the public to prioritize and actively participate in the conversion of underutilized land into green space, which can have a sustainable positive impact on society and the economy.
The strategic placement of emergency shelters is paramount for enhancing and complementing resident emergency congregate shelters. Firstly, in the choice of resident emergency congregate shelter, the high population density in the urban center of Lindian County, coupled with well-constructed and high-quality roads, contributes to lower susceptibility to building collapses and flooding hazards in this area. Moreover, the central region boasts abundant educational resources, with medium-sized primary and secondary schools evenly distributed throughout. These educational facilities serve as emergency shelters for residents, significantly reducing urban construction costs and land resource utilization while enhancing overall accessibility within the central city. In contrast, the urban fringe, designated as the city’s reserved development area, is characterized by extensive rural and agricultural land. However, the availability of suitable land for potential shelter sites is limited, resulting in a lower level of provision in this area. Additionally, underdeveloped rural road systems, narrow roads, low population densities, and reduced demand contribute to the overall lower accessibility observed in urban fringe areas. Through our analysis, several recurring observations have emerged: predominantly, areas with higher accessibility to emergency evacuation and embarkation shelters are situated on the outskirts of urban regions, often overlapping with regions inaccessible in the resident emergency congregate shelter accessibility analysis. As depicted in Figure 9b, the effective land area allocated for emergency shelters is more substantial in regions with heightened accessibility, indicative of their enhanced supply capacity. Additionally, owing to the restricted service area of emergency evacuation and embarkation shelters, their reach to the population is relatively limited. Coupled with their placement in sparsely populated fringe areas, this creates a scenario of high supply and low demand, which underpins the disparity observed in accessibility analysis between the two shelter types. A comparative analysis of accessibility levels between two types of shelters in the Northwest and Southeast communities reveals very different results. This underscores that while resident emergency congregate shelters may offer superior long-term services, they often fall short of reaching every corner of the city. Consequently, the strategic placement of emergency evacuation and embarkation shelters, typically near residential zones, assumes paramount importance to ensure prompt response and comprehensive coverage across the city. This realization highlights the significance of judiciously distributing emergency evacuation and embarkation shelters, which can effectively compensate for the coverage gaps of resident emergency congregate shelters and elevate the overall accessibility level of the entire region.
Compared to existing related studies, our study has made improvements in several aspects. In terms of theoretical concepts, the release of China’s Spatial Planning Guidance: Community Life Unit signifies China’s attention to and recognition of the concept of the disaster prevention life circle. It also demonstrates the possibility of introducing Japan’s concept of the disaster prevention life circle into the country, which represents a positive exploration and attempt for China. Regarding facility siting, this study utilized the spatial allocation minimization facilitation tool to select the spatial location of shelters, potentially providing a more accurate siting method than existing studies, especially in small and medium-sized cities with limited resources. Concerning constructing a disaster prevention life circle, this study delineates the scope of the disaster prevention life circle by combining the range of demand points from the OD cost matrix and the effective land area of the shelters. This approach may offer a new perspective to consider the balance of supply and demand and spatial layout more comprehensively. Despite the important implications of this study for urban disaster prevention, mitigation, and post-disaster reconstruction, there are some limitations related to its data sources and disaster risk assessment. The use of 2020 WorldPop data may be constrained by the frequency of data updates, and the study solely focuses on earthquakes and urban flooding, neglecting other significant hazard types such as storm surges in coastal areas. Additionally, in the accessibility study, the weighted Voronoi diagrams only considered land area and did not adequately account for factors such as the completeness of local facilities. Therefore, adjustments and optimizations are necessary based on regional characteristics, and further research is required to enhance the comprehensiveness of the methodology and results.
Construction costs are crucial for disaster prevention and readiness in small towns. This study aims to tackle this issue through meticulous planning and efficient resource allocation. By optimizing resources, towns can enhance the quality and coverage of evacuation facilities, bolstering their emergency response capabilities. Strategically selecting evacuation sites and defining disaster readiness zones allows towns to better manage policies and emergency drills. Considering factors like population density, accessibility, and natural disaster risk, towns can position evacuation facilities and disaster-safe zones to meet residents’ safety needs. Employing a mix of quantitative and qualitative analytical methods, such as statistics and GIS, enhances the study’s scientific rigor. Field surveys and case studies offer valuable insights into disaster preparedness and response in small towns. Ultimately, this study seeks to provide dependable decision support for bolstering small towns’ disaster resilience and ensuring resident safety, fostering sustainable and secure living environments.
5. Conclusions
This study firstly optimized the site selection of existing places of refuge in the urban area of Lindian County, meeting the requirements of the Technical Guidelines for Community Life Circle Planning, through the use of GIS spatial configuration tools. Following the completion of the pre-disaster risk assessment of the city, the Gaussian two-step floating catchment area method was enhanced by incorporating the cost of transportation time during disasters, the service radius of evacuation sites, supply capacity, and demand for evacuation population. This allowed for analysis of the supply and demand of evacuation sites and the accessibility within the urban area. In addition to optimizing the siting of evacuation sites and exploring the supply-demand relationship and accessibility, the study also established the basic framework and scope of the service area by setting thresholds and employing the OD cost matrix. Simultaneously, the spatial influence of each evacuation site was delineated by combining the weighted Voronoi method with the effective land area as the weight. Through these steps, the study successfully delineated the disaster prevention life circle in the urban area of Lindian County, providing a scientific basis and decision support for disaster response and relief efforts in the town.
This study aims to promote multi-stakeholder shared governance, create a new model of disaster prevention, mitigation, and relief, and provide valuable references for other cities to plan and build disaster-proof living circles. The study helps deepen the government’s and people’s understanding of social disaster risk and promotes the establishment of a comprehensive and dynamic urban information database, encompassing various factors such as climatic conditions, geographic environment, land use status, infrastructure, population, etc. This database serves to provide exhaustive and authentic basic information for urban climate change prediction and risk assessment, thereby enhancing the accuracy and efficiency of urban disaster risk assessment. In the context of China’s increasing emphasis on urban health checks, it is believed that this study will also contribute to better supporting territorial spatial planning and the construction of resilient cities. The promotion of this research and methodology aims to ensure that cities possess sufficient capacity to respond to natural disasters and emergencies, strengthen the social security system, enhance the scientific level of emergency management, promote the modernization of the country’s governance system and capacity, and achieve sustainable development across various aspects including the economy, ecology, culture, and productivity while ensuring urban safety.
Author Contributions
H.J. and S.F. wrote the main text of the manuscript and S.F. prepared the figures. S.F. provided data; H.J. and S.F. provided methods; H.J. and S.F. reviewed and edited the manuscript. All authors have read and agreed to the published version of the manuscript.
Funding
This research received no external funding.
Institutional Review Board Statement
Not applicable.
Informed Consent Statement
Not applicable.
Data Availability Statement
The authors do not have the right to share the data. However, they will be made available to the reader upon reasonable request.
Acknowledgments
We acknowledge the reviewers for their constructive comments to improve the manuscript.
Conflicts of Interest
The authors declare no conflicts of interest.
References
- Opinions on Promoting Green Development of Urban and Rural Construction Issued by the General Office of the CPC Central Committee and the State Council_Related Documents of the Central Government_Chinese Government Website. Available online: https://www.gov.cn/zhengce/2021-10/21/content_5644083.htm (accessed on 19 February 2024).
- By 2024, China will Carry out Comprehensive Urban Medical Checkups in Cities of Prefectural Level and above_Departmental News_Chinese Government. Available online: https://www.gov.cn/lianbo/bumen/202311/content_6917507.htm (accessed on 19 February 2024).
- Guo, W.; Lu, Y.; Zhai, G. Domestic and Overseas Research Progress and Trend on Resilient City. Shanghai Urban Plan. Rev. 2022, 8–15. [Google Scholar] [CrossRef]
- Li, Y.; Chai, Y.; Ta, N. From Disaster Prevention Life Circle to Safety Life Circle: Japanese Experience and Inspirations for China. Urban Plan. Int. 2022, 37, 113–120. [Google Scholar]
- Department of Natural Resources. Spatial Planning Guidance to Community Life Unit; Ministry of Natural Resources of the People’s Republic of China: Beijing, China, 2021; p. 37.
- Zhang, Y.; Zheng, L.; Gao, J. Earthquake Prevention Planning: Xichang Example. Planners 2011, 27, 19–25. [Google Scholar]
- Tang, S.; Wang, J.; Xu, Y.; Chen, S.; Zhang, J.; Zhao, W.; Wang, G. Evaluation of Emergency Shelter Service Functions and Optimisation Suggestions—Case Study in the Songyuan City Central Area. Sustainability 2023, 15, 7283. [Google Scholar] [CrossRef]
- Shi, L.; Zheng, Q.; Yang, M.; Liu, L. A review of definitions, influence factors and assessment of urban resilience. Acta Ecol. Sin. 2022, 42, 6016–6029. [Google Scholar]
- Capano, G.; Woo, J.J. Resilience and robustness in policy design: A critical appraisal. Policy Sci. 2017, 50, 399–426. [Google Scholar] [CrossRef]
- Simone, F.; Akel, A.J.N.; Di Gravio, G.; Patriarca, R. Thinking in systems, sifting through simulations: A way ahead for cyber resilience assessment. IEEE Access 2023, 11, 11430–11450. [Google Scholar] [CrossRef]
- De Nicola, A.; Villani, M.L.; Sujan, M.; Watt, J.; Costantino, F.; Falegnami, A.; Patriarca, R. Development and measurement of a resilience indicator for cyber-socio-technical systems: The allostatic load. J. Ind. Inf. Integr. 2023, 35, 100489. [Google Scholar] [CrossRef]
- Di Nardo, M.; Clericuzio, M.; Murino, T.; Madonna, M.J. An adaptive resilience approach for a high capacity railway. Int. Rev. Civ. Eng. 2020, 11, 98–105. [Google Scholar] [CrossRef]
- Dimitrova, M.; Snair, M. Classifying disaster risk reduction strategies: Conceptualizing and testing a novel integrated approach. Glob. Health 2024, 20, 7. [Google Scholar] [CrossRef]
- Kim, N.-Y.; Chung, J.-B. Disaster Resilience of Korean Cities Using Data Envelopment Analysis. Nat. Hazards Rev. 2024, 25, 04024003. [Google Scholar] [CrossRef]
- Chen, X.; Wang, P.; Fu, Z. Study on layout optimization of fixed refuge in mountainous city based on disaster risk assessment—Take Dongchuan district for example. J. Nat. Disasters 2020, 29, 162–174. [Google Scholar]
- Zhang, X.; Yu, S.; Zhang, X. Optimized Location Model of Resident Emergency Congregate Shelter Based on Multi-Objective Constraints. Urban Dev. Stud. 2020, 27, 59–66. [Google Scholar]
- Zhou, A.; Chen, L.; Zhu, H.; Chen, S. Reasonability of spatial distribution for urban emergency shelter in central district of Beijing at community scale. J. Saf. Environ. 2021, 21, 1662–1669. [Google Scholar]
- Li, G.; Ma, D.; Su, J. Weighted Voronoi Diagrams for Responsibility Space Regionalization of Urban Earthquake Emergency Shelters. Build. Sci. 2006, 55–59. [Google Scholar] [CrossRef]
- Ma, Y.; Xu, W.; Zhao, X. Assessment of allocation of residents to emergency shelters under different earthquake damage scenarios—Case study on central area of Beijing. China Saf. Sci. J. 2014, 24, 137–143. [Google Scholar]
- The State Council of the People’s Republic of China. Opinions on Promoting Urbanization with County Cities as Important Carriers; The State Council of the People’s Republic of China: Beijing, China, 2022.
- He, L.; Xie, Z. Towards Resilience: Review and Prospects of Urban Integrated Disaster Prevention Planning. Build. Sci. 2021, 43–54. [Google Scholar] [CrossRef]
- Xue, F.; Gao, X.; Qian, J.; Shen, D. Numerical Simulation of Urban Waterlogging Based on GIS. Geomat. Spat. Inf. Technol. 2012, 35, 12–14. [Google Scholar]
- Guo, J.; Zhang, Y.; Ji, J.; Yuan, X.; Xiao, B. A Preliminary Study on the Method of Seismic Intensity Assessment Based on Residential Building Data and High Resolution Remote Sensing Images. Seismol. Geol. 2020, 42, 968–980. [Google Scholar]
- Yang, H.; Yang, N.; Kong, F.; Zeng, J. Spatial Accessibilities Evaluation of Compulsory Education at County Level Based on Improved Two-Step Floating Catchment Area Method-Taking Jianli County of Hubei Province as an Example. J. Fudan Univ. (Nat. Sci.) 2021, 60, 618–625. [Google Scholar]
- Wang, M.; Chen, C.; Zhou, S. Accessibility of urban green open space based on weighted two-step floatingcatchment area method: A case study of the central district of Nanjing City. Acta Ecol. Sin. 2023, 43, 1–10. [Google Scholar]
- Bai, Z.; Wang, J.; Yang, F. Research progress in spatialization of population data. Prog. Geogr. 2013, 32, 1692–1702. [Google Scholar]
- Lee, Y.H.; Lee, J.S.; Baek, S.C.; Hong, W.H. Spatial Equity with Census Population Data vs. Floating Population Data: The Distribution of Earthquake Evacuation Shelters in Daegu, South Korea. Sustainability 2020, 12, 8046. [Google Scholar] [CrossRef]
- Bai, Z.; Wang, J.; Wang, M.; Gao, M.; Sun, J. Accuracy Assessment of Multi-Source Gridded Population Distribution Datasets in China. Sustainability 2018, 10, 1363. [Google Scholar] [CrossRef]
- Wu, W.; Ma, J.; Banzhaf, E.; Meadows, M.; Yu, Z.; Guo, F.; Sengupta, D.; Cai, X.-X.; Zhao, B. A first Chinese building height estimate at 10 m resolution (CNBH-10 m) using multi-source earth observations and machine learning. Remote Sens. Environ. 2023, 291, 113578. [Google Scholar] [CrossRef]
- Que, Z.; Hu, H.; Chen, S. Analysis of the Optimization in Urban Fire Station Layout Planning Based on Location-Allocation of GIS. Beijing Surv. Mapp. 2013, 18–24. [Google Scholar] [CrossRef]
- De, T.; Yiyu, S.; Miaomiao, X. Evaluation of green space accessibility based on improved Gaussian two-step floating catchment area method: A case study of Shenzhen City, China. Prog. Geogr. 2021, 40, 1113–1126. [Google Scholar]
- Wang, D. Study on the Division of Responsibility Area of Emergency Shelters in the Main Urban District of Nanjing Based on Weighted Voronoi Diagram. Master’s Thesis, Nanjing University of Technology, Nanjing, China, 2018. [Google Scholar]
- Zeng, S.; Chen, Z. Study on Urban System Spatial Structure and Attractive Scope by Voronoi Way: A Case of Guangdong Province. J. South China Norm. Univ. (Nat. Sci. Ed.) 2017, 49, 87–94. [Google Scholar]
- Rainstorm Popularization I. Rainstorm and Its Definition-China Meteorological Administration Government Portal. Available online: https://www.cma.gov.cn/2011xwzx/2011xqxxw/2011xqxyw/202110/t20211030_4058957.html (accessed on 10 January 2024).
- Tian, Z. Community Disaster Prevention Planning Method Based on Precaution Living Perimeter Theory. Ph.D. Thesis, Shandong University of Architecture, Zibo, China, 2019. [Google Scholar]
- Zhao, X.; Hu, L.; Wang, X.; Wu, J. Study on Identification and Prevention of Traffic Congestion Zones Considering Resilience-Vulnerability of Urban Transportation Systems. Sustainability 2022, 14, 16907. [Google Scholar] [CrossRef]
- Wenjun, M.; Liang, L.; Yizeng, W.; Qiao, H.; Jian, S. Physical Evaluation of Community-Life Circle for Health, Safety, and HighDensity Cities Governance. J. Tongji Univ. (Nat. Sci.) 2022, 50, 1628–1636. [Google Scholar]
- GB 21734-2008; Emergeney Shelter for Earthquake Disasters—Site and Its Facilities, China. 2008. Available online: http://c.gb688.cn/bzgk/gb/showGb?type=online&hcno=8B2E0D7D4505370BA2CAD64253A354F3 (accessed on 22 January 2024).
- Wei, L.; Chengxu, L.; Yaping, M. Division of responsibility areas for urban emergency shelters based on aGIS location-allocation analysis. J. Tsinghua Univ. (Sci. Technol.) 2022, 62, 1102–1109. [Google Scholar]

Disclaimer/Publisher’s Note: The statements, opinions and data contained in all publications are solely those of the individual author(s) and contributor(s) and not of MDPI and/or the editor(s). MDPI and/or the editor(s) disclaim responsibility for any injury to people or property resulting from any ideas, methods, instructions or products referred to in the content. |
© 2024 by the authors. Licensee MDPI, Basel, Switzerland. This article is an open access article distributed under the terms and conditions of the Creative Commons Attribution (CC BY) license (https://creativecommons.org/licenses/by/4.0/).