Article

Integrated Absorption–Adsorption Process for Waste-Free Decontamination of Gases from Sulfur Dioxide, Part 2: CFD Modeling and Experimental Investigation of a Bubble-Cap Tray

by
Apostol Apostolov
,
Stela Panyovska
,
Stefan Stefanov
,
Daniela Dzhonova-Atanasova
*,
Elena Razkazova-Velkova
and
Stefan Michev
Institute of Chemical Engineering, Bulgarian Academy of Sciences, “Acad. G. Bonchev” Str., Bldg. 103, 1113 Sofia, Bulgaria
*
Author to whom correspondence should be addressed.
Sustainability 2024, 16(6), 2472; https://doi.org/10.3390/su16062472
Submission received: 15 January 2024 / Revised: 12 March 2024 / Accepted: 14 March 2024 / Published: 16 March 2024

Abstract

:
There are many technologies for removal of sulfur dioxide (SO2) from flue gases. They are intrinsic part of the efforts for sustainability of energy production as they reduce the harmful impact of fossil fuel combustion on the environment by minimizing one of the main air pollutants. A wide range of methods use alkaline absorbents. In most cases, the products obtained from the absorption process have to undergo further oxidation, which increases the cost of carrying out the process. As a final result, the sulfates obtained (Na2SO4 and CaSO4) have limited practical application and there is a problem with their disposal. Scientific and engineering efforts have been directed towards the development of a practically waste-free technology for gas purification from SO2. An absorption–adsorption method is proposed, which comprises absorption of SO2 in water with simultaneous adsorption of the resultant sulfurous acid (H2SO3) from the aqueous solution with a synthetic anion-exchange resin. Regeneration of the adsorbent is accomplished with a dilute solution of ammonia (NH3), followed by decomposition of the resulting ammonium sulfite ((NH4)2SO3) with nitric acid (HNO3). The products of the processes are pure gaseous (liquefied) SO2 and an aqueous solution of ammonium nitrate (NH4NO3). Sulfur dioxide has a wide range of applications in the chemical industry; ammonium nitrate is a product with a variety of commercial uses as well, the most common of which is as a soil fertilizer. The new absorption–adsorption method offers a practically waste-free technology. The basic unit of this technology is a bubble-cap tray column where the absorption–adsorption process is carried out in an aqueous suspension of a synthetic anion-exchange resin. This work presents a CFD simulation of the flow on the bubble-cap tray. A physical model of the column is constructed, which contains a bubble-cap tray fabricated by 3D printing. As a result of this experimental study, new data on the tray pressure drop, gas holdup, and the kinetics of the absorption–adsorption process were obtained.

1. Introduction

Atmospheric sulfur dioxide (SO2) plays an important role in the sulfur cycle, but at the same time it is the main culprit behind acid rain. The sources of atmospheric sulfur dioxide can be generally divided into two groups, natural and anthropogenic. Natural sources, e.g., volcanoes, produce 35–65% of the total SO2 emissions [1]. Approximately 84% of the anthropogenic SO2 emissions are due to the combustion of sulfur-containing fossil fuels. The power generation industry is the largest source of anthropogenic SO2 emissions. Sulfur dioxide is one of the most abundant air pollutants emitted in the United States (about 4.5 million tons in 2013). The emissions have, however, decreased in the Eastern United States by 76–79% from 2000–2002 to 2018–2020 [2].
China is considered the world’s biggest SO2 emitter; in 2022, the annual average SO2 concentration in 339 Chinese cities was 9 μg/m3 (ranging from 2 to 30 μg/m3) [3] (p. 8). Based on data from 272 Chinese cities, Wang et al. evaluated the health effects of SO2 exposure and concluded that a 10 μg/m3 increase in SO2 corresponds to a 0.55–0.70% increase in the mortality rate of patients with chronic diseases [4].
Sustainable development of energy production needs efficient and waste-free approaches to combat this serious environmental pollutant. Various methods for SO2 capture and neutralization have been developed, focused mainly on the most abundant anthropogenic emitters—coal power plants. Generally, the methods for flue gas desulfurization (FGD) can be divided into “throwaway” and “regenerable” and both types include wet and dry methods [5] (p. 17). Based on the processes involved, they are classified as follows: absorption employing alkaline, alkali metals, and different liquid sorbents [6] (p. 481); adsorption [7]; electron beam method [8]; pulse corona discharge method [9]; etc. However, the most widely applied FGD method is the lime/limestone gas scrubbing method which produces gypsum (CaSO4 × 2 H2O) as a by-product [10]. An overview [10] published in 2015 noted that at that time, this method was employed in about 45% of existing FGD facilities and covered more than 68% of planned future ones. The gypsum FGD technology, regardless of the equipment design, has several main drawbacks: (i) operation with a slurry; (ii) additional need for oxidation of the CaSO3 to gypsum; (iii) the by-product is of limited practical application and needs disposal.

State-of-the-Art FGD Using Ion-Exchange Resins

A retrospective study of applications of ion-exchange resins was presented by Alexandratos, covering publications in a 100 year period (1909–2009) and areas like water softening, environmental remediation, wastewater treatment, hydrometallurgy, chromatography, biomolecular separations, and catalysis [11]. Waste gas desulfurization is a priority field of application of ion-exchange resins, directed at reducing air pollution. A lot of approaches have been introduced for that purpose. Cole and Shulman studied the adsorption of sulfur dioxide from air–sulfur dioxide mixtures in contact with dry ion-exchange resins with medium porosity [12]. The adsorptive capacity-temperature characteristics of ion-exchange resins were obtained and compared with data from the literature for silica gel, gas-adsorbent carbon, and molecular sieves. In regard to adsorption capacity and volume of sulfur dioxide desorbed, the best-performing resin was a medium porosity anion-exchange resin in chloride form (IRA-400). Nevertheless, the molecular sieves appear to be far superior in their ability to adsorb large quantities of SO2 at extremely low concentrations. Following Cole and Shulman, numerous investigations were performed on fixed-bed adsorption of acid gases, like SO2, nitrogen oxides, and H2S. An overview by Vaidyanathan et al. describes a sorption mechanism, supported by many authors, which proceeds in the following two stages: (i) diffusion into the void volume of the dry polymeric phase, followed by (ii) penetration of the aggregates of sulfonated sites with swelling and reaction [13]. The study pointed out the practical applicability of highly porous macroreticular (MR) ion-exchange resins, which were evaluated in terms of sorption potential. However, the rate and equilibrium data obtained for the sorption of SO2 and H2S in [13] showed that the MR ion-exchange resins considered were not proper for commercial removal of these gases. When evaluated for the removal of NO2, they exhibited excellent sorption but poor desorption characteristics. The results obtained were interpreted in view of the mechanism assumed for the complex sorption and desorption processes.
Strongly basic anion-exchange resins containing quaternary ammonium functionality and fluoride, or acetate anions, were investigated for the removal of CO2 and H2S from gas mixtures [14]. The author suggested regeneration of the resins containing absorbed CO2 or H2S by purging with an inert gas.
Fixed-bed adsorption of sulfur dioxide and carbon dioxide on a MR styrene-divinylbenzene anion-exchange resin was studied in [15]. A high adsorption capacity was observed for sulfur dioxide, with significant heat of sorption effects. The mechanism of adsorption was found to be physisorption, with heats of adsorption in the range of 1 × 10⁷ to 4 × 10⁷ J/kmol. This led to the conclusion that the resin could be easily regenerated with a temperature swing over a narrow temperature range. An important practical result was that at sulfur dioxide concentrations typical for flue gases from high sulfur-containing coals, over 1500 bed volumes of gas could be treated at a high column utilization. In flue gas desulfurization, it is necessary to take into account the presence of CO2, which reduces the bed capacity due to competitive adsorption between SO2 and CO2. The studies of fixed-bed adsorption in [16] of flue gas with a ratio of the components [CO2]:[SO2] = 50:1, observed a 10–15% decrease in the adsorption capacity. The authors suggested FGD in a fixed bed of a synthetic anion-exchange resin and sorbent reactivation with a concentrated solution of Na2SO3 or (NH4)2SO3. The results showed that the volumetric mass transfer coefficient of the suggested desulfurization method was several times higher than that of absorption in a packed bed column, but high pressure drop was mentioned as a problem that needed to be further investigated.
Chen and Pinto presented a study on the adsorption and regeneration capacity of commercial MR ion-exchange resins for small-scale desulfurization applications [17]. The authors state that the use of polymeric resins in large-scale utilities is limited, because the resin capacity rapidly decreases with the increase in temperature, while this problem is somewhat smaller in small-scale applications. The study determined the absorption isotherms for sulfur dioxide, nitrogen dioxide, and carbon dioxide, and obtained data on the mechanical and thermal stability of the resins. The Langmuir model and the Vacancy Solution Model were used successfully to correlate the SO2 adsorption data.
A very wide variety of methods using ion-exchange resins have been proposed for the removal of ionic species from water in the treatment of drinking water and industrial wastewaters [18,19,20]. A method for selective sulfate removal from hard wastewater (e.g., from neutralizing acid mine drainage) is proposed by the invention [21] with anion-exchange treatment. The invention utilizes carbon dioxide gas to control pH. The anion-exchange resins, loaded with sulfate, can be regenerated by treatment with a solution or a slurry containing lime and/or caustic solution, to produce a solid calcium sulfate (gypsum) and a liquid regenerant. Another anion-exchange, resin-based desulfurization concept is proposed for the removal of alkali metal sulfates from waste created by FGD systems [22]. The aqueous solution, containing alkali metal ions and sulfate ions, is passed through a weak base anion-exchange resin. The resin can be regenerated by treatment with ammonium hydroxide solution, followed by contact with carbon dioxide to obtain commercially useful by-products, namely a fertilizer product, or ammonia and gypsum.
Gao et al. propose an improvement of amine-based CO2 capture from flue gases by using ion-exchange resin for removal of SO2 [23]. The latter is one of the main factors causing a loss of free amine, which may lead to an increase in energy consumption for CO2 capture. Ion-exchange resins are employed in a technology that competes with nanofiltration, distillation and electrodialisis for the purpose of recovery of amine solutions used in purification of natural gas from CO2 and H2S [24].
A strong base amphoteric anion-exchange resin was prepared by Matsuura et al. and investigated for separation of sulfuric acid and monosaccharides by simulated moving bed chromatography in ethanol production from bamboo [25].
Our previous study (Part 1) [26] evaluated seven commercial synthetic anion-exchange resins and a zeolite, for the removal of SO2 at concentrations near the maximum for flue gases from coal power plants using treatment with a water–resin slurry. The absorption of SO2 in water, which produces sulfurous acid (H2SO3), is followed by adsorption of the acid by the ion-exchange resin. The experiments were performed by mixing the dry granular resin (1–5 g) with 100 mL of sulfurous acid (at concentration of 1 g/L) in a closed flask for a fixed time with constant stirring. Based on the investigation of adsorption and desorption capacity, and time and efficiency of adsorption and desorption, AmberLite® FPA66 (formerly Dowex® 66) of Sigma-Aldrich Co., St. Louis, MO, USA was selected as the most promising resin for the purpose of removing sulfite anions with successive desorption and resin regeneration.
The present work aims to obtain new information about the limits of applicability of anion-exchange resins in flue gas desulfurization. There are contradictory opinions about the scale of the feasible systems. This study is directed towards evaluating the potential of the proposed desulfurization process and investigating its advantages in comparison to the existing methods. CFD simulation results were obtained to design and fabricate a laboratory-scale tray column for an experimental study of SO2 removal from a model flue gas at different initial SO2 concentrations. A bubble-cap gas distributor was designed and fabricated by additive manufacturing method (3D printing). It was tested numerically and experimentally to obtain new data for the proposed desulfurization technique.

2. Investigation Methods and Experimental Set-Up

The present study is directed towards development of a practically waste-free FGD technology in a tray column, Figure 1. The proposed absorption–adsorption method [27,28] includes absorption of SO2 in water with simultaneous adsorption of the resulting H2SO3 from the water with a synthetic anion-exchange resin. The adsorbent is regenerated with a solution of NH3, followed by decomposition of the obtained (NH4)2SO3 with HNO3. The products of the processes are pure gaseous (or liquefied) SO2, and aqueous solution of NH4NO3. The conceptual diagram in Figure 1 is the starting point for designing the experimental set-up for the present study.
The integrated absorption–adsorption process (Figure 1) [27] for SO2 removal from flue gases is carried out in a tray column (1), provided with an inlet pipe (2) at the bottom for the supply of flue gas and an outlet pipe (3) at the top for the removal of the purified gas. The column is connected to a sorbent regeneration system (9). The sorbent is a synthetic anion-exchange resin suspended in water. The gas flow keeps the mixture homogeneous and prevents the settling of the resin. In the interior of the column (1) there are horizontal bubble-cap trays (4), each having vertical risers (5) and bubble caps (6) for gas distribution. In the zone between each two trays, an inlet pipe (7) and an outlet pipe (8) are connected to the column wall for periodic feeding and removal, respectively, of the sorbent suspension. The outlet pipe (8) of each tray (4) is connected to the sorbent regeneration system (9). The regenerated liquid sorbent is transported by a pump (10) to the inlet pipes (7). When the sorbent of a tray reaches its saturation capacity, it is removed through an outlet pipe (8) and after regeneration in the system (9) it is returned through an inlet pipe (7) for reuse in the column. The trays undergo regeneration cycles one at a time, while the others continue to operate.
Designing the bubble-cap tray is fundamental for the efficiency of purifying large gas volumes. The gas holdup in the sorbent slurry is chosen as a characteristic parameter of the inter-phase mixing intensity and the proper operation of the column. The gas holdup is the gas volume fraction in the total volume of the gas–liquid–solid mixture. A good contact between the three phases of the flow—the liquid, the gas, and the solid particles of the anion-exchange resin—is a prerequisite for a high mass transfer rate. The gas holdup is directly dependent on the performance of the bubble-cap tray.
The design of the bubble-cap tray included the following steps:
  • Determination of the flow conditions, in accordance with the experience and the data in the literature on bubble-cap trays, as well as the scale of the laboratory model;
  • Dimensioning of the model, according to the liquid level, the column diameter, and the gas velocity;
  • Testing different configurations of the bubble-cap tray by CFD simulation of the fluid flow. Analysis of the results leads to the proper configuration of the bubble-cap tray.
Based on the results obtained from the previous steps, a 3D CAD model of the bubble-cap tray column was developed. As part of an in-depth study of the hydrodynamics of a bubble-cap tray, the present work is focused on the specific two-phase flow regime on a tray with a single bubble cap, presented in Figure 2. The bubble-cap tray is intended to operate at a liquid level significantly higher than is generally accepted for tray columns due to the need for a sufficient amount of liquid to capture the sulfur dioxide from the gas stream. On the other hand, the high level of the liquid leads to a significant increase in the pressure drop of the gas flow, which is unfavorable in terms of the energy consumption of the processes. The liquid level also determines the height of the bubble cap, which must not allow leakage down the tray in the absence of gas flow. Therefore, simulations were performed with a liquid level H0 = 300 mm (Case 1) and H0 = 150 mm (Case 2) and the results were compared. The gas is distributed by a bubble-cap with an outside diameter d = 80 mm for both cases and a height h = 360 mm for Case 1 and h = 180 mm for Case 2. The bubble cap has 12 rectangular slots 20 mm high and 10 mm wide in both cases. The riser cross-section surface area, the reversal area, and the escape area of the bubble cap are balanced with almost equal values for all areas.

2.1. CFD Model Details

The two-phase flow of liquid and gas is modeled by the Eulerian approach [29], which allows for the description of two separate interacting phases. The laws of conservation of mass and momentum are satisfied for each phase.
𝜕 ( α q ρ q ) 𝜕 t + . α q ρ q U q = 0 ,
where q is a suffix denoting the phase, q = g for the gas phase and q = l for the liquid phase.
The sum of the volume fractions of liquid (αl) and gas (αg) is equal to 1:
α g + α l = 1 .
The transient Reynolds averaged momentum conservation equation for phase q is:
𝜕 α q ρ q U q 𝜕 t + . α q ρ q U q U q = α q P τ q ̿ + α q ρ q g + M p q   ,
where U q is the time averaged velocity of phase q, M p q is the inter–momentum exchange term between the two phases p and q, which accounts for inter–phase coupling forces, P is the pressure shared by the two phases, τq is the stress-strain tensor of phase q, and ρq is the density of phase q.
Turbulence was modeled by the realizable “k-ε” model [29] with the corresponding transport equations of turbulent kinetic energy (k) and the turbulent kinetic energy dissipation rate (ε) for each phase. The conservation equations were solved by the CFD software ANSYS Fluent 2023 R1, based on a finite volume numerical method. The flow on the tray was modeled as a two-phase water–air system. It was accepted that the presence of the solid particles of the anion-exchange resin (with density close to that of water and a maximum particle diameter of about 0.5 mm) had a negligible effect. The computational domain (Figure 2) represented the volume of the column section outside the bubble cap. It was accepted that the liquid was the primary (continuous) phase, and the gas was the secondary (dispersed) phase. The boundary conditions (BC) were as follows: at the surfaces of the bubble-cap slots (Figure 2)—velocity inlet BC with a specified uniform gas velocity and a 100% gas volume fraction; at the gas outlet of the compartment—pressure outlet BC with a gas volume fraction of 100%. Transient solution was performed starting with a time step of 0.0001 s, which was increased in the calculation process to 0.001 s. The convergence criteria for all equations were scaled residuals equal to 10−4.

2.2. Additive Technology

The components of the experimental set-up in the present work were manufactured using Fused Deposition Modeling [30,31]. With this technology, the object is created by melting plastic filaments. The filament is extruded through heated nozzles. The thermoplastic polymer is deposited on the printing bed layer by layer and solidifies after cooling. In the present work, PETG (Polyethylene terephthalate modified with glycol) is chosen, on the basis of its affordable price, availability, non-toxicity, and durability. The polymer is tested in an aqueous phase for chemical resistance in the acidic pH range (1–5) measured in the solution of the present experiments.

Manufacturing of the Bubble-Cap Tray

The bubble-cap tray was manufactured in the following steps:
  • Adapting the 3D CAD model of the bubble-cap tray in accordance with the 3D printer’s working volume and the properties of the material used;
If necessary, the object could be divided into several parts. In this case, no dividing was needed. The dimensions of the bubble cap are presented in Figure 3a. The cap height is 176 mm, the cap outside diameter is 80 mm, and the inside diameter is 76 mm. There are 12 slots at equal distances. The height of each slot is 19 mm and the width is 10 mm. The tray (Figure 3b) has a rebated edge, designed to fit the 200 mm inside diameter of the column. The tray thickness is 4 mm. The outside diameter of the tray is 215 mm. The bubble cap is mounted in the center of the tray into a circular groove that is 4 mm wide. The gas riser is connected into an orifice with a diameter of 50.05 mm in the center of the tray.
2.
Reprocessing (slicing) of the 3D CAD model by specialized software and setting of the printing machine;
3.
Drying of the polymer before printing to ensure the necessary quality of the part;
4.
Test printing of a test object before printing the main part;
5.
Printing of the physical model (for the bubble cap it took about 12 h; for the tray—about 8).

2.3. Choice of Anion-Exchange Resin

Detailed information on the evaluation and selection of a suitable synthetic anion-exchange resin is presented in Part 1 of the investigation [26]. The anion-exchange resins compared there are commercially available and have been selected based on their size, functional groups and adsorption mechanism. Sulfurous acid with a concentration of 1.6 ± 0.2 g/L was used to simulate the water absorption process of capturing SO2 from flue gases. This concentration is consistent with the maximum sulfur dioxide concentration in flue gases and Henry’s law. The anion-exchange resin AmberLite® FPA66 has been chosen from eight candidates for the novel technology being investigated in the current work.

2.4. Experimental Set-Up

A scheme of the experimental set-up is presented in Figure 4.
The main unit of the experimental set-up was a glass column (C) with an inside diameter of 200 mm (Figure 4b). It contained the 3D-printed tray with a single bubble cap for gas distribution (Figure 3). The sorbent used was an anion-exchange resin in distilled water and the homogeneity of the suspension was maintained by means of the gas flow. It was filled up to a certain level above the tray before operation and it was removed for regeneration after operation. Air at room temperature was fed by a centrifugal ventilator through PP pipes with OD = 50 mm. The air was mixed with pure SO2 coming from a pressurized gas cylinder. The air flow rate was controlled by a spherical valve and measured with a Prandtl tube inserted into the gas pipe (FC 1, Figure 4a). The Prandtl tube was connected to a portable gas analyzer system (Optima 7 MRU). The SO2 flow rate was controlled by a rotameter equipped with a manual valve (FC 2). The gas mixture entered the column from the bottom and bubbled through the slots of the bubble cap into the liquid sorbent. The SO2 concentration of the purified gas was measured by inserting the probe of the gas analyzer (G) into the gas outlet pipe. The pressure drop of the tray column was measured with mechanical manometers at the column inlet (PI 1) and at the outlet (PI 2) (manometer range 98 kPa, accuracy 0.4%) and some experimental runs were repeated with a differential water-filled U-tube manometer measuring the pressure difference between the inlet (PI 1) and the outlet (PI 2).

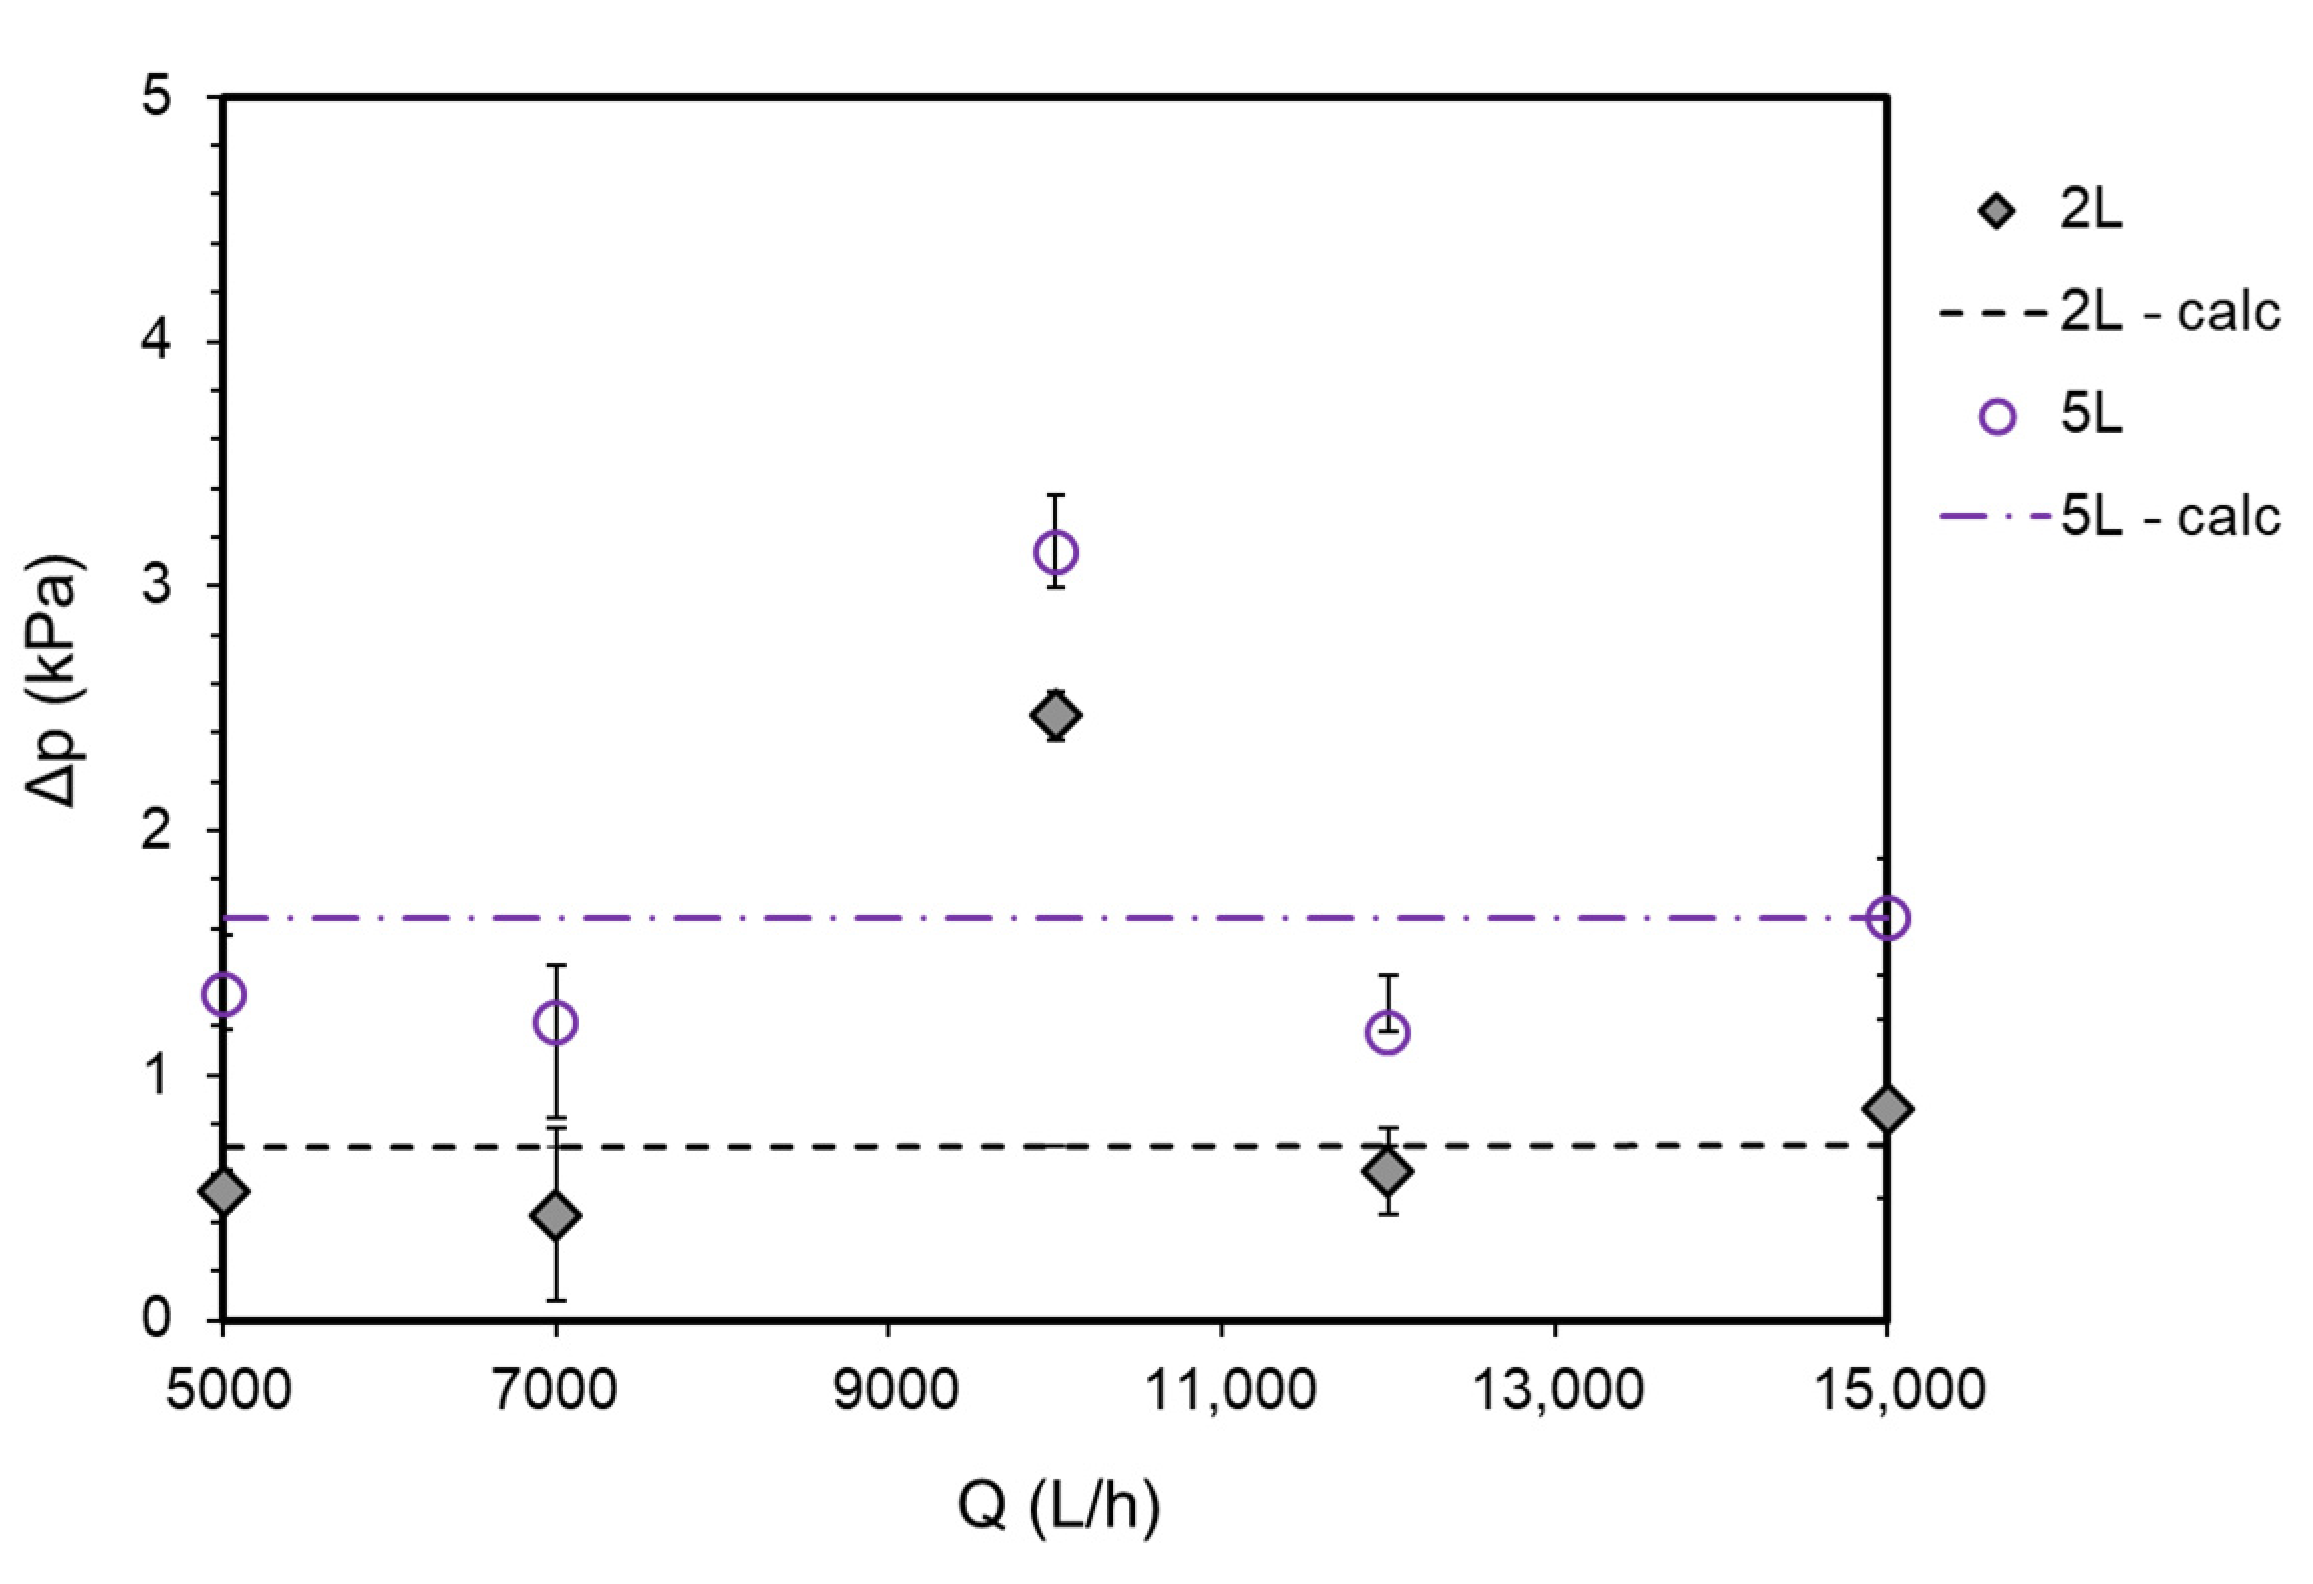
2.5. Pressure Drop Measurements

The pressure drop of the installation was measured at different volumes of pure distilled water [1–5] L, which corresponded to the water levels on the tray in the absence of gas flow H0 = [40–170] mm. The measurements were averaged from 3 runs. The regimes investigated included gas flow rates Q = [5000–15,000] L/h, corresponding to average velocity at the surface area of the slots wG = [0.6–1.8] m/s, respectively (calculated by dividing the flow rate by the total surface area of the slots). The measurements were performed by increasing and decreasing the gas flow rate, observing negligible hysteresis effect [32] (p. 109). Additionally, it was experimentally determined that adding 250 g or 500 g anion-exchange resin into the water had a negligible effect on the pressure drop.
The pressure drop of a bubble-cap tray can be calculated by the equation [33] (p. 576):
p = p 1 + p 2 + p 3 + p 4 .
Δp1 (Pa) is the pressure drop of the dry tray with fully open slots, calculated from the relationship:
p 1 = ξ γ G w G 2 2 g ,
where γG = 11.81 N/m3—specific weight of air (20 °C); wG—gas velocity in the slots of the bubble cap (m/s); ξ = [1.5–2] coefficient of resistance (the calculations were performed with the maximum value of the coefficient).
Δp2 (Pa) is the pressure drop due to surface tension forces, calculated by:
Δ p 2 = 2 σ ( 1 l + 1 b ) ,
where σ = 0.0728 N/m—surface tension at a water–air interface (20 °C); l—height of slots (m); b—width of slots (m).
Δp3 (Pa) is the hydrostatic pressure of the liquid column at the open slots.
Δp4 (Pa) is the static pressure of the liquid column above the upper edge of the slots, calculated by:
Δ p 3 + Δ p 4 = γ w 1 2 l + h p ,
where hp—distance from the upper edge of the slots to the liquid level of the tray (m); γw = 9807 N/m3—specific weight of water (20 °C).

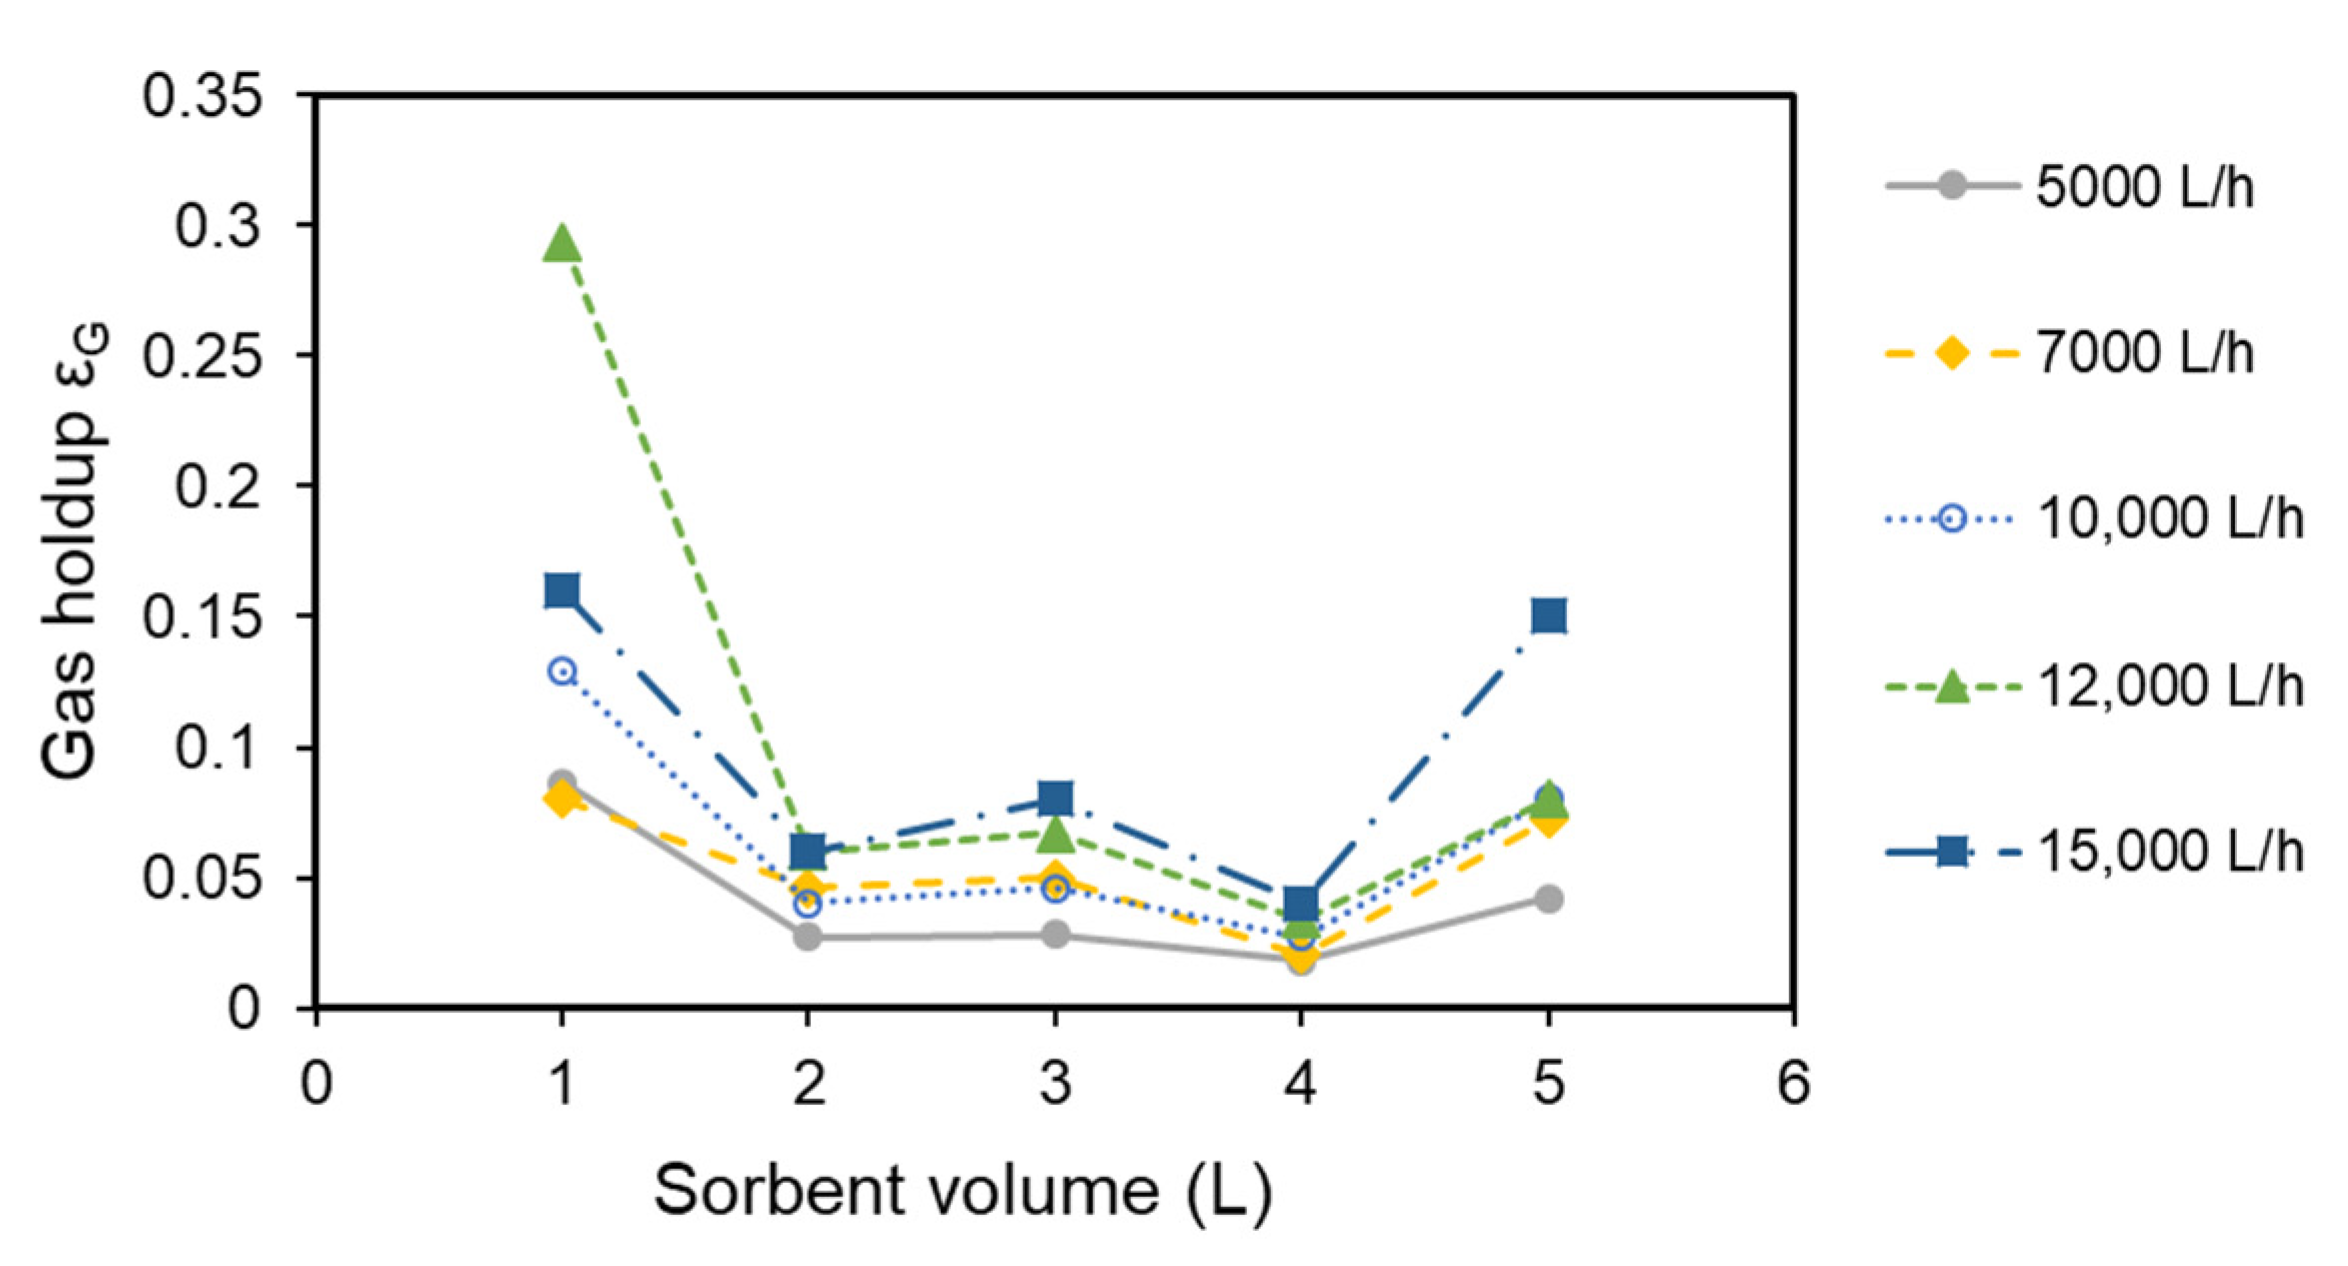
2.6. Gas Holdup Measurements

Gas holdup was determined by measuring the liquid level in the absence of gas and at a given gas flow rate using the equation:
ε G = 1 H 0 H ,
where εG—gas holdup; H0—height of the liquid level in the absence of gas (mm); H—height of the liquid level at a given gas flow rate (mm).
The gas bubbling leads to large vortices of the two-phase flow and waves at the free surface with strong pulsation of the surface level in time and space. The level at a given gas flow rate is determined as the average horizontal line between the maximal and minimal height, after reaching a stationary regime.

2.7. Kinetics of the Gas Absorption–Adsorption Process

The investigation of the sorption was carried out at gas flow rates of 5000 L/h and 15,000 L/h and inlet concentrations of sulfur dioxide of 1500 ppm (v/v) and 3600 ppm (v/v). The volume of the suspension was 4.5 L. The Optima 7 MRU portable gas analyzer [34] was used for SO2 concentration measurement at the inlet and outlet of the installation, while iodometric analysis following Ferguson was used for the liquid phase [35]. Three sets of experiments were carried out—with 0 g (distilled water only), 250 g, and 500 g of an anion-exchange resin suspended in 4.5 L of distilled water. Desorption of the sulfite anion from the resin was conducted with 0.8% v/v NH3, as described in [26].

3. Results and Discussion

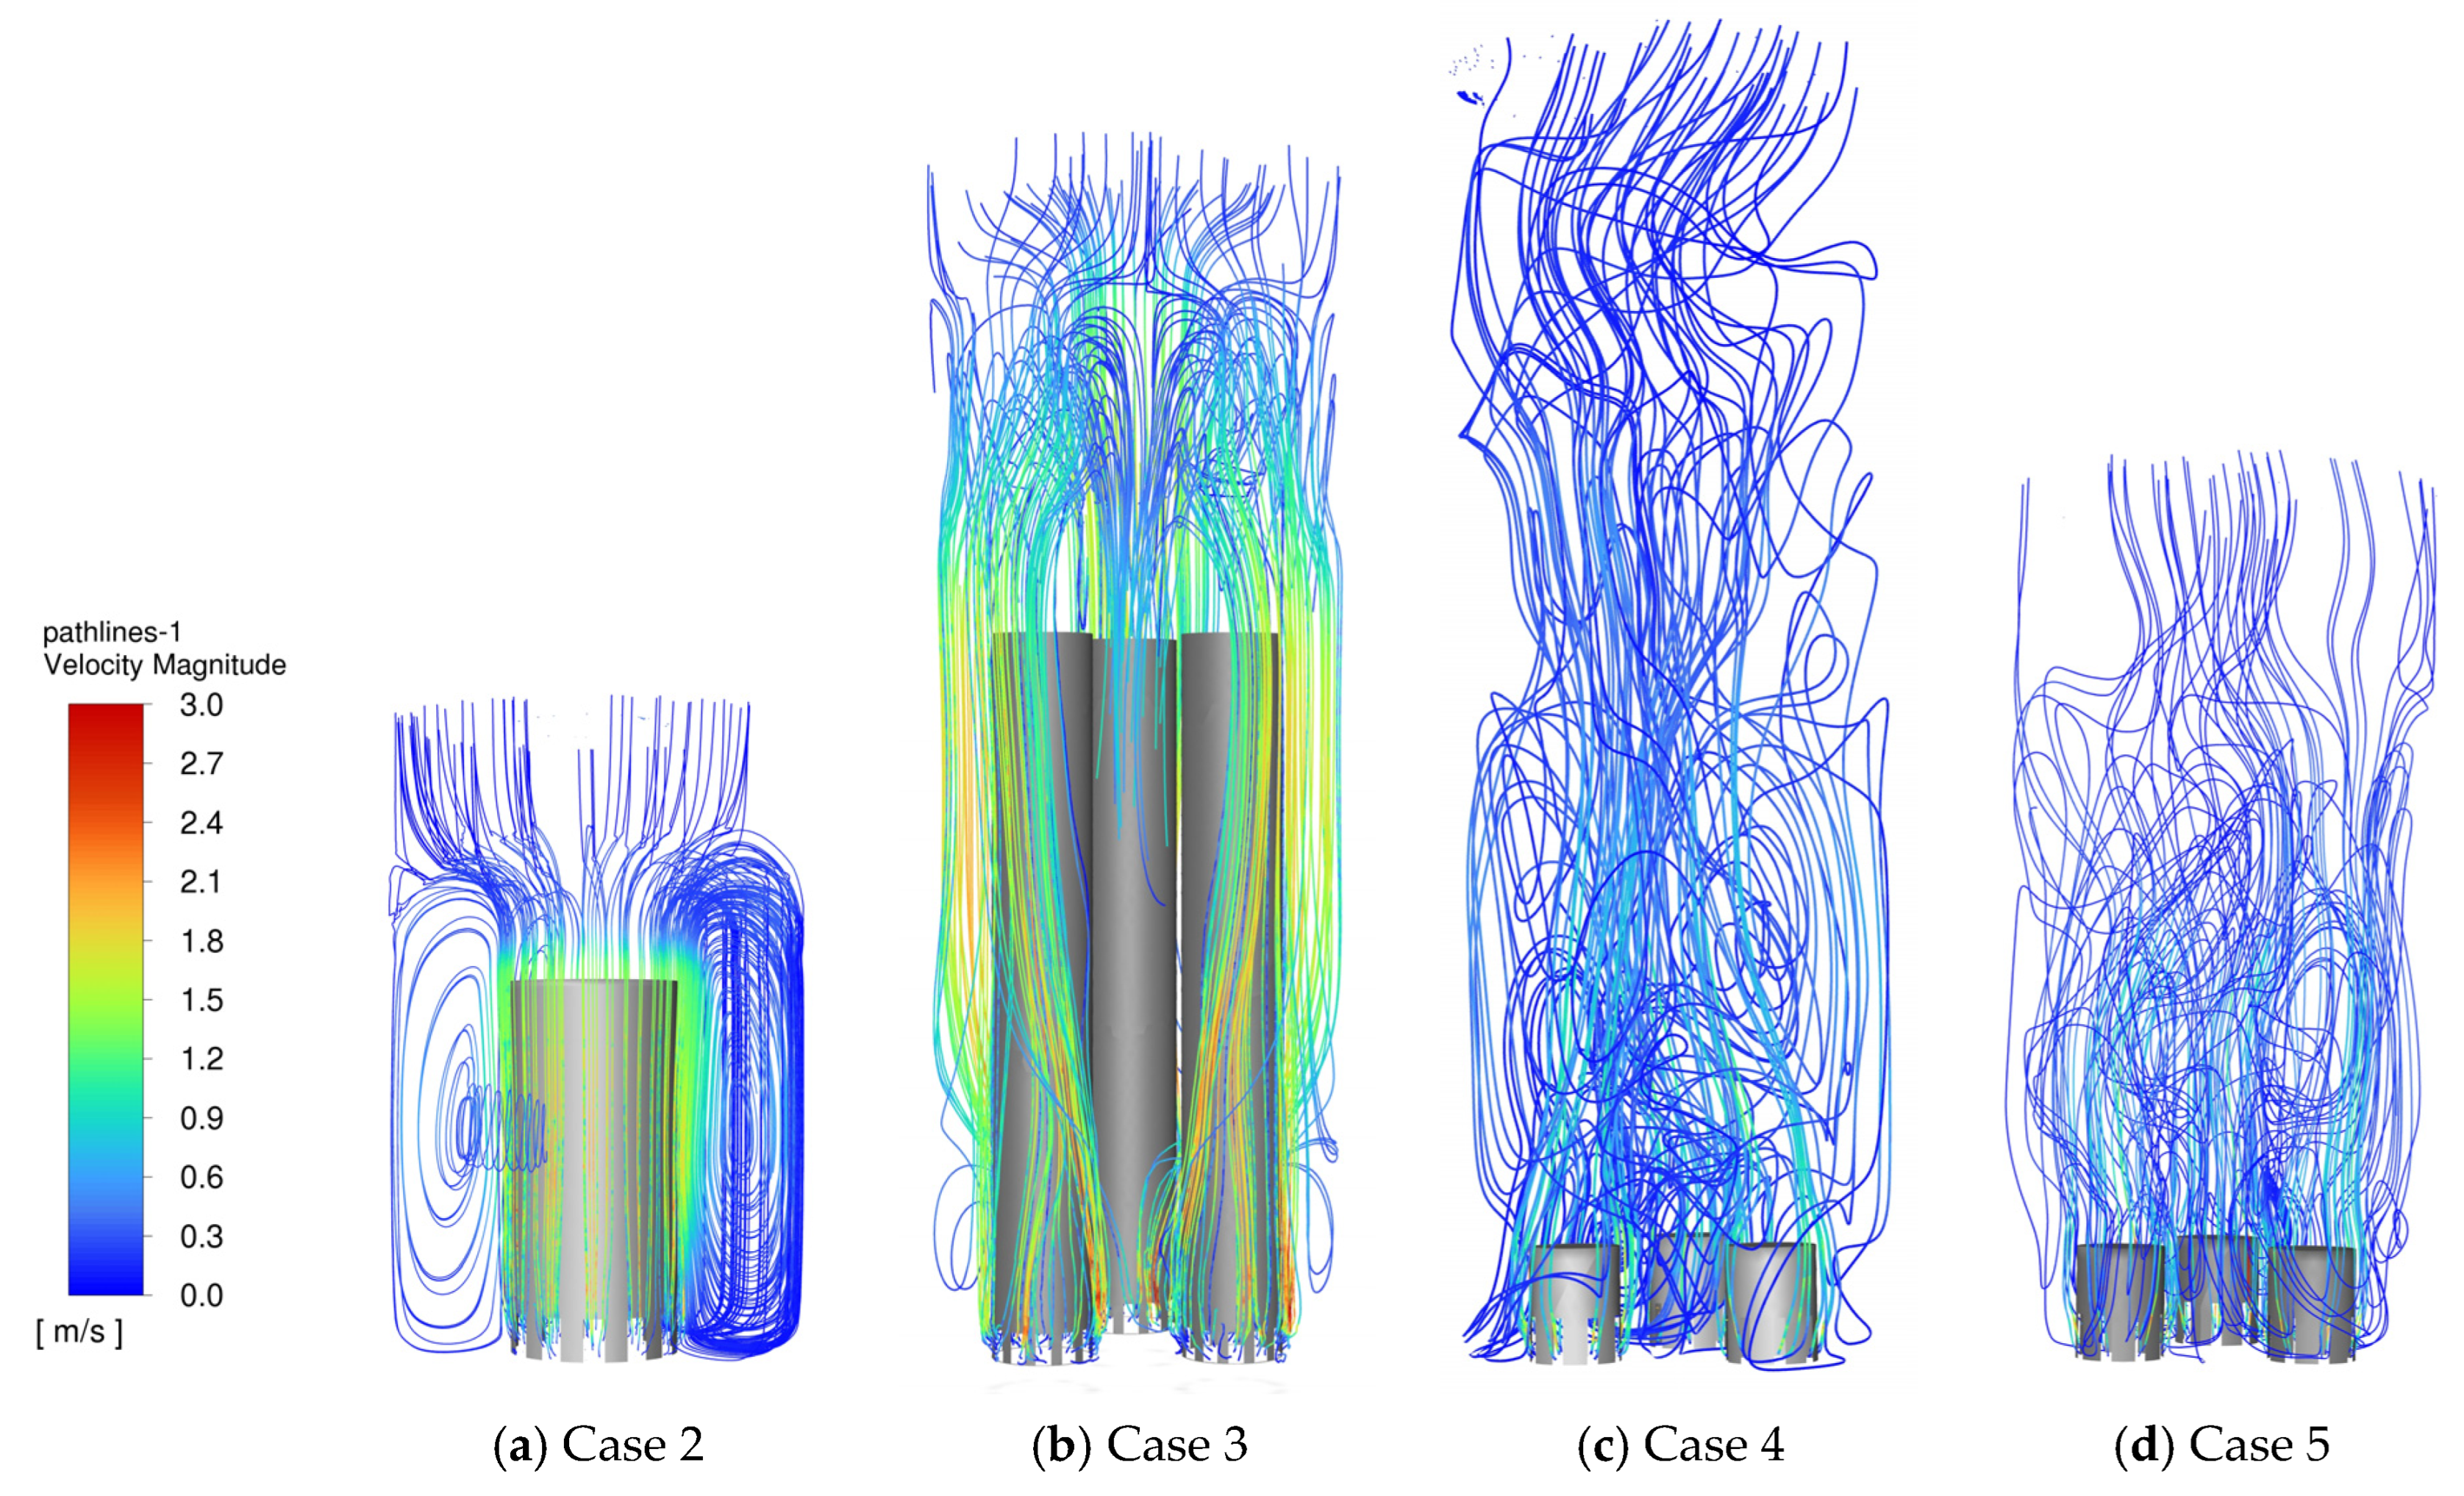
3.1. CFD Simulations

3.1.1. Reference Bubble-Cap Design

Case 1:
A 3D model of the cylindrical column section with one tray (Figure 2) with a diameter D = 200 mm and a height Hs = 500 mm was generated. The liquid level above the tray was H0 = 300 mm. The air was distributed by a cylindrical bubble cap with an outside diameter d = 80 mm and a height h = 360 mm, with 12 evenly cut rectangular slots with a height of 20 mm and a width of 10 mm. The flow over the tray was modeled as a two-phase water–air system. It was assumed that the slots are completely open and unoccupied by liquid and the gas velocity is uniform over their entire surface. The computational domain was discretized by a hexahedral grid of about 400,000 cells. The grid was selected after performing a grid independence test with three different cell numbers (260,000, 400,000, and 800,000). It was found that the value of the average gas volume fraction (holdup), chosen as a criterion, above 400,000 cells differs by less than 1%. A stationary flow regime was established after about 2 s—the time it took for air bubbles to reach and leave the free surface of the liquid.
Figure 5a shows the gas holdup distribution at 2 m/s inlet gas velocity. Figure 5b presents the gas holdup averaged over cross-sections at various heights (z) above the tray at inlet gas velocities [0.5, 1, and 2] m/s.
Figure 5a shows a zone of poor mixing on the tray where the gas rises as a thin layer along the walls of the bubble cap without interacting with the liquid. Intense mixing occurs near the free surface, where the gas holdup increases and strong phase circulation is induced. This pattern is weakly dependent on the inlet gas velocity (Figure 5b). The height of the zone of poor mixing is about 80% of the initial liquid level height (H0) in all cases. The results presented show that mixing can be improved by reducing the poor-mixing zone. This can be achieved by lowering the liquid level and/or increasing the number of bubble caps per tray. Both strategies are demonstrated and explored further below.

3.1.2. Enhancement of Mixing by Lowering the Liquid Level

Case 2:
A numerical experiment was carried out following the conclusions above regarding the problematic zones of poor mixing on the tray and the applicable strategies to reduce them. To reduce the zone of low gas holdup, the height of the liquid volume was lowered. A 3D model of a cylindrical section was created with the same diameter, but reduced height and liquid level (Hs = 300 mm and H0 = 150 m, respectively). The dimensions of the bubble cap were as follows: an outside diameter d = 80 mm and a height h = 180 mm. A tetrahedral mesh with about 500,000 cells was generated in the computational domain. The same model assumptions and boundary conditions were adopted as in the geometry of Case 1. The simulations confirm that the zone of poor mixing is much smaller (Figure 6a,c) compared to that of Case 1 (Figure 5a).
The configuration of Case 2 was chosen to serve as a basis for the design and fabrication of a physical model of the single-tray column with a single bubble cap. The comparison of the air volume fraction distribution from the simulation (Figure 6a–c) and photographs of the gas bubbling in the physical model of the column section (Figure 6b,d) testify to the good agreement between model and experiment in terms of liquid level and flow pattern.

3.1.3. Enhancement of Mixing by Increasing the Number of Bubble Caps

Case 3:
A 3D model of a cylindrical compartment was composed with the same dimensions and the same liquid height as those in Case 1, with three bubble caps (outside diameter d = 40 mm and height h = 360 mm) arranged at the apexes of an equilateral triangle. Each bubble cap had eight slots—5 mm wide and 20 mm high, so that the total gas inlet surface area of all bubble caps was equal to the inlet surface area of the single bubble cap in Cases 1 and 2. The computational domain was discretized by a tetrahedral grid of ca. 1,000,000 cells. The simulation results show intensification of mixing with reduced zones of poor mixing and higher values of the gas holdup, represented in Figure 7 (line 1), compared to the cases with one bubble cap (Figure 5b). However, in Case 3, the three bubble caps occupy a great part of the compartment volume, reducing the available volume for both the sorbent and the mixing of the phases. This disadvantage can be avoided by a submerged configuration of the bubble caps, which leads to Case 4.
Case 4:
An additional simulation with three submerged bubble caps (diameter d = 40 mm and height h = 50 mm) was performed with the same compartment height and liquid level as those in Case 3. The results of the simulation (with a tetrahedral grid of 700,000 elements and mesh refinement near the cap wall) show that this configuration is more favorable in respect of maximum gas holdup and minimum zone of poor mixing, see Figure 7 (line 2). However, at 2 m/s inlet gas velocity, after 3 s of flow time, the liquid phase is dispersed into the gas phase above the bubble caps and leaves the compartment, carried by the gas stream, which is known as a flooding regime. Here, the flow time indicates the predicted time for the transient flow to evolve from the initial conditions to the presented picture. The undesirable flooding of the column occurs when the gas velocity exceeds the settling velocity of liquid droplets [36]. The flow regimes of the two-phase flow, including the flooding regime, need further investigation, which is not included here.
Case 5:
Lowering the liquid level by half (to 150 mm) did not eliminate the flooding effect at 2 m/s inlet gas velocity. The simulation results (with a tetrahedral grid of 500,000 elements and mesh refinement near the cap walls) for the gas holdup of Case 5 are presented in Figure 7, lines 3 (2 s flow time) and 4 (3 s flow time). The two plots (3 and 4) demonstrate the increase in the holdup with time at a given height (z) of the compartment. For z = 0–110 mm, the holdup is close to the values for one high bubble cap with the same liquid level (Case 2, line 5), while it is up to two times higher than in Case 2 for z = 110–180 mm. Case 5 provides better mixing conditions (lines 3 and 4) than the configuration with high caps (line 1 and 5), where the gas flow tends to flow near the vertical cap wall and bypasses the rest of the liquid volume. However, the configuration with one high cap (line 5) provides acceptable values of the gas holdup for most of the liquid height.
Figure 7 and Figure 8 demonstrate the effect on the holdup of the two approaches to improve mixing. In the configuration with one high cap, the decrease in the level of the liquid volume on the tray leads to a decrease in the zone of poor mixing (εG < 0.1) from 80% (Figure 5b) to 50% (Figure 7, line 5) of the liquid height (H0). The increase in the number of the bubble caps (Case 3) eliminates the zone of poor mixing (εG < 0.1) (Figure 7, line 1).
The comparison of the submerged configurations with two different liquid heights (Figure 7, lines 2 and 4) shows that higher liquid volume results in higher gas holdup for z = 0–120 mm because of the higher resistance of the liquid medium. The resulting stronger displacement of liquid in a vertical direction leads to lower gas holdup for z > 120 mm.
Figure 8 presents a comparison of the predicted liquid flow pathlines in the investigated configurations at 2 m/s inlet gas velocity. It confirms that the submerged configuration, which is commonly used in practice, is the most favorable for good mixing of the phases, but the proper regime of operation requires further investigation. The course of the pathlines of this configuration (Figure 8c,d) demonstrates intensive mixing with smaller scale of the vortices and more regular velocity distribution in the liquid volume in comparison to the configurations with high caps (Figure 8a,b). The zones of high velocity near the cap wall in these figures represent a strong maldistribution of the phases, which is unfavorable for the separation process.
As a result of the numerical experiments, the configuration with one high bubble cap (Case 2) was selected for the physical model of the bubble-cap tray. It offers acceptable hydrodynamic conditions, simpler fabrication of a single bubble cap and the convenience of filling the compartment with the sorbent before the start of the operation, with no liquid leakage in the absence of gas flow.

3.2. Experimental Results for Pressure Drop and Gas Holdup

The calculations by Equations (4)–(7) show that the pressure drop is almost equal to the hydrostatic pressure of the liquid column on the tray, which is determined by the liquid height and is almost independent of the gas velocity. The tray pressure drop was obtained by subtracting the measured pressure drop of the column section without the tray from the pressure drop of the fully equipped column with the tray filled with the sorbent. It is in agreement with the pressure drop calculations (Figure 9). The figure shows that the points are quite scattered and at low flow rates the standard deviation reaches 85% of the average value of the measured pressure drop because of strong flow pulsations.
Figure 10 presents the gas holdup (Equation (8)) as a function of the sorbent volume, i.e., the liquid level on the tray at a constant gas flow rate. At a low liquid level, the gas forms larger gas bubbles, the liquid is strongly dispersed, and the holdup is relatively high. At higher liquid levels, a region of a low holdup follows, which is characterized by smaller gas bubbles with a more uniform distribution. Further increasing the liquid level results in an increase in the holdup because of the higher resistance of the liquid on the movement of the gas bubbles. The measurements confirm the simulation results for this configuration—that the gas holdup value is relatively low, in the range of [0.1–0.3]. The measurement precision of the liquid level was 5 mm and the standard deviation reached 5% of the average values.

3.3. Kinetics of the Gas Absorption–Adsorption Process

The results for SO2 removal at various operating regimes are compared in Figure 11. The figure shows three distinct regions of removal efficiency η, defined by Equation (9):
η = ( C 0 C e ) C 0 × 100 % ,
where C0—inlet SO2 concentration (ppm); Ce—outlet SO2 concentration after sorption (ppm).
SO2 inlet concentration was C0 = 1500 ppm (Figure 11, lines 1,2,4,5) and C0 = 3500 ppm (Figure 11, line 3), which was in the typical range for coal combustion flue gases from power plants (from 4 mg/L reported in [15] to 20 mg/L from lignite coal in [37]). During the first [5,6,7,8,9,10] min the outlet SO2 concentration Ce increases and the efficiency η decreases rapidly with a gradient close to that of line 5 (Figure 11) of pure water as a sorbent. This stage is followed by a period of almost constant η, followed by a second period of a rapid decrease. This course of the curve can be explained with the consecutive absorption of sulfur dioxide by the water and adsorption by the anion-exchange resin. The period of efficient SO2 removal with a constant low outlet concentration Ce continues until the resin adsorption capacity starts to decrease, leading to an increase in Ce. The bubble-cap tray can operate efficiently at least until the period of constant high η without the need to stop operation for sorbent regeneration. In that region of the plot, the sorption efficiency η is in the range of [92–95]%, which is lower than the reported efficiency for fixed-bed adsorption of 98% in [16] and up to 100% (Ce = 0) in [15]. The comparison of plots 2 and 4 in Figure 11 confirms that the higher gas flow rate intensifies the mixing and the sorption rate. The time of efficient operation before the breakthrough shortens, but the gas treated per volume of dry resin G (m3/m3), Equation (10), at high efficiency increases, as observed also in [15].
G = ρ r Q t M r ,  
where ρr is dry resin density (kg/m3), Q—gas flow rate (m3/s); t—time of operation (s); Mr—mass of dry resin (kg) in the sorbent mixture.
The breakthrough time decreases with the increase in gas flow rate: 110 min for 5000 L/h (line 2) and 50 min for 15,000 L/h (line 4). The breakthrough time decreases with the increase in SO2 inlet concentration: 110 min for 1500 ppm (line 2) and 35 min for 3500 ppm (line 3). The breakthrough time increases with the increase in resin quantity in the slurry: 30 min for 250 g resin (line 1) and 110 min for 500 g resin (line 2). In the period before the breakthrough, η is lower at higher C0 (line 3) and at lower resin concentration (line 1). With the increase in gas flow rate, the maximal efficiency coefficient decreases from 95% (line 2) to 92% (line 4), which is most likely due to a shorter gas residence time. Figure 11 shows that the period of efficient tray operation in the tested regimes is in the range of [30–80] min. The gas treated per volume of dry resin at high efficiency is in the range from G = 5400 m3/m3 (line 3) to G = 17,500 m3/m3 (line 4). These values exceed the treated gas per bed volumes at high efficiency, reported for fixed-bed SO2 adsorption from flue gases with a dry anion-exchange resin, namely up to 1500 m3/m3 in [15] and up to 3000 m3/m3 in [16].

4. Conclusions

This work demonstrates the advantages of implementing modern techniques, like CFD modeling and additive manufacturing, in reactor design. A multidisciplinary holistic approach has been applied to develop an innovative reactor for removal of SO2 from flue gases. The simulation and experimental results obtained reveal the cumulative effect of combining absorption and adsorption processes, and complement the existing knowledge on the mechanism and the main factors affecting the efficiency of these processes.
Strategies of tray performance control were developed based on the resulting flow picture. The results show that mixing can be improved by reducing poor-mixing zones by lowering the liquid level and increasing the number of bubble caps. Both strategies were investigated and evaluated. For the configurations with one high bubble cap, lowering the liquid height by half reduces the zone of poor mixing from 80% to 50% of the liquid height and halves the tray pressure drop. The resulting reduction in sorbent volume can be compensated for by a higher resin concentration to prevent the decrease in time to saturation. The submerged configuration with three bubble caps and reduced liquid height seems most favorable in terms of mixing and regular phase distribution. However, the configuration with one high bubble cap and reduced liquid height was chosen for the experimental set up, due to the acceptable gas holdup results and the convenience of prevented liquid leakage in the absence of gas flow.
The experimental investigation of sorption kinetics provided new insights into the integrated absorption–adsorption process. The effect on the sorption efficiency of the gas flow rate, the SO2 concentration, and the resin concentration in the sorbent was studied. The higher values of these factors result in lower maximal efficiency and shorter time of operation before the breakthrough. The gas treated per volume of dry resin at high efficiency of the integrated method exceeds the values reported for fixed-bed adsorption of SO2 from flue gas at comparable SO2 concentrations. This result supports the viability of the proposed FGD technology.
Further design improvement requires optimizing the three-phase flow, enhancing mixing, and conducting further kinetic studies in the future. To bring the technology closer to practical application in industry, its scalability, long-term stability, and economic feasibility need to be considered.

Author Contributions

Conceptualization, E.R.-V.; funding acquisition, E.R.-V.; investigation, A.A., S.P., S.S., D.D.-A. and S.M.; methodology, D.D.-A. and E.R.-V.; visualization, S.P. and S.M.; writing—original draft, D.D.-A. All authors have read and agreed to the published version of the manuscript.

Funding

This research was funded by the Bulgarian National Science Fund, grant number KP-06-N37/11 from 6 December 2019.

Institutional Review Board Statement

Not applicable.

Informed Consent Statement

Not applicable.

Data Availability Statement

Data are available upon request from the corresponding author.

Acknowledgments

The access granted to the resources of the Multifunctional High Performance Computing Center at the Institute of Information and Communication Technologies of the Bulgarian Academy of Sciences is gratefully acknowledged.

Conflicts of Interest

The authors declare no conflicts of interest.

Nomenclature

bslot width (m);
C0inlet SO2 concentration in the gas before treatment (ppm v/v);
Ceoutlet SO2 concentration in the gas after treatment (ppm v/v);
doutside diameter of the bubble cap (mm);
Dinside diameter of the model section (mm);
Ggas treated per volume of dry resin (m3/m3);
hheight of the bubble cap (mm);
hpdistance from the upper edge of the slots to the liquid level of the tray (m);
Hheight of the liquid level at a given gas flow rate (mm);
H0height of the liquid level in the absence of gas flow (mm);
Hsheight of the model section for the CFD simulation (mm);
lslot height (m);
M p q inter–momentum exchange term between the two phases p and q, which accounts for inter–phase coupling forces (N);
Mrmass of dry resin in the sorbent mixture (kg);
Ppressure (Pa);
Qgas flow rate (L/h);
ttime of operation (s);
U q average velocity of phase q (m/s);
wGaverage gas velocity at the surface area of the slots (m/s);
zvertical coordinate (height) (mm);
Greek symbols:
αggas volume fraction (-);
αlliquid volume fraction (-);
αqvolume fraction of phase q (-);
γGspecific weight of air (γG = 11.81 N/m3 at 20 °C) (N/m3);
γwspecific weight of water (γw = 9807 N/m3 at 20 °C) (N/m3);
Δpgas pressure drop caused by the bubble-cap tray (Pa);
Δp1pressure drop of the dry tray with fully open slots (Pa);
Δp2 pressure drop due to surface tension forces (Pa);
Δp3hydrostatic pressure of the liquid column at the open slots (Pa);
Δp4static pressure of the liquid column above the upper edge of the slots (Pa);
εGgas holdup (gas volume fraction) (-);
ξcoefficient of slot resistance (ξ = 2) (-);
ηremoval efficiency (%);
ρqdensity of phase q (kg/m3);
ρrdry resin density (kg/m3);
σsurface tension at a water–air interface (σ = 0.0728 N/m at 20 °C) (N/m);
τq-stress-strain tensor of phase q (Pa);
Abbreviations:
BCboundary conditions;
CADcomputer aided design;
CFDcomputational fluid dynamics;
FCflow control;
FGDflue gas desulfurization;
ODoutside diameter;
MRmacroreticular;
PETGpolyethylene terephthalate glycol;
PPpolypropylene;
PIpressure indicator.

References

  1. The World Bank Annual Report 1998 (English); World Bank Group: Washington, DC, USA, 1988; Available online: http://documents.worldbank.org/curated/en/390771468320070967/The-World-Bank-annual-report-1998 (accessed on 28 November 2023).
  2. EPA Agency, USA. Available online: https://www.epa.gov/acidrain/acid-rain-program (accessed on 28 November 2023).
  3. 2022 Report on the State of the Ecology and Environment in China, Ministry of Ecology and Environment, PR China. Available online: https://english.mee.gov.cn/Resources/Reports/soe/SOEE2019/202312/P020231206607194894058.pdf (accessed on 11 January 2024).
  4. Wang, L.; Liu, C.; Meng, X.; Niu, Y.; Lin, Z.; Liu, Y.; Liu, J.; Qi, J.; You, J.; Tse, L.A.; et al. Associations between short-term exposure to ambient sulfur dioxide and increased cause-specific mortality in 272 Chinese cities. Environ. Int. 2018, 117, 33–39. [Google Scholar] [CrossRef] [PubMed]
  5. Srivastava, R.K. Controlling SO2 Emissions: A Review of Technologies; Nova Science: Washington, DC, USA, 2003. [Google Scholar]
  6. Kohl, A.L.; Nielsen, R.B. Chapter 7—Sulfur Dioxide Removal. In Gas Purification, 5th ed.; Elsevier: Amsterdam, The Netherlands, 1997. [Google Scholar]
  7. Atanes, E.; Nieto-Márquez, A.; Cambra, A.; Ruiz-Pérez, M.C.; Fernández-Martínez, F. Adsorption of SO2 onto waste cork powder-derived activated carbons. Chem. Eng. J. 2012, 211–212, 60–67. [Google Scholar] [CrossRef]
  8. Namba, H.; Tokunaga, O.; Hashimoto, S.; Tanaka, T.; Ogura, Y.; Doi, Y.; Aoki, S.; Izutsu, M. Pilot-scale test for electron beam purification of flue gas from coal-combustion boiler. Radiat. Phys. Chem. 1995, 46, 1103–1106. [Google Scholar] [CrossRef]
  9. Yan, W.; Ninghui, W.; Yimin, Z.; Yanbin, Z. SO2 removal from industrial flue gases using pulsed corona discharge. J. Electrostat. 1998, 44, 11–16. [Google Scholar] [CrossRef]
  10. Poullikkas, A. Review of Design, Operating, and Financial Considerations in Flue Gas Desulfurization Systems. Int. J. Energy Technol. Policy 2015, 2, 92–103. [Google Scholar] [CrossRef]
  11. Alexandratos, S.D. Ion-Exchange Resins: A Retrospective from Industrial and Engineering Chemistry Research. Ind. Eng. Chem. Res. 2009, 48, 388–398. [Google Scholar] [CrossRef]
  12. Cole, R.; Shulman, H.L. Adsorbing Sulfur Dioxide on Dry Ion Exchange Resins. Ind. Eng. Chem. 1960, 52, 859–860. [Google Scholar] [CrossRef]
  13. Vaidyanathan, A.S.; Youngquist, G.R. Sorption of Sulfur Dioxide, Hydrogen Sulfide, and Nitrogen Dioxide by Ion-Exchange Resins. Ind. Eng. Chem. Prod. Res. Develop. 1973, 12, 288–293. [Google Scholar] [CrossRef]
  14. Quinn, R. Ion Exchange Resins as Reversible Acid Gas Absorbents. Sep. Sci. Technol. 2003, 38, 3385–3407. [Google Scholar] [CrossRef]
  15. Chen, T.-W.; Pinto, N.G. Fixed-bed adsorption of acid gases on a macroreticular ion-exchange resin. React. Polym. 1991, 14, 151–168. [Google Scholar] [CrossRef]
  16. Boyadzhiev, K.; Pantofchieva, L.; Khristov, I. Sulfur dioxide adsorption in a fixed bed of a synthetic anionite. Theor. Found. Chem. Eng. 2000, 34, 141–144. [Google Scholar] [CrossRef]
  17. Chen, T.-W.; Pinto, N.G. Stability and equilibrium properties of macroreticular resins for flue gas desulfurization. Ind. Eng. Chem. Res. 1990, 29, 440–447. [Google Scholar] [CrossRef]
  18. Al-Asheh, S.; Aidan, A. A Comprehensive Method of Ion Exchange Resins Regeneration and Its Optimization for Water Treatment. In Promising Techniques for Wastewater Treatment and Water Quality Assessment; IntechOpen: London, UK, 2021. [Google Scholar] [CrossRef]
  19. Holub, M.; Pavlikova, P.; Balintova, M.; Smolakova, M. Application of ion-exchange resins for removing sulphate ions from acidic solutions. Chem. Technol. 2017, 68, 18–22. [Google Scholar] [CrossRef]
  20. Geraud, D. Ion Exchange Experiments—Water Softening and Deionization, 2016, 345, Honors Research Projects. Available online: http://ideaexchange.uakron.edu/honors_research_projects/345/ (accessed on 28 November 2023).
  21. Kratochvil, D.; Bratty, M. Selective Sulphate Removal by Exclusive Anion Exchange from Hard Water Waste Streams. United States of America Patent US8551340B2, 23 September 2014. [Google Scholar]
  22. Sheth, A.C.; Butler, W.A. Desulfurization Process. U.S. Patent 4917874, 17 April 1990. [Google Scholar]
  23. Gao, J.; Wang, S.; Wang, J.; Cao, L.; Tang, S.; Xia, Y. Effect of SO2 on the amine-based CO2 capture solvent and improvement using ion exchange resins. Int. J. Greenh. Gas Control 2015, 37, 38–45. [Google Scholar] [CrossRef]
  24. Ghorbani, A.; Bayati, B.; Poerio, T.; Argurio, P.; Kikhavani, T.; Namdari, M.; Ferreira, L.M. Application of NF Polymeric Membranes for Removal of Multicomponent Heat-Stable Salts (HSS) Ions from Methyl Diethanolamine (MDEA) Solutions. Molecules 2020, 25, 4911. [Google Scholar] [CrossRef] [PubMed]
  25. Matsuura, H.; Sun, Z.; Yanase, M.; Ihara, T.; Kida, K.; Jyo, A. Separation of Sulfuric Acid and Monosaccharides with a Strong-Base Anion Exchange Resin Containing Polystyrenesulfonate as Polymeric Counter Ion to Reduce Tailing of Sulfuric Acid. J. Ion Exch. 2014, 25, 81–87. [Google Scholar] [CrossRef]
  26. Stefanov, S.; Razkazova-Velkova, E. Integrated absorption-adsorption process for waste-free decontamination of gases from sulfur dioxide. Part 1. Choice of ion-exchange resin and adsorption and desorption parameters. Bulg. Chem. Commun. 2020, 52, 57–63. [Google Scholar]
  27. Boyadjiev, C.B.; Boyadjiev, B.C. Absorption-Adsorption Apparatus for Purification of Gases from Sulfur Dioxide. Bulgarian Patent 2196, 31 March 2016. (In Bulgarian). [Google Scholar]
  28. Boyadjiev, C.B.; Boyadjiev, B.C.; Doychinova, M.D.; Popova-Krumova, P. Method and Apparatus for Purification of Gases from Sulfur Dioxide. Bulgarian Patent 66757, 11 October 2018. (In Bulgarian). [Google Scholar]
  29. ANSYS Fluent Theory Guide; Release 2023 R1; ANSYS, Inc.: Canonsburg, PA, USA, 2023.
  30. Dimitrov, D.; Schreve, K.; de Beer, N. Advances in three dimensional printing—State of the art and future perspectives. Rapid Prototyp. J. 2006, 12, 136–147. [Google Scholar] [CrossRef]
  31. Sans, V.; Dragone, V.; Cronin, L. Applications of 3D Printing in Synthetic Process and Analytical Chemistry. In Handbook of Green Chemistry; Wiley Online Books: Hoboken, NJ, USA, 2019; pp. 215–256. [Google Scholar] [CrossRef]
  32. Kolev, N. Chapter 2—Investigation of the main performance characteristics of packed bed columns. In Packed Bed Columns, 1st ed.; Elsevier: Amsterdam, The Netherlands, 2006. [Google Scholar]
  33. Kasatkin, A.G. Basic Processes and Equipment of Chemical Technology; Izdat. Coskhimizdat: Moscow, Russia, 1955. (In Russian) [Google Scholar]
  34. Optima MRU—Emission Monitoring Systems. Available online: https://www.mru.eu/en/products/detail/optima7/ (accessed on 30 November 2023).
  35. Ferguson, J.B. The Iodometric Determination of Sulfur Dioxide and the Sulfites. J. Am. Chem. Soc. 1917, 39, 364–373. [Google Scholar] [CrossRef]
  36. Stupin, W.J.; Kister, H.Z. System Limit: The Ultimate Capacity of Fractionators. Chem. Eng. Res. Des. 2003, 81, 136–146. [Google Scholar] [CrossRef]
  37. Totev, T.; Boycheva, S.; Ignatov, B.; Angelov, B.; Todorov, K. SO3 emission control for Thermal Power Plants burning lignite coals. In Proceedings of the 15 Scientific Conference—Faculty of Power Engineering and Power Machines (PEPM), Sozopol, Bulgaria, 16–19 September 2010; Technical University Sofia: Sofia, Bulgaria; Volume I, pp. 135–141. (In Bulgarian). [Google Scholar]
Figure 1. Conceptual process diagram of SO2 removal by the absorption–adsorption method [27]: 1—bubble-cap tray column; 2—flue gas inlet pipe; 3—gas outlet pipe; 4—tray; 5—riser; 6—bubble cap; 7—sorbent inlet pipe; 8—sorbent outlet pipe; 9—sorbent regeneration system; 10—circulation pump.
Sustainability 16 02472 g001
Figure 2. Bubble-cap geometry for the CFD simulations.
Sustainability 16 02472 g002
Figure 3. Bubble cap: (a) sketch of the bubble cap with dimensions; (b) photograph of the bubble-cap tray, manufactured by additive technology.
Sustainability 16 02472 g003
Figure 4. Experimental set-up: (a) process flow chart (C—tray column; G—gas analyzer system; FC—flow rate control; PI—pressure indicator); (b) photograph of the set-up.
Sustainability 16 02472 g004
Figure 5. Gas holdup Case 1: (a) contour plots in the mid-vessel plane at Q = 17,280 L/h (wG = 2 m/s inlet gas velocity); (b) cross-section surface averaged gas holdup at Q = [4320–17,280] L/h (wG = [0.5–2] m/s inlet gas velocity).
Sustainability 16 02472 g005
Figure 6. Flow pattern in Case 2: (a) contour plots in the mid-vessel plane of gas holdup at Q = 4320 L/h (wG = 0.5 m/s); (b) photograph of the flow at Q = 4320 L/h (wG = 0.5 m/s); (c) contour plots in the mid-vessel plane of gas holdup at Q = 17,280 L/h (wG = 2 m/s); (d) photograph of the flow at Q = 17,280 L/h (wG = 2 m/s).
Sustainability 16 02472 g006aSustainability 16 02472 g006b
Figure 7. Cross-sectional averaged gas holdup at Q = 17,280 L/h (wG = 2 m/s): 1—Case 3 (1 s flow time); 2—Case 4 (3 s flow time); 3—Case 5 (2 s flow time); 4—Case 5 (3 s flow time); 5—Case 2 (3.5 s flow time). The cases are explained in Table 1.
Sustainability 16 02472 g007
Figure 8. Pathlines of liquid phase at Q = 17,280 L/h (wG = 2 m/s). The cases are explained in Table 1.
Sustainability 16 02472 g008
Figure 9. Measured and calculated pressure drop of the gas flow, caused by the bubble-cap tray, for two liquid heights, H0 = 70 mm and H0 = 170 mm, corresponding to liquid volumes 2 L and 5 L, respectively. (The error bars present the standard deviation of the measurements).
Sustainability 16 02472 g009
Figure 10. Gas holdup as a function of the liquid sorbent volume on the tray at different gas flow rates through the bubble-cap slots Q = [5000–15,000] L/h (wG = [0.6–1.8] m/s).
Sustainability 16 02472 g010
Figure 11. Removal efficiency of sulfur dioxide by 4.5 L of sorbent. Plot numbers are explained in Table 2.
Sustainability 16 02472 g011
Table 1. Model configurations.
Case NoNumber of
Bubble Caps
Bubble-Cap Diameter
d (mm)
Bubble-Cap Height
h (mm)
Liquid Level
H0 (mm)
Case 1180360300
Case 2180180150
Case 3340360300
Case 434050300
Case 534050150
Table 2. Experimental conditions.
Plot NoC0 (ppm)Q (L/h)Mr (g)
115005000250
215005000500
335005000500
4150015,000500
5150050000 (water only)
Disclaimer/Publisher’s Note: The statements, opinions and data contained in all publications are solely those of the individual author(s) and contributor(s) and not of MDPI and/or the editor(s). MDPI and/or the editor(s) disclaim responsibility for any injury to people or property resulting from any ideas, methods, instructions or products referred to in the content.

