Ideology of Urban Road Transport Chaos and Accident Risk Management for Sustainable Transport Systems


Abstract
1. Introduction
2. Literature Review and Basic Research Ideas
2.1. The Place and Role of Chaos in Operation of the Sustainable Urban Transport System (UTS)
2.2. Road Traffic Management as a Way to Suppress Traffic Chaos and Transform It into Traffic Order
2.3. Energy–Information System Balance and Entropy
2.4. Road Accident Rate and Its Relationship with Road Traffic Conditions and Traffic Chaos
2.5. Previous Studies on the Impact of Traffic Flow Entropy on Road Accident Rates
- The urban transport system and its traffic control and traffic safety subsystems are rather complicated, and their operation is often accompanied by chaotic processes.
- An essential purpose of traffic control is to suppress road chaos and transform it into road order. This work levels the energy–information system balance. Entropy can be used to quantify the level of road order. Entropy is a characteristic of assessing the quality of road chaos suppression.
- When analyzing the previous works on the relationship between road and transport conditions, road chaos, and road accident rates, we developed a scheme of the influence of road and transport conditions on the formation of chaotic traffic flow modes and, as a result, on the two essential characteristics of road accident rates—probability and severity of the outcome—and formulated a research hypothesis.
- We analyzed the existing works studying the influence of specific (congestion and free) traffic flow modes on road accident rates. We established that the form of accident manifestation (the ratio of the probability of a road accident and the severity of its consequences) largely depends on the speed characteristics of the traffic flow. Under conditions of traffic congestion, the severity of road accidents decreases while the frequency of road accidents increases. Under the conditions of high speeds (free movement), drivers are not always successfully exposed to large information volumes and the proportion of errors in their actions increases, which adversely affects road safety.
3. Materials and Methods
3.1. Theoretical Studies on the Specifics of the Traffic Flow
3.2. Theoretical Studies on the Specifics of Road Accident Rates
3.3. Methodology for Planning Experimental Studies
4. Results
4.1. Results of Experimental Studies on the Dynamic and Energy Characteristics of the Traffic Flow State
4.2. Results of Experimental Studies on the Assessment of the Daily Specifics of Road Accident Rates
5. Discussion
6. Conclusions
Author Contributions
Funding
Institutional Review Board Statement
Informed Consent Statement
Data Availability Statement
Conflicts of Interest
References
- Koźlak, A. The role of transport system in stimulating economic and social development. Res. J. Univ. Gdan. 2017, 72, 19–33. [Google Scholar] [CrossRef]
- Drucker, P. The age of social transformation. Atl. Mon. 1994, 274, 53–80. [Google Scholar]
- Hossain, F. Chapter 14—Sustainable Urbanization. In Sustainable Development for Mass Urbanization; Elsevier: Amsterdam, The Netherlands, 2019; pp. 347–358. [Google Scholar]
- World-Urban-Forum. Summary Report of 11th Session of the World Urban Forum (WUF11), 26–30 June 2022. Available online: https://enb.iisd.org/sites/default/files/2022-07/wuf11_summary.pdf (accessed on 14 January 2024).
- Smeed, R.J. The traffic problem in towns: A review of possible long term solutions. Town Plan. Rev. 1964, 35, 133–158. [Google Scholar] [CrossRef]
- Sayama, H. Introduction to the Modeling and Analysis of Complex Systems; Open SUNY Textbooks: Geneseo, NY, USA, 2015; 498p. [Google Scholar]
- Owais, M.M.; Salah, G.; Oneib, M.; Abbas, Y. Evaluation and analysis of urban passengers transport modes operation performance & efficiency. J. Eng. Sci. 2011, 39, 283–299. [Google Scholar] [CrossRef]
- Makarova, I.; Mustafina, J.; Boyko, A.; Fatikhova, L.; Parsin, G.; Buyvol, P.; Shepelev, V. A Virtual Reality Lab for Automotive Service Specialists: A Knowledge Transfer System in the Digital Age. Information 2023, 14, 163. [Google Scholar] [CrossRef]
- Lorenz, E.N.; Haman, K. The Essence of Chaos; Taylor & Francis e-Library: London, UK, 2005; 227p. [Google Scholar]
- Mandelbrot, B.B. The Fractal Geometry of Nature; W.H. Freeman: New York, NY, USA, 1983; 468p. [Google Scholar]
- Abraham, N.B.; Albano, A.M.; Tufillaro, N.B. Complexity and Chaos. In Measures of Complexity and Chaos; NATO ASI Series, Series B: Physics Vol. 208; Abraham, N.B., Albano, A.M., Passamante, A., Rapp, P.E., Eds.; Springer: Boston, MA, USA, 1989; pp. 1–27. [Google Scholar] [CrossRef]
- Prigogine, I. The philosophy of instability. Futures 1989, 21, 396–400. [Google Scholar] [CrossRef]
- Casdagli, M.; Jardins, D.D.; Eubank, S.; Farmer, J.D.; Gibson, J.; Theiler, J. Nonlinear Modeling of Chaotic Time Series: Theory and Applications. In Applied Chaos; Kim, J.H., Stringer, J., Eds.; John Wiley and Sons: New York, NY, USA, 1992; pp. 335–380. [Google Scholar]
- Hilborn, R.C. Chaos and Nonlinear Dynamics: An Introduction for Scientists and Engineers; Oxford University Press: Oxford, UK, 2001; 672p. [Google Scholar]
- Faust, G.; Haase, M.; Argyris, J.H. Texts on Computational Mechanics Volume VII: An Exploration of Chaos; North Holland: Amsterdam, The Netherlands, 1994; 772p. [Google Scholar]
- Abarbanel, H.D.I. Analysis of Observed Chaotic Data; Spinger: New York, NY, USA, 1995; 288p. [Google Scholar]
- Disbro, J.E.; Frame, M. Traffic Flow Theory and Chaotic Behavior; Dept. of Transportation: New York, NY, USA, 1989; 36p. [Google Scholar]
- Cvitanović, P.; Artuso, R.; Mainieri, R.; Tanner, G.; Vattay, G. Chaos: Classical and Quantum; Niels Bohr Institute: Copenhagen, Denmark, 2020; 1089p. [Google Scholar]
- Kiel, D.L.; Elliott, E.W. Chaos Theory in the Social Sciences: Foundations and Applications; University of Michigan Press: Ann Arbor, MI, USA, 2009; 349p. [Google Scholar]
- Zhang, X.; Jarrett, D.F. Chaos in a dynamic model of traffic flows in an origin-destination network. Chaos 1998, 8, 503–513. [Google Scholar] [CrossRef]
- Dendrinos, D.S. Traffic-flow dynamics: A search for chaos. Chaos Solit. Fract. 1994, 4, 605–617. [Google Scholar] [CrossRef]
- Muhmoudabadi, A. The assessment of applying chaos theory for daily traffic estimation. In Proceedings of the 2014 International Conference on Industrial Engineering and Operations Management, Bali, Indonesia, 7–9 January 2014; pp. 559–567. [Google Scholar]
- Oestreicher, C. A history of chaos theory. Dialogues Clin. Neurosci. 2007, 9, 279–289. [Google Scholar] [CrossRef] [PubMed]
- Prigogine, I.; Herman, R. Kinetic Theory of Vehicular Traffic; Elsevier: New York, NY, USA, 1971; 102p. [Google Scholar]
- Gazis, D.C.; Herman, R.; Rothery, R.W. Nonlinear Follow-the-Leader Models for Traffic Flow. Oper. Res. 1961, 9, 545–567. [Google Scholar] [CrossRef]
- Van Zuylen, H.J.; van Geenhuizen, M.S.; Nijkamp, P. (Un)predictability in Traffic and Transport Decision Making. Transp. Res. Rec. 1999, 1685, 21–28. [Google Scholar] [CrossRef]
- Safonov, L.A.; Tomer, E.; Strygin, V.V.; Ashkenazy, Y.; Havlin, S. Delay-Induced Chaos with Multi-Fractal Attractor in a Traffic Flow Model. Europhys. Lett. 2002, 57, 151–157. [Google Scholar] [CrossRef][Green Version]
- Attoor, S.N.; Liu, J.-C.; Rilett, L.; Gupta, S. Non-Linear Analysis of Traffic Flow. In Proceedings of the 2001 IEEE Intelligent Transportation Systems, Oakland, CA, USA, 25–29 August 2001; pp. 681–685. [Google Scholar] [CrossRef]
- Weidlich, W. Sociodynamics: A Systematic Approach to Mathematical Modeling in the Social Sciences; Harwood Academic: Amsterdam, The Netherlands, 2000; 392p. [Google Scholar]
- Bannester, E.M. Sociodynamics: An Integrative Theorem of Power, Authority, Interfluence and Love. Am. Sociol. Rev. 1969, 34, 374–393. [Google Scholar] [CrossRef]
- Koshland, D.E. The Laws of Sociodynamics. Science 1990, 249, 341. [Google Scholar] [CrossRef] [PubMed][Green Version]
- Kolmogorov, A.N. General theory of dynamical systems. Proc Intern. Congr Math 1954, 1, 315–333. [Google Scholar]
- Murray, R.M. Recent Research in Cooperative Control of Multivehicle Systems. J. Dyn. Syst. Meas. Control 2007, 129, 571–583. [Google Scholar] [CrossRef]
- Leok, M.; Tiong, B. Estimating the attractor dimension of the equatorial weather system. Acta Phys. Pol. A 1994, 85, 27–35. [Google Scholar]
- Goertzel, B. Chaotic Logic: Language, Thought, and Reality from the Perspective of Complex Systems Science; Plenum Press: New York, NY, USA, 1994; 278p. [Google Scholar]
- Xue, J.; Shi, Z. Short-time traffic flow prediction based on chaos time series theory. J. Transp. Syst. Eng. Inf. Technol. 2008, 8, 68–72. [Google Scholar] [CrossRef]
- Clement, S.J.; Taylor, M.A.P.; Rao, K.V.K.; Mathew, T.V.; Gundaliya, P.J. From Chaotic Road Traffic to Cooperative Opportunistic Percolation Using Cellular Automata. In Proceedings of the 28th Australasian Transport Research Forum, ATRF 05, Sydney, NSW, Australia, 28–30 September 2005; pp. 1–15. [Google Scholar]
- Frazier, C.; Kockelman, K.M. Chaos Theory and Transportation Systems: Instructive Example. Transp. Res. Rec. 2004, 1897, 9–17. [Google Scholar] [CrossRef]
- Haight, F.A. Mathematical Theories of Traffic Flow; Academic Press: New York, NY, USA, 1963; 242p. [Google Scholar]
- Ashton, W.D. The Theory of Traffic Flow; Methuen & Co: London, UK, 1966; 186p. [Google Scholar]
- Drew, D.R. Traffic Flow Theory and Control; McGraw Hill: New York, NY, USA, 1968; 467p. [Google Scholar]
- Gerlough, D.L.; Huber, J.H. Traffic Flow Theory: A Monograph; Transportation Research 713 Board National Research Council: Washington, DC, USA, 1975; 233p. [Google Scholar]
- Gazis, D.C. Traffic Science; Wiley: New York, NY, USA, 1974; 293p. [Google Scholar]
- Leutzbach, W. Einfuhrung in die Theorie des Verkehrsflusses; Springer: Berlin, Germany, 1972; 162p. [Google Scholar]
- Dreyer, K.; Hickey, F.R. The route to chaos in a dripping water faucet. Am. J. Phys. 1991, 59, 619–627. [Google Scholar] [CrossRef]
- Hamilton, A.; Waterson, B.; Cherret, T.A.R.; Snell, I. Urban traffic control evolution. In Proceedings of the Conference UTSG 44th Annual Conference of the Universities’ Transport Study Group, Aberdeen, UK, 4–6 January 2012. [Google Scholar]
- IHE Guidance Note: Traffic Control and Information Systems. Available online: https://www.theihe.org/wp-content/uploads/2020/03/5-IHE-Traffic-Control-Info-Systems.pdf (accessed on 8 September 2023).
- Narh, A.T.; Thorpe, N.; Bell, M.C.; Hill, G.A. Do new sources of traffic data make the application of Chaos Theory to traffic management a realistic possibility? Transp. Rev. 2016, 36, 635–658. [Google Scholar] [CrossRef]
- Cheslow, M.; Hatcher, S.G.; Patel, V.M. An Initial Evaluation of Alternative Intelligent Vehicle Highway Systems Architectures; MITRE Corporation: Bedford, MA, USA, 1992. [Google Scholar]
- Vlahogianni, E.I.; Karlaftis, M.G.; Golias, J.C. Optimized and meta-optimized neural networks for short-term traffic flow prediction: A genetic approach. Transp. Res. Part C Emerg. Technol. 2005, 13, 211–234. [Google Scholar] [CrossRef]
- Kesting, A.; Treiber, M. How reaction time, update time, and adaptation time influence the stability of traffic flow. Comput. Aided Civ. Infrastruct. Eng. 2008, 23, 125–137. [Google Scholar] [CrossRef]
- Huang, S.; Sadek, A.W. A novel forecasting approach inspired by human memory: The example of short-term traffic volume forecasting. Transp. Res. Part C Emerg. Technol. 2009, 17, 510–525. [Google Scholar] [CrossRef]
- Qi, Y.; Ishak, S. A hidden Markov model for short term prediction of traffic conditions on freeways. Transp. Res. Part C Emerg. Technol. 2014, 43, 95–111. [Google Scholar] [CrossRef]
- Zhang, G.; Patuwo, B.E.; Hu, M.Y. Forecasting with artificial neural networks. State Art. Int. J. Forecast. 1998, 14, 35–62. [Google Scholar] [CrossRef]
- Zheng, P.; McDonald, M. Optimal traffic data archive scheme. Intell. Transp. Syst. IET 2007, 1, 144–149. [Google Scholar] [CrossRef]
- Guo, J.; Huang, W.; Williams, B.M. Adaptive Kalman filter approach for stochastic short-term traffic flow rate prediction and uncertainty quantification. Transp. Res. Part C Emerg. Technol. 2014, 43, 50–64. [Google Scholar] [CrossRef]
- Jianming, H.; Chunguang, Z.; Jingyan, S.; Zuo, Z.; Jiangtao, R. An applicable short-term traffic flow forecasting method based on chaotic theory. In Proceedings of the IEEE International Conference on Intelligent Transport Systems, Institute of Electrical and Electronic Engineers, Shanghai, China, 12–15 October 2003; pp. 608–613. [Google Scholar] [CrossRef]
- Tribus, M.; McIrvine, E.C. Energy and Information. Sci. Am. 1971, 224, 179–188. [Google Scholar] [CrossRef]
- Petrov, A.I. Information and Entropy Aspects of the Specifics of Regional Road Traffic Accident Rate in Russia. Information 2023, 14, 138. [Google Scholar] [CrossRef]
- Petrov, B.N.; Petrov, V.V.; Ulanov, G.M.; Zaporczets, A.W.; Uskov, A.S.; Kotchubievsky, I.L. Stochastic Process in Control and Information Systems; Survey Paper 63; IFAC: Warszawa, Poland, 1969. [Google Scholar]
- Petrov, V.V.; Uskov, A.S. Informational aspects of the regularization problem. Dokl. Akad. Nauk SSSR 1970, 195, 780–782. (In Russian) [Google Scholar]
- Petrov, V.V.; Uskov, A.S. Channel capacities of feed-back informational systems with internal perturbations. Dokl. AN SSSR 1970, 194, 1029–1031. (In Russian) [Google Scholar]
- Bukanov, N.P. Information criterion of optimality of automatic control systems. Avtomat. Telemekh 1972, 1, 57–62. (In Russian) [Google Scholar]
- Szilard, L. On the reduction of entropy in a thermodynamic system by the intervention of intelligent beings. Z. Phys. 1929, 53, 840–856. (In German) [Google Scholar] [CrossRef]
- Brillouin, L. Science and Information Theory; State Edition of Foreign Literature: Moscow, Russia, 1960; 392p. (In Russian) [Google Scholar]
- Prigogine, I.R. The philosophy of instability. Quest. Philos. 1991, 6, 46–52. (In Russian) [Google Scholar] [CrossRef]
- Kűhne, R.D. Freeway Control Using a Dynamic Traffic Flow Model and Vehicle Reidentification Techniques. Transp. Res. Rec. 1991, 1320, 251–259. [Google Scholar]
- Kumari, S.; Chugh, R. A novel four-step feedback procedure for rapid control of chaotic behavior of the logistic map and unstable traffic on the road. Chaos 2020, 30, 123115. [Google Scholar] [CrossRef]
- Martinovič, T. Chaotic behaviour of noisy traffic data. Math. Methods Appl. Sci. 2018, 41, 2287–2293. [Google Scholar] [CrossRef]
- Jiang, R.; Jin, C.-J.; Zhang, H.M.; Huang, Y.-H.; Tian, J.-F.; Wang, W.; Hu, M.-B.; Wang, H.; Jia, B. Experimental and Empirical Investigations of Traffic Flow Instability. Transp. Res. Procedia 2017, 23, 157–173. [Google Scholar] [CrossRef]
- Schuster, H.G.; Just, W. Deterministic Chaos: An Introduction; John Wiley & Sons: New York, NY, USA, 2006; 312p. [Google Scholar]
- Quek, W.L.; Chung, N.N.; Chew, L.Y. An analysis on the traffic processing efficiency of a combination of serial and parallel bottlenecks. Phys. A Stat. Mech. Its Appl. 2018, 503, 491–502. [Google Scholar] [CrossRef]
- Kennedy, J.; Eberhart, R.C. Particle swarm optimization. In Proceedings of the IEEE Conference on Neural Networks, Perth, WA, Australia, 27 November–1 December 1995; pp. 1942–1948. [Google Scholar] [CrossRef]
- Pang, M.-B.; He, G.-G. Real-time Intelligent Recognition of Chaos in Traffic Flow Using Reduced Support Vector Machine. In Proceedings of the 2007 International Conference on Wireless Communications, Networking and Mobile Computing, Shanghai, China, 21–25 September 2007; pp. 5667–5671. [Google Scholar] [CrossRef]
- Alatas, B.; Akin, E.; Bedri, O.A. Chaos embedded particle swarm optimization algorithms. Chaos Solit. Fract. 2009, 40, 1715–1734. [Google Scholar] [CrossRef]
- Zheng, Z. Empirical Analysis on Relationship between Traffic Conditions and Crash Occurrences. Procedia Soc. Behav. Sci. 2012, 43, 302–312. [Google Scholar] [CrossRef]
- Gharehchopogh, F.S.; Dizaji, Z.A. A new chaos agent based approach in prediction of the road accidents with hybrid of PSO optimization and chaos optimization algorithms: A case study. Int. J. Acad. Res. Part A 2014, 6, 108–115. [Google Scholar] [CrossRef]
- Senkerik, R.; Zelinka, I.; Pluhacek, M. Chaos-Based Optimization—A Review. J. Adv. Eng. Comput. 2017, 1, 68–79. [Google Scholar] [CrossRef]
- Akgȕn-Tanbay, N.; Campisi, T.; Tanbay, T.; Tesoriere, G.; Dissanayake, D. Modelling Road User Perceptions towards Safety, Comfort, and Chaos at Shared Space: The via Maqueda Case Study, Italy. J. Adv. Transp. 2022, 2022, 4979496. [Google Scholar] [CrossRef]
- Wilde, G.J.S. The Theory of Risk Homeostasis: Implications for Safety and Health. Risk Anal. 1982, 2, 209–225. [Google Scholar] [CrossRef]
- Wilde, G.J.S. Risk homeostasis theory and traffic accidents: Propositions, deductions and discussion of dissension in recent reactions. Ergonomics 1988, 31, 441–468. [Google Scholar] [CrossRef]
- Norén, F. H-Day 1967—An alternative perspective on «propaganda» in the historiography of public relation. Public Relat. Rev. 2018, 45, 236–245. [Google Scholar] [CrossRef]
- Worldwide Driving Orientation by Country. Available online: http://chartsbin.com/view/edr (accessed on 18 September 2023).
- Monderman, H.; Clarke, E.; Baillie, B.H. Shared space—The alternative approach to calming traffic. Traffic Eng. Control 2006, 47, 290–292. [Google Scholar]
- Architecture Norway: Shared Space—The Next Step in Urban Development? An interview with Ben Hamilton-Baillie. Available online: https://www.architecturenorway.no/stories/people-stories/hamiltonbaillie-11/ (accessed on 19 October 2023).
- Richards, D.C. Relationship between Speed and Risk of Fatal Injury: Pedestrians and Car Occupants; Department for Transport, Transport Research Laboratory: London, UK, 2010; 41p. [Google Scholar]
- Rosén, E.; Stigson, H.; Sander, U. Literature review of pedestrian fatality risk as a function of car impact speed. Accid. Anal. Prev. 2011, 43, 25–33. [Google Scholar] [CrossRef] [PubMed]
- Dickerson, A.; Peirson, J.; Vickerman, R. Road Accidents and Traffic Flows: An Econometric Investigation; University of Kent, Department of Economics: Canterbury, UK, 1998; 32p. [Google Scholar]
- Heinrich, H.W. Industrial Accident Prevention: A Scientific Approach; Mcgraw-hill Book Company Inc.: New York, NY, USA, 1941; 448p. [Google Scholar]
- Bellamy, L.J. Exploring the relationship between major hazard, fatal and non-fatal accidents through outcomes and causes. Saf. Sci. 2014, 71, 93–103. [Google Scholar] [CrossRef]
- Boarnet, M.; Kim, E.; Parkany, E. Measuring traffic congestion. Transp. Res. Rec. 1998, 1634, 93–99. [Google Scholar] [CrossRef]
- Shefer, D. Congestion, air pollution, and road fatalities in urban areas. Accid. Anal. Prev. 1994, 26, 501–509. [Google Scholar] [CrossRef] [PubMed]
- Shefer, D.; Rietveld, P. Congestion and safety on highways: Towards an analytical model. Urban Stud. 1997, 34, 679–692. [Google Scholar] [CrossRef]
- Noland, R.B.; Quddus, M.A. Congestion and safety: A spatial analysis of London. Transp. Res. Part A Policy Pract. 2005, 39, 737–754. [Google Scholar] [CrossRef]
- Belmont, D.M.; Forbes, T.W. Effect of average speed and volume on motor-vehicle accidents on two-lane tangents. Proc. Highw. Res. Board 1953, 32, 383–395. [Google Scholar]
- Gwynn, D.W. Relationship of accident rates and accident involvements with hourly volumes. Traffic Q. 1967, 21, 407–418. [Google Scholar]
- Ceder, A.; Livneh, M. Relationships between road accidents and hourly traffic flow–I: Analyses and interpretation. Accid. Anal. Prev. 1982, 14, 19–34. [Google Scholar] [CrossRef]
- Ceder, A. Relationships between road accidents and hourly traffic flow–II. Probabilistic approach. Accid. Anal. Prev. 1982, 14, 35–44. [Google Scholar] [CrossRef]
- Turner, D.J.; Thomas, R. Motorway accidents: An examination of accident totals, rates and severity and their relationship with traffic flow. Traffic Eng. Control 1986, 27, 377–383. [Google Scholar]
- Golob, T.F.; Recker, W.W. Relationships among urban freeway accidents, traffic flow, weather, and lighting conditions. J. Transp. Eng. 2003, 129, 342–353. [Google Scholar] [CrossRef]
- Zhou, M.; Sisiopiku, V. 1997. Relationship between volume-to-capacity ratios and accident rates. Transp. Res. Rec. J. Transp. Res. Board 1997, 1581, 47–52. [Google Scholar] [CrossRef]
- Lord, D.; Manar, A.; Vizioli, A. Modeling crash-flow-density and crash-flow-V/C ratio relationships for rural and urban freeway segments. Accid. Anal. Prev. 2005, 37, 185–199. [Google Scholar] [CrossRef] [PubMed]
- Shinar, D.; Compton, R. Aggressive driving: An observational study of driver, vehicle, and situational variables. Accid. Anal. Prev. 2004, 36, 429–437. [Google Scholar] [CrossRef] [PubMed]
- Kulbashna, N.; Lynnyk, I.; Galkin, A.; Prasolenko, O.; Dulfan, S. Safety assessment of adjacent roads sections via maximum entropy driver’s perception field. Commun. Sci. Lett. Univ. Žilina 2020, 22, 182–190. [Google Scholar] [CrossRef]
- Lynnyk, I.; Chepurna, S.; Vakulenko, K.; Kulbashna, N. Informational Characteristics of Objects to the Driver’s Perception Field in Urban and Suburban Conditions. Lect. Notes Netw. Syst. 2023, 536, 695–706. [Google Scholar] [CrossRef]
- Niven, R.K. Dimensionless Groups by Entropic Similarity: I—Diffusion, Chemical Reaction and Dispersion Processes. Entropy 2023, 25, 617. [Google Scholar] [CrossRef] [PubMed]
- Peters, M.H. Nonequilibrium Entropy Conservation and the Transport Equations of Mass, Momentum, and Energy. Energies 2021, 14, 2196. [Google Scholar] [CrossRef]
- Aljamal, M.A.; Abdelghaffar, H.M.; Rakha, H.A. Estimation of Traffic Stream Density Using Connected Vehicle Data: Linear and Nonlinear Filtering Approaches. Sensors 2020, 20, 4066. [Google Scholar] [CrossRef] [PubMed]
- Lighthill, M.J.; Whitham, G.B. On kinematic waves: II. Theory of traffic flow on long crowded roads. Proc. R. Soc. 1955, 229, 281–345. [Google Scholar]
- Morozov, V.; Iarkov, S. Formation of the Traffic Flow Rate under the Influence of Traffic Flow Concentration in Time at Controlled Intersections in Tyumen, Russian Federation. Sustainability 2021, 13, 8324. [Google Scholar] [CrossRef]
- Morozov, V.; Shepelev, V.; Kostyrchenko, V. Modeling the Operation of Signal-Controlled Intersections with Different Lane Occupancy. Mathematics 2022, 10, 4829. [Google Scholar] [CrossRef]
- Shannon, C.E. Mathematical Theory of Communication. Bell Syst. Tech. J. 1948, 27, 379–423. [Google Scholar] [CrossRef]
- Shannon, C.E. Communication Theory of Secrecy Systems. Bell Syst. Tech. J. 1949, 28, 656–715. [Google Scholar] [CrossRef]
- Premaratne, P.; Jawad Kadhim, I.; Blacklidge, R.; Lee, M. Comprehensive Review on Vehicle Detection, Classification and Counting on Highways. Neurocomputing 2023, 556, 126627. [Google Scholar] [CrossRef]
- Liliana, D.Y.; Nalawati, R.E.; Iswara, R.W.; Pradito, R.N.; Heryana, A.M.; Andayani, G. Multi-type Vehicle Detection and Classification Using YOLOV5. In Proceedings of the 2023 International Conference on Informatics, Multimedia, Cyber and Information Systems (ICIMCIS), Jakarta Selatan, Indonesia, 7–8 November 2023; pp. 296–301. [Google Scholar] [CrossRef]
- Ali, U.; Oh, S.; Um, T.-W.; Hann, M.; Kim, J. Fine-Grained Image Recognition by Means of Integrating Transformer Encoder Blocks in a Robust Single-Stage Object Detector. Appl. Sci. 2023, 13, 7589. [Google Scholar] [CrossRef]
- Jocher, G.; Bochkovskiy, A.; Kay, W. YOLOv5: Improved Real-Time Object Detection. arXiv 2020, arXiv:2004.10934. [Google Scholar]
- State Traffic Inspectorate: Indicators of the State of Road Safety. Available online: http://stat.gibdd.ru/ (accessed on 16 September 2023).
- Sturges, H. The choice of a class-interval. J. Am. Stat. Assoc. 1926, 21, 65–66. [Google Scholar] [CrossRef]
- Hazarika, A.; Choudhury, N.; Nasralla, M.M.; Khattak, S.B.A.; Rehman, I.U. Edge ML Technique for Smart Traffic Management in Intelligent Transportation Systems. Proc. IEEE Access 2024, 12, 25443–25458. [Google Scholar] [CrossRef]
- Kaur, A.; Saxena, S.; Kumar, R. OsCoMIT: Osmotic computing-based service management for intelligent transportation systems in 5G network. Clust. Comput. 2024, 27, 1–19. [Google Scholar] [CrossRef]
- Gong, T.; Zhu, L.; Yu, F.R.; Tang, T. Edge Intelligence in Intelligent Transportation Systems: A Survey. IEEE Trans. Intell. Transp. Syst. 2023, 24, 8919–8944. [Google Scholar] [CrossRef]
- De Curtò, J.; de Zarzà, I.; Cano, J.C.; Manzoni, P.; Calafate, C.T. Adaptive Truck Platooning with Drones: A Decentralized Approach for Highway Monitoring. Electronics 2023, 12, 4913. [Google Scholar] [CrossRef]
- Shoaib, M.R.; Emara, H.M.; Zhao, J. A Survey on the Applications of Frontier AI, Foundation Models, and Large Language Models to Intelligent Transportation Systems. In Proceedings of the 2023 International Conference on Computer and Applications (ICCA), Cairo, Egypt, 28–30 November 2023; pp. 1–7. [Google Scholar] [CrossRef]
- Tian, Y.; Li, X.; Zhang, H.; Zhao, C.; Li, B.; Wang, X.; Wang, F.Y. VistaGPT: Generative Parallel Transformers for Vehicles with Intelligent Systems for Transport Automation. IEEE Trans. Intell. Veh. 2023, 8, 4198–4207. [Google Scholar] [CrossRef]
- Smeed, R.J. Some Statistical Aspects of Road Safety Research. J. R. Stat. Soc. Ser. A 1949, 112, 1–34. [Google Scholar] [CrossRef]
- Petrov, A.I. Philosophy and Meanings of the Information Entropy Analysis of Road Safety: Case Study of Russian Cities. Information 2023, 14, 302. [Google Scholar] [CrossRef]
- Ordu, M.; Der, O. Polymeric Materials Selection for Flexible Pulsating Heat Pipe Manufacturing Using a Comparative Hybrid MCDM Approach. Polymers 2023, 15, 2933. [Google Scholar] [CrossRef]
- Sayadinia, S.; Beheshtinia, M.A. Proposing a new hybrid multi-criteria decision-making approach for road maintenance prioritization. Int. J. Qual. Reliab. Manag. 2021, 38, 1661–1679. [Google Scholar] [CrossRef]


| Authors | Methodology | ||||||||
|---|---|---|---|---|---|---|---|---|---|
| General Chaos Theory | Mathematical Foundations of the Chaos Theory | Chaotic Data Analysis Methods. Properties of Chaotic Systems | Traffic Modeling | Study of the Influence of Chaos on Urban Planning Processes | Study of the Influence of Chaos on Human Behavioral Processes | Study of Traffic Flow Patterns | Works on Applied Sociodynamics | Modeling of Nonlinear System Performance Dynamics | |
| Lorenz, E.N [9] | √ | √ | |||||||
| Mandelbrot, B. [10] | √ | √ | √ | ||||||
| Abraham, N.B. et al. [11], Muhmoudabadi, A. [22] | √ | √ | √ | ||||||
| Prigogine, I. [12], Casdagli, M. et al. [13], Hilborn, R.C. [14], Cvitanovic, P. et al. [18], Kiel, D. et al. [19], Zhang, X. et al. [20], Oestreicher, C. [23] | √ | √ | |||||||
| Argyris, J. et al. [15] | √ | ||||||||
| Abarbanel, H.D.I. [16], Kolmogorov, A.N. [32], Murray, R.M. [33], Leok, M. et al. [34], Goertzel, B. [35], Xue, J. [36], Clement, S.J. et al. [37], Frazier et al. [38] | √ | ||||||||
| Prigogine, I. et al. [24], Gazis, D.C. et al. [25] | √ | √ | |||||||
| Disbro, J.E. et al. [17] | √ | √ | √ | ||||||
| Van Zuylen et al. [26] | √ | √ | |||||||
| Safanov, L.A. et al. [27], Attoor, S.N. et al. [28] | √ | √ | |||||||
| Weidlich, W. et al. [29], Bannester, E.M. [30], Koshland, E.D. [31] | √ | √ | |||||||
| Dendrinos D.S. [21] | √ | √ | √ | √ | |||||
| Authors | Goal of Research | Obtained Results |
|---|---|---|
| Cheslow, M. et al. [49] | Search for options for improving the adequacy of road traffic management modes lining up with reality. | The essential prerequisite for implementing sustainable dynamic traffic control lies in the capability to formulate and consistently revise forecasts regarding traffic flows and link times, extending several minutes into the future, utilizing real-time data. |
| Vlahogianni, E.I. et al. [50] | Search for ways to understand the laws of traffic flow dynamics | The authors established regularities in the dynamics of the traffic flow. |
| Kesting, A. et al. [51] | ||
| Huang, S. and Sadek, A.W. [52] | ||
| Qi, Y. and Ishak, S. [53] | ||
| Zhang, G. et al. [54] | Formation of traffic state models, encompassing time series, nonparametric, filtering, and their various hybrids. | The authors established that the applicability of these models to congested traffic situations is limited due to their low adequacy for real processes. |
| Vlahogianni, E.I. et al. [50] | ||
| Zheng, P. and Mcdonald, M. [55] | ||
| Guo, J. et al. [56] | ||
| Jianming, H. et al. [57] | Development of a phase state model based on the Chaos Theory concepts. | The authors established that this model has major potential for analyzing the complexities in a disturbed traffic flow. |
| Authors | Goal of Research | Obtained Results |
|---|---|---|
| General works on the regularities of road traffic formation | ||
| Kűhne R.D. [67] | The paper studies the traffic flow model and control strategy. | The determination of traffic flow stability hinges upon traffic density. Stability conditions can be deduced from the traffic flow model. |
| Kumari S. and Chugh R. [68] | This paper examined the complete dynamical behavior of the logistic map through the application of diverse dynamical techniques. | A modified chaos-based model for managing chaotic and unpredictable discrete traffic was presented in this paper. Additionally, a physical interpretation was provided to validate the outcomes of this model. |
| Studies on traffic flow instability | ||
| Martinovič T. [69] | This paper describes the procedure of extracting information on the dynamics of highway traffic speed. | The paper established the regularities of changes in Shannon entropy results on daily highway data |
| Jiang R. et al. [70] | This paper reports the experimental and empirical studies on traffic flow instability. | The paper established the regularities in the formation of traffic jams. |
| Works directly or indirectly studying the influence of road traffic (with an emphasis on traffic chaos) on road accident rates | ||
| Schuster H.G. [71] | The author studies the nature of chaos as a phenomenon. | Chaos manifests as a bounded and unstable dynamic phenomenon characterized by sensitive dependence on initial conditions, encompassing infinite unstable periodic motions within nonlinear systems. Despite its seemingly stochastic nature, chaos emerges in a deterministic nonlinear system under deterministic conditions |
| Quek, W.L. et al. [72] | The authors studied the maximum vehicular flow rate of traffic processing bottlenecks. | The authors concluded that bottlenecks influence changes in the chaotic nature of traffic flow. |
| Kennedy J. et al. [73] | The goal of the research is to study chaos and order in the social behaviors of birds flocking or fish schooling. | Particle swarm optimization represents a highly straightforward algorithm. Social optimization transpires within the realm of commonplace experiences. |
| Pang M.-bao et al. [74] | The authors studied the patterns of the origin of chaotic processes in traffic. | The authors developed a model for recognizing chaos in road traffic. |
| Alatas B. et al. [75] | New methods for particle swarm optimization (PSO) are introduced in this paper. The authors use chaotic maps for the purpose of parameter adaptation | The authors proposed several new methods to improve the convergence of the PSO algorithm. |
| Zheng Z. [76] | The investigation in this paper delves into the correlation between traffic conditions and crash occurrence likelihood (COL). | The crash occurrence likelihood (COL) is notably influenced by the prevailing traffic conditions. In summary, COL during congested conditions is approximately six times higher than that during free conditions. COL in transitional conditions is approximately 1.6 times higher than that in free conditions. |
| Gharehchopogh F.S. [77] | The paper studies the possibilities of predicting road accident rates using a hybrid of particle swarm optimization (PSO) algorithm and chaos optimization algorithms (COAs). | The author established that taking into account the contribution of the chaotic traffic flow to the formation of the road situation somewhat increased the accuracy of the accident rate forecasting model. |
| Narh A.T., Thorpe N., Bell M. C., Hill G.A. [48] | The goal of the research is to study the possibilities of the new applications of chaos theory in road traffic analysis | Chaos theory’s capacity to analyze and predict dynamic systems has been examined, with indications that its potential can be harnessed for strategic network-wide control. This complements the functioning of current UTC systems, thereby enhancing the efficacy of demand management within the urban road network. |
| Senkerik R. et al. [78] | This paper explores the application of complex chaotic dynamics derived from chosen time-continuous chaotic systems and discrete chaotic maps. These serve as chaotic pseudo-random number generators and driving maps for chaos-based optimization | This paper illustrated three sets of complex chaotic dynamics originating from chaotic flows, oscillators, and discrete chaotic maps. |
| Akgȕn-Tanbay N. et al. [79] | This study seeks to examine the effects of road usage frequency on safety, comfort, and chaos within the context of shared spaces. | In the course of sociological research, the authors established the peculiarities of the impact of gender and age differences on the qualitative perception of the traffic chaos level and road accident risks. |
| Hours of the Day | Road Accident (RA) and Traffic Incident (TI). | Number of Victims NV, People | Scale of the Road Accident ScRA, Victims/Road Accident | Severity of the Road Accident SevRA, Share of Road Accidents with Victims | Damage from Road Accident Consequences DRA | Probability of a Road Accident PRA | Injury Risk RV | ||
|---|---|---|---|---|---|---|---|---|---|
| With Victims (RA), NRA Units | With Material Damage (TI), Units | Total N, Units | |||||||
| 7:00–9:00 | 5 | 89 | 94 | 6 | 1.20 | 0.053 | 0.064 | 0.075 | 0.00478 |
| Experiment Characteristics | Characteristic Description |
|---|---|
| Experiment type | Passive |
| Method | Continuous monitoring of traffic flows within the city road network Collection and analysis of experimental data on accident rates within the selected road network section |
| Conditions | Real traffic conditions within the city road network |
| Duration | Working days of the week from 07:00 to 23:00 during 2016–2023 |
| Studied values: | |
| - Target indicator | Kinetic energy of the traffic flow, m/s2 |
| - Target indicator | Road injury risk RV |
| Influencing factors: | |
| - Relative entropy of the traffic flow depending on its concentration in time | Specific measure of chaos and energy dissipation of the traffic flow. |
| - Traffic flow concentration in time | Lane occupancy, % |
| Additional environmental restrictions: | |
| - Condition of the road surface; | Dry asphalt/asphalt concrete surface, no ice |
| - Precipitation; | No precipitation |
| - Fog. | Fair visibility (no fog) |
| Additional requirements for the traffic flow: | |
| - Movement direction; | Particular, unmixed direction |
| - Composition of the traffic flow; | Uniform traffic flow of passenger cars |
| - Traffic conflict with an oncoming traffic and/or pedestrian flow. | N/a |
| Hours of the Day | Number (%) of Vehicle Collisions, Taking into Account Their Specifics | |||
|---|---|---|---|---|
| Road Accidents with Victims (RA) | Traffic Incidents with Material Damage (TI) | |||
| Number | % | Number | % | |
| 23:00–7:00 | 6 | 15.4 | 14 | 1.2 |
| 7:00–9:00 | 5 | 12.8 | 89 | 7.3 |
| 9:00–11:00 | 3 | 7.7 | 128 | 10.5 |
| 11:00–13:00 | 2 | 5.1 | 145 | 11.9 |
| 13:00–15:00 | 3 | 7.7 | 166 | 13.7 |
| 15:00–17:00 | 4 | 10.3 | 182 | 15.0 |
| 17:00–19:00 | 5 | 12.8 | 225 | 18.5 |
| 19:00–21:00 | 5 | 12.8 | 201 | 16.5 |
| 21:00–23:00 | 6 | 15.4 | 65 | 5.3 |
| Total | 39 | 100.0 | 1215 | 100.0 |
| Hours of the Day | Number (%) of Vehicle Collisions, Taking into Account Their Specifics | ||
|---|---|---|---|
| Road Accidents with Victims | Traffic Incidents with Material Damage | ||
| Number of Fatalities | Number of Injured, (%) | Amount of Material Damage | |
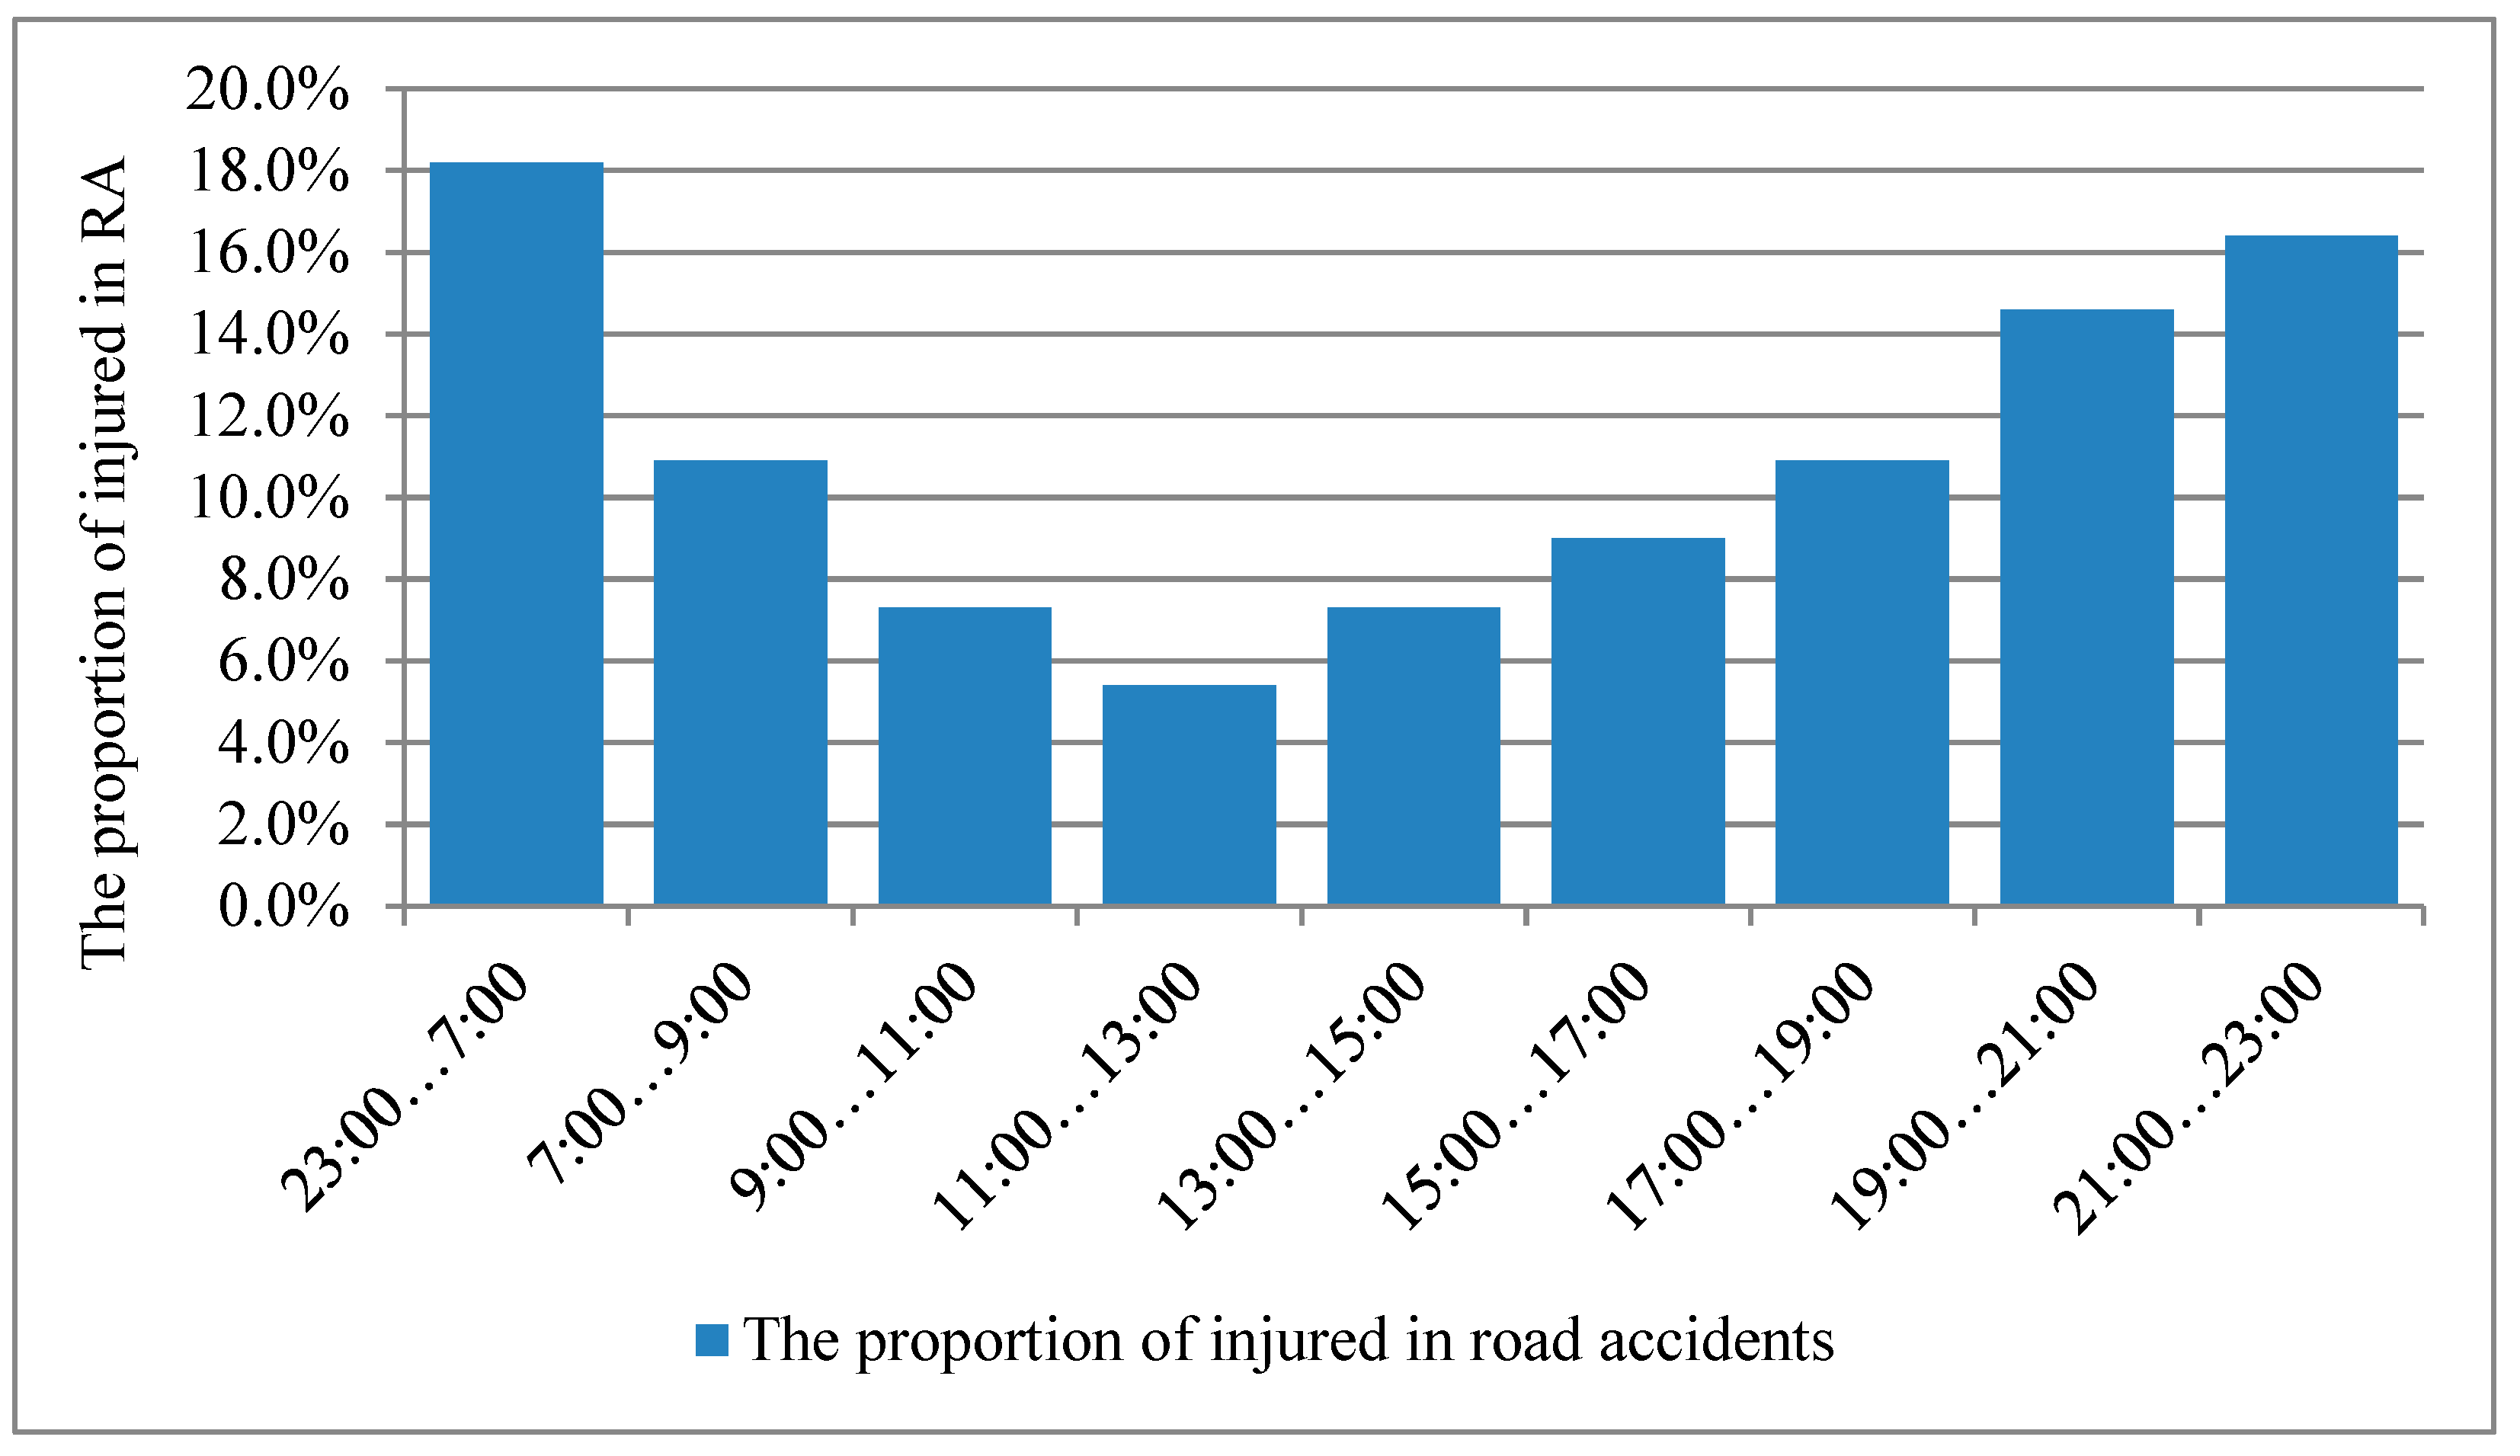
| 23:00–7:00 | 0 | 10 (18.2) | No differentiated data are available. As part of the calculation, material damage can be accepted at the level of the average statistical payments by an Insurance Company for one average statistical road accident (118.2 thousand rubles/road accident) |
| 7:00–9:00 | 0 | 6 (10.9) | |
| 9:00–11:00 | 0 | 4 (7.3) | |
| 11:00–13:00 | 0 | 3 (5.4) | |
| 13:00–15:00 | 0 | 4 (7.3) | |
| 15:00–17:00 | 0 | 5 (9.0) | |
| 17:00–19:00 | 0 | 6 (10.9) | |
| 19:00–21:00 | 0 | 8 (14.6) | |
| 21:00–23:00 | 0 | 9 (16.4) | |
| Total | 0 | 55 (100) | |
| Hours of the Day | Number of Vehicle Collisions | The Number of Victims NV, Units | Scale of the Road Accident ScRA, Victims/Road Accident | Severity of the Road Accident Sevra, Share of Road Accidents with Victims | Damage from Road Accident Consequences DRA | Probability of the Road Accident PRA | Injury Risk RV | ||
|---|---|---|---|---|---|---|---|---|---|
| With Victims, NRA Units | With Material Damage, Units | Total N, Units | |||||||
| 23:00–7:00 | 6 | 14 | 20 | 10 | 1.67 | 0.300 | 0.500 | 0.0159 | 0.00797 |
| 7:00–9:00 | 5 | 89 | 94 | 6 | 1.20 | 0.053 | 0.064 | 0.0750 | 0.00478 |
| 9:00–11:00 | 3 | 128 | 131 | 4 | 1.33 | 0.023 | 0.031 | 0.1045 | 0.00319 |
| 11:00–13:00 | 2 | 145 | 147 | 3 | 1.50 | 0.014 | 0.020 | 0.1172 | 0.00239 |
| 13:00–15:00 | 3 | 166 | 169 | 4 | 1.33 | 0.018 | 0.024 | 0.1348 | 0.00319 |
| 15:00–17:00 | 4 | 182 | 186 | 5 | 1.25 | 0.022 | 0.027 | 0.1483 | 0.00399 |
| 17:00–19:00 | 5 | 225 | 230 | 6 | 1.20 | 0.022 | 0.026 | 0.1834 | 0.00478 |
| 19:00–21:00 | 5 | 201 | 206 | 8 | 1.60 | 0.024 | 0.039 | 0.1643 | 0.00638 |
| 21:00–23:00 | 6 | 65 | 71 | 9 | 1.50 | 0.085 | 0.127 | 0.0566 | 0.00718 |
| Total | 39 | 1215 | 1254 | 55 | - | - | - | - | - |
| Hours of the Day | |||||||
|---|---|---|---|---|---|---|---|
| 7:00–9:00 | 9:00–11:00 | 11:00–13:00 | 13:00–15:00 | 15:00–17:00 | 17:00–19:00 | 19:00–21:00 | 21:00–23:00 |
| Average values of the relative entropy of lane occupancy | |||||||
| 0.920 | 0.972 | 0.968 | 0.972 | 0.951 | 0.928 | 0.903 | 0.806 |
Disclaimer/Publisher’s Note: The statements, opinions and data contained in all publications are solely those of the individual author(s) and contributor(s) and not of MDPI and/or the editor(s). MDPI and/or the editor(s) disclaim responsibility for any injury to people or property resulting from any ideas, methods, instructions or products referred to in the content. |
© 2024 by the authors. Licensee MDPI, Basel, Switzerland. This article is an open access article distributed under the terms and conditions of the Creative Commons Attribution (CC BY) license (https://creativecommons.org/licenses/by/4.0/).
Share and Cite
Morozov, V.; Petrov, A.I.; Shepelev, V.; Balfaqih, M. Ideology of Urban Road Transport Chaos and Accident Risk Management for Sustainable Transport Systems. Sustainability 2024, 16, 2596. https://doi.org/10.3390/su16062596
Morozov V, Petrov AI, Shepelev V, Balfaqih M. Ideology of Urban Road Transport Chaos and Accident Risk Management for Sustainable Transport Systems. Sustainability. 2024; 16(6):2596. https://doi.org/10.3390/su16062596
Chicago/Turabian StyleMorozov, Viacheslav, Artur I. Petrov, Vladimir Shepelev, and Mohammed Balfaqih. 2024. "Ideology of Urban Road Transport Chaos and Accident Risk Management for Sustainable Transport Systems" Sustainability 16, no. 6: 2596. https://doi.org/10.3390/su16062596
APA StyleMorozov, V., Petrov, A. I., Shepelev, V., & Balfaqih, M. (2024). Ideology of Urban Road Transport Chaos and Accident Risk Management for Sustainable Transport Systems. Sustainability, 16(6), 2596. https://doi.org/10.3390/su16062596