Article

Optimisation of Process Parameters to Maximise the Oil Yield from Pyrolysis of Mixed Waste Plastics

by
Farjana Faisal
1,
Mohammad Golam Rasul
1,
Ashfaque Ahmed Chowdhury
2,* and
Md Islam Jahirul
1
1
Fuel and Energy Research Group, School of Engineering and Technology, Central Queensland University, Rockhampton, QLD 4702, Australia
2
Fuel and Energy Research Group, School of Engineering and Technology, Central Queensland University, Gladstone, QLD 4680, Australia
*
Author to whom correspondence should be addressed.
Sustainability 2024, 16(7), 2619; https://doi.org/10.3390/su16072619
Submission received: 26 January 2024 / Revised: 10 March 2024 / Accepted: 18 March 2024 / Published: 22 March 2024

Abstract

:
The study sought to optimise process parameters of thermal pyrolysis of mixed waste plastic (MWP) to maximise pyrolytic oil yield. High-density polyethylene (HDPE), polypropylene (PP), and polystyrene (PS) were used as feedstocks for pyrolysis. Response surface methodology (RSM) and Box–Behnken design (BBD) were used to optimise the pyrolysis process. The optimisation was carried out by varying three independent variables, namely, reaction temperature (460–540 °C), residence time (30–150 min), and size of MWP feedstock (5–45 mm), to increase the liquid oil yield. A BBD matrix was used to generate the design of the experiments, and 15 experiments were conducted. The highest liquid oil yield of 75.14 wt% was obtained by optimising the operating parameters, which were a reaction temperature of 535.96 °C, a reaction time of 150 min, and a feedstock particle size of 23.99 mm. A model was developed to determine the relationships among the independent variables, and analysis of variance (ANOVA) was used to investigate their impact on maximising oil yield. ANOVA results showed that the temperature and residence time had the maximum impact on oil yield, followed by feedstock size. Physicochemical analysis of the properties of the plastic pyrolytic oil (PPO) revealed that the crude PPO obtained from the MWP had higher water (0.125 wt%) and sulfur content (5.12 mg/kg) and lower flash point (<20 °C) and cetane index (32), which makes it unsuitable for use as an automobile fuel. However, these issues can be resolved by upgrading the PPO using different posttreatment techniques, such as distillation and hydrotreatment.

1. Introduction

Technological advancements and improved living standards are driving higher demand for petroleum-based fuels. Power generation, automobiles, agriculture, industries, and domestic useable machinery rely on petroleum fuels. Alternative energy sources are receiving increased attention to satisfy growing energy demands. Plastics have become an integral part of our daily life due to their durability, affordability, versatility, and lightweight nature [1]. These materials find extensive application across diverse sectors including packaging, aerospace, consumer goods, electronics, construction, transportation, automotive, biomedical, textiles, leisure, and more [1]. As the amount of plastic production and use in everyday life is increasing, their amount in residues and subsequently in municipal solid waste (MSW) is also rising, which is a matter of growing concern because of the very slow degradability of plastics.
Many researchers have turned to using plastic waste to produce plastic diesel as a means of reducing dependency on depleting fossil fuels and managing plastic waste problems more efficiently. At present, 70% of municipal solid waste (MSW) is disposed of in landfills, 19% is recycled, and a mere 11% is converted into energy [1]. From 1950 to 2016, global plastic production increased from 1.5 million tons to 335 million tons [2]. Plastic waste can have a long-lasting impact on the environment, taking hundreds of years to decompose and often ending up in waterways, landfills, and hazardous waste stockpiles. As plastic degrades through various environmental conditions like wear and tear, exfoliation, fragmentation, abrasion, gradual degradation, etc., it can cause a range of environmental problems, including release of microplastics [3,4]. Microplastics have a small particle size (less than 5 mm) and their degradation rate is slow. They possess high stability and can endure in the atmosphere for extended durations [4]. Rough estimates suggest that approximately 10–20 million tons of plastic waste enter the oceans annually [5]. The influence of plastic waste on marine life is significant and far-reaching, given its persistence in the environment for decades to even centuries.
The world’s oceans currently host over 5 trillion plastic fragments floating on their surfaces. These fragments come in different sizes and shapes and weigh more than 250,000 tons [6]. According to a report from 2019, China was responsible for producing the highest amount of plastic material, accounting for approximately 31% of global production. The second highest plastic producers were the NAFTA countries (USA, Canada, and Mexico), contributing to 19% of global plastic production [7]. Given that crude oil serves as a basis for plastic production, there is potential to convert waste plastic into energy [8]. The production of plastics consumes 4% of the fossil fuels produced worldwide [8]. To fuel the operations of plastic manufacturing industries, an extra 4% is necessary for power generation [5]. Landfilling and incineration are commonly used methods for eliminating waste plastics. However, landfilling requires a massive amount of land outside of human habitats, which makes obtaining new sites for landfills increasingly challenging. These landfill sites cause serious health and environmental concerns, including groundwater contamination, heightened greenhouse gas (GHG) emissions, potential fire and explosion risks, threats to human health, and sanitation issues [9].
Incineration has the potential to recover some energy from plastic wastes. Nevertheless, it generates pollutants like nitrous and sulfur oxides, light hydrocarbons, dust, and dioxins, which can damage human health and degrade air quality during the process [10]. Pyrolysis is an advanced thermal treatment (ATT) method that can effectively manage waste plastic in a sustainable way. Pyrolysis is a thermochemical recycling technique that transforms waste plastics into liquid oil, along with valuable byproducts like flammable gases and char. It is a thermal degradation process that involves moderate heat and pressure in an inert environment, breaking down long-chain hydrocarbons into shorter ones. Compared to incineration, pyrolysis is preferred as it yields lower levels of toxic and greenhouse gases, reducing emissions like nitrogen oxides, sulfur oxides, and other harmful gases. The liquid product generated through pyrolysis boasts a higher heating value. However, the output yield of the pyrolysis process hinges on various factors: temperature, heating rate, reactor design, residence time, feedstock volume, moisture content, particle size, and elemental composition. This paper concentrates on optimising three key parameters: temperature, residence time, and feedstock particle size. There has been limited exploration using response surface methodology (RSM) to fine-tune the waste plastic pyrolysis process. In a study by Selvaganapathy et al. [11], the process parameters were optimised to increase the yield of liquid fuel in the pyrolysis of waste polystyrene. A pyrolytic reaction with a 1 kg capacity was used, and the experiments were designed using a central composite design (CCD) matrix in RSM with Design Expert 12 statistical programming software. For optimisation, four parameters were chosen: reaction temperature (ranging from 350 to 500 °C), polystyrene size (2 to 6 mm), weight of polystyrene feedstock (ranging between 250 to 750 gm), and retention time (10 to 90 min), with the aim to enhance liquid oil yield. They executed 30 experiments to ascertain the liquid oil yield, matching these results with values obtained via numerical simulations using a quadratic model. ANOVA was employed to discern the connection between independent variables and their influence on liquid oil yield. Their conclusion highlighted temperature and reaction time as the most critical factors for maximising liquid oil production.
In another study, RSM was utilised to optimise the process parameters in catalytic pyrolysis of waste HDPE to maximise liquid oil yield in a 300 mL capacity reactor [12]. Three parameters were chosen for optimisation—reaction temperature, mass ratio between HDPE and modified catalyst, and acidity of the modified catalyst—using face central composite design (FCCD). Under optimum conditions (reaction temperature of 450 °C, catalyst-to-waste HDPE ratio at 1:4, and a catalyst acidity of 0.341), they recorded a substantial 78.7 wt% yield of liquid product. Furthermore, they attained a notably high determination coefficient of R2, affirming the model’s reliability.
Ayodele et al. [13] also used RSM to study the influence of operating parameters on the oil yield from waste plastic pyrolysis. They considered four operating factors, plastic-type (PS, LDPE and PP, HDPE, PET, and PVC), temperature (300–740 °C), heating rate (3–25 °C/min), and reaction time (20–150 min). They documented that the temperature and type of plastic used had greater influence on the liquid oil yield from pyrolysis compared with the other two parameters studied. They observed that the liquid product obtained under optimised conditions had a higher heating value and was in the range of hydrocarbons (C10–C25). Pinto et al. [14] also investigated the effect of experimental operating conditions on liquid oil yield from pyrolysis of a mixture of recycled plastic (80 wt%), scrap tire (10 wt%), and pine (10 wt%) in an autoclave with a capacity of 1 L, by using RSM. The recycled plastic they used comprised PE, PS, and PP, and they considered three factors for optimising liquid oil yield—temperature, reaction time, and initial pressure—using an experimental factorial design. The maximum liquid yield obtained was 91.3 wt% for optimum conditions of 350 °C, 30-min reaction time, and 0.2 MPa initial pressure. Miranda et al. [15] also used RSM for the thermal pyrolysis of mixed waste plastic (PE, PP and PS) and rubber tires. They optimised the process parameters to maximise the liquid oil yield and used 70 wt% mixed waste plastic and 30 wt% rubber tires. Three important process parameters were chosen for optimisation: temperature, reaction time and initial pressure. The optimum values were 370 °C, 15 min, and 0.48 MPa, respectively. The experimental deviation of 0.95% resulted in a highest liquid oil yield of 81.3 wt%. In a recently published study, Prabha et al. [16] conducted optimisation of the pyrolysis process using single-use waste PP grocery bags. They used a laboratory scale semi-batch type pyrolyzer with only 1 kg capacity. The process parameters considered were reaction temperature (400–550 °C), nitrogen flow rate (5–20 mL min−1), and substrate feed rate (0.25–1.5 kg h−1). However, the process parameters considered in this present study are vital and have more influence on the pyrolysis product yield. That research has several differences with this present study, as here a pilot scale batch type pyrolytic reactor that provides more reliable data was used. Moreover, a mixture of HDPE, PP, and PS was used in this study and more characterisation parameters have been considered. Dutta et al. [17] also conducted optimisation of the thermal pyrolysis of virgin and waste HDPE in a small lab-scale batch pyrolytic reactor. They documented maximum liquid yield as 69.33% for optimum operating conditions, which is lower than was achieved in this present study (75.14%). Moreover, they considered only two independent variables, temperature and virgin to waste plastic ratio, whereas in this study three vital pyrolysis process parameters, which are temperature, reaction time, and size of the feedstock have been considered.
Some researchers have used response surface methodology to optimise the process parameters of the pyrolysis process for biofuel production. For example, Jahirul et al. [18] studied process optimisation by response surface methodology (RSM) for producing biodiesel from nonedible beauty leaves. Their optimisation approach was based on the Box-Behnken design in RSM and considered three main factors (reaction temperature, catalyst concentration, and methanol to oil molar ratio). Both linear and full quadratic regression models were developed to analyse the results. ANOVA was conducted to determine the significance of factors and their interaction, and optimum values were obtained. Li et al. [19] also used RSM to optimise process parameters to maximise bio-oil yield using a microwave-assisted pyrolysis process from cotton stalks. In that study, they chose the Box-Behnken design approach. For the optimisation study, three parameters were chosen: reaction temperature, reaction time, and microwave power. They conducted 17 experiments following the software-generated experimental design. It was concluded that a 32.47 wt% bio-oil yield can be achieved by using the optimum values of the process parameters, which are 1800 W as the microwave power, a 24 min reaction time, and a 550 °C reaction temperature. Gupta et al. [20] used a combination of RSM and an artificial neural network (ANN) to optimise biofuel production from the pyrolysis of pine needles. They chose three factors, temperature (400–700 °C), inert gas flow rate (100–250 mL/min), and heating rate (10–50 °C/min), at three different levels of −1, 0, and 1 for optimisation and conducted a total of 20 experimental runs planned by the software. They used RSM in Design Expert 12 statistical software to determine the influence and significance of process parameters on three responses, increasing bio-oil yield, and decreasing biochar and gas yield, using a second-order polynomial equation. For improved prediction of the pyrolysis process output, ANN was used. They documented that the most influential variable is temperature, which maximises pyrolytic product yield. They concluded that the predicted optimum bio-oil yield is 51.11 wt% and 51.70 wt %, by using RSM and ANN modelling for values of parameters such as temperature 552.06 °C, inert gas flow rate 164.40 mL/min, and heating rate 50 °C/min [20].
This research article has several novelties compared with the existing research articles and knowledge. A literature review revealed that insufficient numbers of researchers have studied the optimisation of process parameters from mixed waste plastic pyrolysis. Among the very few studies where the optimisation of mixed waste plastic pyrolysis process parameters was discussed, only a very small size pyrolyzer was used. Experimental results obtained using small pyrolyzers (<1 L) might not be as accurate as the present study, where a 20-L capacity pyrolyzer was used. The pyrolyzer used in this study also has an automatic proportional–integral–derivative (PID) control unit that provides proper and accurate control over the operating parameters.
Furthermore, research papers where complete characterisation of the fuel properties of crude oil obtained under optimum operating conditions has been conducted and compared with standard values for automobile standard diesel fuels are rare. In this paper, optimisation of the pyrolysis process parameters from mixed waste plastics was conducted by using RSM to obtain the maximum liquid oil yield. After conducting some prior experiments, three waste plastics were selected, HDPE, PP, and PS, with a 1:1:1 ratio to favour liquid fuel production. The main objective of the present study was to maximise the output of liquid oil yield by optimising three important parameters: reaction temperature (460–540 °C), retention time (30–150 min), and MWP feedstock particle size (5–45 mm), by using RSM. The use of RSM can reduce the number of experiments to a great extent and help predict pyrolysis product yields. The model developed in this work is applicable for optimising the mixed waste plastic pyrolysis process and can be used by other researchers, with small adjustments based on their operating conditions.

2. Materials and Methodology

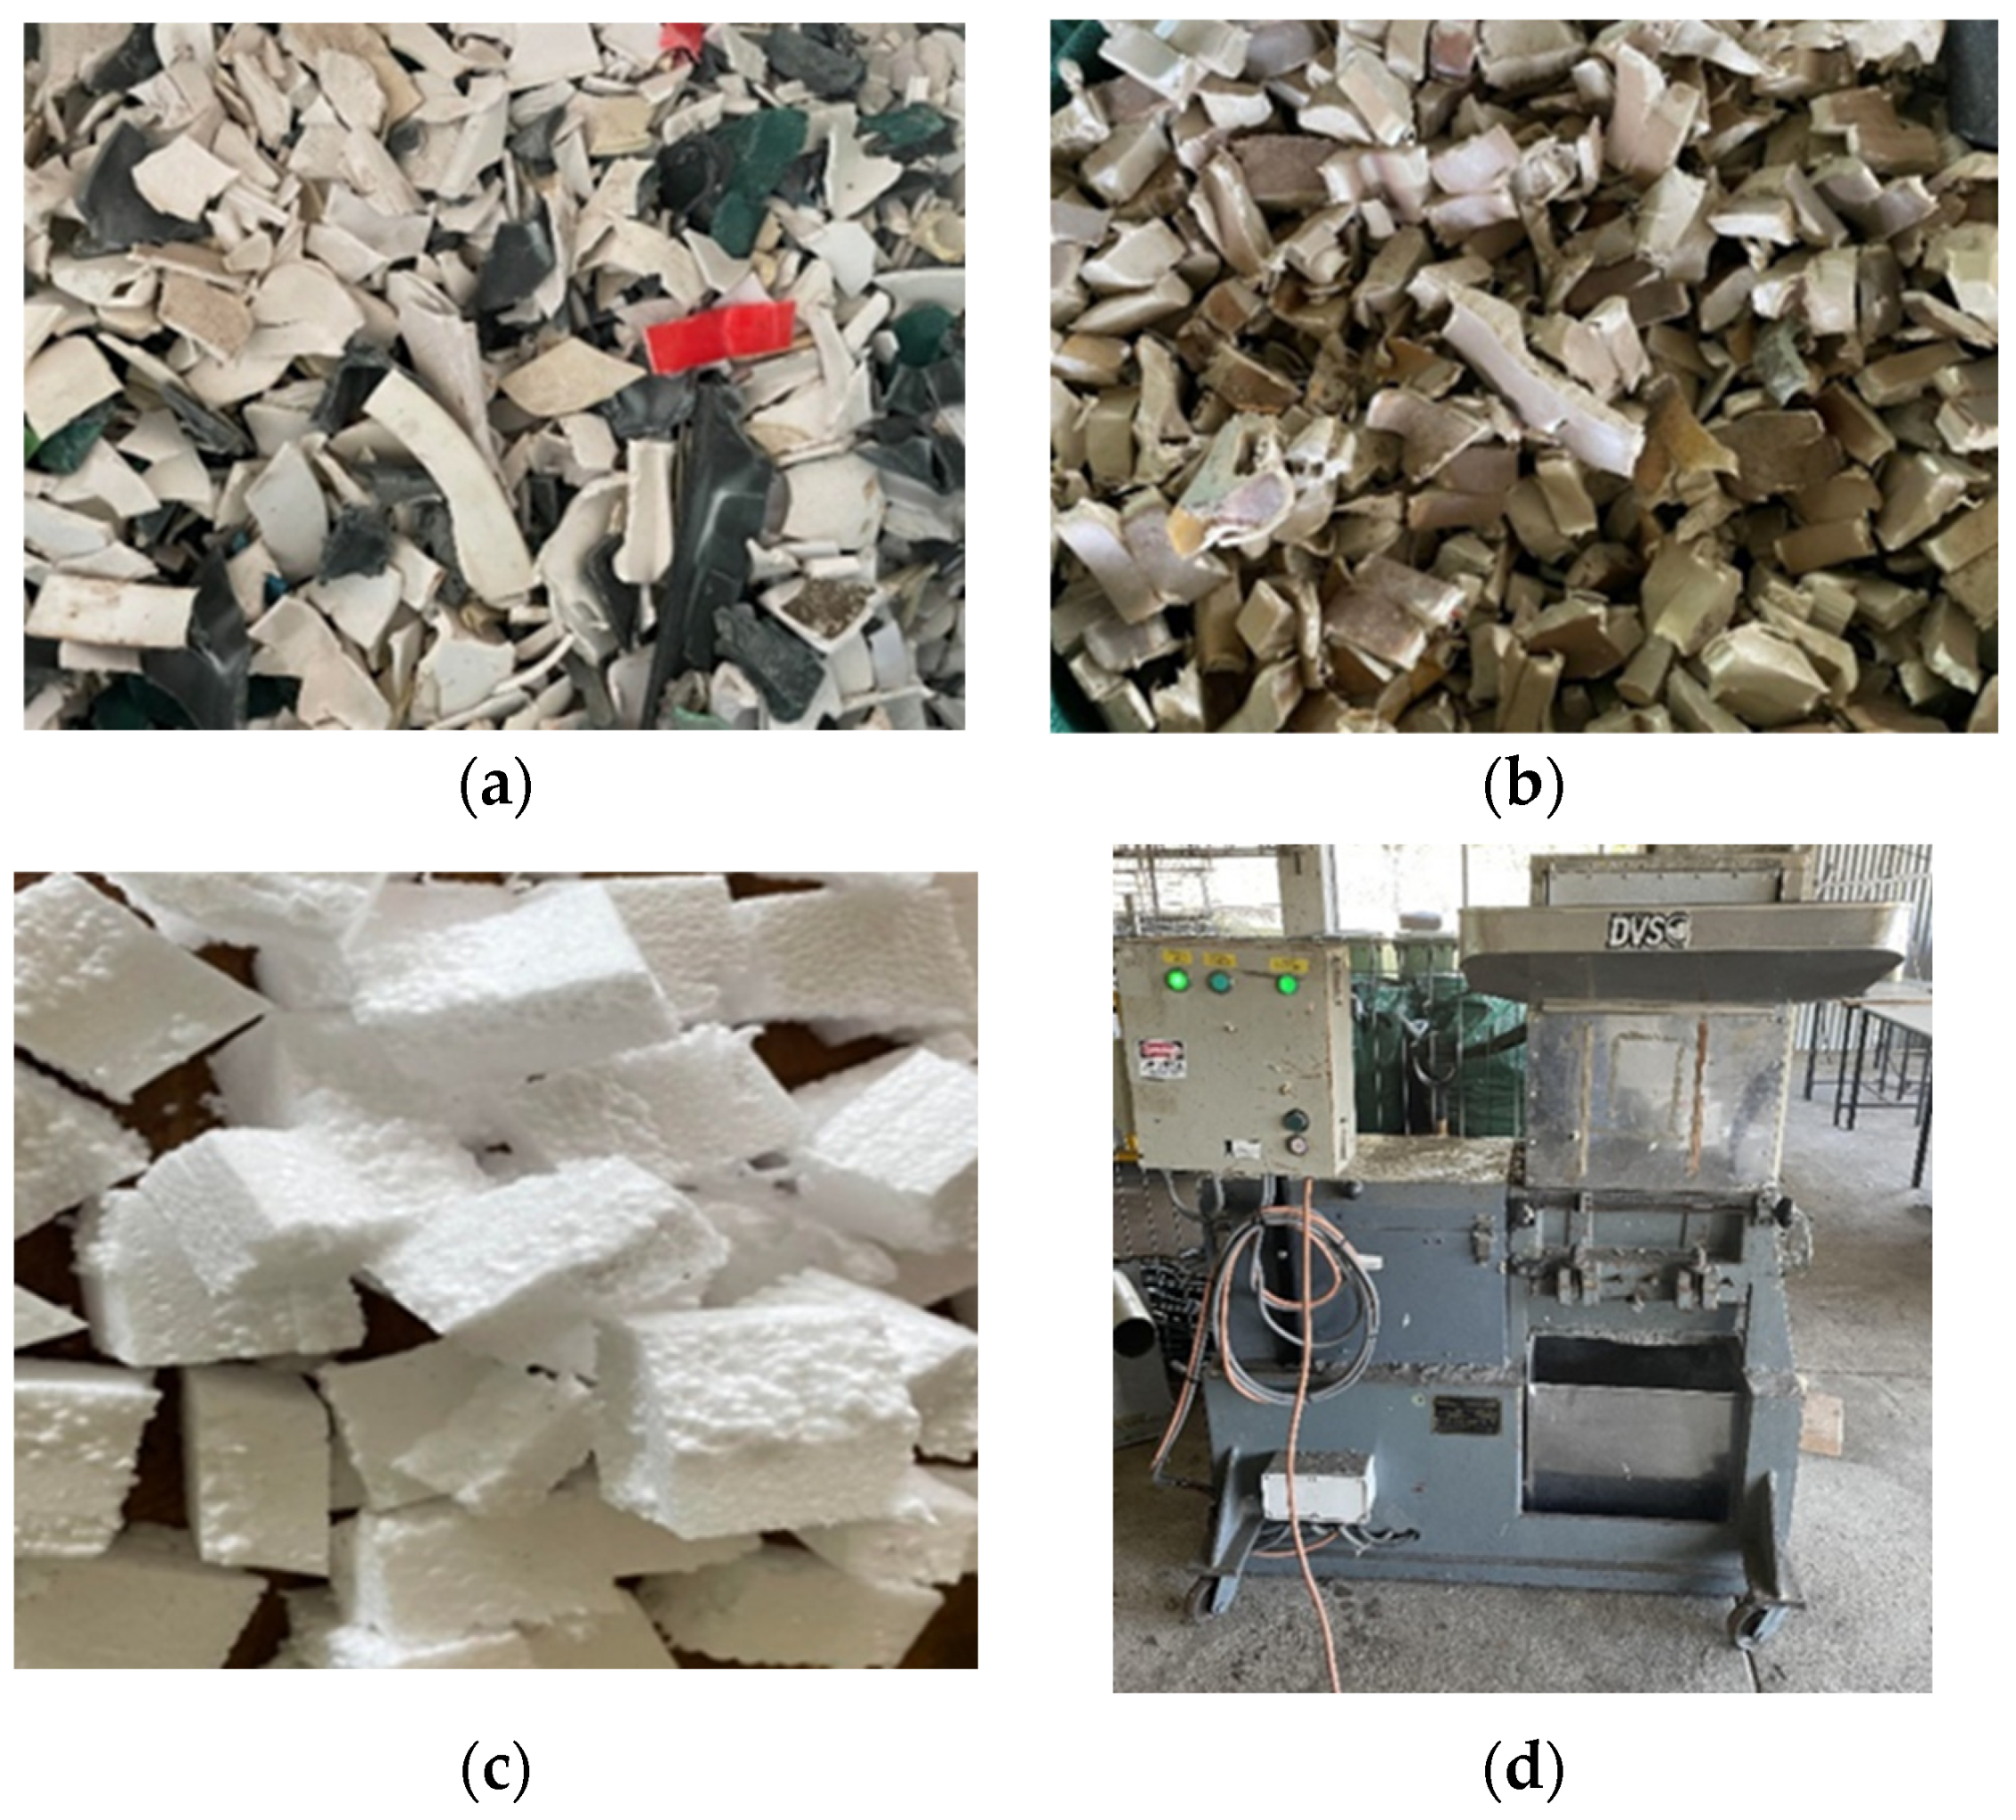
2.1. Preparing the Feedstock for Pyrolysis

MWP samples were sourced from the local municipal solid waste (MSW) site in Rockhampton, Australia. Among the MWP mix, HDPE, PS, and PP samples were segregated for this specific study based on their resin identification codes. Typically, high- and low-density polyethylene (HDPE and LDPE), polypropylene (PP), and polystyrene (PS) collectively constitute a substantial fraction of overall plastic waste, accounting for 46%, 16%, and 16%, respectively [21]. Among the other common waste plastics, PVC and PET are worth mentioning. However, neither of these are particularly suitable for pyrolysis experiments and have several disadvantages. For example, PET increases char and gas production but reduces the production of liquid pyrolytic oil if used in smaller amounts in catalytic pyrolysis and contains heteroatoms [22,23]. PVC generates hazardous phosgene and HCl gases during pyrolysis, affects catalytic activity in catalytic pyrolysis because of the presence of chlorine or coke deposition, and at low temperatures (250–320 °C), dichlorination occurs [24,25]. Waste plastic water tanks were used as the source of HDPE feedstock. They were shredded in an industrial-scale shredder. Waste PP was sourced from used and broken plastic chairs, food containers and packaging, bottles, jars, hot beverage cups, etc., and shredded in the same lab facility. The shredded HDPE and PP feedstocks were further shredded (second shredder) into smaller sizes (5 mm and 25 mm) in the CQU North Rockhampton campus laboratory. Waste polystyrene foam boxes were used as the source of polystyrene (PS). PS foams underwent cutting into smaller pieces in the CQU North Rockhampton campus laboratory. Figure 1, below, reveals the three types of feedstocks used for the pyrolysis experiments and the second shredder used for shredding them in the present study.
The HDPE, PP, and PS feedstocks were further shredded into two other sizes of approximately 5 mm and 25 mm in the shredder to satisfy the experimental design plan obtained using Minitab software 21.1.0. No pretreatment of the feedstocks was conducted other than manually removing some dirt and dust before shredding the feed materials. For preparing the feedstock, HDPE-, PP-, and PS-type waste plastics were used in equal proportions, i.e., 1:1:1. Figure 2 shows the three different sizes of the mixed feedstock used for the pyrolysis optimisation experiments.
The literature review also mentioned shredding of waste plastics before using them for pyrolysis [23,26,27].

2.2. Experimental Set up and Pyrolysis of MWP

The mixed waste plastics (MWP) were thermally pyrolyzed in a 20 L pilot-scale batch reactor situated at the Waste-to-Energy Laboratory on the Central Queensland University campus in Rockhampton, Australia [28]. Figure 3 displays both the physical representation of the reactor and a schematic diagram illustrating the pyrolysis reactor setup. The pyrolytic reactor system comprises a reactor chamber, a condenser, an oil collection unit, a char collector, a mechanical stirrer, a stirrer motor, a nitrogen gas cylinder, and a PID controller. The reactor walls are heated by electric heating coils that surround the vessel and are insulated. This pyrolytic plant can operate both as a batch reactor and an Auger reactor. However, the pyrolysis of MWP was conducted in a batch process by feeding shredded mixed plastic chips (HDPE, PP, and PS) of different sizes directly into the reactor through the feeding hopper. K-type thermocouples were installed at different points inside the reactor chamber to measure the temperature. The temperature and heating rate were managed by an automatic PID controller unit. Nitrogen gas was employed to purge the system, eliminating residual air and oxygen, and it had its own pressure regulator valve. The reactor system’s pressure was kept at 30 KPa, to ensure that the system operated under atmospheric or nearly atmospheric conditions, and a pressure gauge was used to monitor it. Additionally, a pressure relief valve was included in the system to eliminate excess pressure in case of excessive pressure build-up. The reactor system also had a condenser to condense the vapour after it left the reactor. An external chiller unit was utilised to control the condenser’s temperature, and the chiller unit’s temperature range could be adjusted between −5 °C and 20 °C. However, for the present study, −5 °C was selected. Ethylene glycol was utilised to cool the chiller unit, ensuring the water temperature remained below 0 °C while circulating through the condenser.
The pyrolytic reactor chamber received 1.5 kg of processed mixed waste plastic feedstocks—comprising HDPE, PS, and PP at a ratio of 1:1:1—through a feeding hopper situated atop the primary reactor chamber. The pyrolysis experiments employed a fixed-bed batch pyrolysis reactor (Figure 3a), as depicted. The system, illustrated in Figure 3b, was loaded with shredded plastic samples, sealed, and checked for air leaks using high-pressure nitrogen. To ensure airtightness, the system was purged with nitrogen gas from a nitrogen bottle for 15 min, eliminating any residual oxygen. The chiller unit was activated, followed by the heater/electric power, set to a heating rate of 6 °C/min, while the pyrolysis temperature was regulated using the PID controller. In this study, the pyrolysis temperature varied between 460, 500, and 540 °C, depending on the design obtained from the Minitab statistical design software for the optimisation studies. The mechanical stirrer was turned on to agitate the feedstock continuously. The feedstock was thermally decomposed at the provided temperature, producing vapour/gas and char. Vapours generated within the heated reactor chamber were channeled through a shell-and-tube condenser unit, where the condensable vapours formed liquid oil. The non-condensable vapours, referred to as syngas, were released through the exit valve. After concluding the experiment, the electric heater was deactivated, enabling the gradual cooling of the reactor. The plastic crude oil was then collected from the bottom of the oil tank, while the solid residue (char) was directly gathered from the bottom outlet of the pyrolytic reactor vessel. In this study, 1.5 kg of mixed waste plastic feedstock with a 1:1:1 ratio of HDPE, PP, and PS was processed. The feedstock was loaded into the pyrolytic reactor chamber using a feeding hopper situated at the top of the main chamber. In conducting the experiments, a fixed-bed batch pyrolysis reactor, depicted in Figure 3a, was utilised. Meanwhile, Figure 3b illustrates the schematic diagram of the pyrolysis reactor system employed in this study. After filling the reactor with processed (shredded) waste plastic samples and sealing it, the system underwent high-pressure nitrogen testing to check for leaks. Upon confirming the airtightness of the system, a 15 min purge with nitrogen gas was conducted to eliminate any remaining oxygen. Following the nitrogen purging, the sequence involved activating the chiller unit and subsequently turning on the electric heater.
The heating rate was set to 6 °C/min, and the pyrolysis temperature was varied (460, 500, and 540 °C) based on the experimental design obtained from the Minitab statistical design software. The mechanical stirrer was turned on to agitate the feedstock continuously. The feedstock underwent thermal decomposition at the provided temperature, producing vapour/gas and char. The vapours produced in the heated reactor chamber were directed through a shell-and-tube condenser unit, where the condensable vapours were gathered as liquid oil. Non-condensable vapours or gases, known as syngas, were released through the exit valve. When the experiment was finished, the electric heater was turned off to facilitate the gradual cooling of the reactor. Following that, the plastic crude oil was obtained from the bottom of the oil tank, while the solid residue (char) was collected directly from the lower outlet of the pyrolytic reactor vessel.
The yield of crude PPO (CPPO), char and gas can be calculated from the formula below [29,30]:
Y 0 = m 0 × 100 % m f
Y c = m c × 100 % m f
Y g = 100 ( Y 0 + Y c )
where Y 0 , Y c and Y g represent the yields of CPPO, char, and syngas derived from pyrolysis of MWP, respectively, m 0 and m c are the masses of CPPO and char, respectively (in kg), and m f the total mass of feedstock used for every experiment is 1.5 kg. The production of syngas was calculated by adding the production of CPPO and char and subtracting them from 100, as the reactor had no mass flowmeter to measure the mass of syngas. In this study, priority was given to the yield of CPPO from the pyrolysis process, and the produced char and syngas were not analysed. However, char and syngas are two valuable pyrolysis products and can be used in many sectors, for example, to produce power and heat and upgrade soil quality.
By-Products of MWP Pyrolysis Process
(1) 
Gas
Composition of gas produced from pyrolysis of waste plastic depends on the composition of the feedstock material. The main components of gases obtained from pyrolysis of different types of plastic feedstocks are methane, hydrogen, propane, propene, ethane, ethene, and butane [31], but PET produces carbon dioxide and carbon monoxide along with those and PVC produces hydrogen chloride [32]. Gases produced from pyrolysis of waste plastic include methane (34%), hydrogen (20%), nitrogen (17.5%), CO (13%), CO2 (11%), ethylene (3%), and oxygen (1.5%) [33]. As the temperature of the pyrolysis process increases, the amount of gas production increases [34]. It was documented that pyrolysis of individual plastics produced more gas than in mixture when pyrolysis was carried out for LDPE, PS, and their mixtures at 350 °C [35]. Long residence time and high temperature maximise gas production in the pyrolysis process [36].
The gas produced from the pyrolysis process has higher heating value and can be used in boilers for heating or in gas turbines for the generation of electricity without any flue gas treatment [37]. However, Joo and Guin. [38] mentioned that produced gas from thermal pyrolysis is not suitable as a fuel source and needs refining before use. The gases formed in the pyrolysis process consist of methane (6.6%), ethane ethylene (10.6%), propane (7.4%), propylene (29.1%), isobutane (1.9%), n-butane (0.9%), C4 (unsaturated) (25.6%), Iso C5–n-C5 (0.1%), C5+higher (15.3%), hydrogen (2.5%), and CO/CO2 (<400 ppm) [39,40]. Kaimal & Vijayabalan [41] also mentioned that gas produced from pyrolysis of waste plastic consists of propylene, isobutane, ethane, and small amounts of methane. After separation from other gas components, ethene and propene can be used as chemical feedstock for the production of polyolefins [42].
(2) 
Char
Char is the unburnt plastic left in the reactor after the pyrolysis process and is considered as a by-product [43]. Char formation maximises with a slow heating rate at very low temperatures, decreased feed rate, and long residence time, whereas char formation is low in fast pyrolysis [42,44]. Char production can also be reduced by using a microporous catalyst [45]. However, catalytic activity reduces when char is produced due to decreasing active sites [46]. Char is produced in small amounts (1–1.3 g in 1 kg plastic) during the pyrolysis process [47,48]. Char mainly consists of volatile matter and fixed carbon (97%) with small amount of moisture and ash [49]. Char has low sulfur content, making it convenient to use as a fuel [42]. Char can be used in different environmental applications like heavy metal adsorption from municipal and industrial wastewater and toxic gases [50]. A proximate analysis of the solid residue produced in waste plastic pyrolysis was conducted [51] and it was found that higher heating value can be obtained. Char has the potential to be used for an energy source in boilers or as a feedstock for activated carbon [37], in road surfacing, as a building material [44], and as an absorbent in water treatment for removing heavy metals through upgrading treatment [42].
(3) 
Wax Analysis
Wax can sometimes be produced from pyrolysis of waste plastic. Polyolefin polymers are considered as valuable products and a potential fuel source because of having high elemental carbon. Wax is a residue of the pyrolysis process caused by devolatilisation and has carbon range between C20–C50 [52]. The wax produced has elemental carbon ranging from 81.04 to 87.67% and can be used as high-carbon-based material.
Environmental impact assessment of the pyrolysis process: Recycling rates of waste plastics are very low and most of them find their way into landfills and pollute the environment. Pyrolysis of waste and contaminated plastics can reduce the harmful impact on the environment to a great extent by reducing their global warming impact. Garcia et al. [53] conducted an environmental impact assessment of contaminated waste plastics in three different scenarios, one where pyrolysis was conducted with combustion of the char and the other two where pyrolysis of the char with carbon dioxide and with potassium hydroxide was considered. In all three scenarios, the environmental impact was found to be less than landfilling. Hermanns et al. [54] found that global warming impacts can be reduced by about 60% to 94% compared with incineration through pyrolysis when considering a life-cycle assessment of mixed waste plastics. Moreover, Jeswani et al. [55] also conducted life-cycle assessment of mixed plastic wastes and found that pyrolysis has about 50% lower climate change impact and life-cycle energy use than energy recovery from MPW.

3. Design of Experiments (DoE) Using RSM

Selecting an appropriate experimental design is a critical step in DoE methodology. To optimise the liquid oil yield of the thermal pyrolysis process of MWP, this study employed response surface methodology (RSM) to identify the most influential operating parameters. RSM is a statistical analysis technique capable of optimising or minimising a dependent variable, which is determined by various independent variables. The RSM design procedure encompasses three facets: design, modeling, and optimisation. It is employed to enhance the efficiency of manufacturing processes and formulations [14,15,56]. A literature review observed that many researchers have utilised RSM to optimise process parameters [15,30,57]. RSM can predict a particular response with the help of creating a conceptual model. In RSM, useful equations and effective visualisation are established with the help of the developed model for optimising the response of the dependent variable. The flow diagram of the processes of RSM used in this study for model development and validation is shown in Figure 4.
The first step in RSM is to select an appropriate design of experiment (DoE). In the single-factor optimisation method, one parameter is varied at a time, keeping the other factors constant, unlike in RSM, where interactions among variable process parameters can also be considered [58]. The two main design techniques in RSM, central composite design and Box-Behnken design, were used for this study. RSM has the advantage of efficiently reducing the number of experiments and making it possible to change all the variables simultaneously and not one at a time [15]. Response surface methodology (RSM) is an amalgamation of mathematical and statistical techniques. It is used to optimise and analyse responses obtained during experiments with multiple variables. It is very suitable in cases of modelling, analysing, and optimising studies where multiple factors impact the response of interest. The reason for choosing Box–Behnken design over central composite design is the simplicity of the design and its effectiveness. One of the research articles concludes that the BBD method is better than other RSM designs because of its efficacy, after comparing BBD with several other RSM designs [59]. Furthermore, BBD offers the advantage of excluding combinations where all components are simultaneously at their maximum or minimum levels, thus preventing unacceptable results by averting tests conducted under extreme conditions. Box-Behnken design can consider three levels for each factor considered. First- and second-order coefficients can be estimated efficiently using BBD, but they cannot include runs from a factorial experiment.
For conducting DoE, selecting the most important factors affecting the response of interest and the ranges along which they can vary was needed. According to previous experiments conducted by the authors of this present study and the literature review, three vital factors were chosen for optimising MWP pyrolysis studies: temperature, residence time, and feedstock particle size. The literature suggests that these three factors significantly impact the product yield (predominantly liquid oil) from the thermal pyrolysis process. Other factors significantly affect the pyrolytic oil yield, such as varying the amount of catalyst used, stirrer speed, and nitrogen flow rate. However, in this study, only thermal pyrolysis was considered and not catalytic pyrolysis, so no catalyst was used. The stirrer speed was not considered, as from some preliminary tests conducted by the researchers, it was found that varying stirrer speed and feedstock volume do not significantly impact pyrolytic oil yield in terms of pilot-scale thermal pyrolysis. The nitrogen flow rate was also not considered, as nitrogen was used as an inert gas in the experiment and only to purge the system to ensure that experiments could run without oxygen. After purging the system with nitrogen for 15 min, the nitrogen supply was stopped and was not used during the experiment. These are the reasons for not exploring those factors (type and amount of catalyst used, stirrer speed, nitrogen flow rate) within the optimisation study in the present work.
Selecting an appropriate design of experiment (DoE) is a critical step that significantly influences the reliability and meaningfulness of the study’s results. It determines the probable relationship among various factors (which is three for this study, n = 3) and builds a response surface for all of them. Therefore, a 2n factorial design was not considered. The reason for not choosing a 3n factorial design was to reduce the cost, time, and complexity of conducting 27 experimental runs. The Box–Behnken design was selected as the DoE for the RSM other than the 3n factorial design, to reduce the time and cost associated with extra experiments [30,60].
In the application of RSM, the correlation between the response variable and the independent variables can be represented by the equation below:
Y = f ( A ,   B ,   C )
where Y = liquid oil yield from MWP pyrolysis (response variable), while A, B, and C are independent variables representing temperature, residence time, and feed amount, respectively. The factors were investigated at three different levels: central (0), low (−1), and high (+1).
The formula [30] provided below was used to establish the total number of experiments:
T = p 2 + p + q
where T = total number of experimental runs, p = number of factors, and q = number of the centre point repeated.
There were 15 experiments with three centre-point trials (q = 3); three factors and three levels were chosen for the present optimisation study. The Minitab 16 statistical software package (Version 20.2, USA) was used to randomly generate the run orders of the experiments, shown in design Table 1, and a total of 15 runs were generated. The main aim of the experimental design was to optimise the process parameters to maximise the liquid oil yield (Y) from the pyrolysis of MWP. For statistical analysis, a second-order polynomial model was developed using the Box-Behnken design of the RSM to determine the effect of the three chosen process parameters on the liquid oil yield. Fitting the results to a quadratic polynomial model enables effective prediction of the system response, in this case, the liquid oil yield. It is a way to capture the non-linear relationships and optimise the experimental conditions for the desired outcome.
The form of the second-order polynomial model for predicting liquid oil yield is as follows [30]:
Y = β 0 + β 1 X 1 + β 2 X 2 + β 3 X 3 + β 1 , 2 X 1 X 2 + β 1 , 3 X 1 X 3 + β 2 , 3 X 2 X 3 + β 1 , 1 X 1 2 + β 2 , 2 X 2 2 + β 3 , 3 X 3 2
Were Y = predicted liquid oil yield, β 0 = constant coefficient, β 1 = linear coefficient, β 2 = quadratic coefficient, β 3 = interaction coefficient, and X 1 , X 2 , and X 3 are coded values of the independent variables.
Regression coefficients provide valuable insights into the extent of change in the response variable for each unit change in the independent variable, while holding all other independent variables constant. They are key indicators of the relationships within the model. This statistical control is essential in distinguishing the impact of one variable from all the others present in the model. Table 1 clearly describes the parameters and their range for the experimental study. Table 2 illustrates the actual and predicted yield of plastic pyrolytic oil from MWP pyrolysis and the experimental design matrix.

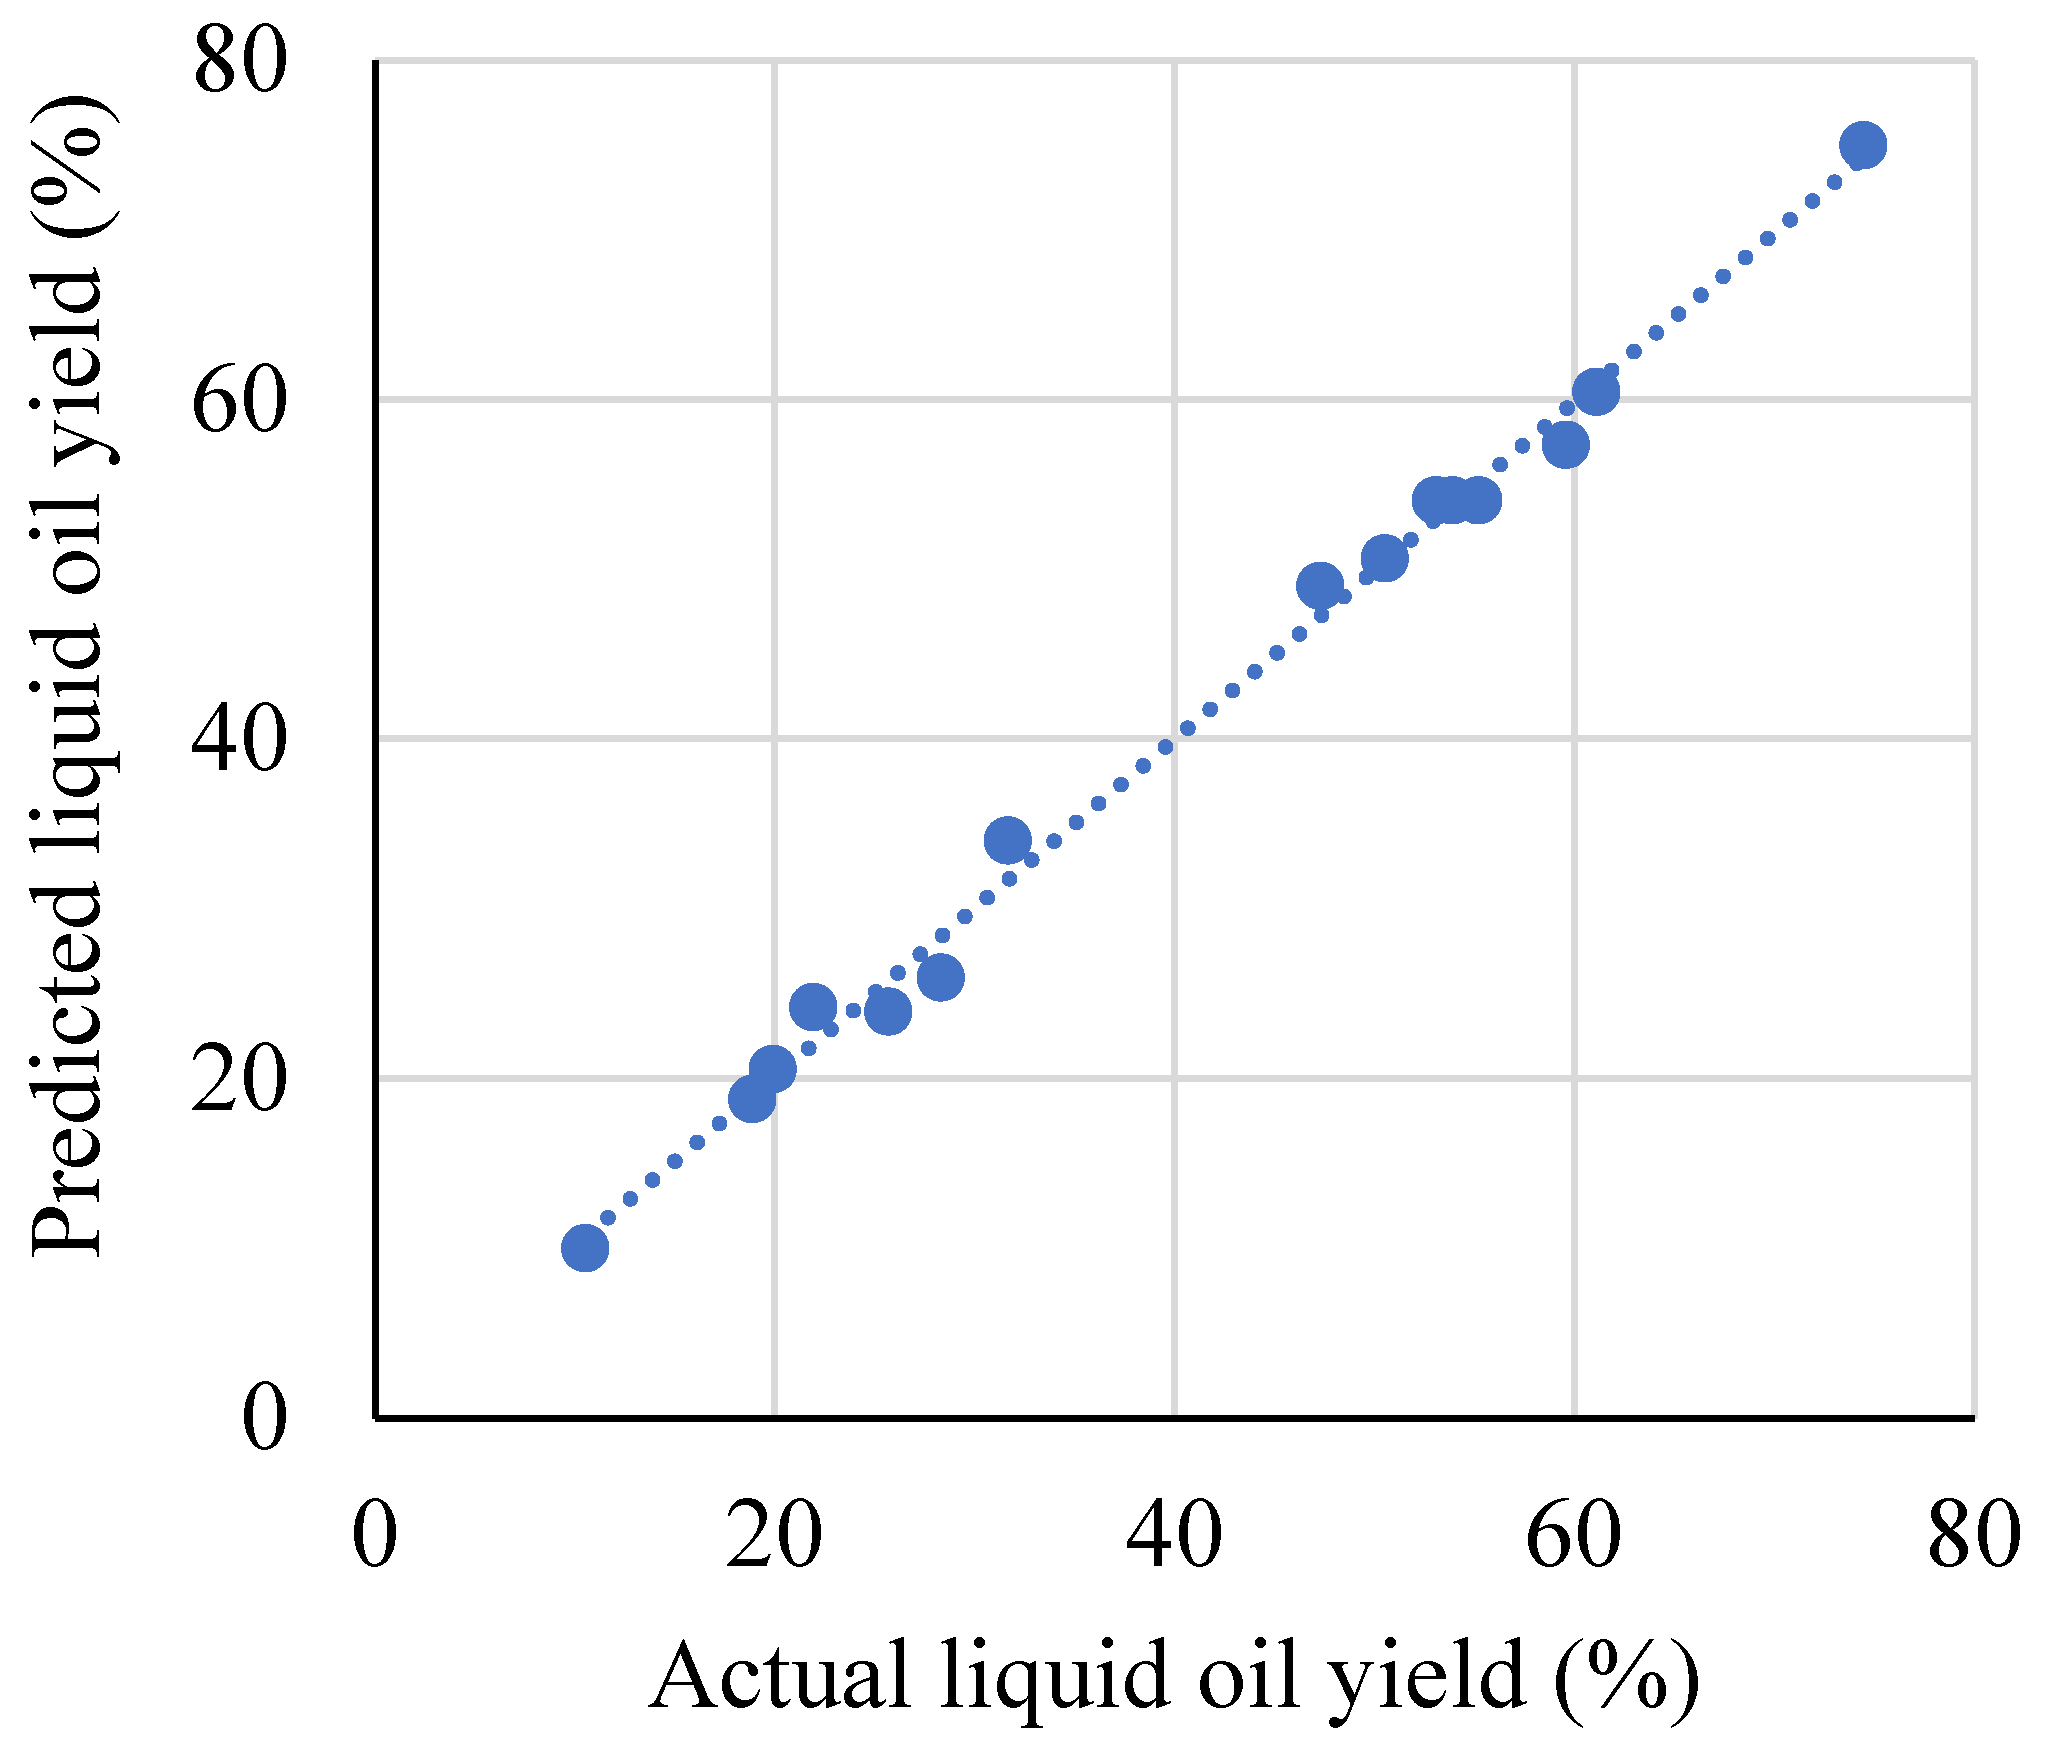
4. Statistical Analysis of the Developed Model

The optimisation process of MWP pyrolysis was statistically analysed using RSM, with the assistance of ANOVA. The aim of the analysis was to identify the process parameters that yielded better results. The actual yield of PPO was calculated through practical experiments, while the predicted PPO yield values were obtained via Minitab software. The fitness of the developed model was assessed using ANOVA. The impact of various factors was determined by the F value and the ratio of the mean square of treatments to the mean square of the error, in conjunction with the coefficient values. A factor is deemed statistically significant when the F value is sufficiently large, and the p value is less than 0.05. In addition to p and F values, various correlation coefficients, such as R2, predicted R2 (R2 pred), and adjusted R2 (R2 adj.), along with degrees of freedom, were considered to further validate the accuracy of the model. Moreover, 3D surface plots and contour plots were drawn to determine and analyse the effects of independent factors on the yield of PPO.

5. Results and Discussion

5.1. Optimisation of Liquid Oil Yield

As mentioned earlier, in the present study, three parameters were considered for optimisation: temperature, residence time, and feedstock particle size, and experimental design was conducted using BBD in response surface methodology. Each of the parameters was assessed at three different points. All the points were analysed to identify the topics producing higher amounts of pyrolytic liquid oil. The temperature was varied from 460 °C to 540 °C, the reaction time was changed from 30 min to 150 min, and the feedstock particle size was varied from 5 mm to 45 mm for the optimisation study. According to Table 2, Run 9 yielded the highest liquid oil, while Run 13 had the lowest liquid oil yield among the experimental design matrices. The table includes the actual yield of plastic oil along with the predicted yield. The difference between the actual and predicted values was minimal and negligible.
Figure 5 shows the graphical representation of the experimental vs. predicted liquid oil yield from the pyrolysis of MWP. The experimental yield of liquid oil varied in the range of 10.53 wt% to 74.47 wt%, and the predicted yield also matches closely with the experimental data, which shows the consistency of the developed model. R2 was obtained as 0.995, representing a reliable relationship between the independent and dependent variables. The response variable means at different factor levels were compared, to verify factor importance via ANOVA assessments.
Table 3 illustrates the elemental composition analysis of MWP. The data reveal that MWP has higher carbon and hydrogen contents, which are 79.9% and 12.6%, respectively. The proximate analysis also shows higher volatile matter content in waste plastics, 92.90%, and a small amount of moisture and fixed carbon content.
The model includes a polynomial equation representing the relationships between the dependent (response) and independent variables. Y is the pyrolytic oil yield, A is the temperature, B is the residence time, and D is the feedstock particle size.
Liquid oil yield, Y (wt%) = −1828 + 7.232 A − 0.683 B + 0.230 D
                                         −0.007139 A × A − 0.001775 B × B − 0.01759 D × D + 0.002608 A × B + 0.00111 A × D + 0.00011 B × D
The ANOVA results are presented in Table 4. Terms with a p value below 0.05 are considered statistically significant. Therefore, it can be said that A, B, A2, B2, D2, and A × B are considered as the significant terms of the developed model. In addition, it can also be concluded that among all the terms, A, B, and A2 have the highest significance in relation to the amount of liquid oil yield.

5.2. Analysis of Variance (ANOVA)

Analysis of variance was conducted to determine the statistical fit of the developed model.
Table 4 shows that the p value of the model is less than 0.0001, and the F value is 93.52, which provides evidence supporting the developed model’s statistical fitness. The quadratic model obtained fits effectively in predicting the response, evidenced by a high determination coefficient of R2 (99.41%). When the difference between two correlations, R2 pred and R2 adj., is smaller than 0.2, then it is considered that they are in reasonable agreement. Thus, in this developed model, R2(pred) and R2(adj.) values can be regarded as in good agreement.

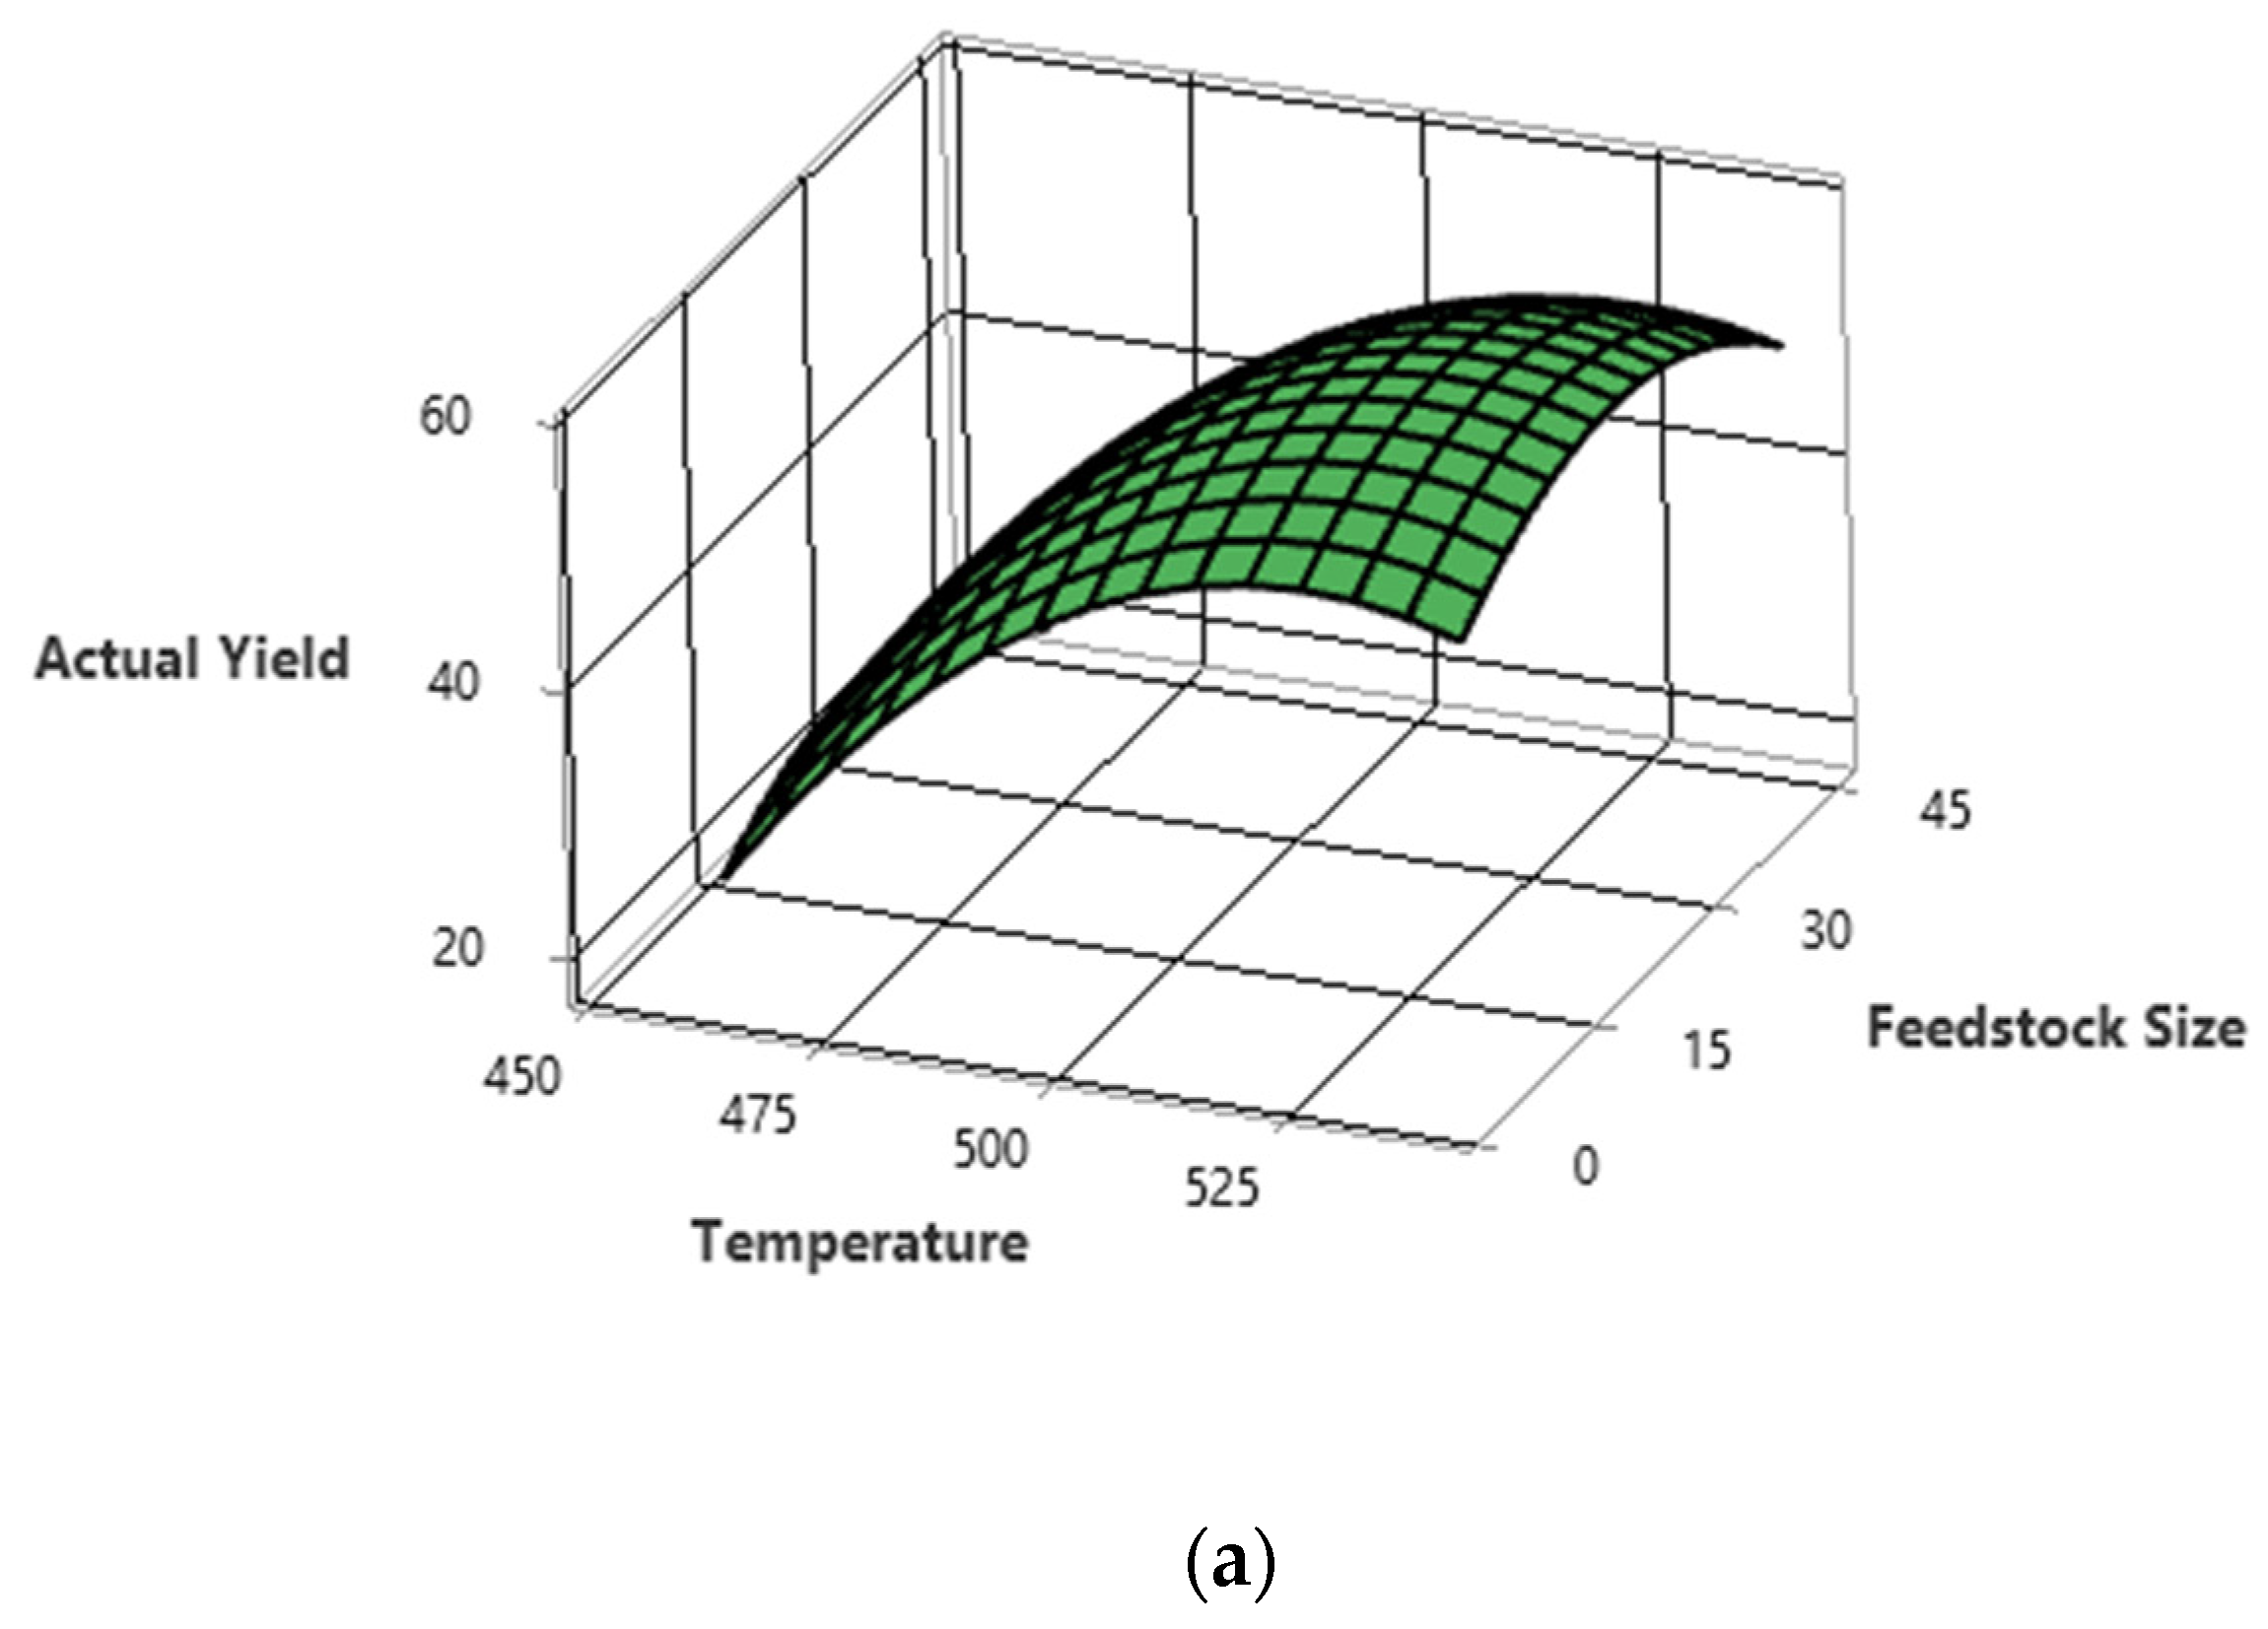
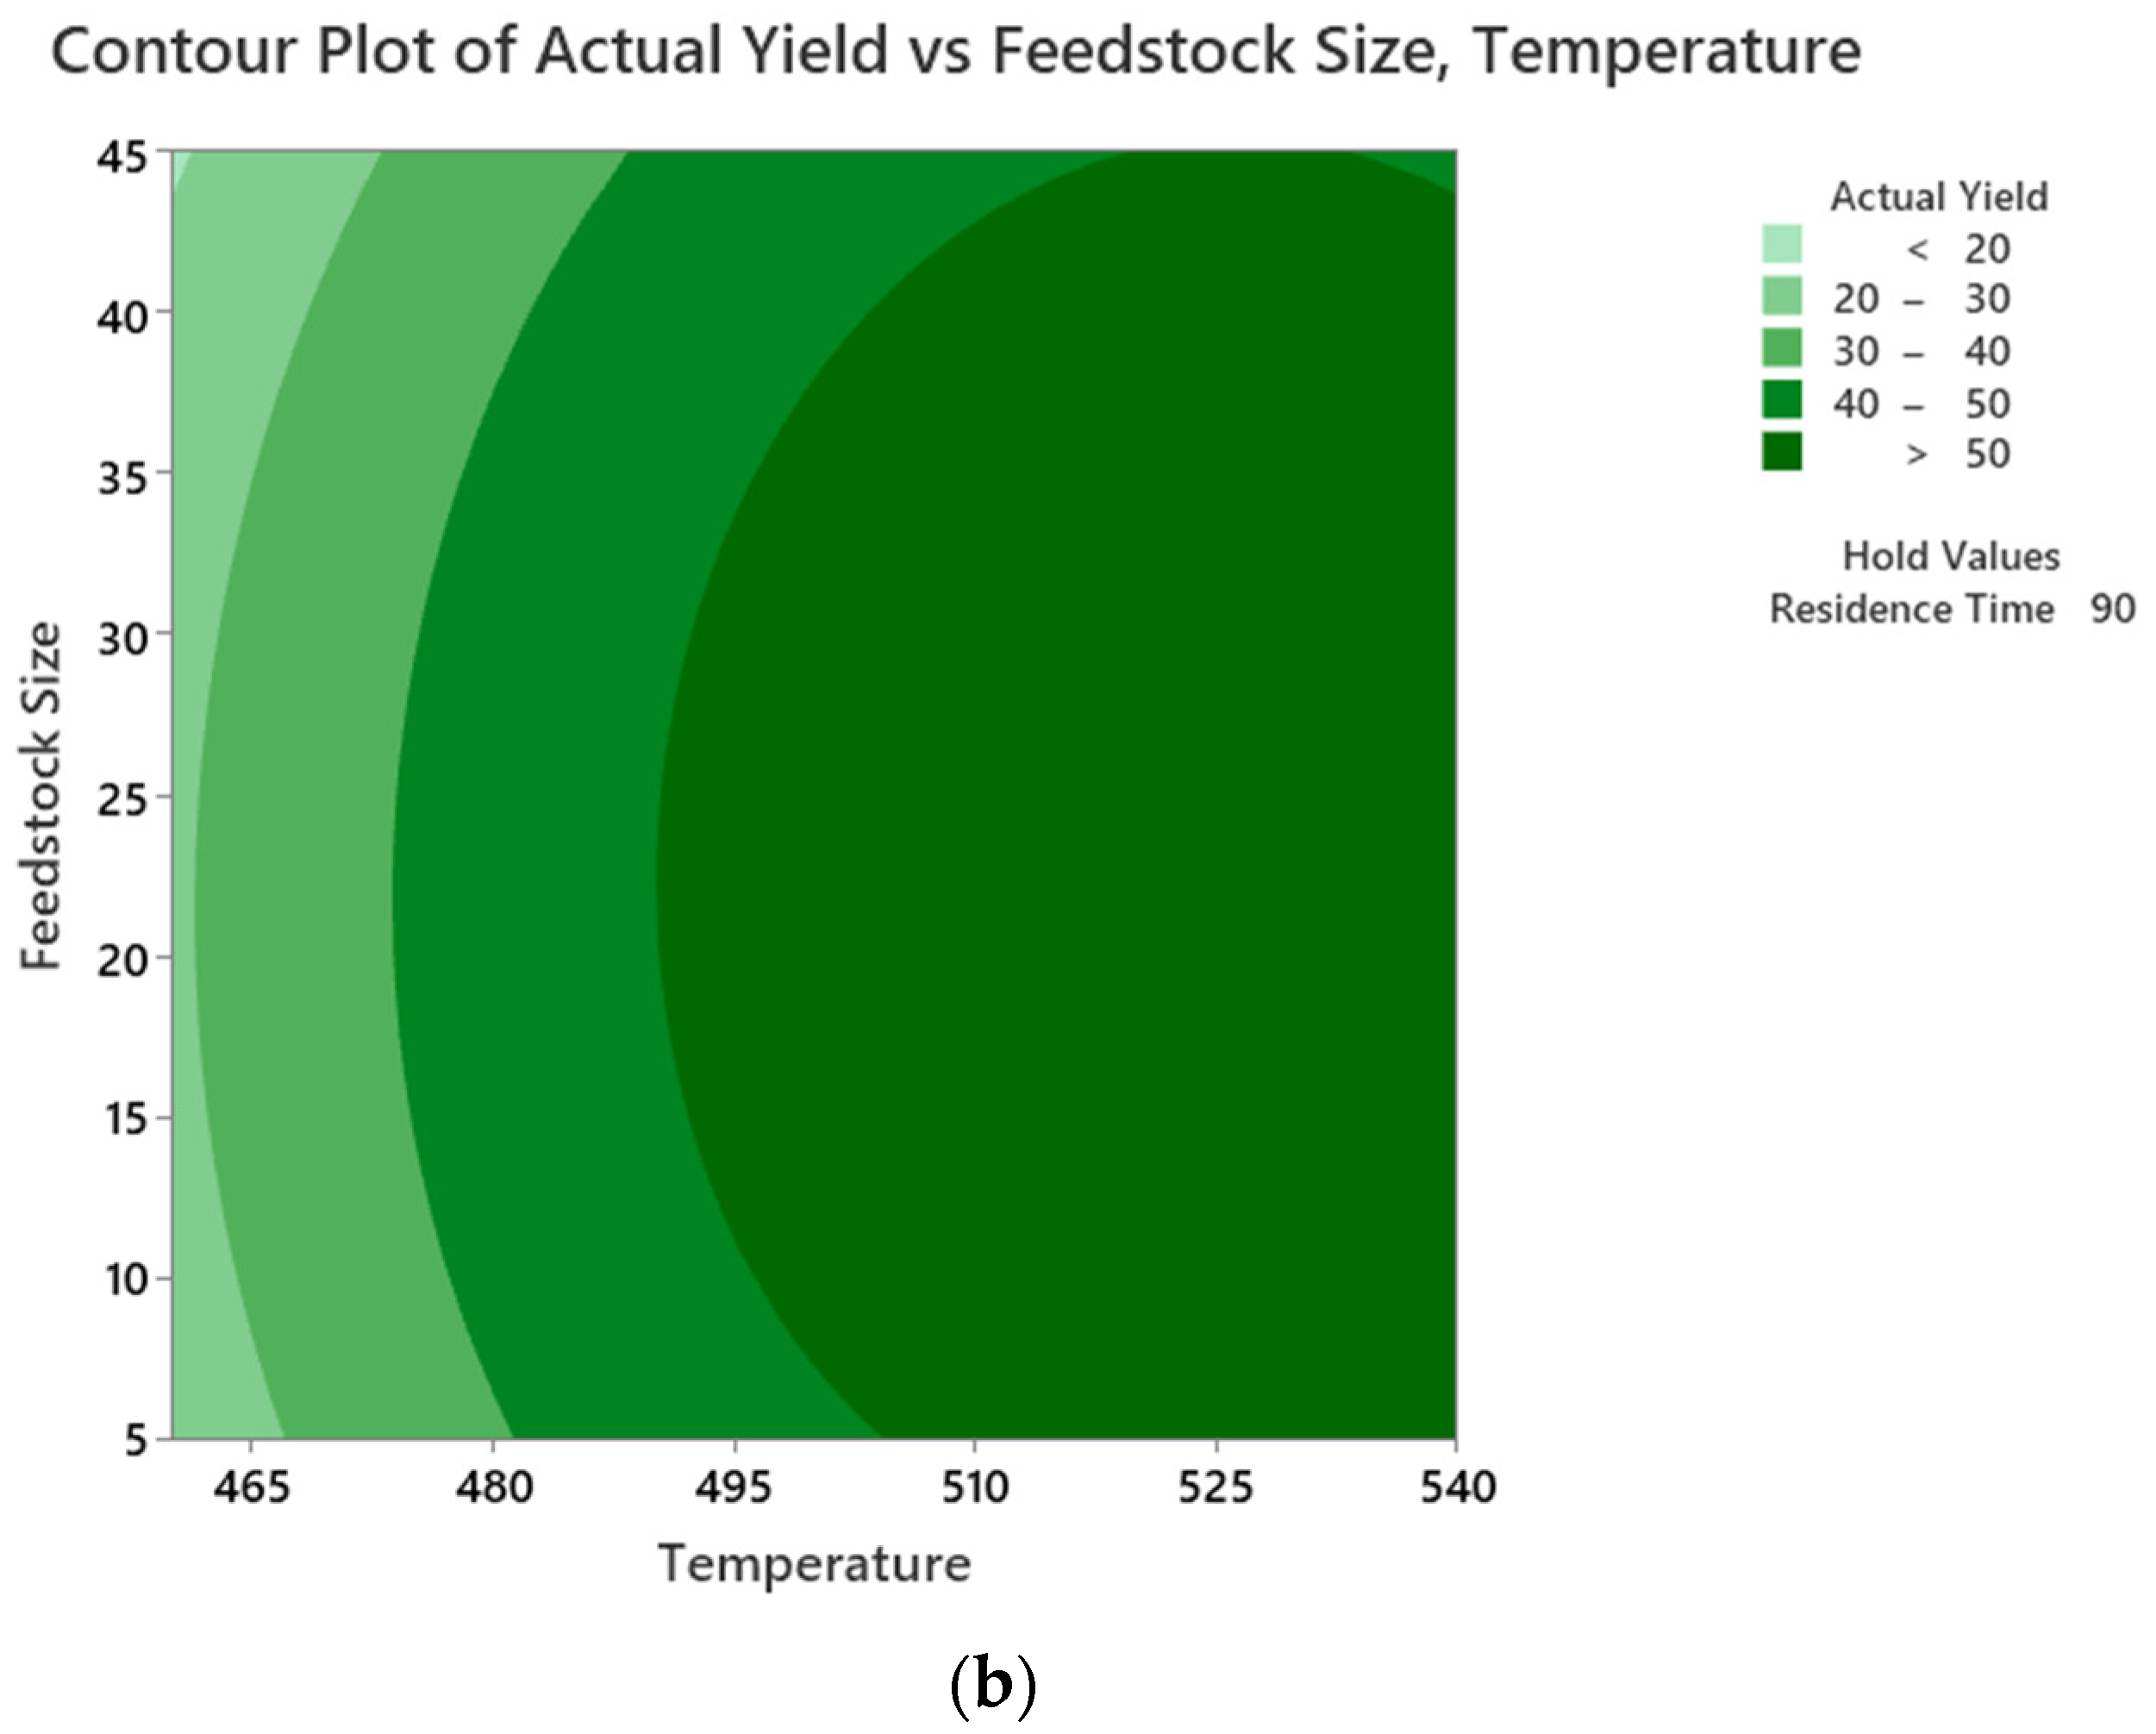
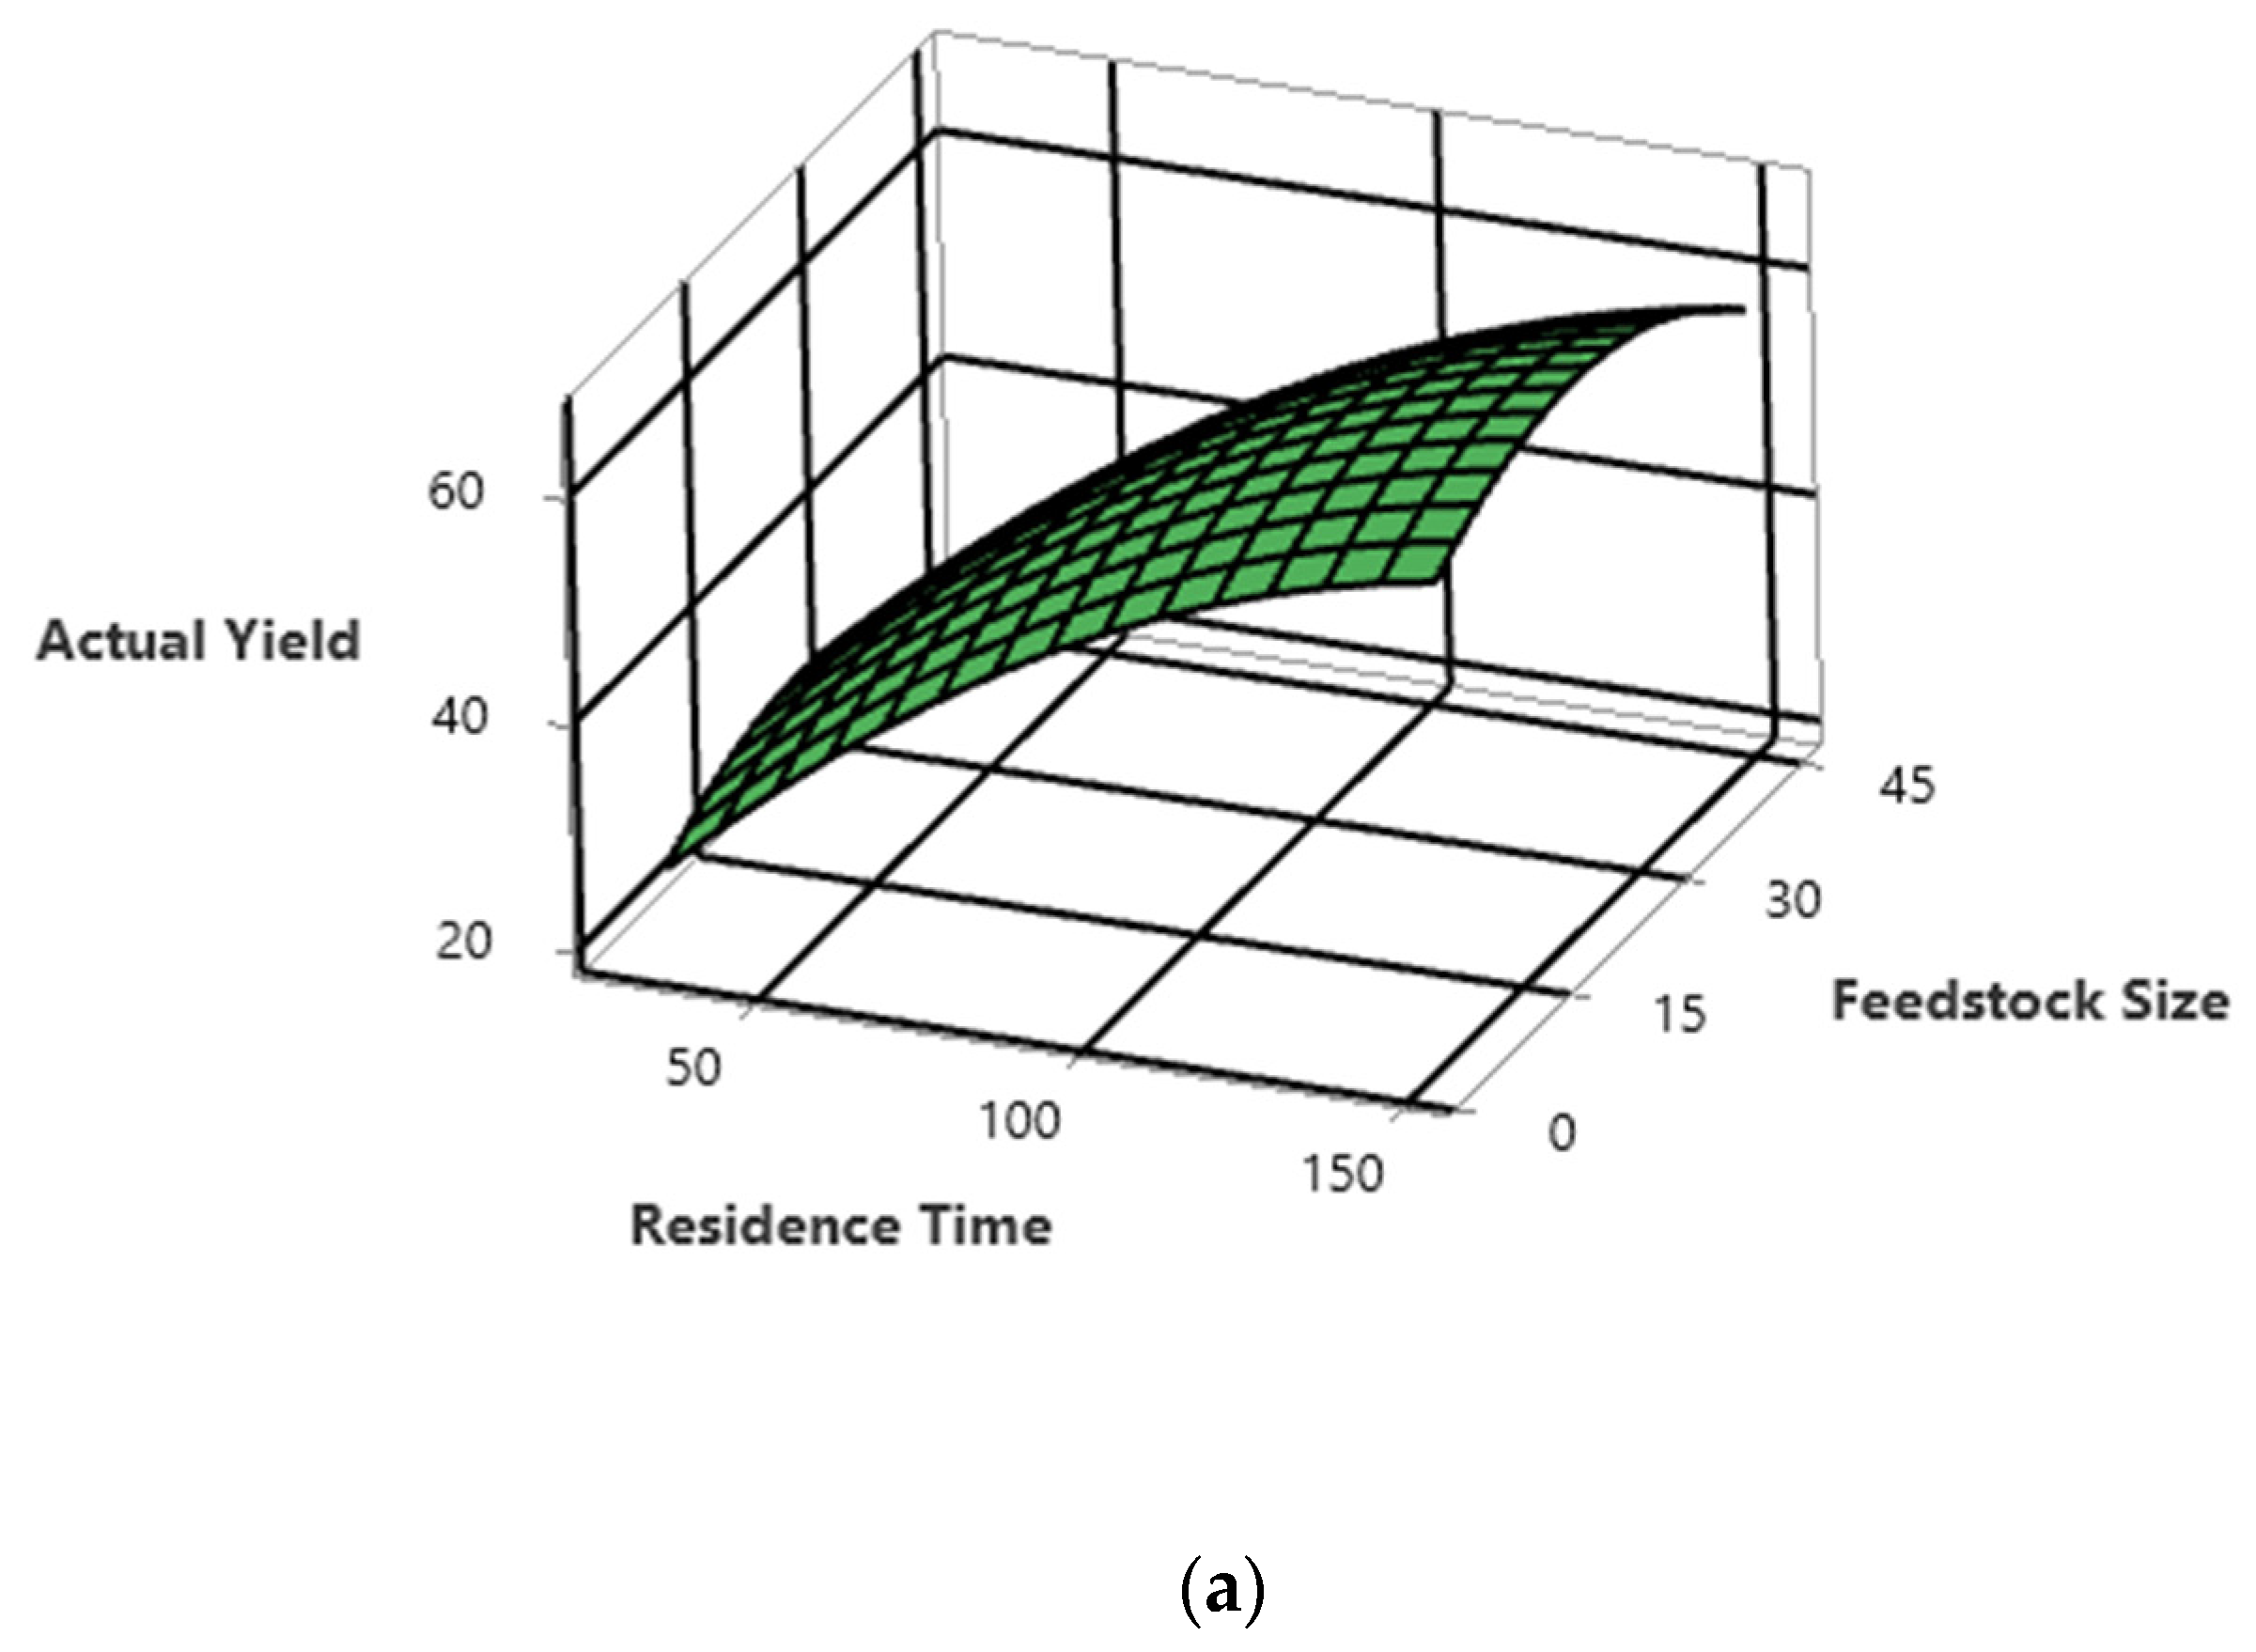
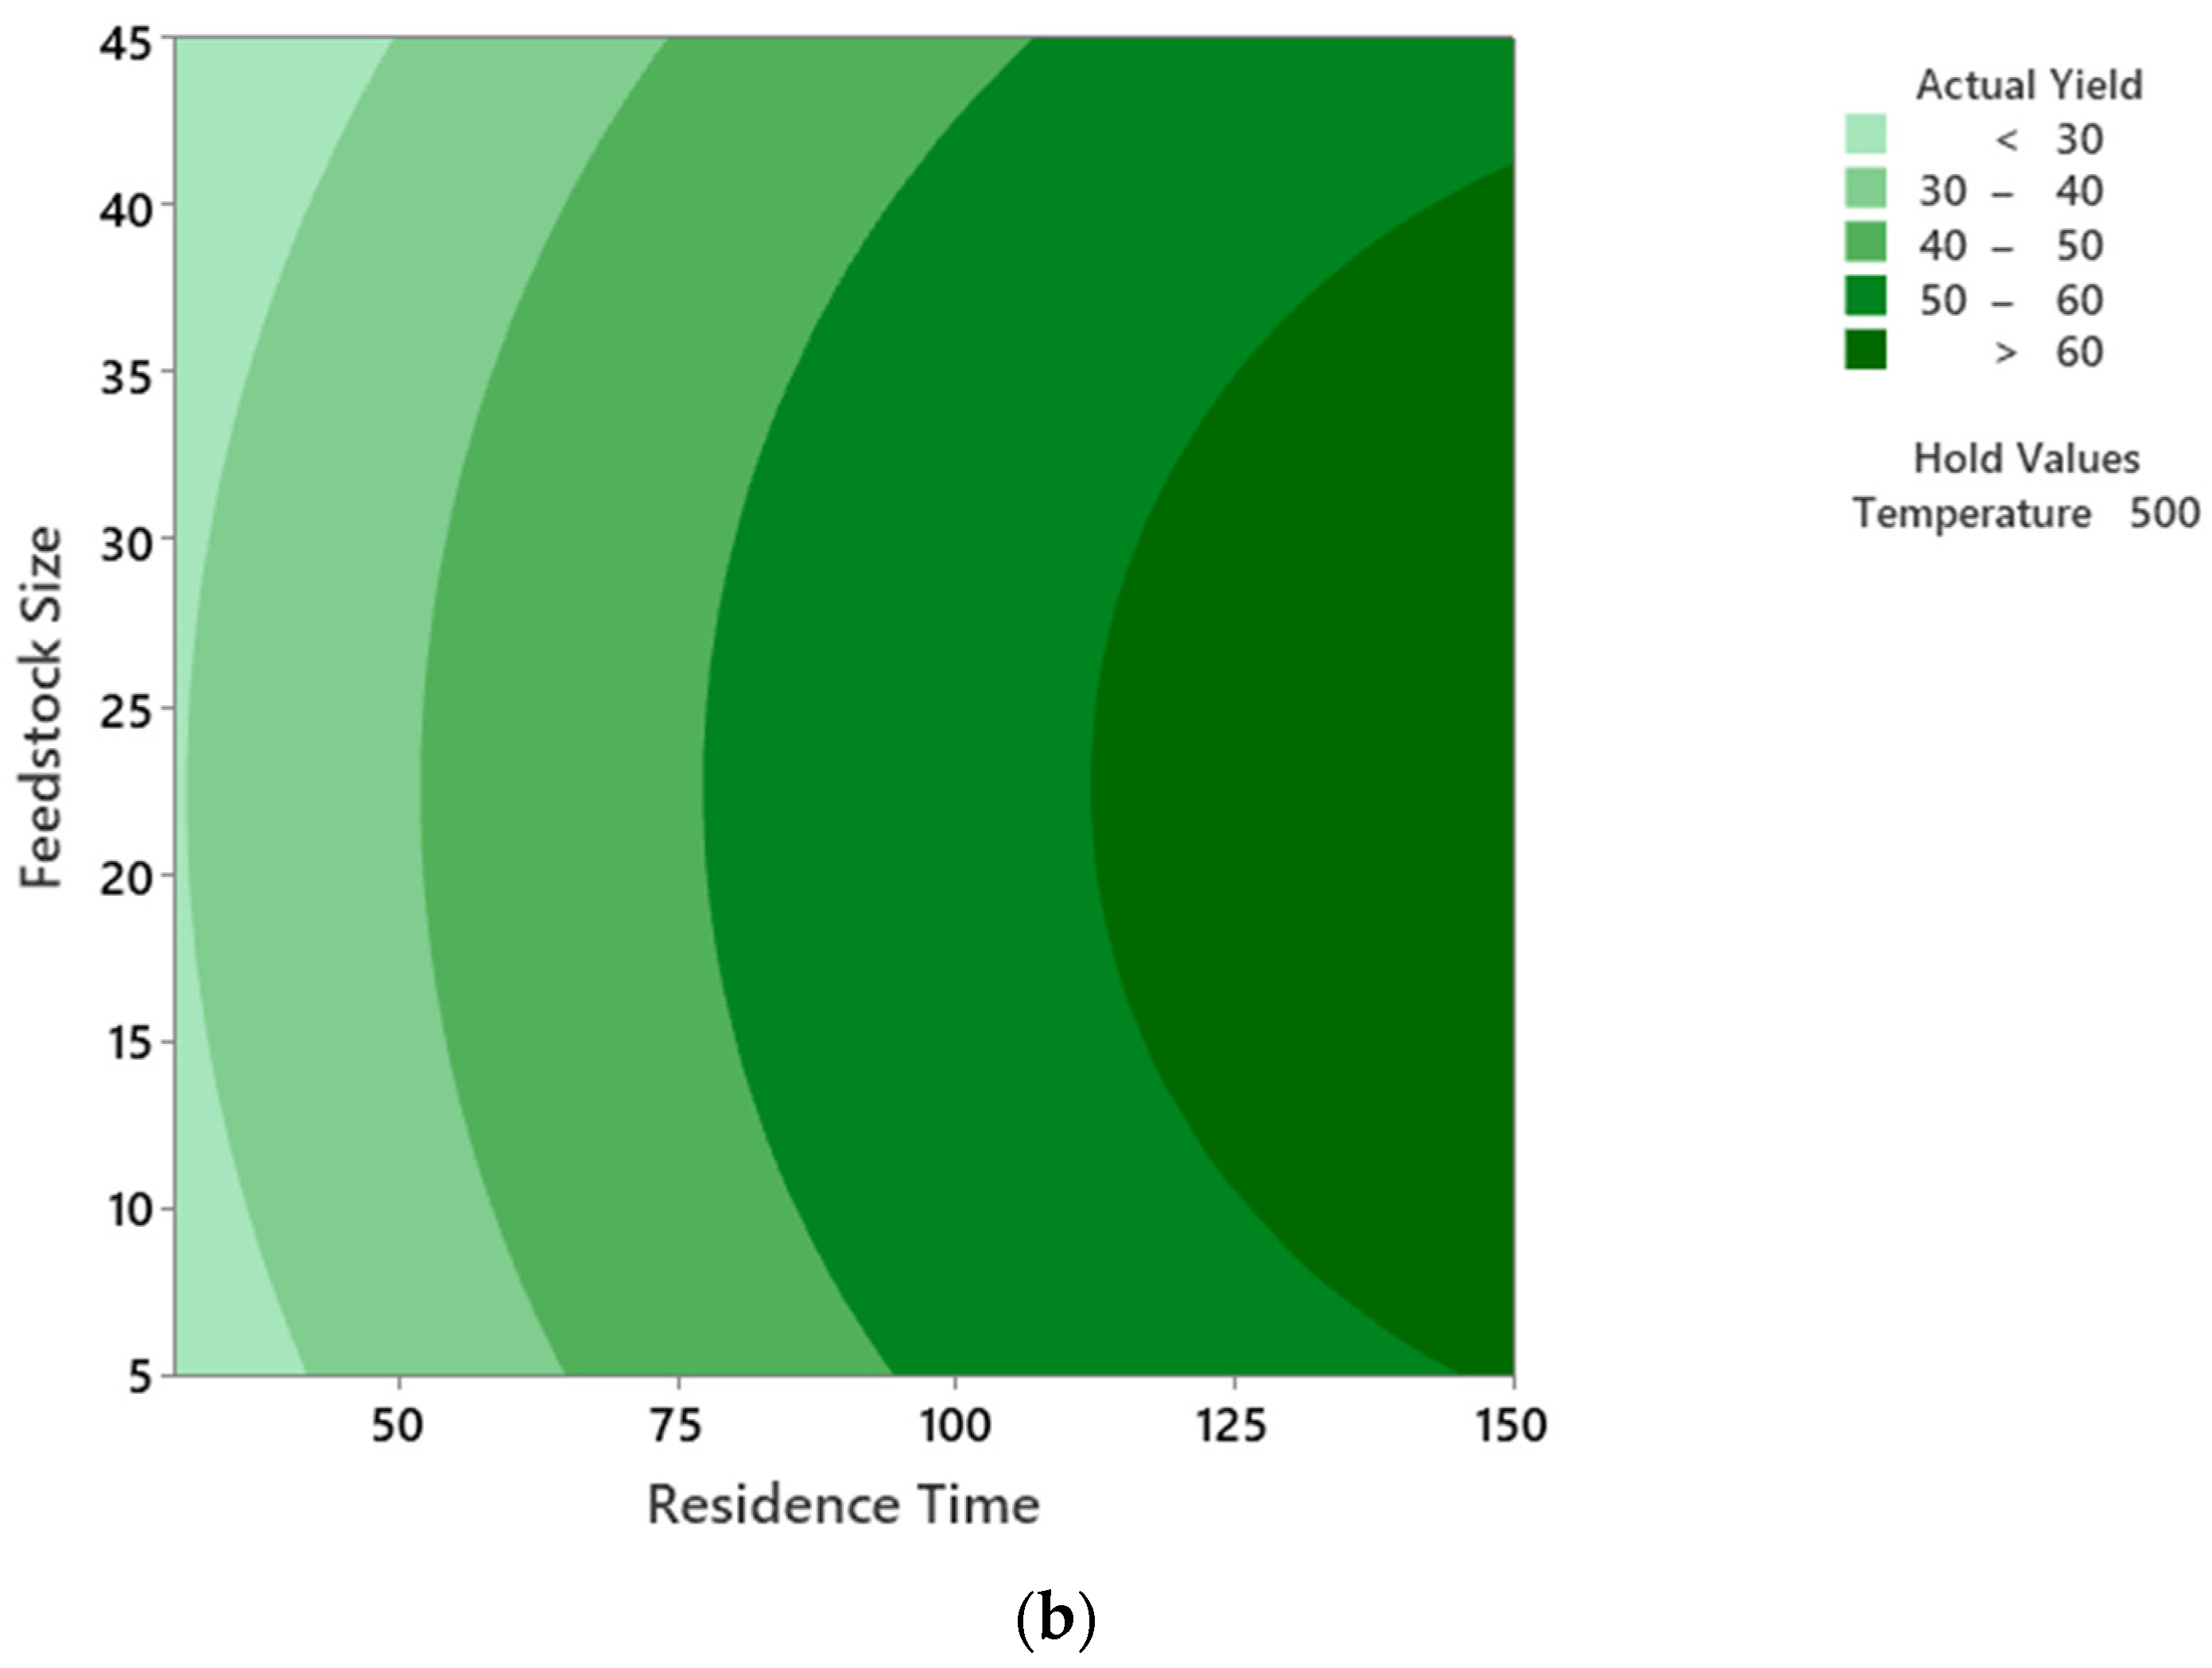
5.3. Interactions of the Process Parameters on PPO Yield

This study examined the influence of three distinct process factors—temperature, residence time, and feedstock particle size—on the liquid oil yield from thermal pyrolysis or MWP. The interaction between these factors was also examined using 3D surface plots and 2D contour plots. To determine the optimal liquid yield, two parameters were varied at a time while the third was kept constant at its average value. The contour plots served as a visual representation to depict the relationship between each factor’s response and the experimental levels. They also graphically displayed the regression equation [12]. Figure 6a,b illustrate the impact of temperature and residence time on the liquid oil yield from the thermal pyrolysis of MWP, with the feedstock size held constant at 25 mm.
Figure 6 demonstrates that the yield of plastic pyrolytic oil is influenced by the combined effects of temperature and residence time. The liquid oil yield was noted to rise with the elevation of both temperature and residence time. The increase in liquid oil yield with reaction temperature is predictable because the MWP molecules receive more energy at higher temperatures and form monomers by breaking more intermolecular bonds of the macromolecules [57]. Moreover, previous research also mentioned an increase in liquid oil yield at increased residence time due to increased heat energy being transported to the MWP molecules and helping them decompose more. Figure 6 shows that at temperatures higher than 500 °C, the liquid oil yield increased with increasing residence time. Moreover, when the reaction temperature was lower than approximately 500 °C, even at the highest residence time, the liquid oil yield was not in the higher range.
From the ANOVA results documented in Table 4, it can be noted that the F values for temperature (A) and residence time (B) were 262.84 and 432.62, respectively, for individual terms and 78.11 and 24.46 for their square terms. The p values for both the individual and squared terms are below 0.05, indicating that their influence on the liquid oil yield is statistically significant. The highest amount of liquid was 74.47% at a temperature of 540 °C and 150 min residence time. The liquid oil yield decreased after approximately 536 °C, while the residence times were longer. The reason could be the formation of more gases that are not condensable at increased temperatures by secondary cracking [12]. Thus, choosing the higher temperature range of 540 °C was appropriate. Nevertheless, there was no observed decrease in the production of liquid oil yield for the residence time of 150 min. This behaviour denotes that pyrolytic oil continued to be produced at a residence time of 150 min at temperatures above 500 °C. The MWP pyrolysis model is significantly affected by reaction time and temperature at the 95% confidence level.
In Figure 7a, the three-dimensional surface plots depict the empirical model’s variation with respect to two factors, temperature and feedstock particle size, within the considered experimental range and at a fixed residence time of 90 min. The above figure shows that the liquid oil yield increases with increasing temperature. Figure 7 shows that at temperatures higher than 495 °C, the liquid oil yield increases sharply for both small and large particle sizes of the feedstock. At temperatures above 500 °C, a higher liquid oil yield was only achieved when the feedstock size was approximately 24 mm. From the nature of the graph, it can be said that after reaching a specific higher temperature, the liquid oil yield starts to decrease, because of the secondary cracking of volatiles. This phenomenon increases the yield of syngas [62]. The liquid oil yield was lower when the feedstock size was too low in the 5 to 20 mm range and for larger particle sizes greater than approximately 25 mm. Figure 7 also shows that particle size also has some impact on the pyrolytic oil yield. For larger size feedstock particles, heat transfer reduces as the rate of heat and mass transfer to the feedstock depend on its shape, size, and homogeneity. Therefore, the temperature in the feedstock reduces and thus the yield of PPO [30]. However, the p value for feedstock particle size (single term) is 0.111, more significant than 0.05, which means that its effect on liquid oil yield is insignificant. Selvaganapathy et al. [11] also observed a less significant effect of feedstock particle size on liquid oil yield from pyrolysis of waste PS.
The combined effect of residence time and feedstock particle size can be demonstrated from the 3D surface and 2D contour plots in Figure 8a,b. It is evident from the contour plot that when the residence time increases, the liquid oil yield increases as well, especially after approximately 80 min. However, after reaching a certain highest yield with the increase of residence time, further liquid PPO yield starts to decrease as most of the feedstock is pyrolyzed by then. Particle size did not significantly affect liquid oil yield (p < 0.05) in either single or interacting terms. However, when the feedstock particle size was very small (less than 20 mm) and too large (greater than 30 mm), the PPO yield was relatively small. Thus, the optimum yield was found when the feedstock particle size was close to the mean value (25 mm).
The process parameters were optimised by keeping the independent variables’ values within the stated range and maximising the yield of PPO. Table 5 shows the ranges for the independent and dependent variables for the optimisation study and the maximum and minimum amounts of liquid oil obtained from the experiments.
To attain a peak liquid plastic oil yield of 75.14%, the optimal operational conditions were a temperature of 535.96 °C, a residence time of 150 min, and a feedstock particle size of 23.99 mm. The actual values of the operating parameters chosen for the optimisation study varied slightly from the abovementioned values due to the limitation of the pyrolysis instrument. The parameters chosen for the optimisation studies were a temperature of 536 °C, a residence time of 150 min, and a feedstock particle size of 24 mm. Three experiments were conducted under the optimum operating conditions to validate the model. Table 6 displays both the experimental and predicted values of the PPO yield under optimal conditions.

5.4. Characterisation of PPO under Optimum Conditions

The PPO acquired under optimum operating conditions underwent characterisation. Characterisation involved conducting fuel property tests and Fourier transform infrared spectroscopy (FTIR). Standard test methods were employed to determine the liquid fuel’s density, kinematic viscosity, flash point, calorific value, water content, lubricity, sulfur content, and cetane index, and are listed in Table 7.
The properties of the crude PPO were measured and compared with ASTM, EN, and Australian standard diesel and are described in Table 8.
Table 8 shows that the HHV of the produced crude PPO under the optimum operating conditions satisfies two of the fuel standards. However, the HHV obtained by Khatha et al. [64] was 37.72 MJ/kg and lower than the described value for diesel fuel in all the standards. The kinematic viscosity measured for the produced crude PPO was lower than the value mentioned in all the diesel fuel standards. Khatha et al. [64] also found a low KV (1.66 mm2/s) for the crude PPO produced in their study. The cetane index for the crude PPO in this study was found to be low 32 and failed to satisfy any of the diesel fuel test standards. Nevertheless, the water content, sulfur content, lubricity, and density values agree well with all the diesel testing standards. The literature review includes reports of higher sulfur content in crude PPO; for example, Bezergianni et al. [63] documented 42.9 mg/kg of sulfur from PPO obtained from waste plastics, which does not satisfy any of the diesel fuel property measurement standards. However, the flash point for the crude PPO produced under optimised pyrolytic conditions in this study was very low, at less than 20 °C, and using this in an engine would be a fire hazard. Bezergianni et al. [63] and Janyalertadun et al. [65] also documented lower flash points for crude PPO compared with the standards. Finally, it can be concluded that the crude PPO produced from the pyrolysis of MWP had low KV, CI, and flash points. At the moment, these factors hinder its suitability as a readily applicable fuel in automobile engines. However, posttreatment processes, such as distillation and hydrotreatment, can significantly improve these parameters. The researchers in this study conducted distillation and hydrotreatment of crude PPO obtained under optimum operating conditions and analysed the fuel properties of distilled and hydrotreated PPO. Distillation was conducted with a pilot-scale vacuum distillation unit (iFischer AutoDest 800/860 AC, i-Fischer Engineering, Germany). Gasoline distillation temperatures were set at <170 °C, diesel distillation temperatures ranged from 170 °C to 380 °C, with lube oil and residue distillation temperatures > 380 °C. After completing the distillation run, the diesel fraction was collected and analysed. The distilled diesel fraction was hydrotreated afterwards, which is a vital refinery process to improve the quality of the pyrolytic oil by removing heteroatoms and saturating alkenes [66,67]. Hydrotreatment was carried out in this study to catalyse hydrodesulfurization (HDS), nitrogen removal (HDN), and hydrodeoxygenation (HDO) from the distilled diesel fraction of the plastic pyrolytic oil.
Experiments conducted by the researchers in the present study have shown that properties such as water content, sulfur content, cetane index, lubricity, etc., improve significantly after post-treating the crude PPO. For example, the cetane index was found to be 32 for PPO from waste plastics, which was very low and does not satisfy the minimum requirements of the applied diesel fuel standards; however, CI increased to 48 in distilled plastic diesel and further to 59 in hydrotreated plastic diesel, which is well above the minimum requirement. It was also observed that DPD and HPD satisfied the quality specifications of Australian standard diesel standards. Kinematic viscosity of CPPO increased from 1.32 to 2.72 mm2/s after distillation; after hydrotreatment, it reached 2.95 mm2/s. Reduction in sulfur content from 5.12 mg/kg to 2.83 mg/kg was achieved when waste plastics PPO was hydrotreated, satisfying the diesel standards. The lubricity of DPD and HPD also satisfies the Australian diesel standards.
Detail analysis of the distillation and hydrotreatment processes and the physicochemical properties of the crude, distilled, and hydrotreated pyrolytic oil has been discussed in another research paper by the current authors [28].

5.5. FTIR Analysis of PPO

Fourier transform infrared spectroscopy (FTIR) plays a crucial role as an analytical technique for the identification of distinct functional groups within pyrolytic oil. Figure 9 illustrates the FTIR spectrum obtained via analysing the PPO produced by thermal pyrolysis of MWP under optimum operating conditions. The FTIR technique works by interacting pyrolytic oil with infrared light, which causes the chemical bonds to undergo stretching, absorption, and contracting of infrared radiation at a specific wavelength [12]. FTIR analysis can identify different functional groups by analysing the peak intensities of PPO.
In Figure 9, the peak at approximately wavenumber 2924.65 is probably due to the presence of alkanes with C–H stretching vibrations with a strong appearance, and the peak detected at approximately wavenumber 2856.35 cm−1 also represents alkanes due to C–H stretching. Selvaganapathy et al. [11] also documented the presence of alkanes at wavenumbers 2919.22 cm−1 and 2854.01 cm−1 with C–H stretching with a strong appearance, for PPO obtained from the pyrolysis of polystyrene. The relatively smaller peaks at 3082.93 cm−1 probably represent the presence of functional group alkenes because of =C–H stretching. The wavenumber of 1642.26 cm−1 is perhaps due to the presence of alkene functional groups due to C=C stretching [12]. The peak with a strong appearance at 1454.31 cm−1 could be due to the C–H bending and scissoring of alkane functional groups. Moreover, an alkane group was detected at 1376.86 cm−1, probably because of CH3C–H bending in the medium appearance. The peak found at 965.27 cm−1 is probably because of the vibration of C–H bending and represents the functional group alkene. The wavenumber 888.66 cm−1 exhibits the presence of an alkene functional group due to =C–H bending in a strong appearance. Moreover, an alkene functional group was detected at a frequency of approximately 775.23 cm−1, which might result from C–H bending vibrations. The presence of alkanes, alkenes, aromatics, etc., suggests the potential of using PPO as a liquid hydrocarbon [30,68]. These results are comparable to the findings of research articles by Kumar and Singh [9] and Selvaganapathy et al. [11], where FTIR analysis was conducted for PPO obtained from the pyrolysis of HDPE and PS plastics, respectively, under optimum conditions [11,12]. In conclusion, it can be affirmed that the diverse chemical compounds found in pyrolytic oil derived from waste plastics can be readily categorised through the analysis of FTIR spectra. Categorisation means FTIR analysis can identify specific functional groups, molecular bonds, or characteristic absorption bands present in the spectra of the oil samples.
For example, the presence of various chemical groups like alkanes, aromatics, alkenes, etc., can be identified by FTIR spectra. Moreover, comparison among different oil samples is possible by FTIR analysis, based on the intensity and position of absorption peaks corresponding to different fu nctional groups. These characterisation results can be useful for identifying the influence of different pyrolysis process parameters on the chemical composition of the produced pyrolytic oils and thus can be used for optimisation studies as well.

6. Conclusions

In this study, thermal pyrolysis of MWP to produce liquid pyrolytic oil was conducted. To maximise the yield of liquid oil, a combination of RSM and BBD was used to optimise three vital experimental operating parameters: reaction temperature, feedstock particle size, and reaction time. A quadratic model was developed and the validation of the model was conducted under the optimum operating conditions achieved from the model. The experimental average maximum yield of plastic pyrolytic oil (PPO) was found to be 75.55%, with an average error of 0.88%. The experimental and predicted liquid yields were close, indicating the accuracy of the model. The quadratic model is a strong fit for predicting the liquid oil yield response, as indicated by its high coefficient of determination R2 (99.41%). The researchers found that temperature and reaction time had a greater impact on liquid oil yield compared with feedstock particle size, based on ANOVA analysis. The model can be used by other researchers, with a few modifications depending on the experimental conditions. The oil produced has properties comparable to petroleum fuels and thus has the potential to be used as automobile fuel. However, the crude PPO has a lower CI, KV, and flash point and higher sulfur and water content than the standard values for automobile diesel according to ASTM, EN, and Australian standards. Therefore, additional processing is required for crude PPO to make it suitable for use as a direct replacement fuel in automobile engines.

Author Contributions

Conceptualization, F.F. and A.A.C.; methodology, F.F.; software, F.F.; validation, F.F. and M.I.J.; formal analysis, F.F. and M.I.J.; investigation, F.F.; resources, A.A.C.; data curation, F.F. and M.I.J.; writing—original draft preparation, F.F.; writing—review and editing, M.G.R.; A.A.C. and M.I.J.; visualization, F.F.; supervision, M.G.R., A.A.C. and M.I.J.; project administration, M.G.R. and M.I.J.; funding acquisition, M.G.R., and M.I.J. All authors have read and agreed to the published version of the manuscript.

Funding

This research was funded by CRC-P project with the project number CRCPEIGHT000194, which focuses on Australian Standard Diesel from Mixed Waste Plastics, and the Advanced Queensland Industry Research Fellowship project with the project number RSH/6017, which aims to optimise renewable fuel production from mixed waste for a more affordable and environmentally friendly Queensland.

Institutional Review Board Statement

Not applicable.

Informed Consent Statement

Not applicable.

Data Availability Statement

Data is contained within the article.

Conflicts of Interest

The authors declare no conflict of interest.

References

  1. Nanda, S.; Berruti, F. Thermochemical conversion of plastic waste to fuels: A review. Environ. Chem. Lett. 2021, 19, 123–148. [Google Scholar] [CrossRef]
  2. Statistica. Global Plastic Production 1950–2020. 2021. Available online: https://www.statista.com/statistics/282732/global-production-of-plastics-since-1950/ (accessed on 25 January 2024).
  3. Zhang, K.; Shi, H.; Peng, J.; Wang, Y.; Xiong, X.; Wu, C.; Lam, P.K. Microplastic pollution in China’s inland water systems: A review of findings, methods, characteristics, effects, and management. Sci. Total Environ. 2018, 630, 1641–1653. [Google Scholar] [CrossRef] [PubMed]
  4. Padervand, M.; Lichtfouse, E.; Robert, D.; Wang, C. Removal of microplastics from the environment. A review. Environ. Chem. Lett. 2020, 18, 807–828. [Google Scholar] [CrossRef]
  5. Gourmelon, G. Global plastic production rises, recycling lags. Vital Signs 2015, 22, 91–95. [Google Scholar]
  6. Eriksen, M.; Lebreton, L.C.; Carson, H.S.; Thiel, M.; Moore, C.J.; Borerro, J.C.; Galgani, F.; Ryan, P.G.; Reisser, J. Plastic pollution in the world’s oceans: More than 5 trillion plastic pieces weighing over 250,000 tons afloat at sea. PLoS ONE 2014, 9, e111913. [Google Scholar] [CrossRef]
  7. Statistica. Plastic Material Production Worldwide by Region 2019. 2019. Available online: https://journals.plos.org/plosone/article?id=10.1371/journal.pone.0111913 (accessed on 25 January 2024).
  8. Kumar, R.; Mishra, M.; Singh, S.; Kumar, A. Experimental evaluation of waste plastic oil and its blends on a single cylinder diesel engine. J. Mech. Sci. Technol. 2016, 30, 4781–4789. [Google Scholar] [CrossRef]
  9. Kumar, A.; Sharma, M. GHG emission and carbon sequestration potential from MSW of Indian metro cities. Urban Clim. 2014, 8, 30–41. [Google Scholar] [CrossRef]
  10. Lee, K.-H.; Shin, D.-H. Characteristics of liquid product from the pyrolysis of waste plastic mixture at low and high temperatures: Influence of lapse time of reaction. Waste Manag. 2007, 27, 168–176. [Google Scholar] [CrossRef] [PubMed]
  11. Selvaganapathy, T.; Muthuvelayudham, R.; Jayakumar, M. Process parameter optimization study on thermolytic polystyrene liquid fuel using response surface methodology (RSM). Mater. Today Proc. 2020, 26, 2729–2739. [Google Scholar] [CrossRef]
  12. Kumar, S.; Singh, R.K. Optimization of process parameters by response surface methodology (RSM) for catalytic pyrolysis of waste high-density polyethylene to liquid fuel. J. Environ. Chem. Eng. 2014, 2, 115–122. [Google Scholar] [CrossRef]
  13. Ayodele, T.R.; Durodola, O.; Ogunjuyigbe, A.S.; Munda, J.L. Effects of operating factors on the bio-oil produced from pyrolysis of plastic wastes using response surface methodology. In Proceedings of the 2019 IEEE PES/IAS PowerAfrica, Abuja, Nigeria, 20–23 August 2019; pp. 527–532. [Google Scholar]
  14. Pinto, F.; Paradela, F.; Gulyurtlu, I.; Ramos, A.M. Prediction of liquid yields from the pyrolysis of waste mixtures using response surface methodology. Fuel Process. Technol. 2013, 116, 271–283. [Google Scholar] [CrossRef]
  15. Miranda, M.; Pinto, F.; Gulyurtlu, I.; Cabrita, I.; Nogueira, C.; Matos, A. Response surface methodology optimization applied to rubber tyre and plastic wastes thermal conversion. Fuel 2010, 89, 2217–2229. [Google Scholar] [CrossRef]
  16. Prabha, B.; Ramesh, D.; Sriramajayam, S.; Uma, D. Optimization of Pyrolysis Process Parameters for Fuel Oil Production from the Thermal Recycling of Waste Polypropylene Grocery Bags Using the Box–Behnken Design. Recycling 2024, 9, 15. [Google Scholar] [CrossRef]
  17. Dutta, N.; Mondal, P.; Gupta, A. Optimization of process parameters using response surface methodology for maximum liquid yield during thermal pyrolysis of blend of virgin and waste high-density polyethylene. J. Mater. Cycles Waste Manag. 2022, 24, 1182–1193. [Google Scholar] [CrossRef]
  18. Jahirul, M.I.; Koh, W.; Brown, R.J.; Senadeera, W.; O’Hara, I.; Moghaddam, L. Biodiesel production from non-edible beauty leaf (Calophyllum inophyllum) oil: Process optimization using response surface methodology (RSM). Energies 2014, 7, 5317–5331. [Google Scholar] [CrossRef]
  19. Li, X.; Wang, B.; Wu, S.; Kong, X.; Fang, Y.; Liu, J. Optimizing the conditions for the microwave-assisted pyrolysis of cotton stalk for bio-oil production using response surface methodology. Waste Biomass Valorization 2017, 8, 1361–1369. [Google Scholar] [CrossRef]
  20. Gupta, S.; Patel, P.; Mondal, P. Biofuels production from pine needles via pyrolysis: Process parameters modeling and optimization through combined RSM and ANN based approach. Fuel 2022, 310, 122230. [Google Scholar] [CrossRef]
  21. Vasile, C.; Brebu, M.; Sakata, Y.; Pakdel, H.; Roy, C.; Miranda, R. Solid waste treatment by pyrolysis methods. J. Environ. Prot. Ecol. 2002, 3, 230e235. [Google Scholar]
  22. Thorat, P.; Warulkara, S.; Sathonea, H. Pyrolysis of waste plastic to produce Liquid Hydroocarbons. Adv. Polym. Sci. Technol. Int. J. 2013, 3, 14–18. [Google Scholar]
  23. Sembiring, F.; Purnomo, C.W.; Purwono, S. Catalytic Pyrolysis of Waste Plastic Mixture. In IOP Conference Series: Materials Science and Engineering; IOP Publishing: Bristol, UK, 2018; p. 012020. [Google Scholar]
  24. Lopez-Urionabarrenechea, A.; De Marco, I.; Caballero, B.; Laresgoiti, M.; Adrados, A. Catalytic stepwise pyrolysis of packaging plastic waste. J. Anal. Appl. Pyrolysis 2012, 96, 54–62. [Google Scholar] [CrossRef]
  25. Singh, R.; Ruj, B.; Sadhukhan, A.; Gupta, P.; Tigga, V. Waste plastic to pyrolytic oil and its utilization in CI engine: Performance analysis and combustion characteristics. Fuel 2020, 262, 116539. [Google Scholar] [CrossRef]
  26. Almohamadi, H.; Alamoudi, M.; Ahmed, U.; Shamsuddin, R.; Smith, K. Producing hydrocarbon fuel from the plastic waste: Techno-economic analysis. Korean J. Chem. Eng. 2021, 38, 2208–2216. [Google Scholar] [CrossRef]
  27. Miandad, R.; Barakat, M.; Aburiazaiza, A.S.; Rehan, M.; Ismail, I.; Nizami, A. Effect of plastic waste types on pyrolysis liquid oil. Int. Biodeterior. Biodegrad. 2017, 119, 239–252. [Google Scholar] [CrossRef]
  28. Faisal, F.; Rasul, M.; Chowdhury, A.A.; Schaller, D.; Jahirul, M. Uncovering the differences: A comparison of properties of crude plastic pyrolytic oil and distilled and hydrotreated plastic diesel produced from waste and virgin plastics as automobile fuels. Fuel 2023, 350, 128743. [Google Scholar] [CrossRef]
  29. Song, Q.; Zhao, H.-y.; Xing, W.-l.; Song, L.-h.; Yang, L.; Yang, D.; Shu, X. Effects of various additives on the pyrolysis characteristics of municipal solid waste. Waste Manag. 2018, 78, 621–629. [Google Scholar] [CrossRef]
  30. Hasan, M.; Rasul, M.; Jahirul, M.; Khan, M. Fast pyrolysis of macadamia nutshell in an auger reactor: Process optimization using response surface methodology (RSM) and oil characterization. Fuel 2023, 333, 126490. [Google Scholar] [CrossRef]
  31. Williams, P.T.; Williams, E.A. Interaction of plastics in mixed-plastics pyrolysis. Energy Fuels 1999, 13, 188–196. [Google Scholar] [CrossRef]
  32. López, A.; de Marco, I.; Caballero, B.M.; Adrados, A.; Laresgoiti, M.F. Deactivation and regeneration of ZSM-5 zeolite in catalytic pyrolysis of plastic wastes. Waste Manag. 2011, 31, 1852–1858. [Google Scholar] [CrossRef]
  33. Kalargaris, I.; Tian, G.; Gu, S. Combustion, performance and emission analysis of a DI diesel engine using plastic pyrolysis oil. Fuel Process. Technol. 2017, 157, 108–115. [Google Scholar] [CrossRef]
  34. López, A.; De Marco, I.; Caballero, B.; Laresgoiti, M.; Adrados, A.; Torres, A. Pyrolysis of municipal plastic wastes II: Influence of raw material composition under catalytic conditions. Waste Manag. 2011, 31, 1973–1983. [Google Scholar] [CrossRef]
  35. Onwudili, J.A.; Insura, N.; Williams, P.T. Composition of products from the pyrolysis of polyethylene and polystyrene in a closed batch reactor: Effects of temperature and residence time. J. Anal. Appl. Pyrolysis 2009, 86, 293–303. [Google Scholar] [CrossRef]
  36. Prabir, B. Biomass Gasification and Pyrolysis: Practical Design and Theory; Elsevier Inc.: Amsterdam, The Netherlands, 2010. [Google Scholar]
  37. Fernández, Y.; Arenillas, A.; Menéndez, J.Á. Microwave Heating Applied to Pyrolysis; INTECH Open Access Publisher: London, UK, 2011. [Google Scholar]
  38. Joo, H.; Guin, J.A. Continuous upgrading of a plastics pyrolysis liquid to an environmentally favorable gasoline range product. Fuel Process. Technol. 1998, 57, 25–40. [Google Scholar] [CrossRef]
  39. Mani, M.; Subash, C.; Nagarajan, G. Performance, emission and combustion characteristics of a DI diesel engine using waste plastic oil. Appl. Therm. Eng. 2009, 29, 2738–2744. [Google Scholar] [CrossRef]
  40. Mani, M.; Nagarajan, G.; Sampath, S. Characterisation and effect of using waste plastic oil and diesel fuel blends in compression ignition engine. Energy 2011, 36, 212–219. [Google Scholar] [CrossRef]
  41. Kaimal, V.K.; Vijayabalan, P. A detailed study of combustion characteristics of a DI diesel engine using waste plastic oil and its blends. Energy Convers. Manag. 2015, 105, 951–956. [Google Scholar] [CrossRef]
  42. Sharuddin, S.D.A.; Abnisa, F.; Daud, W.M.A.W.; Aroua, M.K. A review on pyrolysis of plastic wastes. Energy Convers. Manag. 2016, 115, 308–326. [Google Scholar] [CrossRef]
  43. Miandad, R.; Barakat, M.; Aburiazaiza, A.S.; Rehan, M.; Nizami, A. Catalytic pyrolysis of plastic waste: A review. Process Saf. Environ. Prot. 2016, 102, 822–838. [Google Scholar] [CrossRef]
  44. Jung, S.-H.; Cho, M.-H.; Kang, B.-S.; Kim, J.-S. Pyrolysis of a fraction of waste polypropylene and polyethylene for the recovery of BTX aromatics using a fluidized bed reactor. Fuel Process. Technol. 2010, 91, 277–284. [Google Scholar] [CrossRef]
  45. Lee, K.-H. Effects of the types of zeolites on catalytic upgrading of pyrolysis wax oil. J. Anal. Appl. Pyrolysis 2012, 94, 209–214. [Google Scholar] [CrossRef]
  46. Miskolczi, N.; Ateş, F.; Borsodi, N. Comparison of real waste (MSW and MPW) pyrolysis in batch reactor over different catalysts. Part II: Contaminants, char and pyrolysis oil properties. Bioresour. Technol. 2013, 144, 370–379. [Google Scholar] [CrossRef]
  47. López, G.; Olazar, M.; Artetxe, M.; Amutio, M.; Elordi, G.; Bilbao, J. Steam activation of pyrolytic tyre char at different temperatures. J. Anal. Appl. Pyrolysis 2009, 85, 539–543. [Google Scholar] [CrossRef]
  48. Williams, P.T. Yield and composition of gases and oils/waxes from the feedstock recycling of waste plastic. In Feedstock Recycling and Pyrolysis of Waste Plastics: Converting Waste Plastics into Diesel and Other Fuels; Wiley: Hoboken, NJ, USA, 2006; pp. 285–313. [Google Scholar]
  49. Jamradloedluk, J.; Lertsatitthanakorn, C. Characterization and utilization of char derived from fast pyrolysis of plastic wastes. Procedia Eng. 2014, 69, 1437–1442. [Google Scholar] [CrossRef]
  50. Heras, F.; Jimenez-Cordero, D.; Gilarranz, M.A.; Alonso-Morales, N.; Rodriguez, J. Activation of waste tire char by cyclic liquid-phase oxidation. Fuel Process. Technol. 2014, 127, 157–162. [Google Scholar] [CrossRef]
  51. Syamsiro, M.; Saptoadi, H.; Norsujianto, T.; Noviasri, P.; Cheng, S.; Alimuddin, Z.; Yoshikawa, K. Fuel oil production from municipal plastic wastes in sequential pyrolysis and catalytic reforming reactors. Energy Procedia 2014, 47, 180–188. [Google Scholar] [CrossRef]
  52. Arabiourrutia, M.; Elordi, G.; Lopez, G.; Borsella, E.; Bilbao, J.; Olazar, M. Characterization of the waxes obtained by the pyrolysis of polyolefin plastics in a conical spouted bed reactor. J. Anal. Appl. Pyrolysis 2012, 94, 230–237. [Google Scholar] [CrossRef]
  53. Garcia-Garcia, G.; Martín-Lara, M.; Calero, M.; Blázquez, G. Environmental impact of different scenarios for the pyrolysis of contaminated mixed plastic waste. Green Chem. 2024. advance article. [Google Scholar] [CrossRef]
  54. Hermanns, R.; Kraft, A.; Hartmann, P.; Meys, R. Comparative life cycle assessment of pyrolysis–recycling Germany’s sorted mixed plas-tic waste. Chem. Ing. Tech. 2023, 95, 1259–1267. [Google Scholar] [CrossRef]
  55. Jeswani, H.; Krüger, C.; Russ, M.; Horlacher, M.; Antony, F.; Hann, S.; Azapagic, A. Life cycle environmental impacts of chemical recycling via pyrolysis of mixed plastic waste in comparison with mechanical recycling and energy recovery. Sci. Total Environ. 2021, 769, 144483. [Google Scholar] [CrossRef] [PubMed]
  56. Cornell, J. How to Apply Response Surface Methodology; ASQC: Milwaukee, WI, USA, 1990; Volume 8, p. 3. [Google Scholar]
  57. Wong, S.L.; Ngadi, N.; Amin, N.A.S.; Abdullah, T.A.T.; Inuwa, I.M. Pyrolysis of low density polyethylene waste in subcritical water optimized by response surface methodology. Environ. Technol. 2016, 37, 245–254. [Google Scholar] [CrossRef] [PubMed]
  58. Azargohar, R.; Dalai, A. Production of activated carbon from Luscar char: Experimental and modeling studies. Microporous Mesoporous Mater. 2005, 85, 219–225. [Google Scholar] [CrossRef]
  59. Ferreira, S.C.; Bruns, R.; Ferreira, H.S.; Matos, G.D.; David, J.; Brandão, G.; da Silva, E.P.; Portugal, L.; Dos Reis, P.; Souza, A. Box-Behnken design: An alternative for the optimization of analytical methods. Anal. Chim. Acta 2007, 597, 179–186. [Google Scholar] [CrossRef] [PubMed]
  60. Kuehl, R.O. Designs of Experiments: Statistical Principles of Research Design and Analysis; Duxbury Press: New York, NY, USA, 2000. [Google Scholar]
  61. Cho, M.-H.; Jung, S.-H.; Kim, J.-S. Pyrolysis of mixed plastic wastes for the recovery of benzene, toluene, and xylene (BTX) aromatics in a fluidized bed and chlorine removal by applying various additives. Energy Fuels 2010, 24, 1389–1395. [Google Scholar] [CrossRef]
  62. Moreira, R.; dos Reis Orsini, R.; Vaz, J.M.; Penteado, J.C.; Spinacé, E.V. Production of biochar, bio-oil and synthesis gas from cashew nut shell by slow pyrolysis. Waste Biomass Valorization 2017, 8, 217–224. [Google Scholar] [CrossRef]
  63. Bezergianni, S.; Dimitriadis, A.; Faussone, G.-C.; Karonis, D. Alternative diesel from waste plastics. Energies 2017, 10, 1750. [Google Scholar] [CrossRef]
  64. Khatha, W.; Ekarong, S.; Somkiat, M.; Jiraphon, S. Fuel Properties, Performance and Emission of Alternative Fuel from Pyrolysis of Waste Plastics. In IOP Conference Series: Materials Science and Engineering; IOP Publishing: Bristol, UK, 2020; p. 012001. [Google Scholar]
  65. Janyalertadun, A.; Santaweesuk, C.; Sanongraj, S. Fuel production, performance, and emission of a CI engine using waste plastics oil. World J. Eng. 2017, 14, 114–120. [Google Scholar] [CrossRef]
  66. Bezergianni, S.; Kalogianni, A.; Dimitriadis, A. Catalyst evaluation for waste cooking oil hydroprocessing. Fuel 2012, 93, 638–641. [Google Scholar] [CrossRef]
  67. Belbessai, S.; Azara, A.; Abatzoglou, N. Recent Advances in the Decontamination and Upgrading of Waste Plastic Pyrolysis Products: An Overview. Processes 2022, 10, 733. [Google Scholar] [CrossRef]
  68. Bakhtyari, A.; Makarem, M.; Rahimpour, M. Light olefins/bio-gasoline production from biomass. In Bioenergy Systems for the Future; Elsevier: Amsterdam, The Netherlands, 2017; pp. 87–148. [Google Scholar]
Figure 1. Shredded waste plastic feedstocks: (a) PP, (b) HDPE, (c) PS, and (d) shredder.
Sustainability 16 02619 g001
Figure 2. MWP feedstocks of three different sizes: 5 mm, 25 mm, and 45 mm.
Sustainability 16 02619 g002
Figure 3. (a) Plastic pyrolytic plant, (b) process schematic diagram.
Sustainability 16 02619 g003
Figure 4. Flow diagram of the processes of RSM for model development and validation.
Sustainability 16 02619 g004
Figure 5. Experimental vs. predicted yield of PPO.
Sustainability 16 02619 g005
Figure 6. (a) The 3D surface and (b) contour plot for PPO yield illustrate the combined impact of temperature and residence time while maintaining a constant feedstock particle size of 25 mm.
Sustainability 16 02619 g006
Figure 7. (a) The 3D surface and (b) contour plot for PPO yield showing the combined effect of temperature and feedstock particle size, keeping residence time fixed at mean value (90 min).
Sustainability 16 02619 g007aSustainability 16 02619 g007b
Figure 8. (a) The 3D surface and (b) contour plot for PPO yield, while maintaining the temperature constant at 500 °C, demonstrating the combined impact of residence time and feedstock particle size.
Sustainability 16 02619 g008aSustainability 16 02619 g008b
Figure 9. FTIR spectra of PPO under optimum conditions.
Sustainability 16 02619 g009
Table 1. Range and level of independent factors chosen for the optimisation study.
VariablesUnitSymbol CodedRange and Levels
−101
Temperature°CA460500540
Residence timeminB3090150
Feedstock sizemmD52545
Table 2. Experimental design matrix along with actual and predicted product yields of PPO.
RunTemp. (°C)Residence Time (min)Feedstock Size (mm)Liquid Oil Yield (%)
ActualPredicted
1500 (0)150 (1)5 (−1)61.0960.4563
2500 (0)90 (0)25 (0)55.1954.0533
3460 (−1)150 (1)25 (0)31.6534.0075
4460 (−1)90 (0)5 (−1)25.6723.9462
5500 (0)30 (−1)45 (1)19.9120.5438
6540 (1)90 (0)5 (−1)50.5350.6387
7500 (0)90 (0)25 (0)53.9054.0533
8540 (1)90 (0)45 (1)47.3049.0238
9540 (1)150 (1)25 (0)74.4774.9950
10500 (0)30 (−1)5 (−1)21.9424.1888
11500 (0)150 (1)45 (1)59.5757.3212
12540 (1)30 (−1)25 (0)28.3125.9525
13460 (−1)30 (−1)25 (0)10.5310.0050
14460 (−1)90 (0)45 (1)18.8918.7812
15500 (0)90 (0)25 (0)53.0754.0533
Table 3. Ultimate and proximate analysis of MWP [61].
AnalysisPropertyAmount (wt%)
UltimateC79.9
H12.6
S0.00
N0.00
O5.1
Chlorine
HHV (MJ/kg)
1.13
44.4
ProximateMoisture content1.37
Volatile matter92.90
Fixed carbon1.14
Table 4. Analyzing the quadratic model for PPO yield through ANOVA.
SourceDFAdj SSAdj MSF Valuep ValueRemark
Model95190.04576.6793.520.0000Significant
A11620.801620.80262.840.0000Significant
B12667.792667.79432.620.0000Significant
D122.9822.983.730.1114Not significant
A21481.68481.6878.110.0003Significant
B21150.84150.8424.460.0043Significant
D21182.69182.6929.630.0028Significant
A × B1156.75156.7525.420.0040Significant
A × D13.153.150.510.5067Not significant
B × D10.070.070.010.9222Not significant
Lack-of-Fit328.559.528.340.1090Not significant
Pure Error22.281.14
Total145220.88
R-sq = 99.41%; R-sq(adj) = 98.35%; R-sq(pred) = 91.15%.
Table 5. Independent and dependent variable ranges for the optimisation study.
ParametersObjectiveMinimum ThresholdMaximum Boundary
Temperature (°C)Within range460550
Residence time (min)Within range30150
Feedstock particle size (mm)Within range545
Yield of PPO (%)Maximise10.5374.47
Table 6. Experimental and predicted yield of PPO under optimum operating conditions.
RunTemp.
(°C)
Residence Time
(min)
Particle Size
(mm)
Exp. PPO Yield
(%)
Predicted PPO Yield
(%)
Error
(%)
15361502474.7775.140.49
25361502475.9275.141.03
35361502475.9875.141.11
Avg.5361502475.5575.140.88
Table 7. The standards for conducting property tests of the PPO.
Fuel PropertiesUnitTesting MethodsEquipment Used
Flash point°CD93BPensky Martins closed-cup apparatus (Koehler instrument company, INC., Bohemia, NY, USA)
Calorific valuekJ/kgD4809Parr 6200 calorimeter (Parr Instrument Company, Chicago, IL, USA)
Densitykg/LD4052DM40 Mettler Toledo density meter (METTLER TOLEDO, Columbus, OH, USA)
Cetane index (CI)-D4737 AIgnition quality tester (CFR Engines, Ottawa, ON, Canada)
LubricityµmD6079Ducom lubricity meter (Ducom instruments, New York, NY, USA)
Kinematic viscosity (KV)cStD7042Stabinger viscometer SVM 3000 (Anton Paar, Gurugram, India)
Sulfur content(mg/kg)D5453XPLORER sulfur analyser (TE Instrument, Delft, The Netherlands)
Water contentwt%D2709Centrifuge sigma (Thermo Fisher Scientific, Waltham, MA, USA)
Table 8. Comparison of the fuel properties of crude PPO with three different diesel fuel standards.
PropertiesASTM Std.EN Std.Aus. Std. DieselCrude PPOCPPO
[63]
CPPO
[64]
CPPO
[65]
HHV (MJ/kg)42–46-44–4644.1543.5837.7245.24
KV (mm2/s)1.9–4.12–4.52–4.51.3182.31.663.11
CI40 min46 min46 min3266.7-46.7
Density@15 °C (g/cm2)-0.82–0.840.82–0.850.8320.80270.8990.823
Flash point
(°C)
52 min55 min61.5 min.<20483554
Water content (wt. %)0.050.02 max0.02 max.0.1250.051--
Sulfur content (mg/kg)15 max10 max10 max.5.1242.9--
Lubricity (WSD, µm)520 max460 max460 max.220---
Disclaimer/Publisher’s Note: The statements, opinions and data contained in all publications are solely those of the individual author(s) and contributor(s) and not of MDPI and/or the editor(s). MDPI and/or the editor(s) disclaim responsibility for any injury to people or property resulting from any ideas, methods, instructions or products referred to in the content.

