Abstract
This study aimed to investigate the possibility of using biomass fly ash as a cement additive after hydrothermal modification. The treatment of biomass fly ash involves additional milling and curing under various hydrothermal conditions. Variation of the CaO/SiO2 ratio was achieved by mixing different samples of biomass fly ash. Samples with a CaO/SiO2 ratio of 1 and 1.5 were selected for synthesis, and cement samples with different amounts of the synthesized additive were examined. The research employed the following methodologies: XRD, XRF, DSC-TG, ICP-OES, and isothermal calorimetry. It was found that in all the biomass fly ash samples, calcium silicate hydrates already formed after 2 h of hydrothermal synthesis at 200 °C. Analysis of the chemical composition of the liquid medium after hydrothermal maintenance revealed an exceptionally low release of heavy metals from the samples. The synthesised additive accelerated the initial hydration of Portland cement. In total, 5% to 10% of the weight of cement can be replaced by hydrothermally treated biomass fly ash without reducing the compressive strength class of Portland cement samples.
1. Introduction
The primary issue facing the contemporary world is the phenomenon of global warming, which originates from substantial emissions of greenhouse gases released into the atmosphere. An effective approach to addressing this issue involves increasing the adoption of renewable energy sources such as wind and solar power. Among these sources, biofuels stand out, which are experiencing a remarkable increase in utilization. Biofuel is an organic substance of plant or animal origin that is traditionally used as an energy source [1]. During the biomass combustion process, fly ash—fine solid particles that accumulate in exhaust gas and are collected using gas filtration devices, usually electrostatic filters or cyclones—is produced [2]. As industries increasingly turn to biomass as a renewable energy source, the by-product of this process, fly ash, presents a serious challenge. Biomass fly ash can exhibit significant variability in its chemical and physical properties; moreover, biomass fly ash often contains trace heavy metals and other unwanted elements. These potentially hazardous elements can pose health and environmental risks [3]. Traditionally considered a disposal issue due to its potential environmental risks, biomass fly ash waste can be transformed into a valuable resource through sustainable practices.
The incorporation of biomass fly ash in cement production represents a sustainable and environmentally friendly approach that has gained increasing attention in recent years [4]. However, the use of biomass fly ash in cementitious systems can also provide different results. In past research, the compressive strength was below that of control samples [5,6] or exceeded that of control samples [7]. On the contrary, poorer results were observed in samples containing higher proportions of wood ashes [4,8]. Furthermore, certain information presented in the literature [9] indicates an extremely distinct chemical composition of wood ash. However, regardless of geographic location or combustion method, the composition of biomass fly ash is dominated by calcium and silicon compounds [10,11]. Calcium and silicon oxides are also the main components of cementitious systems, and when cement is hydrated, the most important compounds of hydrated cement are formed: calcium silicate hydrates (C-S-H).
Synthetic calcium silicate hydrate can also be used as an additive to Portland cement. C-S-H particles are different from other supplementary cementitious materials, as they are considered ideal materials for nucleating C-S-H products [12]. It should be noted that achieving high purity for every C-S-H phase may not be feasible, often resulting in mixed phases [13]. The post-synthesis grinding of the product may be necessary to develop an efficient accelerator for cement hydration. This results in a reduction in both induction and dormant periods [14,15]. Various studies have explored cement additions in the range of 0.04 wt.% to 10% wt.% [16,17]. C-S-H particles have demonstrated their role as direct sites for secondary nucleation or the growth of additional hydration products, diverting the product formation process from clinker particles [18].
In addition, calcium silicate hydrates have the ability to incorporate calcium or aluminium ions into their framework, along with indications of intercalation of sodium, potassium, and other ions [19,20]. Therefore, there is a high probability that during the hydrothermal treatment of biomass fly ash, the main components of which are calcium and silicon oxides, C-S-H may be formed, and unwanted ash elements may be permanently incorporated into their framework.
Therefore, this work evaluated the possibility of using fly ash formed during biomass burning for the hydrothermal synthesis of calcium silicate hydrates, and investigated the properties of this newly synthesized material as an additive for Portland cement.
2. Materials and Methods
2.1. Materials
In this work, biomass fly ash (BFA) was collected from industrial plants that use biomass as an energy source. Monitoring of the change in the chemical composition of BFA was carried out for 6 months in 8 different plants. The BFA was collected from a common gas treatment system, where the gas is first cleaned in cyclones and then in e-filters and everything goes into a common tank, separately from the cyclones and separately from the e-filters. A total of 25 kg of each fly ash sample was collected. The mass of the selected sample was reduced to 5 kg by the quartering method [21]. A selected amount upon further quartering was reduced to a representative amount for analysis and hydrothermal synthesis. As expected, the chemical composition of all samples varied within very wide limits. Since this work adopted the hydrothermal synthesis of BFA, the CaO/SiO2 (C/S) ratio was chosen as the main indicator for the selection of BFA samples for the research. This ratio in the tested specimens varied from 0.61 to 8.57. However, a general regularity was observed in that the ash collected in e-filters was distinguished by the highest C/S ratio (7.39–8.57), and in the ash collected in common gas treatment system or in cyclones, this ratio varied only in the range 0.67–1.56. This is because, in e-filters, the smallest particles are collected and the amount of SiO2 is negligible. Three samples (abbreviated as S, A and R) with the lowest, highest and average C/S ratio were selected for the investigation. The chemical composition of these materials, determined by the XRF method, is presented in Table 1.

Table 1.
Chemical composition wt.% of raw materials.
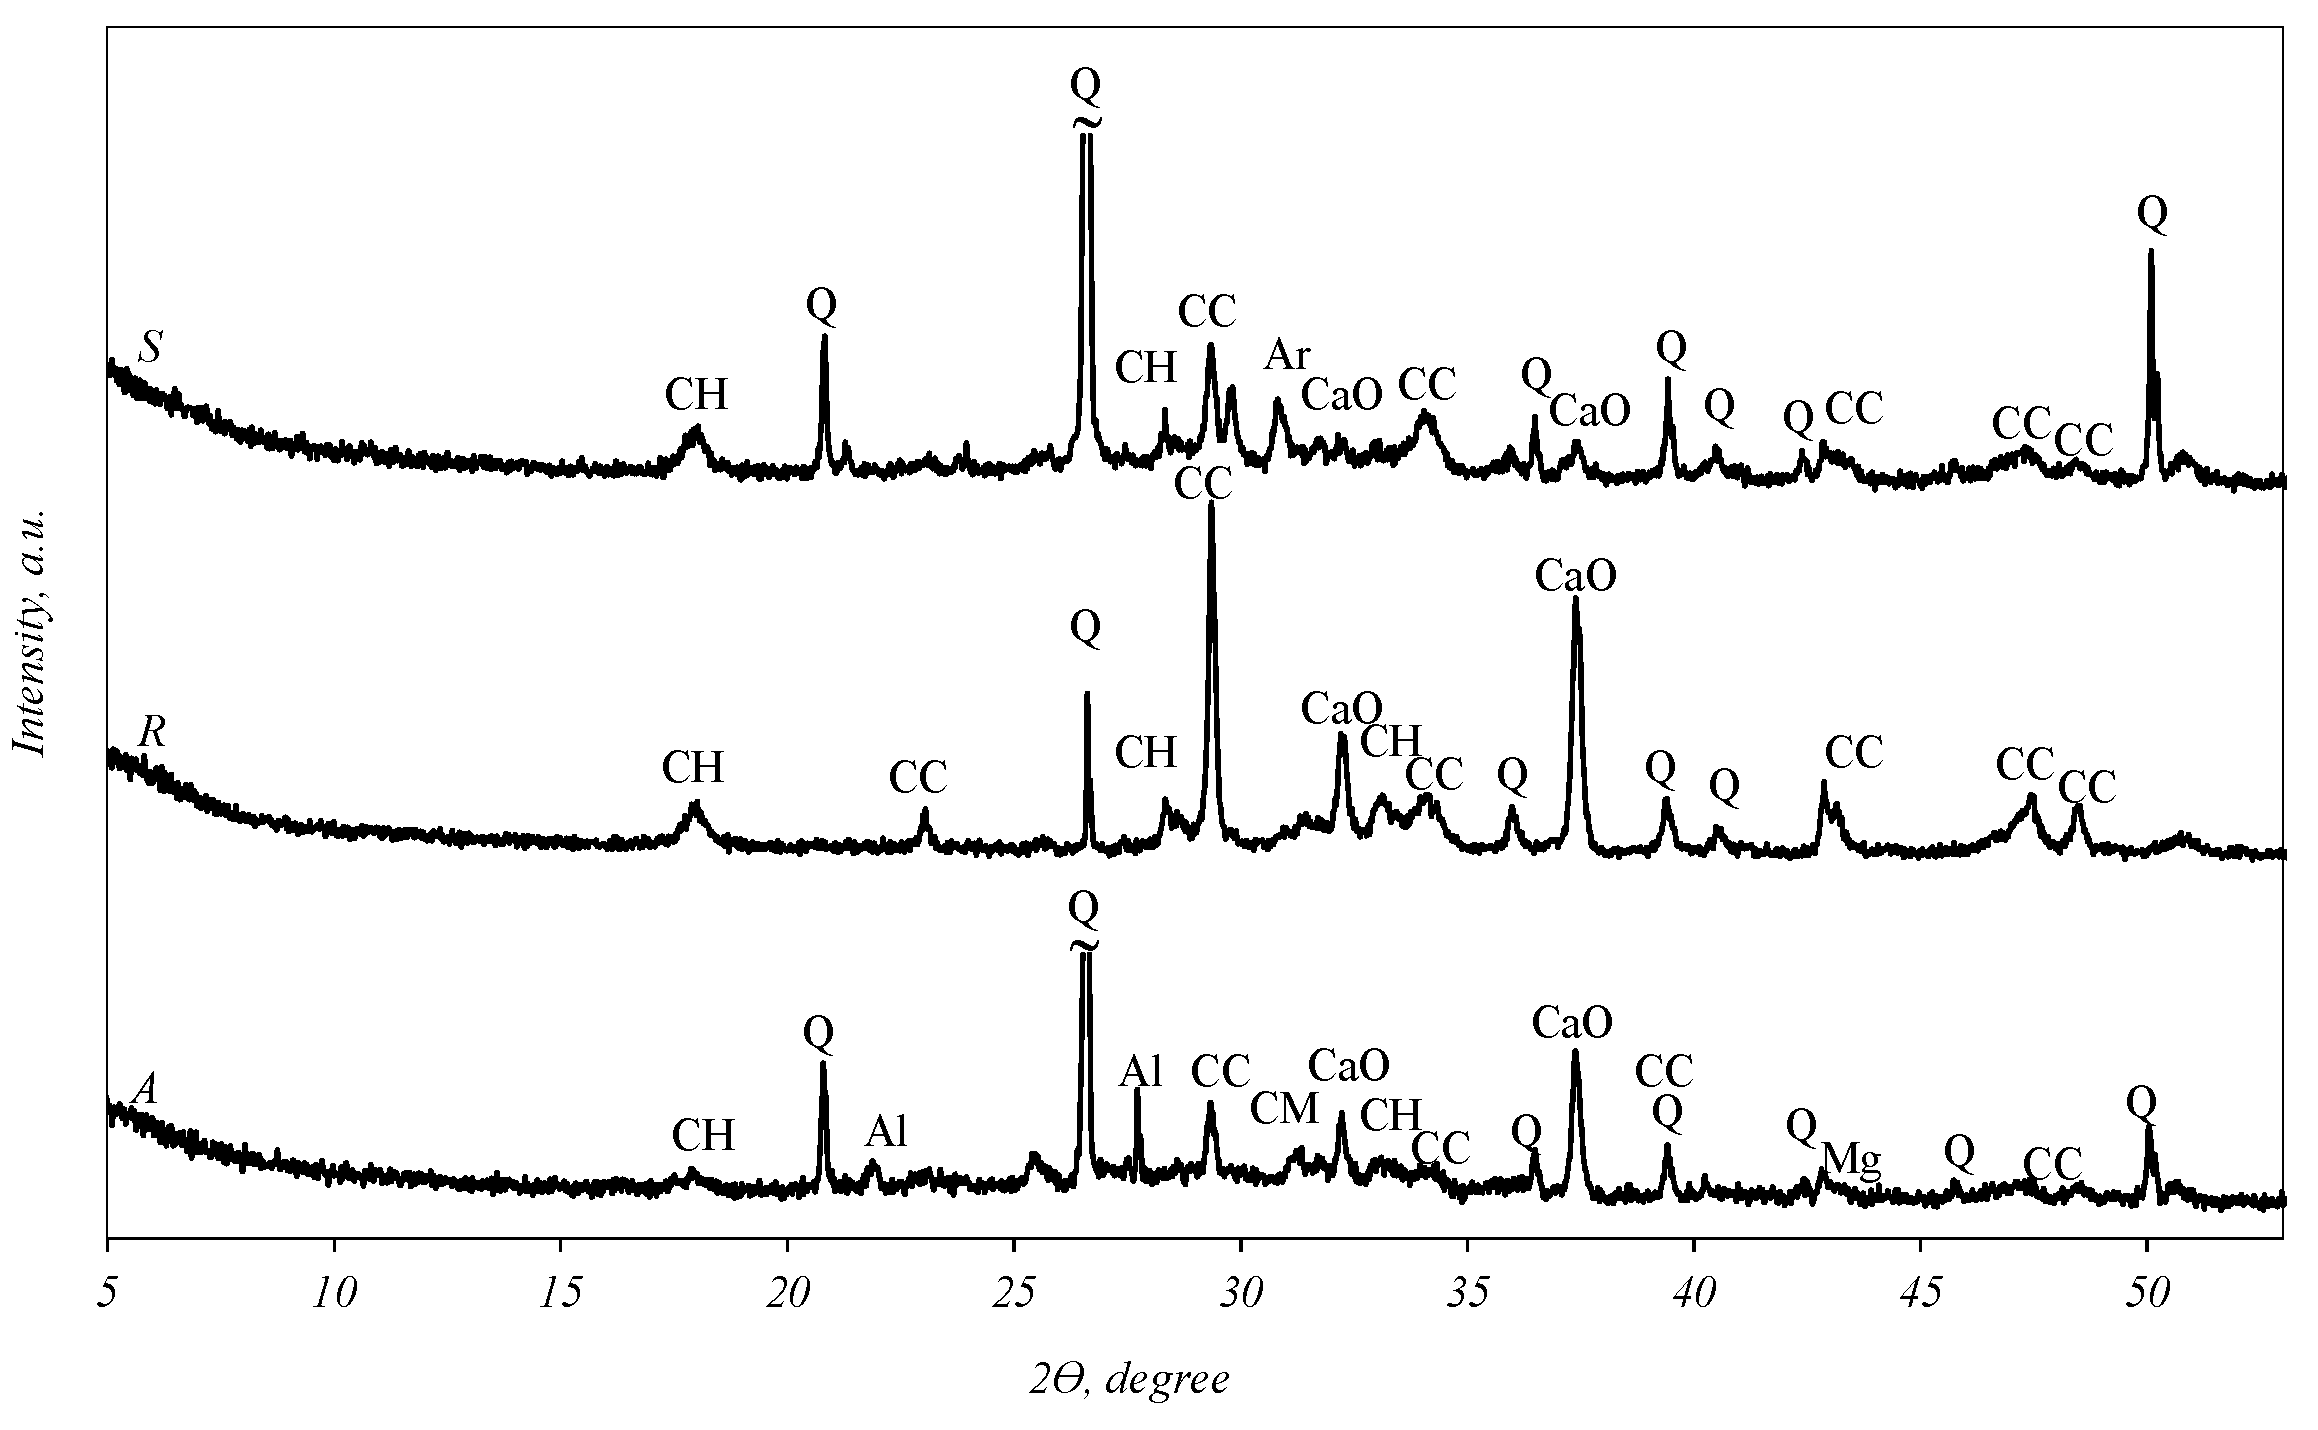
X-ray analysis (Figure 1) revealed that quartz (SiO2), calcium carbonate (CaCO3), portlandite (Ca(OH)2) and CaO can be identified in all fly ash curves. In addition to these main compounds, the curve of sample S shows the diffraction maxima of arcanite (K2SO4), while sample A shows that of akermanite (Ca2MgSi2O7), aluminum phosphate (AlPO4), magnesium oxide and a negligible hump at an angle of 18–29°, which is characteristic of amorphous compounds.

Figure 1.
X-ray diffraction analysis of biomass fly ash. Indexes: Q—quartz; CaO—calcium oxide; Mg—magnesium oxide; Al—aluminum phosphate (AlPO4); CH—portlandite; CC—calcite; CM—akermanite (Ca2MgSi2O7); Ar—arcanite (K2SO4).
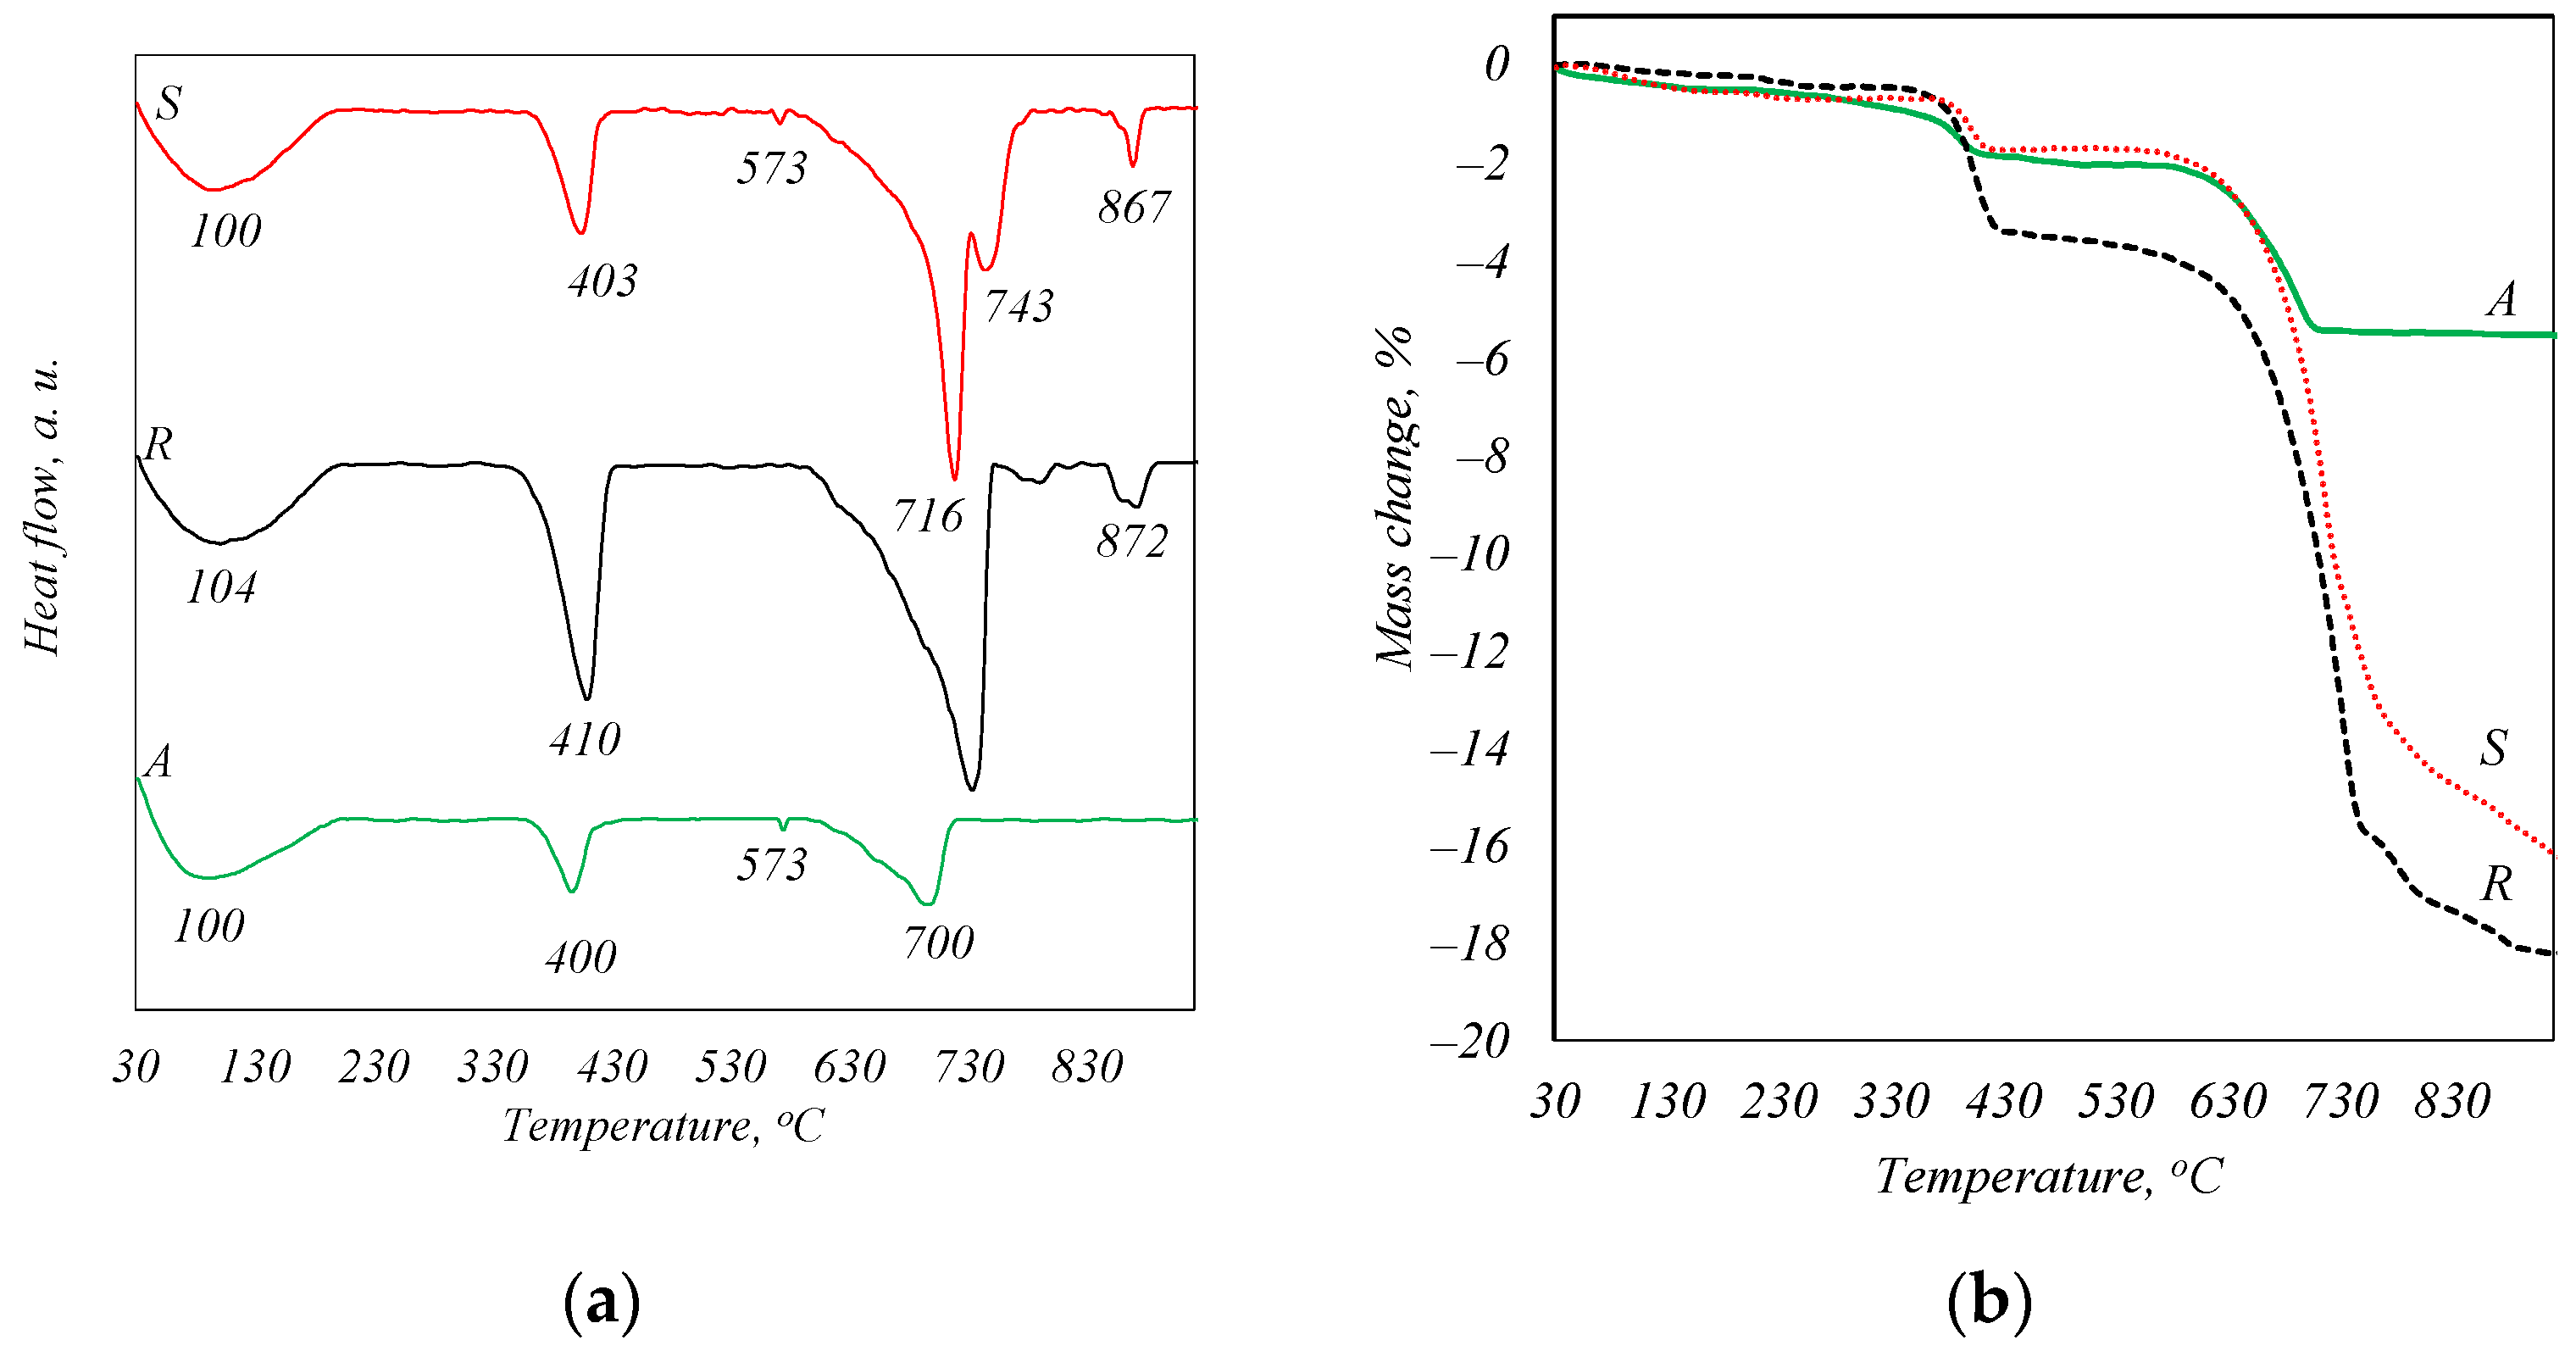
The DSC analysis curves (Figure 2a) show endothermic effects with maxima in the temperature regions of ~100, 400, and 700 °C. These transformations are characteristic of the following processes: about 100 °C—the evaporation of adsorbed water from ash, 400 °C—the decomposition of portlandite, 700 °C—the decomposition of CaCO3. The decomposition temperatures of CaCO3 in the samples are not in agreement due to the difference in the size of the crystals formed during combustion [22]. However, a peak at 573 °C is also identified in the curve of samples A and S, which is the characteristic recrystallization of quartz from alpha to beta modification, while the peaks at 870 °C seen in the curve of samples S and R can be attributed to the dehydroxylation process of a compound of apatite type [23]. This phase was not identified by X-ray diffraction analysis because of its weak crystallinity. The TG analysis curves (Figure 2b) show that the total mass loss of sample S is 16.27%, of sample R is 18.22%, and of sample A is 12.12%.
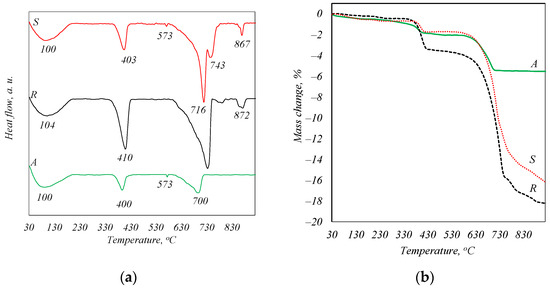
Figure 2.
STA analysis curves of biomass fly ash. DSK curves (a) and TGA curves (b).
In this investigation, ordinary Portland cement CEM I 42.5 N was used; the chemical composition is given in Table 1.
2.2. Sample Preparations
Hydrothermal treatment of biomass fly ash. A C/S ratio of 1 and 1.5 was selected for the synthesis of calcium silicate hydrates. For this purpose, the sample S was used as-received, while samples A and R were mixed to achieve the C/S ratio of 1 and 1.5. Before synthesis, all samples were ground in a vibratory disc mill for 2 min at 950 rpm until powders were obtained, which were sieved through a 0.08 mm sieve. The components of the mixtures were accurately weighed and placed in a sealed plastic container. To ensure complete homogenization, three porcelain grinding bodies were added to the container. The mixtures were homogenized using a “TURBULA TYPE T 2 F” device at a speed of 49 rpm for 15 min.
Each initial mixture was combined with distilled water to achieve a suspension with a water-to-solids ratio (W/S) of 5. Synthesis occurred without stirring the suspension, placed in 25 mL PTFE vessels within a “Parr Instruments” autoclave (Moline, IL, USA) at a saturated steam temperature of 200 °C, with an isothermal treatment time of 2 to 24 h. The saturation of the water vapor temperature was achieved in 2 h. The quantities were adjusted to produce the required 2 g of materials for each synthesis. For the synthesis of additives for Portland cement, the synthesis conditions (2 h, 200 °C, W/S = 5) were reiterated in a 1 L autoclave, in which 80 g of material was synthesized. The synthesis was repeated until the required amount of material was obtained.
After synthesis, the obtained product was removed from the PTFE vessels and dried in a dryer at a temperature of 50 °C to a constant weight. The dried material was then manually crushed in an agate mortar until all the material passed through a 0.063 mm sieve. The resulting powder was used as an additive to Portland cement.
2.3. Testing Methods
Simultaneous thermal analysis (STA) was performed with a PT1000 (Linseis, Germany), analyzer. The temperature range was 30–1000 °C in steps of 15 °C/min. The uncertainty in measurements for the DSC was ±0.2 °C, and for TG, it was ±0.3%.
The X-ray diffraction (XRD) method was used to determine the mineral composition of the samples. XRD data were collected with a Bruker D8 Advance diffractometer using a Bragg–Brentano geometry with a detector step of 0.02° and a 2θ angle of 3–70°. The reliability of the method—99%.
The X-ray fluorescence (XRF) method was used to determine the chemical composition of the samples. XRF data were collected on a Bruker S8 Tiger WD spectrometer equipped with an Rh tube with energy up to 60 keV. The samples were measured in a He atmosphere, and the data were analysed using SPECTRAPlus V.2 QUANT EXPRESS software. The reliability of the method—98%.
To determine the overall concentrations of elements in the solutions after hydrothermal treatment, Inductively Coupled Plasma Optical Emission Spectrometer (ICP-OES) Optima 8000 (PerkinElmer Instruments Co., Shelton, USA) was used. Argon was used as the ICP torch gas (7.0 L/min) and purge gas (1.0 L/min). The parameters of the recirculating cooling system (chiller) were as follows: cooling capacity at 20 °C: 2850 watts; temperature stability: ±0.5 °C; and pump rate: 4 gal/min at 55 psi max. The uncertainty in measurements was ±5 ppm.
The materials were milled with a FRITSCH PULVERISETTE 9 mill.
The properties of the cement paste were ascertained according to EN 196-3 [24].
An ordinary sand-free Portland cement (OPC) paste was prepared for instrumental analysis. Subsequently, the samples were immersed in distillated water at 20 ± 1 °C for durations of 2 and 28 days. After the respective periods, the samples were crushed and rinsed with isopropanol. The resulting material was then dried at 45 °C for 12 h and stored in hermetic bags.
Samples (prisms 40 × 40 × 160 mm) for compressive strength analysis were formed according to EN 196-1 [25]. The cement/sand ratio in the samples was 1:3 and the water/cement ratio was 0.5:1.
Calorimetric analysis was carried out by using a TAM Air III calorimeter. The measurement deviation was <0.03 W/g. The obtained results were recalculated per gram of Portland cement.
3. Results
3.1. Hydrothermal Treatment of Biomass Fly Ash
The hydrothermal treatment was applied to three samples, the abbreviations of which are presented in Table 2. The isothermal holding time at 200 °C for all samples was chosen at 2, 4, 8, and 24 h.
Table 2.
Samples’ abbreviations.
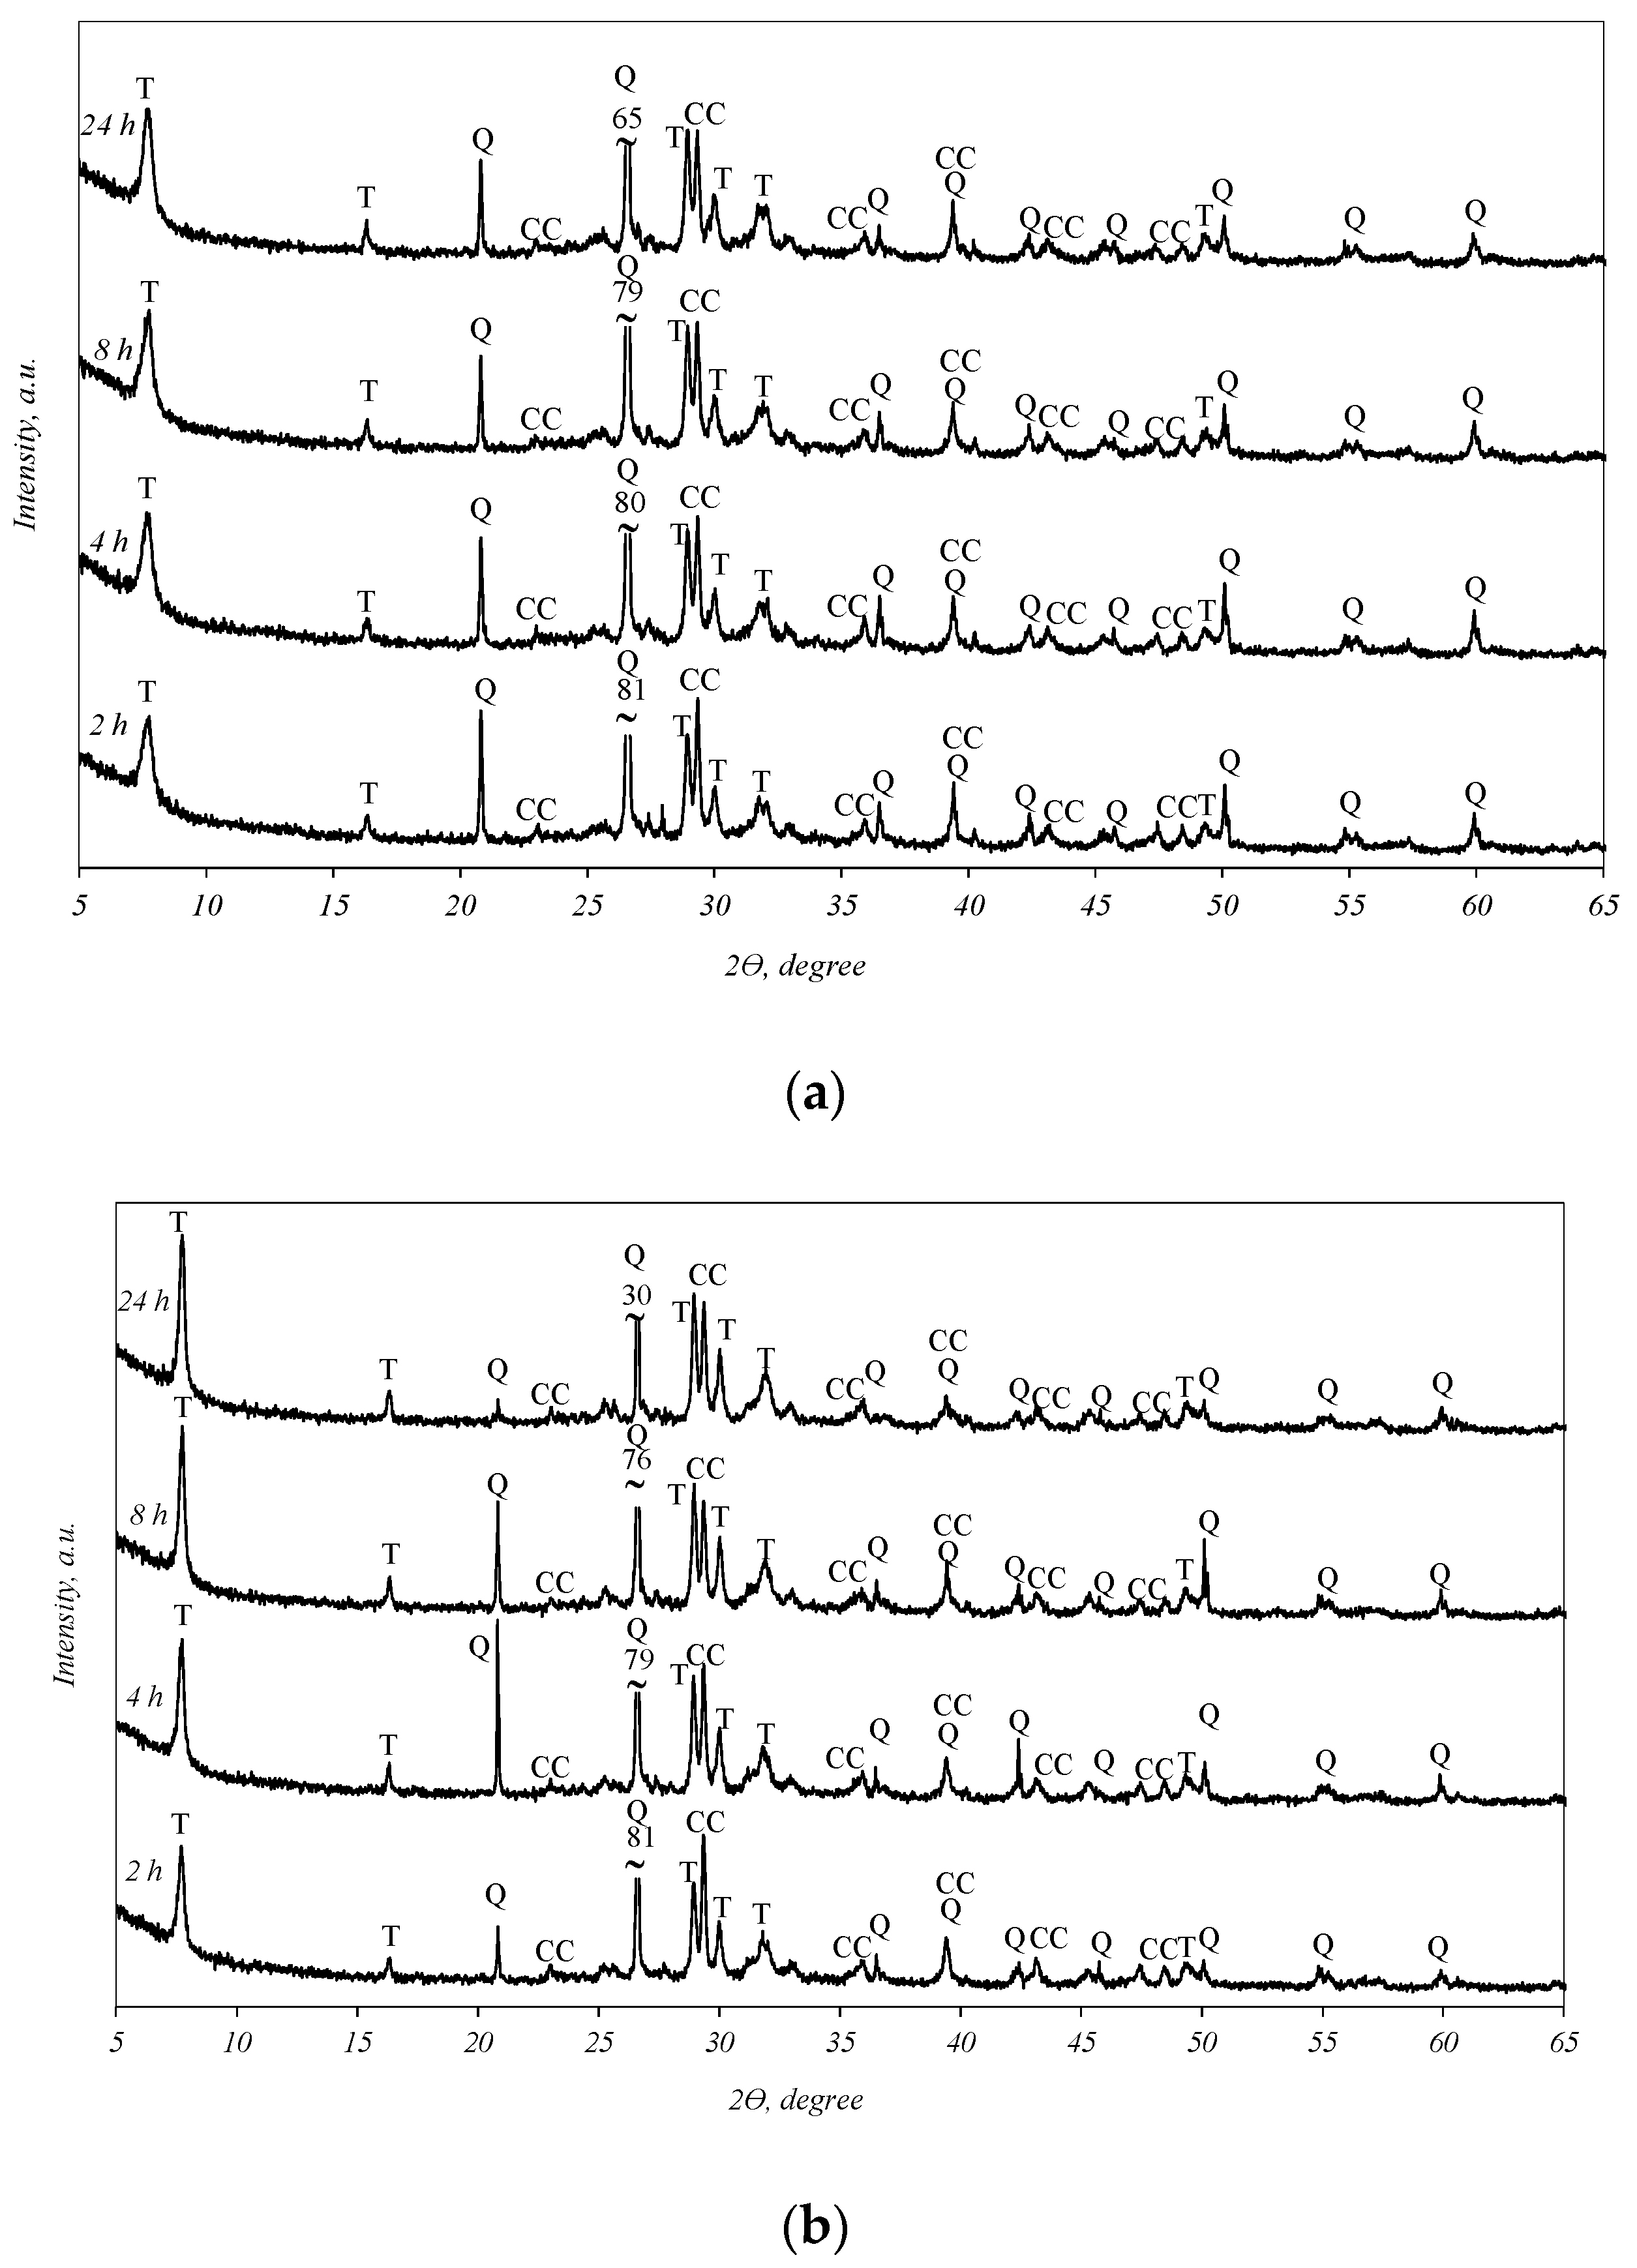
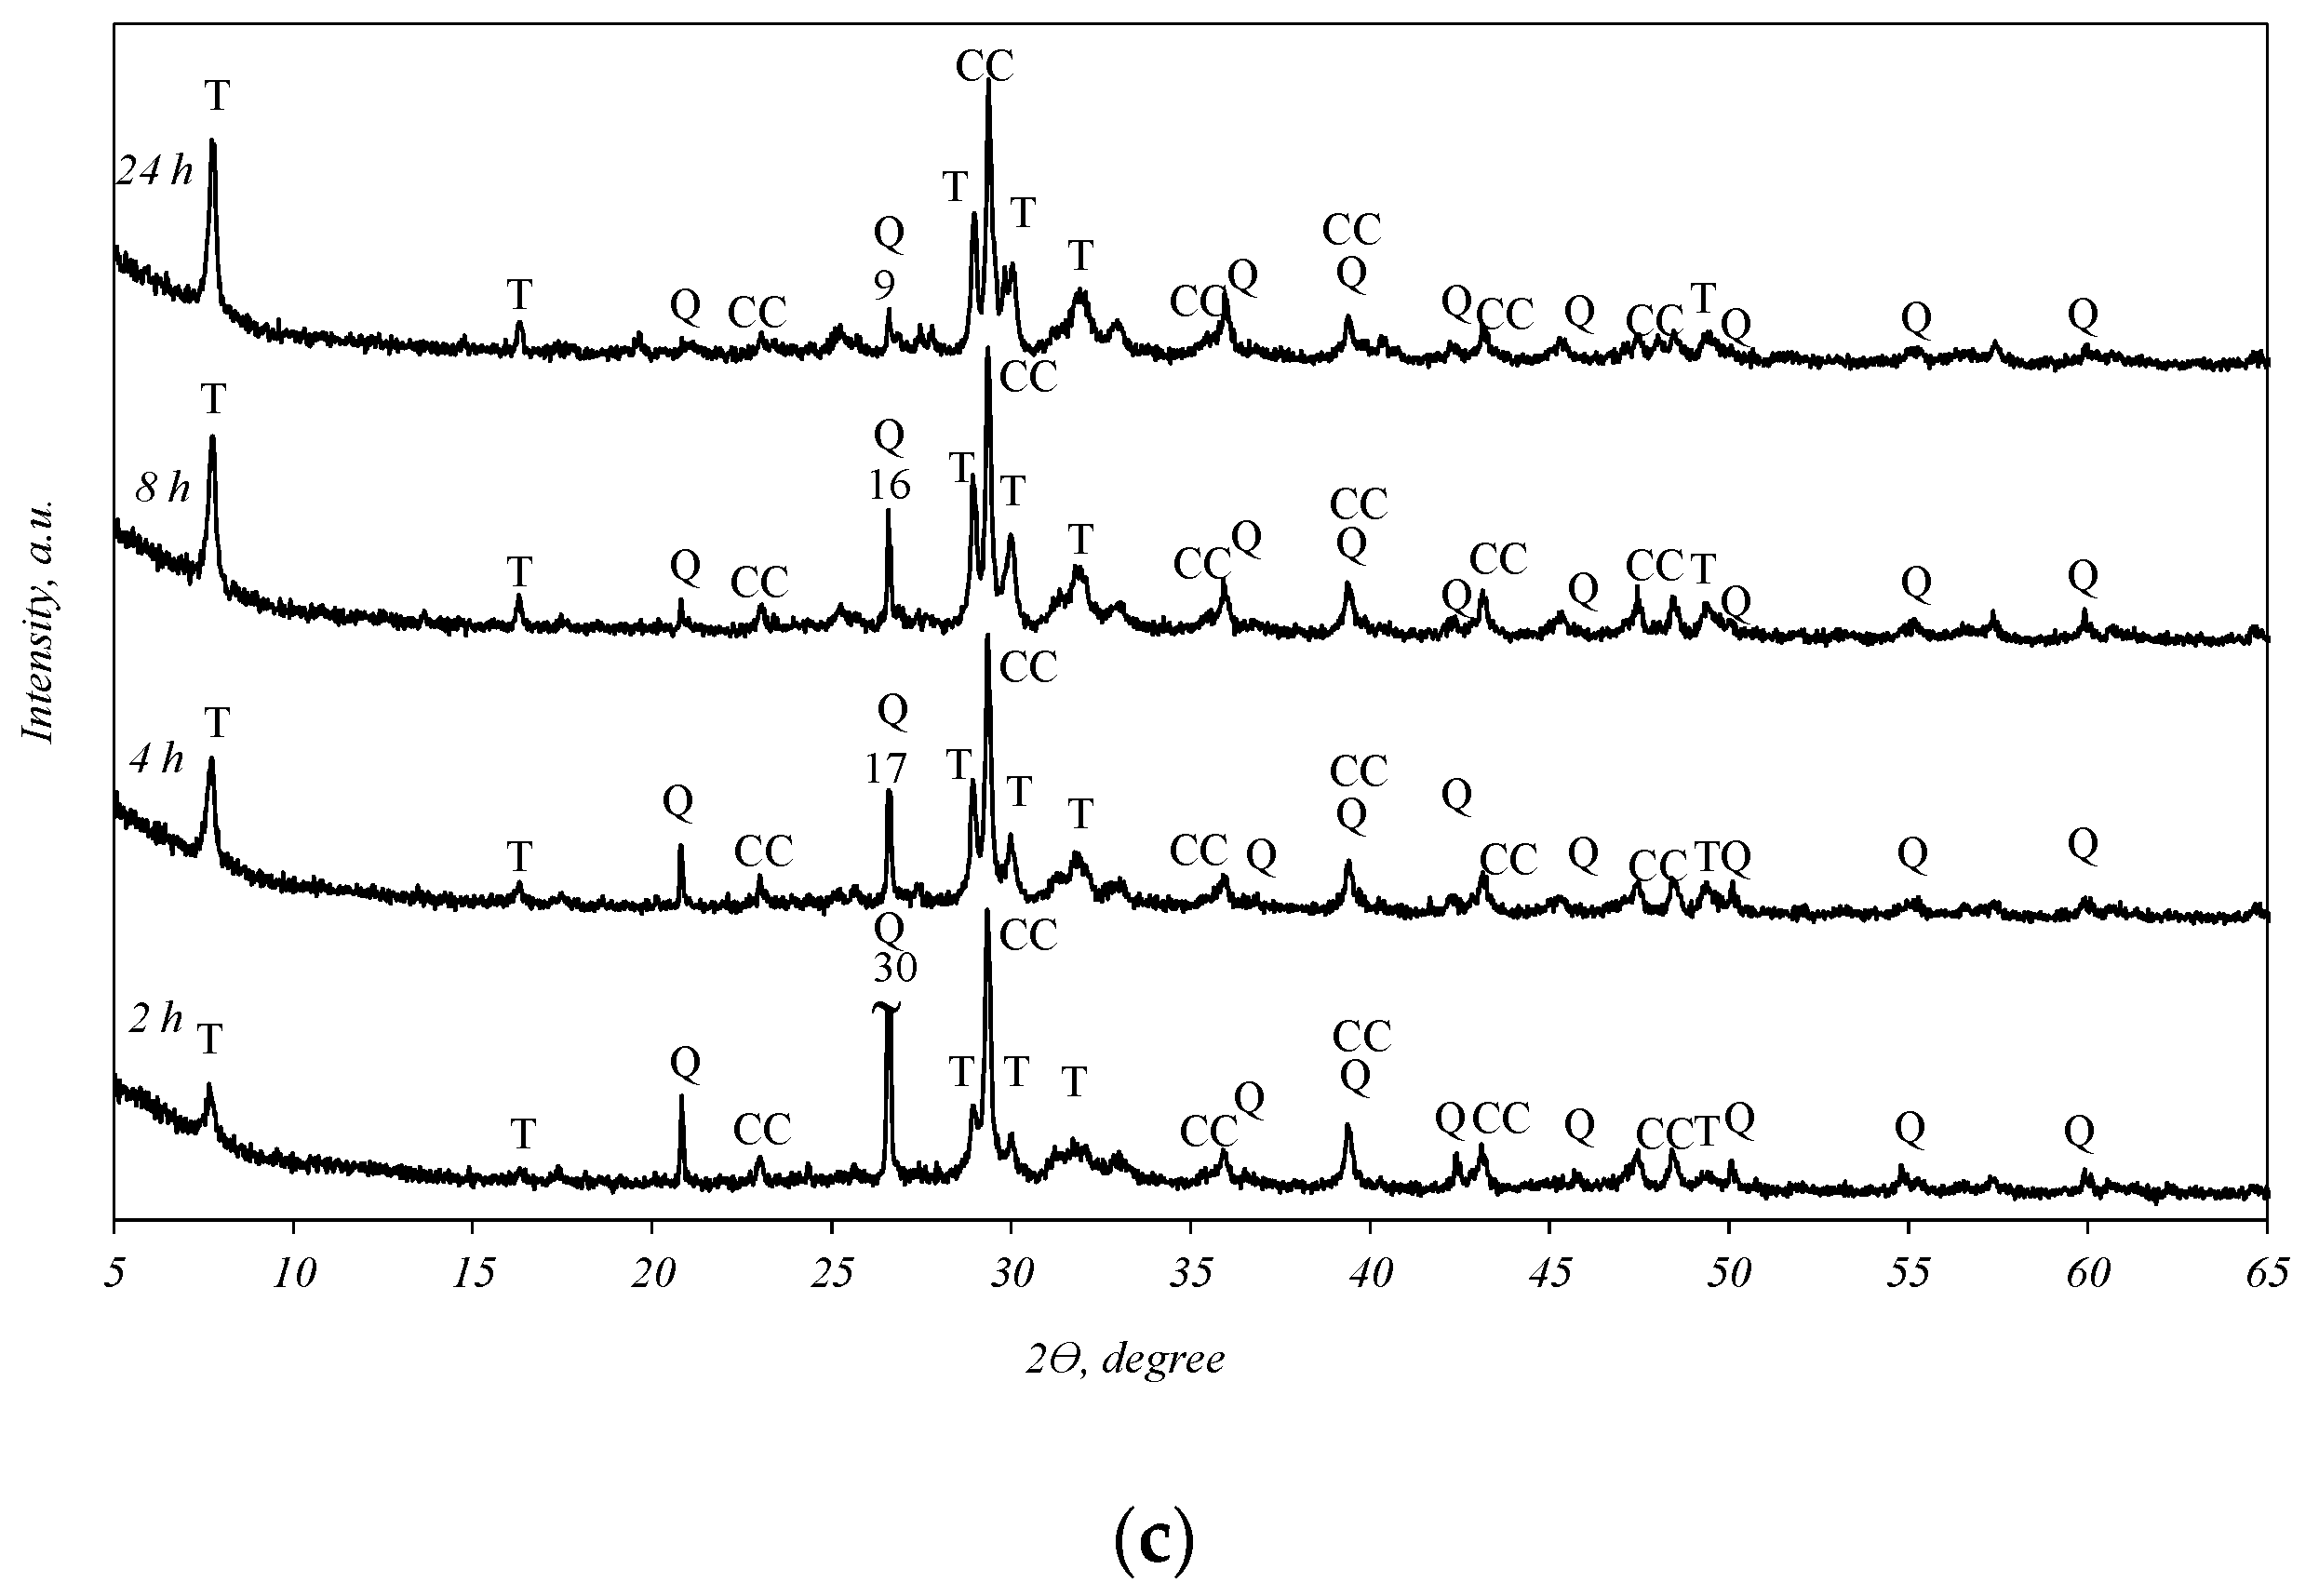
It was determined that in all the biomass fly ash samples, after 2 h of hydrothermal treatment, tobermorite (d-spacing: 1.130, 0.548, 0.308, 0.298, 0.282, 0.184) was obtained (Figure 3). By prolonging the duration of synthesis to 4, 8, and 24 h, the intensities of the tobermorite diffraction peaks increase only slightly (Figure 3, curves 4–24 h). Meanwhile, the intensities of the diffraction maxima characteristic of quartz also slightly decreased. It should be noted that only one other primary crystalline compound, calcium carbonate, remained in the synthesis products under all experiment conditions. This finding shows that the hydrothermal treatment of biomass fly ash results in a product consisting only of quartz, calcite, and calcium silicate hydrates (tobermorite).

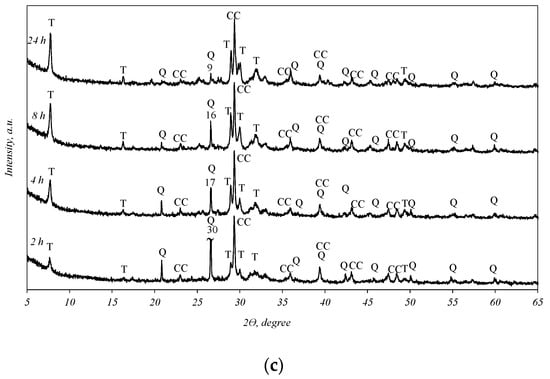
Figure 3.
X-ray diffraction analysis of hydrothermal treatment of different biomass fly ash: (a)—sample S1, (b)—sample AR1, (c)—sample AR1.5. Indexes: Q—quartz; CC—calcite; T—tobermorite.
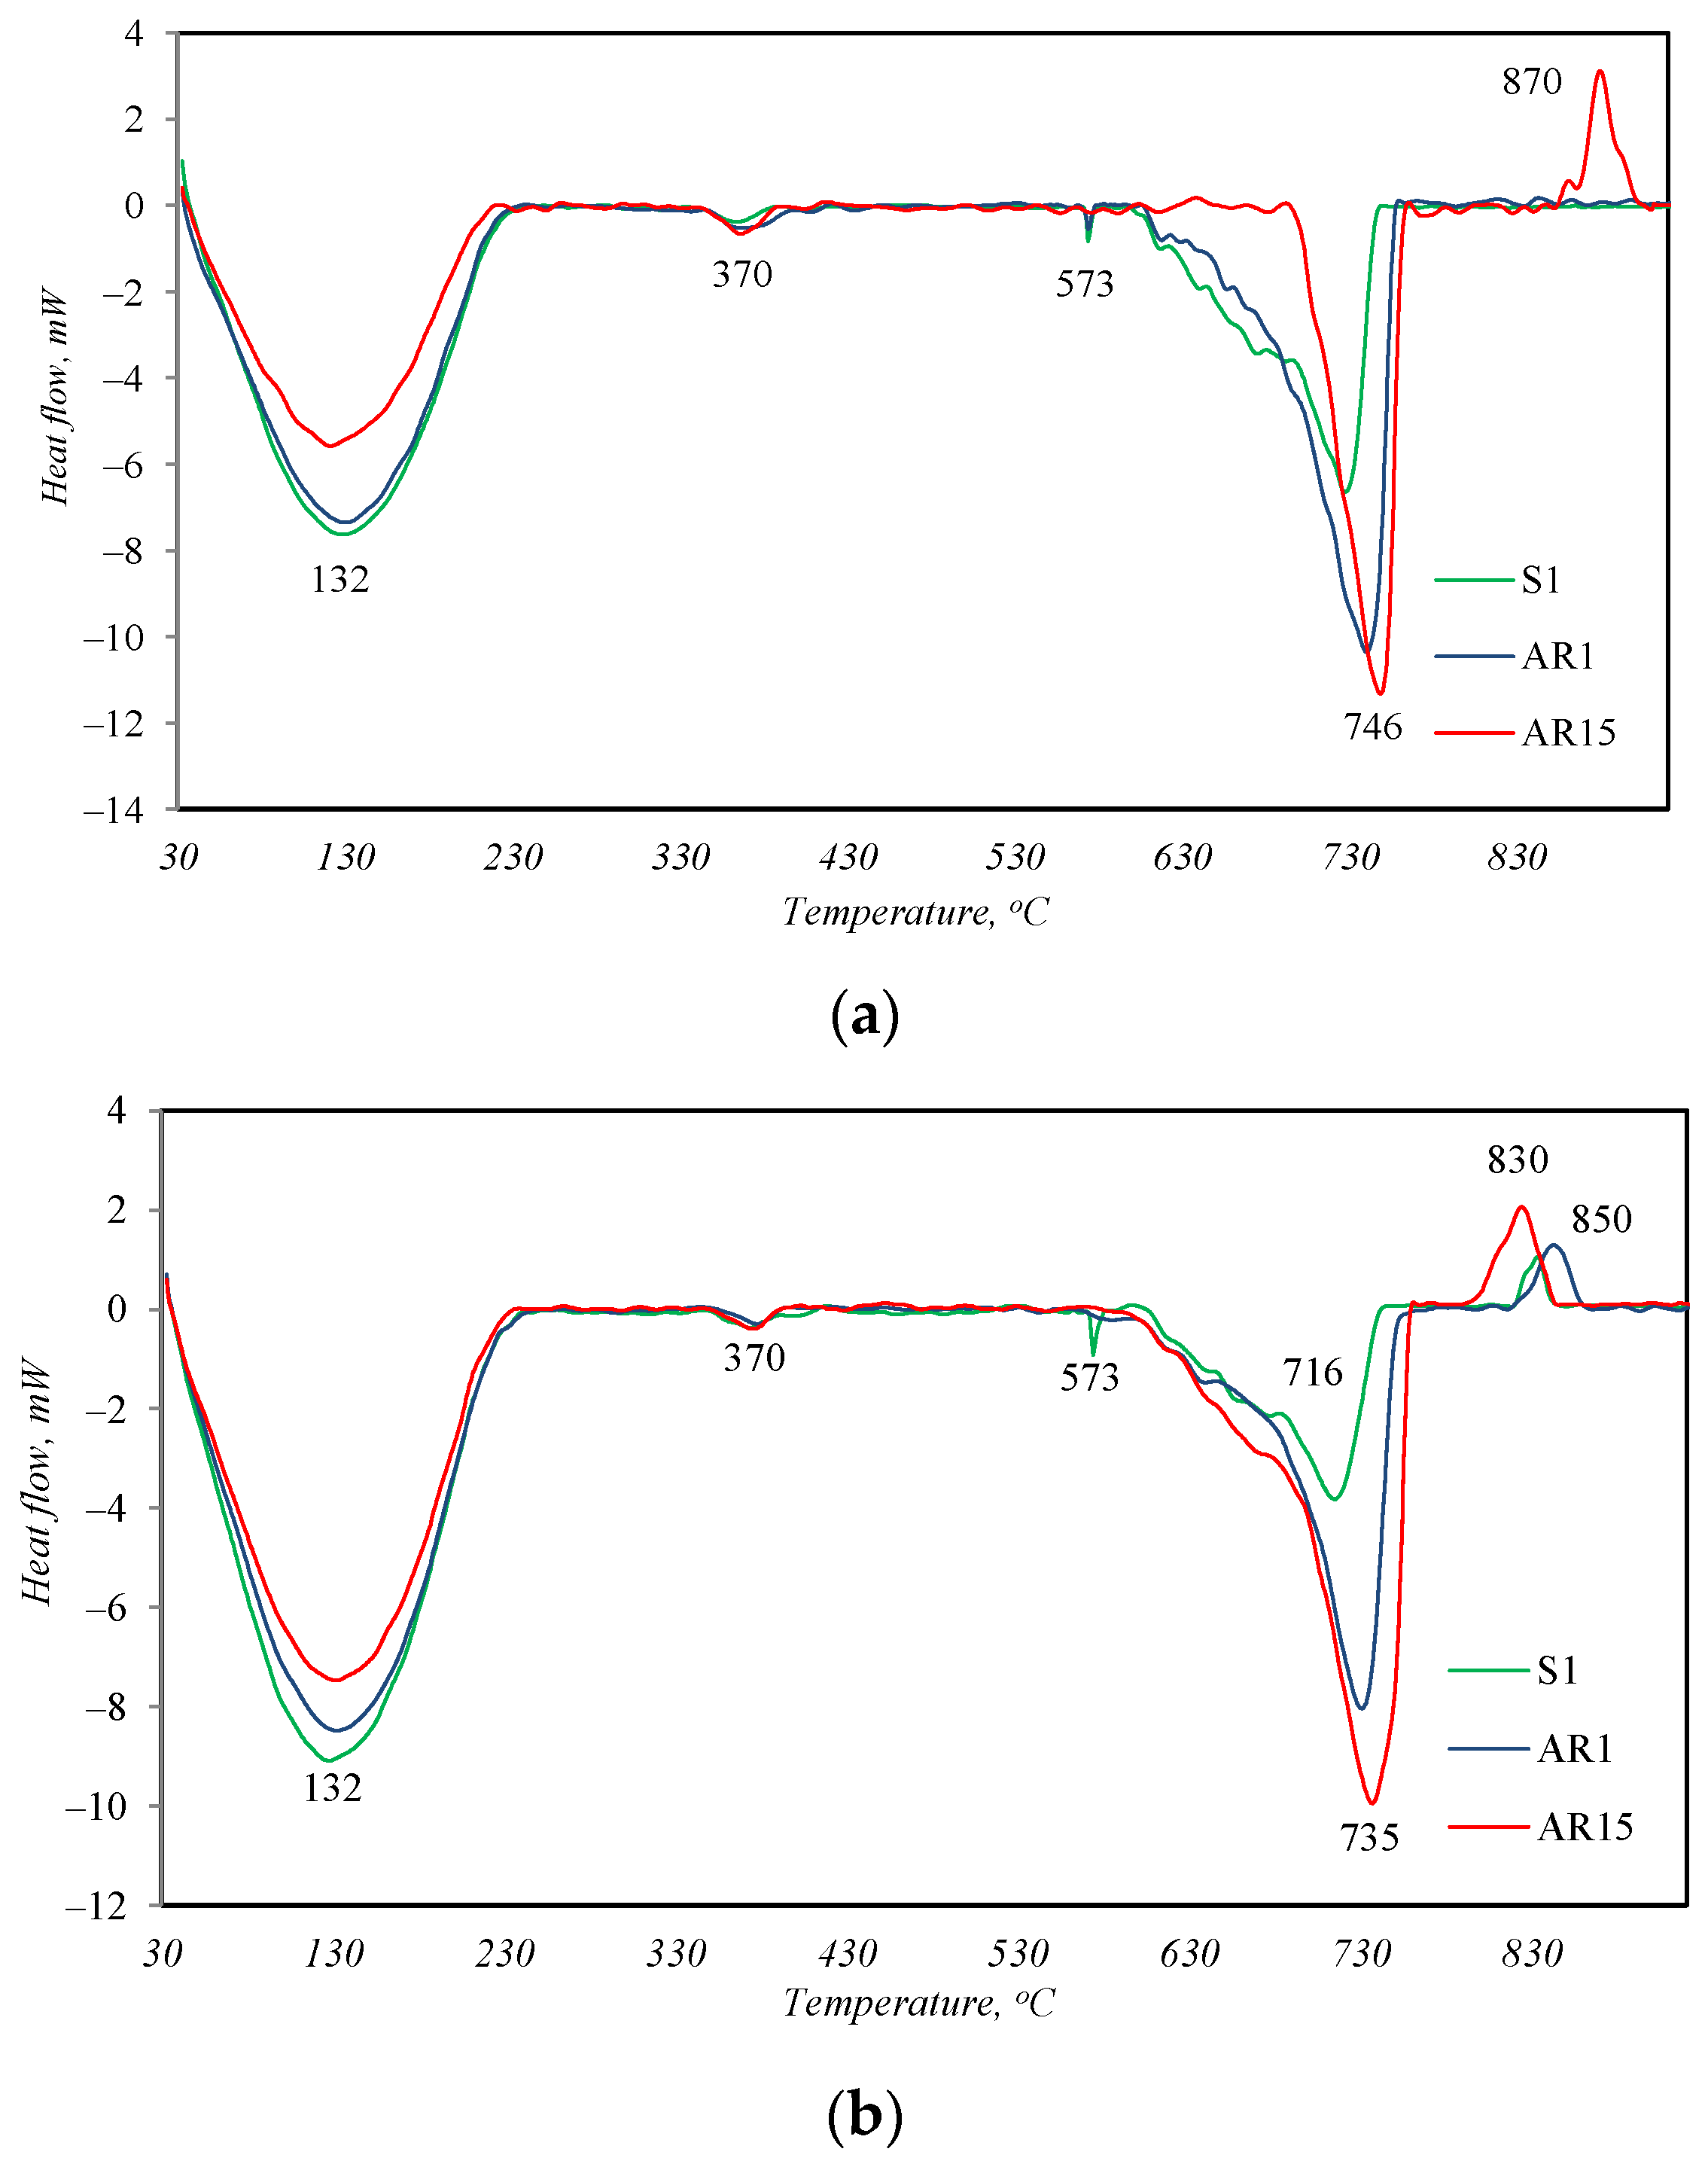
This affirmation was confirmed by the results of the simultaneous thermal analysis (Figure 4, Table 3). Because the curves of the DSC analysis of all the samples are closely similar as in the case of the XRD analysis, only the graphs after 2 and 24 h of synthesis are presented.
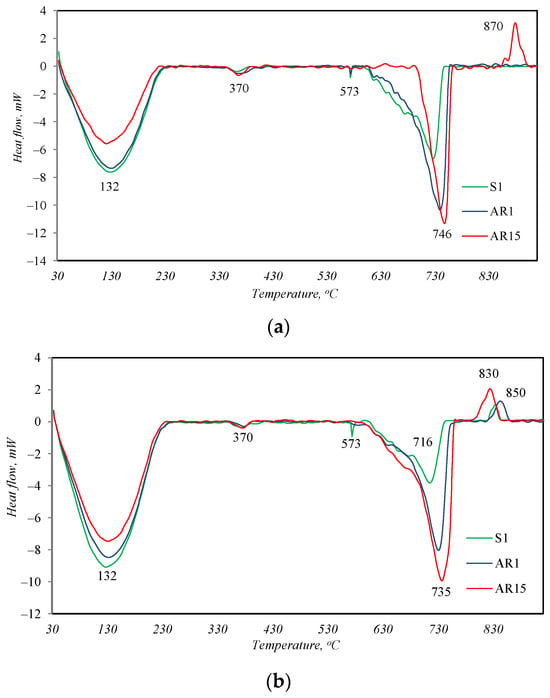
Figure 4.
DSC analysis curves of samples after 2 h (a) and 24 h (b) of hydrothermal treatment.
Table 3.
Thermogravimetric analysis data on sample mass loss at 50 and 200 °C after different durations of synthesis.
In all the DSC curves of the samples treated for 2 h under hydrothermal conditions (Figure 4a), four endothermal effects are visible. Three effects describe the thermal changes in materials identified by the XRD method. The endothermal effect with a maximum at 132 °C is attributed to the removal of absorptive/structural water from the synthesis products, which is also characteristic of the partial decomposition of tobermorite [26]; a peak at 573 °C describes the recrystallization of quartz from alpha to beta modification; and a peak at 730 °C is attributed to the decomposition of CaCO3. In addition to these described peaks, another non-intense endothermic effect is visible in the temperature range of 350–390 °C in the DSC curves of all samples. This peak is typical for the decomposition of hydrogarnets with varying degrees of silicate substitution [27], which, due to its amorphous form, was not identified by the XRD method.
The main difference between the profiles of the DSC curves is the exothermic effect at ~845 °C, which appears in the curve of sample AR1.5. This peak is indicative of the transformation of semi-crystalline or amorphous calcium silicate hydrates with a lower CaO/SiO2 ratio (C-S-H(I)) into wollastonite [28]. This shows that not only crystalline but also amorphous calcium silicate hydrates can form in the synthesis products, which are not identified by the XRD method. After 24 h of synthesis, the peak of recrystallization of these amorphous compounds into wollastonite is already visible in the DSC curves of all samples (Figure 4b). The earlier formation of amorphous calcium silicate hydrates in sample AR 1.5 is apparently related to the nature of the starting materials. This sample contains the largest amount of R-type fly ash, in whose XRD curve (Figure 1) amorphous compounds were identified.
Since the target synthesis product was calcium silicate hydrates, Table 3 presents the TG analysis data for the mass loss of all hydrothermally treated samples at temperatures between 50 and 200 °C.
As can be seen from the provided data, calcium silicate hydrates already formed after 2 h of hydrothermal treatment. By extending the synthesis time to 24 h, the amount of new calcium silicate hydrates formed increased slightly. The highest mass losses during the decomposition of calcium silicate hydrates were recorded in the AR1 sample and the lowest were recorded in the AR 1.5 sample.
On the other hand, 2 h of hydrothermal treatment at 200 °C was a sufficient amount of time for the formation of calcium silicate hydrates. The slightly higher amount of these compounds, formed by extending the duration of synthesis, does not compensate for the energy costs required for synthesis.
In addition to the study of the composition of the synthesis products, a study of the chemical composition of the liquid medium remaining after the filtering of the synthesis products was carried out. The data of the ICP-OES analysis results after 2 h of hydrothermal treatment are presented in Table 4.
Table 4.
Concentration of components in liquid medium after 2 h of hydrothermal treatment.
As can be seen from the data in Table 4, the most soluble components—SO3, K2O, Na2O, and CaO—were mostly transferred to the liquid medium during hydrothermal synthesis. The concentration of all other components, including heavy metals, in the liquid medium was extremely low. The total amount of leached materials from ash during the hydrothermal treatment was the highest in sample S1, which contained the most K2O.
It should be noted that due to the small amount of components transferred to the liquid medium, this medium can be reused for synthesis. After several stages of synthesis, the liquid medium can be easily purified with anionic and cationic sorbents. Therefore, it can be concluded that the hydrothermal biomass fly ash processing method is a sustainable method that allows the prevention of environmental pollution.
3.2. The Influence of Synthesized Additive on Portland Cement Hydration and Hardening
The cement paste samples were formed by substituting 5–15 wt.% of ordinary Portland cement with synthesized additives (S1, AR1, and AR1.5). Table 5 displays the mixing ratios and principal properties of the cement paste samples.
Table 5.
Normal consistency and setting time of Portland cement paste with additives.
As depicted in Table 5, the water requirement to achieve normal consistency in cement pastes containing additives exceeds that of pure cement pastes. This phenomenon is ascribed to the sorption properties of the synthesized additives, which prompt a heightened water demand. All samples with additives exhibited slightly longer setting times (except the initial setting time of sample 10S1) compared to the pure Portland cement paste. The longer setting times in samples with additives could be related to the elevated sulphate content (Table 1) in biomass fly ash.
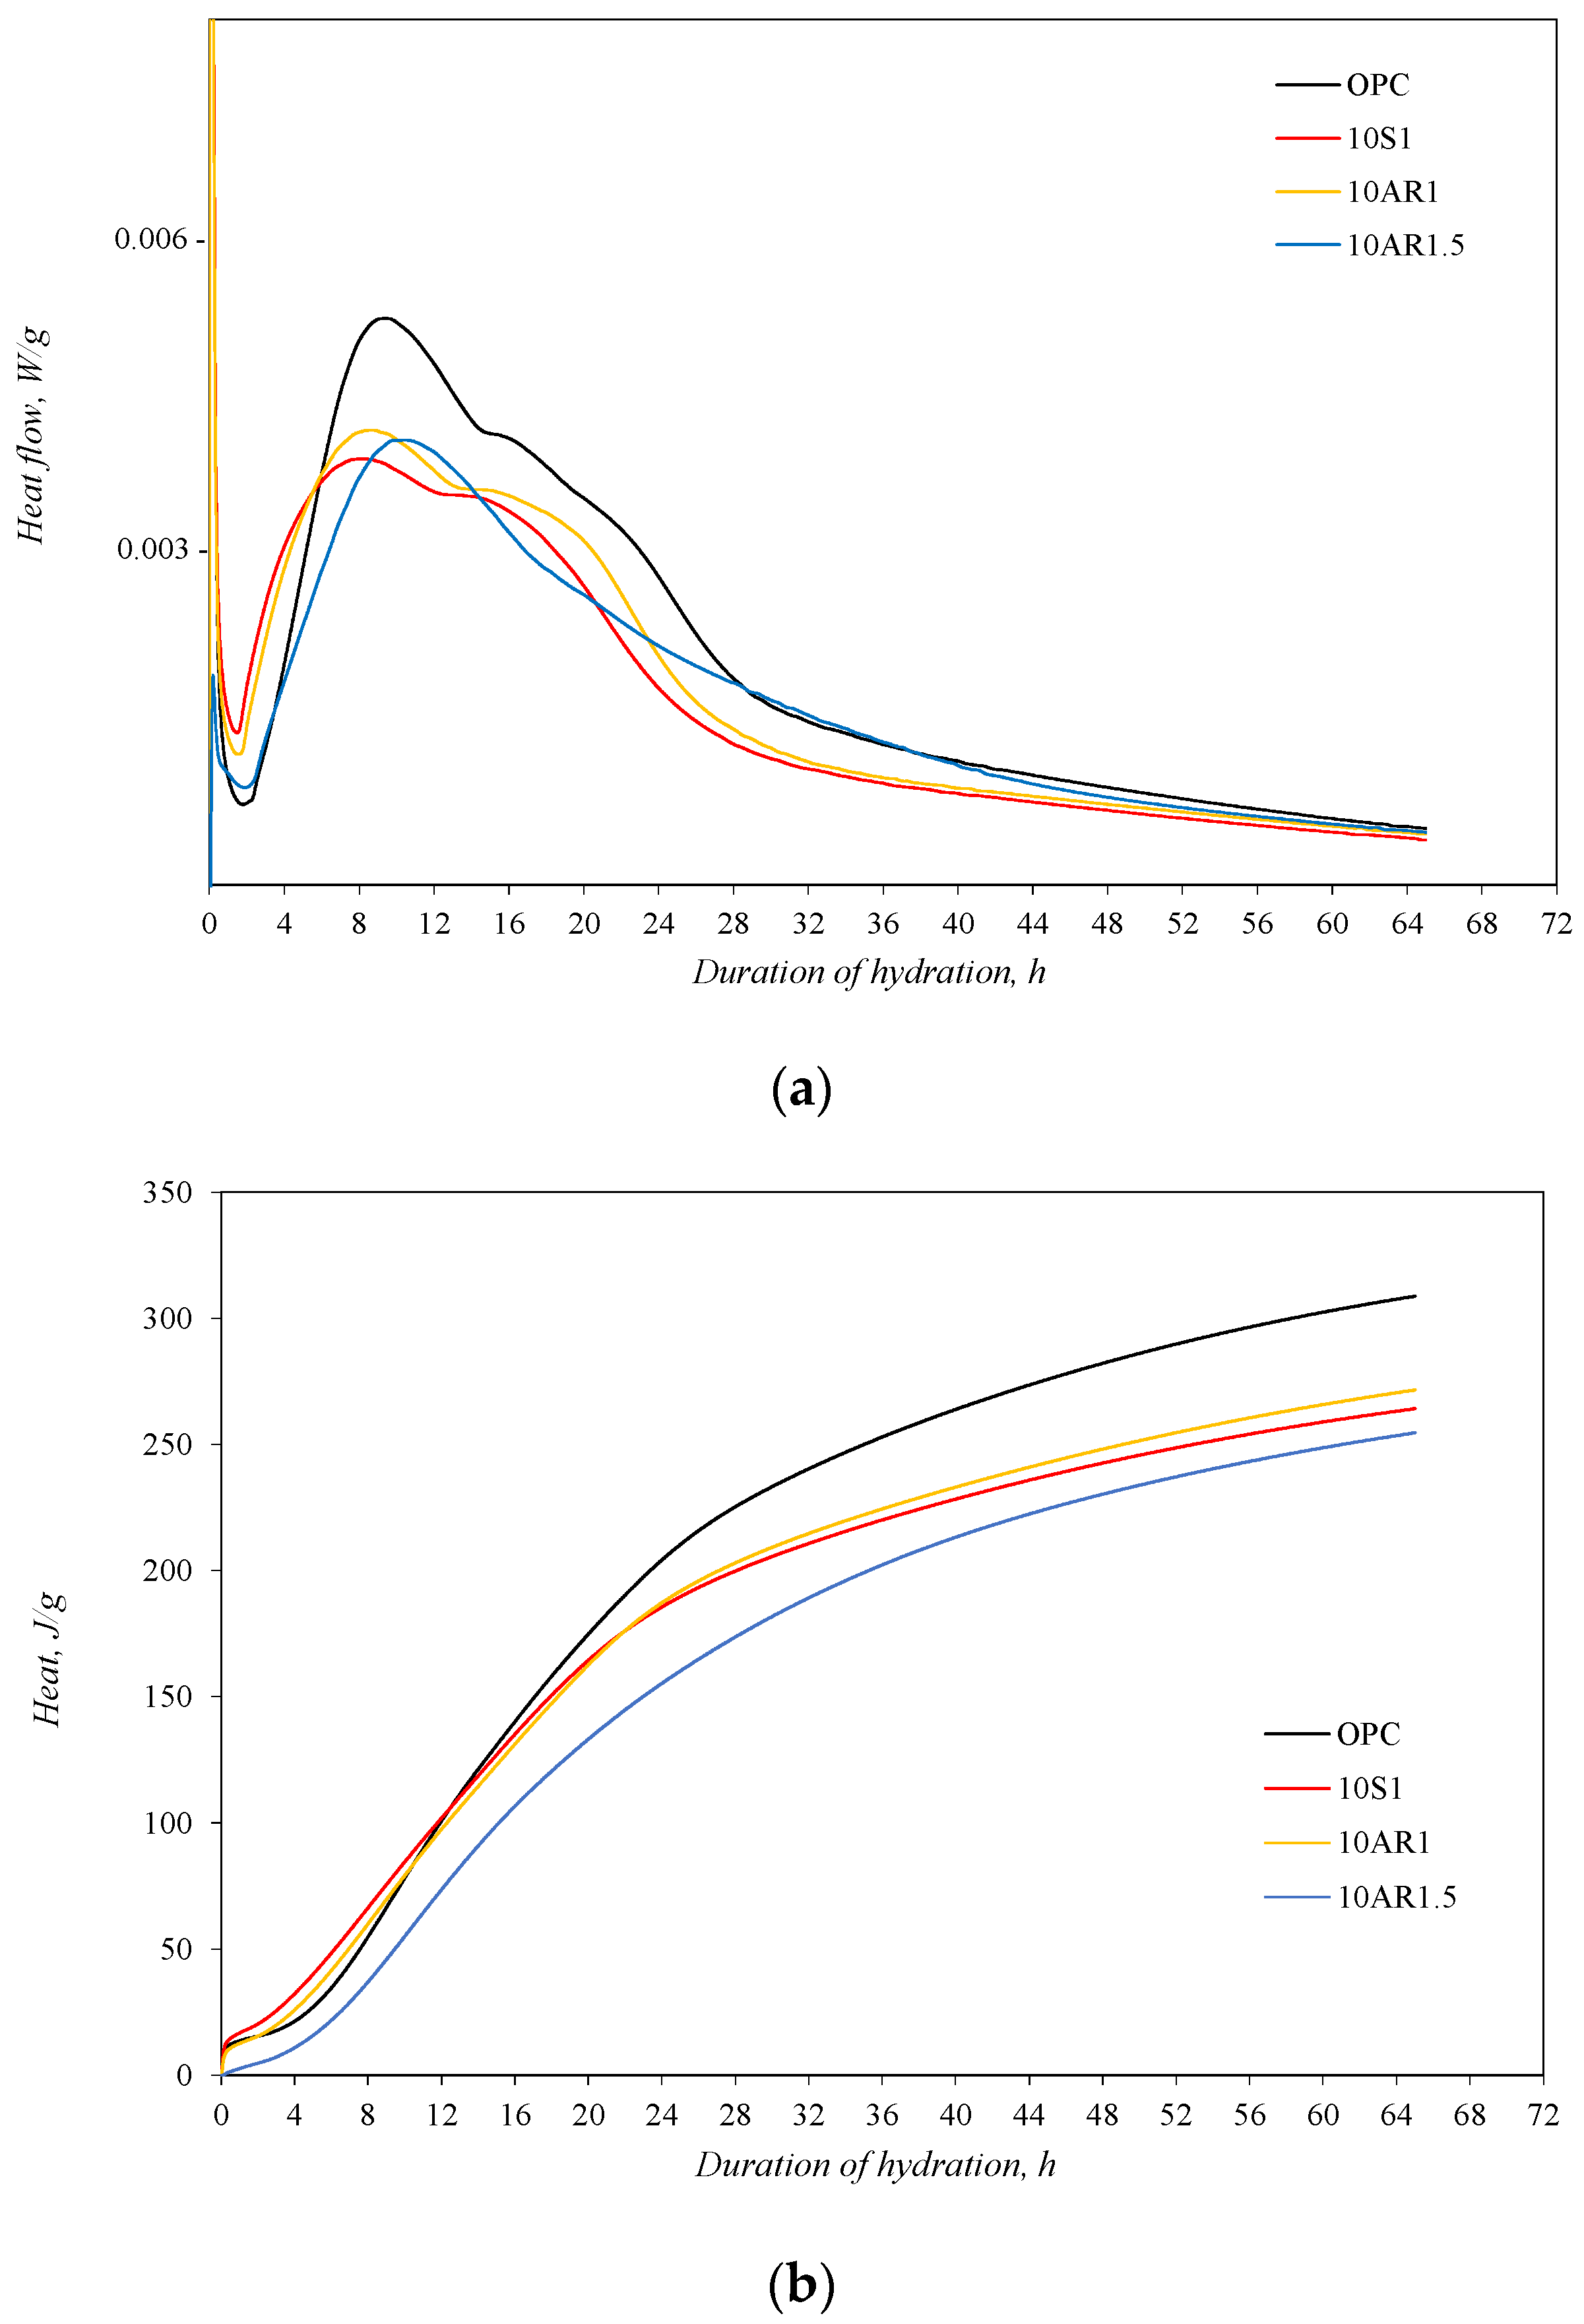
For an estimate of the influence of synthesized additive on the early hydration process of Portland cement, an isothermal calorimetry test was performed. The test was carried out with a pure Portland cement sample and samples in which 10% by weight of Portland cement was replaced by additives S1, AR1, and AR1.5. The test results are presented in Figure 5.
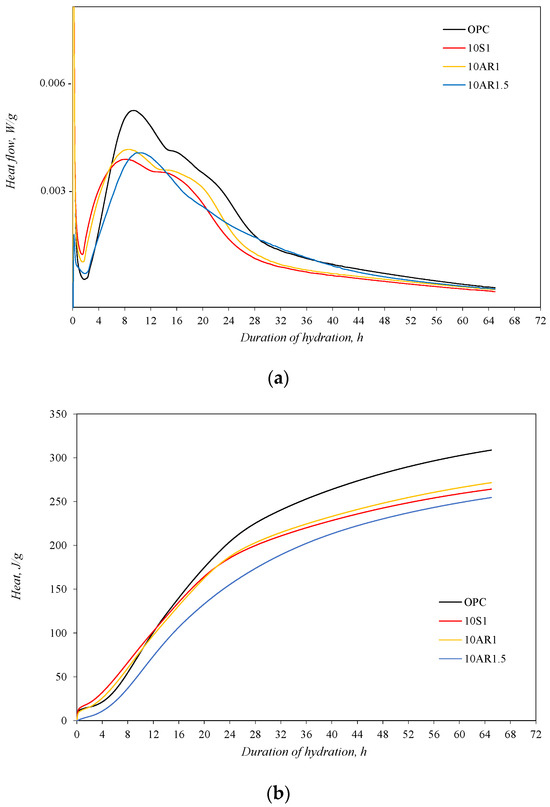
Figure 5.
The isothermal calorimetry analysis results of samples: (a) heat flow; (b) total heat.
The highest intensity of heat flow was identified in the Portland cement without additives. Meanwhile, in samples with additives, the induction period came earlier than in the OPC sample and was significantly shorter, especially in samples 10S1 and 10AR1 (Figure 5a). In these samples, the second peak of heat emission, related to the hydration of calcium silicates, also appeared in a shorter time period from the start of hydration. Meanwhile, the second peak of heat evolution in the AR1.5 sample was reached at the same time as in the OPC sample. The shifting of heat flow curves with additives to the side of shorter durations indicates the acceleration of C3S hydration in the early period. However, this acceleration does not compensate the reduction in the degree of the C3S hydration reaction, because in the samples with additives, less C3S reacts, and more heat of hydration is released from the sample cement without additives (Figure 5b).
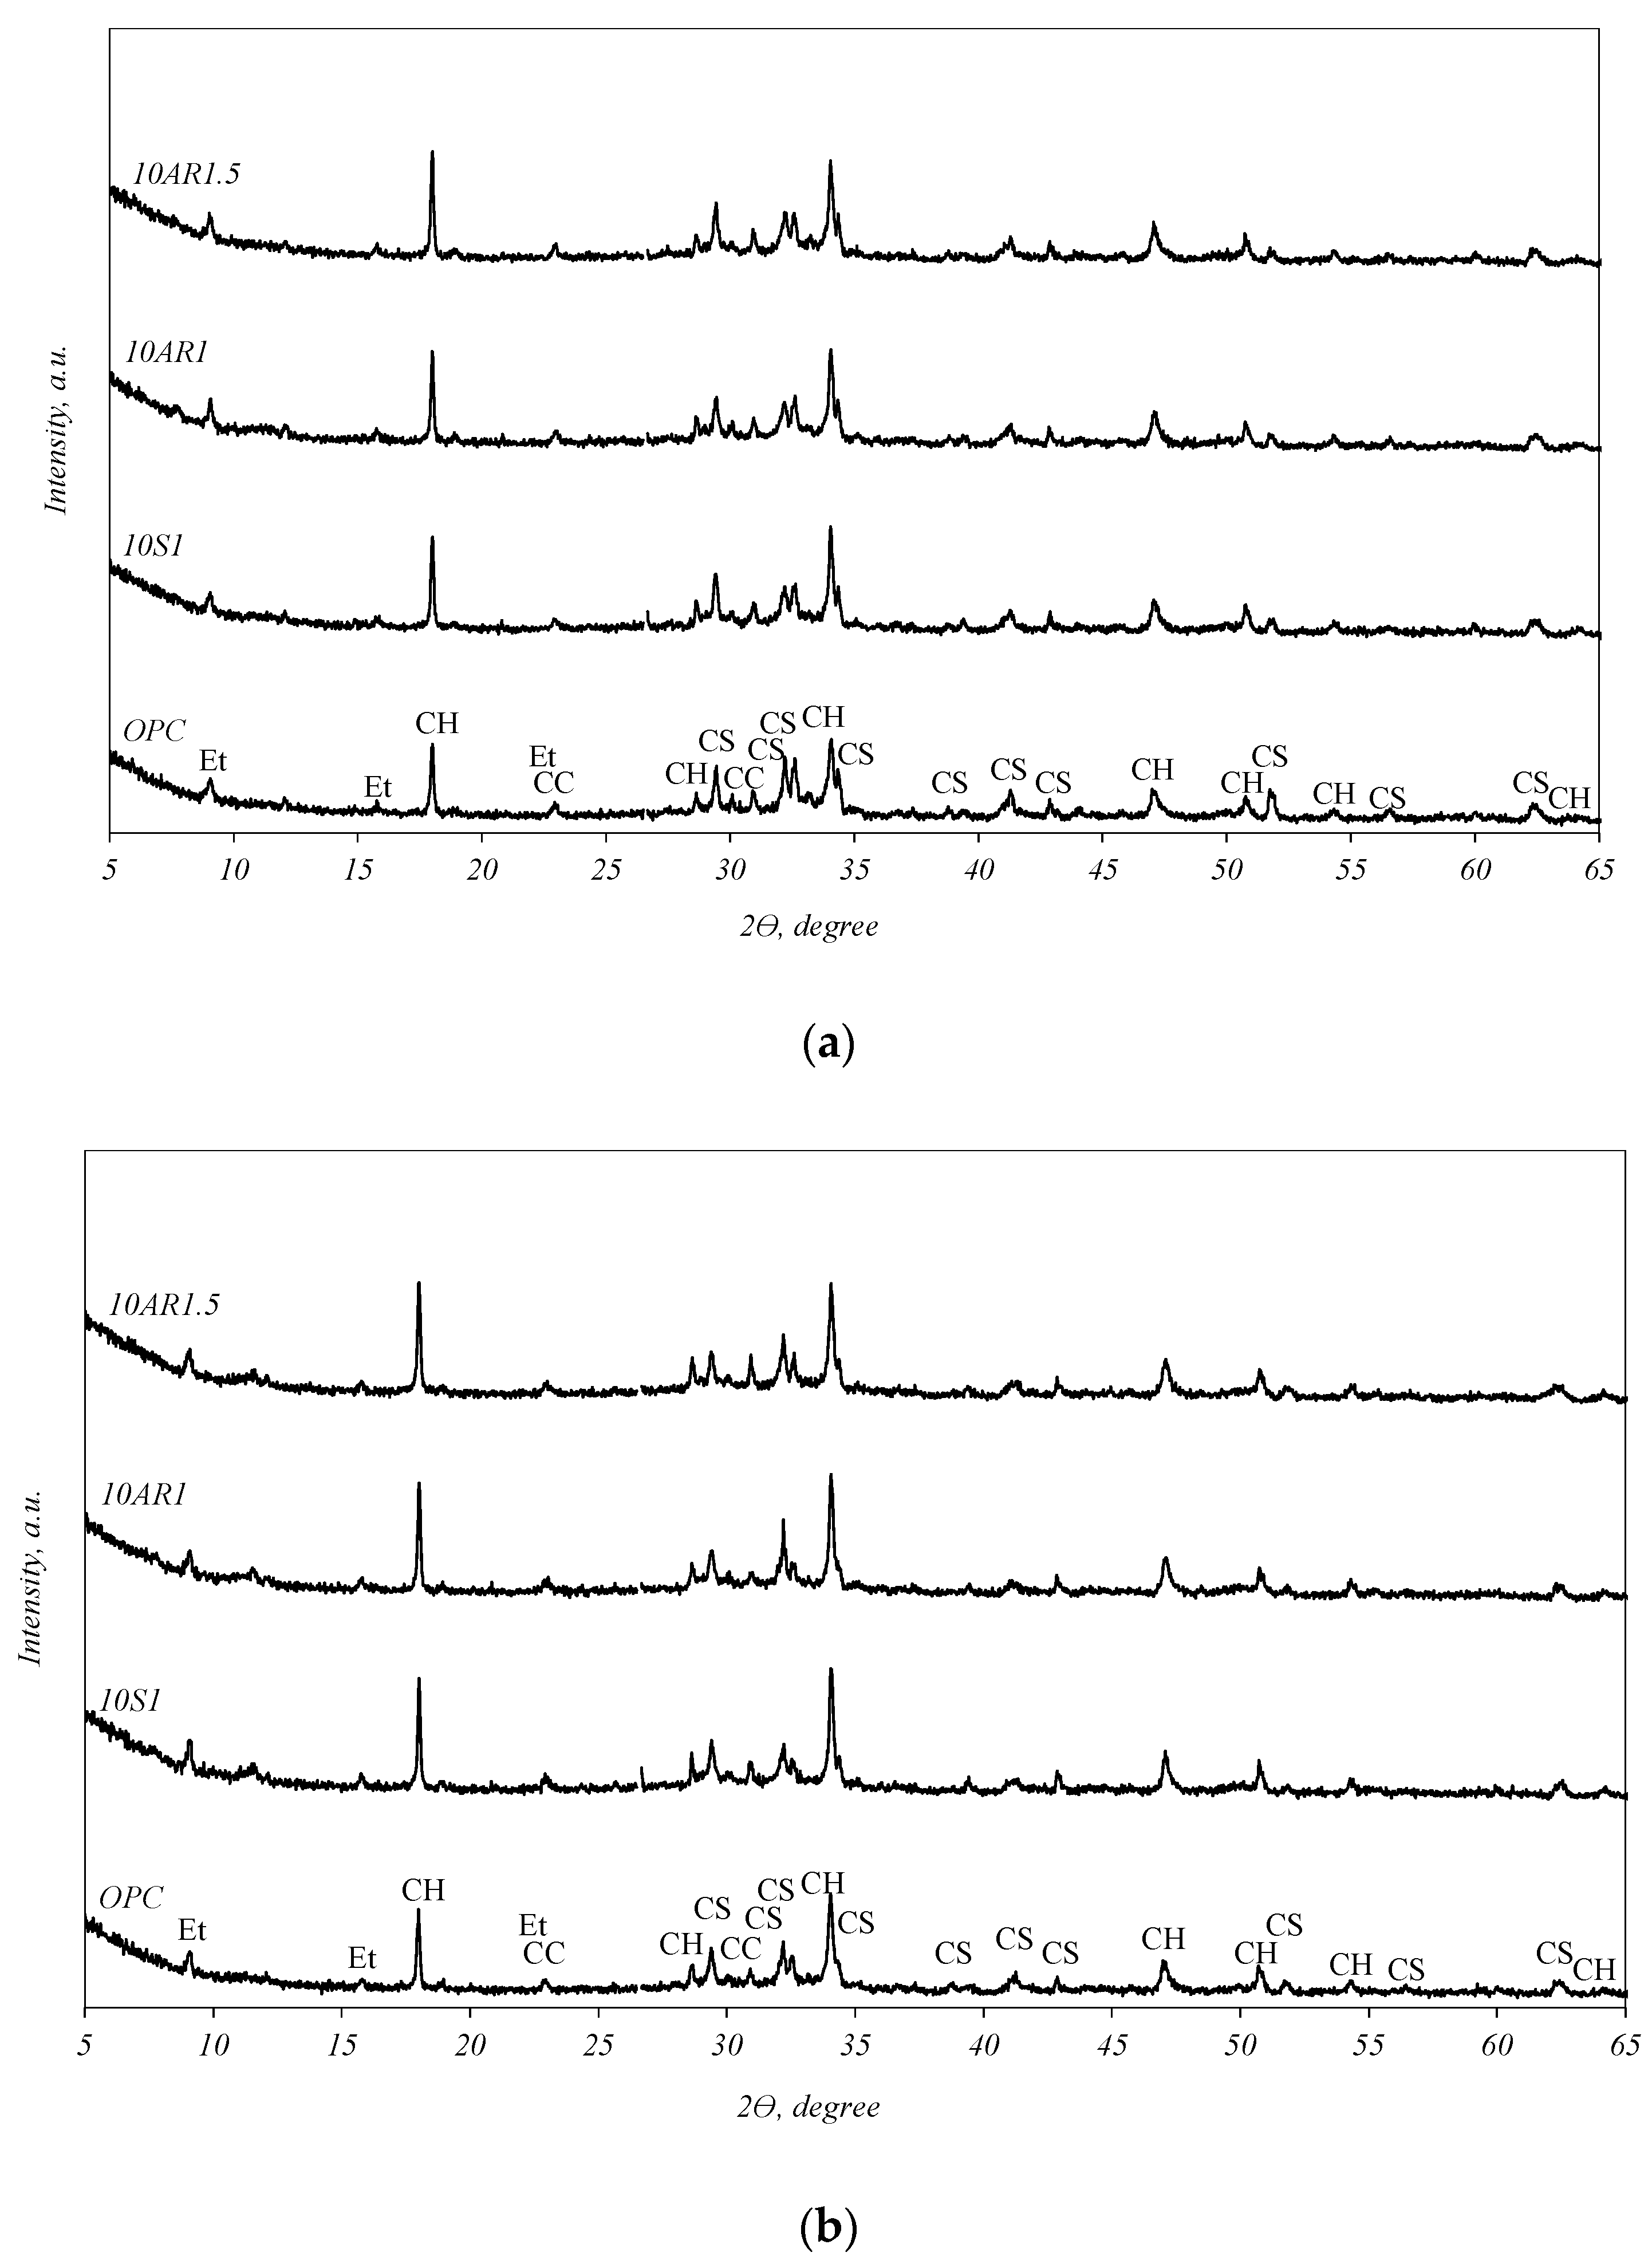
The XRD analysis curves of the samples hydrated for 2 and 28 days are presented in Figure 6. In all samples, regular cement hydrates were formed, ettringite (PDF 41-1451) and portlandite (Ca(OH)2) (PDF 84-1271). In addition, unhydrated calcium silicates (C3S, C2S) (PDF 42-551) and calcite (CaCO3) (PDF 5-586) were detected in the samples. Although the XRD curves of the samples after 2 days of hydration (Figure 6a) appear similar, a disparity can be observed in the intensities of the portlandite peaks and unhydrated calcium silicates. The samples containing additives exhibit higher intensities of portlandite and lower intensities of unhydrated calcium silicates compared to the pure cement sample. The same trend persists after 28 days of hydration (Figure 6b); however, the differences in the peak intensities mentioned in these XRD curves are not so clear.
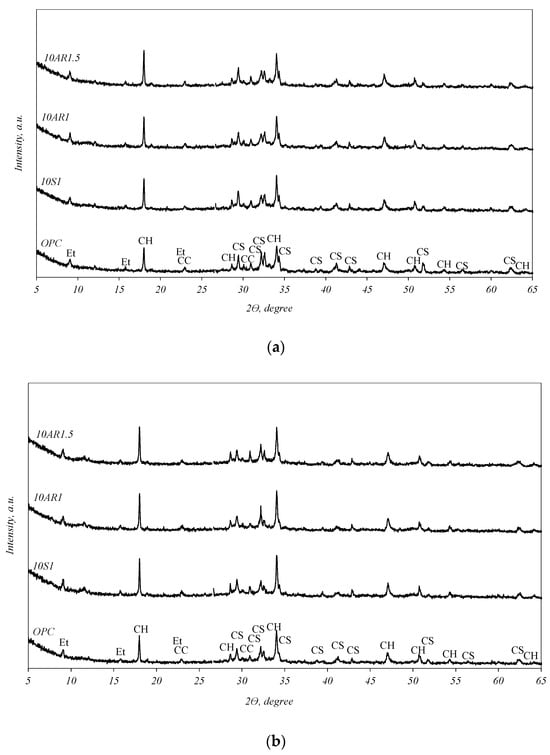
Figure 6.
XRD analysis curves of the samples hydrated for 2 (a) and 28 (b) days. Indexes: CC—calcite; Et—ettringite; CH—portlandite; CS—unhydrated calcium silicates.
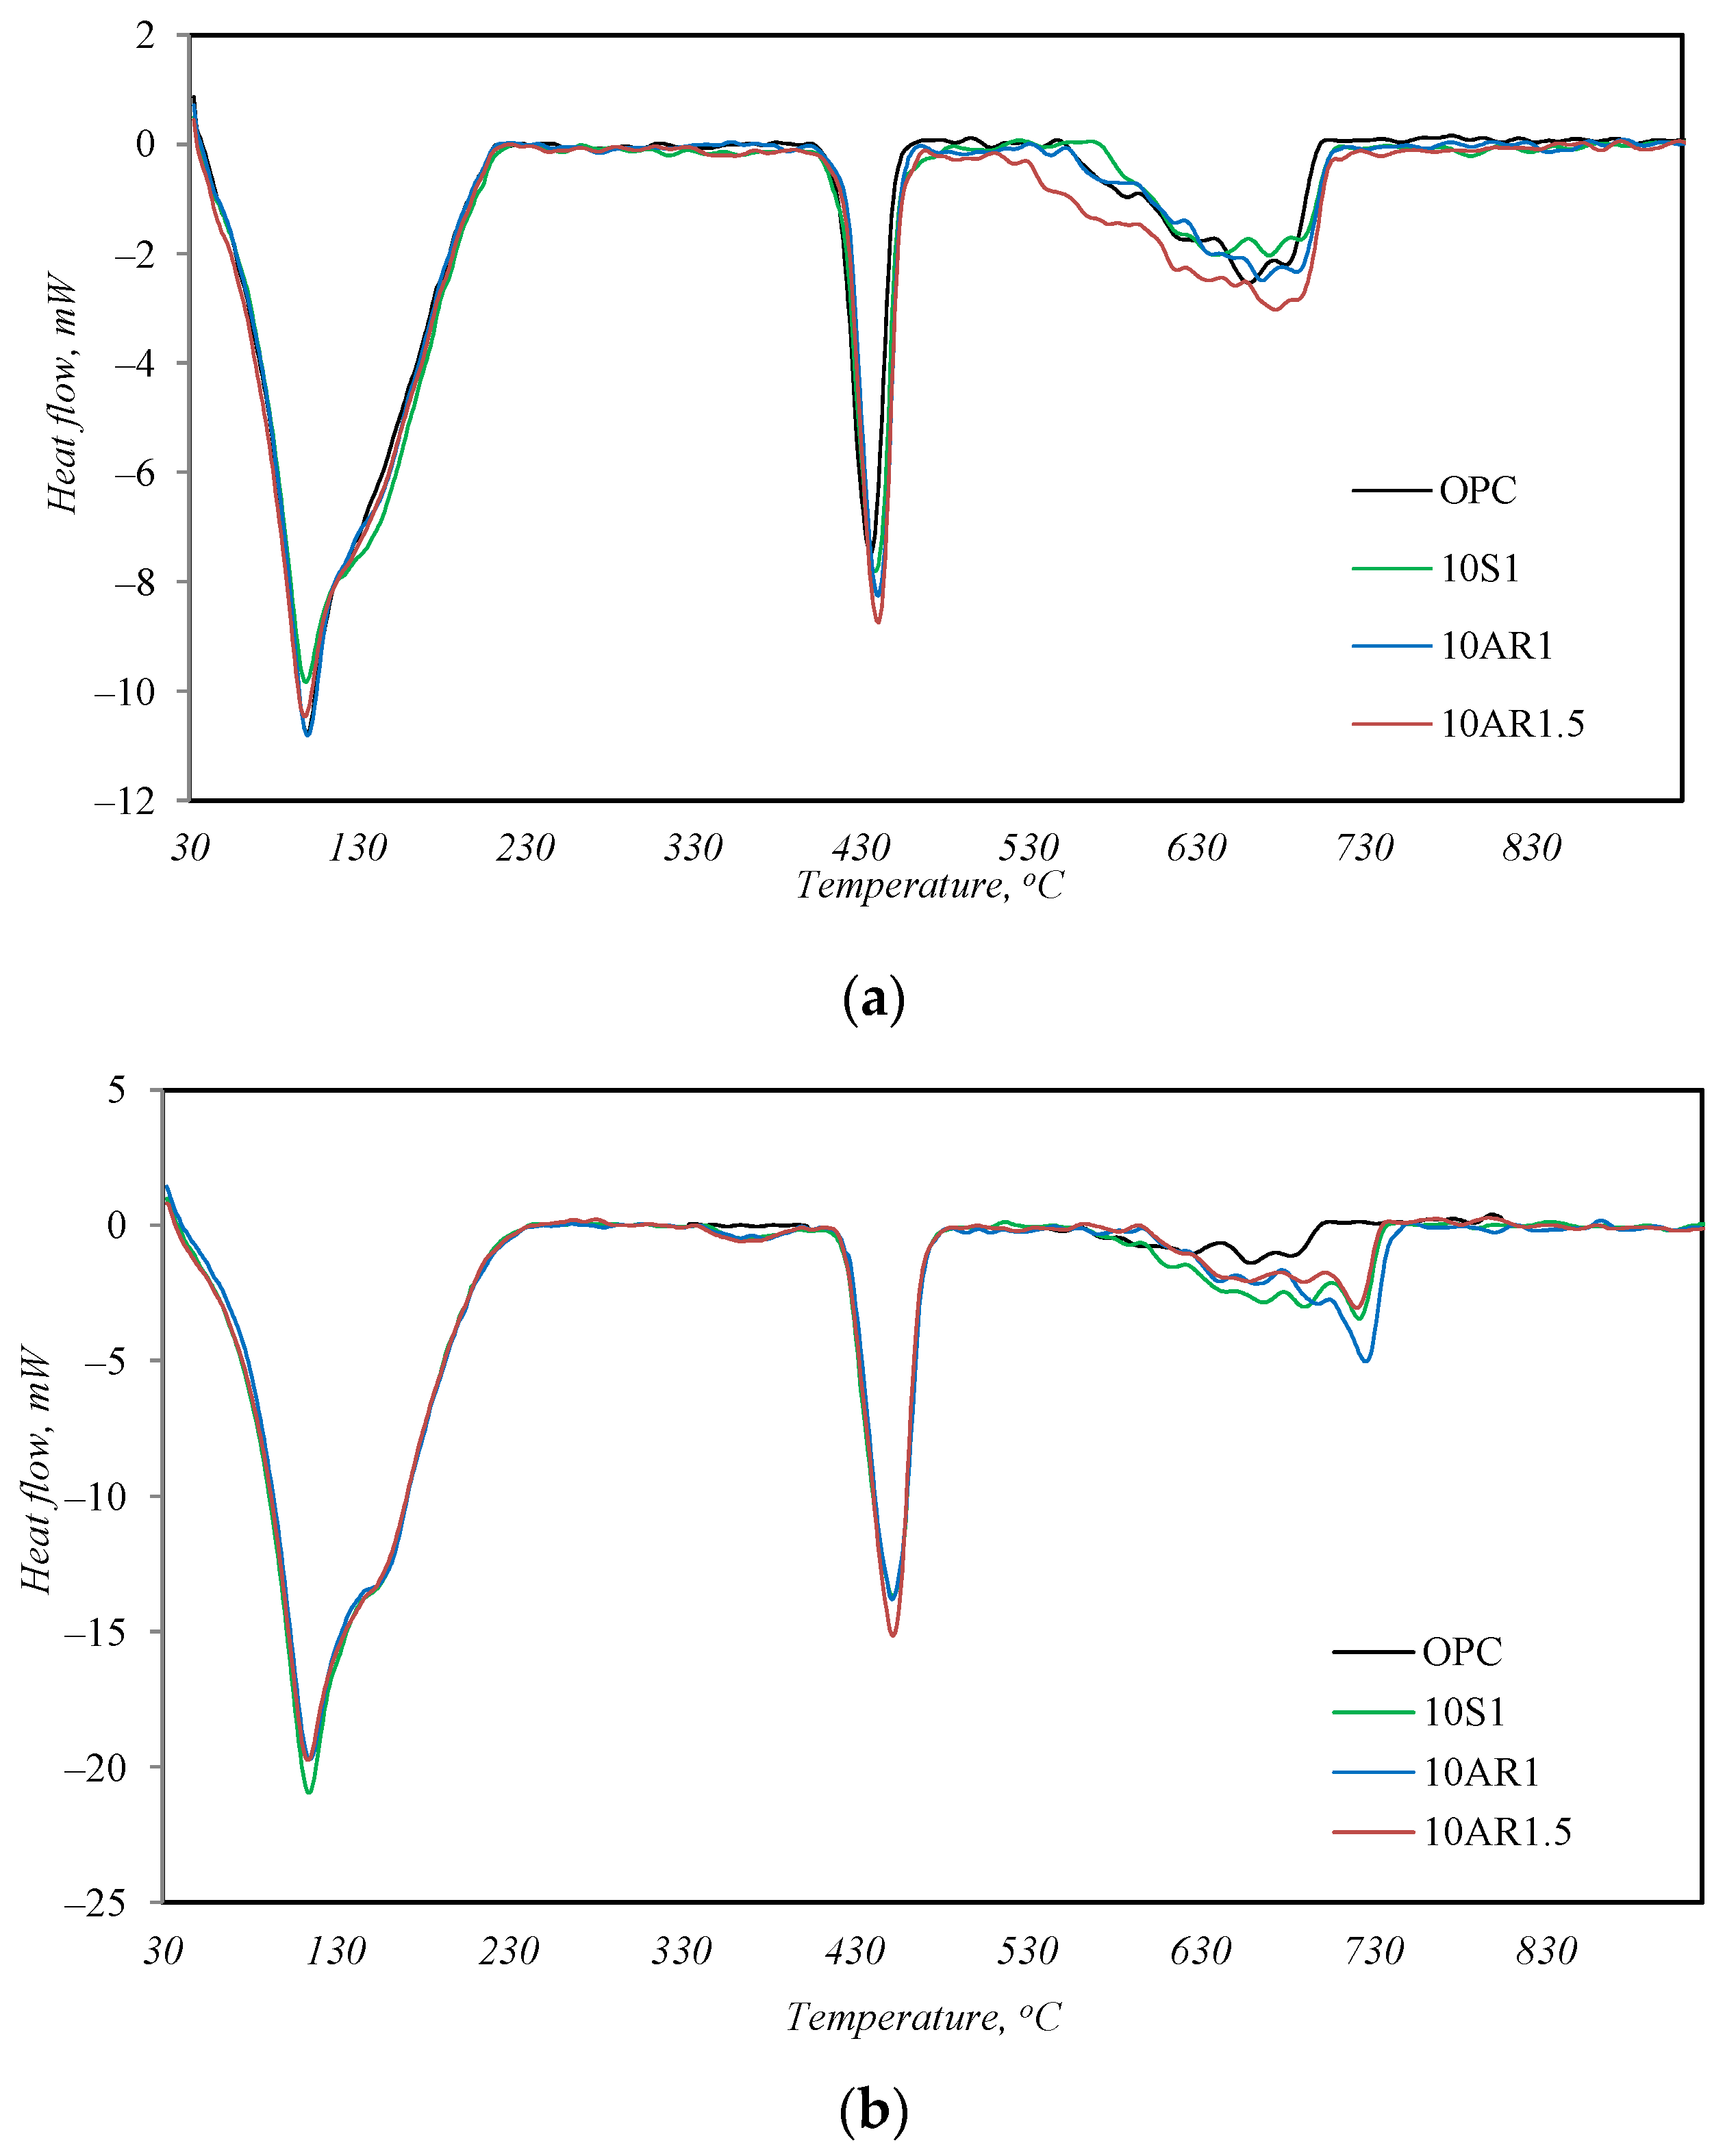
The outcome of the simultaneous thermal analysis is presented in Figure 7 and Table 6. After 2 days of hydration, as well as after 28 days of hydration, the profiles of the DSC curves of all samples are very similar; only the intensities of the peaks are slightly different. Three endothermic peaks are observed in the temperature range from 30 to 950 °C (Figure 7). The peak at 50–220 °C is associated with the split of the main cement hydrates (C-S-H, ettringite, calcium aluminate hydrate, hydrogarnets), the peak at ~450 °C identifies the decay of portlandite, and the peak at 650–750 °C indicates the decomposition of calcite [29]. After 28 days of hydration, the character of the DSC curves remains the same (Figure 7b), except for one notable difference. Another weak endothermic effect appears in the temperature range of 350–390 °C in the DSC curves of all samples with additives. This effect can also be observed in the DSC curves of samples after hydrothermal treatment (Figure 4a). As mentioned above, this peak is typical of the decomposition of hydrogarnets, and this fact shows that the investigated additives also promote the formation of hydrogarnets in cement.
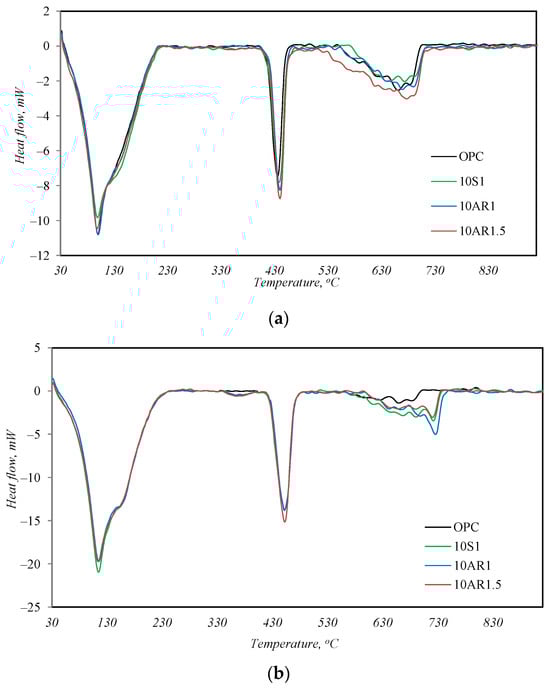
Figure 7.
DSC analysis results after 2 (a) and 28 (b) days of hydration.
Table 6.
Results of the thermogravimetric analysis after 2 and 28 days of hydration.
In Table 6, the total mass loss of the samples at 50–220 °C is presented, excluding the mass loss of the additive itself because part of the additive loses its mass at this temperature due to the dehydration of C-S-H. After 2 days of hydration, the mass loss of the sample without additive and the samples with 10% by weight of the additives S1 and AR1.5 was the same at this temperature, while the mass loss of the sample with the AR1 additive was higher. This indicates that, even with a lower amount of cement in the reaction, the samples with all additives produced the same or a higher amount of main cement hydrates. The same trend could be seen after 2 days of hydration in the amount of mass loss of the samples during portlandite decomposition at 450 °C. The mass loss of the samples with additives S1 and AR1.5 was greater than the pure cement sample, while the mass loss of the sample with the AR1 additive was slightly smaller. In summary, it can be said that all the additives promote the hydration of calcium silicates, but in the samples with additives S1 and AR1.5, more portlandite is formed, and in the AR1 sample, more calcium silicate hydrates are formed.
After 28 days of hydration, this trend is no longer observed. The highest mass losses at temperatures of 50–220 °C were determined in the sample without additives and in sample 10S1; however, the highest mass losses at ~450 °C remained in sample 10AR1.5. Therefore, it can be said that during the initial hydration period (up to 2 days), the investigated additives promote the hydration of Portland cement, but as the duration of hydration increases to 28 days, this influence becomes less noticeable.
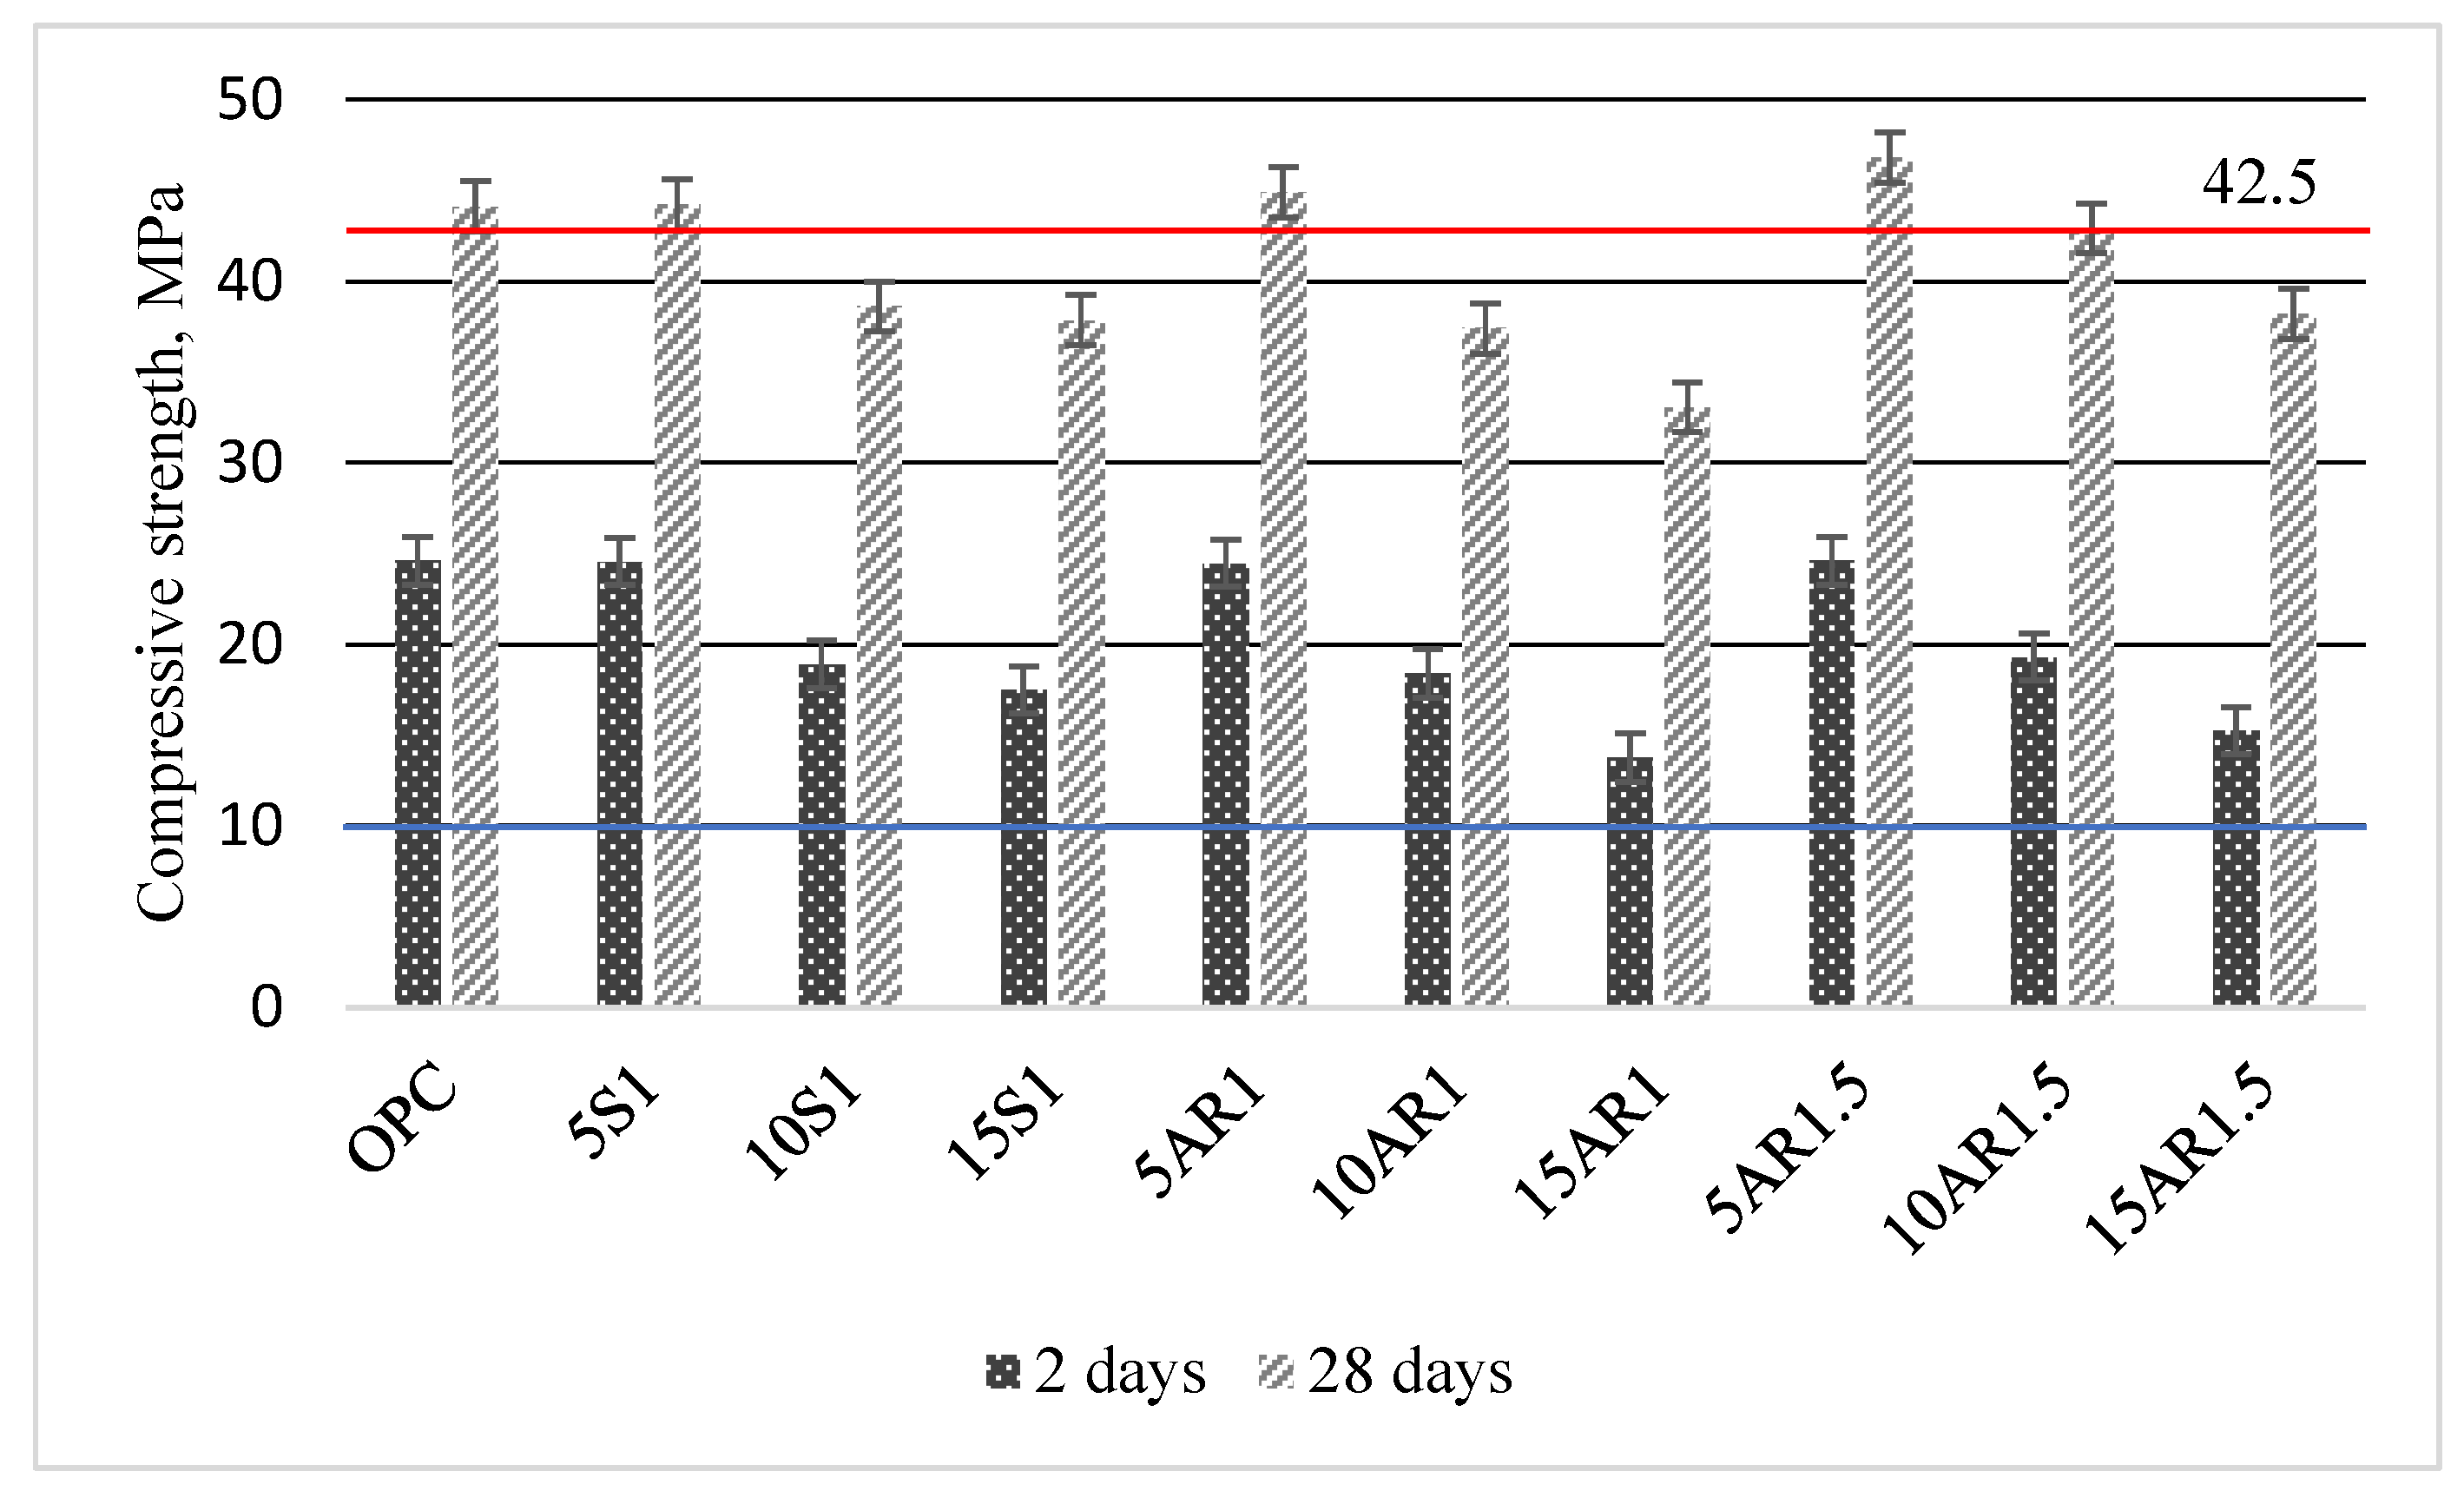
Figure 8 summarizes the data of the compressive strength of the Portland cement samples for different durations of hydration and different additives.
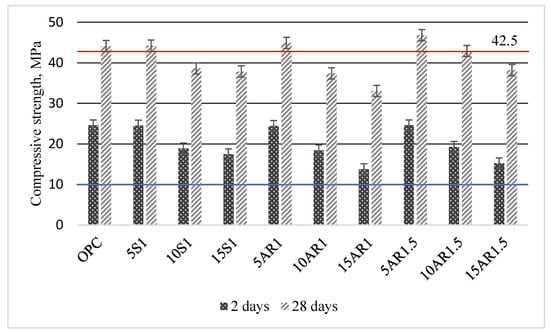
Figure 8.
Compressive strength of Portland cement samples with different additive after 2 and 28 days of hydration.
Following 2 days of hydration, the compressive strength of the samples incorporated with 5 wt.% of various additives was similar to that of pure cement (24.60 MPa), ranging from 24.55 to 24.60 MPa. However, with increasing additive content up to 15 wt.%, the compressive strength of all samples with additives decreased compared to that of the pure cement sample, regardless of the specific additive used. However, it should be noted that the compressive strengths of all samples after 2 days of hardening meet the requirements of the EN 197-1:2011 standard [30] and are greater than 10 MPa. After 28 days of curing, all samples with 5 wt.% of different additives showed slightly higher compressive strengths (44.2–44.8 MPa) than the Portland cement sample (44.1 MPa) and met the requirements of the mentioned standard for cement 42.5 N. The requirements of this standard are also met by the compressive strength of sample with 10 wt.% of AR1.5 additive (42.9 MPa). The compressive strengths of all other samples with additives decreased in direct proportion to the amount of additive added and were lower than 42.5 MPa.
In summary of the findings of this section, it can be concluded that knowing the volume of cement production, substituting 5% to 10% of the weight of cement with biomass fly ash after hydrothermal treatment allows the sustainable utilization of a significant portion of this waste.
4. Conclusions
- The biomass fly ash collected in the e-filters was distinguished by the highest CaO/SiO2 ratio (7.39–8.57), and in the ash collected in a common gas treatment system or in cyclones, this ratio varied only in the range of 0.67–1.56.
- Calcium silicate hydrates had already formed after 2 h of hydrothermal treatment at 200 °C, when the initial CaO/SiO2 ratio of 1 and 1.5 was chosen. In the synthesis products, tobermorite and amorphous calcium silicate hydrates dominated. Together with these compounds, quartz, calcite, and hydrogarnets were identified.
- All synthesized additives accelerated the hydration of calcium silicates in the early period of hydration of Portland cement.
- 5% to 10% of the weight of cement can be replaced by hydrothermally treated biomass fly ash without reducing the compressive strength class of Portland cement samples.
Author Contributions
Conceptualization, R.K., A.E. and I.B.; methodology, R.K., A.E., M.G. and I.B.; software, A.E. and I.B.; validation, R.K., A.E., M.G. and I.B.; investigation, R.K., A.E., M.G. and I.B.; writing—original draft preparation, R.K., A.E. and I.B.; writing—review and editing, R.K.; visualization, A.E. and I.B.; supervision, R.K. All authors have read and agreed to the published version of the manuscript.
Funding
This research was funded by the Research Council of Lithuania, grant No. S-REP-22-2.
Institutional Review Board Statement
Not applicable.
Informed Consent Statement
Not applicable.
Data Availability Statement
The data presented in this study are available on request from the corresponding author.
Conflicts of Interest
The authors declare no conflicts of interest.
References
- Sánchez, J.; Curt, M.D.; Robert, N.; Fernández, J. Chapter Two—Biomass Resources. In The Role of Bioenergy in the Bioeconomy; Lago, C., Caldés, N., Lechón, Y., Eds.; Academic Press: London, UK, 2019; pp. 25–111. [Google Scholar]
- Dogar, S.; Nayab, S.; Farooq, M.Q.; Said, A.; Kamran, R.; Duran, H.; Yameen, B. Utilization of Biomass Fly Ash for Improving Quality of Organic Dye-Contaminated Water. ACS Omega 2020, 5, 15850–15864. [Google Scholar] [CrossRef] [PubMed]
- Nguyen, H.H.T.; Nguyen, H.T.; Ahmed, S.F.; Rajamohan, N.; Yusuf, M.; Sharma, A.; Arunkumar, P.; Deepanraj, B.; Tran, H.T.; Al, G.A.; et al. Emerging waste-to-wealth applications of fly ash for environmental remediation: A review. Environ. Res. 2023, 227, 115800. [Google Scholar] [CrossRef] [PubMed]
- Rajamma, R.; Ball, R.J.; Tarelho, L.A.C.; Allen, G.C.; Labrincha, J.A.; Ferreira, V.M. Characterisation and use of biomass fly ash in cement-based materials. J. Hazard. Mater. 2009, 172, 1049–1060. [Google Scholar] [CrossRef]
- Carevic, I.; Baricevic, A.; Štirmer, N.; Šantek, B.J. Correlation between physical and chemical properties of wood biomass ash and cement composites performances. Constr. Build. Mater. 2020, 256, 119450. [Google Scholar] [CrossRef]
- Ganesana, K.; Rajagopala, K.; Thangavelb, K. Evaluation of bagasse ash as supplementary cementitious material. Cem. Concr. Compos. 2007, 29, 515–524. [Google Scholar] [CrossRef]
- Jura, J. Influence of Type of Biomass Burned on the Properties of Cement Mortar Containing Fly Ash. Constr. Optim. Energy Potential. 2020, 9, 77–82. [Google Scholar] [CrossRef]
- Hamid, Z.; Rafiq, S. An experimental study on behavior of wood ash in concrete as partial replacement of cement. Mater. Today Proc. 2021, 46, 3426–3429. [Google Scholar] [CrossRef]
- Demis, S.; Rodrigues, C.S.; Santos, L.A.; Papadakis, V.G. An investigation of the effectiveness and durability characteristic of biomass ashes as pozzolanic materials. In Proceedings of the 13th International Conference on Durability of Building Materials and Components—XIII DBMC, Sao Paulo, Brazil, 2–5 September 2014. [Google Scholar]
- Kaminskas, R.; Cesnauskas, V. Influence of activated biomass fly ash on portland cement hydration. Ceram Silik 2014, 58, 260–268. [Google Scholar]
- Gabrijel, I.; Jelčić, M.R.; Štirmer, N. Influence of Wood Fly Ash on Concrete Properties through Filling Effect Mechanism. Materials 2021, 14, 7164. [Google Scholar] [CrossRef] [PubMed]
- Nicoleau, L. Accelerated growth of calcium silicate hydrates: Experiments and simulations. Cem. Concr. Res. 2011, 41, 1339–1348. [Google Scholar] [CrossRef]
- Houston, J.R.; Maxwell, R.S.; Carroll, S.A. Transformation of meta-stable calcium silicate hydrates to tobermorite: Reaction kinetics and molecular structure from XRD and NMR spectroscopy. Geochem. Trans. 2009, 10, 1. [Google Scholar] [CrossRef] [PubMed]
- Thomas, J.J.; Jennings, H.M.; Chen, J.J. Influence of nucleation seeding on the hydration mechanisms of tricalcium silicate and cement. J. Phys. Chem. C 2009, 113, 4327–4334. [Google Scholar] [CrossRef]
- Bost, P.; Regnier, M.; Horgnies, M. Comparison of the accelerating effect of various additions on the early hydration of Portland cement. Constr. Build. Mater. 2016, 113, 290–296. [Google Scholar] [CrossRef]
- Owens, K.; Russell, M.I.; Donnelly, G.; Kirk, A.; Basheer, P.A.M. Use of nanocrystal-seeding chemical admixture in improving Portland cement strength development: Application for precast concrete industry. Adv. Appl. Ceram. 2014, 113, 478–484. [Google Scholar] [CrossRef]
- John, E.; Matschei, T.; Stephan, D. Nucleation seeding with calcium silicate hydrate—A review. Cem. Concr. Res. 2018, 113, 74–85. [Google Scholar] [CrossRef]
- Artioli, G.; Valentini, L.; Dalconi, M.C.; Parisatto, M.; Voltolini, M.; Russo, V.; Ferrari, G. Imaging of nano-seeded nucleation in cement pastes by X-ray diffraction tomography. Int. J. Mater. Res. 2014, 7, 628–631. [Google Scholar] [CrossRef]
- Viallis, H.T.; Nonat, A.; Petit, J.C. Zeta-potential study of calcium silicate hydrates interacting with alkaline cations. J. Colloid. Interface Sci. 2001, 244, 58–65. [Google Scholar] [CrossRef]
- Lothenbach, B.; Nonat, A. Calcium silicate hydrates: Solid and liquid phase composition. Cem. Concr. Res. 2015, 78, 57–70. [Google Scholar] [CrossRef]
- EN 196-2:2013; Methods of Testing Cement—Part 2: Chemical Analysis of Cement. iTeh, Inc.: Newark, DE, USA, 2013.
- El, H.D.; Amer, A.A.; Sokkary, T.M.; El, S.H. Hydration and characteristics of metakaolin pozzolanic cement pastes. HBRC J. 2018, 14, 150–158. [Google Scholar]
- Tõnsuaadu, K.; Gross, K.A.; Plūduma, L.; Veiderma, M. A review on the thermal stability of calcium apatites. J. Therm. Anal. Calorim. 2012, 110, 647–659. [Google Scholar] [CrossRef]
- EN 196-3:2016; Methods of Testing Cement. Determination of Setting Times and Soundness. iTeh, Inc.: Newark, DE, USA, 2016.
- EN 196-1:2016; Methods of Testing Cement. Determination of Strength. iTeh, Inc.: Newark, DE, USA, 2016.
- Chen, M.; Lu, L.; Wang, S.; Zhao, P.; Zhang, W.; Zhang, S. Investigation on the formation of tobermorite in calcium silicate board and its influence factors under autoclaved curing. Constr. Build. Mat. 2017, 143, 280–288. [Google Scholar] [CrossRef]
- Pytel, Z. Synthesis of hydrogarnets in the system Al2O3·2SiO2-SiO2-CaO-H2O under hydrothermal conditions, Építôanyag. J. Silic. Based Compos. Mater. 2019, 71, 6. [Google Scholar]
- Gineika, A.; Siauciunas, R.; Baltakys, K. Synthesis of wollastonite from AlF3-rich silica gel and its hardening in the CO2 atmosphere. Sci. Rep. 2019, 9, 18063. [Google Scholar] [CrossRef] [PubMed]
- Kaminskas, R.; Monstvilaite, D.; Valanciene, V. Influence of low-pozzolanic activity calcined mica clay on hydration and hardening of Portland cement. Adv. Cem. Res. 2018, 30, 231–239. [Google Scholar] [CrossRef]
- EN 197-1:2011; Cement—Part 1: Composition, Specifications and Conformity Criteria for Common Cements. iTeh, Inc.: Newark, DE, USA, 2011.
Disclaimer/Publisher’s Note: The statements, opinions and data contained in all publications are solely those of the individual author(s) and contributor(s) and not of MDPI and/or the editor(s). MDPI and/or the editor(s) disclaim responsibility for any injury to people or property resulting from any ideas, methods, instructions or products referred to in the content. |
© 2024 by the authors. Licensee MDPI, Basel, Switzerland. This article is an open access article distributed under the terms and conditions of the Creative Commons Attribution (CC BY) license (https://creativecommons.org/licenses/by/4.0/).