Article

Facile Preparation of Magnetic Chitosan Carbon Based on Recycling of Iron Sludge for Sb(III) Removal

1
Key Laboratory of Water Quality Science and Water Environment Recovery Engineering, Beijing University of Technology, Beijing 100124, China
2
State Key Laboratory of Urban Water Resource and Environment, Harbin Institute of Technology, Harbin 150090, China
*
Authors to whom correspondence should be addressed.
Sustainability 2024, 16(7), 2788; https://doi.org/10.3390/su16072788
Submission received: 21 February 2024 / Revised: 16 March 2024 / Accepted: 25 March 2024 / Published: 27 March 2024

Abstract

:
In this study, following the concept of “treating waste with waste”, magnetic chitosan carbon (MCC) was developed through the pyrolysis of chitosan/iron sludge (CHS) beads created using an embedding method in a closed environment for antimony removal. The results indicate MCC has a good magnetic recovery rate and that its magnetic saturation strength can reach 33.243 emu/g. The iron proportion and acid resistance of MCC were all better than those of CHS, and at 25 °C, its adsorption saturation capacity improved from 24.956 mg/g to 38.234 mg/g. MCC has a quick adsorption equilibrium time, and in about 20 min, 90% of the final equilibrium capacity can be achieved. The primary mechanism of Sb adsorption by MCC is the formation of an inner sphere complex between Fe-O and Sb, while surface complexation, hydrogen bonding, and interaction also play a function. Thus, MCC, a lower-cost and greener adsorbent for Sb removal, has been made using iron sludge. This enabled it to utilize iron sludge as a resource and served as a reference for the sustainable management of water treatment residuals.

1. Introduction

Antimony is a toxic chemical element that exists naturally in nature [1]. The European Union and the United States set antimony as a priority control pollutant and stipulated that the concentration of antimony in drinking water should not exceed 6 µg/L and 5 µg/L, respectively, and China restricts the amount of antimony in drinking water to a maximum of 5 µg/L [2,3]. The level of antimony in natural water bodies ranges from tens of ng/L to several μg/L [4]. However, because of human activities like antimony mining, the concentration of Sb in the water body surrounding the antimony mining area can reach several thousand μg/L [5,6,7]. This is far greater than the limited concentration in the drinking water standards set by different nations and regions and poses a health risk to humans. Thus, it is vital that antimony be removed from the waters around us, especially the more toxic antimony trivalent. Membrane filtration [6], adsorption [8,9], electrochemical reaction [9,10], ion exchange [11], and other techniques are frequently used for antimony removal. Among these, the adsorption method has attracted a lot of attention due to its benefits of low cost, simple operation, and recyclability [9]. Finding effective, affordable, and environmentally friendly adsorption materials is an essential step in the adsorption process.
Chitosan is widely used in the water treatment industry due to its economic accessibility and ecological friendliness [12,13]. Chitosan does, however, have some drawbacks, including low surface area, poor hydrophilicity, low porosity, and no acid resistance [14]. According to some research, chitosan porous carbon materials can be produced via pyrolysis in a nitrogen environment or hydrothermal pyrolysis with KOH or NaOH as the active ingredient, which helps with the above-mentioned issues of chitosan. It has an important advantage in adsorption and an excellent adsorption capacity for the removal of pollutants such as carbon dioxide [15], dye 54 [16,17], arsenate [18], chromium [19], and other pollutants because of its porosity and large specific surface area [20,21]. Moreover, it is thought that chitosan carbon has some potential for Sb removal because it has abundant functional groups that can compound with Sb. Nevertheless, the material has certain practical application limits because it is challenging to recover in powder form.
A commonly used method for efficiently separating the adsorbent from the medium is magnetic separation [22,23]. This approach may improve material reuse and is cheap and simple to apply. Transition metal salt solutions are cheaper, highly pure, and simple to achieve. However, applying transition metal salt solutions to make magnetic materials requires complex steps involving thermal reduction and precipitation [24,25]. Although there are abundant natural iron ore reserves and it is inexpensive, the purity is not very high [26]. A significant quantity of iron elements exists in the backwashing water of biofilter, which is used to remove manganese and iron. Additionally, over 80% of the iron γ-FeOOH in the iron sludge is recovered after precipitation is present, with high iron content. The direct pyrolysis of iron sludge yields the magnetic product γ-Fe2O3, which has a good magnetic separation effect, high productivity, and simple operation [27]. As a result, iron sludge, when mixed with chitosan and activator, can be regarded as a precursor to magnetic materials. Consequently, iron sludge is a preferable option to use as the magnetic precursor of magnetic chitosan carbon compounds. Furthermore, the literature verified the viability of using iron-based materials for the adsorption of antimony removal [28]. Simultaneously, it acknowledges the decrease in iron sludge and offers a pathway for the resource of waste containing iron.
Chitosan/iron sludge particle adsorbents were successfully produced and applied for removal, as in our previous research [29]. In addition to iron sludge, NaOH, and chitosan, this material also contains acetic acid for chitosan dissolution, which has been shown to improve the structural creation of chitosan carbon materials during the hydrothermal/pyrolysis process [15,16]. By using chitosan/iron sludge particle adsorbent in a one-step pyrolysis process, magnetic chitosan carbon can be prepared and activated. For the removal of Sb, the functional groups and iron-based compounds produced during pyrolysis are also useful. In addition, studies have shown that waste sludge combined with γ-Fe2O3 can prepare magnetic biochar (BC-@γ-Fe2O3) for antimony adsorption [30]; however, it is unclear how antimony removal by iron sludge rich in iron components works by adsorption.
Thus, this study aimed to produce magnetic chitosan carbon (MCC) for the adsorption and removal of antimony by pyrolyzing chitosan/iron sludge particle adsorbents. By using a variety of methods to characterize MCC, the effect of various factors on the ability to remove antimony for MCC was examined. The adsorption capacity and mechanism of MCC were then discussed. In summary, this study provides an adsorbent for Sb adsorption that is more affordable and environmentally friendly. It also analyzes the possible use for Sb removal from iron sludge, offering a reference for using iron sludge as a resource.

2. Materials and Methods

2.1. Material

The iron and manganese removal biofilter in a groundwater treatment plant in Harbin, Heilongjiang Province, China, supplies all of the iron sludge used in this paper. After letting the backwash water of the filter settle for a few hours, the supernatant is disposed of. For several days, the iron clay at the bottom dries naturally in the atmosphere. After the iron sludge has completely dried, grind it through a 100-grit screen and store it in an airtight, dry container for later use.
The hydrochloric acid (HCl), sodium hydroxide (NaOH), acetic acid (CH3COOH), thiourea (CH4N2S), and potassium borohydride (KBH4) used in the experiment were all analytically pure and purchased from Tianjin Fuchen Chemical Reagent Factory, Tianjin, China. Potassium antimony tartrate (C8H4K2O12Sb2·3H2O) and chitosan (viscosity 200–400 mpa·s) were supplied by Shanghai McLean Biochemical Technology Co., Ltd., Shanghai, China.

2.2. Adsorbent Preparation

Figure 1 shows the MCC synthesis way. First, the precursor for pyrolysis was prepared. The particular actions were as follows: To create the acetic–chitosan–iron sludge hydrogel, 1 g of chitosan and 4 g of iron sludge were dissolved in 100 mL 1% acetic acid solution, and the two were then equally mixed ultrasonically for 5 h. After that, the hydrogel was strengthened for 12 h by being submerged in 0.5 mM NaOH. To absorb surface moisture, the particles are then simply cleaned and lightly pressed using filter paper. To obtain the chitosan/sludge particle adsorbent (CHS) as the precursor of pyrolysis, it was frozen in a refrigerator at −20 °C for 24 h and then dried in a vacuum dryer for 12 h. After that, one step of pyrolysis was employed to create and activate the magnetic chitosan carbon material. To achieve uniform heating, the CHS is crushed. The crushed precursor is then placed in a quartz sand bottle, sealed with a quartz cover, and put in a Muffle Furnace for calcining. The following adjustments are made to the parameters of Muffle Furnace: temperature rise for one hour, constant temperature for three and a half hours, constant temperature of 500 °C, and cooling period of two hours. The end product is magnetic chitosan carbon (MCC), a black powder.

2.3. Characterization

Tecnai G2 F30, FEI, Hillsboro, OR, USA, scanning electron microscopy (SEM) was used to comprehend the essential surface morphology of MCC. The structural properties of the materials were analyzed by N2 adsorption–resolution experiments performed using the ASAP 2460 absorbent apparatus (Micromeritics, Atlanta, GA, USA). With an X-ray diffractometer (XRD, Bruker D8 Advance, Karlsruhe, Germany), phase analysis of MCC was carried out. The Co Kα radiation (l = 1.79026 A) was carried out between 10° and 90° in the 2θ range, and the scanning speed was 6°/min. Fourier transform infrared spectroscopy (FTIR, Nicolet IS10, Nicolet, Green Bay, WI, USA) was used to identify and characterize the functional group types in the 400–4000 cm−1 range. The valence states of the elements are identified by X-ray photoelectron spectroscopy (XPS, Escalab 250Xi, Thermo Fisher Scientific, Waltham, MA, USA).

2.4. Batch Sorption Experiments

To prepare 1 g/L of Sb(III) mother liquor, potassium antimony tartrate was dissolved in deionized water. The Sb(III) solution was then put in a wide-mouth bottle and kept at 4 °C for later use.
On the adsorption of Sb(III) by MCC, the effects of dose, initial pH, ionic strength, ionic coexistence, contact time, and initial concentration of Sb(III) were examined. The basic requirement for the batch experiment is for a 250 mL conical bottle with 100 mL of 0.1 mg/L Sb(III) solution and 0.04 g of adsorbent unless otherwise noted. The conical bottle is to be put in a constant temperature shaker set to 25 °C, pH 6.6, 165 rpm, and shaken for 24 h. Following the reaction, the supernatant of the water sample was filtered by a 0.45 μm filter membrane. Each group of data was measured three times and averaged.
The remaining antimonial content in water samples was measured by atomic fluorescence spectrophotometry (AFS-8230, Beijing Yoshida Instrument Co., Ltd., Beijing, China). A total of three measurements were made for each set of experimental data, and the average was calculated. The antimony adsorption amount (mg/g) and removal rate were calculated with Equations (1) and (2), respectively.
q e = C 0 C e V / m
%   o f   R e m o v e = ( C 0 C e ) / C 0
where Ce (mg/L) and qe (mg/g) are the concentration of Sb and the adsorption capacity in the solution at equilibrium, respectively, and C0 (mg/L) is the initial amount of Sb in the solution.

2.4.1. Influence Factors

We studied how the dosage, initial pH, ion strength, and ion coexistence impacted Sb adsorption by MCC.
The MCC dosage levels were 0.2 g/L, 0.3 g/L, 0.4 g/L, 0.5 g/L, 0.6 g/L, 0.7 g/L, 0.8 g/L, 0.9 g/L, and 1.0 g/L. Initial pH levels were 3, 4, 5, 6, 7, 8, 9, and 10. Also, 0.1 mol of HCl and 0.1 mol of NaOH were added to the solution to adjust its pH. NaCl was used to change the ionic strength of the solution to 0.01 M, 0.1 M, 1 M, 10 M, and 50 M. Cl, NO32−, CO32−, SO42−, and PO34−, some of the common anions in natural water, and their effects on Sb adsorption at concentrations of 0 mM, 1 mM, and 10 mM were examined.
Adding 0.04 g of adsorbent to 100 mL of 0.1 mg/L Sb(III) and applying 0.1 mM NaCl as the background electrolyte allowed for the measurement of the solution pHpzc. The solutions are adjusted to different beginning pH ranges (3–10), and after a day, the ultimate pH of each solution is measured. The point zero charge (pHpzc) of the adsorbent can be calculated by the intersection of the final and initial pH curves.

2.4.2. Adsorption Kinetics

A total of 800 mL Sb(III) aqueous solution was placed in a plastic bottle, and 0.32 g of MCC was added. The concentrations of Sb(III) were adjusted to 0.1 mg/L and 1 mg/L. Samples were taken at intervals of 0–1200 min.
Pseudo-first-order dynamics model Equation (3) and pseudo-second-order dynamics model Equation (4) were used to fit the data. Using the Weber–Morris in-particle diffusion model (Equation(5)), the complete adsorption process was analyzed.
q t = q e 1 e k 1 t
q t = k 2 q e 2 t / 1 + k 2 q e t
q t = k d i t 0.5 + C i
where k1 (1/min) and k2 (g/(mg·min)) are the rate constants of pseudo-first-order and pseudo-second-order kinetic models, respectively, qt (mg/g) and qe (mg/g) are the adsorption capacity of Sb at time t and equilibrium, kdi is the in-particle diffusion constant, and Ci is the stage i intercept.

2.4.3. Adsorption Isotherms

Starting Sb(III) concentration for MCC and CHS, respectively, will range from 0.5 to 50 mg/L and 0.5 to 30 mg/g at 25 °C. The data were fitted by the Langmuir Equation (6) and Freundlich Equation (7) isothermal adsorption models.
q e = q m k L c e / ( 1 + k L c e )
q e = k F c e 1 / n
where kL (L/mg) and kF are the Langmuir and Freundlich constants, respectively, qm (mg/g) is the adsorption maximum capacity, n is a dimensionless parameter that represents the affinity of the adsorbent for the adsorbent.

2.4.4. Cycle Experiment

To assess the cycle performance of MCC, three sets of continuous cycle experiments were created. Magnetic separation is utilized to keep the used MCC apart from the water. After repeatedly wiping the surface with deionized water to remove any remaining Sb(III) solution, continue to the following set of cycles. Additionally, research was performed on the ability of MCC for regeneration. Using a hand-held magnet, the MCC that was adsorbing antimony for 24 h is retrieved. It is then added to 50 mL 1 M sodium hydroxide solution, and the supernatant is obtained by shaking for another 24 h. After being isolated from sodium hydroxide, the MCC is repeatedly cleaned with water until it becomes neutral.

3. Results and Discussion

3.1. Characterization of the Adsorbents

3.1.1. Surface Morphology of MCC

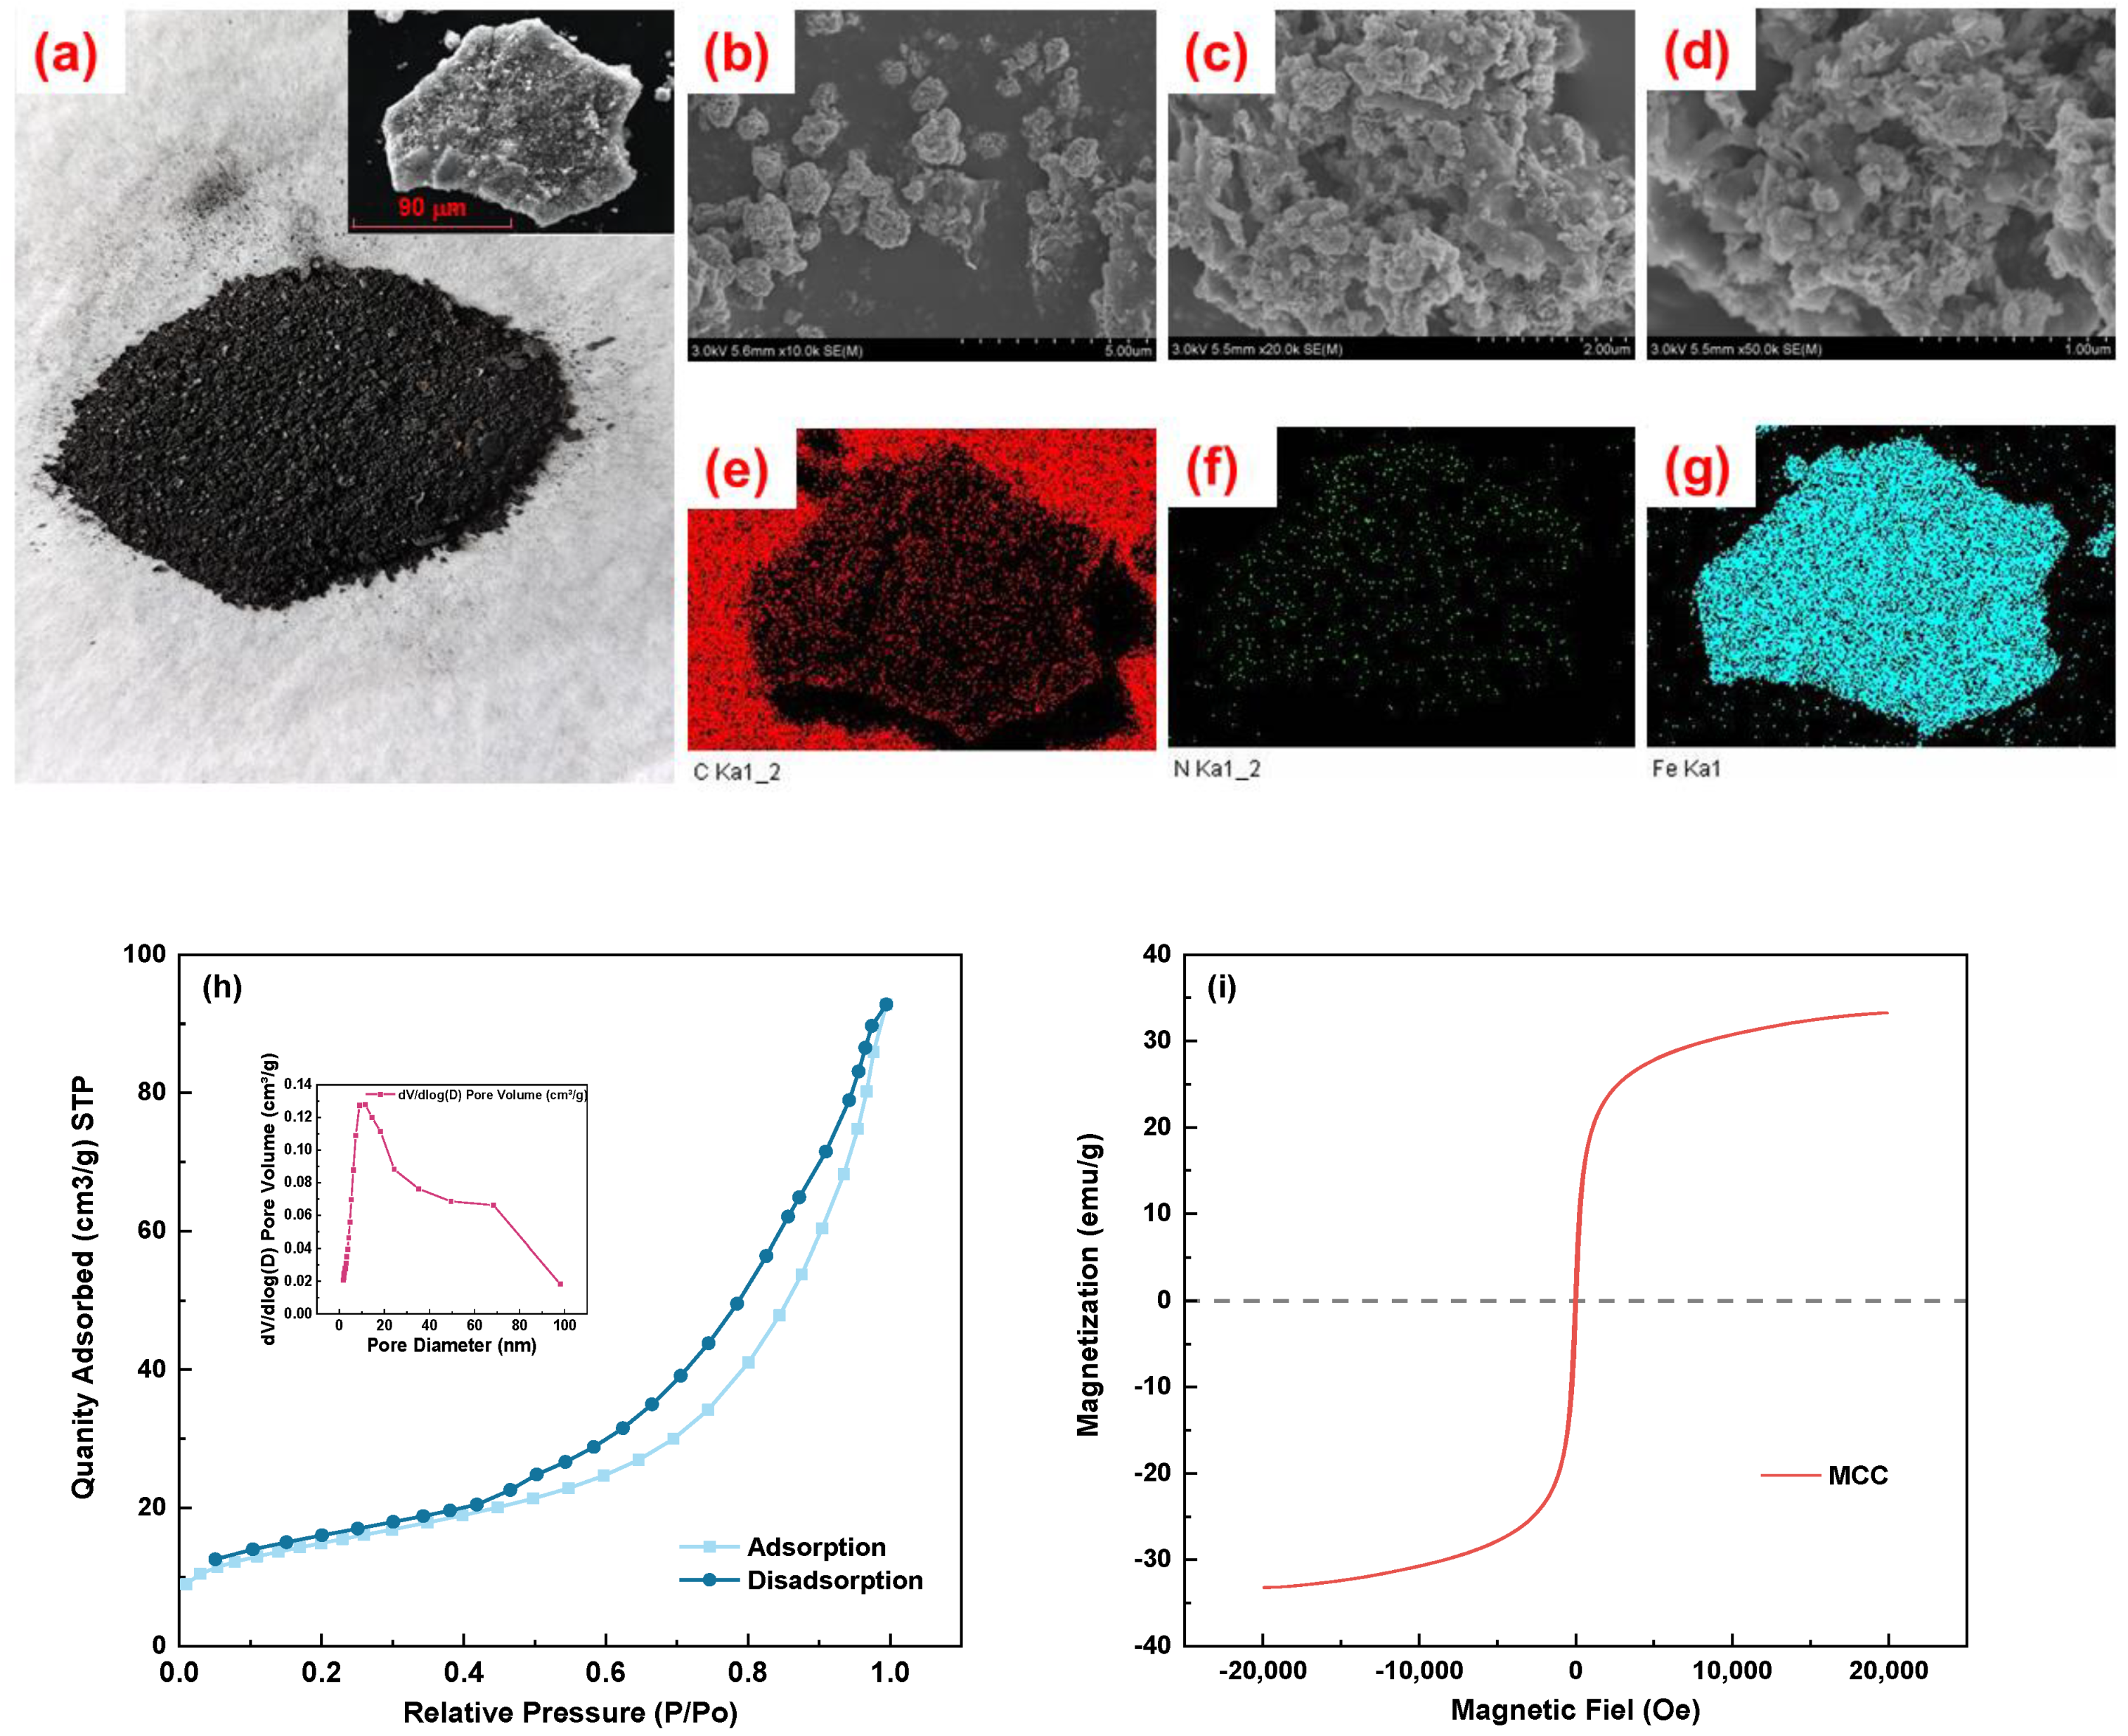
The digital electronic image of MCC, which seems like black powder, is shown in Figure 2a. The uneven shape of powder, with a diameter of around 90 µm, can be attributed to its grinding process before calcination, as revealed by the scanning electron microscope (SEM) shown in Figure 2a illustration. Figure 2b–d displays the SEM at various MCC magnifications. An electron microscope image of MCC with a 10.0 K magnification is shown in Figure 2b. It is obvious that the MCC surface is rough, that many tiny particles group together as an effect of magnetic, and that visible accumulation forms. Furthermore, some lamellar structures—dense layers made from calcining chitosan—are also visible [15]. The MCC is extended to 20.0 K and 50.0 K, respectively, visible in Figure 2c,d. It is also seen that the MCC has a variety of pore sizes, that a layered porous structure forms, and that the surface of the dense layer has pores of various sizes. The following two factors could be to blame for this: (1) The iron sludge will have a significant pore structure throughout the calcination process [27]. The pore structure was created on the MCC surface by etching NaOH before calcination [31]. Adsorption can be assisted by the creation of a pore structure. In addition, the energy spectrum analysis results demonstrate that the distribution of C, N, and Fe in MCC is rather uniform. It helps ensure that Sb binds completely to the adsorption site.
In addition, as can be shown in Figure 2e–g, the energy spectrum analysis results demonstrate that the distribution of C, Fe, and O in MCC is comparatively uniform. It demonstrates how effectively the carbon layer and the magnetic substance are blended. It helps ensure that Sb binds completely to the adsorption site.
The adsorption efficiency of the substance is greatly affected by the specific surface area and pore size of the adsorbent. The average pore diameter of MCC is 10.47 nm, and its specific surface area (SSA) is 52.63 m2/g. As can be observed from the IUPAC classification and the N2 adsorption–desorption isotherm diagram of MCC (Figure 2f), the fitted isotherm consists of the Type IV isotherm of the H3 hysteresis loop, meaning that MCC is a mesoporous material (2 nm < d < 50 nm). Based on data from the pore size distribution diagram (illustration of Figure 2f), MCC primarily consists of mesoporous pores, with a small number of macropores (d > 50 nm) present. Furthermore, an evident increase in the N2 adsorption–desorption isotherm appeared in the high-pressure zone (P/P0 = 0.95~1.0), confirming the existence of large pores in the MCC and supporting the SEM phenomena. Despite this, the average aperture increased when compared to CHS (d = 4.05). However, the average pore diameter dropped from 12.43 nm to 10.47 nm if compared to the results of pure iron sludge burnt at 500 °C. Moreover, the pore structure was altered. The percentage of macropores dropped as the percentage of mesoporous pores rose. The creation of mesoporous structures was shown to be aided by the calcination of the chitosan–acetic–NaOH system. However, the rise in the low-pressure area is not significant, meaning that there are few micropores. The research finding found that the specific surface area of the pyrolyzed chitosan carbon material increases with the amount of active agent (NaOH/KOH) in the pyrolysis precursor [15]. When chitosan carbon is added with an active agent, its specific surface area is tens of times larger than the nonactive agent [15,16]. However, in this study, NaOH has only a comparatively modest percentage of what is still on the surface of CHS. To boost the proportion of NaOH and consequently improve the specific surface area and micropore ratio of MCC, NaOH can, therefore, be injected into the hydrogel of chitosan/iron sludge, solidified, freeze-dried, and then pyrolyzed during the production of MCC.
The magnetic saturation strength of MCC is 33.24 emu/g, according to the magnetization curve (Figure 2i). MCC is easily attracted when a magnetic field exists. As a result, MCC is magnetic and can be separated via magnetic separation from the solution. When the magnetic saturation strength of the material reaches 16.3 emu/g [32], magnetic separation is thought to be achievable.

3.1.2. XRD

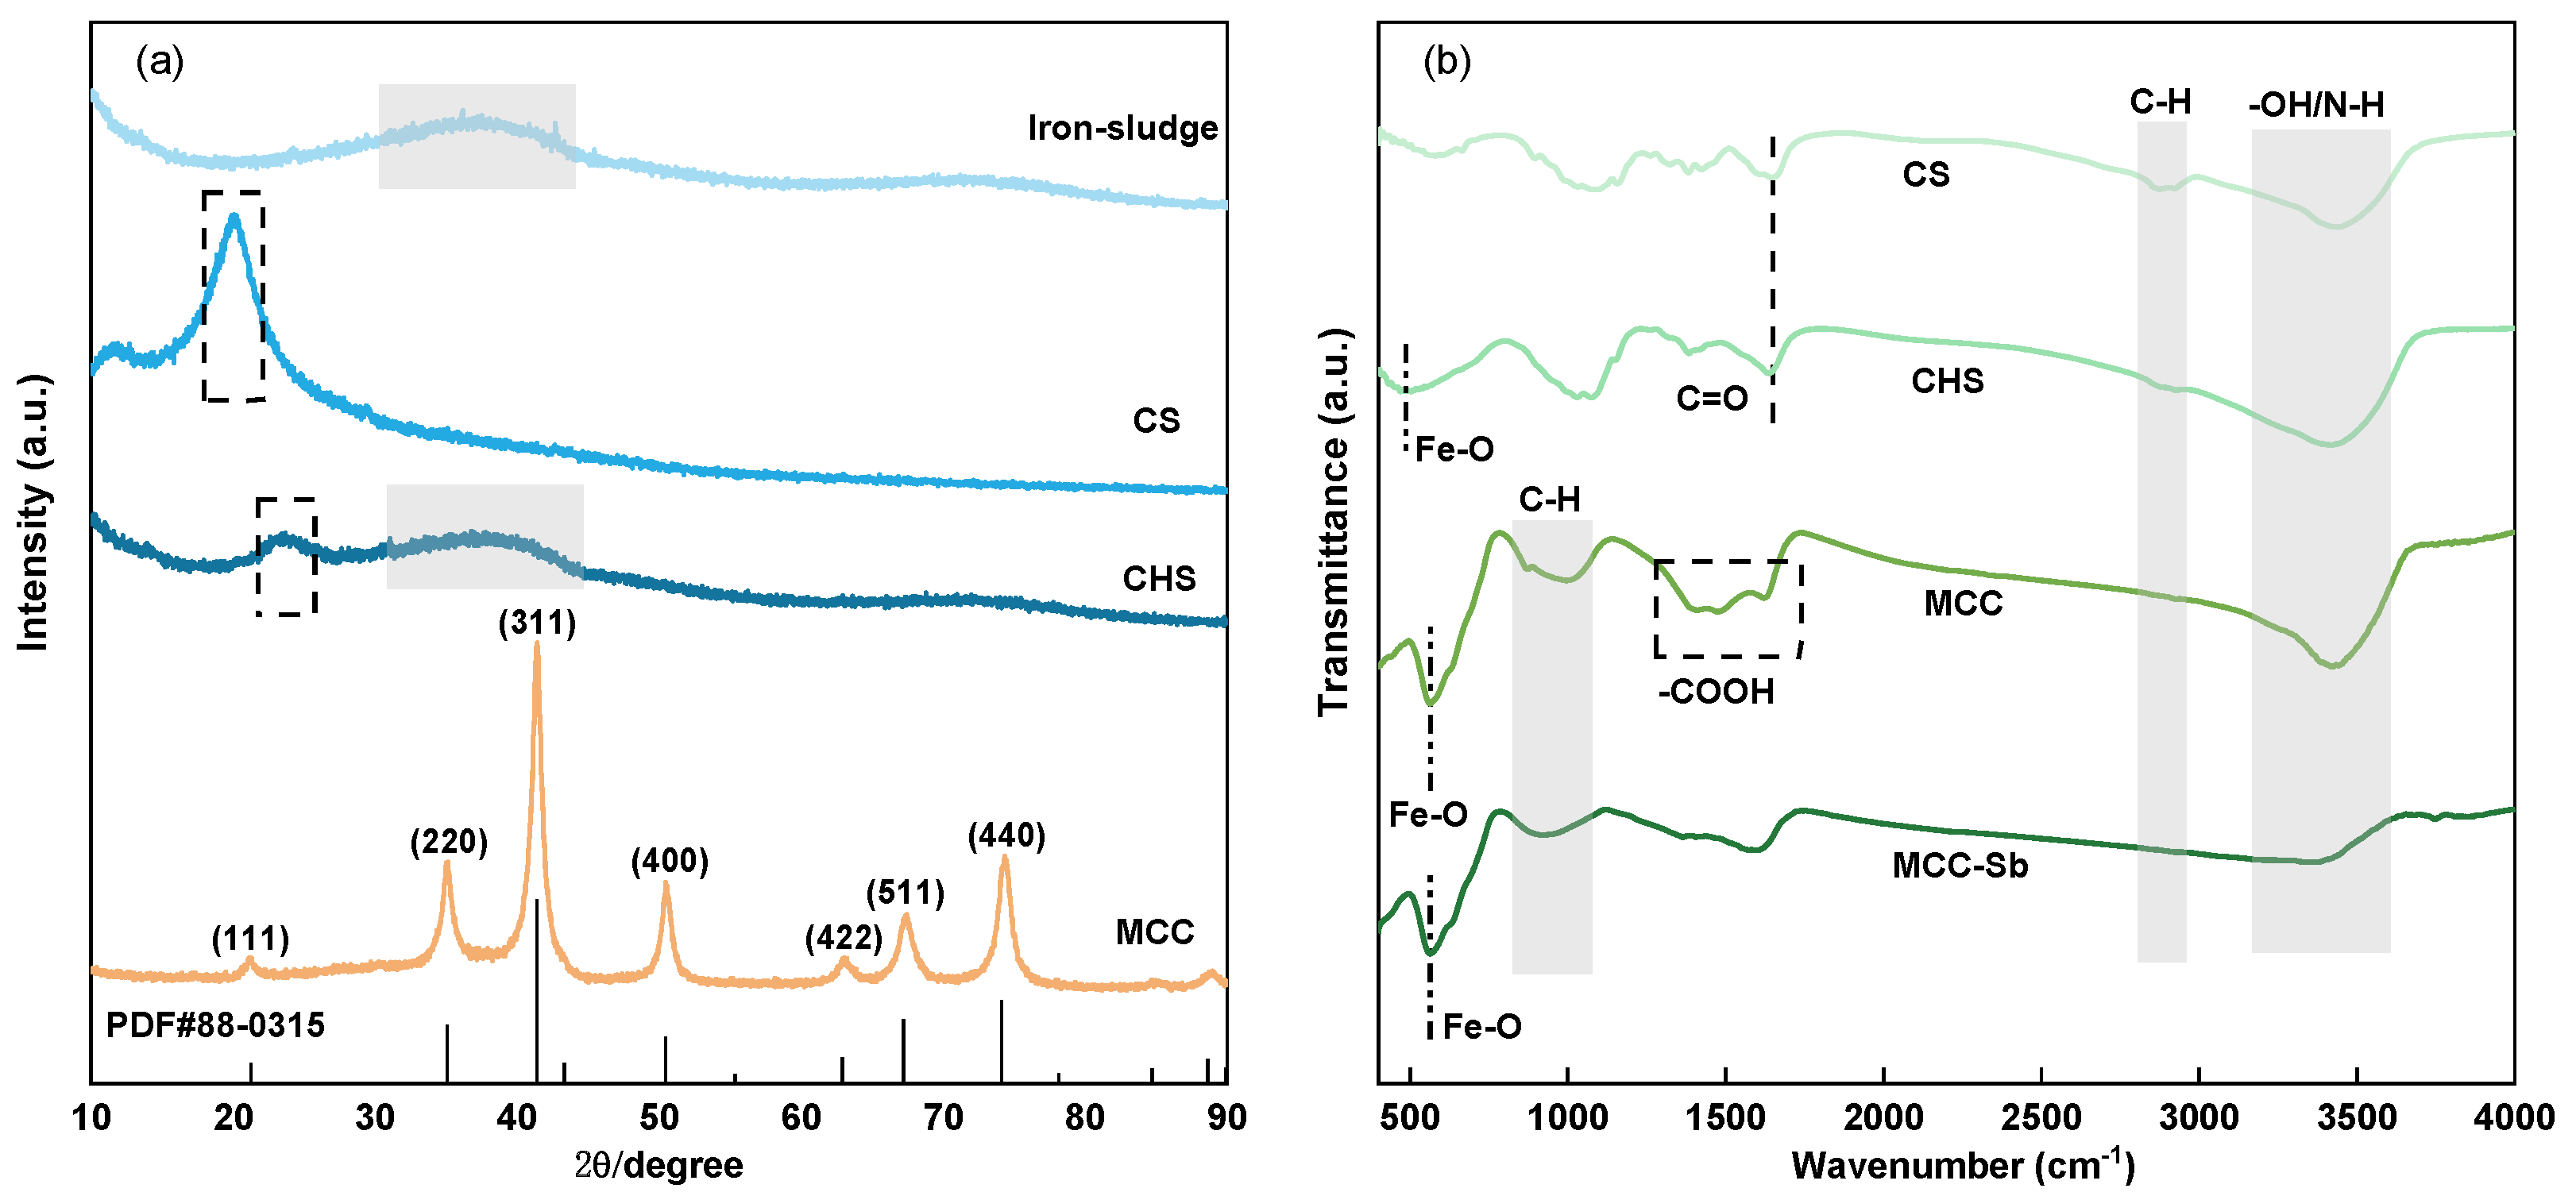
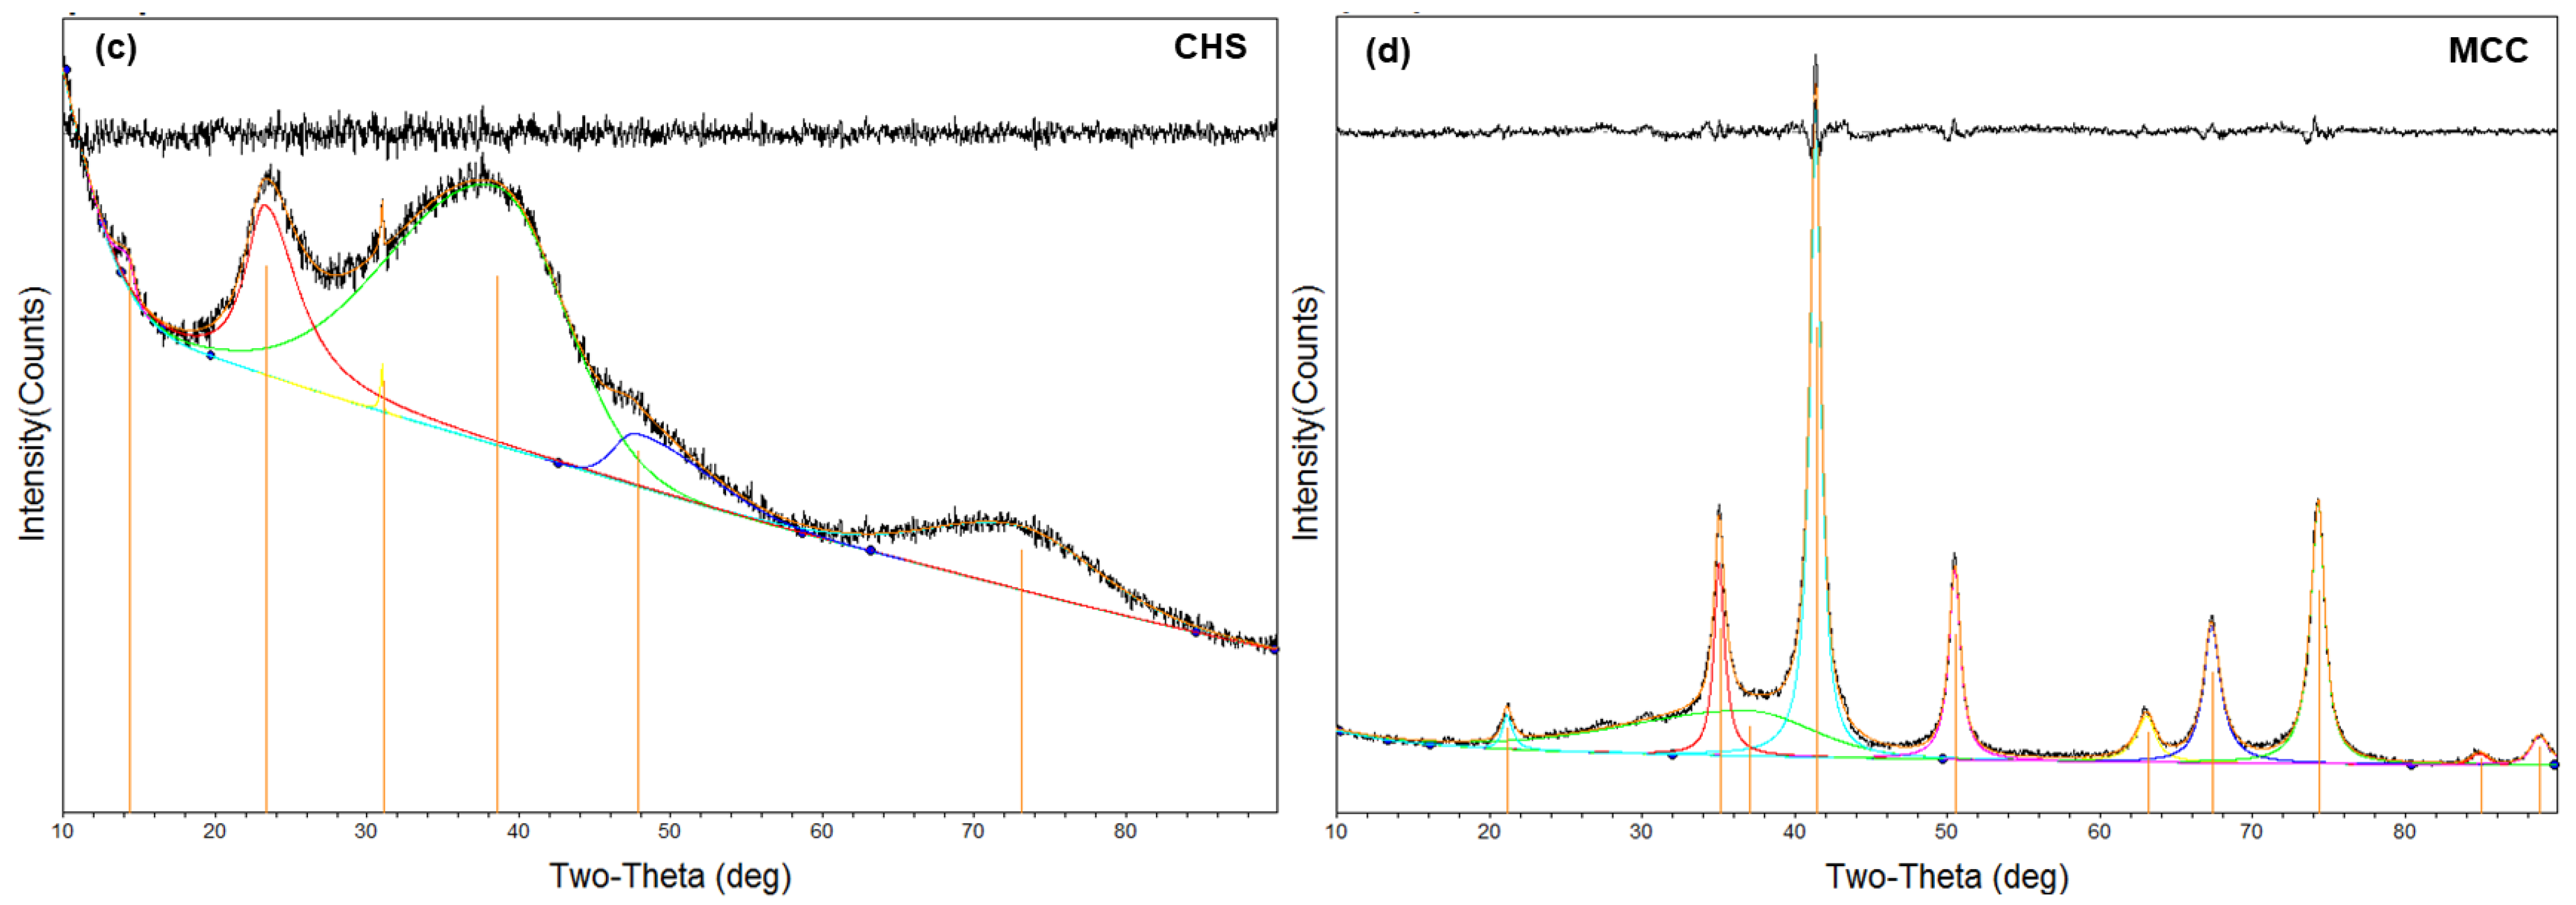
The X-ray diffraction (XRD) of iron sludge, chitosan, particle adsorbent, and MCC is displayed in Figure 3a. Because the iron sludge contains γ-FeOOH, it is evident that both the particle adsorbent and the iron sludge exhibit wide 2θ diffraction peaks near 48° [33]. Additionally, a wide 2θ diffraction peak is visible around 20°, which is in line with the crystal forms II of the chitosan XRD location [34]. These show that, although the structure is still amorphous, the chitosan and iron sludge were effectively combined in the particle adsorbent. Following the calcination of the particle adsorbent, the XRD of MCC results show that it is no longer amorphous. Positions 21.31°, 35.07°, 41.39°, 50.49°, 62.96°, 67.41°, 74.36°, and 88.96° correspond to the crystal faces of the Fe3O4 (PDF #88-0315) nanoparticle, which are located in the following positions: (111) (220) (311) (400) (422) (511) (440) (533) [35,36]. It proves that Fe3O4 is the main magnetic material in MCC. This could result from the synthetic production of reducing C during calcination, which reduces Fe3+ to Fe2+. Figure 3c,d show the results of fitting the XRD data of MCC and CHS. The fitted results show that MCC and CHS have crystallinities of roughly 24% and 76%, respectively. This indicates that the calcination procedure increases the crystallinity.

3.1.3. FTIR

Figure 3b displays the FTIR diagram of MCC, particle adsorbent, and chitosan at 400–4000 cm−1. The FTIR spectra of chitosan and the particle adsorbent show identical placements of the major peaks, indicating that the particle adsorbent made by the embedding approach does not significantly change the structure of chitosan. But following calcination, some peaks vanish and some new ones appear, showing that the structure of chitosan has changed.
The figure shows that hydroxyl absorption bands exist in chitosan, CHS, and MCC at around 3420 cm−1, suggesting that -OH/-NH persists even after calcination [30,37]. The C-H (e.g., -CH-, -CH2-) tensile vibrations of the saturated hydrocarbons in chitosan are represented by the peaks at 2830–2930 cm−1 [38]. When compared to chitosan and its predecessor, it is evident that the peak of MCC at this location is weaker; nonetheless, a new peak formed at 1000 cm−1 is caused by the C-H of aromatic group bending vibration [39]. Consequently, it can be proven that the calcination process generates the π-π bond and encourages the creation of the aromatic structure. The C=O of the amide group tensile vibration is represented by the peaks in chitosan and CHS at 1650 cm−1, which disappear with calcination. The asymmetric vibration of C=O and the symmetric vibration of O-C-O in carboxylic acid, respectively, matched the new peaks that appeared at 1627 cm−1, 1476 cm−1, and 1397 cm−1 in MCC [40,41,42]. This may indicate that calcination broke down the chitosan structure and created carboxylic acid in MCC. Furthermore, CHS has a strong peak around 500 cm−1, which is frequently recognized as the result of Fe-O vibrations in γ-FeOOH [43]. The peak at 500 cm−1 faded in MCC, and a new peak that protruded at 564 cm−1—related to Fe-O vibration in Fe3O4—appeared [36].
In conclusion, while the structure of chitosan shifts and some functional groups vanish, MCC produces new functional groups such as -COOH and aromatic structures. Furthermore, γ-FeOOH transfer to Fe3O4 after calcination was further confirmed with FTIR. Antimony can be removed from MCC through the adsorption sites supplied by both the functional group and Fe-O.

3.1.4. XPS

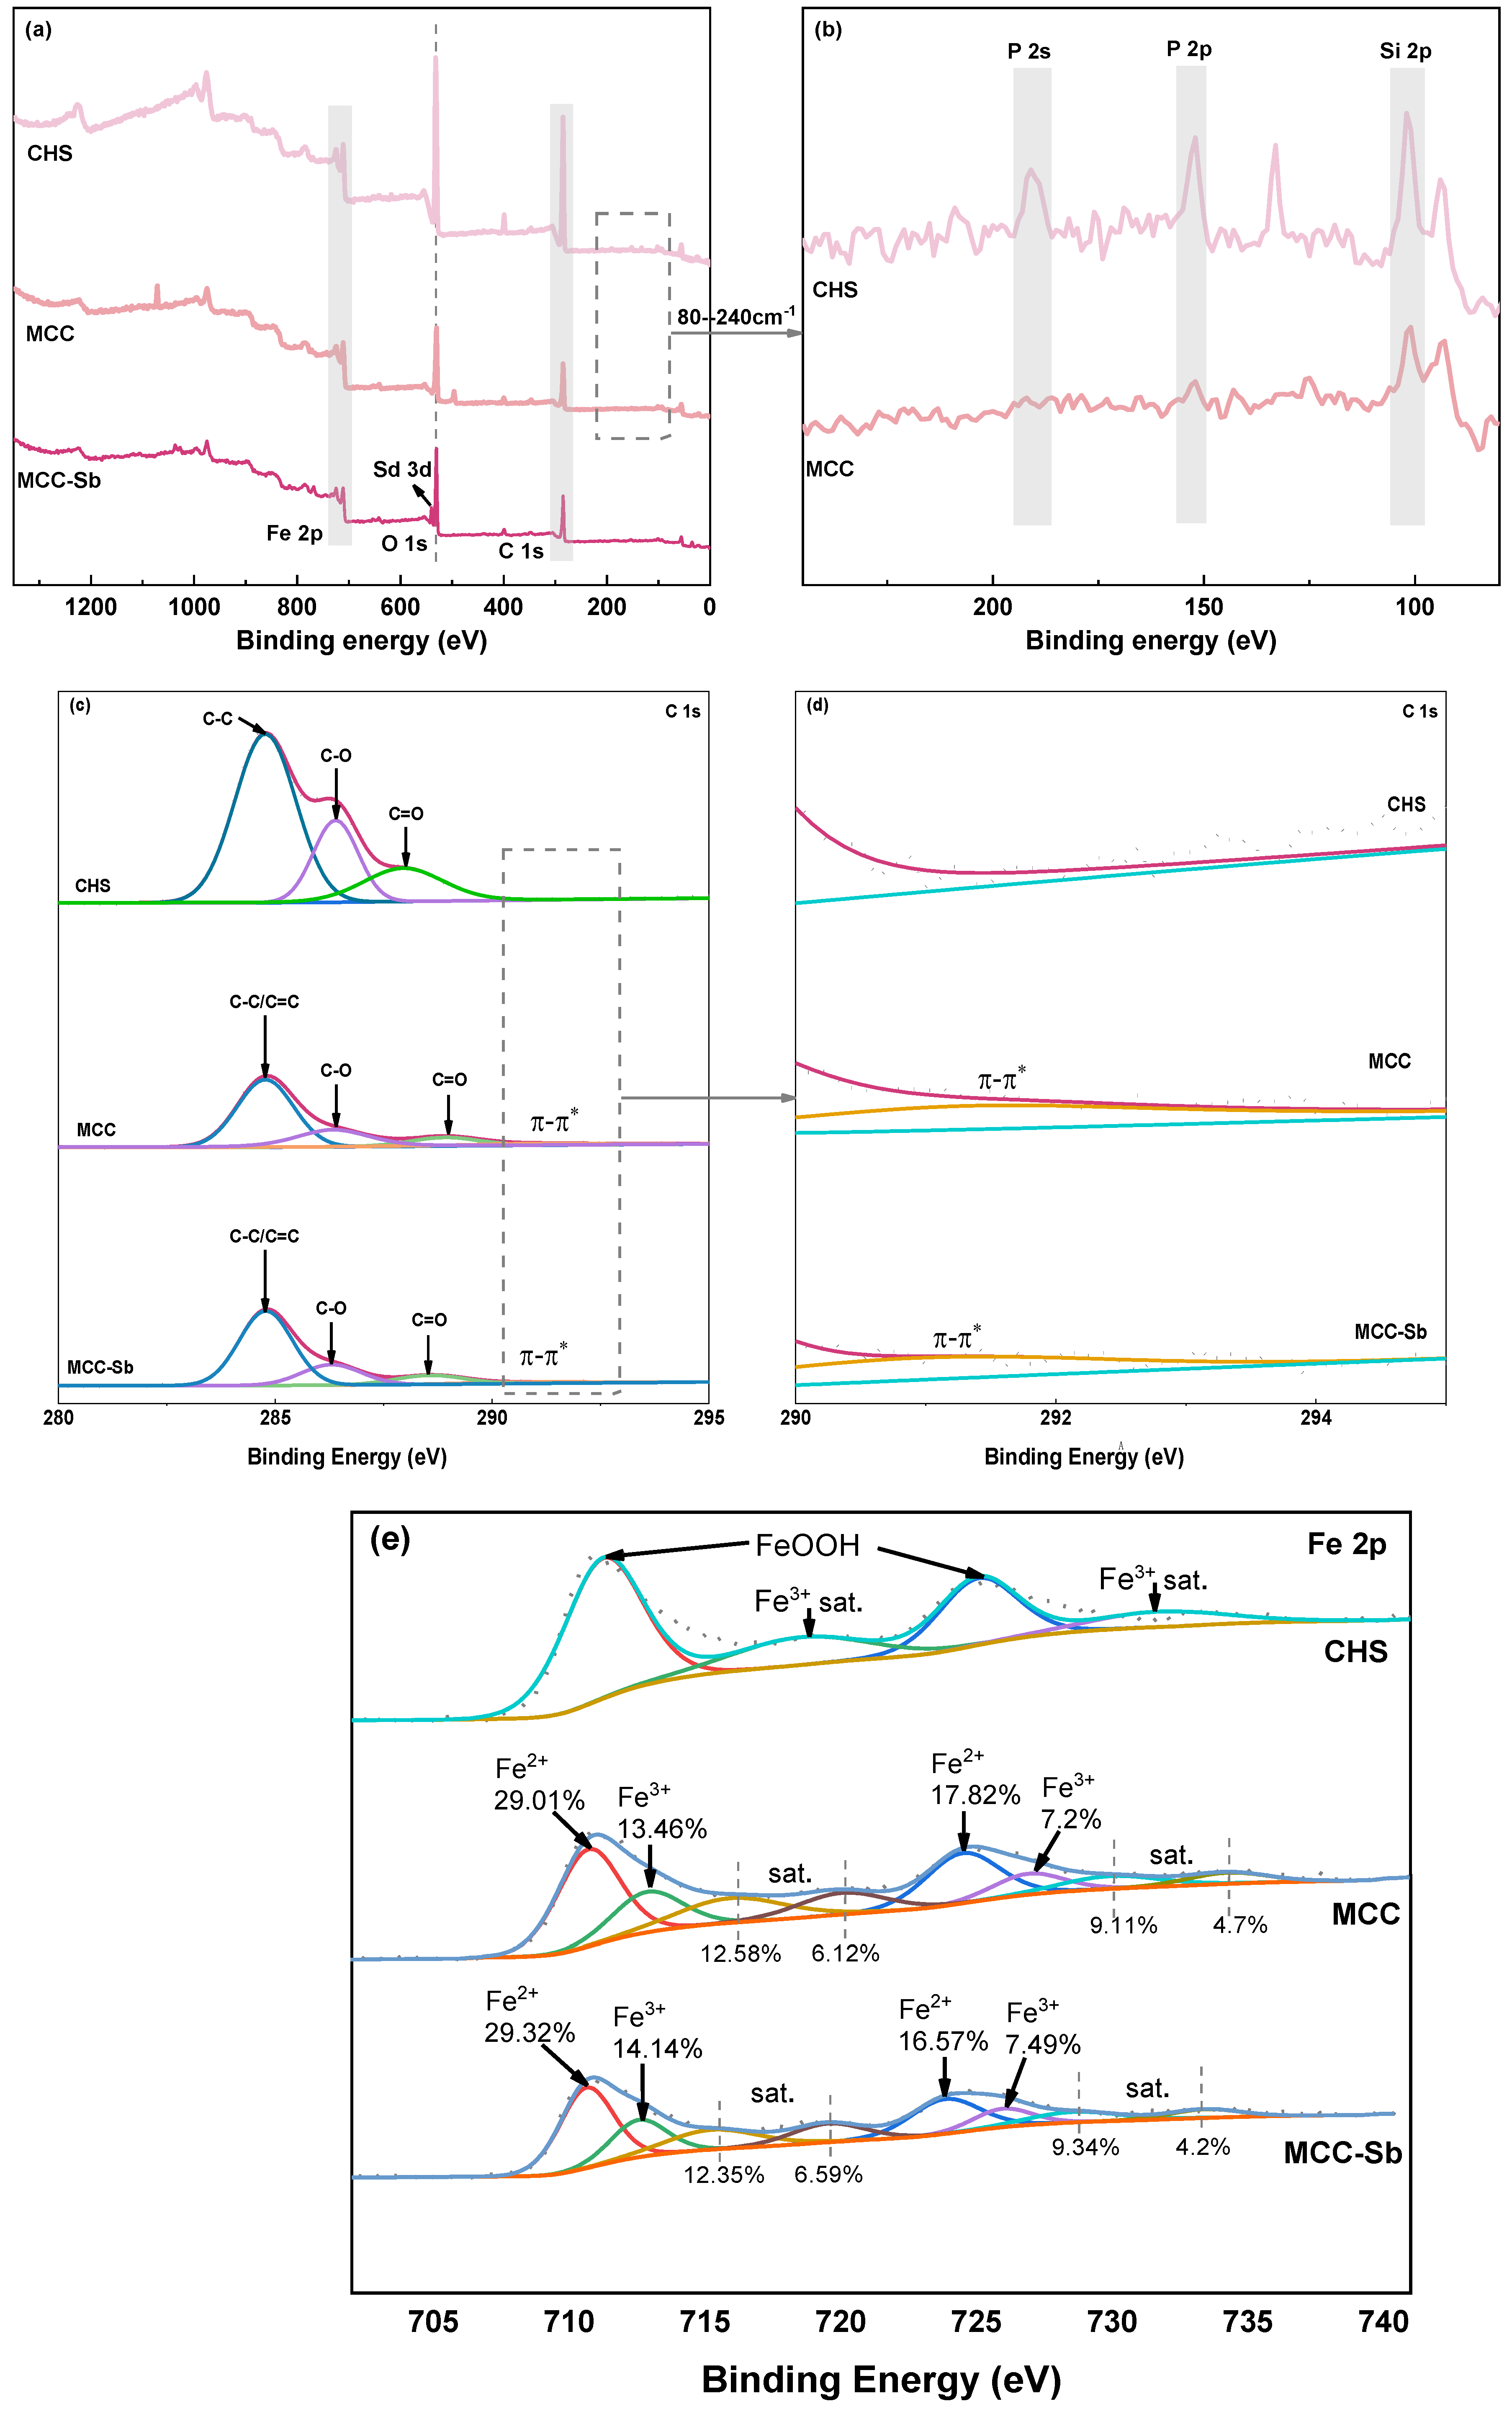
The primary elements in the precursor and MCC are C, O, Fe, and N, as the XPS total spectrum shows in Figure 4a. The collected iron sludge contains contaminants for natural water bodies are made up of a fairly substantial number of elements. On local amplifying CHS and MCC throughout the whole XPS spectrum at 80–240 cm−1 (Figure 4b), the corresponding peaks of Si 1s, P 2p, and P 2s in CHS become visible. In MCC, the corresponding peaks of P and Si vanish. This suggests that some contaminants (such as Si and P) can be decreased in content by the pyrolysis process, and the purity of iron was boosted for MCC.
Figure 4c displays the sub-peak fitting results of the C1s of MCC and CHS. Three peaks that belong to the groups C-C, C-O, and C=O can be seen at positions 284.77 eV, 286.39 eV, and 287.59 eV. Following the calcination process, the C1s peak of MCC at 284.77 eV, 286.33 eV, 288.91 eV, and 291 eV, corresponding to the keys C-C/C=C, C-O, C=O, and π-π* [16,44]. The local enlarged of the C1s spectrum near 291 eV is shown in Figure 4d. More clearly, the characteristic peak, belonging to π-π*, appears at 291 eV after pyrolysis. This implies that the FTIR data are consistent with the production of aromatic structures following calcination.
The broad peaks of CHS Fe 2p at Fe 2p3/2 and Fe 2p1/2 relate to the peaks of Fe3+ and are deconvolution peaks at 711.02 eV and 724.48 eV, respectively (Figure 4e). Fe 2p3/2 has been shown to simulate two peaks in MCC, with corresponding energies of 710.64 eV and 712.56 eV for Fe2+ and Fe3+, respectively. Similarly, Fe2+ and Fe3+, or 723.85 eV and 725.96 eV, respectively, are fitted at Fe 2p1/2 [45]. It demonstrates how C will convert some Fe3+ to Fe2+ throughout the calcination process. The XPS results show that the percentage of Fe2+ is around 68.52%, the proportion of Fe3+ is roughly 31.48%, and Fe 2p shows the presence of satellite peaks, indicating that MCC contains more than only Fe3O4 [45,46]. However, Fe3O4 appears to be the primary component of MCC, according to the results of XRD. Therefore, other iron oxides that may be formed in MCC are not discussed in this paper.

3.2. Discussion of Adsorption Mechanism

3.2.1. FTIR

Figure 3a displays FTIR before and after Sb adsorption by MCC. It is apparent upon adsorption that the peak density decreases and the peak position of -NH/-OH in MCC moves. The impact of hydrogen bonds on adsorption could be the reason for it. The oxygen atoms on the Sb(III) molecule can form hydrogen bonds with the -NH/-OH hydrogen atoms [38,47]. Furthermore, it is thought that the hydrogen on -OH functions as a metal-binding site where ions can take the place of H and Sb can take the place of H [48]. After adsorption, the functional group at -COOH changes significantly, and a peak appears at 1602 cm−1, between C=O and C-O, which can be attributed to the replacement of H on -OH in -COOH by Sb.
Following the adsorption of Sb by MCC, the C-H peak of the aromatic structure also shifted, and the peak density dropped, suggesting that the π-π bond was also implicated in the reaction. To adsorb antimony, the π electron on C-H bonds with the π electron on Sb(III) [49]. In the MCC, the Fe-O bond shifts from 562 cm−1 to 565 cm−1. To produce the adsorption action, Fe-O and Sb chelate to form Fe-O-Sb [30,50].

3.2.2. XPS

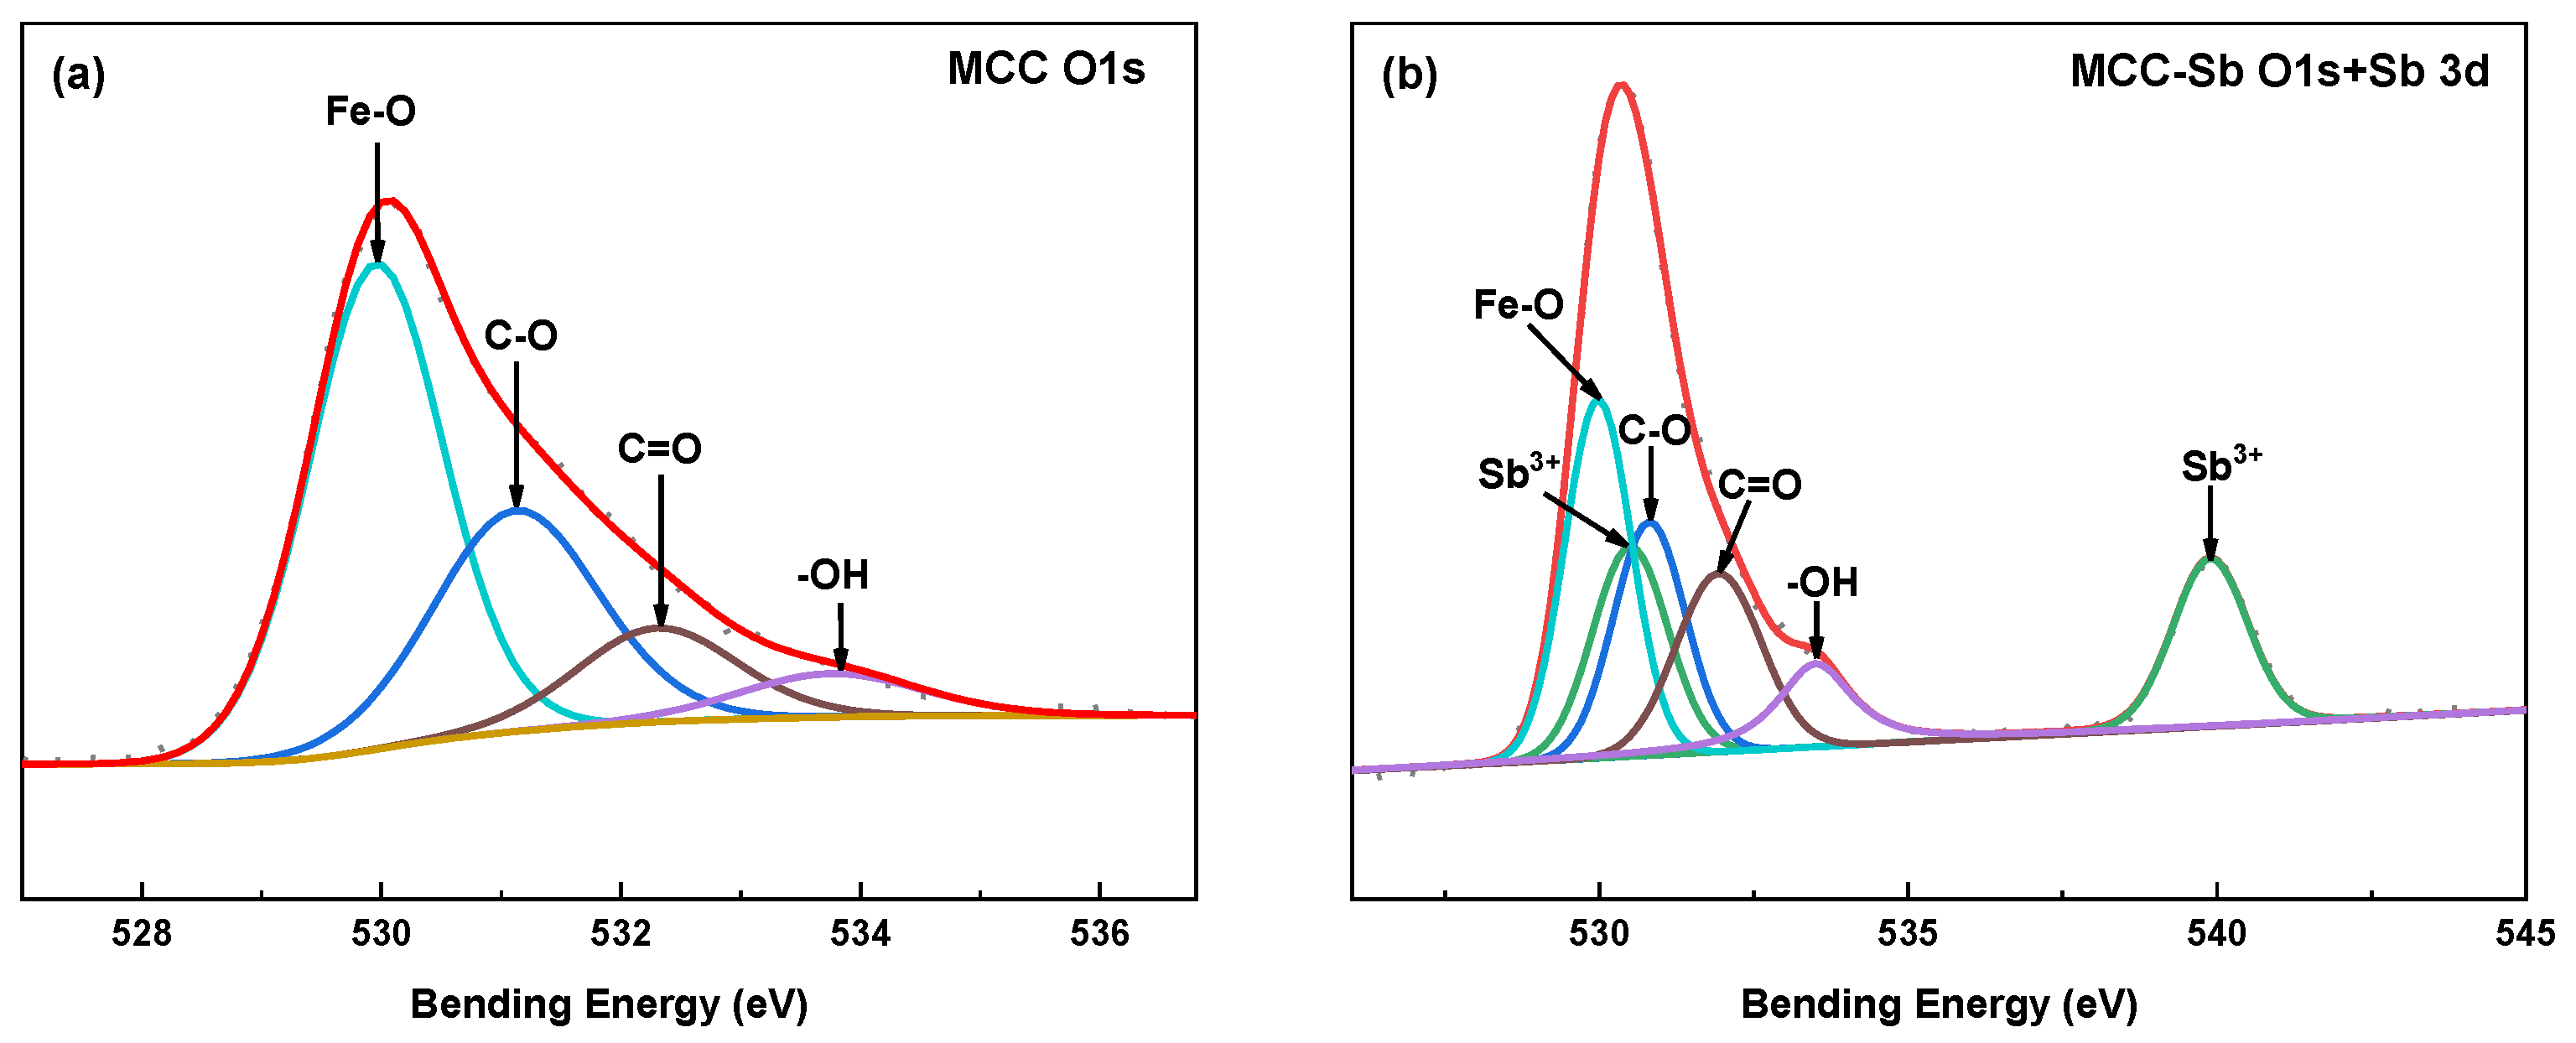
Figure 4a shows a comparison of the XPS spectra obtained before and after Sb adsorption by MCC. As can be observed, adsorption precedes the peak of Sb 3d, suggesting that MCC successfully absorbed Sb. After adsorption, the peak of O 1s slightly rises as a result of the dividing of the Sb3d peak into Sb 3d3/2 and Sb 3d5/2, where the peak place of Sb 3d5/2 coincides with that of O 1s. Fe-O took part in the adsorption reaction, as seen in a distinct drop in the peak of Fe 2p.
When the peak fitting findings of C1s are compared before and after Sb(III) adsorption, the percentage of π-π falls from 5% to 3%, indicating that MCC and Sb(III) interact via π-π. After adsorption, the binding energies of C-O and C=O reduced from 286.33 eV to 286.29 eV and 288.91 eV to 288.57 eV, respectively, which indicates that the two roles assisted in eliminating Sb using MCC by forming surface complexes with Sb.
The peaks of Fe 2p were separated into Fe 2p3/2 and Fe 2p1/2 after the adsorption of Sb, and the peaks were fitted in Figure 4e. Fe2+ and Fe3+ hold binding energies of 723.85 eV and 725.96 eV on Fe 2p1/2 and 710.64 eV and 712.56 eV on Fe 2p3/2, respectively. The peak area and binding energy decreased to varying levels after the fitted Fe2+, Fe3+, and satellite peaks absorbed Sb in Fe 2p, showing that electron transfer occurred and Fe-O formed internal coordination complexes with Sb. Nonetheless, Fe2+ and Fe3+ area ratios after adsorption are 67.58% and 32.42%, respectively, and the Fe2+/Fe3+ area ratio, which was around 2.1 before and after adsorption, remained constant. The valence state of Fe valence state is thought to remain steady during the adsorption process, which means Fe3O4 may not undergo a redox reaction.
Figure 5a,b display the peak fitting results of O 1s both before and after Sb(III) adsorption by MCC. The Fe-O percentage reduced from 76.39% to 37.13%, and the location of the peak changed. Additionally, it is shown that Fe-O is the primary effect of MCC on Sb removal, and Fe-O and Sb chelate to produce Fe-O-Sb. The -OH binding energy went up to 533.50 eV from 533.45 eV. The creation of hydrogen bonds is implied by the increased electron absorption properties of -OH, as indicated by the increase in binding energy after adsorption [51]. These findings imply that during the adsorption phase, the -OH in MCC may form a hydrogen bond with Sb(III) molecules, resulting in the removal effect.
By using peak fitting for Sb adsorbing by MCC (Figure 5b), Sb 3d was divided into Sd 3d3/2 and Sd 3d5/2. The peaks that correlate are 539.89 eV and 530.50 eV. It is thought that there is no Sb(V) in the adsorbed MCC because there is no correlation peak of Sb(V) at a place of relatively high binding energy (540.20 eV) [3]. There were initially two reasons for this phenomenon: one is that Sb(III) was not involved in the redox reaction; the other is that Sb(III) was oxidized to Sb(V) and then reduced to Sb(III) [41]. It was noted that when Sb(III) and Sb(V) absorb in aqueous solution, Fe3O4 does not exhibit a redox reaction with them [41,52].
Given the significant role Fe3O4 plays in adsorption for MCC, it is assumed that there may not be a redox reaction during the MCC adsorption process. This is also similar to the nearly constant area ratio of Fe2+/Fe3+ both before and during Fe 2p adsorption.

3.3. Batch Sorption Experiments

3.3.1. Effect of Adsorbent Dosage

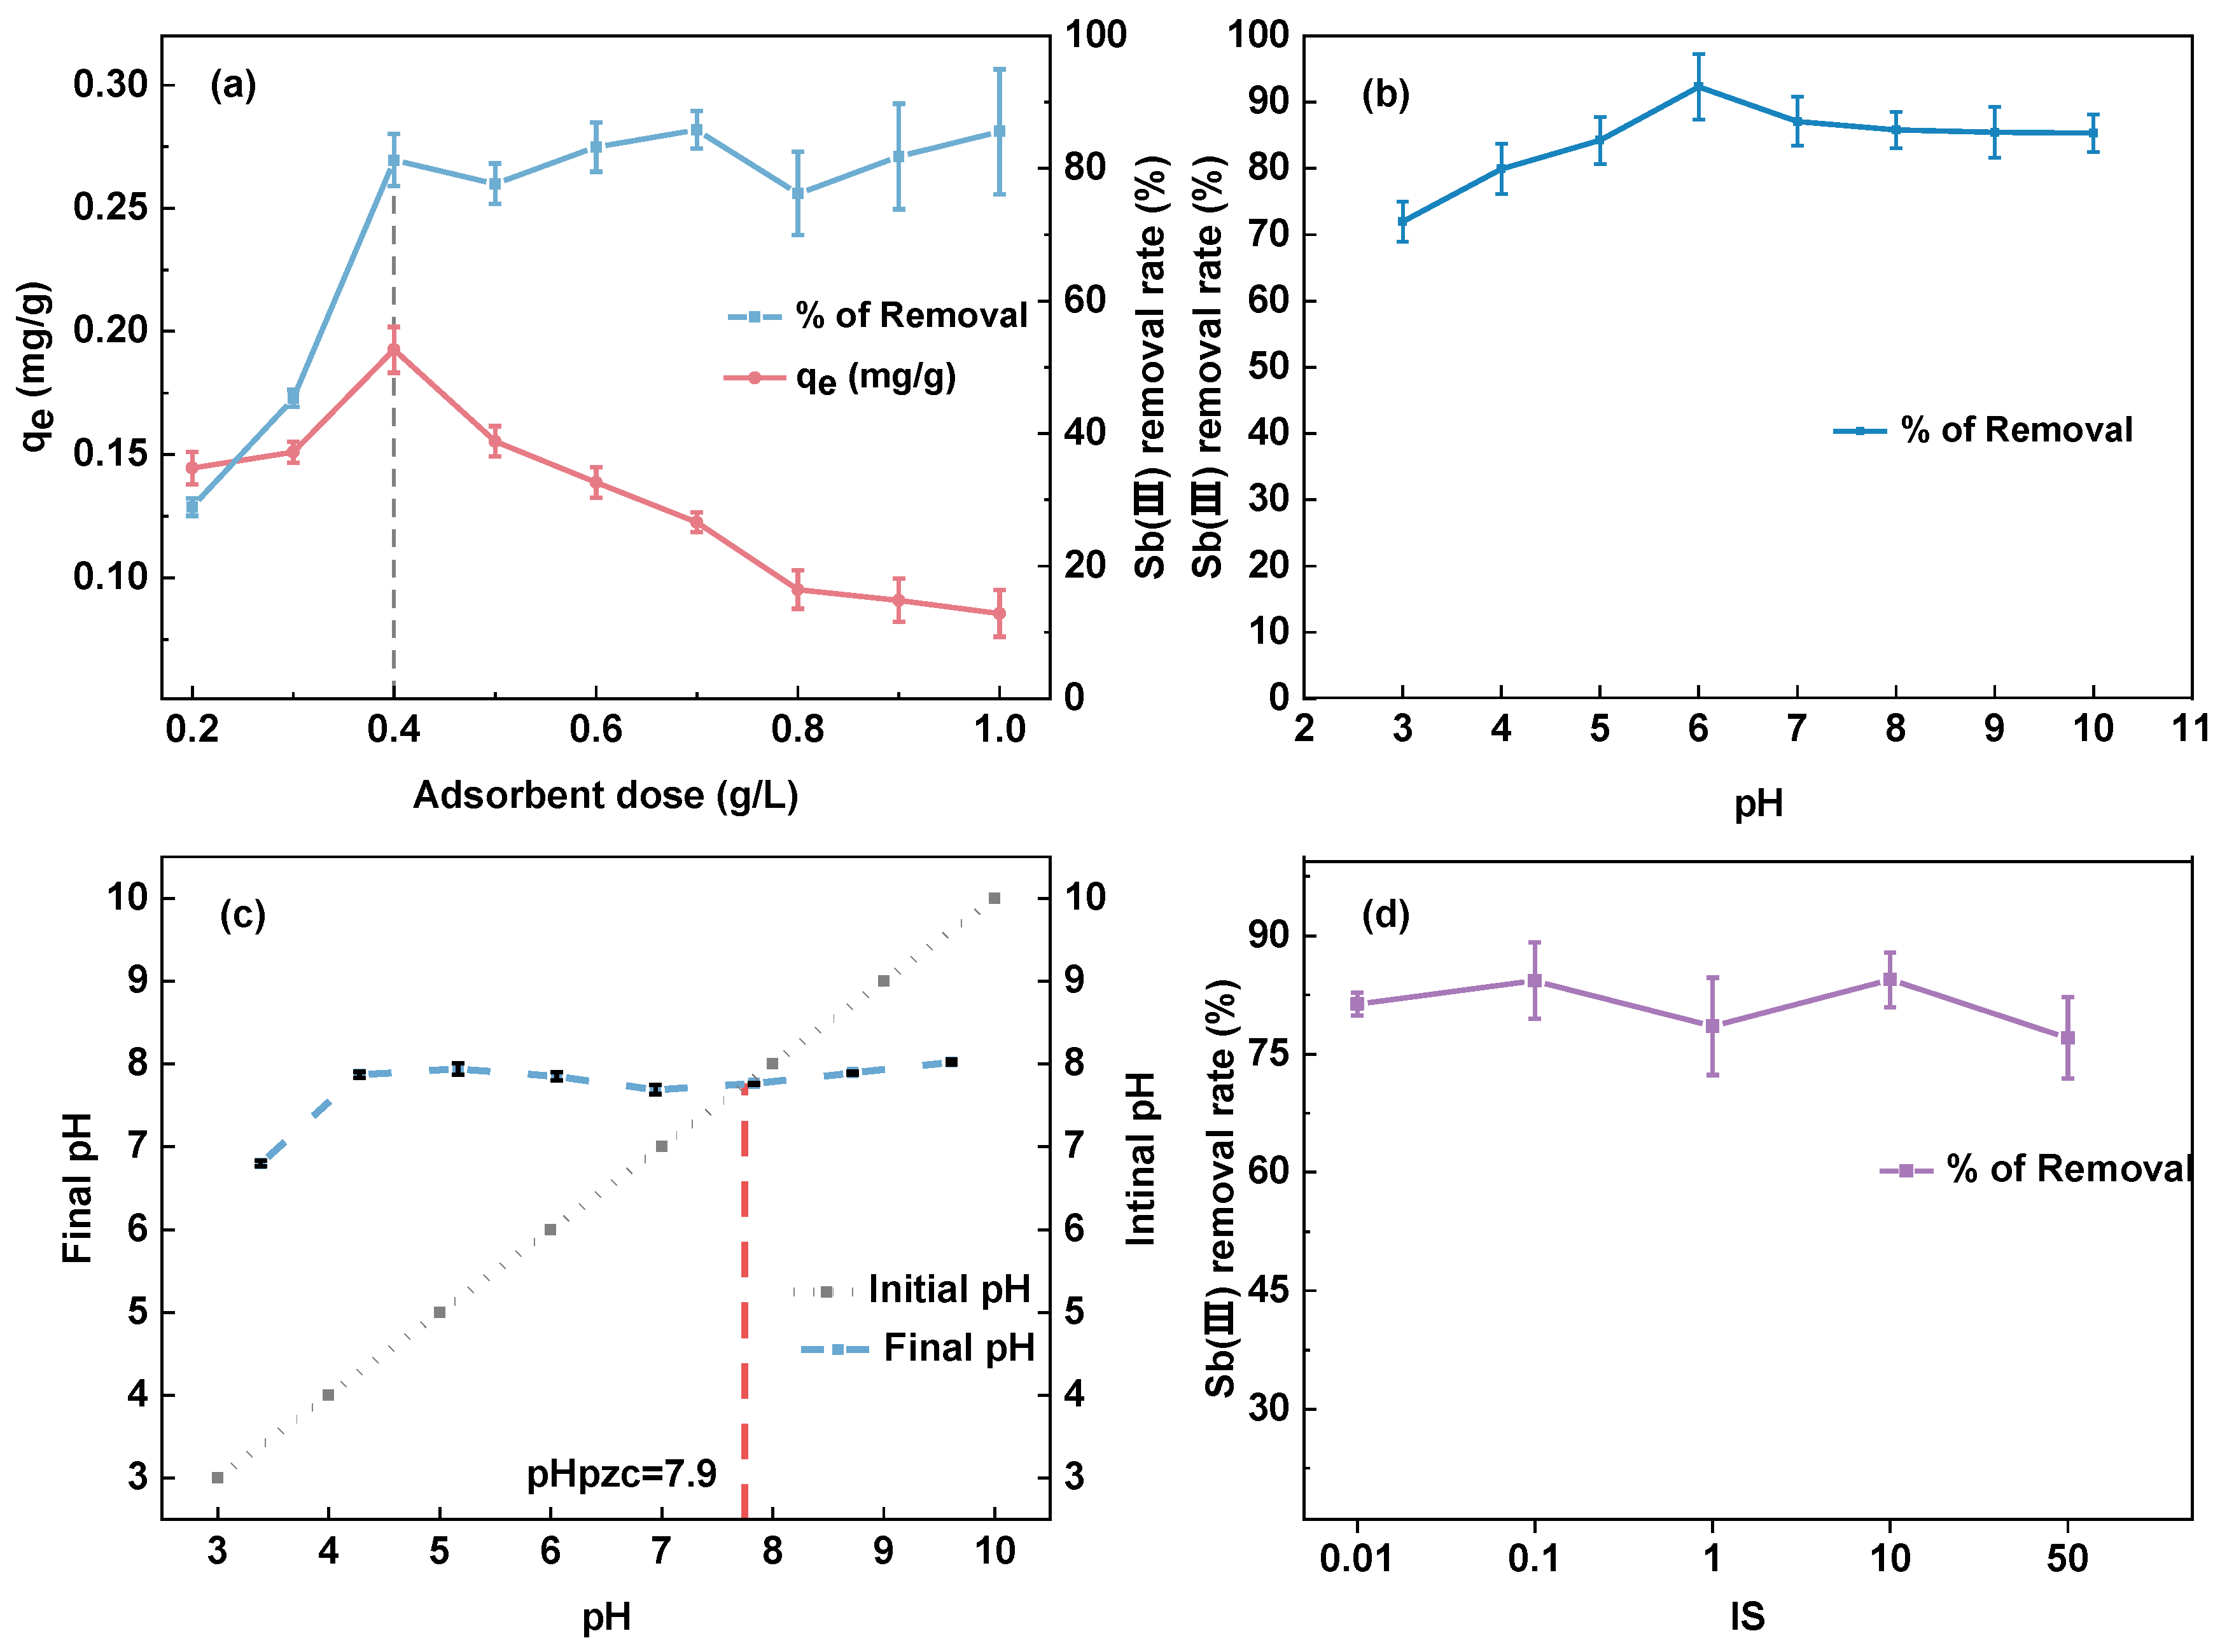
The relationship between the dosage of MCC and Sb(III) removal from the solution is shown in Figure 6a. The figure shows that the removal rate of Sb(III) increased from roughly 20% to more than 80% when the dosage of adsorbent increased from 0.2 g/L to 0.4 g/L. However, when the dosage of MCC reached 0.4 g/L, the adsorption removal rate essentially remained unchanged with the increase in dosage. Furthermore, the figure also indicates that the unit adsorption capacity improved as the dose increased up to 0.4 g/L, but the capacity declined as the dosage crossed this threshold. This is because the adsorption capacity of the MCC for Sb(III) will rise before the dose reaches 0.4 g/L since the mass transfer force between the solid–liquid phase is insufficient at low dosages. The adsorption site of Sb(III) increases as the dosage increases, but there is a limit to the amount of Sb(III) in the solution, which means that the concentration of Sb(III) assigned to each unit of adsorption site will decrease. This further demonstrates that an excessive amount of adsorbent cannot be fully utilized in the adsorption process, leading to waste.

3.3.2. Effect of pH and Ionic Strength

The form of heavy metals in the solution and the surface of the adsorbent charge are both influenced by pH. As a result, pH is another significant component affecting the adsorption impact.
Figure 6b depicts how pH affects the removal effect of Sb(III). The figure shows that the removal rate of MCC for Sb(III) in the pH range of 3–10 was around 80%, revealing that pH has a negligible effect on Sb(III) adsorption. As Figure 6e illustrates, Sb is mostly present as uncharged Sb(OH)3 across the pH range in this study [53,54]. As can be shown in Figure 6c, MCC has a pHpzc of 7.9. The MCC surface becomes negatively charged when the solution pH exceeds pHpzc, and vice versa. Nonetheless, Figure 6b illustrates that the adsorption is not significantly influenced by pH; therefore, electrostatic attraction is not the primary adsorption mechanism in the MCC adsorption of Sb(III) [54]. Furthermore, MCC and CHS were placed in two conical bottles, respectively, in an acidic environment (pH = 3), and after a 24 h reaction, the scenario depicted in Figure 6f was observed. CHS disintegrated, which was connected to the characteristics of chitosan. After a full day, MCC might still separate from water. One could argue that MCC is more stable structurally and has superior acid resistance compared to CHS.
Furthermore, Figure 6d indicates the adsorption rate of MCC for Sb(III) stays at roughly 80% even when the ionic strength increases from 0.01 mM to 50 mM, confirming that the ionic strength has little impact on the removal of antimony. Since both pH and ion strength have no significant effect on antimony removal, it may be assumed that the primary mechanism by which MCC removes Sb(III) is the formation of an inner sphere complex between Fe and antimony [54].

3.3.3. Effect of Coexisting Anions

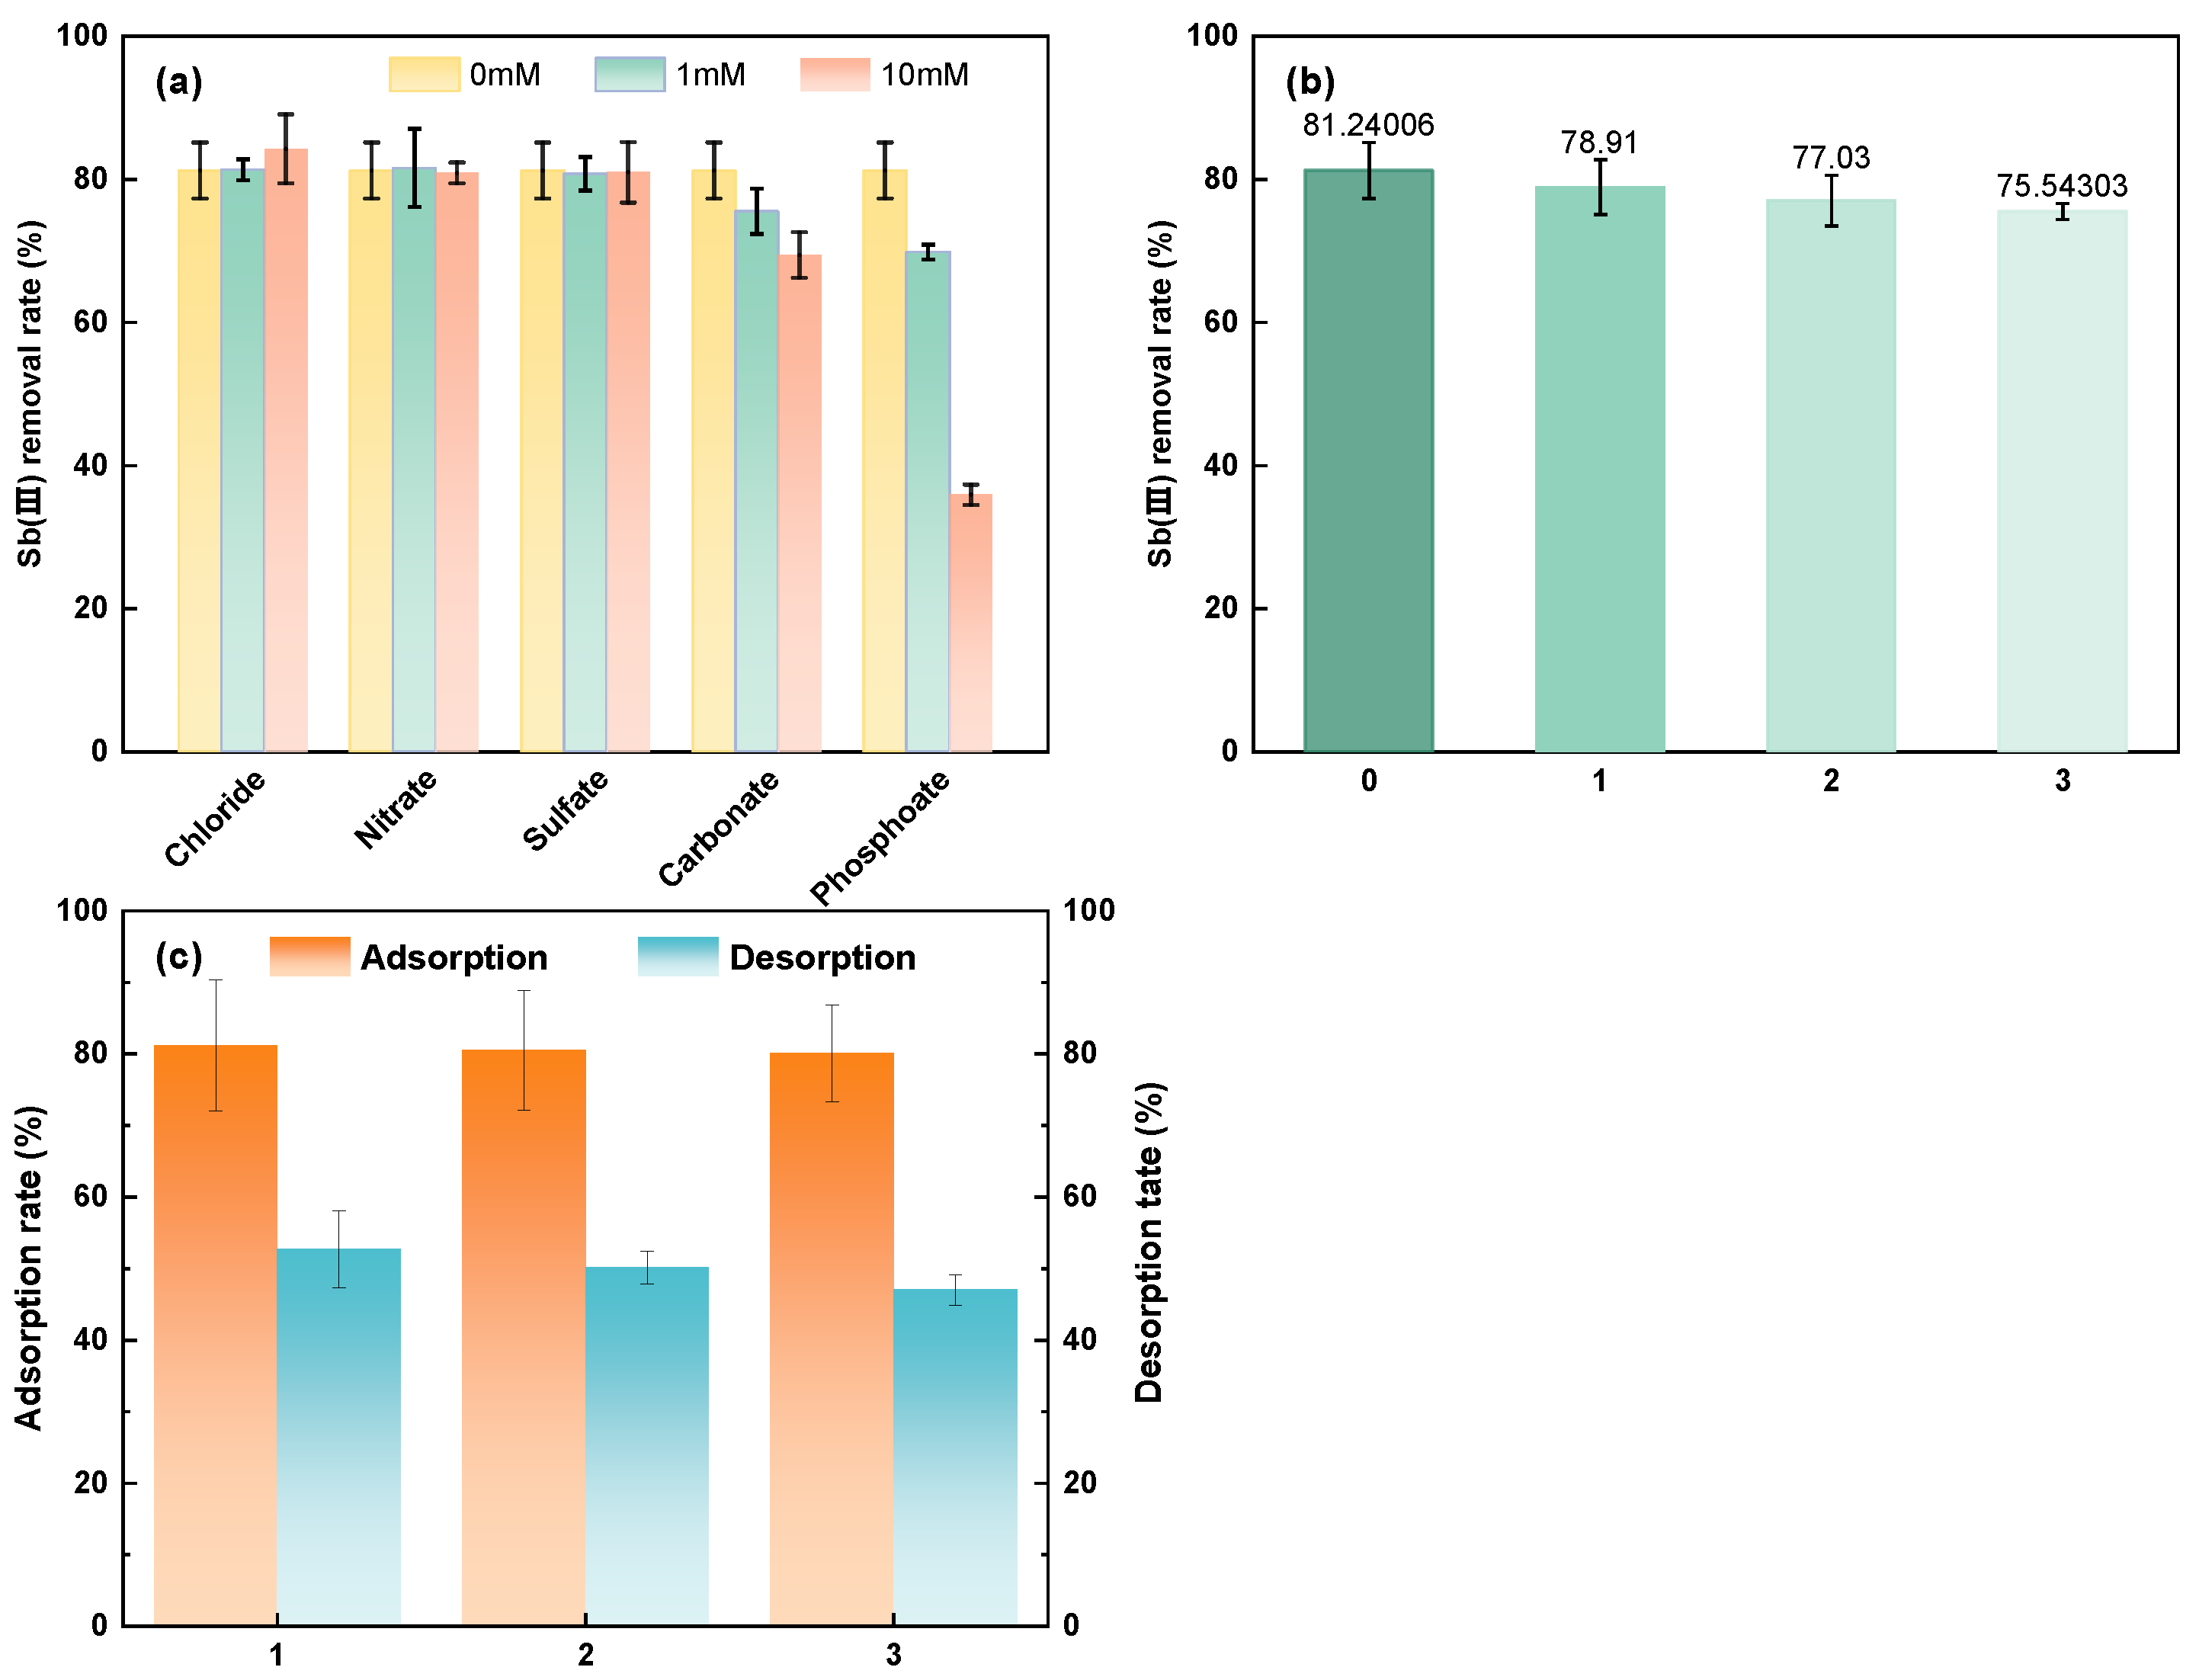
Many different kinds of anions coexist in natural water. Therefore, some common anions in water, such as Cl, NO3, SO42−, CO32−, and PO42−, were selected to explore the influence of co-existing ions. The effects of these anions on the adsorption effect were studied at three different concentrations (0 mM, 1 mM, and 10 mM), as displayed in Figure 7a. As the graph indicates, phosphate has the most significant adsorption inhibitory effect on Sb(III) among those selected anions. The adsorption removal rate drops from 81% to 66% when the phosphate concentration increases from 0 mM to 1 mM, and lower still to 35% when the concentration hits 10 mM. Other anions had no obvious effect on the adsorption or removal of Sb(III).
Because of differences in the bonding interactions between anions and iron oxides, different anions have distinct impacts on the adsorption effect. With iron oxides, Cl and NO3 primarily form exo-spherical complexes [55]; SO42− also produces exo-spherical complexes when the pH exceeds 6 [56]. However, an inner spherical complex—which has a larger binding force than the outer spherical complex—is mostly formed between antimonate and iron oxide [57]. As a result, there is little effect of nitrate, sulfate, or chloride ions on Sb(III) adsorption. Furthermore, even though carbonate and iron oxide also form inner-sphere complexes, the influence of carbonate is less evident due to the relatively low affinity. The obvious suppression of antimony adsorption by phosphate is caused by the strong affinity inner sphere complex, which phosphorus and iron oxides can form. This complex competes with antimony for the adsorption location [58,59].

3.3.4. Recycle Experiment

To assess the cycle performance for MCC, three sets of continuous cycle experiments were set up. Magnetic separation is applied to keep the used MCC separate from the water. Because the initial concentration of 0.1 mg/L is much less than the adsorption saturation capacity of MCC, the isolated MCC is repeatedly cleaned directly with deionized water, the leftover Sb(III) solution is washed off the surface and added to the next set of cycles. The results of the cyclic experiment are shown in Figure 7b. The elimination rate after the first use is 81.24%, as can be seen. The adsorption removal rate exceeds 75.54% after three cycles. The reduction is around five percent when compared to the removal rate at the time of beginning use. As a result, MCC is thought to have good recycling.
Moreover, three sets of desorption experiments were carried out, and the desorption capacity of MCC was assessed. Figure 7c shows that the adsorption capacity of MCC may be kept above 75% even after three desorptions. The MCC desorption rate is kept at roughly 50%. MCC may be used, without desorption, in non-wastewater with low antimony concentrations by circulating multiple times. The MCC is desorbed when the effluent concentration hits a predetermined limit threshold.
Furthermore, Sb@C material performs well as the anode in sodium-ion batteries [60,61]. As a result, it may be said that MCC has some recycling potential.

3.3.5. Adsorption Kinetics

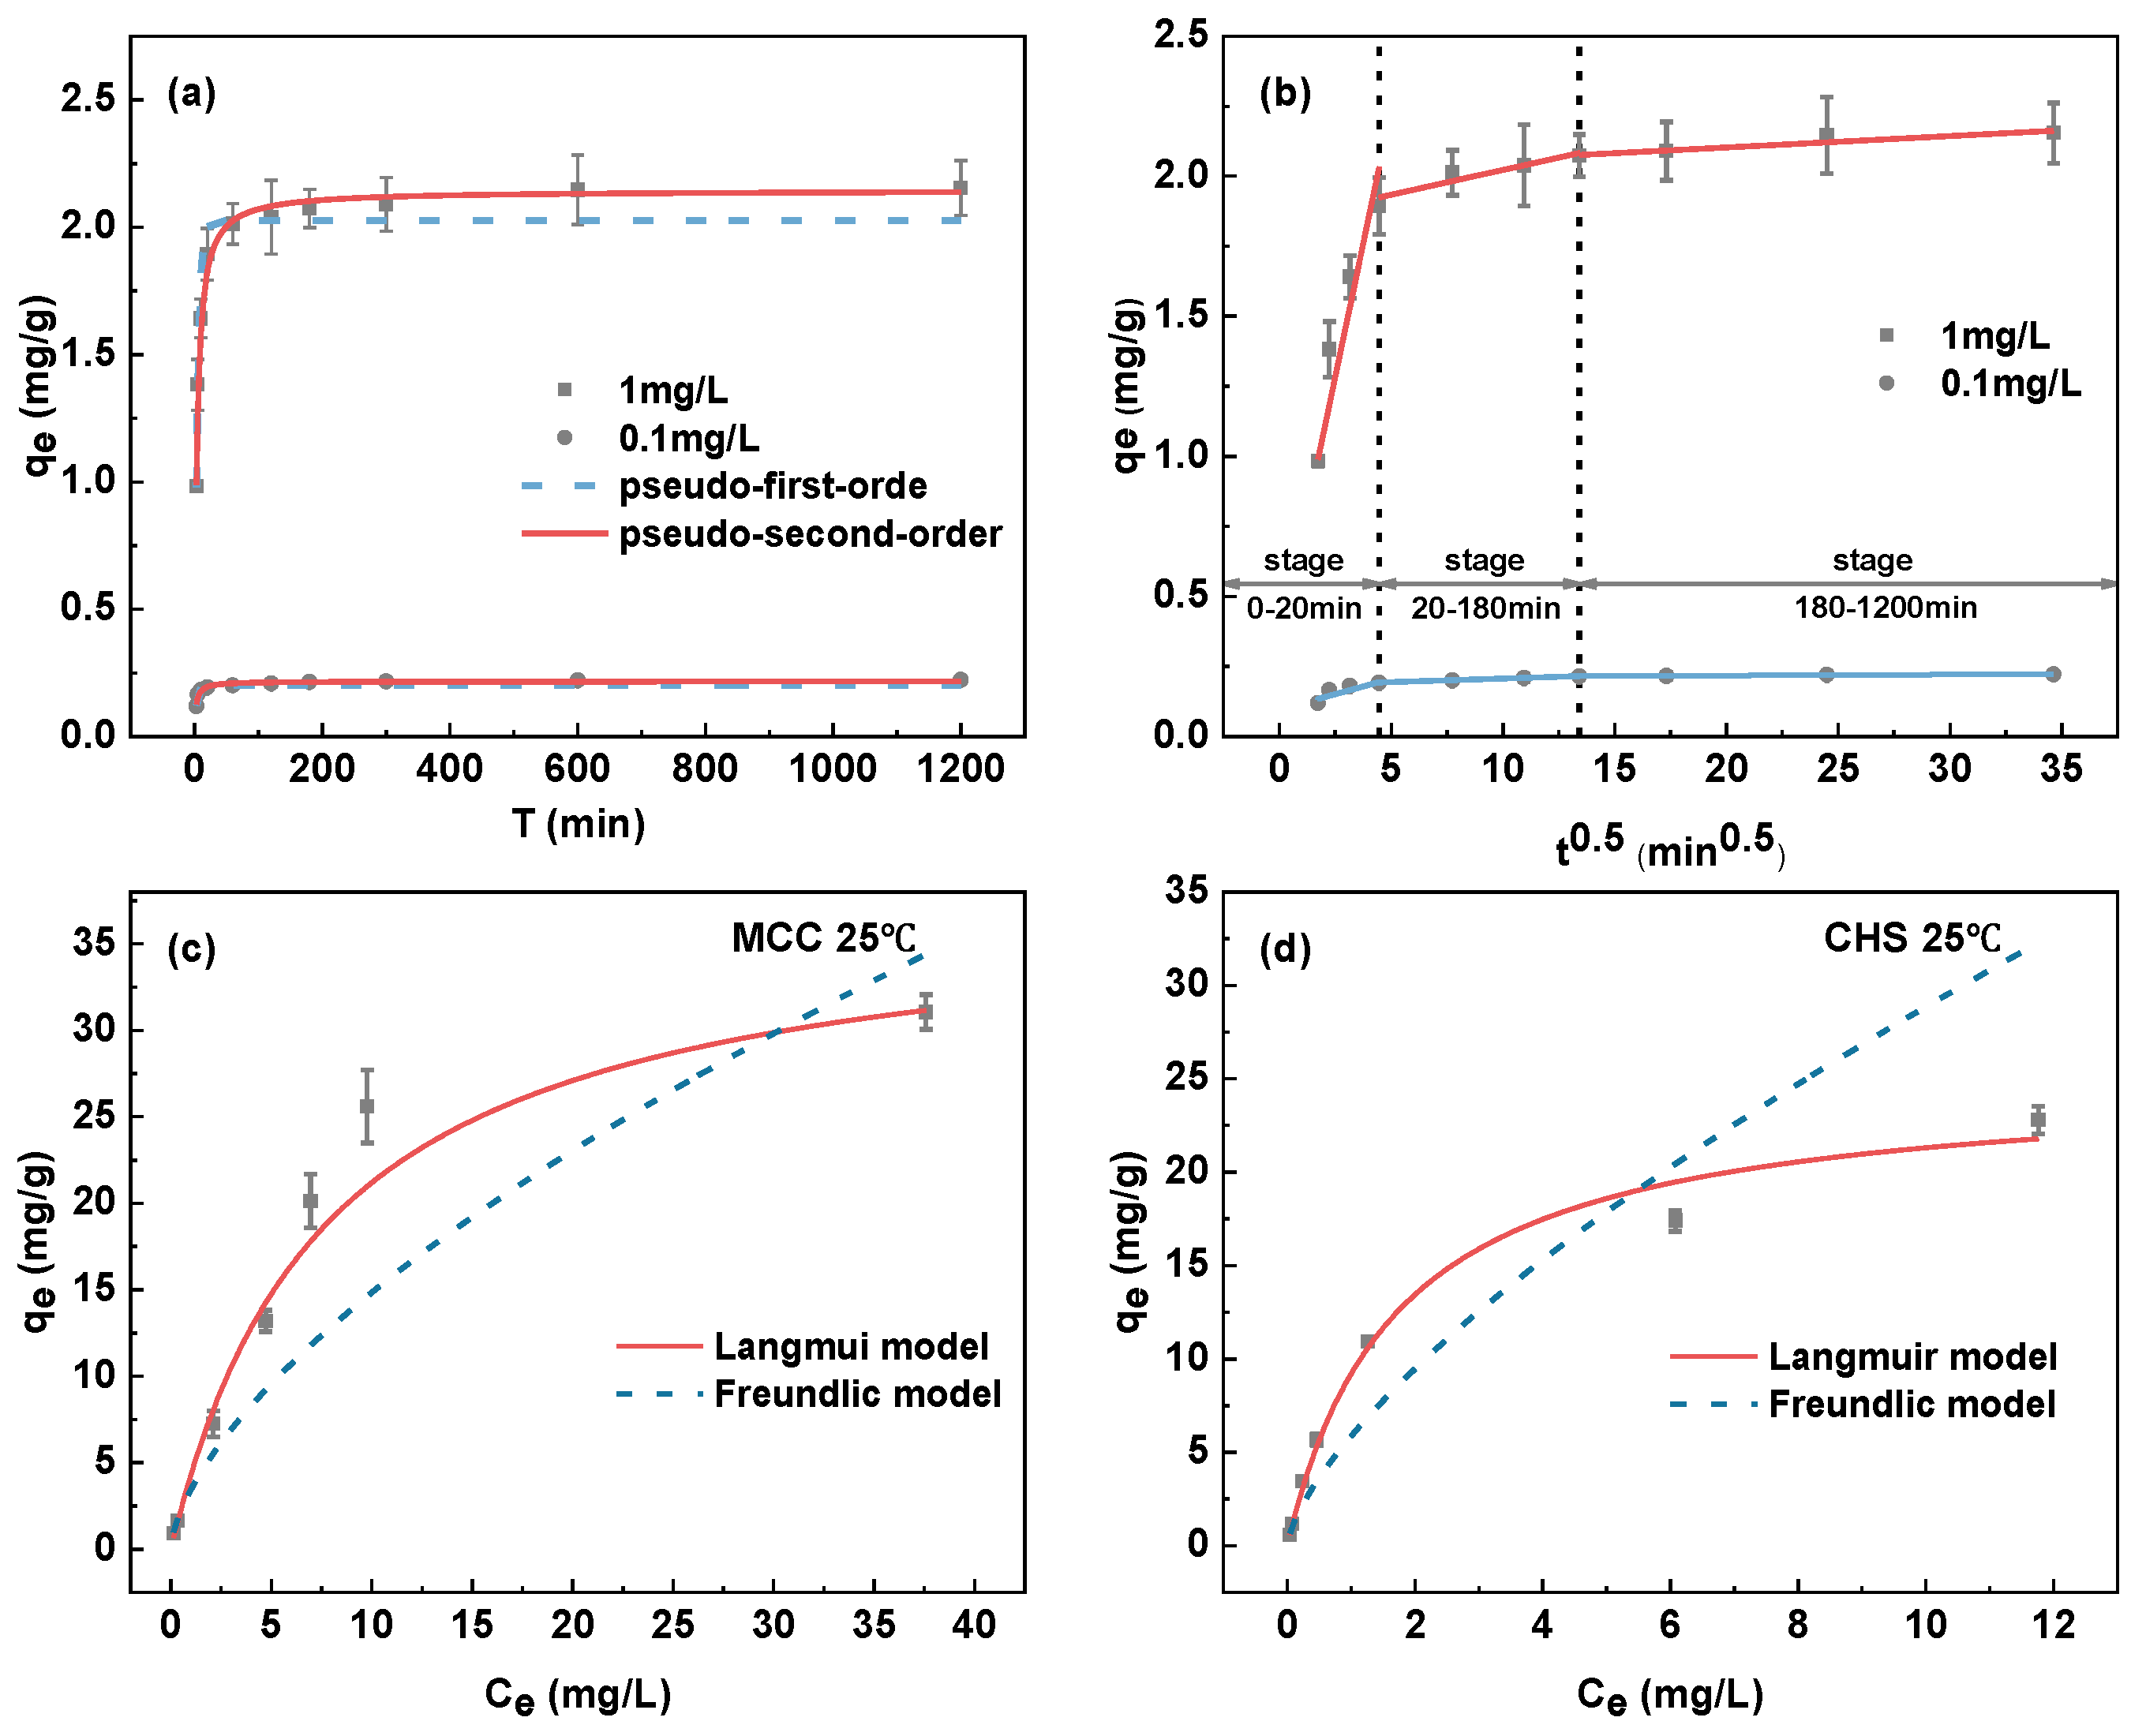
Adsorption efficiency is a crucial criterion for assessing adsorption effectiveness. As a consequence, this chapter examines the connection between the Sb(III) adsorption process and the time. The data were fitted by the pseudo-first-order and pseudo-second-order dynamics models. Figure 8a shows the fitting results, and Table 1 displays the pertinent parameters that were determined by fitting.
Adsorption speed in the initial stage of adsorption was relatively fast under the two different initial concentrations (0.1 mg/L and 1 mg/L), as the figure shows, and the adsorption removal rate reached more than 80% in about two hours. After that, the adsorption speed gradually slows down and eventually reaches the adsorption equilibrium. This is mainly because there are sufficient adsorption sites in the MCC to combine Sb(III) during the initial stage of adsorption. The number of adsorption sites in the MCC decreases with the increase in contact time between the MCC and Sb(III) solution, which influences the adsorption rate.
The results in Table 1 reveal that the R2 of the pseudo-first-order kinetic model is 0.878 and 0.949 at initial concentrations of 0.1 mg/L and 1 mg/L, respectively, whereas the R2 of the pseudo-second-order kinetic model is 0.943 and 0.988. The R2 of the pseudo-second-order kinetic model is higher than that of the pseudo-first-order kinetic model across all Sb(III) concentrations. Consequently, the adsorption process of MCC could be described more precisely by the pseudo-second-order kinetic model, revealing that chemisorption is the primary method of adsorption for Sb(III) by MCC [38].
With the Weber–Morris particle pore diffusion model, the adsorption process of Sb(III) on MCC was analyzed further, and the outcomes are displayed in Figure 8b; the pertinent parameters are listed in Table 2. The linear graphs of the three steps did not cross the origin (Ci ≠ 0) at the starting concentration of 0.1 mg/L or 1 mg/L, indicating that intragranular diffusion is not the sole important step [62]. The adsorption of Sb(III) by MCC is split into three linear components by the particle diffusion model. As a result, the adsorption process may be split into three stages: the surface adsorption stage (0–20 min) has the quickest adsorption rate (k1), most likely as a result of Sb(III) diffusing into the boundary layer through adsorption on the outer surface. The internal diffusion process, which is primarily influenced by intra-particle diffusion [62], occurs in the second stage (20–180 min). The adsorption reached equilibrium during the final stage (180–1200 min) and had the slowest adsorption rate (k3).
Figure 8b shows that within 20 min, MCC removed Sb at a rate that was almost 90% of the final level of concentration. Also, the adsorption equilibrium time of MCC (about 2 h) stands out more than that of the adsorbents reported in Table 1 for antimony removal. It may be said that MCC has the potential to remove Sb(III) since a faster adsorption rate offers better financial benefits for the adsorption facilities.
Table 1. Parameter of the adsorption kinetic models and adsorption equilibrium time of other materials.
Initial ConcentrationPseudo-First-Order Pseudo-Second-Order
k1SD (k1)qeSD (qe)R2 k2SD (k2)qeSD (qe)R2
0.1 mg/L0.2780.0310.2090.0040.878 2.2310.2610.2160.0030.949
1 mg/L0.2000.0172.0570.0340.946 0.1530.0102.1320.0180.988
Adsorbent Dose (g/L) pH te(h) Model
Iron-coated cork granulates 2.5 6 24 Elovich[54]
Fe3O4/Fe2O3/CNs 1 5 3 pseudo-second-orde[44]
Fe3O4/BC 2 pseudo-second-order[63]
CNT-SH 2.5 7 2.5 pseudo-second-orde[64]
CNT-I 2.5 7 3 pseudo-second-orde[64]
MnFe2O4–biochar 1 7 12 pseudo-second-orde[65]
Table 2. Parameter of the Weber–Morris particle pore diffusion model.
Initial ConcentrationStage1Stage2Stage3
kd1C1kd2C2kd3C3
0.1 mg/L0.0230.0970.0030.1810.00030.211
1 mg/L0.3080.5810.0191.8310.0042.026

3.3.6. Adsorption Isotherms

The isothermal adsorption for CHS and MCC studies were conducted at 25 °C. To fit the measured data, the Freundlich and Langmuir models were applied. The fitting results are displayed in Figure 8c,d. The correlation values (R2) of the Freundlich model were 0.974 and 0.878, and the correlation coefficients (R2) of the Langmuir model of CHS and MCC were 0.985 and 0.969, respectively, given the fitting results in Table 3. Thus, the Langmuir model description of the adsorption of Sb(III) by both is more suitable, indicating that the adsorption is monolayer adsorption.
Additionally, Table 3 indicates that all the Langmuir constants KL that were calculated by fitting the Langmuir model are 0.614 and 0.144, respectively. Adsorption can easily occur because all the dimensionless constants 1/n fitted to the Freundlich model are less than 0.5. As the 1/n of MCC (0.413) is lower than that of CHS (0.440), MCC is more likely to have a greater attraction with Sb(III).
The Langmuir model was used by CHS and MCC for calculating the adsorption saturation capacities, which came out to be 24.380 mg/g and 38.234 mg/g, respectively. Thus, the adsorption saturation capacity is impacted in some way by the pyrolysis process. Furthermore, the adsorption saturation capability of MCC is roughly double that of Fe3O4 sold commercially.
The data in Table 4 indicates that the majority of the specific surface area of these adsorbents with adsorption saturation capacities higher than MCC is likewise higher than MCC. BC-γFe2O3 with specific surface areas comparable to MCC has a comparable adsorption saturation capacity, suggesting that particular surface area could be a contributing component. Furthermore, as the iron-based materials utilized in these adsorbents are primarily obtained from the manufacturing of chemical reagents, where iron purity is higher, it is also important to enhance the iron load when using iron-proportion waste as an adsorbent.

3.3.7. Summary of Sorption Mechanism

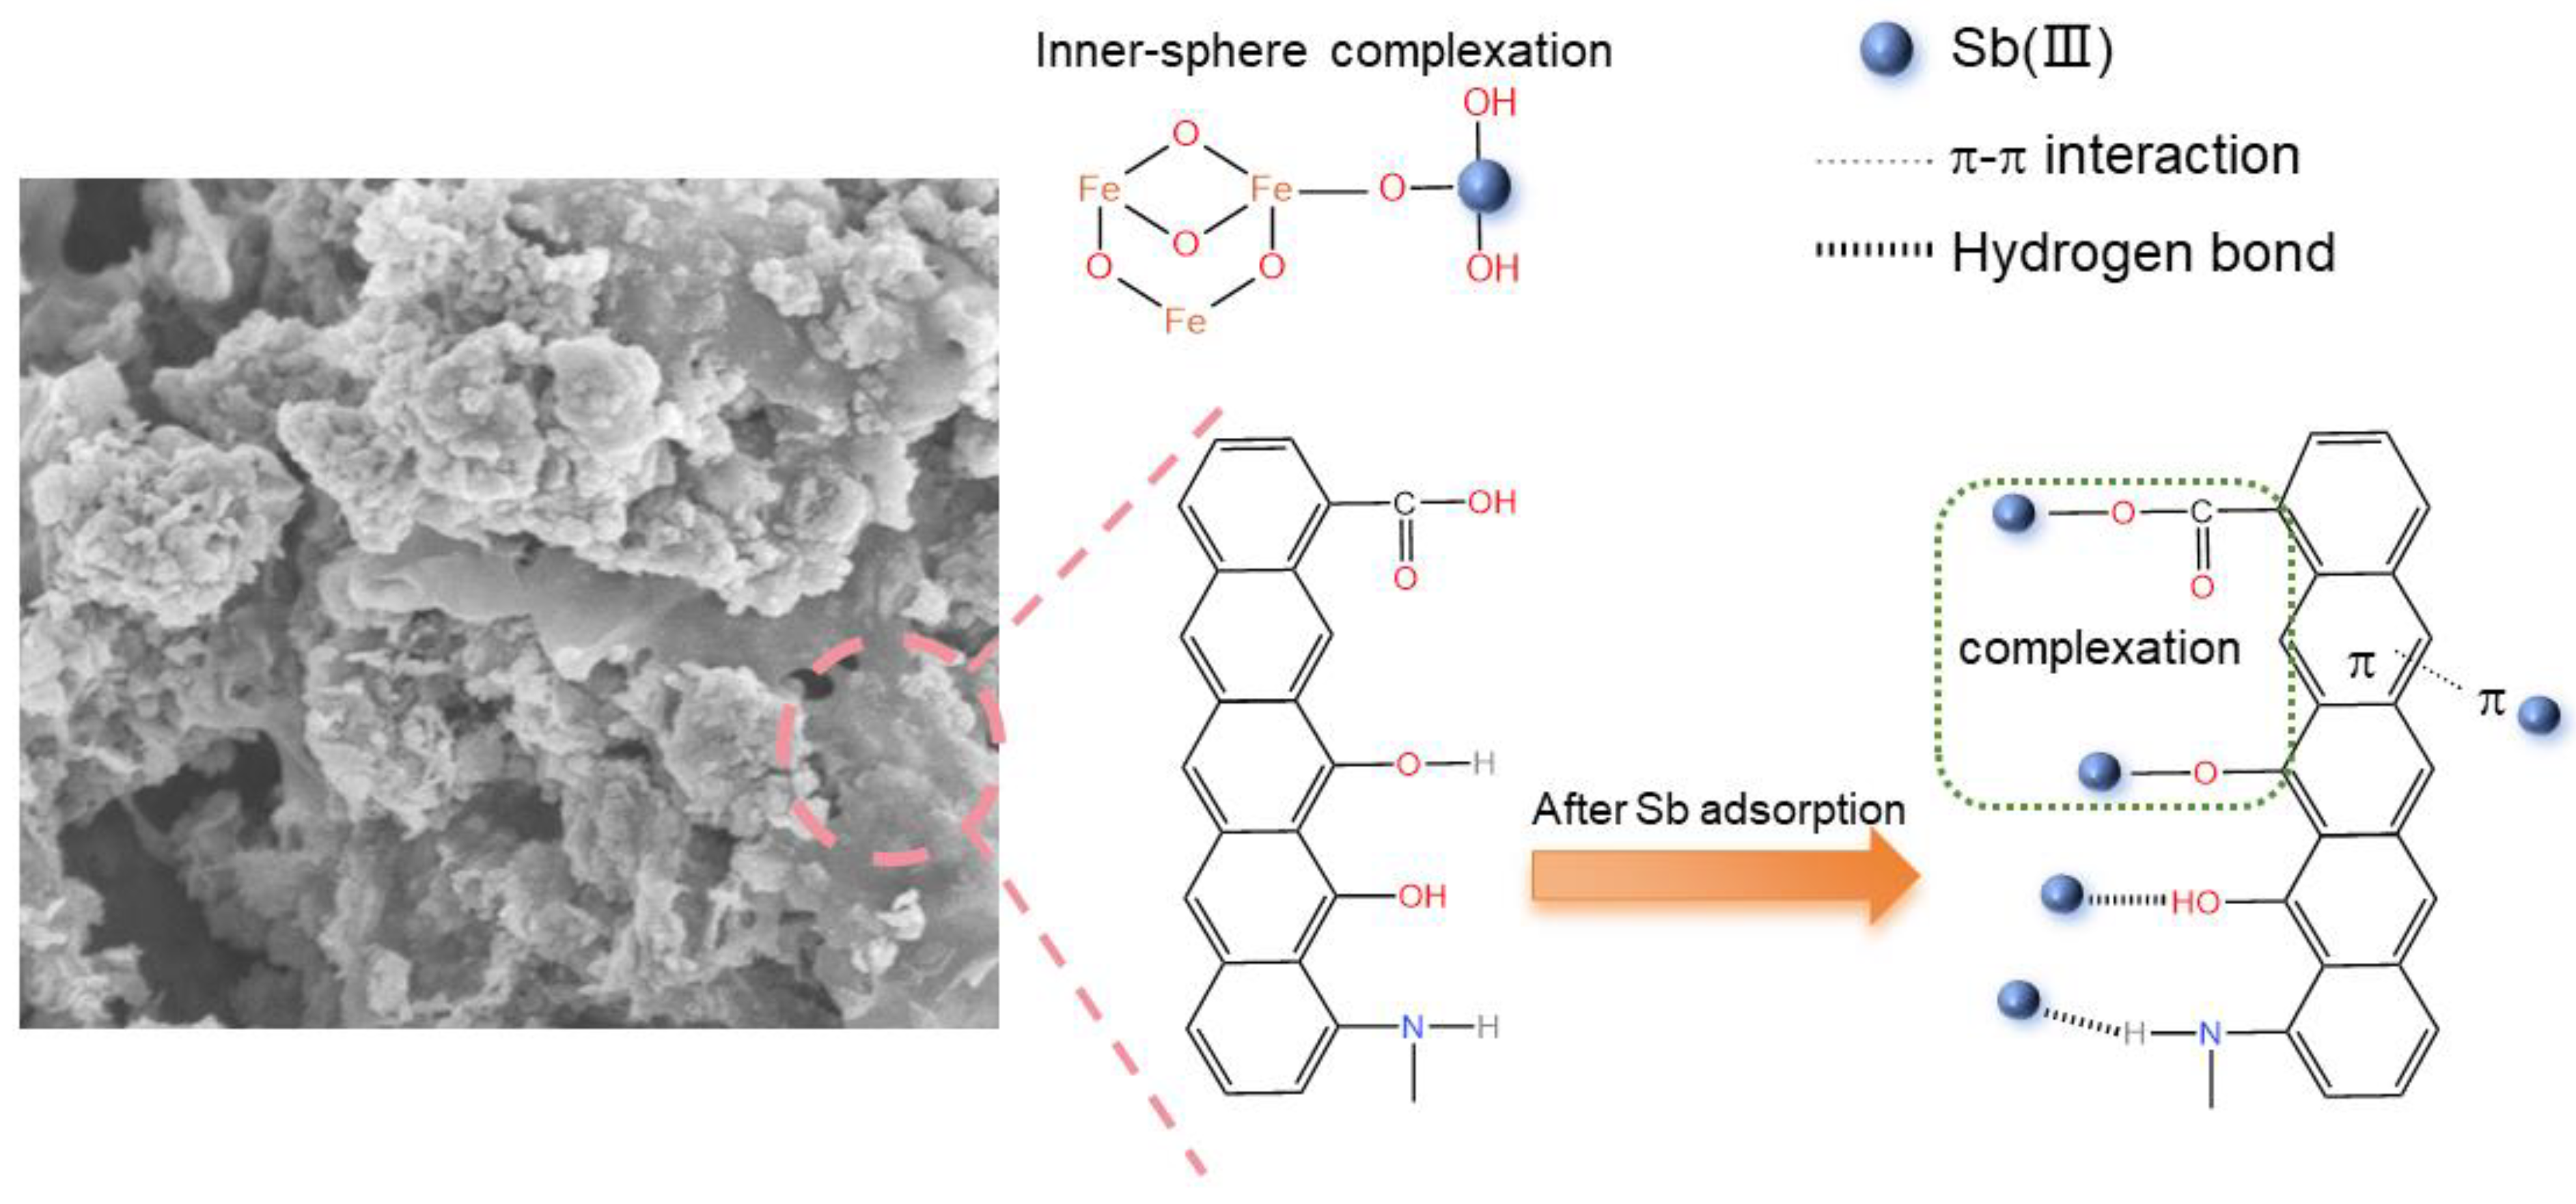
The batch sorption experiments and the pre- and post-adsorption characterization data show that the adsorption process of MCC is more in line with the pseudo-second-order kinetic adsorption model and the Langmuir model, indicating that chemical adsorption is the primary mechanism by which Sb is adsorbed by MCC. The fact that pH and ionic strength have no obvious effects on adsorption suggests that Sb mostly forms inner-sphere complexes in MCC. It is evident from the FTIR and XPS characterization results that the adsorption of Sb is supported by the -COOH, -OH, π electrons, and Fe-O present in MCC.
The following is a summary of the mechanism: (1) Sb is made complex with the -OH and -COOH functional groups in chitosan carbon. Between Sb(III) molecules and the hydrogen atoms of N- and O- groups on the chitosan carbon, hydrogen bonds can form. There is π-π interaction among antimony molecules and the aromatic structure. (2) Iron sludge becomes Fe3O4 after calcination due to the presence of carbon-based factors, and Fe-O can form an inner sphere complex with Sb, which is also the primary mechanism by which MCC removes Sb. In Figure 9, the mechanism is displayed.

3.4. Environmental Impact and Sustainability

The iron sludge used in this study is derived from the waste generated during the backwashing of the filter beds in groundwater treatment plants for iron and manganese removal. The large volume of production and the time-consuming and costly disposal process pose challenges. The magnetic carbonaceous material adsorbent successfully prepared from iron sludge and chitosan not only exhibits a high antimony adsorption capacity but can also be easily recovered under the influence of an external magnetic field, facilitating the regeneration and reuse of the adsorbent. This “waste-to-waste” approach is a beneficial attempt towards a circular economy, aiming to reduce environmental pollution pressure and support society’s sustainable development.

4. Conclusions

In this study, iron sludge and chitosan were pyrolyzed to create magnetic chitosan carbon (MCC). Iron sludge could be used as a resource, and Sb was successfully removed from water. The results show after pyrolysis, γ-FeOOH in iron sludge turns into Fe3O4, and the magnetic saturation strength of MCC is 33.243 emu/g. The adsorption process of Sb(III) by MCC can be described by the pseudo-second-order kinetic model and the Langmuir model, suggesting that the adsorption is a single-layer chemisorption. The creation of an inner sphere complex between Fe-O and Sb, hydrogen bonding, π-π interaction, and surface complexation are the mechanisms involved in the adsorption of antimony by MCC. Compared to CHS, MCC has a higher saturation capacity, higher Fe, and better acid resistance. MCC, whose being activated result is not extremely strong, increases the proportion of mesoporous pores and improves the pore structure compared to directly calcined pure iron sludge. Therefore, MCC produced with iron sludge is a cheap and effective adsorbent for the adsorption of antimony, providing useful references for the resource utilization of other iron-containing waste.

Author Contributions

Conceptualization, H.Z. and H.X.; Software, H.X.; Formal analysis, H.X. and S.S.; Resources, Y.Z.; Data curation, H.X. and S.S.; Writing—original draft, H.X.; Writing—review & editing, H.Z.; Visualization, Y.Z.; Supervision, H.Z.; Project administration, D.L.; Funding acquisition, J.Z. and D.L. All authors have read and agreed to the published version of the manuscript.

Funding

This study was funded by the National Natural Science Foundation of China (No. 51308009), Beijing Outstanding Young Scientist Program (BJJWZYJH01201910005019), the Scientific and Technological Research Program of Beijing Municipal Education Commission project (KM201510005021) and Science and technology innovation fund project of Beijing University of Technology—“Urban carbon neutralization” (047000514122632).”

Institutional Review Board Statement

Not applicable.

Informed Consent Statement

Not applicable.

Data Availability Statement

The data presented in this study are available on request from the corresponding author.

Conflicts of Interest

The authors declare no conflict of interest.

References

  1. Lai, Z.; He, M.; Lin, C.; Ouyang, W.; Liu, X. Interactions of antimony with biomolecules and its effects on human health. Ecotoxicol. Environ. Saf. 2022, 233, 113317. [Google Scholar] [CrossRef] [PubMed]
  2. Li, J.; Zheng, B.; He, Y.; Zhou, Y.; Chen, X.; Ruan, S.; Yang, Y.; Dai, C.; Tang, L. Antimony contamination, consequences and removal techniques: A review. Ecotoxicol. Environ. Saf. 2018, 156, 125–134. [Google Scholar] [CrossRef] [PubMed]
  3. He, M.; Wang, X.; Wu, F.; Fu, Z. Antimony pollution in China. Sci. Total Environ. 2012, 421–422, 41–50. [Google Scholar] [CrossRef] [PubMed]
  4. Filella, M.; Belzile, N.; Chen, Y. Antimony in the environment: A review focused on natural waters: I. Occur. Earth-Sci. Rev. 2002, 57, 125–176. [Google Scholar] [CrossRef]
  5. Fu, X.; Xie, X.; Charlet, L.; He, J. A review on distribution, biogeochemistry of antimony in water and its environmental risk. J. Hydrol. 2023, 625, 130043. [Google Scholar] [CrossRef]
  6. Gan, Y.; Ding, C.; Xu, B.; Liu, Z.; Zhang, S.; Cui, Y.; Wu, B.; Huang, W.; Song, X. Antimony (Sb) pollution control by coagulation and membrane filtration in water/wastewater treatment: A comprehensive review. J. Hazard. Mater. 2023, 442, 130072. [Google Scholar] [CrossRef] [PubMed]
  7. Deng, S.; Ren, B.; Hou, B.; Deng, R.; Cheng, S. Antimony-complexed heavy metal wastewater in antimony mining areas: Source, risk and treatment. Environ. Technol. Innov. 2023, 32, 103355. [Google Scholar] [CrossRef]
  8. Hu, X.; You, S.; Li, F.; Liu, Y. Recent advances in antimony removal using carbon-based nanomaterials: A review. Front. Environ. Sci. Eng. 2022, 16, 48. [Google Scholar] [CrossRef]
  9. Peng, L.; Wang, N.; Xiao, T.; Wang, J.; Quan, H.; Fu, C.; Kong, Q.; Zhang, X. A critical review on adsorptive removal of antimony from waters: Adsorbent species, interface behavior and interaction mechanism. Chemosphere 2023, 327, 138529. [Google Scholar] [CrossRef] [PubMed]
  10. Zhu, J.; Wu, F.; Pan, X.; Guo, J.; Wen, D. Removal of antimony from antimony mine flotation wastewater by electrocoagulation with aluminum electrodes. J. Environ. Sci. 2011, 23, 1066–1071. [Google Scholar] [CrossRef]
  11. Ozdemir, N.; Soylak, M.; Elci, L.; Dogan, M. Speciation analysis of inorganic Sb(III) and Sb(V) ions by using mini column filled with Amberlite XAD-8 resin. Anal. Chim. Acta 2004, 505, 37–41. [Google Scholar] [CrossRef]
  12. Mohan, K.; Rajan, D.K.; Rajarajeswaran, J.; Divya, D.; Ganesan, A.R. Recent trends on chitosan based hybrid materials for wastewater treatment: A review. Curr. Opin. Environ. Sci. Health 2023, 33, 100473. [Google Scholar] [CrossRef]
  13. Abdullah, N.H.; Borhan, A.; Saadon, S.Z.A.H. Biosorption of wastewater pollutants by chitosan-based porous carbons: A sustainable approach for advanced wastewater treatment. Bioresour. Technol. Rep. 2024, 25, 101705. [Google Scholar] [CrossRef]
  14. Saheed, I.O.; Oh, W.D.; Suah, F.B.M. Chitosan modifications for adsorption of pollutants—A review. J. Hazard. Mater. 2021, 408, 124889. [Google Scholar] [CrossRef] [PubMed]
  15. Kamran, U.; Park, S. Tuning ratios of KOH and NaOH on acetic acid-mediated chitosan-based porous carbons for improving their textural features and CO2 uptakes. J. CO2 Util. 2020, 40, 101212. [Google Scholar] [CrossRef]
  16. Wu, L.; Qi, S.; Zhang, T.; Jin, Y.; Xiao, H. One-step carbonization/activation synthesis of chitosan-based porous sheet-like carbon and studies of adsorptive removal for Rhodamine B. Carbohydr. Polym. 2024, 330, 121832. [Google Scholar] [CrossRef] [PubMed]
  17. Wu, Z.; Deng, W.; Tang, S.; Ruiz-Hitzky, E.; Luo, J.; Wang, X. Pod-inspired MXene/porous carbon microspheres with ultrahigh adsorption capacity towards crystal violet. Chem. Eng. J. 2021, 426, 130776. [Google Scholar] [CrossRef]
  18. Ramkumar, K.; Prabhu, S.M.; Farzana, M.H.; Kumar, R.; Jeon, B.; Meenakshi, S. Effective arsenite adsorption from aqueous solution using N- and S-functionalized tetragonal nano-zirconia on chitosan-derived carbon. Sep. Purif. Technol. 2023, 306, 122669. [Google Scholar] [CrossRef]
  19. Li, J.; Su, J.; Yang, Q.; Yang, Z. Hydrothermal synthesis of Zr-doped chitosan carbon-shell protected magnetic composites (Zr–Fe3O4@C) for stable removal of Cr(VI) from water: Enhanced adsorption and pH adaptability. Mater. Chem. Phys. 2023, 306, 128057. [Google Scholar] [CrossRef]
  20. Zhang, W.; Zhang, J.; Dong, X.; Li, M.; He, Q.; Zhao, S.; Xie, L. Fluorinated metal–organic frameworks for enhanced stability and iodine adsorption selectivity under humid conditions. Chem. Eng. J. 2023, 461, 142058. [Google Scholar] [CrossRef]
  21. Xiao, W.; Jiang, X.; Liu, X.; Zhou, W.; Garba, Z.N.; Lawan, I.; Wang, L.; Yuan, Z. Adsorption of organic dyes from wastewater by metal-doped porous carbon materials. J. Clean. Prod. 2021, 284, 124773. [Google Scholar] [CrossRef]
  22. Nithya, R.; Thirunavukkarasu, A.; Sathya, A.B.; Sivashankar, R. Magnetic materials and magnetic separation of dyes from aqueous solutions: A review. Environ. Chem. Lett. 2021, 19, 1275–1294. [Google Scholar] [CrossRef]
  23. Ambashta, R.D.; Sillanpää, M. Water purification using magnetic assistance: A review. J. Hazard. Mater. 2010, 180, 38–49. [Google Scholar] [CrossRef] [PubMed]
  24. Ahmed, M.J.K.; Ahmaruzzaman, M. A facile synthesis of Fe3O4–charcoal composite for the sorption of a hazardous dye from aquatic environment. J. Environ. Manag. 2015, 163, 163–173. [Google Scholar] [CrossRef] [PubMed]
  25. Dai, K.; Chen, P.; Wang, Z.; Yang, P.; Li, M.; Tang, C.; Zhuang, W.; Zhu, C.; Ying, H.; Wu, J. Magnetic composite Ca(OH)2/Fe3O4 for highly efficient flocculation in papermaking black liquor without pH neutralization. Adv. Powder Technol. 2021, 32, 2457–2468. [Google Scholar] [CrossRef]
  26. Xiao, B.; Jia, J.; Wang, W.; Zhang, B.; Ming, H.; Ma, S.; Kang, Y.; Zhao, M. A review on magnetic biochar for the removal of heavy metals from contaminated soils: Preparation, application, and microbial response. J. Hazard. Mater. Adv. 2023, 10, 100254. [Google Scholar] [CrossRef]
  27. Zeng, H.; Zhao, W.; Sun, S.; Sun, X.; Zeng, Y.; Hao, R.; Zhang, J.; Li, D. Facile preparation of maghemite based on iron sludge for arsenic removal from water. Sci. Total Environ. 2024, 906, 167575. [Google Scholar] [CrossRef] [PubMed]
  28. Yang, K.; Zhou, J.; Lv, D.; Sun, Y.; Lou, Z.; Xu, X. Preparation and Application of Iron-Based Composite Materials for the Removal of Antimony from Aqueous Solution. Prog. Chem. 2017, 29, 1407–1421. [Google Scholar] [CrossRef]
  29. Zeng, H.; Yu, Y.; Wang, F.; Zhang, J.; Li, D. Arsenic(V) removal by granular adsorbents made from water treatment residuals materials and chitosan. Colloids Surf. A Physicochem. Eng. Asp. 2020, 585, 124036. [Google Scholar] [CrossRef]
  30. Deng, S.; Ren, B.; Hou, B.; Deng, X.; Deng, R.; Zhu, G.; Cheng, S. Adsorption of Sb(III) and Pb(II) in wastewater by magnetic γ-Fe2O3-loaded sludge biochar: Performance and mechanisms. Chemosphere 2024, 349, 140914. [Google Scholar] [CrossRef] [PubMed]
  31. Sevilla, M.; Mokaya, R. Energy storage applications of activated carbons: Supercapacitors and hydrogen storage. Energy Environ. Sci. 2014, 7, 125–128. [Google Scholar] [CrossRef]
  32. Ma, Z.; Guan, Y.; Liu, H. Synthesis and characterization of micron-sized monodisperse superparamagnetic polymer particles with amino groups. J. Polym. Sci. Part A Polym. Chem. 2005, 43, 3433–3439. [Google Scholar] [CrossRef]
  33. Xu, X.; Yang, J.; Hao, G.; Tan, M.; Gao, L.; Yang, Z. Versatile dodecyl trimethyl ammonium bromide modified γ-FeOOH for simultaneous removal and determination of As(V). Anal. Chim. Acta 2023, 1264, 341310. [Google Scholar] [CrossRef] [PubMed]
  34. Sajomsang, W.; Ruktanonchai, U.R.; Gonil, P.; Nuchuchua, O. Mucoadhesive property and biocompatibility of methylated N-aryl chitosan derivatives. Carbohydr. Polym. 2009, 78, 945–952. [Google Scholar] [CrossRef]
  35. Tang, X.; Huang, J.; Liu, K.; Feng, Q.; Li, Z.; Ao, M. Synthesis of magnetically separable MnO2/Fe3O4/silica nanofiber composite with enhanced Fenton-like catalytic activity for degradation of Acid Red 73. Surf. Coat. Technol. 2018, 354, 18–27. [Google Scholar] [CrossRef]
  36. Yeamsuksawat, T.; Zhao, H.; Liang, J. Characterization and antimicrobial performance of magnetic Fe3O4@Chitosan@Ag nanoparticles synthesized via suspension technique. Mater. Today Commun. 2021, 28, 102481. [Google Scholar] [CrossRef]
  37. Li, H.; Wei, Y.; Wang, Y.; Zhao, Y.; Wang, L.; Feng, J.; Sun, F. Cooperative adsorption of Sb(V) in water by magnetic MgFe2O4-biochar composite beads. Colloids Surf. A Physicochem. Eng. Asp. 2024, 684, 133133. [Google Scholar] [CrossRef]
  38. Chen, H.; Gao, Y.; El-Naggar, A.; Niazi, N.K.; Sun, C.; Shaheen, S.M.; Hou, D.; Yang, X.; Tang, Z.; Liu, Z.; et al. Enhanced sorption of trivalent antimony by chitosan-loaded biochar in aqueous solutions: Characterization, performance and mechanisms. J. Hazard. Mater. 2022, 425, 127971. [Google Scholar] [CrossRef] [PubMed]
  39. Su, C.; Liu, Y.; Yang, Y.; Gao, T.; Qi, T.; Wang, Y. Evolution of aromatic structure and nanopores in shale kerogen by using in-situ HRTEM and in-situ FT-IR experiment. Fuel 2024, 359, 130479. [Google Scholar] [CrossRef]
  40. Philippou, K.; Anastopoulos, I.; Dosche, C.; Pashalidis, I. Synthesis and characterization of a novel Fe3O4-loaded oxidized biochar from pine needles and its application for uranium removal. Kinetic, thermodynamic, and mechanistic analysis. J. Environ. Manag. 2019, 252, 109677. [Google Scholar] [CrossRef] [PubMed]
  41. Xiong, N.; Wan, P.; Zhu, G.; Xie, F.; Xu, S.; Zhu, C.; Hursthouse, A.S. Sb(III) removal from aqueous solution by a novel nano-modified chitosan (NMCS). Sep. Purif. Technol. 2020, 236, 116266. [Google Scholar] [CrossRef]
  42. Meng, Z.; Wu, J.; Huang, S.; Xin, L.; Zhao, Q. Competitive adsorption behaviors and mechanisms of Cd, Ni, and Cu by biochar when coexisting with microplastics under single, binary, and ternary systems. Sci. Total Environ. 2024, 913, 169524. [Google Scholar] [CrossRef]
  43. Zhang, X.; Liu, Y.; Li, C.; Tian, L.; Yuan, F.; Zheng, S.; Sun, Z. Fast and lasting electron transfer between γ-FeOOH and g-C3N4/kaolinite containing N vacancies for enhanced visible-light-assisted peroxymonosulfate activation. Chem. Eng. J. 2022, 429, 132374. [Google Scholar] [CrossRef]
  44. Ren, S.; Ai, Y.; Zhang, X.; Ruan, M.; Hu, Z.; Liu, L.; Li, J.; Wang, Y.; Liang, J.; Jia, H.; et al. Recycling Antimony(III) by Magnetic Carbon Nanospheres: Turning Waste to Recoverable Catalytic for Synthesis of Esters and Triazoles. ACS Sustain. Chem. Eng. 2020, 8, 469–477. [Google Scholar] [CrossRef]
  45. Yu, G.; Fu, F. Exploration of different adsorption performance and mechanisms of core-shell Fe3O4@Ce-Zr oxide composites for Cr(VI) and Sb(III). J. Colloid Interface Sci. 2020, 576, 10–20. [Google Scholar] [CrossRef] [PubMed]
  46. Yamashita, T.; Hayes, P. Analysis of XPS spectra of Fe2+ and Fe3+ ions in oxide materials. Appl. Surf. Sci. 2008, 254, 2441–2449. [Google Scholar] [CrossRef]
  47. Zeng, J.; Qi, P.; Shi, J.; Pichler, T.; Wang, F.; Wang, Y.; Sui, K. Chitosan functionalized iron nanosheet for enhanced removal of As(III) and Sb(III): Synergistic effect and mechanism. Chem. Eng. J. 2020, 382, 122999. [Google Scholar] [CrossRef]
  48. Li, J.; Li, X.; Hayat, T.; Alsaedi, A.; Chen, C. Screening of Zirconium-Based Metal–Organic Frameworks for Efficient Simultaneous Removal of Antimonite (Sb(III)) and Antimonate (Sb(V)) from Aqueous Solution. ACS Sustain. Chem. Eng. 2017, 5, 11496–11503. [Google Scholar] [CrossRef]
  49. Cui, X.; Ni, Q.; Lin, Q.; Khan, K.Y.; Li, T.; Khan, M.B.; He, Z.; Yang, X. Simultaneous sorption and catalytic oxidation of trivalent antimony by Canna indica derived biochars. Environ. Pollut. 2017, 229, 394–402. [Google Scholar] [CrossRef] [PubMed]
  50. Gao, Y.; Chen, H.; Fang, Z.; Niazi, N.K.; Adusei-Fosu, K.; Li, J.; Yang, X.; Liu, Z.; Bolan, N.S.; Gao, B.; et al. Coupled sorptive and oxidative antimony(III) removal by iron-modified biochar: Mechanisms of electron-donating capacity and reactive Fe species. Environ. Pollut. 2023, 337, 122637. [Google Scholar] [CrossRef]
  51. Dang, A.; Liu, X.; Wang, Y.; Liu, Y.; Cheng, T.; Zada, A.; Ye, F.; Deng, W.; Sun, Y.; Zhao, T.; et al. High-efficient adsorption for versatile adsorbates by elastic reduced graphene oxide/Fe3O4 magnetic aerogels mediated by carbon nanotubes. J. Hazard. Mater. 2023, 457, 131846. [Google Scholar] [CrossRef] [PubMed]
  52. Tu, Y.; Wang, S.; Lu, Y.; Chan, T.; Johnston, C.T. New insight in adsorption of Sb(III)/Sb(V) from waters using magnetic nanoferrites: X-ray absorption spectroscopy investigation. J. Mol. Liq. 2021, 330, 115691. [Google Scholar] [CrossRef]
  53. Bian, P.; Gao, B.; Zhu, J.; Yang, H.; Li, Y.; Ding, E.; Liu, Y.; Liu, Y.; Wang, S.; Shen, W. Adsorption of chitosan combined with nicotinamide-modified eupatorium adenophorum biochar to Sb3+: Application of DFT calculation. Int. J. Biol. Macromol. 2023, 240, 124273. [Google Scholar] [CrossRef] [PubMed]
  54. Pintor, A.M.A.; Vieira, B.R.C.; Boaventura, R.A.R.; Botelho, C.M.S. Removal of antimony from water by iron-coated cork granulates. Sep. Purif. Technol. 2020, 233, 116020. [Google Scholar] [CrossRef]
  55. Shan, C.; Ma, Z.; Tong, M. Efficient removal of trace antimony(III) through adsorption by hematite modified magnetic nanoparticles. J. Hazard. Mater. 2014, 268, 229–236. [Google Scholar] [CrossRef] [PubMed]
  56. Wijnja, H.; Schulthess, C.P. Vibrational Spectroscopy Study of Selenate and Sulfate Adsorption Mechanisms on Fe and Al (Hydr)oxide Surfaces. J. Colloid Interface Sci. 2000, 229, 286–297. [Google Scholar] [CrossRef] [PubMed]
  57. Brechbühl, Y.; Christl, I.; Elzinga, E.J.; Kretzschmar, R. Competitive sorption of carbonate and arsenic to hematite: Combined ATR-FTIR and batch experiments. J. Colloid Interface Sci. 2012, 377, 313–321. [Google Scholar] [CrossRef] [PubMed]
  58. Wang, H.; Zhu, J.; Fu, Q.; Xiong, J.; Hong, C.; Hu, H.; Violante, A. Adsorption of Phosphate onto Ferrihydrite and Ferrihydrite-Humic Acid Complexes. Pedosphere 2015, 25, 405–414. [Google Scholar] [CrossRef]
  59. Khare, N.; Hesterberg, D.; Martin, J.D. XANES investigation of phosphate sorption in single and binary systems of iron and aluminum oxide minerals. Environ. Sci. Technol. 2005, 39, 2152–2160. [Google Scholar] [CrossRef] [PubMed]
  60. Liang, Y.; Wang, Z.; Xu, Z.; Li, S.; Luo, H.; Xu, C.; Cui, X. Highly-confined, micro-Sb/C@MXene 3D architectures with strengthened interfacial bonding for high volumetric sodium-ion storage. Appl. Surf. Sci. 2024, 651, 159234. [Google Scholar] [CrossRef]
  61. Zhai, K.; Huang, H.; Li, X.; Fu, C.; Long, H.; Wang, W.; Liu, C.; Xie, M.; Ma, D. 3D network and wrapping strategy derived loofah-like Sb@CNTs@C for high performance K+/Na+ storage. J. Alloys Compd. 2024, 976, 172953. [Google Scholar] [CrossRef]
  62. Zhao, Z.; Wang, X.; Zhao, C.; Zhu, X.; Du, S. Adsorption and desorption of antimony acetate on sodium montmorillonite. J. Colloid Interface Sci. 2010, 345, 154–159. [Google Scholar] [CrossRef] [PubMed]
  63. Liang, J.; Hu, Z.; Zhang, X.; Ai, Y.; Wang, Y.; Ding, K.; Gao, J.; Wang, J.; Niu, D.; Sun, H. Recovery of antimony using biological waste and stepwise resourcization as catalysts for both polyesterification and transfer hydrogenation. Colloids Surf. A Physicochem. Eng. Asp. 2022, 635, 128119. [Google Scholar] [CrossRef]
  64. Mishra, S.; Sankararamakrishnan, N. Characterization, evaluation, and mechanistic insights on the adsorption of antimonite using functionalized carbon nanotubes. Environ. Sci. Pollut. Res. Int. 2018, 25, 12686–12701. [Google Scholar] [CrossRef] [PubMed]
  65. Wang, Y.; Ji, H.; Lu, H.; Liu, Y.; Yang, R.; He, L.; Yang, S. Simultaneous removal of Sb(iii) and Cd(ii) in water by adsorption onto a MnFe2O4–biochar nanocomposite. RSC Adv. 2018, 8, 3264–3273. [Google Scholar] [CrossRef] [PubMed]
  66. Yang, X.; Shi, Z.; Yuan, M.; Liu, L. Adsorption of Trivalent Antimony from Aqueous Solution Using Graphene Oxide: Kinetic and Thermodynamic Studies. J. Chem. Eng. Data 2015, 60, 806–813. [Google Scholar] [CrossRef]
  67. Leng, Y.; Guo, W.; Su, S.; Yi, C.; Xing, L. Removal of antimony(III) from aqueous solution by graphene as an adsorbent. Chem. Eng. J. 2012, 211–212, 406–411. [Google Scholar] [CrossRef]
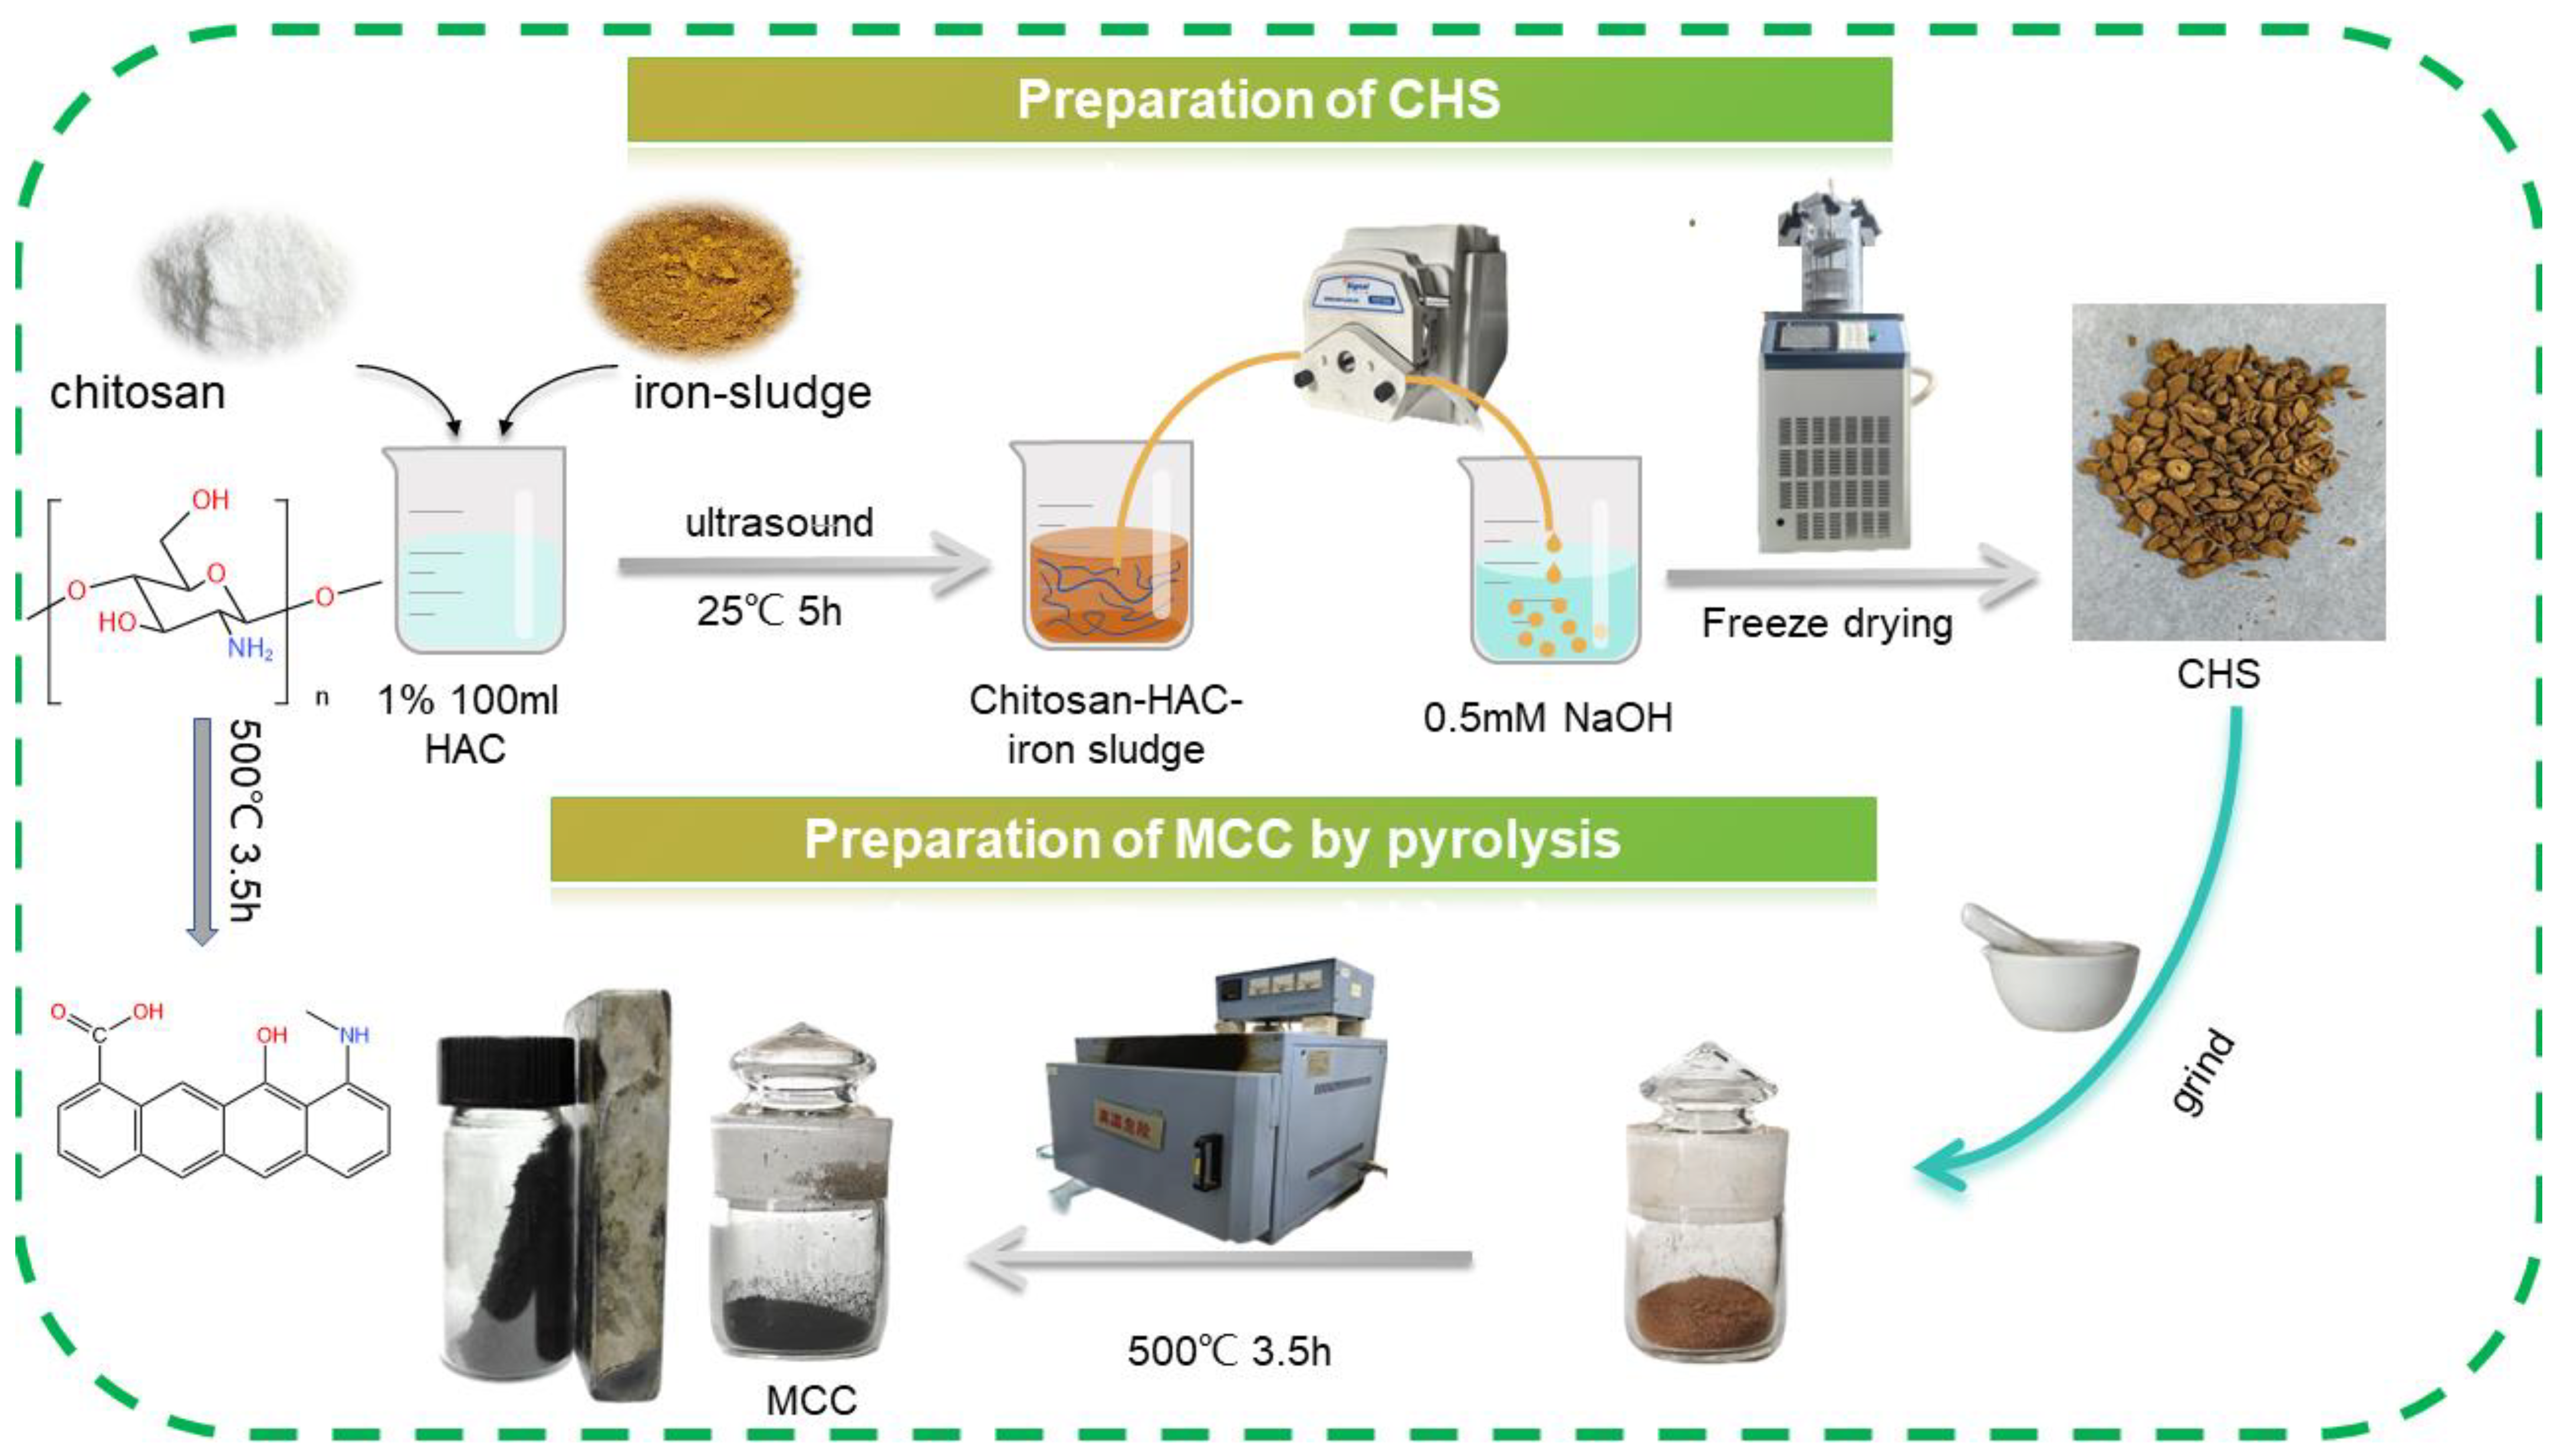
Figure 1. Schematic diagram of MCC preparation.
Sustainability 16 02788 g001
Figure 2. The digital electronic image (a); SEM with 10.0 K (b), 20.0 K (c), 50.0 K (d); EDS of C (e), N (f), Fe (g); N2 adsorption–desorption isotherm (h) and the diameter distribution (inset); the magnetic hysteresis loops (i) of MCC.
Sustainability 16 02788 g002
Figure 3. XRD pattern (a); FTIR spectra (b) of iron–sludge, chitosan, CHS, and MCC; the fitting of XRD spectra of CHS (c) and MCC (d).
Sustainability 16 02788 g003aSustainability 16 02788 g003b
Figure 4. The XPS survey scan spectrum (a); 80–240 cm−1 (b); C 1s spectrum (c); 290–295 eV (d); Fe 2p spectrum (e) of CHS, MCC, MCC–Sb.
Sustainability 16 02788 g004
Figure 5. The XPS spectra of O 1s for MCC (a); the XPS spectra of O 1s+Sb 3d for MCC-Sb (b).
Sustainability 16 02788 g005
Figure 6. The effect of dosage (a); pH (b); pHpzc (c); the effect of ionic strength (d); the presence of Sb at different pH (e); the state of MCC and CHS, after a 24-h of shaking in pH = 3 (f).
Sustainability 16 02788 g006aSustainability 16 02788 g006b
Figure 7. The effect of coexisting anions (a); recycle experiment without desorption (b); Sb(III) adsorption rate and desorption rate with MCC (c).
Sustainability 16 02788 g007
Figure 8. The adsorption kinetic (a); intra-particle model (b) of CHS and MCC; isotherm adsorption of MCC (c) and CHS (d) at 25 °C.
Sustainability 16 02788 g008
Figure 9. The adsorption mechanism of Sb(III) by MCC.
Sustainability 16 02788 g009
Table 3. Parameter of the isotherm adsorption model.
Initial ConcentrationLangmuirFreundlich
kLSD (kL)qmaxSD (qmax)R2kFSD (kF)1/nSD (1/n)R2
CHS0.5840.05324.9561.6510.9925.8630.8750.4400.0590.822
MCC0.1440.01438.2342.7510.9697.6070.4000.4130.0440.878
Table 4. The adsorption saturation capacity of Sb(III) by different adsorbents.
AdsorbentSSAThe Medicine for Preparation AdsorbentQm (mg/g)References
MCC52.63Chitosan, iron sludge38.234This study
Fe3O4/Fe2O3/CNs192.6FeCl3·6H2O, Fe3O4, carbon nanosphere234.3[44]
Fe2O3/CNs134.9FeCl3·6H2O, carbon nanosphere102.8[44]
CNT-I105.78CNT, KI200[64]
CNT-SH111.89CNT, HS(CH2)2OH140.85[64]
MnFe2O4–biochar30.38a tea branch, FeSO4·7H2O, KMnO4237.53[65]
BC/Fe3O4 Dried pomelo peel, FeCl3·6H2O FeSO4·7H2O246.19[63]
BC-γFe2O377.924Sludge, FeCl3·6H2O45.25[30]
Fe3O4 Fe3O419.9[55]
GO315.6GO36.5[66]
graphene2630graphene8.056[67]
Disclaimer/Publisher’s Note: The statements, opinions and data contained in all publications are solely those of the individual author(s) and contributor(s) and not of MDPI and/or the editor(s). MDPI and/or the editor(s) disclaim responsibility for any injury to people or property resulting from any ideas, methods, instructions or products referred to in the content.