Abstract
The use of a circular economy (CE) in a supply chain is conducive to remanufacturing. It can not only make the supply chain innovative but can also further ease resource consumption and lower pollution, thereby reducing carbon emissions. However, most current research remains focused on the concept of integrating circular economy supply chains (CESCs); few studies have carried out practical research in industry, and research addressing issues regarding the rubber recycling industry is even rarer. Therefore, this study refined the existing framework by screening out key factors that a CESC applies to remanufacturing products. This study conducted an expert questionnaire survey using the FDM to select key factors. Since the 30 respondents selected for this study are all experts in related fields, the reliability and stability of the method and results can be ensured. Meanwhile, this study adopted the fuzzy DEMATEL method to rank the importance of the five selected aspects and nineteen criteria and clarified cause-and-effect relationships between the criteria. The results show that important aspects, including “the circular business model” and “enhancing the resource value in the supply chain”, are both classified as cause groups; there are four main criteria that need to be highlighted, namely, “optimizing the production process”, “effectively tracking and recycling products”, “redesigning remanufactured rubber products”, and “improving resource efficiency”. Therefore, when related industries build CESCs to manufacture remanufactured products, these criteria need to be considered first. This study combined a CESC with remanufactured products, constructed a new framework to expand the related literature, and further analyzed the rubber industry and the underlying rubber recycling industry. Accordingly, related industries can refer to the new framework and key factors to develop production strategies for remanufactured products when implementing a CESC.
1. Introduction
Rubber represents a type of material that significantly influences our environment, society, and economy, and it is indispensable in present-day life [1]. Statistically, the United States population accounts for 4% of the world’s population, while its generated waste occupies 12% of the world, amounting to about 230 million tons. However, the waste recycling rate of the United States still falls behind compared to other countries in the world. Rubber-related waste accounts for 15% of total waste [2]. However, there are no United States manufacturers that want to take over these types of waste, and still-valuable plastic–rubber compounds are sent directly to landfills or incinerators [3]. According to statistics, the global demand for tires in 2022 was as high as 3.2 billion. As the demand increased, the number of waste tires also rose. But among these waste tires, only 15–20% was reused, while the rest were not properly recycled [4]. It can be seen from the data that a significant amount of waste was not treated well. Gumede et al. [5] pointed out that the accumulation rate of rubber waste far exceeds the recycling rate, and the proportion of waste that can be recycled is too small. Despite huge potential in the recycling and reuse of these rubber products, manufacturers may be deterred by a high technical threshold. In past studies, numerous scholars established different recycling methods. Nonetheless, the demand for recycled rubber products continues to increase, which has repeatedly urged manufacturers to adopt more circular and less toxic methods to solve the problem.
A circular economy (CE) can make products, materials, and resources more valuable and minimize waste generation. Not only can it promote innovation, eliminate waste, and improve resource efficiency but it also balances sustainability and the economy [6]. In the CE model, resources can be reused, repaired, restored, and recycled so that waste can create value multiple times and then be used rationally and effectively [7]. From a broader perspective, the CE model manages waste in the supply chain, which allows waste to continuously keep its usable form in a product’s lifecycle [8]. Buadit et al. [9] also stated that rubber waste can be used as a material for other production forms, thereby encouraging the promotion of the CE model and urging the remanufactured product supply chain to move toward sustainability [9]. Both Hu et al. [10] and Vegter et al. [11] indicated that supply chain management can be overlapped, using a CE to dispose of and recycle scrap products and increase their recycling value. There is a great diversity of waste rubber remanufactured products. If waste rubber products are regarded as cheap raw materials for other innovative products, then it is feasible to use waste rubber as a material for remanufactured products in the supply chain to realize a CE [12].
Araujo-Morera et al. [7] reconsidered the current industrial production system based on the CE model and focused on scrapped tire rubber, proposing a redesign using renewable resources, reducing material use, and remanufacturing tire retreading, all of which can allow the CE to operate better in the tire rubber industry. But since it is a successful application of the project type, if we want to look at it from a broader perspective, we need to expand its advantages so that it can be used more appropriately. Hu et al. [10] developed an incorporated supply chain management system used for waste tires. They considered the waste tire lifecycle, divided the supply chain into three stages, and identified thirteen obstacles from them. However, their research focused only on waste tires. Therefore, this study expands its scope and takes the entire rubber recycling industry into account. Based on the CE model, Araujo-Morera et al. [7] expanded the new concept of tire rubber material scrapping and explained each hierarchical structure strategy’s advantages and disadvantages but did not further analyze the advantages and disadvantages sorted by importance.
According to research carried out by Gunasekara et al. [13], the transformation of a CE and the success of its practice depend on whether a CESC is effectively implemented. Zhang et al. [14] and Gebhardt et al. [15] indicated that the potential for recycling is ranked the highest, while the potential for remanufacturing is ranked second; at the same time, their studies also pointed out that the practical aspects of remanufacturing are too few for reference. Consequently, although the practice of remanufacturing is profitable, it still faces multiple obstacles. In research by Amir et al. [16], a CE was used in a supply chain. They also proposed that the current supply chain-related framework lacks a systematic approach, and the CESC has such complex characteristics that it requires discussion from multiple angles. In addition, Zhang et al. [14] and da Silva et al. [17] also suggested that appropriate circular indicators must be formulated at the product and supply chain levels to effectively manage the CE. Therefore, this study integrates the past literature, incorporates the CE model and supply chain into a framework applicable to remanufactured products, offers definitions in detail, and proposes implementation aspects and criteria.
To understand the key factors for the implementation of a CE and a remanufactured product supply chain in the rubber recycling industry, this study uses the fuzzy Delphi method (FDM) to select key factors and perfect the effective structural barriers originating from the literature and measurement properties for validating qualitative information and language preference [18]. Next, the fuzzy DEMATEL approach is adopted to understand cause-and-effect relationships between key factors [19]. This study discusses and explores the following research aims:
RQ1: Identify a CESC framework for remanufactured products in the rubber recycling industry.
RQ2: Identify key aspects and criteria for remanufactured products in the rubber recycling industry.
RQ3: Identify the importance ranking of key aspects and criteria.
This study accomplishes these research aims and makes the following contributions: (1) it constructs CESC aspects and principles to expand the literature on the CESC for remanufactured products in the rubber recycling industry; (2) it provides professional expert data, determines the most effective aspects and criteria, and proposes theoretical implications based on them; and (3) it provides practical management implications which help enterprises implement CESCs more effectively and accurately. This study can help decision makers make more effective management decisions and realize sustainability based on importance when implementing a CESC.
This study’s other parts are divided into five chapters. Section 2 demonstrates the CE, the supply chain, and remanufactured products and tabulates aspects and criteria. Section 3 discusses the industry background of this study and provides a clear introduction to the applied methods. The research results and a discussion of this study are presented in Section 4 and Section 5. Finally, the conclusion and suggestions are provided in Section 6.
2. Literature Review
2.1. Circular Economy Supply Chain (CESC)
A CESC is mainly employed to comprehensively innovate supply chain functions by reducing the consumption of resources and energy, lessening pollutant discharge, systematically storing materials, regenerating biomaterials, and constructing an ecosystem responsible for society. Ultimately, productivity and profitability are enhanced in order to achieve a vision of zero waste and reach an optimal balance among economic, social, and environmental benefits [20,21]. Remanufacturing is a key factor of the CE model. It can slow down resource consumption, reduce pollution and solid waste, and further lower carbon emissions. Then, a CE can be formed via high-quality remanufacturing [22,23]. Mhatre et al. [24] pointed out that implementing a CE in a supply chain is conducive to remanufacturing. Therefore, when waste products are inputted as production materials and enter the supply chain to conduct remanufacturing [22], a CESC can be realized, and the goal of zero waste can be achieved as well. When an industry can carry out value recycling across different supply chains as well as integrate and coordinate supply chains to realize material recycling, it can then exhibit a higher level of CESC and raise its competitiveness and performance [14].
Adopting a CE in a supply chain can keep the use of products and materials in the production line at a higher level of efficiency so that materials and products can be kept in circulation for the longest time [25]. Additionally, the use of resources can be minimized, carbon dioxide emissions can be lessened, social benefits can be leveled up with more eco-friendly products, and, finally, the environment can be better protected [21]. Ansari et al. [26] also proposed that adopting a CESC is an approach to sustainable development which can help generate economic, social, and environmental benefits, save energy, lessen emissions, and ultimately enhance profitability. When companies adopt CESCs, they can decrease carbon emissions in the production process as well as offer environmental benefits [14]. Alternatively, they can cooperate with other organizations to gain more value from waste recycling [27], and waste can also be used as an alternative resource for making new products as well as to create new business opportunities while protecting the environment [28].
Singhal et al. [29] identified and evaluated key factors for remanufactured products in a CE, and they provided insights when manufacturers were about to design remanufactured products. Regarding studies conducted by Zhang et al. [14] and Gebhardt et al. [15], they reviewed and integrated a CESC and discovered a gap between research and practice as well as a state in which too few empirical studies resulted in a serious decoupling of academia and practice. Meanwhile, they also explored possible future directions for CESCs. In addition, their research results showed that the potential of recycling is the highest, whereas the potential of remanufacturing ranks second. Their research suggested that multiple obstacles were still encountered since there were too few practical aspects of remanufacturing for reference, even though the remanufacturing practice was profitable. Therefore, Amir et al. [16] implemented a CE in a supply chain and discussed it after combining findings from the literature and actual cases, verifying the applicability and practicability of the CESC framework proposed by their study. Indeed, their study proposed that the current supply chain-related framework lacks a systematic approach and found that the CESC has overly complex characteristics and needs to be explored from multiple perspectives.
Gunasekara et al. [13] also pointed out that the transformation of the CE model and the success of its practice depend on whether CESCs are effectively implemented. They recommended that the life cycle of a product can be split and studied, and each part can be analyzed to promote the practice of using a CESC. In addition, insufficient shared data in the supply chain can limit the implementation of the CE model. Nevertheless, from a long-term perspective, the CE model is a major key point for sustainable solutions. However, the current literature lacks studies on specific strategies that can effectively promote data sharing and the timely sharing of data [17]. This study believes that this will be a key factor in promoting CESCs for remanufactured products. Chen and Huang [30] also addressed that the current uncertainty in CESCs mainly comes from information asymmetry between companies, which makes it difficult for companies to make decisions. Zhang et al. [14] also indicated that appropriate circular indicators must be developed at the product and supply chain levels to effectively manage a CE. Therefore, this study integrates the past literature, incorporates the CE model and a supply chain into a framework suitable for remanufactured products, offers definitions in detail, and proposes implementation aspects and criteria.
2.2. Proposed Methods
The FDM was developed by Murray et al., combining fuzzy theory with the Delphi method to conduct an analysis [31]. Compared with the traditional Delphi method, the strength of the FDM is that it can reduce the number of expert investigations, explicitly reveal expert opinions, and consider the uncertainty of the collected data [31,32]. The FDM can verify indicators with a level of judgment through experts’ language preferences, which can not only reduce the ambiguity of an expert evaluation but also ensure the quality of the results [18]. Additionally, Chen et al. [33] propose that the FDM’s strength is that it can shorten the time required for experts to make decisions as well as eliminate less important qualitative information and subjective preferences at the same time.
The Geneva Research Center put forward the DEMATEL method, which is helpful for discovering relationships between standards. However, using only the DEMATEL method was not enough to control the uncertainty of data, so the fuzzy set theory was suggested to help explain and judge the uncertain environment related to fuzziness [34]. The fuzzy DEMATEL method expounds causal relationships between attributes by computing the weight of each attribute [35]. Consequently, this study first used the FDM to select key factors, determined the key factors, and then used the fuzzy DEMATEL method to determine cause-and-effect relationships between indicators and their importance rankings.
2.3. Proposed Measures
In the remanufacturing process, information sharing (A1) is an important part because waste cannot be ordered like ordinary materials. If real-time information cannot be obtained, the cost of remanufacturing increases [30]. Therefore, digital twins (C1) can be used as a solution to information asymmetry. When a company can establish a database for data integration (C4), the company can analyze data according to its own needs as well as optimize the production process (C3) [33]. In addition, the company can carry out the effective tracking and recycling of products during the remanufacturing process (C6). Companies can also apply big data to handle large and rapidly generated data (C2) and share data on the product lifecycle (C5); this is a promising remanufacturing model that can manage the remanufacturing process more meticulously [36]. From an operational perspective, although remanufacturing can preserve product value, it complicates inventory management and makes shared information uncertain. Hence, optimizing inventory strategies (C7) can lift the flexibility of the CESC to prevent the supply chain from being disrupted [37].
The original components which make remanufactured products are used repeatedly. If customers have doubts about the condition of the components, they avoid risks when purchasing. In order to better sell remanufactured products (A2), information about product quality can be disclosed to customers (C11) so that customers can understand the service records of remanufactured products (C10). When customers’ willingness to pay for green responsibility is high (C9), they are willing to buy greener products. Information gained from tracking and recording components’ lifecycles (C8) can help resolve customers’ mistrust in the quality of remanufactured products. When customer demand shifts from conventional products to remanufactured products, members participating in the CESC can make more flexible pricing decisions (C12) to strengthen cooperative relationships between members as well as soften downstream competition [38]. To better sell products, remanufacturers use business strategies driven based on material usage efficiency in the CESC, which can keep materials and outputs in the chain for a longer circulation time (C13) while simultaneously maintaining their value [25,27].
Although CESCs have many environmental and economic benefits, there are still many obstacles posed by risks which prevent them from functioning normally. CESC risk management (A3) aims to ensure that the supply chain is not destroyed by obstacles. Nevertheless, the critical challenges of remanufacturing are the stability of output and supply (C14) and the maintenance of product quality (C15). These risks make CESCs unstable and cause many problems related to quality and performance [39,40]. Therefore, companies can offset these loopholes by selecting the most acceptable risk solutions through appropriate de-risking measures, risk assessment, or risk control, such as carbon reduction programs, enabling managers to quickly deploy resources (C16), and exploring the possibilities of alternative raw materials (C17), all of which can prevent or mitigate the likelihood of supply chain disruption. Furthermore, different companies’ cooperation can boost the effectiveness of implementing a CE, make reuse and remanufacturing a feasible solution, and effectively manage supply chain risks [38,41,42].
The circular business model (A4) mainly focuses on creating value by slowing down, strengthening, and closing material loops. In order to better develop recycled and remanufactured products, companies must develop capabilities specific to CESCs (C18), such as recycling energy from waste products through new waste-treatment technologies [43]. New capabilities can create a new sustainability culture (C20) for companies, build a suitable environment, and develop approaches to circular-manufacturing-oriented decision making and governance. When a company redesigns a remanufactured product (C22), it needs to adopt CE principles and turn to a more sustainable direction. In the meantime, the correct implementation of a life cycle assessment (C21) can reduce material consumption and decrease the use of toxic materials during the production process or standardize it, which can provide a new framework or action plan for subsequent remanufacturing [43,44]. However, consumer acceptance (C19) is a key factor in remanufactured products. Consumer willingness to purchase remanufactured products is relatively important. If companies can provide the manufacturing processes and histories of products to customers, it can contribute to follow-up marketing and also build positive attitudes toward potential customers [37,44].
In addition to reducing waste generation, a CE can also reuse and recycle waste [43]. There are many benefits to accepting a CESC, one of which is that it can better improve resource value in the supply chain (A5). Strategies of the supply chain are considered to encourage remanufacturing, increase resource efficiency (C26), and optimize the use of materials by reducing waste and using cost-effective waste products. Before entering a CESC, manufacturers need to identify waste composition and separate materials (C23) since harmful components in rubber are likely to increase environmental burdens; thus, this preliminary task is also relatively important [40,44,45]. Additionally, the supply chain also plays a crucial role in curbing the flow of waste into the environment. Not only can it establish an infrastructure which supplements logistics (C24), but it can also restore the value of returned products (C25). Consequently, apart from meeting economic and social goals, an efficient CESC can also decrease the effect on the environment. Meanwhile, integrating collaboration and competition (C27) into the remanufacturing system can optimize the system and help decision makers maximize benefits. Moreover, better strategies for adjusting organizations can also satisfy customer demand [40,46].
With development toward a CE, the recycling of products, components, and materials has also received much attention. The reverse logistics of remanufactured products (A6) is the main driving force for material circulation flow, facilitating the return of remanufactured products to the CESC and carrying out value extraction many times. In particular, the material composition (C28) of a product is one of the most primary characteristics in reverse logistics. When it becomes easier for a company to use these components in their next product, both a value chain analysis (C29) and a cost–benefit analysis (C30) can improve the process of reverse logistics, rethink the value chain to prolong a product’s lifetime, or reduce costs and create value via re-evaluating the value of remanufactured products. When a company monitors and evaluates the performance of remanufacturing reverse logistics (C31), it may lead to an increase in profitability (C32), thereby constituting a competitive economy and providing market advantages for manufacturers [8,47].
3. Methods
3.1. Industry Background
The rubber recycling industry can safeguard environmental ecology, lower the cost of purchasing industrial raw material, and recycle and reuse resources. Apart from its contribution to environmental benefits, it also assists in the development of the industrial economy. Therefore, it can be expected that recycling usable waste and developing resource regeneration will be highlighted. Additionally, the rubber industry achieves the lowest environmental impact factor for sorting and classification, which also provides a great boost to environmental protection. Remanufacturing is economical and eco-friendly, though it has specific technical thresholds. Furthermore, due to the high cost of manufacturing technology, it cannot be implemented smoothly if there are not sufficient funds [23].
According to statistics released by Taiwan’s government, 11,238,654 metric tons of waste was produced in Taiwan in 2022, of which only 6,570,024 metric tons could be recycled, accounting for only 58% of the waste; additionally, the recycling rate of rubber waste amounted to 0.8% of all waste [48]. Therefore, the current problem which Taiwan’s rubber recycling industry is facing is that too much rubber waste is produced nationwide every year with too few companies possessing technologies that can dispose of it. As a result, most of Taiwan’s rubber waste is sent to incinerators, and negative effects generated by incineration continuously increase environmental burdens.
3.2. FDM
This study proposed an FDM combining the fuzzy set theory and the Delphi method to solve the ambiguity of human subjective judgments and preferences in complex decision-making situations [18,49] and adopted expert opinions to refine indicators. The FDM can diminish the number of responses; meanwhile, it ensure that expert opinions are valid assessments as well as turn ambiguous assessments into precise numbers. In this study, a total of 30 experts were selected to fill out the questionnaire. The experts who answered the questionnaire were all professionals in related fields so that the reliability and stability of the method and results could be ensured. Basic information about the experts is shown in Table 1.

Table 1.
Information about experts.
This study selected 30 experts in related fields. The analysis process started with expert a, and the measured value of index b is , where a = 1, 2, 3,…, n; b = 1, 2, 3,…, m. Because the weight of jb is b, it is expressed as , where and ; then, . After that, qualitative information about the experts was transformed into triangular fuzzy numbers (TFNs), as shown in Table 2.
Table 2.
Transformation table of linguistic terms for FDM.
The convex combination value Db is calculated by as follows:
However, is modified from 0 to 1 according to expert opinions; in general, it is designated as 0.5, and the value of Db is expressed as follows:
The above is marked as the positive balance of the final expert evaluation, and the threshold of the refined effective index is calculated by . When , the indicator b is accepted; otherwise, it needs to be deleted.
3.3. Fuzzy-Decision-Making Trial and Evaluation Laboratory (FDEMATEL)
In uncertain circumstances, the fuzzy set theory transforms language into quantitative data; the DEMATEL method mainly constructs causal relationships between indicators in complex situations. The fuzzy DEMATEL method adopts defuzzification technology to convert FTNs into clear values. The fuzzy membership function is employed to calculate the total weighted value. Therefore, the minimum and maximum fuzzy numbers are used to calculate the left value and the right value, and then the clear values are applied to the total direct relationship matrix in the graph to simplify the analysis results. In the graph, the interrelationship structure contains specific indicators, which is an important way of representing the structure, and a set of indicators is displayed as to perform a pairwise evaluation and create connections.
The language scale of this study ranges from low influence to very high influence to accumulate clear values, as displayed in Table 3. This study assumes that k experts perform assessments; then, represents the influence fuzzy weight of the index estimated by the expert on the index.
Table 3.
TFN linguistic scale for fuzzy DEMATEL method.
The fuzzy number is abbreviated as:
where maxmin e. The normalization of the left value (lv) and the right value (rv) is conducted as follows:
The total normalized clear value (cv) is calculated as follows:
The sum value is symbolized to gather the individual insights of k experts and then carried out in the following way:
Next, a pairwise comparison is made to obtain an initial matrix of the direct relationship , where represents the effective level of indicator i to indicator j, and the adjustment is . The normalized direct relationship matrix (U) is expressed as follows:
Then, the correlation matrix W is obtained using the following method:
where W is . The driving value (α) and the dependent value (β) from the correlation matrix of the row value and column value are summed using the following method:
From the correlation diagram obtained from , the indicators are placed to form horizontal and vertical vectors in sequence. The indicators are also divided into a cause group and effect group according to their positive and negative values. Among them, represents the importance of an indicator, and the larger it is, the more significant the indicator is. This study used the mean of to classify critical cause-and-effect indicators that require attention.
As mentioned above, this chapter describes the FDM and FDEMATEL analysis methods in order to determine the key factors and cause-and-effect relationships of aspects and criteria. This study was conducted with the assistance of 30 experts in rubber-related fields. The experts filled in the expert questionnaire based on their experience and knowledge. The analysis steps are described below:
- (1)
- Conduct a systematic literature review to identify possible CESC aspects and criteria and then use these aspects and criteria for an initial set of FDM evaluations.
- (2)
- Form an FDM expert questionnaire based on the above step and let 30 experts fill out the questionnaire. The FDM uses Equation (1) to obtain the values of lb and ub, which are the upper and lower limits. Next, Equation (2) is used to obtain the final value of Db.
- (3)
- Create an FDEMATEL questionnaire based on the FDM results and then invite the same group of experts to conduct interviews and fill out the questionnaire. A data analysis uses Equations (3)–(6) for defuzzification.
- (4)
- Equation (7) is adopted with the defuzzified data to determine the normalized direct relationship matrix and Equation (8) to calculate the total mutual relationship matrix.
- (5)
- Confirm the final importance ranking using Equations (9) and (10); () is the horizontal axis value, while () is the vertical axis value. These values can form a cause-and-effect diagram. This study replaces with D and with R.
4. Results
4.1. FDM Results
This study proposed six aspects and thirty-two criteria as initial attributes. Then, this study converted the expert language into corresponding TFNs. The results of the data analysis of the aspects are shown in Table 4. Next, weights were calculated based on the upper and lower limits of each indicator to form a threshold to refine and develop effective attributes, which is step 2 of the analysis. The threshold of the aspect is , so only the aspect “Adopt blockchain” (A2) is deleted.
Table 4.
FDM results for aspects.
Additionally, the results of the data analysis of the criteria are shown in Table 5, and the threshold is . Therefore, among the 32 factors, a total of 19 key factors are accepted, and the rest are deleted.
Table 5.
FDM results for criteria.
Based on the FDM analysis data, this study screened out five key aspects and nineteen key criteria. The final results are shown in Table 6.
Table 6.
Valid hierarchical model.
4.2. FDEMATEL Results
In the FDEMATEL analysis of this section, following Step 3, Equations (3)–(6) were first used for defuzzification in order to clarify the uncertainty and convert the language preferences into clear values. The initial direction matrix of the aspects is shown in Table 7.
Table 7.
The initial direct relation matrix of aspects.
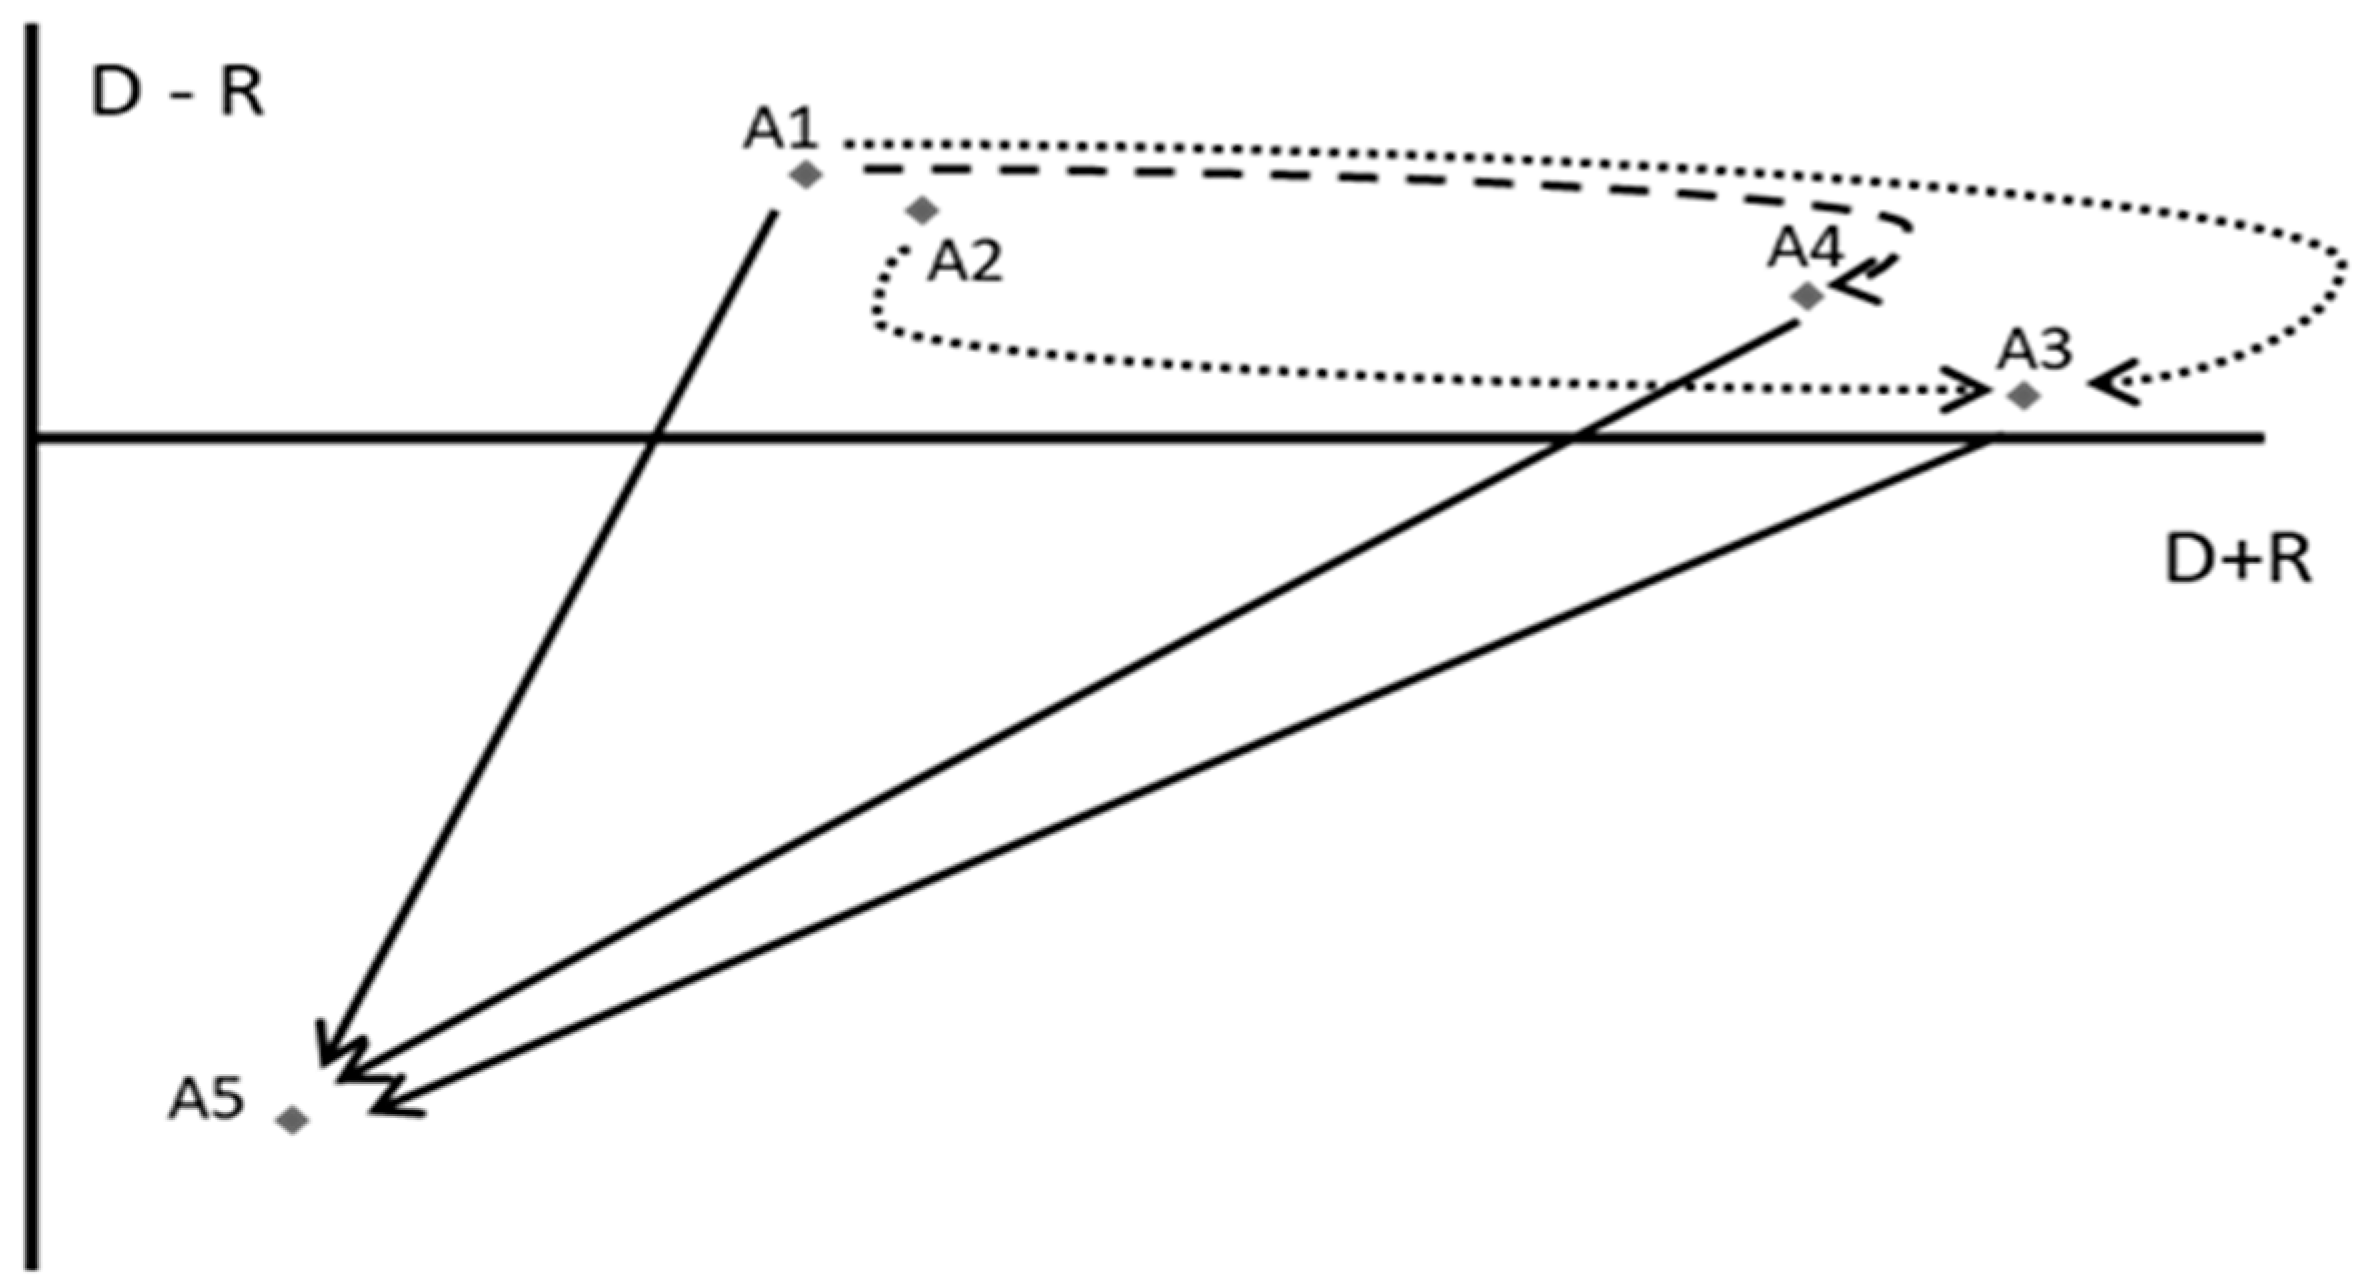
Subsequently, a total interrelationship matrix for the aspects was constructed, and the mutual cause-and-effect relationships of the aspects were inspected as well. Finally, D+R and D−R were used to classify the aspects into an effect group and a cause group, as displayed in Table 8 below. Figure 1 depicts a cause-and-effect model with four aspects: information sharing (A1), CESC risk management (A2), the circular business model (A3), and increasing the value of resources in the supply chain (A4), all of which are classified into the cause group, while the reverse logistics of remanufactured products (A5) is classified as the result group. The solid line in Figure 1 represents the largest impact, the dotted line represents moderate and mild impact, and the direction of the arrow indicates the affected aspect.
Table 8.
Interrelationship matrix of aspects.

Figure 1.
The aspect cause—and—effect diagram.
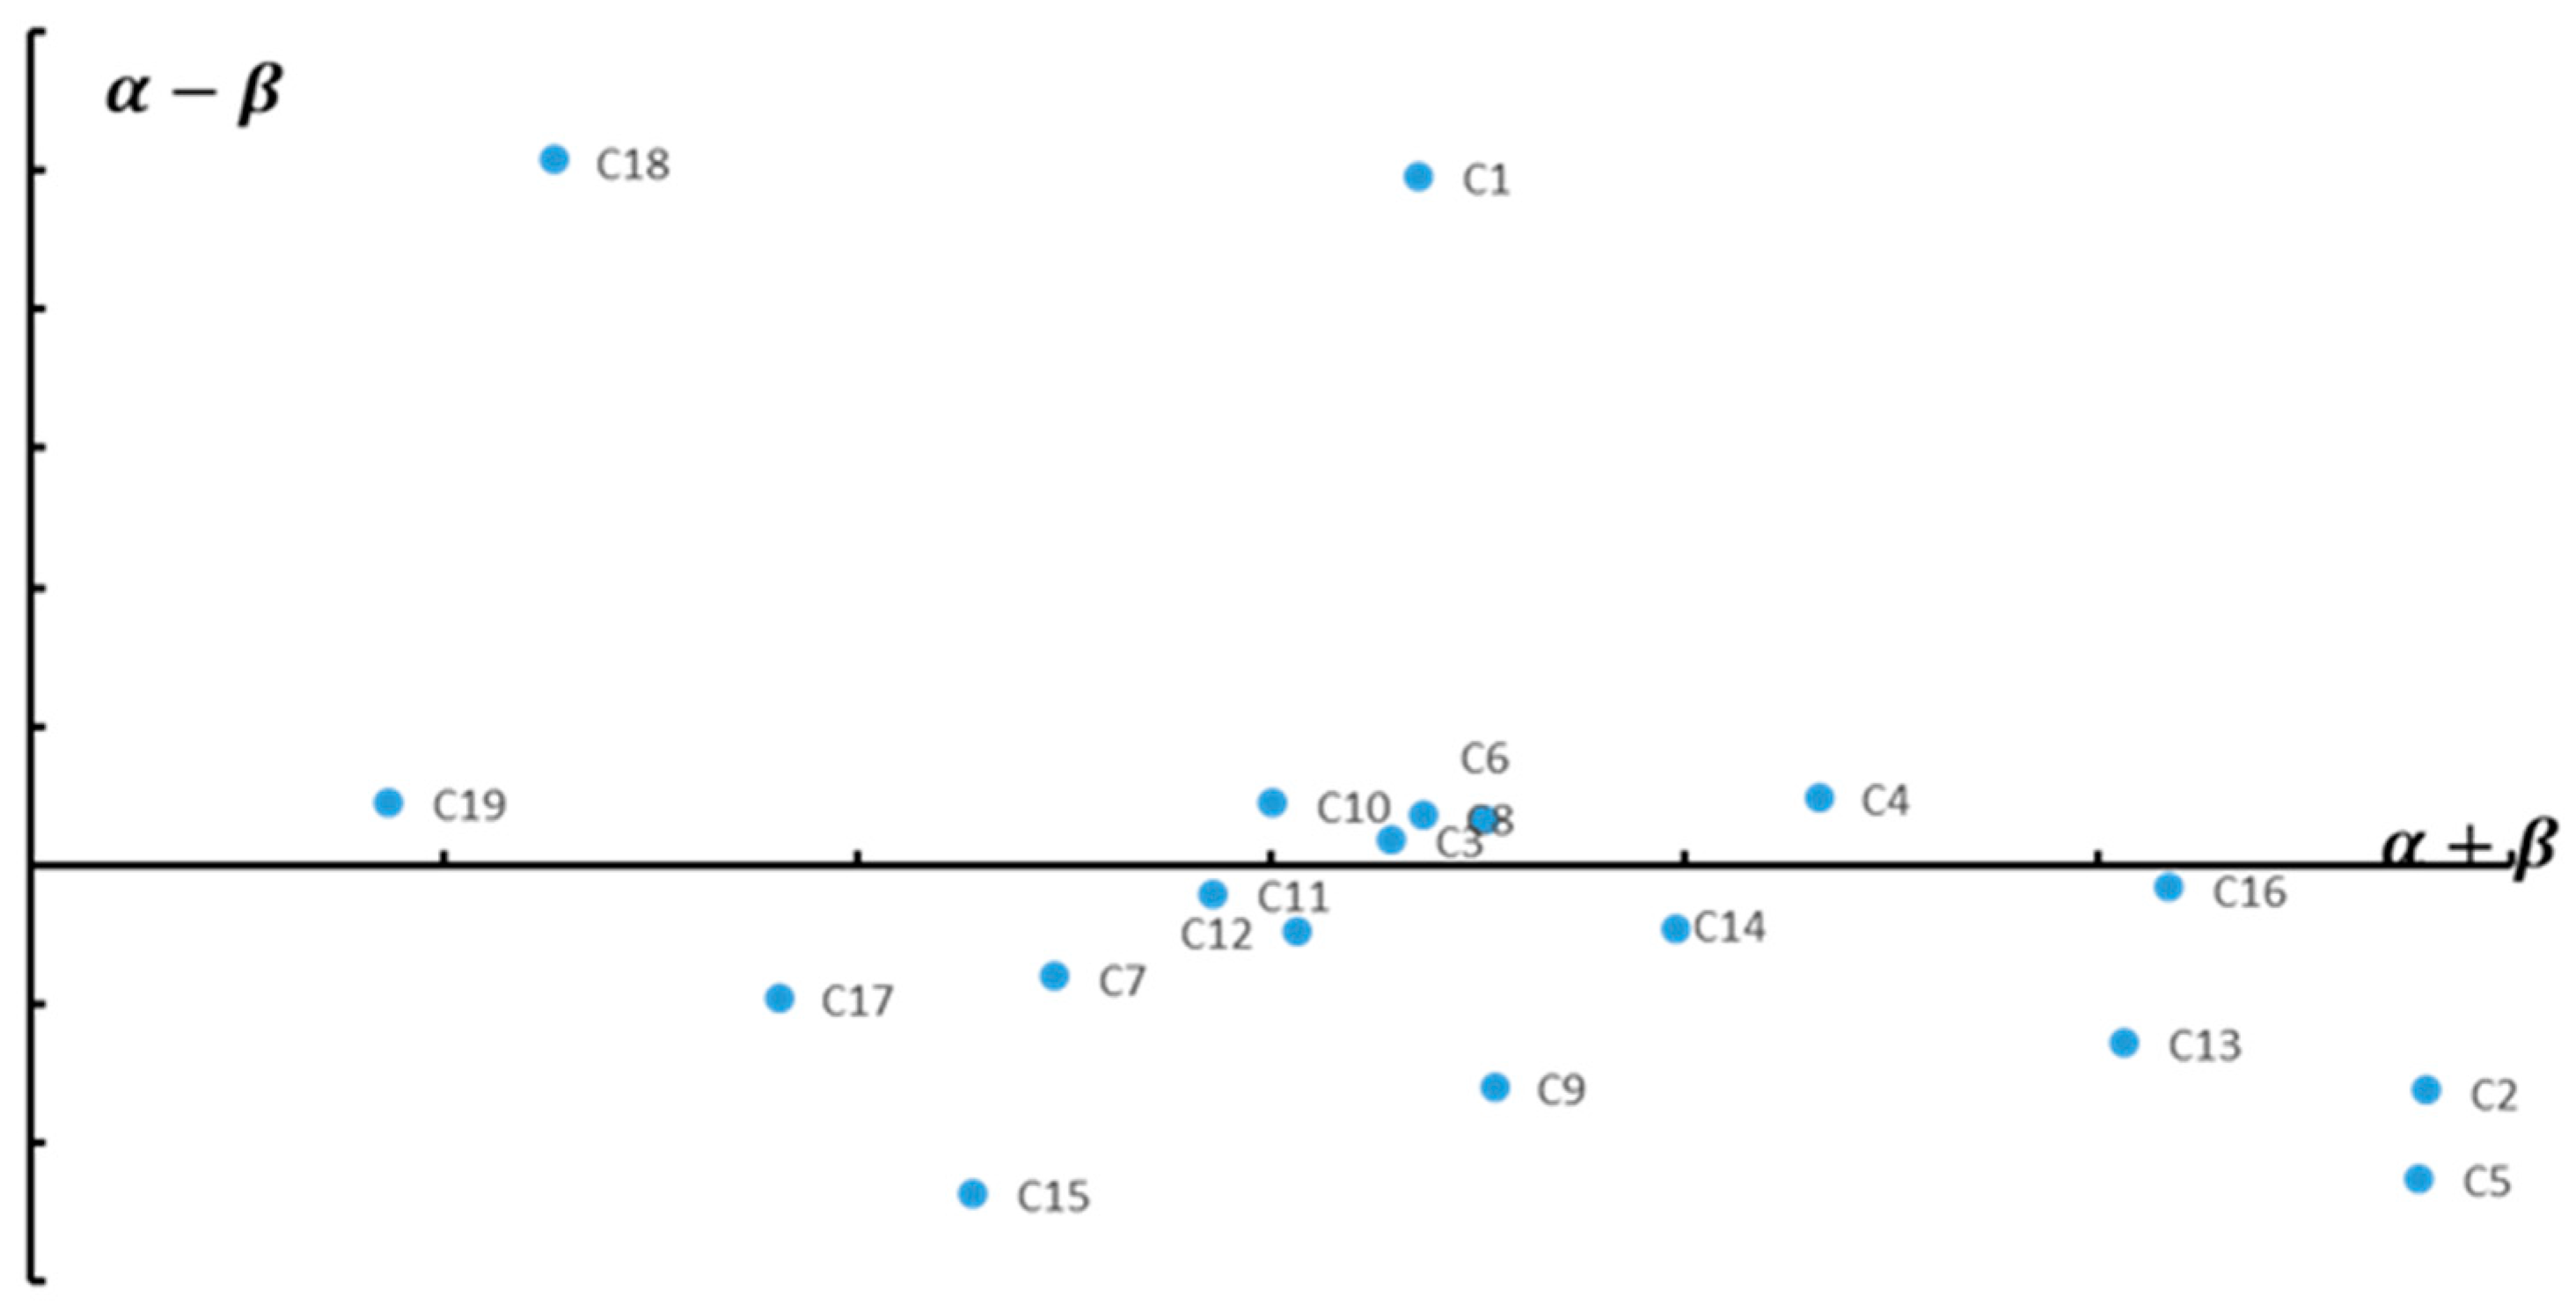
Similar to aspects, criteria were calculated using the matrix, following Steps 3 and 4, and the cause-and-effect relationships between criteria are shown in Table 9. In these criteria, optimizing the production process (C2), sharing data on a product’s lifecycle (C4), effectively tracking and recycling products (C5), redesigning and remanufacturing products (C13), enhancing resource efficiency (C15), and identifying waste composition and separating materials (C14) are the most important ones. In addition, C2, C3, C7, C9, C11, C12, C13, C14, C15, C16, and C17 are classified into the effect group, while C1, C4, C5, C6, C8, C10, C18, and C19 are in the cause group. The cause-and-effect diagram is depicted in Figure 2.
Table 9.
The cause-and-effect relationships between criteria.
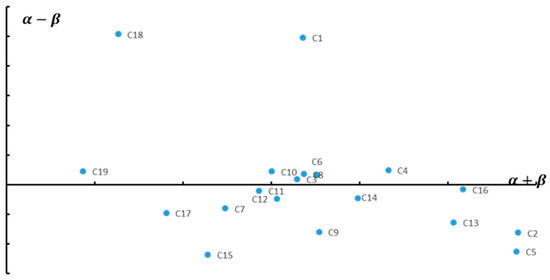
Figure 2.
Cause-and-effect diagram of criteria.
5. Discussion
5.1. Theoretical Implications
This study expands the CESC used in the rubber industry for remanufactured products and makes clear definitions and measures with six aspects so that the rubber recycling industry can have clearer and practical measures for reference when reusing its CESC.
First of all, the most important aspect is the circular business model (A3). When the rubber recycling industry wants to apply a CESC to remanufactured products, it is necessary to build a new circular business model first. When constructing a new model, the company must develop the capabilities extended by the CE model so that it can better develop remanufactured products when the circular business model is formed. This new process fosters a culture of development because most companies use it [37], forming an atmosphere and even an institutional pressure while sending a message to other companies that do not apply a CESC so as to urge the management of the companies to adopt the CESC together. This non-economic factor, which is helpful for the environment, helps companies implement a circular business model. The new model also brings new job opportunities because it means that the company needs to redesign its process so that the CESC can be better implemented. In this case, the company needs talents with professional knowledge to achieve better development [44].
When a company adopts a CESC, it can better improve the value of resources in its supply chain (A4). Therefore, when a company can effectively use the resources in the CESC, it can reduce the amount of energy used. At the same time, it can also reduce waste generation, and environmental burdens also are lowered [11]. The CESC can make remanufactured products develop a greater value, which can be captured and developed in a better way. In addition to reducing the generation rate of waste and improving sustainability, it can also improve social and environmental benefits [45]. Moreover, integrating collaboration and competition into the system of remanufacturing products can not only optimize the system but also enable an organization to rethink strategies, promote coordination and integration, and ensure that information, materials, and resources all flow efficiently and effectively in the CESC. Furthermore, it can also urge the integration of suppliers and consumers with the company, deepen the degree of cooperation, and construct more efficient processes to create more value [40].
Risk management for the CESC (A2) can help a company choose the most suitable solution, plan the solution quickly and efficiently, and eliminate loopholes [40]. When a company implements a CESC, it is necessary to thoroughly evaluate and prepare solutions to deal with possible obstacles that may arise. These obstacles make a CESC unstable [39], resulting in many problems and affecting the subsequent CESC, such as the quality, output, or performance related to remanufactured products. Therefore, through these assessments, the company can carry out risk control and prevent the interruption of the CESC. The stability of the CESC is relatively important for the sustainable operation of the company. If the CESC is interrupted, it may lead to insufficient production and supply, which means low levels of utilization of resources such as waste products; conversely, it may also result in an extremely low return on investment and affect subsequent operations [39,42].
This study started to conduct research in response to the overly low recycling rate in the rubber recycling industry. This study demonstrates that when the rubber industry wants to make remanufactured products, the CESC is a major focus. When a company can use the concept of the CE to develop new capabilities, then it can form a new circular business model and better manage the risk of the CESC. Additionally, it can also better use the resources in the CESC so that it can stay in the CESC for a longer period of time.
5.2. Practical Implications
This section discusses several key factors that the rubber recycling industry needs to take into account when using a CESC in remanufacturing products, including the following five items: optimizing the production process (C2), sharing data on the product lifecycle (C4), effectively tracking and recycling products (C5), redesigning and remanufacturing products (C13), enhancing resource efficiency (C16), and identifying waste composition and separating materials (C14). Then, management implications are provided to the industry for reference.
Since waste products cannot be ordered like ordinary raw materials, it is not conducive to the entire remanufacturing process if relevant information about waste products cannot be controlled. Therefore, in order to optimize the production process (C2), the company may consider introducing a database to obtain real-time information about scrap products, thereby diminishing the defect rate of the products. Also, because collecting and remanufacturing scrap products is a dynamic process, failing to grasp this information enables the CESC to increase cost when producing remanufactured products, and it is not beneficial to companies in the rubber industry that intend to expand the production lines of remanufactured products. It is even possible to interrupt an operating CESC. Therefore, if the industry wants to optimize the production process, this preliminary task must be completed first. In addition, eliminating production equipment with low levels of efficiency and high energy consumption is also a method. Using updated product manufacturing technology can increase production efficiency as well as the rate of resource reuse; meanwhile, it can also reduce the waste generated in the production process, thereby cutting the consumption cost and increasing income. As to how to make the production process more perfect, this study believes that automation technology and digital production equipment can be introduced into the standardization of the production process; then, the entire production line can be upgraded, which can not only reduce the mistakes caused by human beings but also increase the yield of products and boost product quality at the same time.
Similarly, sharing data on a product’s lifecycle (C4) is also an important measure of implementation when companies want to make more accurate decisions. The benefit of these data is that they enable various departments and organizations to achieve collaborative operations. Another effective model is to integrate product lifecycles into the entire CESC for stakeholders. This study considers that if most stakeholders can reach a consensus on data sharing, it not only ensures data accuracy and integrity but can also elevate the feasibility of sharing data on the product’s lifecycle so that the industry can better track the quality and efficiency of the product’s lifecycle through data sharing and better re-develop the product’s design. Sharing data can also help companies engage in more meticulous management of the manufacturing process, enabling business owners to make decisions that are more beneficial to companies and the environment, avoiding the testing task required in the early stage and using more widely used waste to produce remanufactured products, thereby decreasing the costs of remanufacturing products as well as advancing manufacturing efficiency and quality.
After optimizing the production process and then integrating the product lifecycle, companies can track and recycle products more quickly and effectively (C5) in the CESC of remanufactured products. Based on the analysis of data, data, such as a product’s history, design number, batch, or barcode, are sorted into a database, which can ensure that the source and flow of the product can be clearly traced throughout the waste remanufacturing process. In addition, effective and targeted measures can also be carried out based on such a database or real-time data sharing using standard operating procedures that can contribute to improving the efficiency and accuracy of tracking and recycling products. Since this type of data statistics includes regular product monitoring and evaluation data, it enables companies to review and improve their processes. Conducting comprehensive data analyses can also help ensure that waste is effectively recycled and treated. Both resource sustainability and remanufacturing can ease environmental burdens.
As mentioned above, companies can redesign and remanufacture products (C13) through the collection of the latest information. When redesigning remanufactured rubber products, companies can bring remanufactured rubber products more in line with the function of resource recycling and enhance the properties of recyclable materials, such as rubber powder and recycled rubber made of waste rubber. Through this processing cycle, waste recycling and remanufacturing reduce natural resource usage. By means of redesigning, companies can design the remanufactured rubber products into the that are easy to decompose and try not to use complex material formulas as much as possible, which is also beneficial for subsequent recycling and remanufacturing processes. This type of redesigned rubber remanufactured product is more durable and less prone to wear; meanwhile, it can also be heat-resistant and corrosion-resistant. In the long run, not only can the process of the CESC be perfected but the industry also can be encouraged to implement the CESC together. In addition, cooperation with government agencies for research and development can move the industry toward sustainable development and promote the effective recycling and reuse of rubber products, thus lightening environmental burdens.
Using a CESC can effectively enhance resource efficiency (C16). The use of cost-effective waste in the supply chain can promote the better recycling and reuse of waste, maximize the use of waste, and prevent waste from flowing into the environment to avoid possible environmental burdens. In addition, a resource recycling system can be built to sort and classify recyclable waste into raw materials for remanufacturing products, maximize the value of waste, and reduce carbon dioxide emissions. In addition, adopting innovative energy technologies can boost resource efficiency. These new energy technologies contain applications for the research and development of new waste energy technology, intelligent monitoring and control systems, etc. Efficient resource efficiency represents an efficient CESC, which can not only increase economic and social benefits but also lessen the impact on the environment. When decision makers implement corresponding strategies, they can maximize sustainable benefits and improve the entire CESC simultaneously so that the CESC can move toward sustainable development to achieve an optimal balance. Furthermore, the government can urge relevant environmental protection policies or formulate regulations, such as setting goals for resource recycling and polices for green procurement, which can not only stimulate economic development but also encourage enterprises to improve resource efficiency so as to promote environmental and economic sustainability
Identifying waste composition and separating materials (C14) is one of the important steps to effectively manage waste materials and realize resource recycling. The preliminary task before entering a supply chain is that companies must analyze waste for its composition and separate it. In this process, companies must apply to their respective government agencies for a permit for reuse identification listed in the category of reusable waste rubber, and they can then apply for a permit for the export of waste rubber to manufacturers of rubber goods who need to refer to the serial number. Both parties should access their government’s environmental management system (EMS) for matching, as depicted in Figure 2. Waste composition and materials are separated and identified, and whether the batch of waste rubber can be used as resource materials for remanufacturers is confirmed. If the batch of material can be recycled or remanufactured, companies must report this to the EMS and choose to receive them. In this process, the raw materials entering the factory and output quantities must be reported and provided to the governmental agency for verification. This is to prevent waste rubber from flowing into the external environment and causing pollution. This EMS can avoid the illegal dumping of waste. At the same time, integration is performed via regulations to increase the recycling and remanufacturing of resource-recycled materials, reduce waste output, and alleviate environmental burdens. At present, in the US, European countries, and other countries, most government units and non-governmental organizations are responsible for managing and supervising the flow of waste and statistical data. However, in Asia, government agencies supervise waste management. For instance, China, South Korea, Japan, and Taiwan all have set up EMSs to facilitate the identification of waste composition and the separation of materials. The operation of this system can not only diminish the wasting of natural resources, maintain the balance of the ecological environment, save energy, reduce carbon emissions, and delay the greenhouse effect but also bring people a better environment and quality of life.
In addition, most advanced countries have expanded their policies on waste disposal from simple waste cleanup to management methods such as resource classification, recycling, and reuse. Currently, relevant laws and regulations have been enacted around the world to coordinate and organize waste and renewable resources, respectively. In Japan, the “Waste Management Law” and the “Resource Circulation Law” have been implemented to facilitate waste recycling and reuse so that classification and collection have become part of people’s daily lives. In China, the “Law of the People’s Republic of China on the Prevention and Control of Environmental Pollution by Solid Waste” has been made. In terms of legal content, basic regulations on the classification, collection, transportation, and final treatment of waste have been set up. Additionally, reduction, resource utilization, and harmless treatment have been introduced for waste, and waste classification and recycling have been strictly implemented as well.
The European Union approved “A New Circular Economy Action Plan” on 11 March 2020, viewing the circular economy as an important trend and promoting national industrial development strategies. In the future, countries can refer to the “Waste Resource Recycling Promotion Act” to legislate or enhance the effectiveness of laws and regulations. In line with the new global circular economy trend and zero-waste policy, resources can be classified, recycled, and reused. Additionally, the industry can implement source recycling and reduction management as well as adopt a binary plan of charging fees and independent recycling. Accordingly, reasonable responsibilities for waste cleanup can be established, the effective recycling of resources can be urged, the wasting of raw materials can be diminished, and the goal of zero-waste sustainable development can be gradually achieved as well.
6. Conclusions and Suggestions
6.1. Conclusions
This study constructed a framework for a CESC and applied it to remanufactured products in the rubber recycling industry. Previous data revealed that there was too much rubber waste, and too little could be recycled. Therefore, this study proposed a framework to help companies refer to corresponding references when they take relevant measures. This study used the FDM to filter out key factors and then used the FDEMATEL method to sort criteria, finally proposing suggestions.
It was found from this study that two aspects—the circular business model (A3) and raising the value of resources in the supply chain (A4)—are the most important, and their importance indicators (D+R) are both greater than 20. Among the original 32 criteria, 19 important criteria were accepted, and criteria below the threshold γ = 0.613 were deleted. In addition, when a CESC is implemented, the most important factor for the rubber recycling industry to pay attention to is that the important indicators (D+R) of six criteria, “optimizing the production process”, “sharing data during the product lifecycle”, “effectively tracking and recycling products, “redesigning remanufactured rubber products”, “enhancing resource efficiency”, and “identifying waste composition and separating materials”, are all greater than 15. Only the value of “identifying waste composition and separating materials” is 14.978, but it is still close to 15. These criteria are the implementation measures that companies need to pay attention to when they implement a CESC of remanufactured products. By satisfying these criteria, companies can better implement a CESC.
This study contributes to expanding the literature on CESCs by defining critical criteria for remanufactured products in CESCs. The result shows that the CESCs currently used for remanufactured products require companies to develop a circular business model, enhance the value of resources in the supply chain, and conduct good risk management. If companies do not understand several aspects, they may encounter difficulties when expanding their CESC. When companies promote CESCs for remanufactured products, several main criteria need to be satisfied, namely, optimizing the production process (C2), sharing data on the product lifecycle (C4), effectively tracking and recycling products (C5), redesigning remanufactured products (C13), enhancing resource efficiency (C16), and identifying waste composition and separating materials (C14). These measures are offered to companies for reference when making decisions so that the companies can implement CESCs for remanufactured products more completely.
The rubber recycling industry needs to undertake continuous research and development on equipment and innovative technologies to improve the classification of and inspection procedures for different recycled materials. By doing so, processing efficiency can increase, and manufacturing production costs can be lowered as well, which can further raise profits. In addition, when formulating environmental protection regulations and policies related to the rubber recycling industry, these strategies should be inclined to encourage the industry to invest in the CE field so as to establish sustainable production processes and systems, thereby promoting the development of the rubber recycling industry. Finally, policies can also help raise public awareness of the importance of environmental protection and social responsibility to jointly promote the sustainable development of the rubber recycling industry.
In the future, other studies can investigate the same industry in other countries. Since the source of the data in this study is expert opinions from Taiwan’s rubber industry, the conclusions may not be applicable to every region. Of course, a CESC can be used not only in the rubber recycling industry, but future research can also use other industries for verification so as to further expand the concept of the CE and make the literature more diverse and abundant. In addition, consumers are also relevant stakeholders. Future research can change the perspective and think from the viewpoints of multiple fields to obtain research results that are more helpful to the industry’s development.
6.2. Suggestions
According to the results, in order to reduce the consumption of available resources, stabilize environmental climate change, and ease carbon emissions, the government should establish and formulate regulations and policies that meet industry requirements, take responsibility for supervising and coaching the rubber recycling industry to comply with relevant waste recycling regulations and standards, and promote the sustainable development of the rubber recycling industry. From the perspective of sustainable development, the government can provide incentives, such as preferential taxes or subsidies. Moreover, the government can also encourage investment in or subsidize the research and development of rubber recycling technology. From the perspective of environmental protection, rubber products and remanufactured products should be designed to be easily decomposed, easily repaired, and reusable so that each product’s lifecycle can be prolonged. Since the world is facing dramatic environmental changes, the government should actively participate in and make policies adhering to international standards. Complete and good policies can enhance the competitiveness of the industry as well as help the economic profits of the industry grow. At the same time, they can also ensure that the measures are beneficial for environmental protection, which can not only level up the industry’s international image but also urge cooperation between the government or the industry and other countries or international organizations in order to deal with the global rubber waste problem.
As for the industrial part, the rubber recycling industry is mainly engaged in basic front-end classifying and sorting operations, such as recycling, waste reduction and reuse, and the back-end development of the reuse or manufacturing of remanufactured products. This entire process must comply with legal regulations, and industry operators must also formulate environmentally friendly regulations internally to reduce negative impacts on the environment. Since the sources of recycled materials are unstable and difficult to control, operators need to strictly classify recycled rubber materials and store them according to different attributes to ensure the longevity of the raw materials of rubber recycled products, such as Natural Rubber (NR), Styrene–Butadiene Rubber (SBR), Butadiene Rubber (BR), and Nitrile Rubber (NBR), to increase their productivity and reduce energy consumption while complying with regulations during the production process of remanufactured products, thereby lowering the environmental impact. In addition to internal improvements within the industry, businesses should also encourage their employees to participate in technical training or actively engage in industry exchanges. By communicating with domestic and foreign stakeholders, not only can they exchange experience and knowledge but they can also learn about the latest developments in technologies for products and raw materials in order to gain a greater understanding of future market trends.
The CESC of the rubber recycling industry requires the cooperation of many aspects and related industries, such as manufacturing plants, supply chain systems, consumer groups, relevant government agencies, and non-governmental organizations. Additionally, companies can also exchange their knowledge with relevant research units in the academic field so as to facilitate the development of new resources or new remanufactured products. The operating direction as well the technology of research and development for the rubber recycling industry will be affected by the policies made by the government, which will directly affect the future trend of the industry. Therefore, businesses should actively meet with the government to not only communicate but also put forward the current situation and opinions to facilitate a win–win situation. Apart from that, the industry can also cooperate with the government to promote the concept of the CE to establish an environmentally friendly brand image and make consumers understand that remanufactured products have a positive impact on the environment. Awareness of environmental protection can be built through various ways of delivering information, further encouraging consumers to prioritize environmentally friendly remanufactured products when purchasing. Only such a good cycle can make the industry more prosperous as well as bring benefits to the environment while lifting the operating profits of the industry.
Author Contributions
Conceptualization, H.-H.H., K.-C.Y., C.-H.W., C.-H.C. and S.-H.H.; Methodology, H.-H.H., K.-C.Y., C.-H.W., C.-H.C. and S.-H.H.; Validation, H.-H.H., K.-C.Y., C.-H.W., C.-H.C. and S.-H.H.; Writing – original draft, H.-H.H., K.-C.Y., C.-H.W., C.-H.C. and S.-H.H.; Writing – review & editing, H.-H.H., K.-C.Y., C.-H.W., C.-H.C. and S.-H.H. All authors have read and agreed to the published version of the manuscript.
Funding
This research received no external funding.
Institutional Review Board Statement
Not applicable.
Informed Consent Statement
Not applicable.
Data Availability Statement
The data used to support the findings of this study are included in the article.
Acknowledgments
The authors would like to express their sincere gratitude to a number of anonymous reviewers for their careful reading of our manuscript and their many valuable comments and suggestions. Furthermore, the authors would like to thank the National Science and Technology Council of Taiwan (MOST 112-2622-E-167 -006) for financially supporting this study.
Conflicts of Interest
The authors declare no conflicts of interest.
References
- Zhou, X.; Zhai, Y.; Zhang, T.; Li, Z.; Cheng, Z.; Li, C.; Xu, T.; Hong, J. Uncovering the energy-carbon-water footprint of waste rubber recycling: Integrated environmental and economic perspectives. J. Environ. Manag. 2023, 345, 118–916. [Google Scholar] [CrossRef] [PubMed]
- Chrissy Sexton The United States Produces Three Times the Global Average of Waste. 2019. Available online: https://www.earth.com/news/united-states-global-waste/ (accessed on 10 October 2023).
- McCormick, E.; Simmonds, C.; Glenza, J.; Gammon, K. Americans’ plastic recycling is dumped in landfills, investigation shows. The Guardian, 2019. Available online: https://www.theguardian.com/us-news/2019/jun/21/us-plastic-recycling-landfills (accessed on 16 October 2023).
- Wu, Q.; Leng, S.; Zhang, Q.; Xiao, J. Resource and environmental assessment of pyrolysis-based high-value utilization of waste passenger tires. Waste Manag. 2021, 126, 201–208. [Google Scholar] [CrossRef]
- Gumede, J.I.; Hlangothi, B.G.; Mabuto, B.; Woolard, C.D.; Hlangothi, S.P. Devulcanization of natural rubber/styrene-butadiene rubber unfilled blend in supercritical carbon dioxide using Tulbaghia violacea crude extract. J. Clean. Prod. 2022, 362, 132–478. [Google Scholar] [CrossRef]
- Nishitani, K.; Kokubu, K.; Wu, Q.; Kitada, H.; Guenther, E.; Guenther, T. Material flow cost accounting (MFCA) for the circular economy: An empirical study of the triadic relationship between MFCA, environmental performance, and the economic performance of Japanese companies. J. Environ. Manag. 2022, 303, 114–219. [Google Scholar] [CrossRef]
- Araujo-Morera, J.; Verdejo, R.; López-Manchado, M.A.; Santana, M.H. Sustainable mobility: The route of tires through the circular economy model. Waste Manag. 2021, 126, 309–322. [Google Scholar] [CrossRef] [PubMed]
- Julianelli, V.; Caiado, R.G.G.; Scavarda, L.F.; Cruz, S.P.D.M.F. Interplay between reverse logistics and circular economy: Critical success factors-based taxonomy and framework. Resour. Conserv. Recycl. 2020, 158, 104784. [Google Scholar] [CrossRef]
- Buadit, T.; Ussawarujikulchai, A.; Suchiva, K.; Papong, S.; Ma, H.W.; Rattanapan, C. Environmental impact of passenger car tire supply chain in Thailand using the life cycle assessment method. Sustain. Prod. Consum. 2023, 37, 156–168. [Google Scholar] [CrossRef]
- Hu, H.; Liu, J.; Zhu, Q.; Chen, Q. An integrated supply chain management system for end-of-life tires in China and its promotion barriers: A stakeholder perspective. Resour. Conserv. Recycl. 2021, 164, 105–214. [Google Scholar] [CrossRef]
- Vegter, D.; van Hillegersberg, J.; Olthaar, M. Performance measurement system for circular supply chain management. Sustain. Prod. Consum. 2023, 36, 171–183. [Google Scholar] [CrossRef]
- Chittella, H.; Yoon, L.W.; Ramarad, S.; Lai, Z.W. Rubber waste management: A review on methods, mechanism, and prospects. Polym. Degrad. Stab. 2021, 194, 109–761. [Google Scholar] [CrossRef]
- Gunasekara, L.; Robb, D.J.; Zhang, A. Used product acquisition, sorting and disposition for circular supply chains: Literature review and research directions. Int. J. Prod. Econ. 2023, 2023, 108–844. [Google Scholar] [CrossRef]
- Zhang, A.; Wang, J.X.; Farooque, M.; Wang, Y.; Choi, T.M. Multi-dimensional circular supply chain management: A comparative review of the state-of-the-art practices and research. Transp. Res. Part E Logist. Transp. Rev. 2021, 155, 102509. [Google Scholar] [CrossRef]
- Gebhardt, M.; Spieske, A.; Birkel, H. The future of the circular economy and its effect on supply chain dependencies: Empirical evidence from a Delphi study. Transp. Res. Part E Logist. Transp. Rev. 2022, 157, 102–570. [Google Scholar] [CrossRef]
- Amir, S.; Salehi, N.; Roci, M.; Sweet, S.; Rashid, A. Towards circular economy: A guiding framework for circular supply chain implementation. Bus. Strategy Environ. 2023, 32, 2684–2701. [Google Scholar] [CrossRef]
- da Silva, E.R.; Lohmer, J.; Rohla, M.; Angelis, J. Unleashing the circular economy in the electric vehicle battery supply chain: A case study on data sharing and blockchain potential. Resour. Conserv. Recycl. 2023, 193, 106–969. [Google Scholar]
- Tseng, M.L.; Tran, T.P.T.; Ha, H.M.; Bui, T.D.; Lim, M.K. Causality of circular business strategy under uncertainty: A zero-waste practices approach in seafood processing industry in Vietnam. Resour. Conserv. Recycl. 2022, 181, 106–263. [Google Scholar] [CrossRef]
- Negash, Y.T.; Hassan, A.M.; Tseng, M.L.; Wu, K.J.; Ali, M.H. Sustainable construction and demolition waste management in Somaliland: Regulatory barriers lead to technical and environmental barriers. J. Clean. Prod. 2021, 297, 126–717. [Google Scholar] [CrossRef]
- Govindan, K.; Salehian, F.; Kian, H.; Hosseini, S.T.; Mina, H. A location-inventory-routing problem to design a circular closed-loop supply chain network with carbon tax policy for achieving circular economy: An augmented epsilon-constraint approach. Int. J. Prod. Econ. 2023, 257, 108–771. [Google Scholar] [CrossRef]
- Rodríguez-González, R.M.; Maldonado-Guzmán, G.; Madrid-Guijarro, A.; Garza-Reyes, J.A. Does circular economy affect financial performance? The mediating role of sustainable supply chain management in the automotive industry. J. Clean. Prod. 2022, 379, 134–670. [Google Scholar] [CrossRef]
- Li, W.; Sun, H.; Dong, H.; Gan, Y.; Koh, L. Outsourcing decision-making in global remanufacturing supply chains: The impact of tax and tariff regulations. Eur. J. Oper. Res. 2023, 304, 997–1010. [Google Scholar] [CrossRef]
- Zhang, L.; Zhang, Z. Dynamic analysis of the decision of authorized remanufacturing supply chain affected by government subsidies under cap-and-trade policies. Chaos Solitons Fractals 2022, 160, 112–237. [Google Scholar] [CrossRef]
- Mhatre, P.; Panchal, R.; Singh, A.; Bibyan, S. A systematic literature review on the circular economy initiatives in the European Union. Sustain. Prod. Consum. 2021, 26, 187–202. [Google Scholar] [CrossRef]
- Yontar, E. Critical success factor analysis of blockchain technology in agri-food supply chain management: A circular economy perspective. J. Environ. Manag. 2023, 330, 117–173. [Google Scholar] [CrossRef] [PubMed]
- Ansari, Z.N.; Kant, R.; Shankar, R. Evaluation and ranking of solutions to mitigate sustainable remanufacturing supply chain risks: A hybrid fuzzy SWARA-fuzzy COPRAS framework approach. Int. J. Sustain. Eng. 2020, 13, 473–494. [Google Scholar] [CrossRef]
- Berlin, D.; Feldmann, A.; Nuur, C. Supply network collaborations in a circular economy: A case study of Swedish steel recycling. Resour. Conserv. Recycl. 2022, 179, 106–112. [Google Scholar] [CrossRef]
- Mastos, T.D.; Nizamis, A.; Terzi, S.; Gkortzis, D.; Papadopoulos, A.; Tsagkalidis, N.; Ioannidis, D.; Votis, K.; Tzovaras, D. Introducing an application of an industry 4.0 solution for circular supply chain management. J. Clean. Prod. 2021, 300, 126–886. [Google Scholar] [CrossRef]
- Singhal, D.; Tripathy, S.; Jena, S.K. Remanufacturing for the circular economy: Study and evaluation of critical factors. Resour. Conserv. Recycl. 2020, 156, 104681. [Google Scholar] [CrossRef]
- Chen, Z.; Huang, L. Digital twins for information-sharing in remanufacturing supply chain: A review. Energy 2021, 220, 119–712. [Google Scholar] [CrossRef]
- Padilla-Rivera, A.; do Carmo, B.B.T.; Arcese, G.; Merveille, N. Social circular economy indicators: Selection through fuzzy delphi method. Sustain. Prod. Consum. 2021, 26, 101–110. [Google Scholar] [CrossRef]
- Chen, H.M.; Wu, H.Y.; Chen, P.S. Innovative service model of information services based on the sustainability balanced scorecard: Applied integration of the fuzzy Delphi method, Kano model, and TRIZ. Expert Syst. Appl. 2022, 205, 117–601. [Google Scholar] [CrossRef]
- Chen, C.C.; Sujanto, R.Y.; Tseng, M.L.; Fujii, M.; Lim, M.K. Sustainable consumption transition model: Social concerns and waste minimization under willingness-to-pay in Indonesian food industry. Resour. Conserv. Recycl. 2021, 170, 105–590. [Google Scholar] [CrossRef]
- Yorulmaz, M.; Karabulut, K. Analyzing the factors determining the effectiveness of the international safety management code applied on ships through the fuzzy DEMATEL method. Saf. Sci. 2022, 155, 105–872. [Google Scholar] [CrossRef]
- Tseng, M.L.; Ardaniah, V.; Sujanto, R.Y.; Fujii, M.; Lim, M.K. Multicriteria assessment of renewable energy sources under uncertainty: Barriers to adoption. Technol. Forecast. Soc. Chang. 2021, 171, 120–937. [Google Scholar] [CrossRef]
- Wang, Y.; Wang, S.; Yang, B.; Zhu, L.; Liu, F. Big data driven Hierarchical Digital Twin Predictive Remanufacturing paradigm: Architecture, control mechanism, application scenario and benefits. J. Clean. Prod. 2020, 248, 119–299. [Google Scholar] [CrossRef]
- Ahmad, F.; Bask, A.; Laari, S.; Robinson, C.V. Business management perspectives on the circular economy: Present state and future directions. Technol. Forecast. Soc. Chang. 2023, 187, 122182. [Google Scholar] [CrossRef]
- Niu, B.; Bao, J.; Cao, B. Retailer’s make-or-buy decision for remanufactured products under in-house yield uncertainty. Omega 2022, 110, 102–627. [Google Scholar] [CrossRef]
- Dulia, E.F.; Ali, S.M.; Garshasbi, M.; Kabir, G. Admitting risks towards circular economy practices and strategies: An empirical test from supply chain perspective. J. Clean. Prod. 2021, 317, 128–420. [Google Scholar] [CrossRef]
- Tsai, F.M.; Bui, T.D.; Tseng, M.L.; Ali, M.H.; Lim, M.K.; Chiu, A.S. Sustainable supply chain management trends in world regions: A data-driven analysis. Resour. Conserv. Recycl. 2021, 167, 105–421. [Google Scholar] [CrossRef]
- De Lima, F.A.; Seuring, S. A Delphi study examining risk and uncertainty management in circular supply chains. Int. J. Prod. Econ. 2023, 258, 108–810. [Google Scholar] [CrossRef]
- Sankaran, K. Turning black to green: Circular economy of industrial carbon emissions. Energy Sustain. Dev. 2023, 74, 463–470. [Google Scholar] [CrossRef]
- Delai, I.; Alcantara, R.L.C. Circular value chain practices for developing resource value retention options. J. Clean. Prod. 2022, 359, 131–925. [Google Scholar]
- Bhubalan, K.; Tamothran, A.M.; Kee, S.H.; Foong, S.Y.; Lam, S.S.; Ganeson, K.; Vigneswari, S.; Amirul, A.A.; Ramakrishna, S. Leveraging blockchain concepts as watermarkers of plastics for sustainable waste management in progressing circular economy. Environ. Res. 2022, 213, 113631. [Google Scholar] [CrossRef] [PubMed]
- Lahane, S.; Kant, R.; Shankar, R. Circular supply chain management: A state-of-art review and future opportunities. J. Clean. Prod. 2020, 258, 120–859. [Google Scholar] [CrossRef]
- Orji, I.J.; U-Dominic, C.M.; Okwara, U.K. Exploring the determinants in circular supply chain implementation in the Nigerian manufacturing industry. Sustain. Prod. Consum. 2022, 29, 761–776. [Google Scholar] [CrossRef]
- Mallick, P.K.; Salling, K.B.; Pigosso, D.C.; McAloone, T.C. Closing the loop: Establishing reverse logistics for a circular economy, a systematic review. J. Environ. Manag. 2023, 328, 117017. [Google Scholar] [CrossRef]
- Executive Yuan Environmental Protection Agency (EPA). Environmental Impact Statement Review Statistics. (Environmental Statistics Inquiry Network). 2023. Available online: https://statis91.epa.gov.tw/epanet/index.html (accessed on 1 October 2023).
- Wang, C.H.; Chen, Y.C.; Sulistiawan, J.; Bui, T.D.; Tseng, M.L. Hybrid approach to corporate sustainability performance in Inddonesia’s cement industry. Sustainability 2021, 13, 14039. [Google Scholar] [CrossRef]
Disclaimer/Publisher’s Note: The statements, opinions and data contained in all publications are solely those of the individual author(s) and contributor(s) and not of MDPI and/or the editor(s). MDPI and/or the editor(s) disclaim responsibility for any injury to people or property resulting from any ideas, methods, instructions or products referred to in the content. |
© 2024 by the authors. Licensee MDPI, Basel, Switzerland. This article is an open access article distributed under the terms and conditions of the Creative Commons Attribution (CC BY) license (https://creativecommons.org/licenses/by/4.0/).