Article

Exploring Extreme Voltage Events in Hydrogen Arcs within Electric Arc Furnaces

by
Mohamad Al Nasser
1,
Nashmi Alrasheedi
2,
Ebrahim Karimi-Sibaki
1,
Alexander Vakhrushev
1,
Mahmoud Ahmadein
3,
Sabbah Ataya
2 and
Abdellah Kharicha
1,*
1
Metallurgy Department, Montanuniversität of Leoben, Franz-Josef-Str. 18, A-8700 Leoben, Austria
2
Department of Mechanical Engineering, Imam Mohammad Ibn Saud Islamic University, Riyadh 11564, Saudi Arabia
3
Department of Production Engineering and Mechanical Design, Tanta University, Tanta 31512, Egypt
*
Author to whom correspondence should be addressed.
Sustainability 2024, 16(7), 2831; https://doi.org/10.3390/su16072831
Submission received: 4 December 2023 / Revised: 13 March 2024 / Accepted: 26 March 2024 / Published: 28 March 2024

Abstract

:
This study highlights the potential utilization of hydrogen gas in electric arc furnaces for achieving cleaner and more sustainable steel production. The application of hydrogen offers a promising path for reducing carbon emissions, enhancing energy efficiency, and advancing the concept of “green steel”. This study employs a 2D axisymmetric induction-based model to simulate an electric arc under atmospheric pressure conditions. We conducted numerical simulations to compare compressible and incompressible models of an electric arc. The impact of compressibility on hydrogen arc characteristics such as arc velocity, temperature distribution, and voltage drop were investigated. Additionally, different applied current arcs were simulated using the compressible model. When compared to an incompressible arc, the compressible arc exhibits a higher voltage drop. This higher voltage drop is associated with lower temperatures and lower arc velocity. A rise in applied current results in an upward trend in the voltage drop and an increase in the arc radius. In addition, the increased applied current increases the probability of voltage fluctuations. The voltage fluctuations tend to become more extreme and exert more stress on the control circuit. This has an impact on emerging electric arc technologies, particularly those involving the use of hydrogen. These fluctuations affect arc stability, heat output, and the overall quality of processes. Thus, the precise prediction of voltage and the ability to stabilize the operation is critical for the successful implementation of new hydrogen technologies.

1. Introduction

The first use of direct current (DC) electric arc furnaces (EAFs) dates back to 1878. However, the predominant evolution and widespread industrial adoption primarily concentrated on alternating current (AC) furnaces due to better efficiency in transferring power from large power stations [1], and the advancement in direct current EAFs followed by almost a century. The capacity of EAFs increased from 100 tons in the 1930s to 400 tons in the early 1970s [2]. Presently, EAFs are the primary method for producing steel from scrap metal and direct reduced iron (DRI). In 2019, EAFs accounted for over 29% of total steel production, and this percentage is projected to increase annually. It is anticipated that EAFs will constitute 47% of total steel production by the year 2050 [3]. Additionally, EAFs are used in smelting processes, which mainly use non-metallic feed materials, such as ilmenite and chromite, and produce intermediary slags and pig iron before further treatments [1]. Of EAFs’ 57% market share, 8% is produced from DRI and hydrogen gas as plasma atmosphere [3]. EAFs offer better efficiency and have a less detrimental environmental impact compared to traditional furnaces operating on fossil fuels. EAFs provide the advantage of adaptable production rates while maintaining cost-effectiveness, unlike conventional furnaces, which necessitate consistently high feed rates for economically viable steel production. Furthermore, advancements in mining technology and the long-term reduction in natural gas prices have led to decreased production expenses for DRI. The increased availability of cost-effective DRI and the capacity to produce steel exclusively from scrap metals ensure further expansion for EAFs [4].
Another driver for the sustained adoption and growth of EAF technology is the reduction in carbon emissions associated with steel production. An average EAF emits 77% less CO2 than a similarly sized blast furnace [5]. By using electricity instead of conventional fuels for raw material melting and sourcing power from renewable energy, substantial reductions in carbon emissions can be achieved. Numerous emerging technologies, such as green hydrogen methods that substitute hydrogen for carbon in steel production, aim to achieve a zero-carbon footprint in steel manufacturing. In addition to using an EAF, replacing coal, coke, and gas with hydrogen inside an EAF can reduce CO2 emissions by 89–99% compared to the current blast furnace or basic oxygen furnace [5]. Green hydrogen is produced through a process called electrolysis, which involves splitting water (H2O) into hydrogen (H2) and oxygen (O2) using electricity from renewable sources [6]. In an EAF, hydrogen acts as a reducing agent, similar to carbon in traditional steelmaking but without the carbon emissions associated with lime and fossil fuels. The utilization of hydrogen in EAFs is a relatively new area of research and development within the steel industry, and it involves complex dynamics that require further investigation of the behavior of hydrogen in the arc region and the dynamics of hydrogen gas as plasma.
Fundamentally, electric arcs occur when an electrical breakdown occurs in a low-conducting medium such as hydrogen between two conducting plates. Some causes of arcing are (1) critical electrical potential applied between two conductors, (2) the separation of two electrical conductors conducting current, or (3) excessive current flowing through an electrical contact. All the aforementioned scenarios can be observed in an EAF at different time stages of the operation. During arcing, a cathode releases electrons at specific locations called cathode spots, where current enters from the plasma bulk. At high-pressure atmospheres (atmospheric pressure), the current is concentrated in a single cumulative cathode spot. The cathode spot tends to be relatively small, with a high and constant current density in the range of 107 A/m2 [7,8]. This electrical breakdown is accompanied by a high thermal energy discharge that plays a critical role in the smelting and refining of steel and other metals. The electric arc appears at a high temperature, above 10,000 K, and a velocity in the range of km/s [9]. Due to the extremely hostile conditions of electric arc furnaces, experimental measurements are difficult to achieve and are rarely performed in the vicinity of the arc [7,10].
Ushio et al. [11] conducted one of the initial studies aimed at understanding the electric arc. This investigation considered turbulent Navier–Stokes equations, the energy equation, and the Maxwell equations associated with the arc. Certain assumptions were made regarding the current distribution. Szekely et al. [12] employed a similar model and were the first to predict the different heat transfer mechanisms from the arc to the metal bath by integrating the arc with various metal bath regions. Ramirez [13] formulated a mathematical model for a direct current EAF arc and liquid metal bath. Employing the potential approach to address the electromagnetic field, the model demonstrated better agreement using the electric potential method in comparison to the magnetic approach, particularly when compared with argon arc welding data. The investigation covered various aspects of the arc, such as cathode current density, arc jet velocity, the impact of compressibility, and interactions with the metal bath. The study validated the separation of the arc and metal bath since the metal bath temperature did not exert influence on the arc. Notably, the research identified the initial arc gap and total applied current as the most crucial parameters influencing the arc’s performance. Alexis et al. [14] developed a DC arc model to predict the heat transfer from the arc to the metal bath and the shear stresses on the liquid metal bath. The study concluded that radiation and convection dominate the heat transfer from the arc to the steel bath, and the radiation becomes more significant as the arc length increases. Wang et al. [15] developed a similar model and confirmed that radiation and convection are the main modes of heat transfer from the arc to the metal bath. Ramírez [16] conducted a study examining the impact of various gases in an arc atmosphere. The study covered the following gases: atmospheric air, nitrogen, oxygen, argon, carbon dioxide, and carbon monoxide. Among the gases studied, air proved to be the most effective in heating the liquid bath. Furthermore, the presence of carbon oxides was identified as a factor that enhances heating efficiency. Reynolds et al. [17,18,19] studied through numerical models the dynamics of DC arc plasma in both 2D and 3D computational environments. These models captured the characteristics of single-phase arcs and also considered the influence of the arc on the underlying slag layer. Although the model effectively anticipated a shift between stable and fluctuating arc behavior, it relied on the assumption of constant arc properties with temperature. Despite this constraint, the simulation of multiphase arc impingement exhibited reasonably consistent results with experimental measurements. The voltage drop in the simulation was significantly lower than the semi-empirical value, but no clear explanation for this difference was provided [19]. Trelles [20] explored the characteristics of a DC arc plasma torch by employing two temperature models in a 3D framework. The investigation considered the compressibility effect but omitted the influence of turbulence. Various aspects of the arc were captured in the study, such as shear flow instabilities and coherent flow structures. In a separate examination, Guo et al. [21] focused on the behavior of a non-transferred argon–hydrogen DC arc within a plasma torch. The results indicated a decrease in voltage with increasing current, while an increase in flow rate led to higher voltage. Notably, the study assumed an incompressible flow, despite predicting a high velocity of 1600 m/s at the jet’s core. Murphy et al. [22] determined that compressibility’s impact becomes noteworthy in high-velocity and turbulent plasmas, especially as the velocity approaches sonic speeds. Ernst et al. [23] studied the stability of hydrogen arcs as a function of electrode shape and graphite quality. The study concluded that a flat-end electrode tip and coating lead to an unstable arc, while a machined step arc tip leads to better arc stability. Recently, the effect of compressibility on electric arcs was studied [24]. The study considered the arc atmosphere to be atmospheric air and extensively analyzed compressibility’s impact on arc physical and electrical behavior. Compressible arc simulations show a reduction in flow speed and temperature distribution inside the arc, with changes in gas density compared to incompressible arcs. Additionally, compressible arc simulations predict higher voltage drops from incompressible simulations within the arc. The study of hydrogen arcs has been limited to relatively low currents such as welding and torch plasma. Murphy et al. [25] studied the effect of different shielding gases on arc welding, including hydrogen. They predicted a peak velocity of 4.3 km/s and a peak temperature of 27,000 K for a hydrogen arc of 150 A arc. Yao et al. [26] developed a 2D axisymmetric model of a 12 t EAF. The model assessed the interaction between the arc plasma and liquid metal surface, finding a stable cavity over time. Arc shear force proved crucial, impacting flow and temperature distribution significantly, though a slag layer was not modeled. Recently, Cui et al. [27] studied the interaction between a plasma arc and molten slag inside an EAF for a 24 kA arc. The slag depression due to the arc impingement is mainly dependent on arc length and slag viscosity. The use of hydrogen as an atmosphere for electric arcs remains a field that requires further exploration. In 2021, the European Parliament Committee on Industry, Research and Energy (ITRE) set a goal of zero carbon emissions by 2050 and climate neutrality [28]. The committee explicitly indicated the importance of utilization and further development of EAFs instead of blast oxygen furnaces. Additionally, the use of hydrogen instead of carbon in steel reduction to reach a market-ready technology is one of the expected routes to achieve free-carbon metallurgy.
The current study aims to address this gap by simulating and predicting the behavior of pilot-scale electric arcs within a pure hydrogen environment. The particular emphasis is on investigating the impact of compressibility and applied current on the flow characteristics and voltage drop of the hydrogen arc. The model uses a transient 2D axisymmetric domain to solve for flow, thermal, and magnetohydrodynamic (MHD) fields. Firstly, the study compares the field structures of incompressible and compressible hydrogen arcs. Secondly, we assess the effect of different applied currents on arc dynamics. Specifically, we examine changes in velocity, temperature, and voltage drop. This study offers valuable insights into the intricate nature of high-current-density hydrogen electric arcs, which can help engineers optimize the operating conditions of the process.

2. Methodology

In this study, the physical model entails a 2D axisymmetric cylinder. The model resembles the micro-environment of the arc. The cylinder is filled with pure hydrogen. Figure 1 schematically shows the configuration of the model. The distance between the two electrodes, also known as the arc gap, equals 0.25 cm. The radius of the cylinder is 0.3 m. Both electrodes, the cathode and anode, are in direct contact with the base sides of the cylinder. The anode is in full contact with the bottom of the cylinder at 0.25 m. The cathode, positioned on the top, has a radius of 0.08 m. The current flowing through the arc is 5 kA for the base case. In Figure 1, an approximation of the bell-shaped arc structure is shown. The arc’s lateral boundaries are typically determined by temperatures. The current propagates when the temperature exceeds 10,000 K, at which point electrical conductivity is sufficient to maintain current flow. A total number of 280,000 structured hexahedral mesh is generated within our computational domain.
In the context of this particular scenario, several key characteristics define the nature of the arc. Firstly, the arc exhibits asymmetry, implying a symmetry around its axis. The gas comprising the arc consists exclusively of hydrogen, establishing a specific composition for the system without any contaminants. Additionally, the arc operates under the condition of local thermal equilibrium (LTE), signifying that the temperatures of the electrons and heavy particles within the arc are closely aligned. Furthermore, the physical properties of the gas are exclusively reliant on temperature, highlighting the significance of this parameter in influencing the overall behavior of the system. However, in the compressible model, the density is a function of the state equation and not only temperature. The cathode and anode surfaces are assumed to be flat; deformation and erosion are neglected for the time being as an effect of the arc. Lastly, it is noteworthy that there is no absorption occurring within the arc.

3. Governing Equations

The flow inside the 2D axisymmetric cylinder is treated as a single-phase flow. The model is based on the local thermal equilibrium (LTE) assumption. LTE implies that the hydrogen plasma properties are solely dependent on temperature. As a result of the LTE condition, the model can be simulated as a single-phase compressible plasma in the continuum regime. Continuity, flow, energy, and the induction equations are solved in cylindrical coordinates. Turbulence is modeled using the SAS-SST model [29]. The simulations were performed using ANSYS Fluent software. The electromagnetic equations and the Lorentz force were implemented using user-defined functions (UDF). The coupled algorithm was used to solve the pressure–velocity coupling. All the governing equations are as follows:
Continuity Equation:
ρ t + 1 r ( ρ r u r ) r + ( ρ u z ) z = 0
Equation of State (considering compressibility):
ρ = P o p + P R M w T
Momentum Equation:
( ρ u z ) t + 1 r ( ρ r u z u z ) z + 1 r ( ρ r u z u r ) r = P z + 1 r z r μ r e f f 2 u z z 2 3 ( . u ) + 1 r r r μ r e f f u z r + u r z + F z ( ρ u r ) t + 1 r ( ρ r u z u r ) z + 1 r ( ρ r u r u r ) r = P r + 1 r z r μ r e f f 2 u r z + u z r + 1 r r r μ r e f f 2 u r r 2 3 ( . u ) μ r e f f 2 u r r 2 + 2 μ r e f f 3 r ( . u ) + ρ u z 2 r + F r
The additional term F z = J z B θ ; F r = J z B θ represents the Lorentz force, the main driver in the momentum equation inside the arc.
Energy:
t ( ρ c p T ) + 1 r ( ρ r u r c p T ) r + ( ρ u z c p T ) z = 1 r r r K e f f T r + z K e f f T z + J z 2 + J r 2 σ e + R a d l o s s
Radloss is the radiation loss based on the experimental measurements at atmospheric pressure [30] Figure 2.
Induction Equation:
B θ t + 1 r ( r u r B θ ) r + ( u z B θ ) z = 1 r r r 1 σ μ 0 B θ r + z 1 σ μ 0 B θ z + r 1 σ μ 0 r B θ
Current Density:
J r = 1 μ 0 B θ z ; J z = 1 μ 0 r ( r B θ ) r
Voltage Drop:
Δ ϕ = 1 I 0 J 2 σ d V
To assess the impact of compressibility on arc dynamics, we initially conducted two separate simulations. In the first simulation, a temperature-dependent density model for hydrogen (incompressible) was used. The density was purely dependent on temperature and independent of pressure. In the second simulation, the plasma was treated as an ideal gas. The state equation calculates the density for the compressible model (Equation (2)), which is influenced by temperature and pressure. Figure 2 shows the experimental measurements of the thermophysical and electrical properties of hydrogen up to 30,000 K. The experimental measurement density as a function of temperature is used for the incompressible model. All other thermophysical and electrical parameters present in Figure 2 are calculated identically in both cases. As a result, we can assess the effect of compressibility without being influenced by other factors inside the arc.

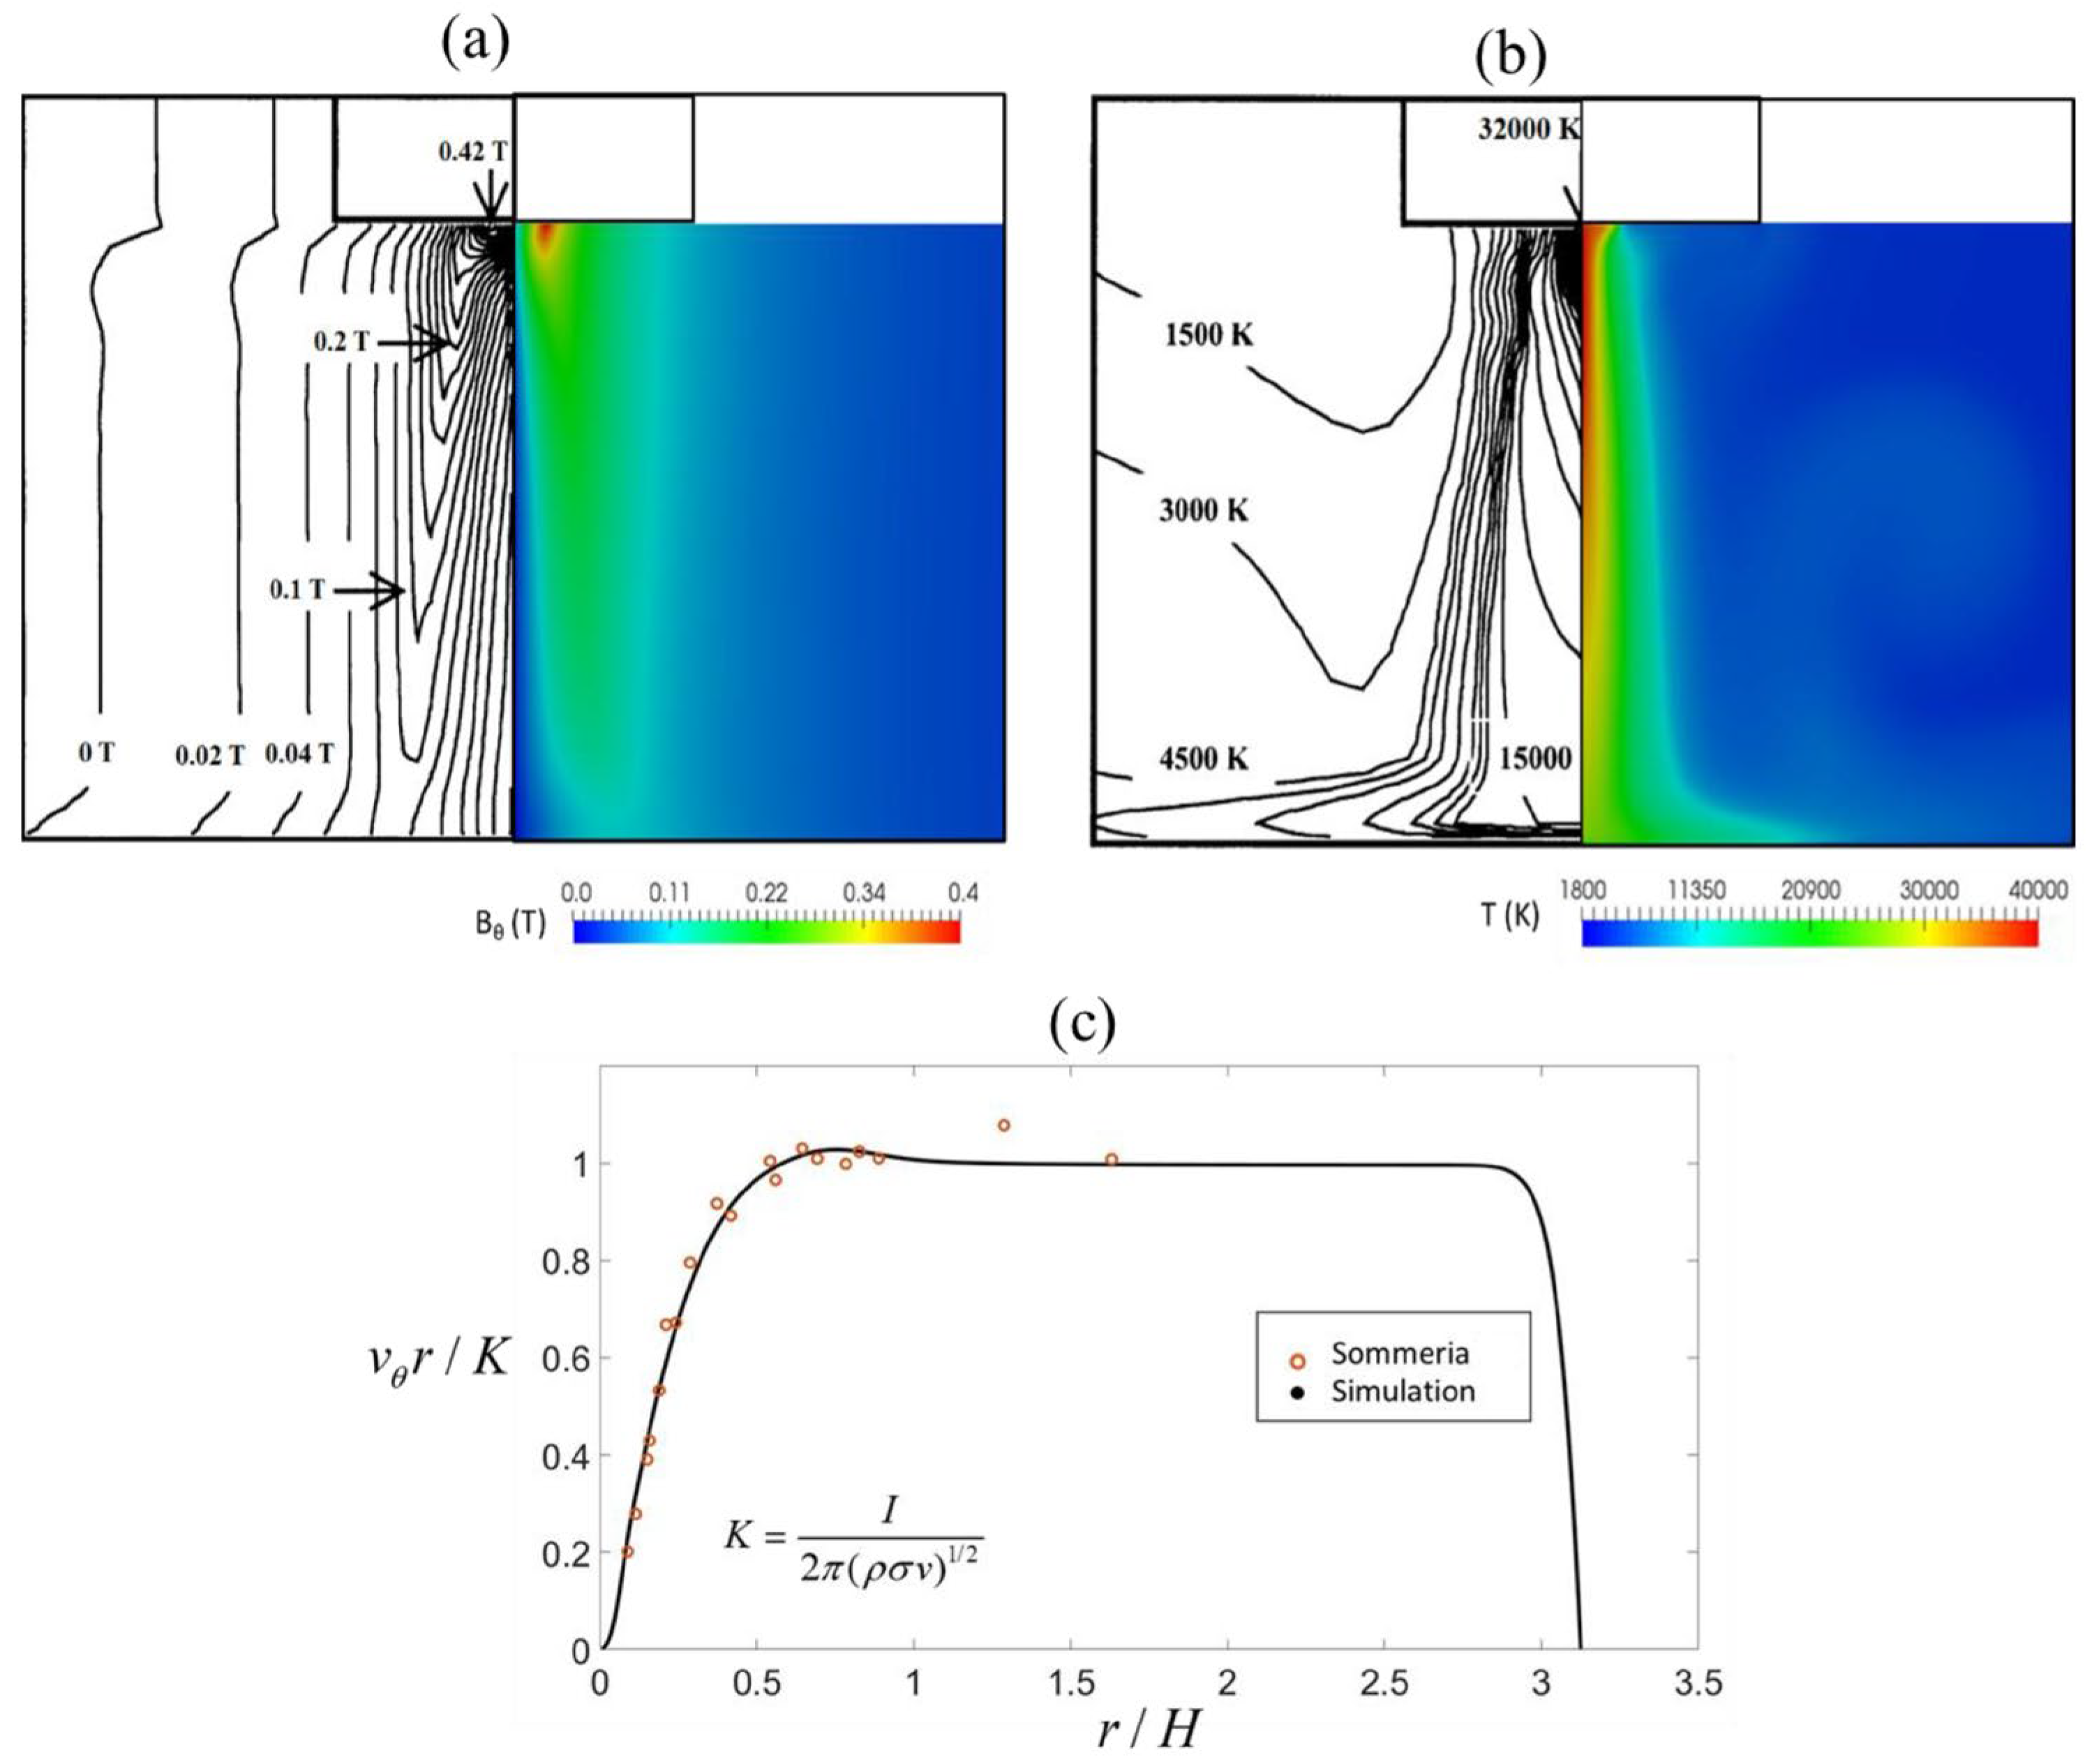
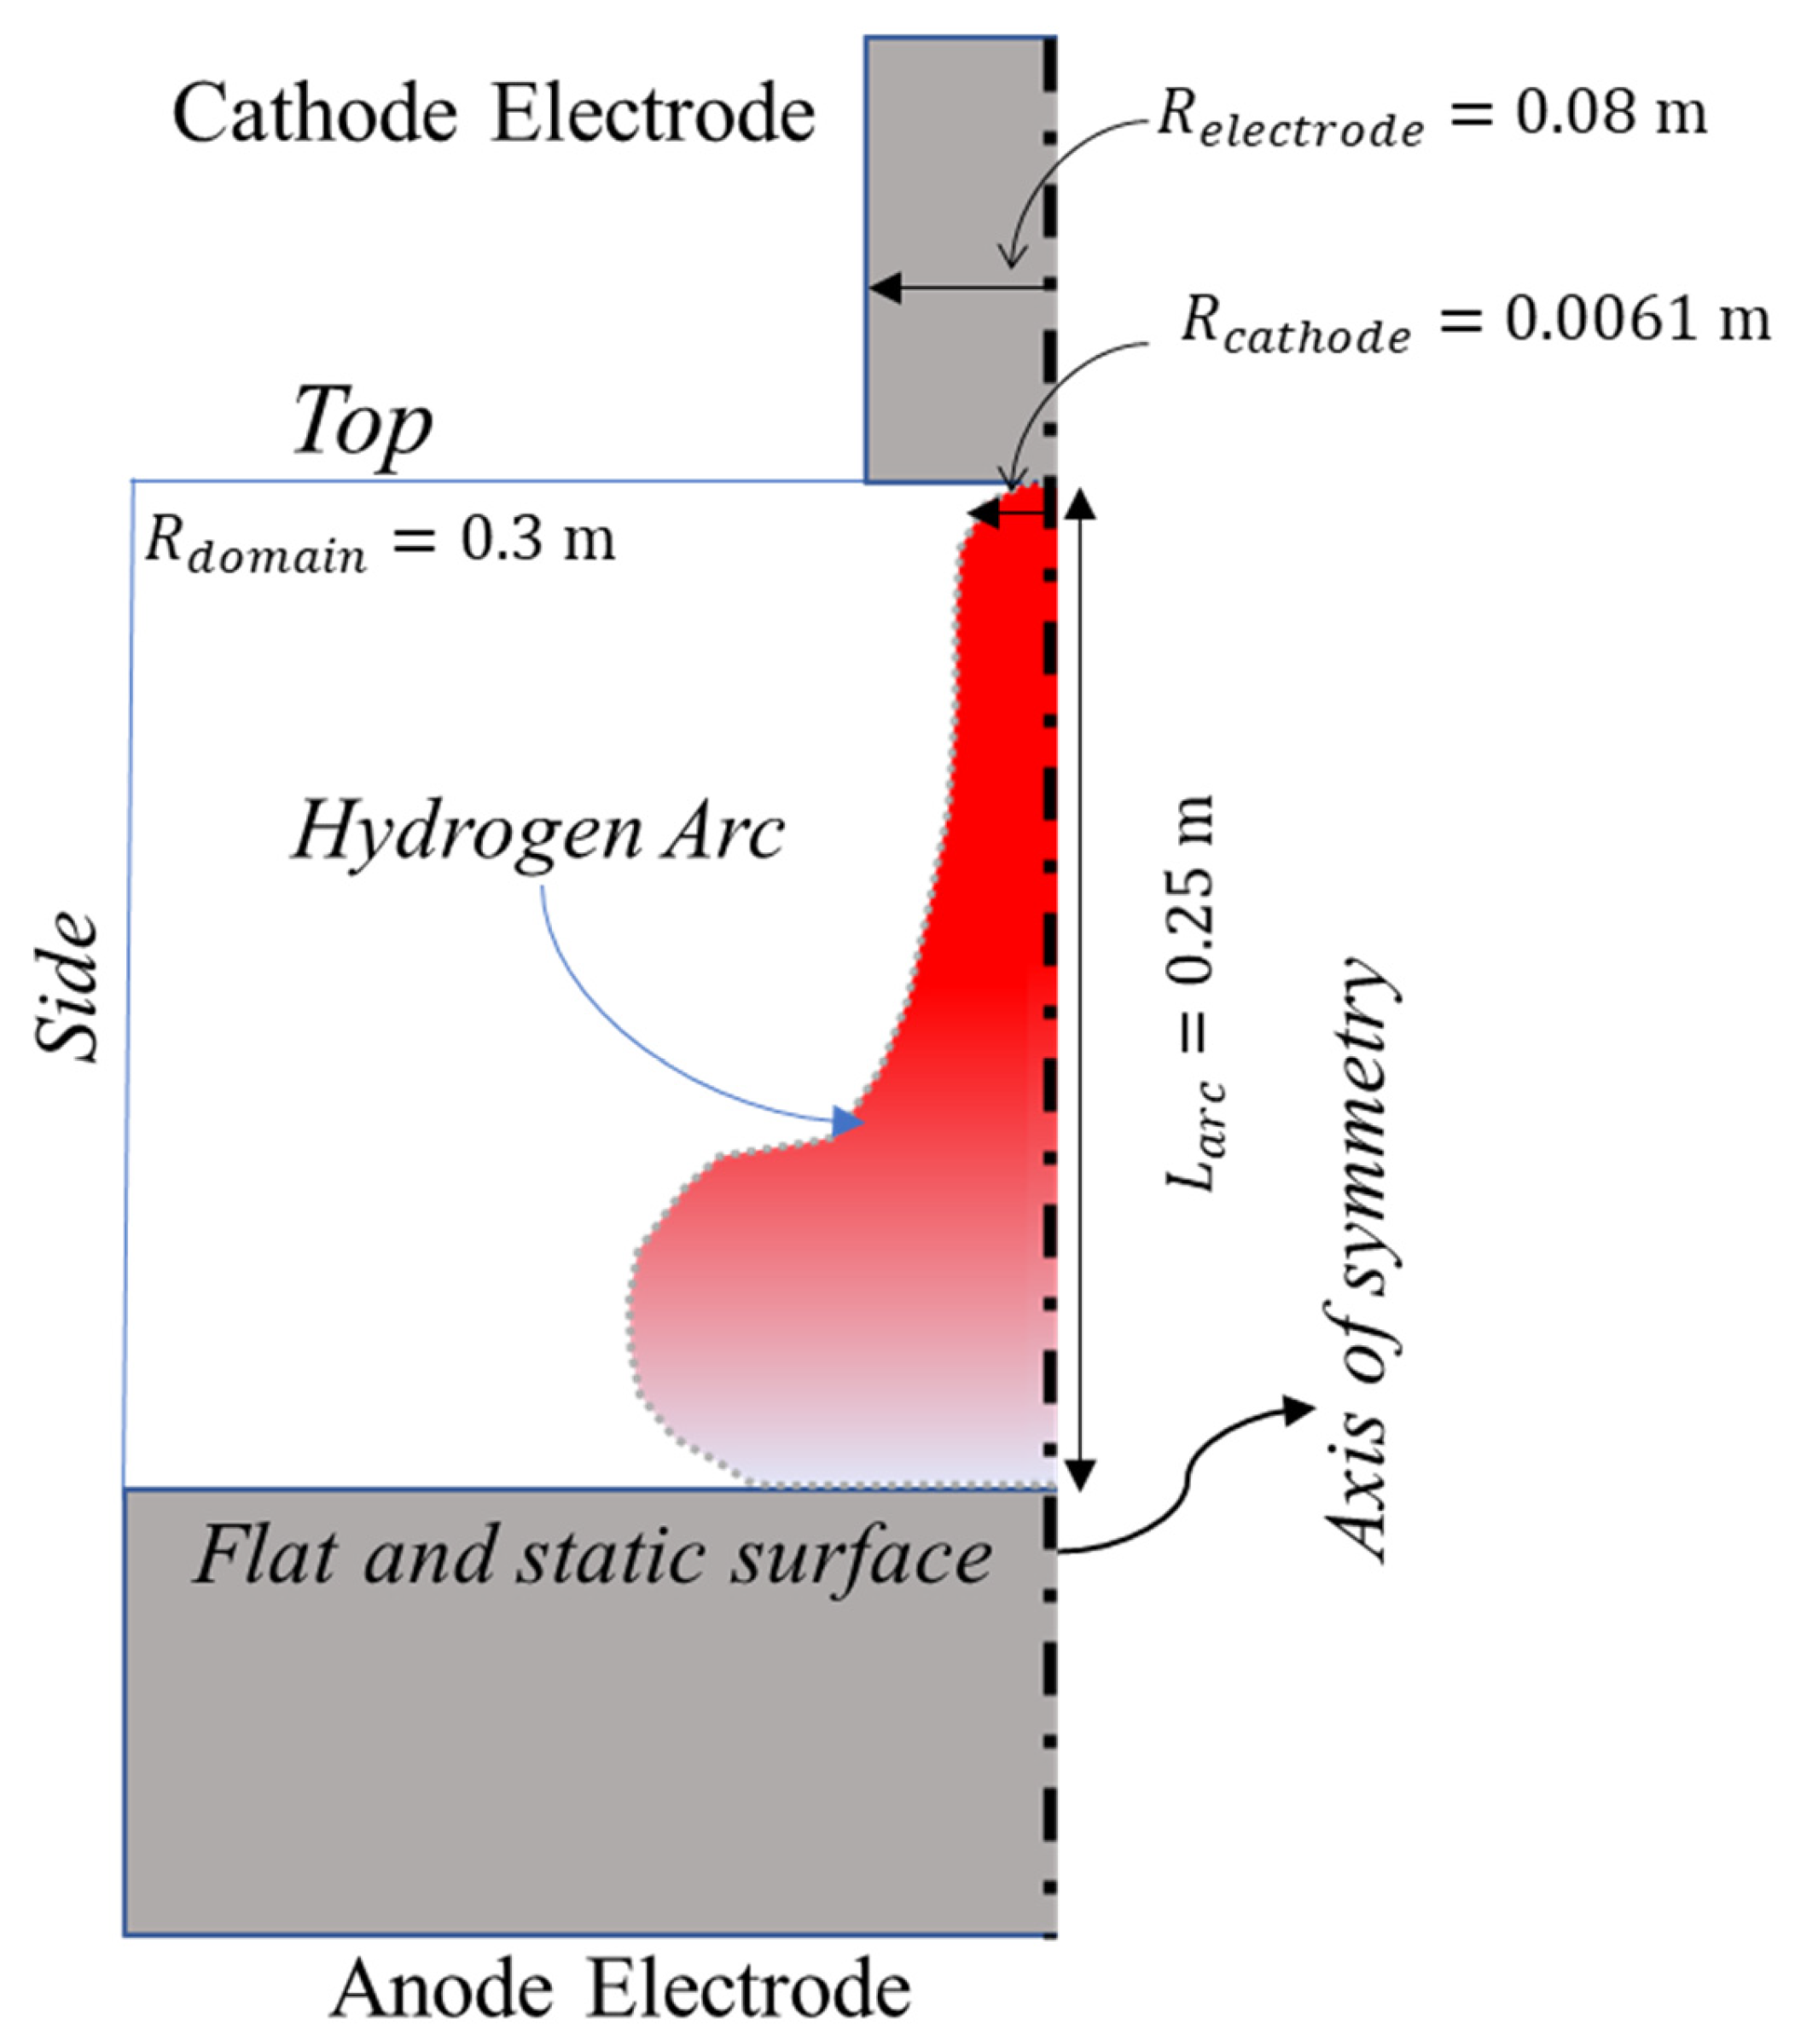
4. Boundary Conditions and Validation

The temperature of the cathode spot is set to be constant and equal to 4000 K. The top side and bottom are considered to be thermally adiabatic. A high temperature of the cathode spot is required to sustain a high current density [31,32]. The current density at the cathode spot is assumed to be constant and equal to 4.4 × 10⁷ A/m2 [7] for a total current of 5 kA. This gives a cathode spot size of 0.0061 m, as shown in Figure 1. Table 1 summarizes the boundary condition of the domain. The position of the cathode spot is set to be fixed in the center of the cathode electrode. No external magnetic field is present to interact with the applied current in this study.
The simulation involves studying the transient arc behavior with a relatively extended physical time of 10 milliseconds for the arc to develop fully. To ensure an accurate representation of the arc’s complex dynamics, a very small time step of 10−7 s is employed. The primary concern is maintaining stability and precision throughout the simulation, which is addressed through the Courant number and CFL number. Both dimensionless numbers are kept below 10. This ensures accurate predictions when solving for a coupled single-phase model. Convergence criteria are also established, requiring absolute residuals to drop below 10−3 for flow and 10−6 for the energy equation in each time step of the simulation.
The model was previously validated and compared to the previous literature [33,34,35], and the time average results of temperature and magnetic field were calculated for the incompressible model. The obtained results were compared with the steady-state results predicted by Alexis et al. [14], Figure 3a,b. A good agreement was achieved between the modeling results and the literature. It is essential to mention that Alexis et al. [14] used the potential method, while our model utilized the induction method. Despite this difference in the model, a good agreement was found between the steady-state results of the Alexis et al. [14] model and the averaged results of our model in terms of temperature and magnetic field distribution. Furthermore, the model was validated with experimental results from Sommeria et al. [36]. Figure 3c and very good agreement was found between the experimental results and the MHD model used in this study.

5. Results and Discussion

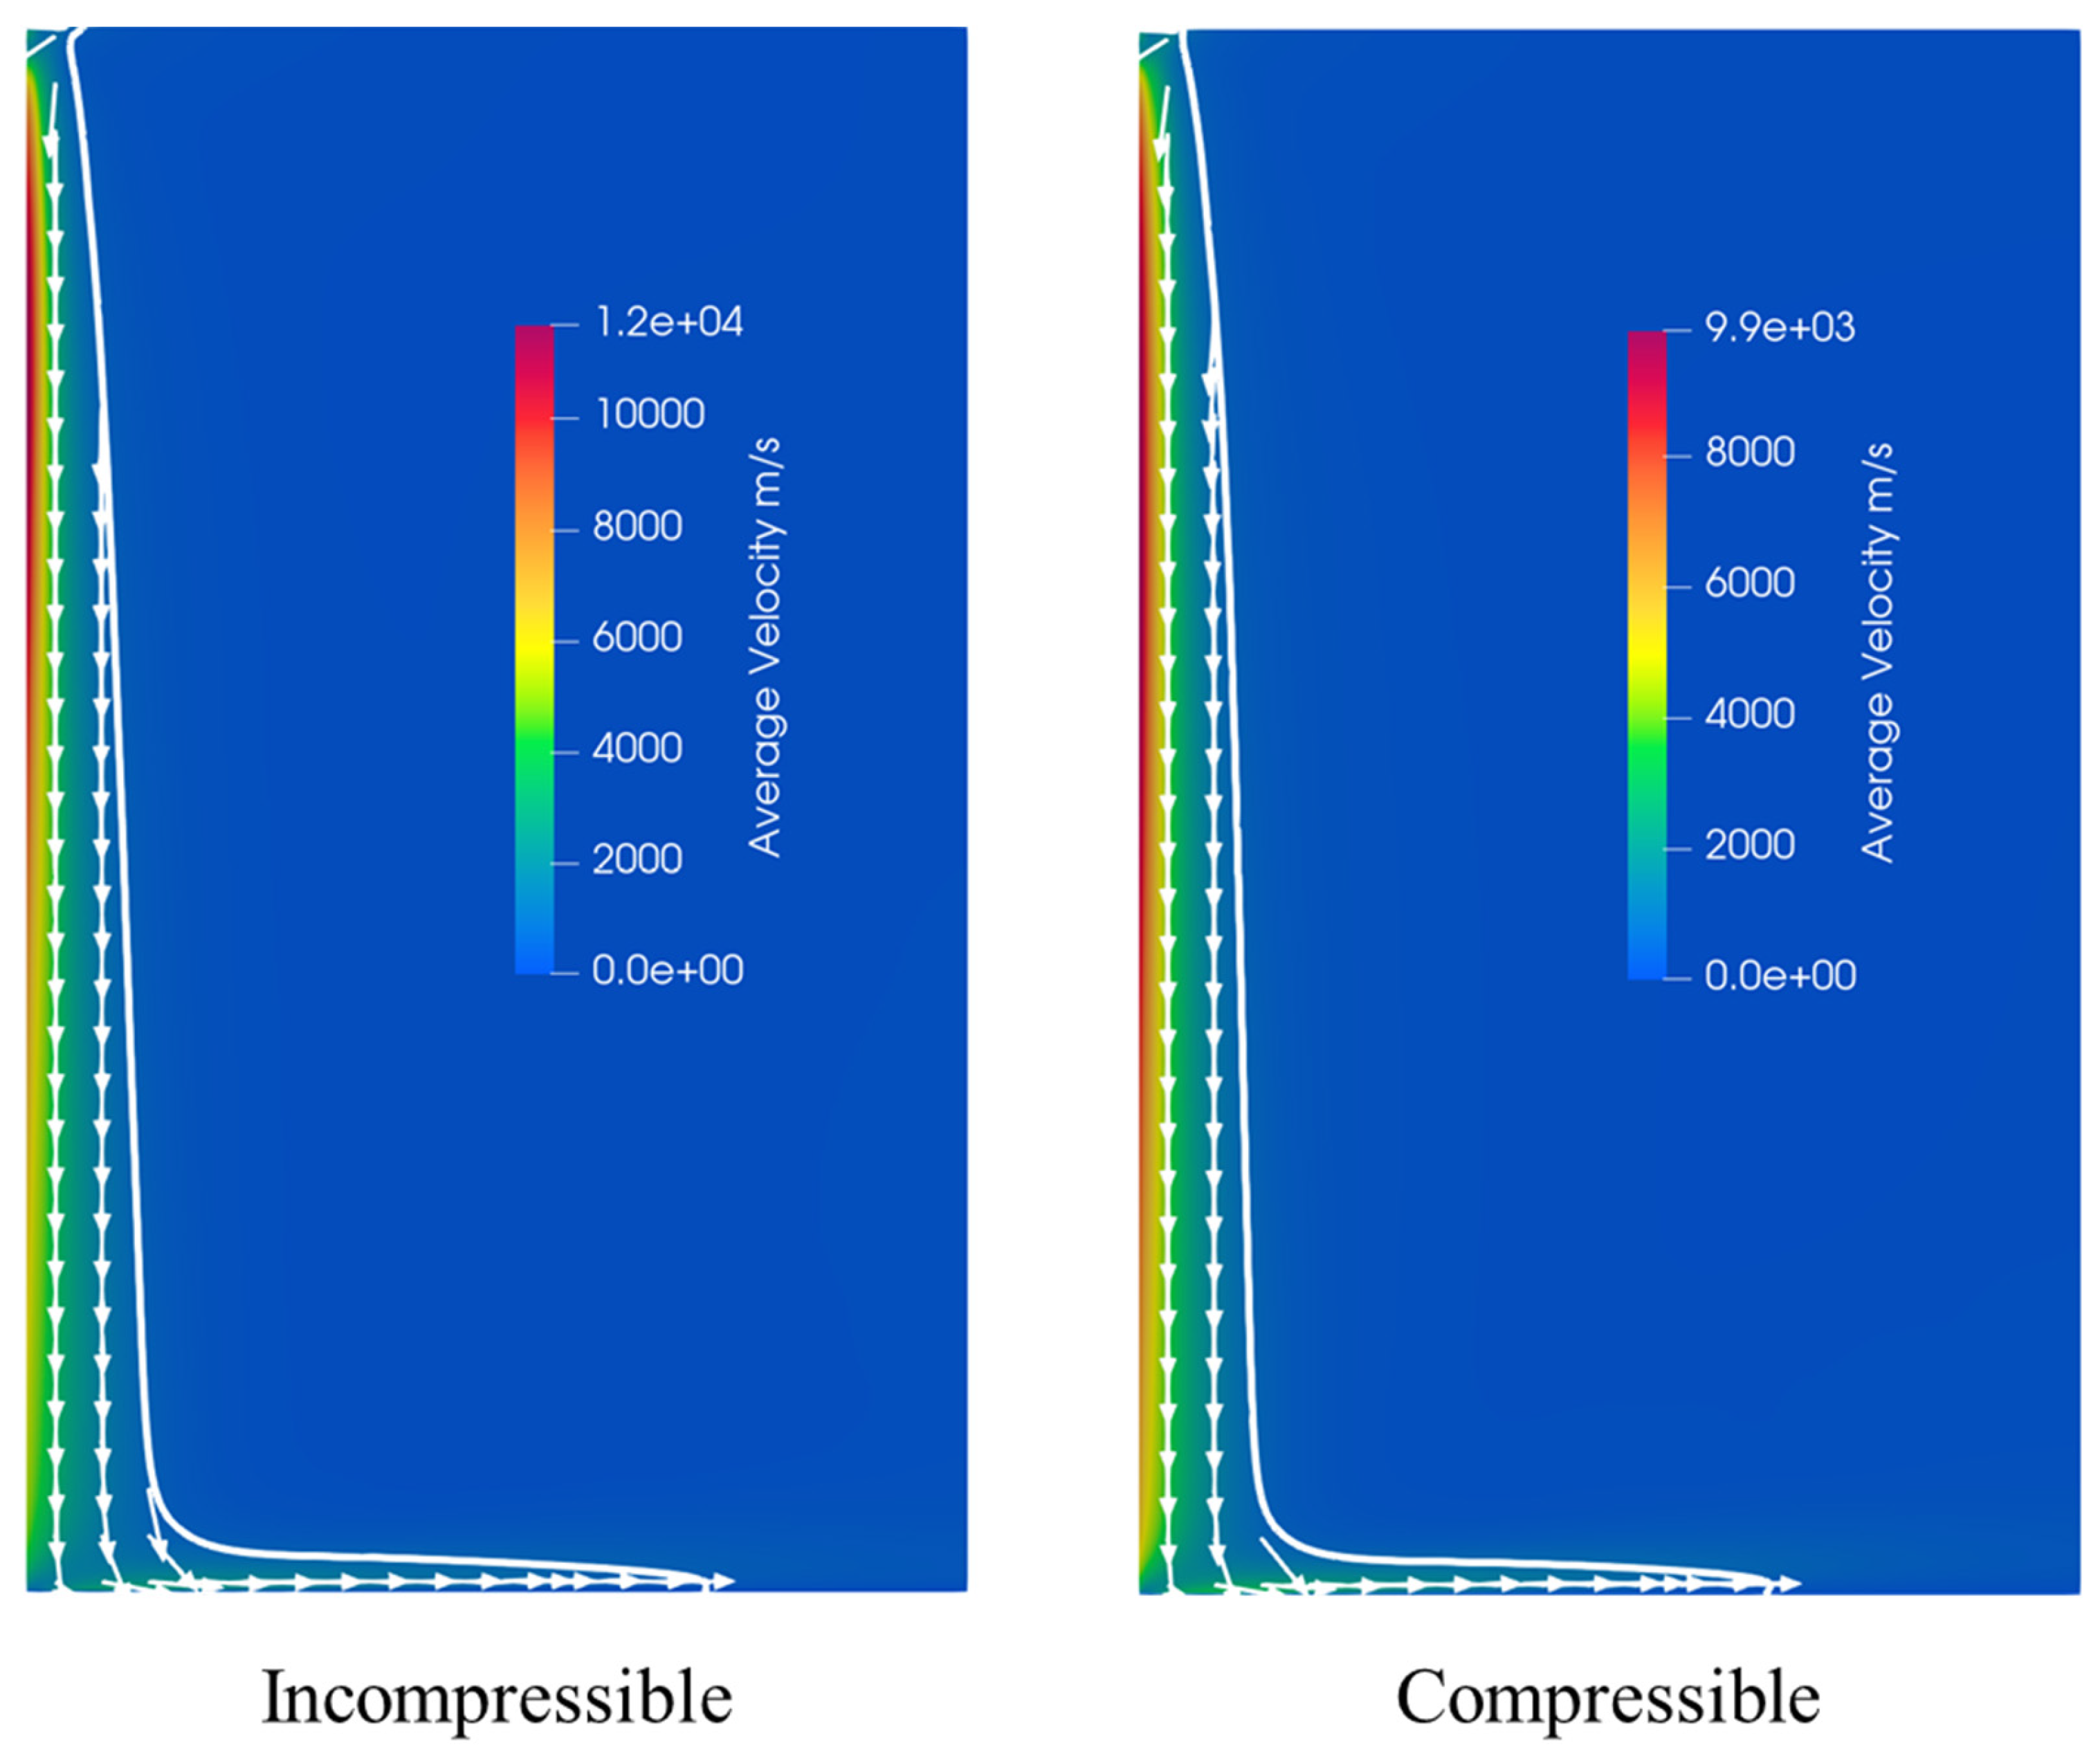
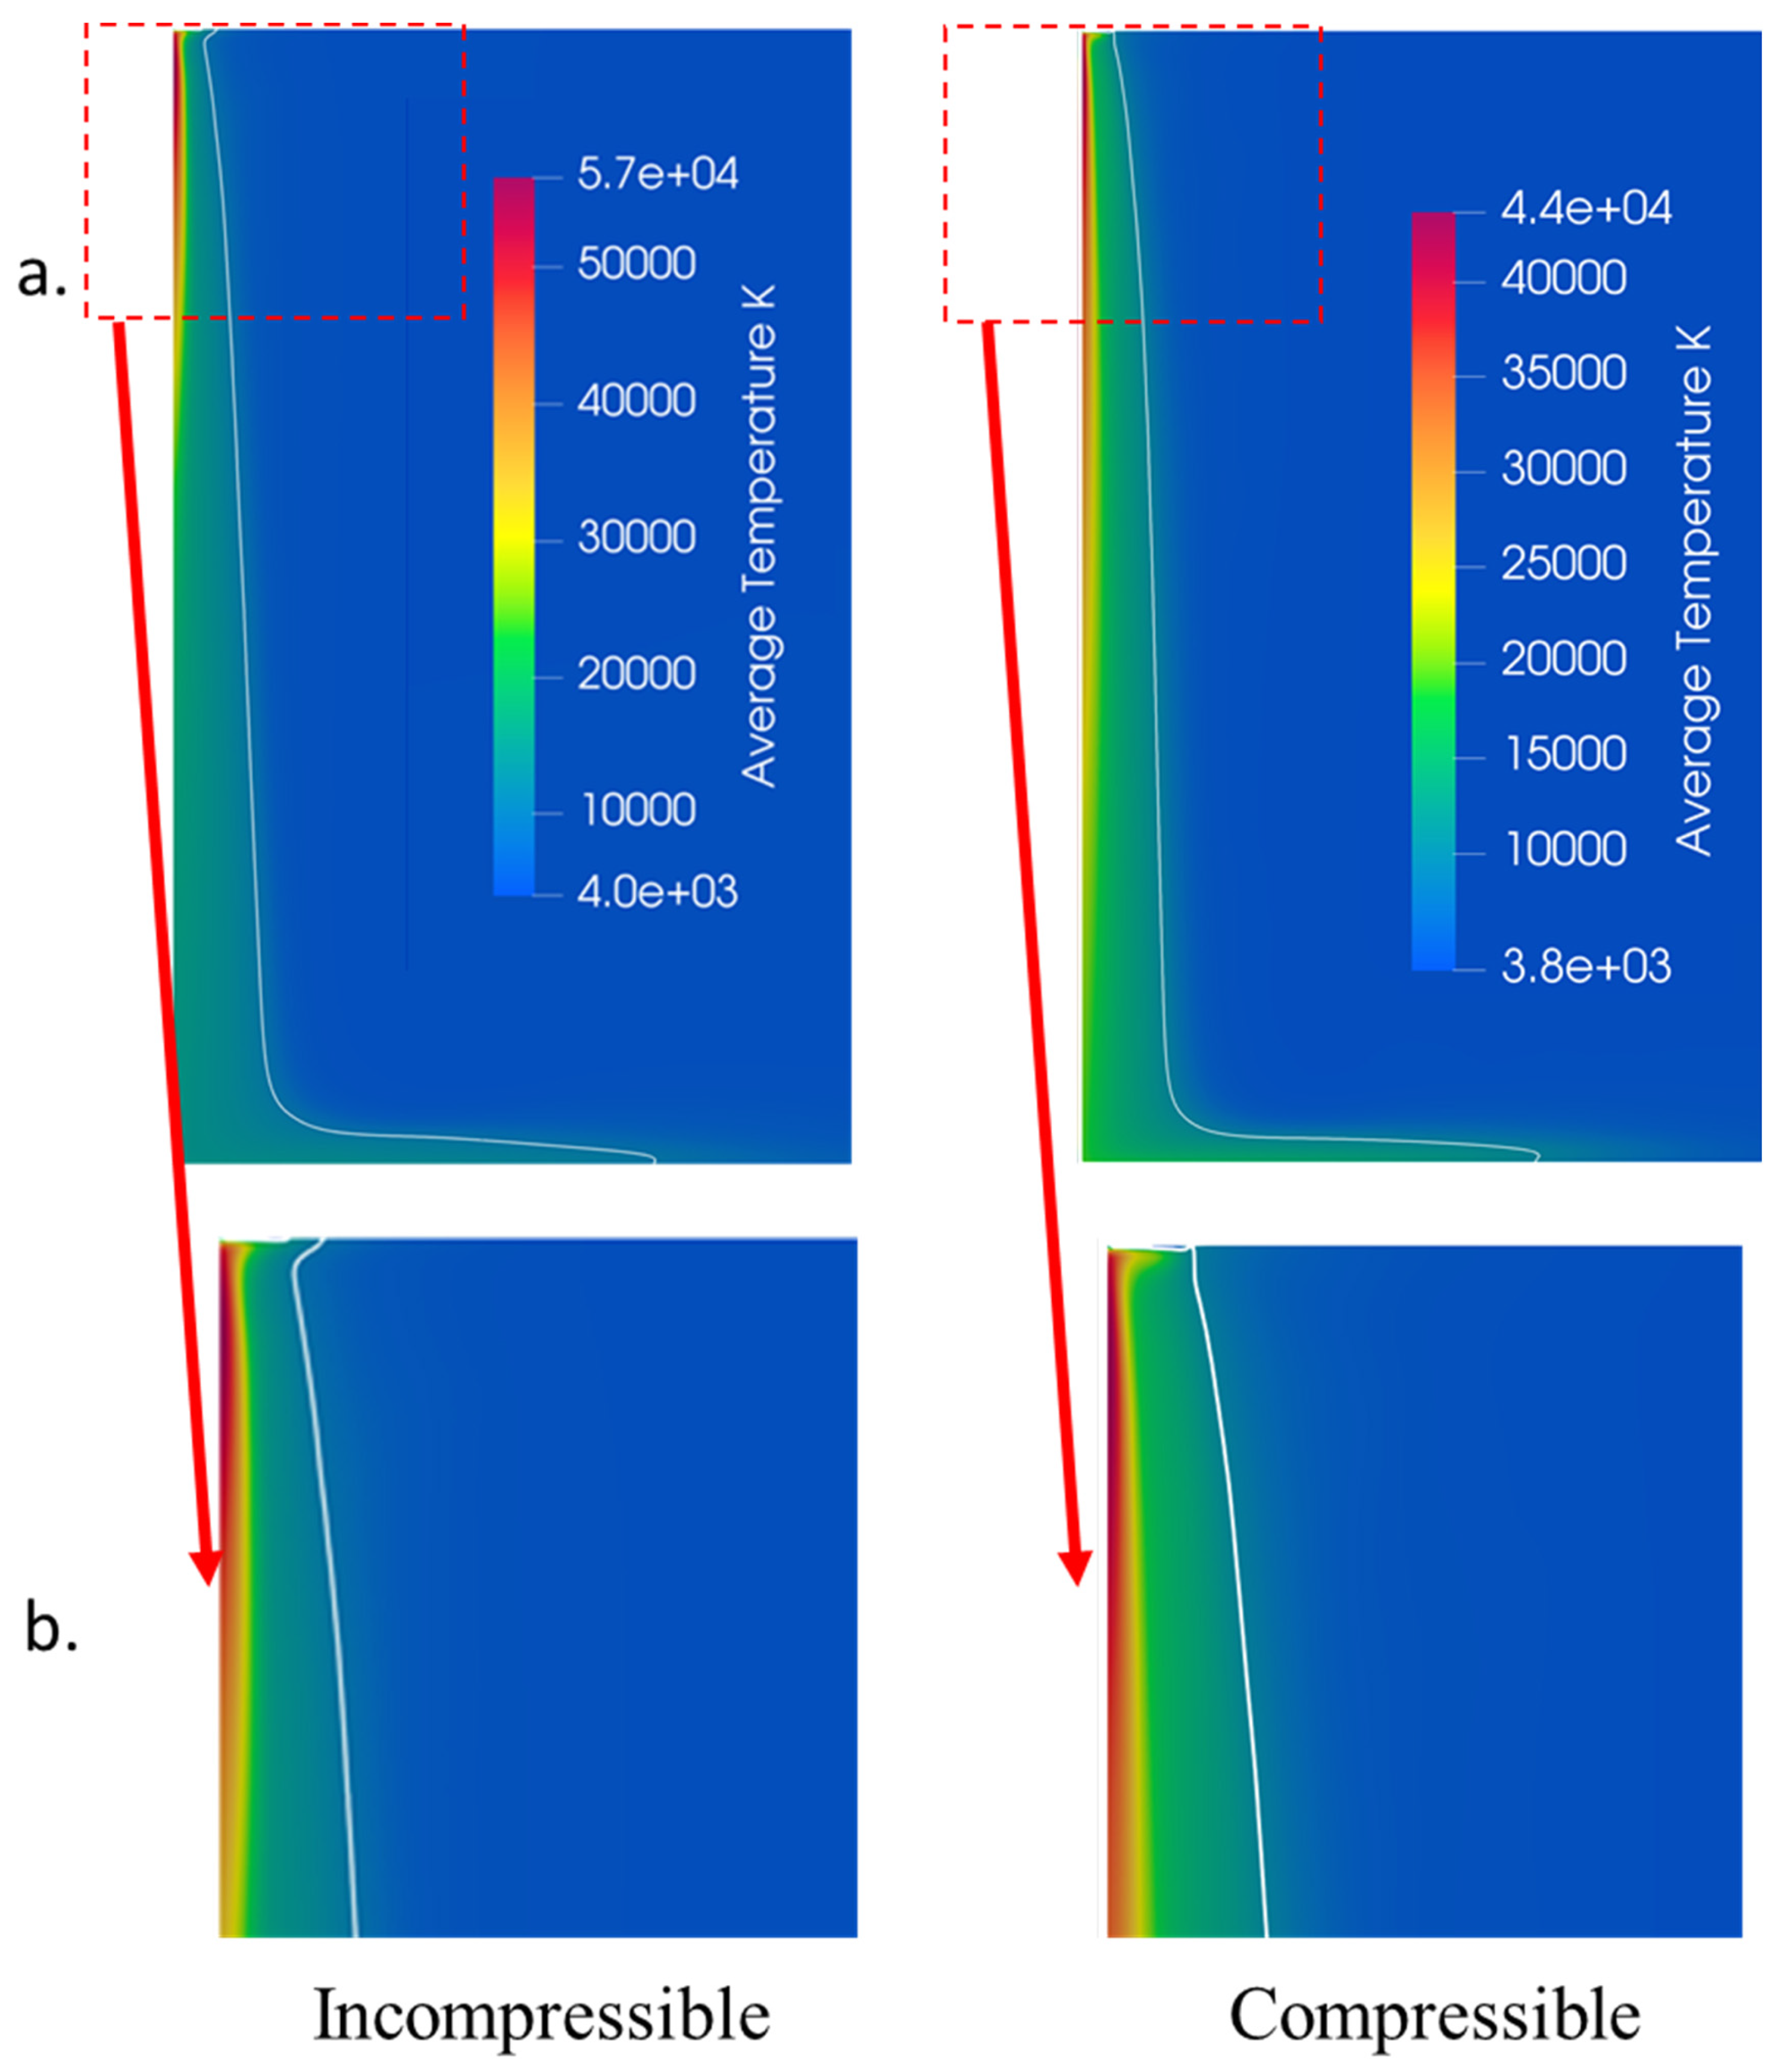
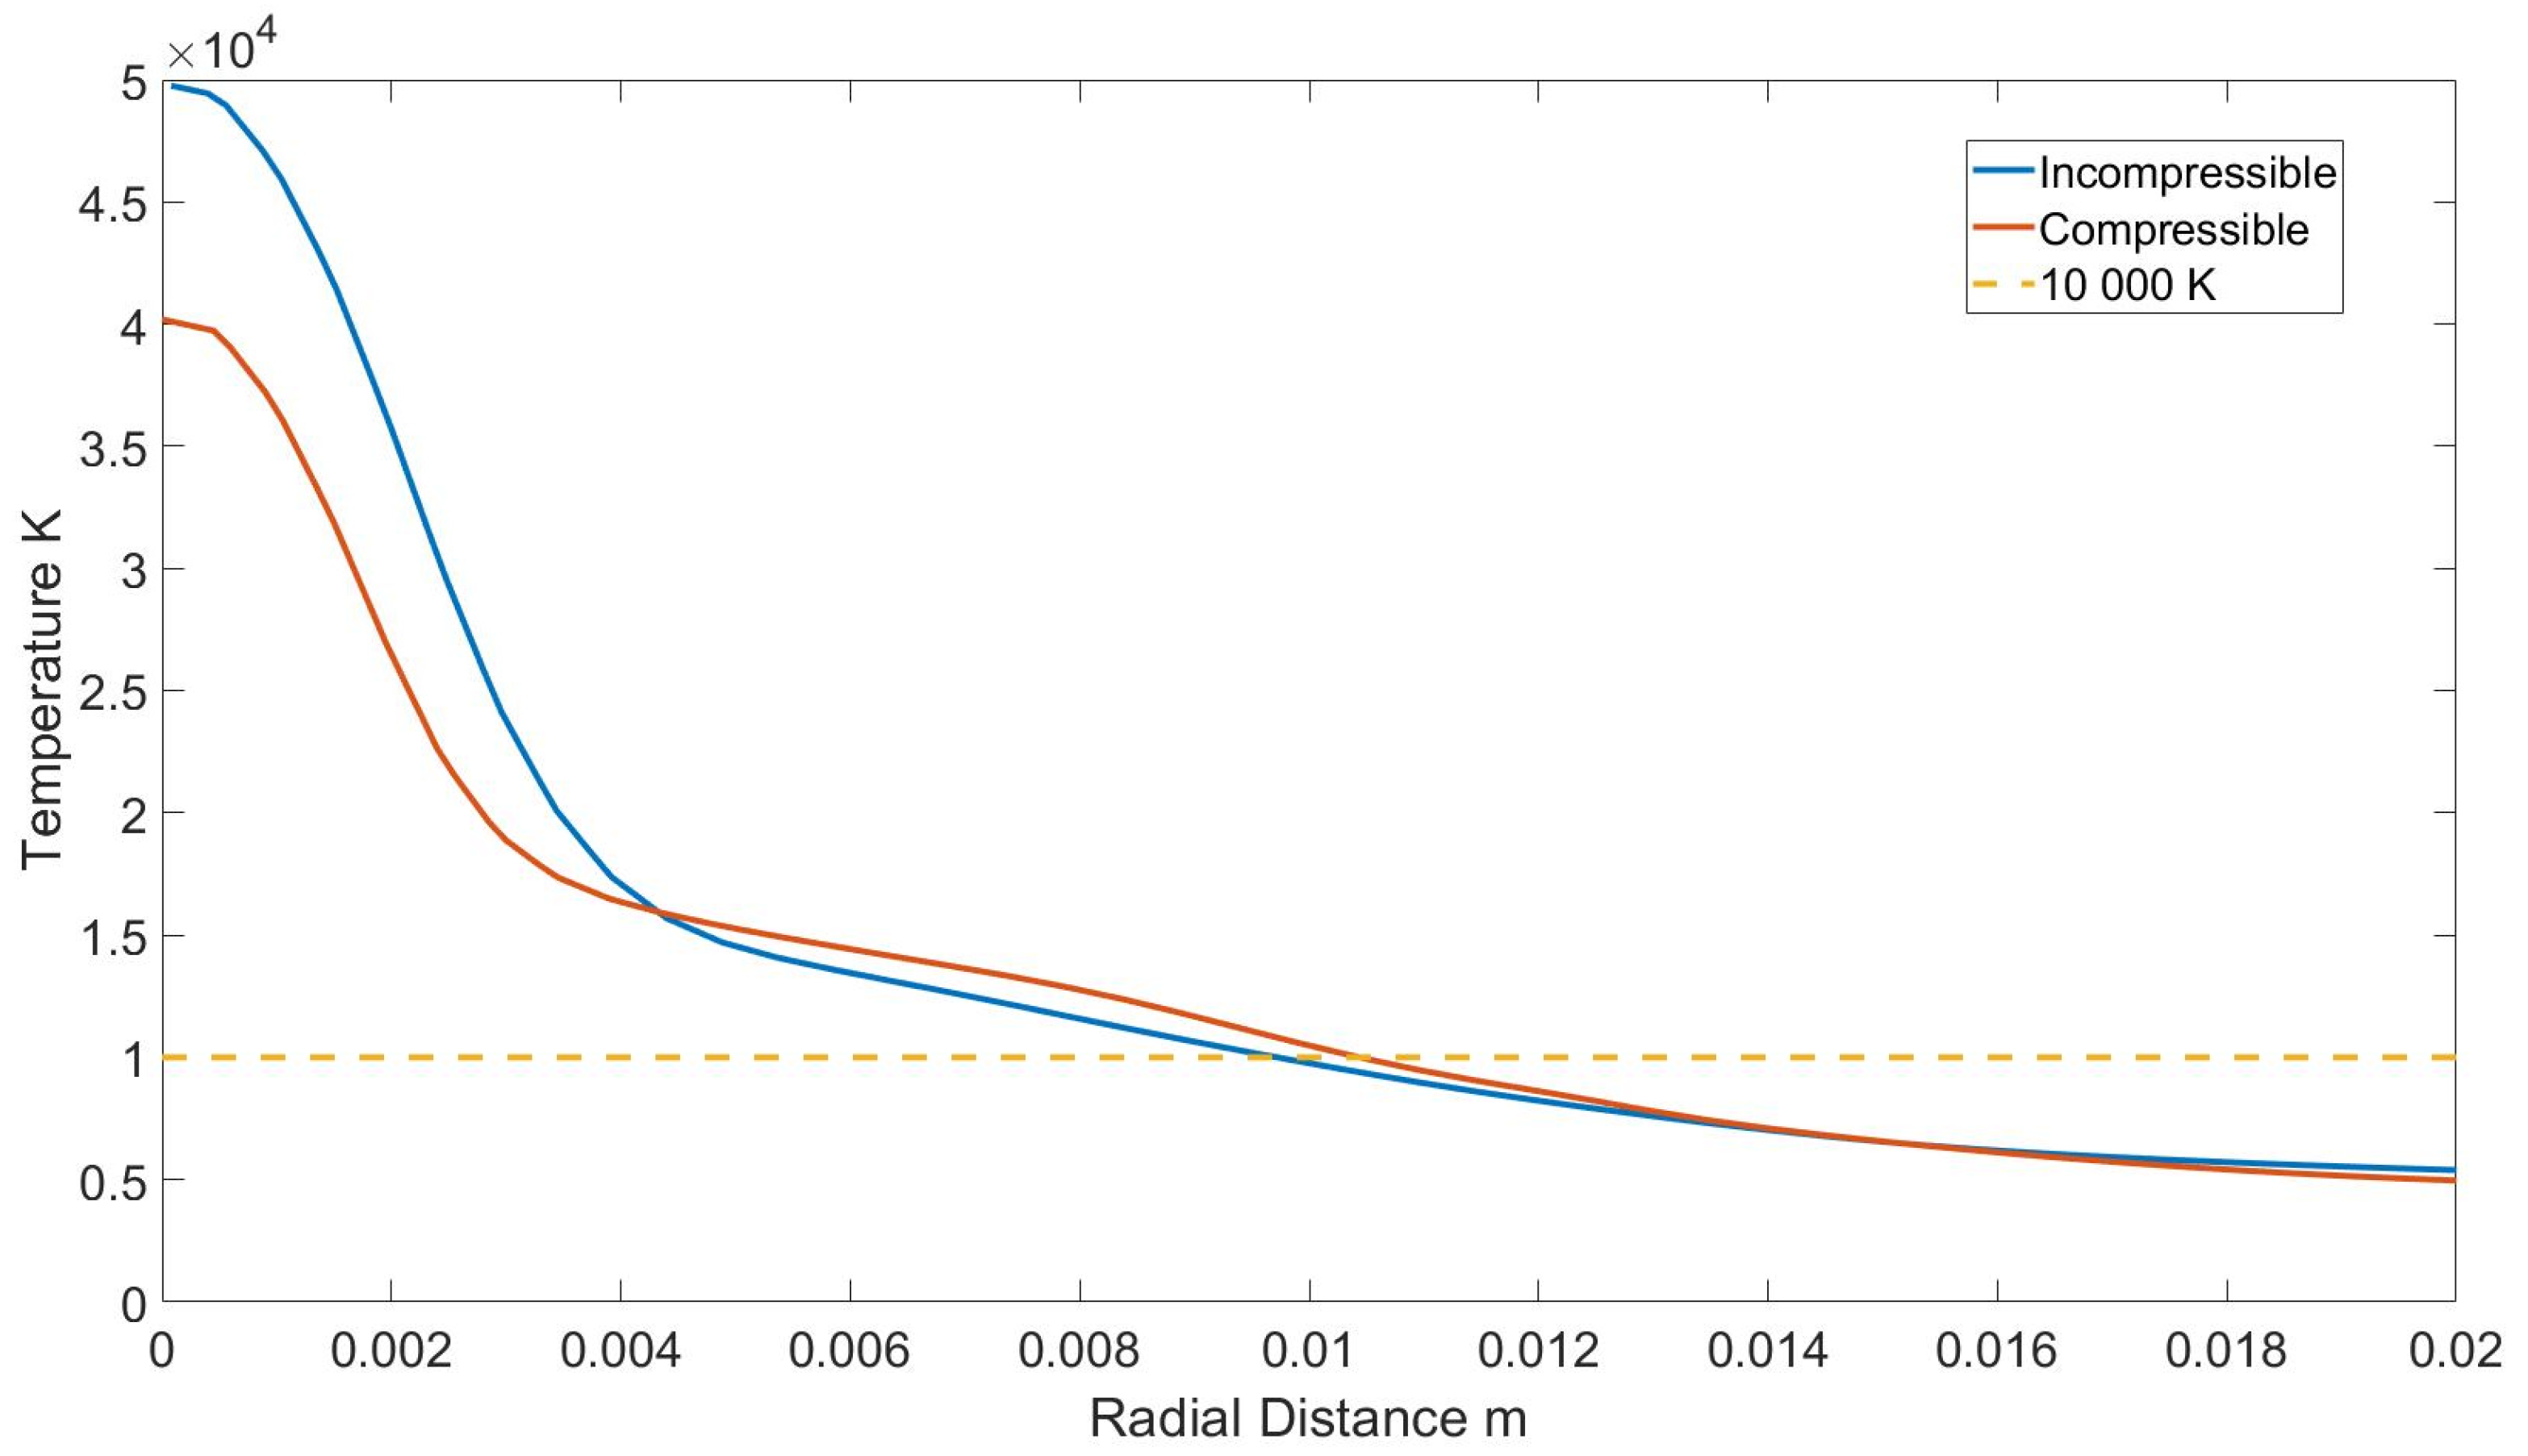
5.1. Compressible and Incompressible Simulation

The baseline scenario assumes that the flow is incompressible. In other words, the density is a function of temperature and is independent of pressure changes. This simulation is compared with a compressible ideal gas simulation. Both simulations consider an applied current of 5 kA. This enables us to assess the effect of compressibility on the hydrogen arc without any additional variables.
Figure 4 shows the average velocity distribution for both models for 10 milliseconds of physical time. Both models predict similar flow patterns; however, the incompressible model predicts higher speed. The maximum speed predicted by the incompressible model is 12,248 m/s, while the compressible model predicts a speed of 9900 m/s. The compressibility reduces the maximum flow by 20% compared to the incompressible flow. While the maximum velocity of the arc decreases in a compressible medium, the velocity distribution becomes more uniform. In contrast, within the incompressible model, the velocity distribution is less uniform, and the velocity decreases rapidly away from the cathode region. Figure 5 shows the average temperature distribution inside the arc over the same period. The white contour line represents the isothermal boundary at 10,000 K, and it encloses the area where the majority of the electric current flows. The high electrical conductivity in this region allows for the passage of sufficient current densities. The maximum temperature inside the incompressible model reaches 57,000 K, while the temperature of the compressible model reaches 44,000 K. Despite the high temperature predicted by the incompressible model, a more uniform distribution of temperature is observed in the compressible model.
Figure 6 compares the voltage drop between the incompressible and compressible plasma models, with the voltage drop calculations based on Equation (7). While both models exhibit similar voltage trends, the compressible plasma model predicts a higher voltage drop. The dashed lines represent the average voltage drop values for both models over 10 milliseconds. For the incompressible arc model, the average voltage drop is 364 V, whereas it is 403 V for the compressible arc. This can be interpreted by knowing that the compressible arc model leads to higher density distribution compared to the experimental data. Both models compute the specific heat identically (Figure 3), while the density is expected to be higher in the compressible model leading to higher enthalpy for the compressible model compared with the incompressible model. Higher enthalpy for the same applied current leads to lower temperature inside the compressible model. This is observed in Figure 5. We know that electrical conductivity is proportional to temperature (Figure 3). Thus, the voltage drop is expected to be high in compressible flow (Equation (7)). Ramírez [13] investigated the effect of compressibility for a 40 kA and 25 cm arc gap. The findings stressed the importance of the compressibility influence. However, due to challenges with numerical convergences, further investigations were disregarded. The study suggests that compressibility has the effect of reducing arc velocity, enhancing plasma density, and diminishing the temperature distribution. A noteworthy distinction within the current study lies in the projection of a lower voltage for the compressible formulation. In the work conducted by Reynolds [19], a discernible voltage difference was observed when comparing incompressible simulations with semi-empirical data derived from experimental measurements. Reynolds developed a computational model specifically to investigate the interaction between the arc and slag in a DC furnace. Despite the incompressible model successfully capturing the overall trends, Reynolds noted a significant discrepancy in voltage predictions, with the model indicating much lower voltages compared to the experimental data. Al Nasser et al. [24] conducted a study that investigated the behavior and dynamics of a direct current electric arc within an industrial electric arc furnace. The simulation employs a 2D axisymmetric geometry, where a substantial 40 kA current traverses between two electrodes with a gap of 0.25 cm. The main findings of the study included multiple effects of compressibility on the electrical properties of the arc. Notably, compressibility induces a higher voltage drop across the arc compared to the incompressible model. Furthermore, the inclusion of compressibility results in a significant reduction in the jet velocity of the arc, approximately one-third lower than the prediction of the incompressible model. The findings of the aforementioned study are in line with what is found in this paper. However, it is important to mention that the arc atmosphere is air in [24], while it is hydrogen in the current study. Additionally, the applied current is 40 kA [24], while for hydrogen it is 5 kA.
Figure 7 depicts the average temperature variation as a function of radial distance from the center of the domain. The temperatures were recorded at a depth of 0.025 cm beneath the cathode spot. Inside the incompressible model, the temperature distribution exhibits higher values at the core of the arc compared to the compressible model. However, it also shows a steeper decrease, with the arc’s temperature dropping below 10,000 K at a radial distance of 0.0092 m. Conversely, the compressible model predicts lower temperatures at the core of the arc, but the region with temperatures above 10,000 K extends further. For the compressible arc, the radius equals 0.0105 m. The lower temperature at the core of the arc, coupled with the wider arc, helps to explain the higher voltage drop observed in Figure 6 for the compressible arc.

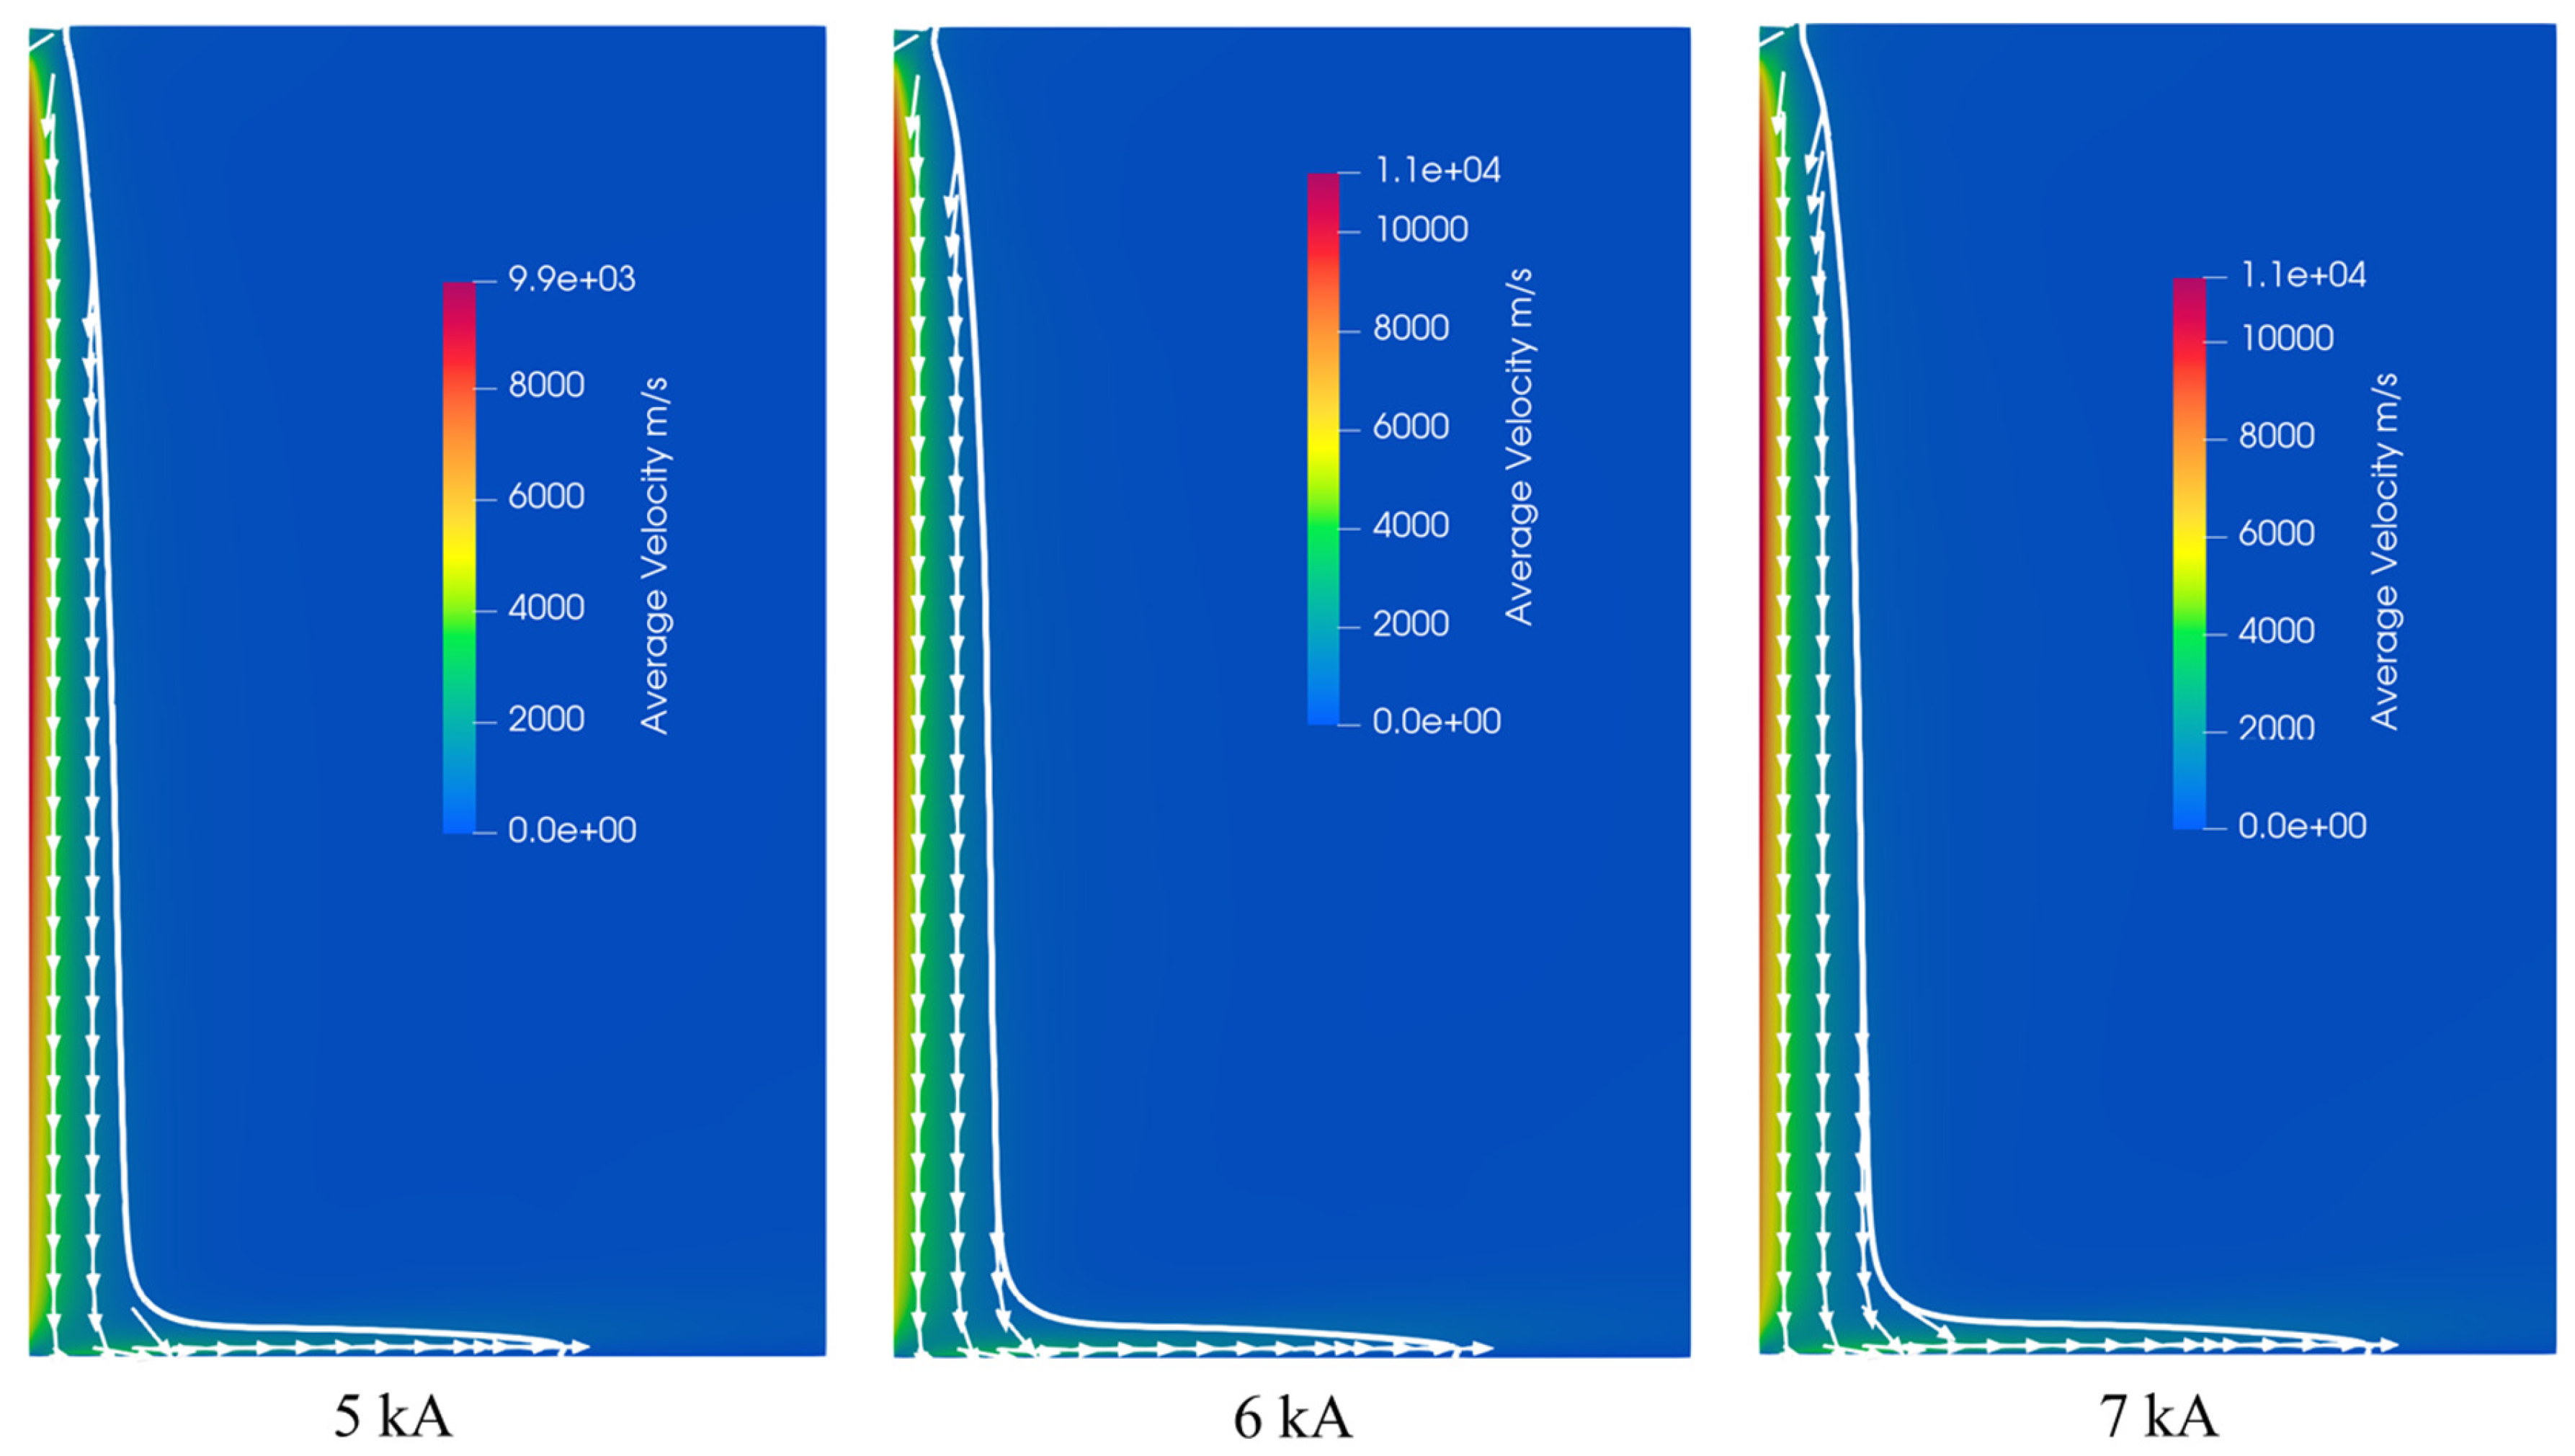
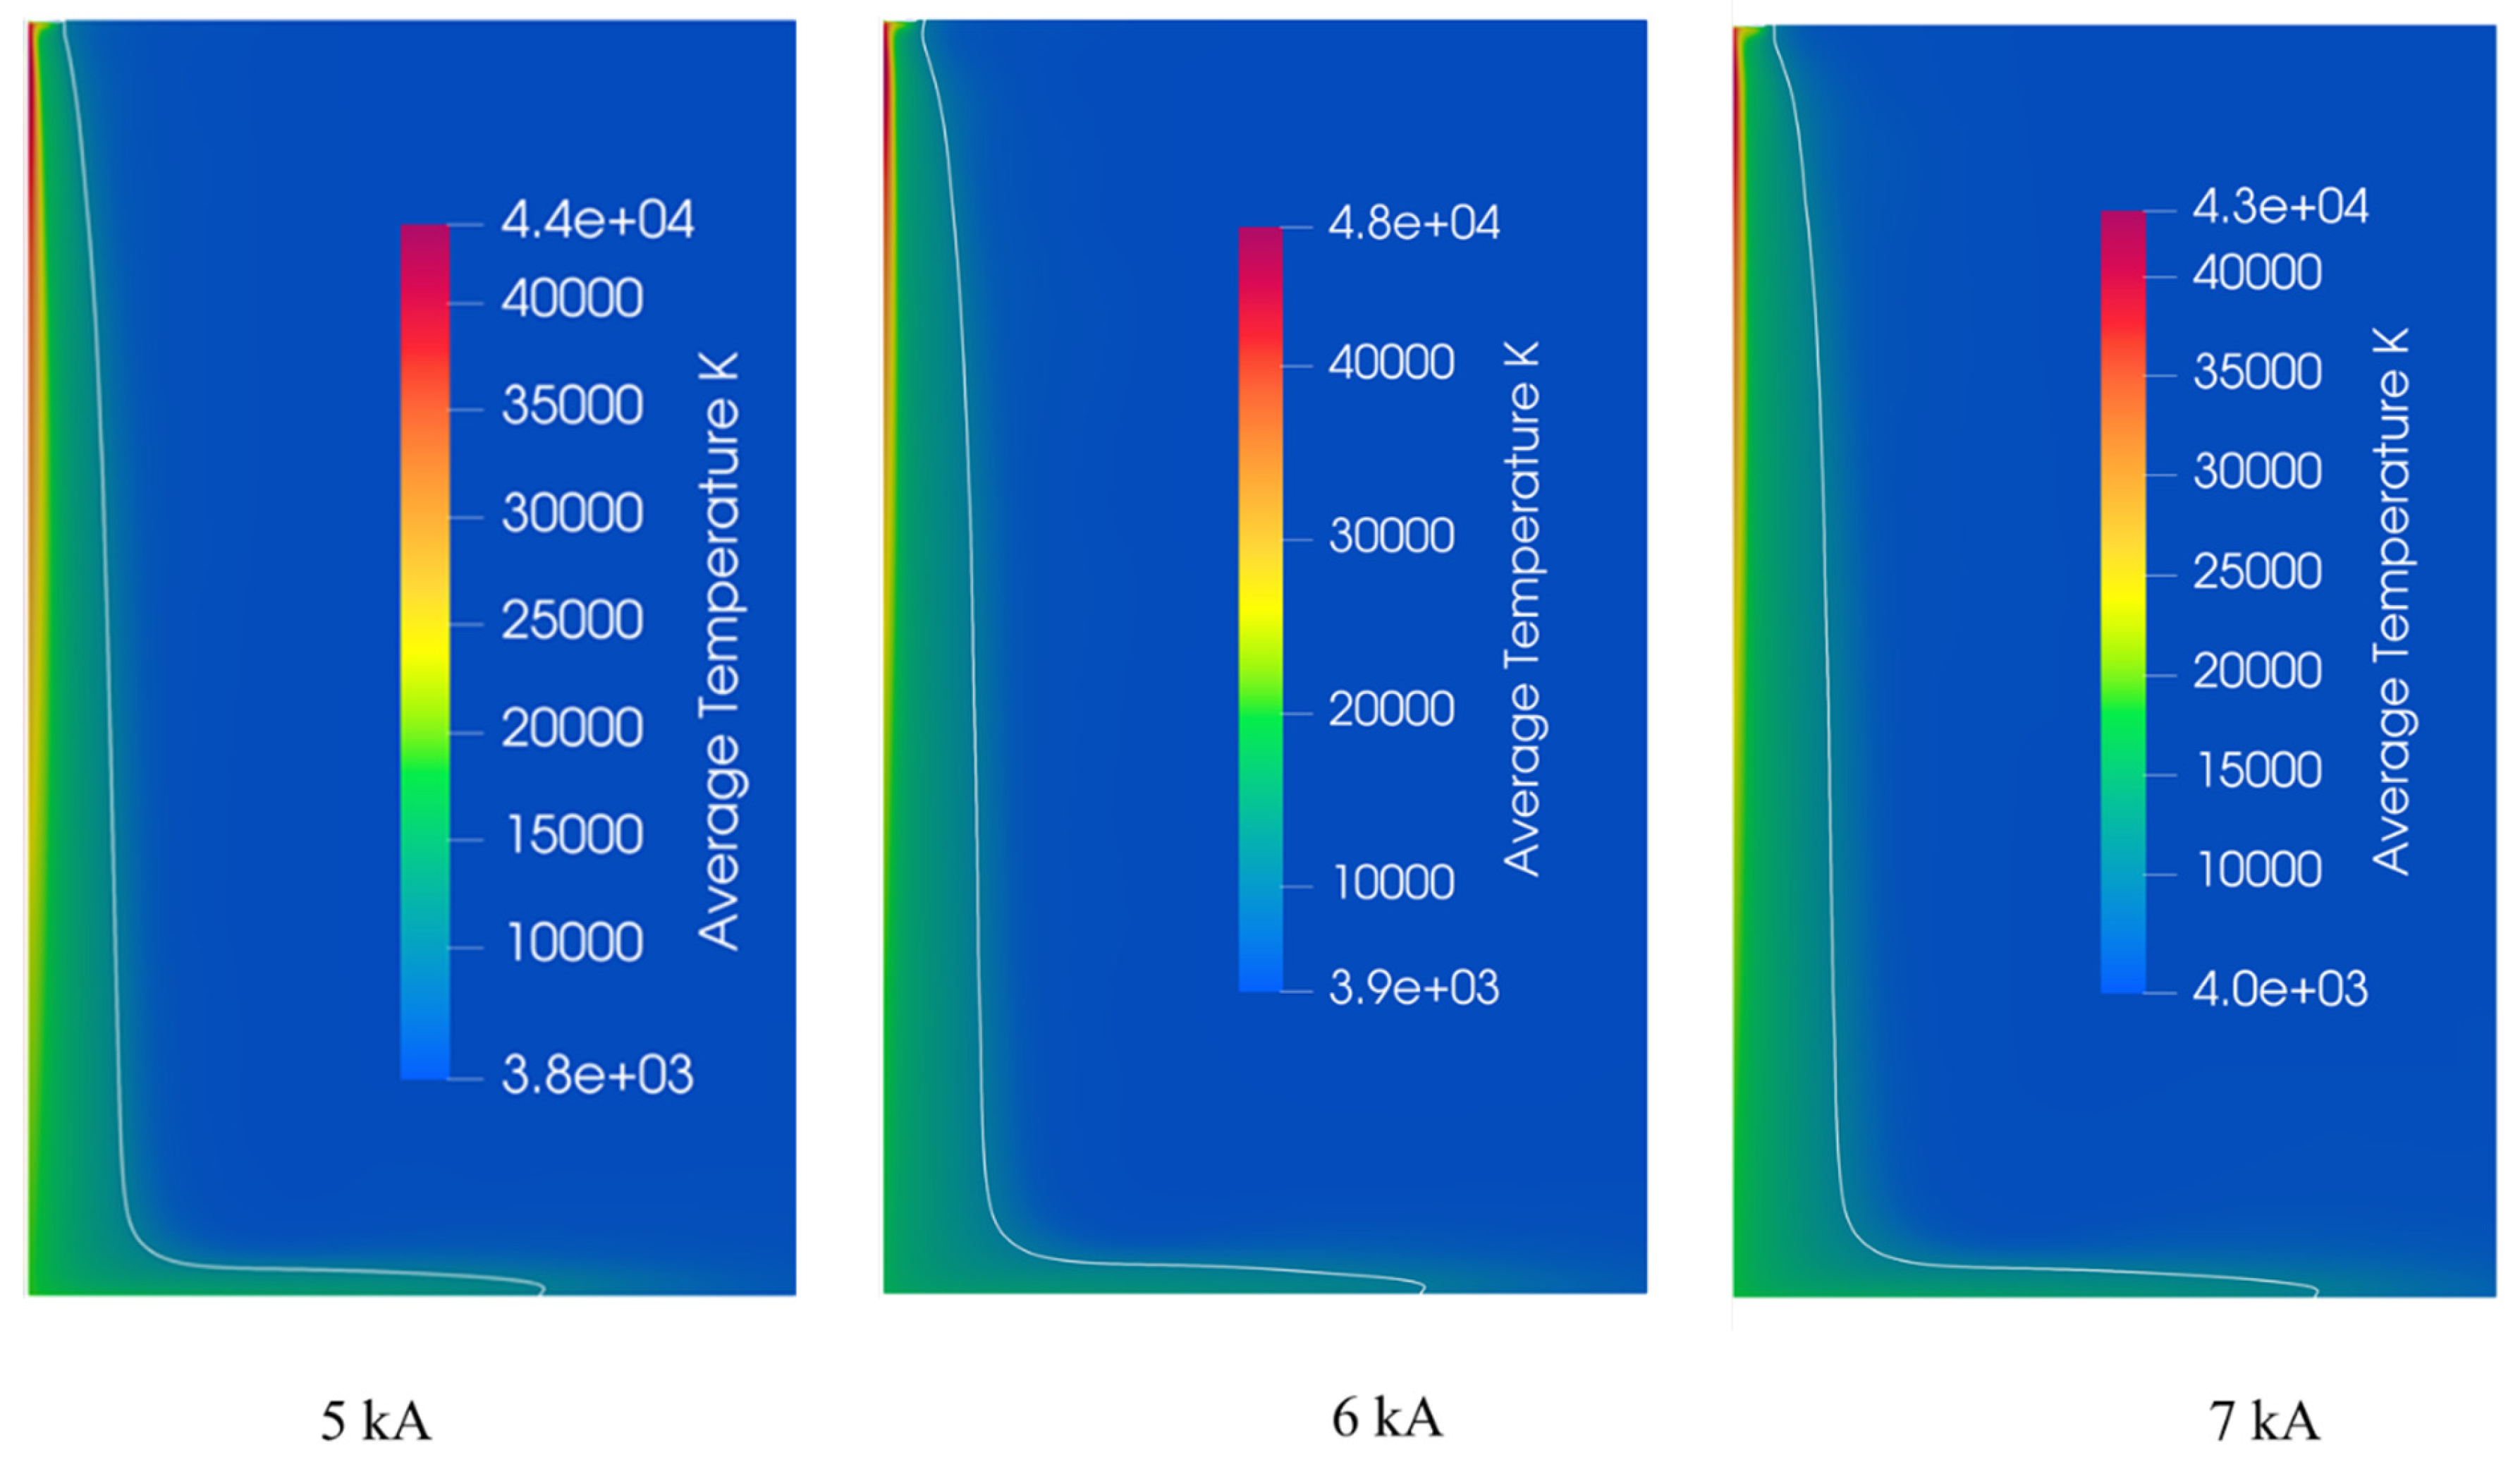
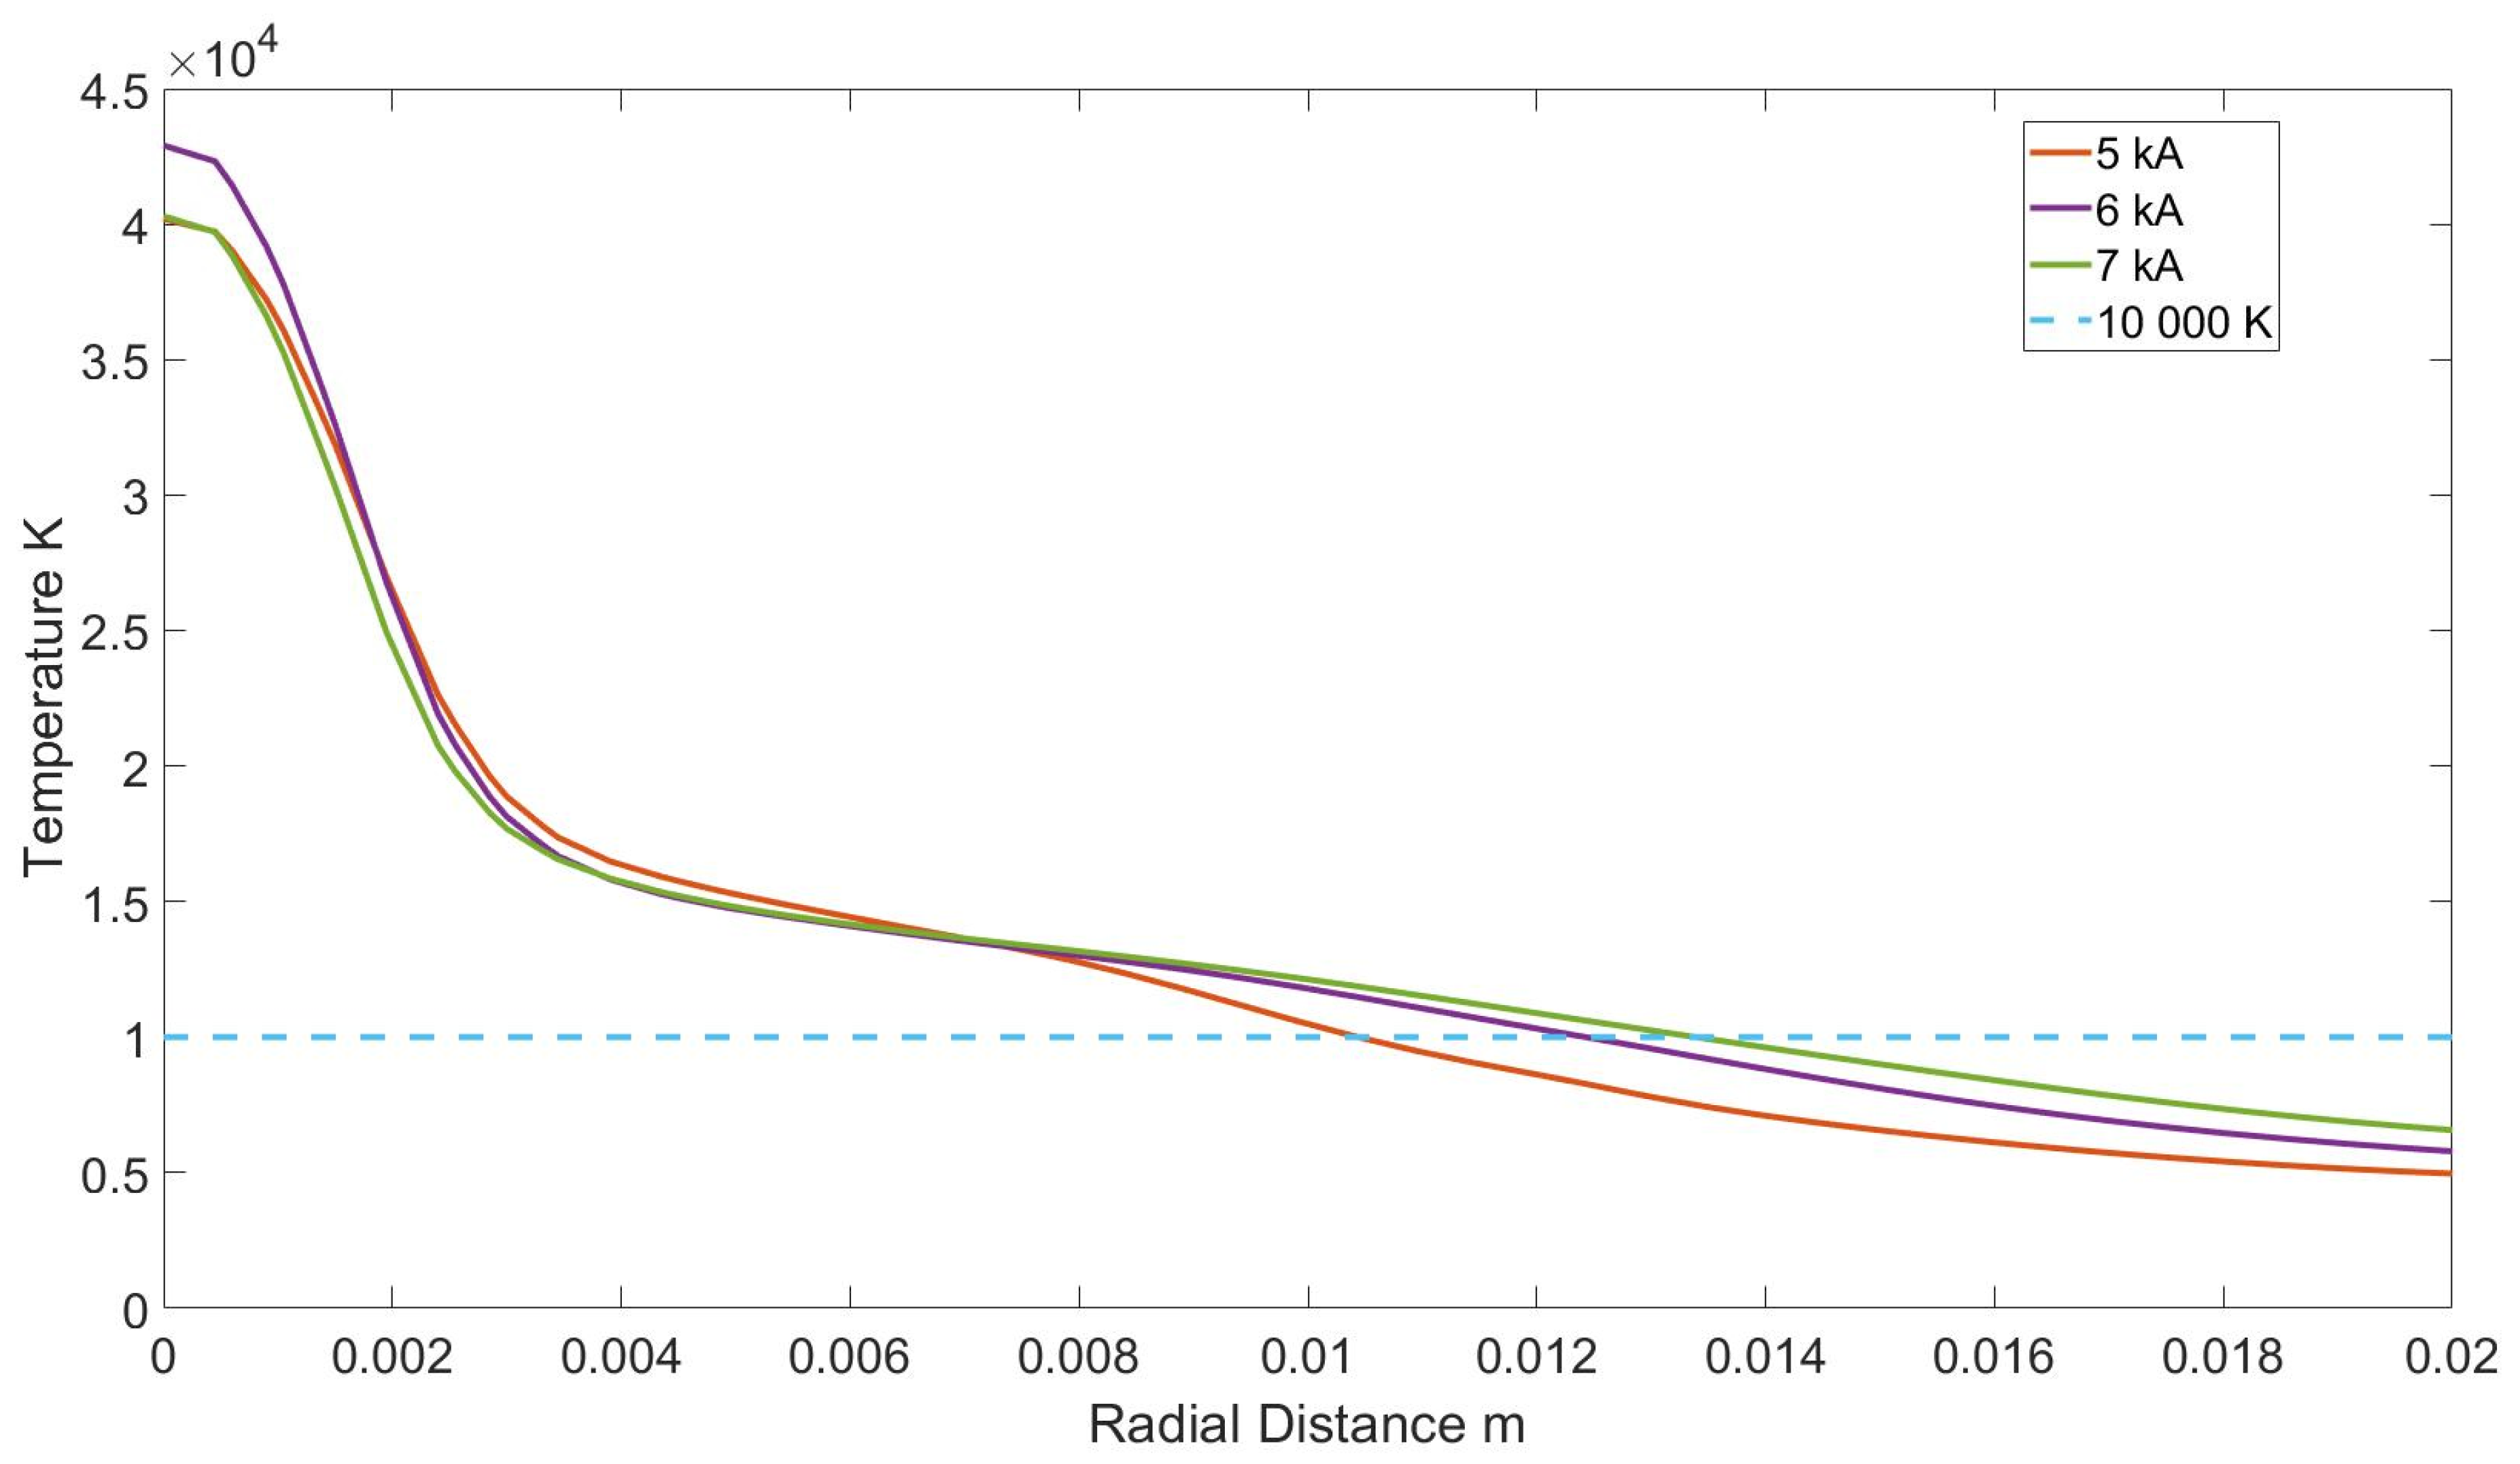
5.2. Effect of Applied Current

The effect of applied current on the arc dynamics for compressible hydrogen plasma is analyzed in this section. Herein, results considering different applied electric currents, including 5, 6, and 7 kA, are presented. Figure 8 shows the average velocity distribution for the arc for three different current values. With the increase in current from 5 to 6 kA, the velocity increases from 9900 m/s to 11,000 m/s. However, the velocity increases slightly to reach 11,280 m/s at 7 kA. The increase in applied current leads to an increase in velocity; nevertheless, the increase is non-linear and the rate of increase tends to decrease with an increase in the applied current.
The comparison of average temperature distribution for compressible flow over 10 milliseconds is shown in Figure 9 for 5, 6, and 7 kA arcs. The maximum temperature of the arc is 44,000 K for 5 kA, while it is 48,000 K for 6 kA and decreases slightly to 43,000 K at 7 kA. Despite the increase in applied current, the maximum temperature of the arc core is almost in the same range. The temperature range is not affected significantly by the increase in applied current.
Further insights can be gathered by examining the arc radius. Figure 10 illustrates the radial temperature distribution along the arc at a depth of 0.025 m beneath the cathode spot. In the case of the 5 kA arc, the core temperature reaches 44,000 K, and the temperature decreases rapidly, falling below 10,000 K at a radius of 0.0105 m. For the 6 kA arc, the core temperature rises to 48 000 K and decreases at a slower rate, dropping below 10,000 K at 0.0125 m. In the case of the 7 kA arc, the core temperature reaches 43,000 K, but the region with temperatures above 10,000 K extends to a radius of 0.0135 m. This confirms that the increase in applied current does not increase the core temperature of the arc but leads to a larger arc radius.
Figure 11 illustrates the voltage drop as a function of time for the compressible model. Although they exhibit different average voltage drop values, the structures of the arc voltage drop closely resemble each other. A direct correlation between the arc radius and voltage drop can be observed, indicating that the voltage drop increases with the radius of the arc. However, the increase in applied current is not proportional to the voltage drop. Specifically, the voltage drop for the 5 kA arc was 403 V, increasing to 417 V for the 6 kA arc and 421 V for the 7 kA arc. The increase in voltage drop can also be related to the increase in arc radius while having an almost constant core temperature inside the arc.
The behavior of the compressible arc with the increase in applied current exhibits several significant trends. As the applied current increases, a concurrent increase is noted in several parameters including voltage drop, arc radius, and the maximum velocity of velocity inside the arc. However, the relationship is non-linear with the applied current increase. The rate of change in these parameters tends to diminish, suggesting a saturation or dimensioning point. This implies that the applied current initially leads to a notable surge in the measured parameters. This non-linear trend introduces a layer of complexity to the system response.
Moreover, the temperature distribution within the arc appears to remain independent of the applied current. Despite the increase in applied current, the thermal characteristics of the system, as reflected in the temperature distribution, do not exhibit a similar trend. This suggests that the temperature distribution is dependent on the current density rather than the global applied current. In other words, for the suggested current density at the cathode spot [7], the maximum temperature is expected to be similar, independent of the applied current.

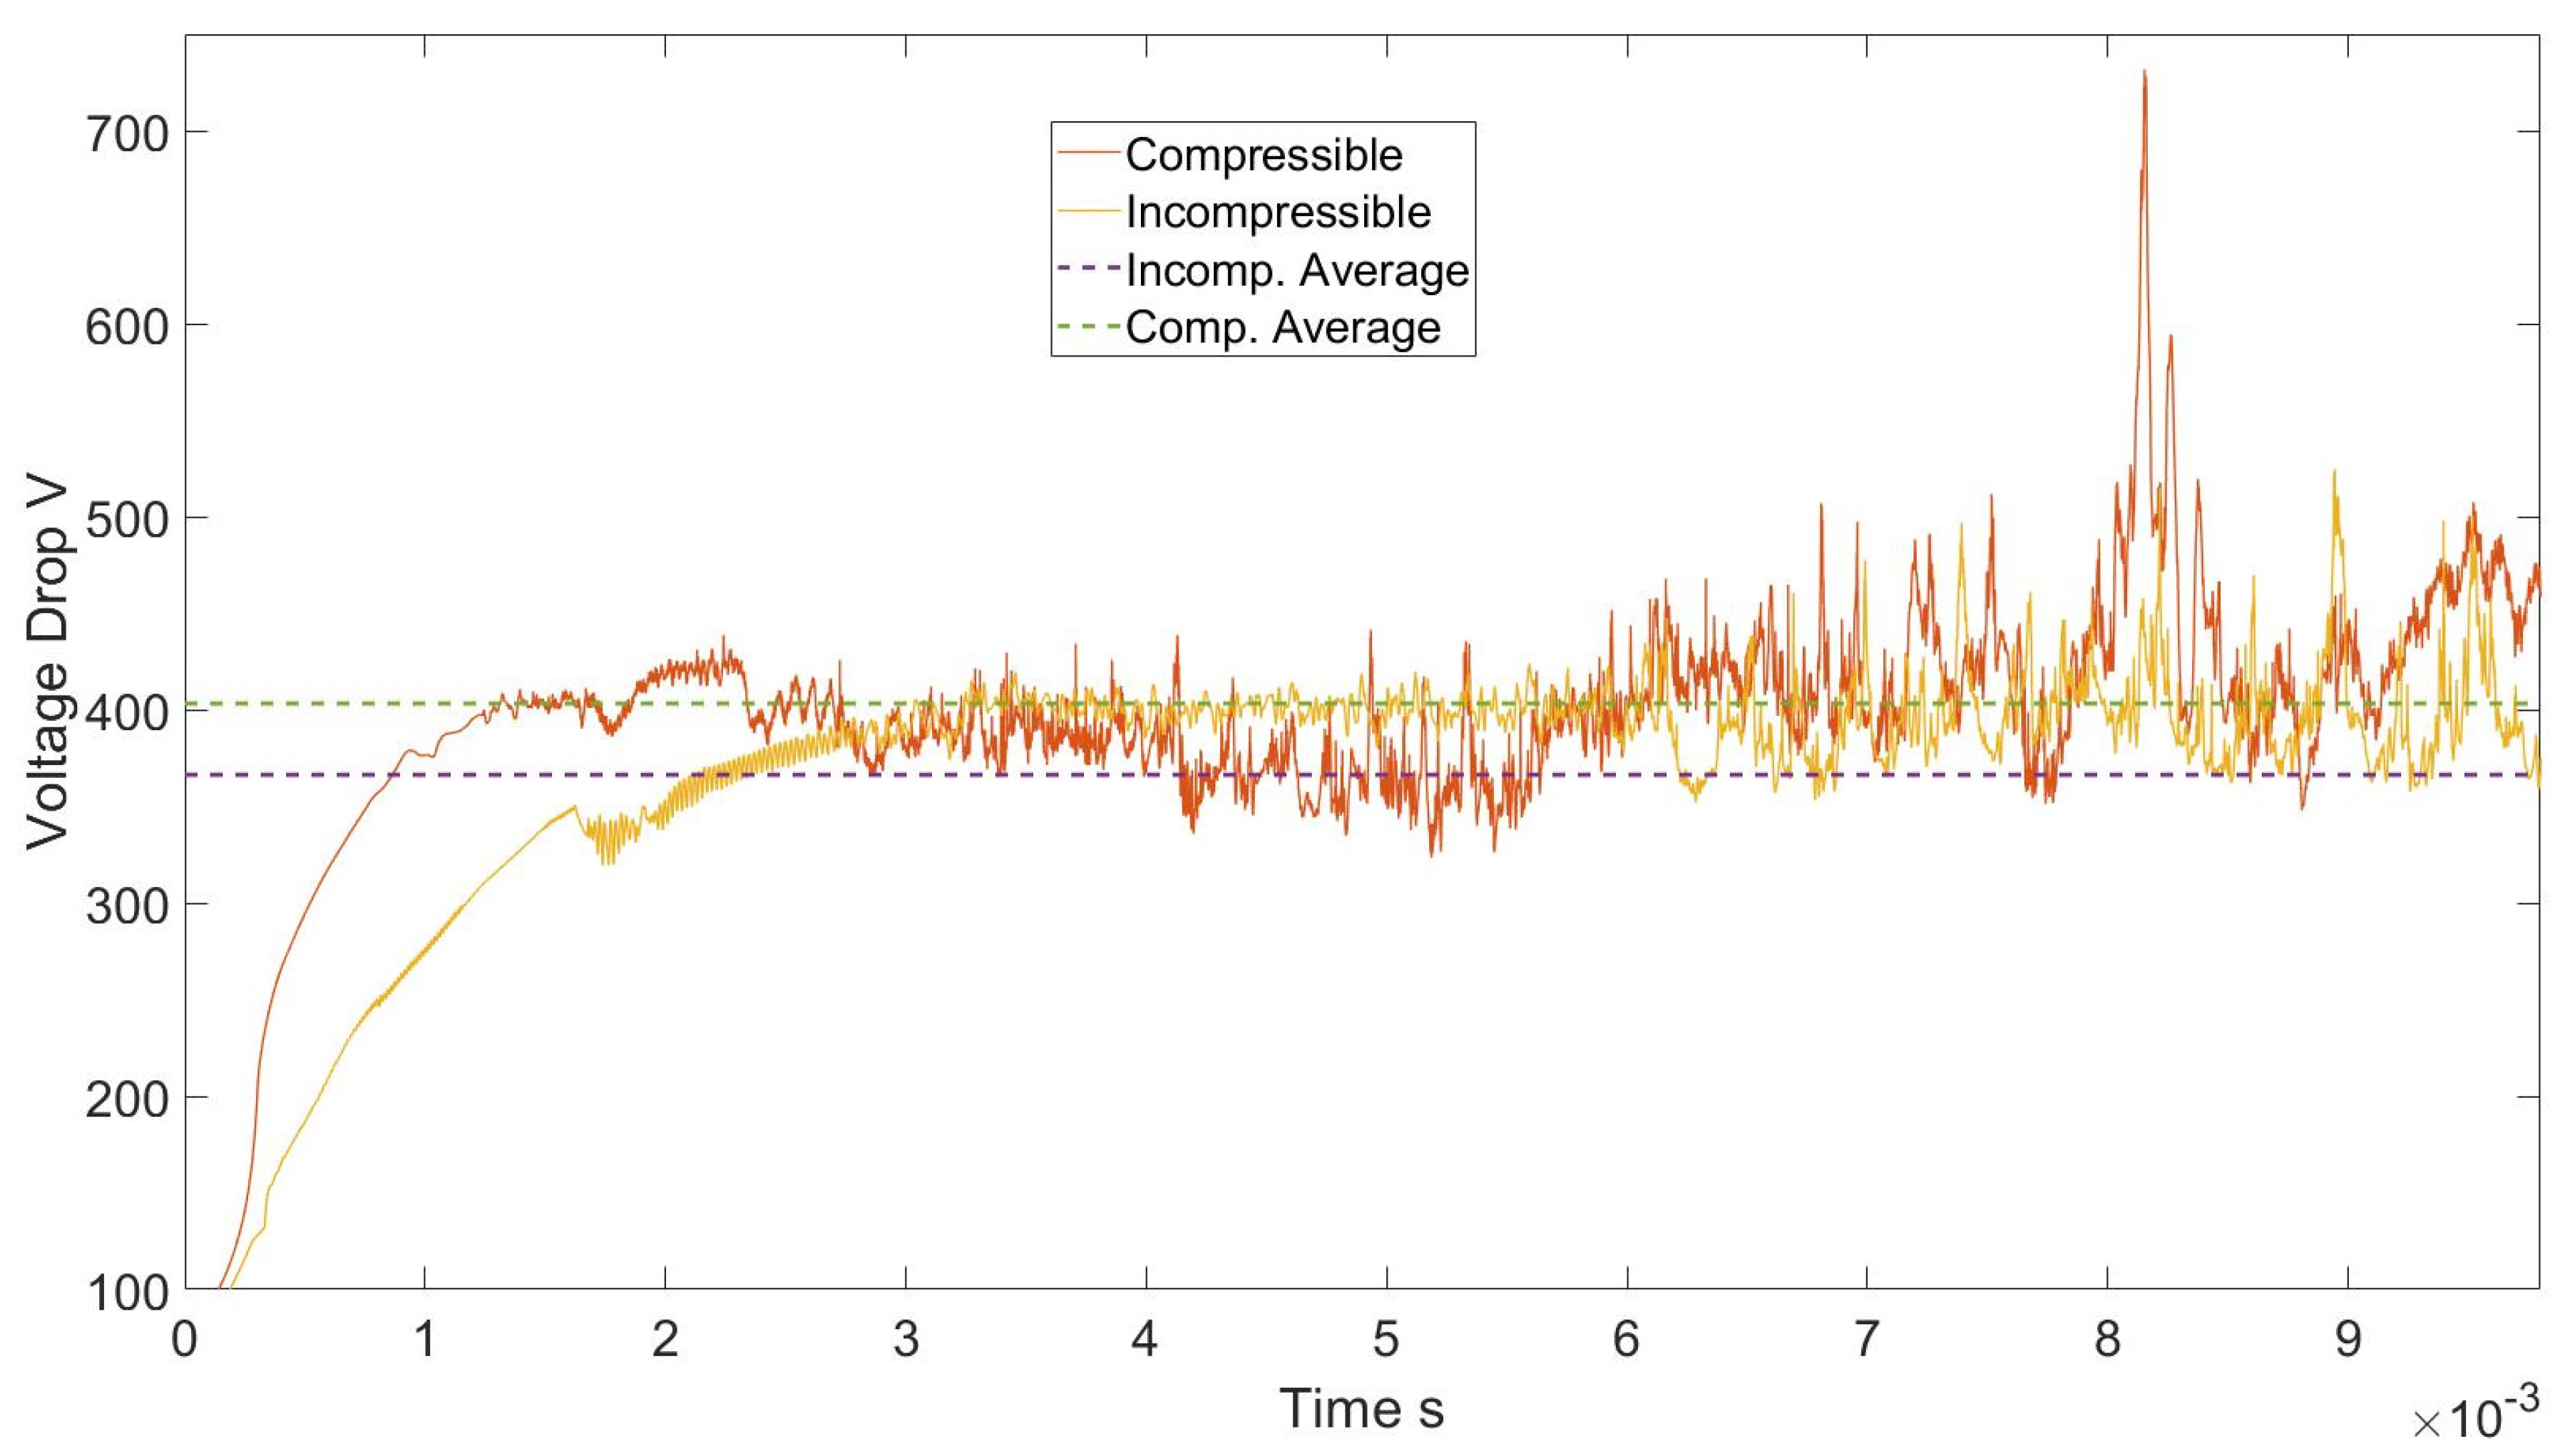
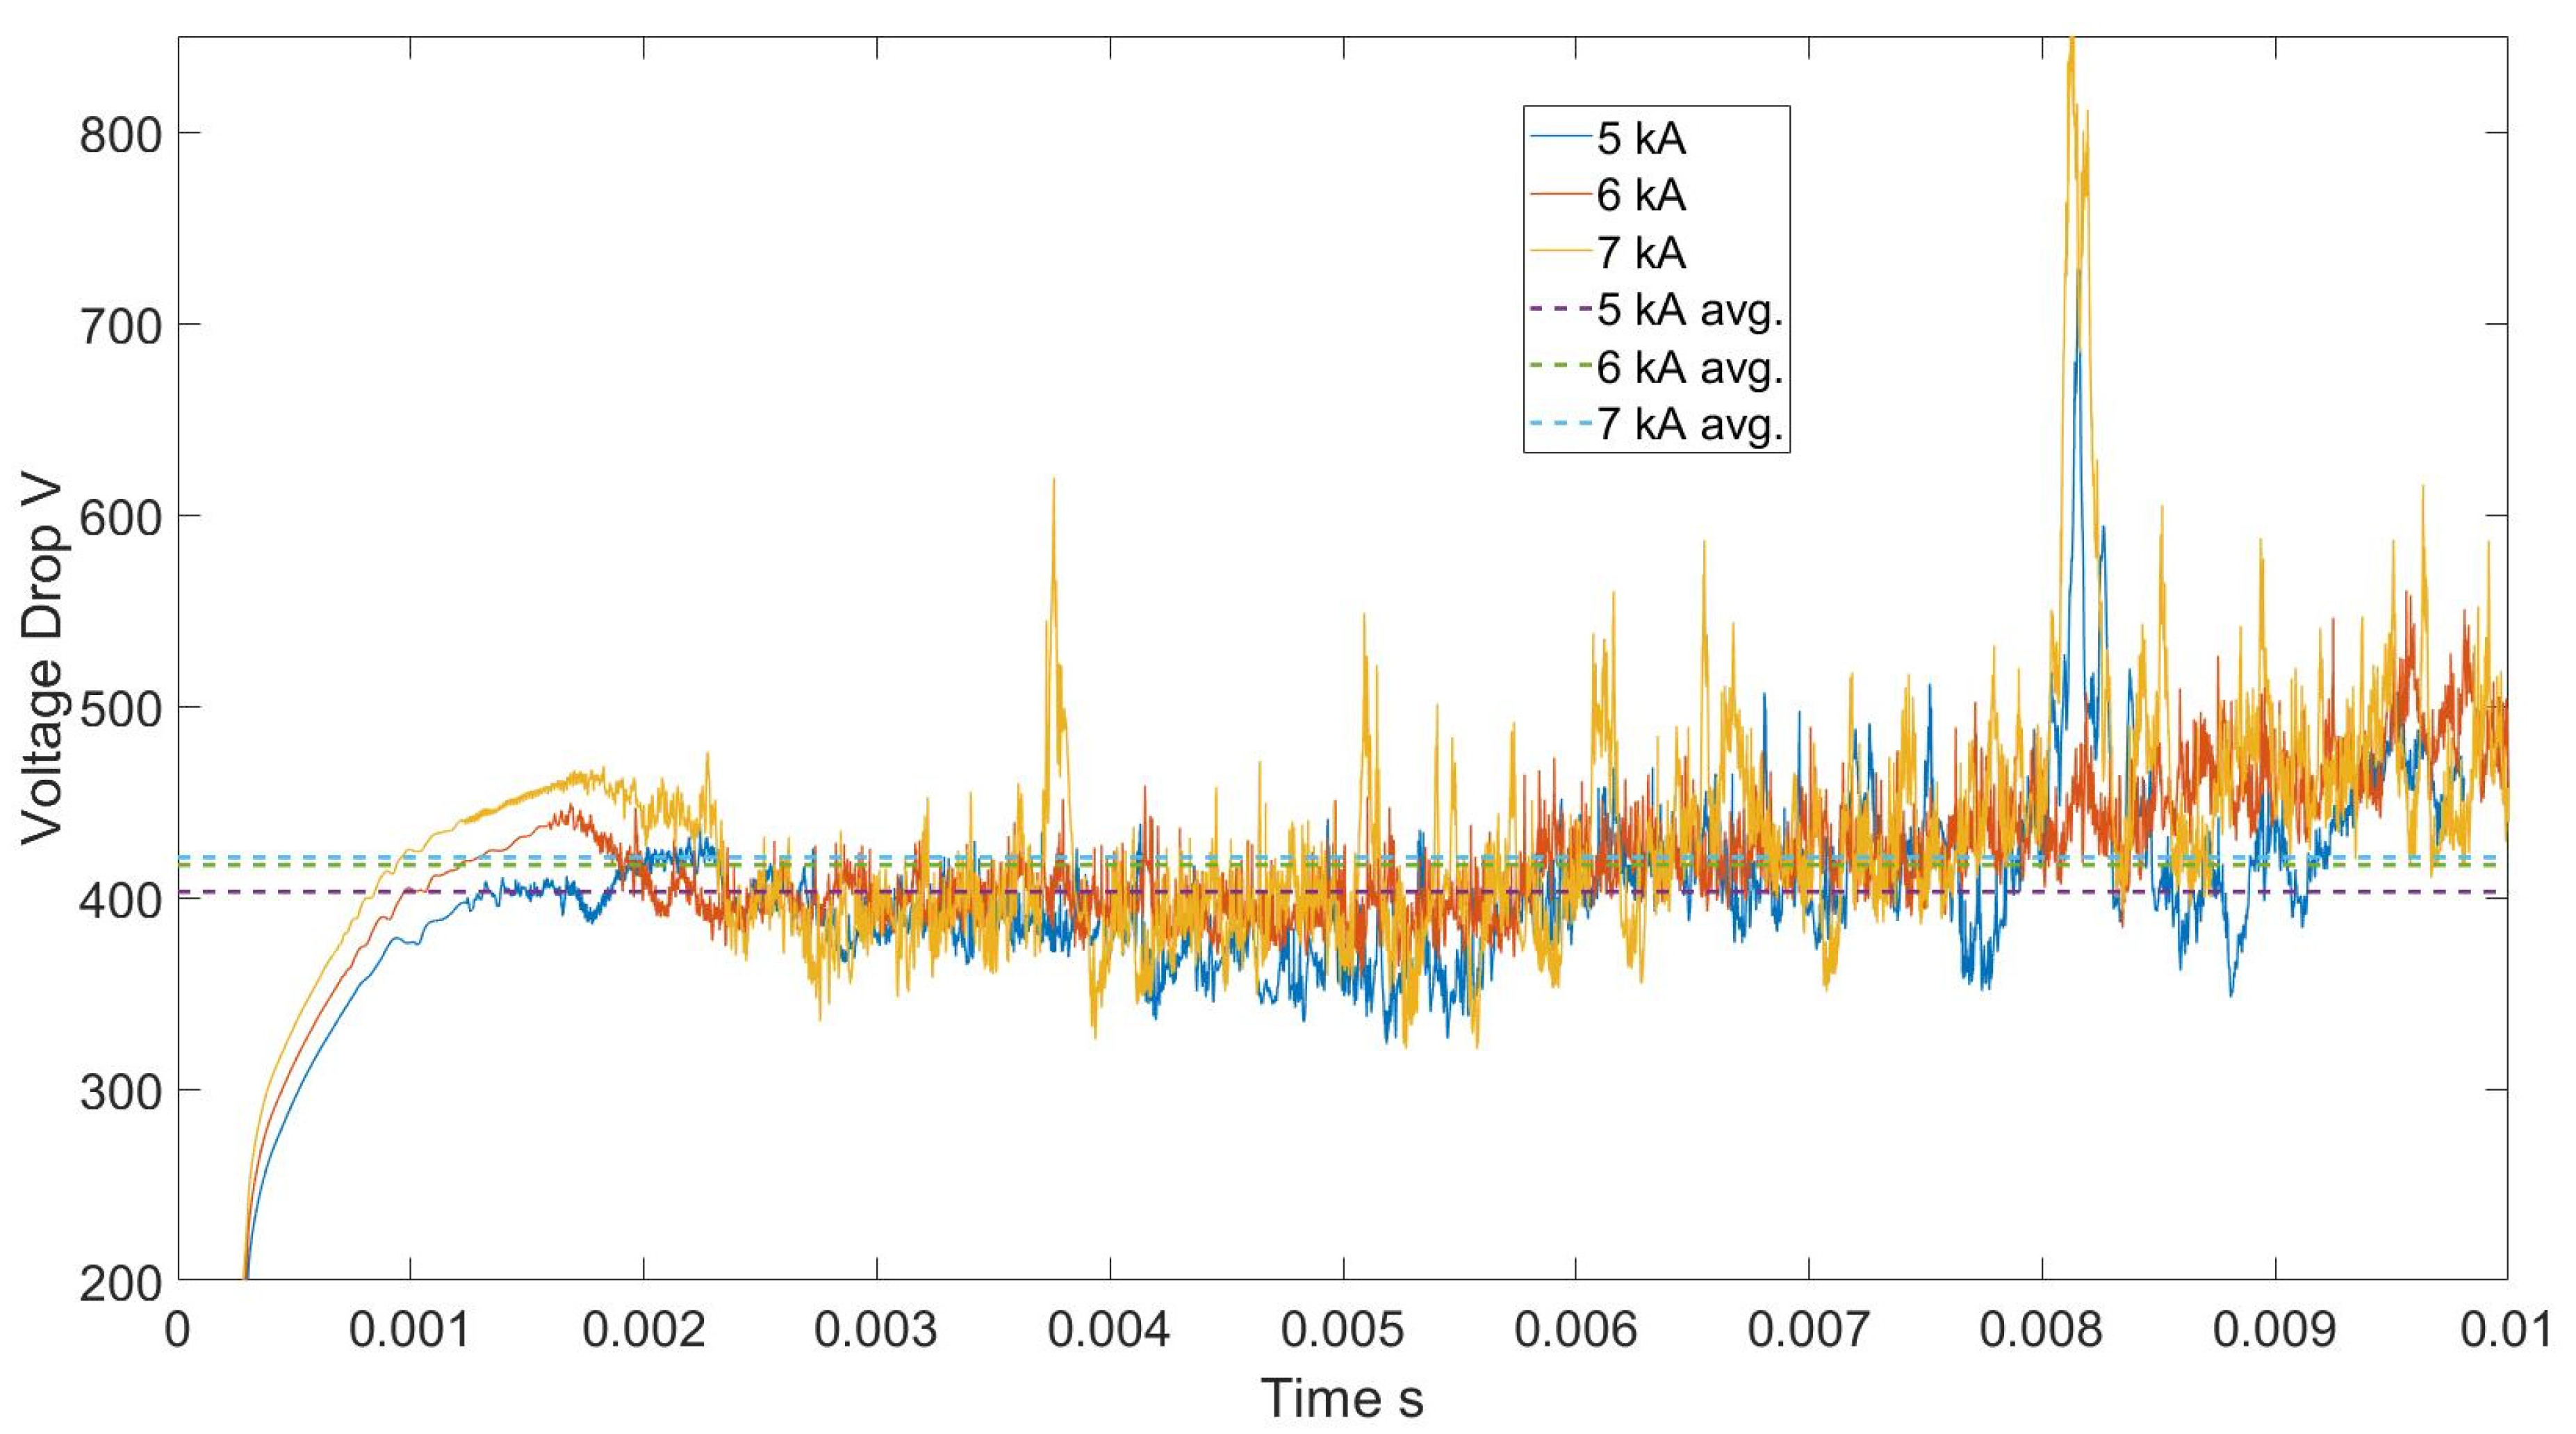
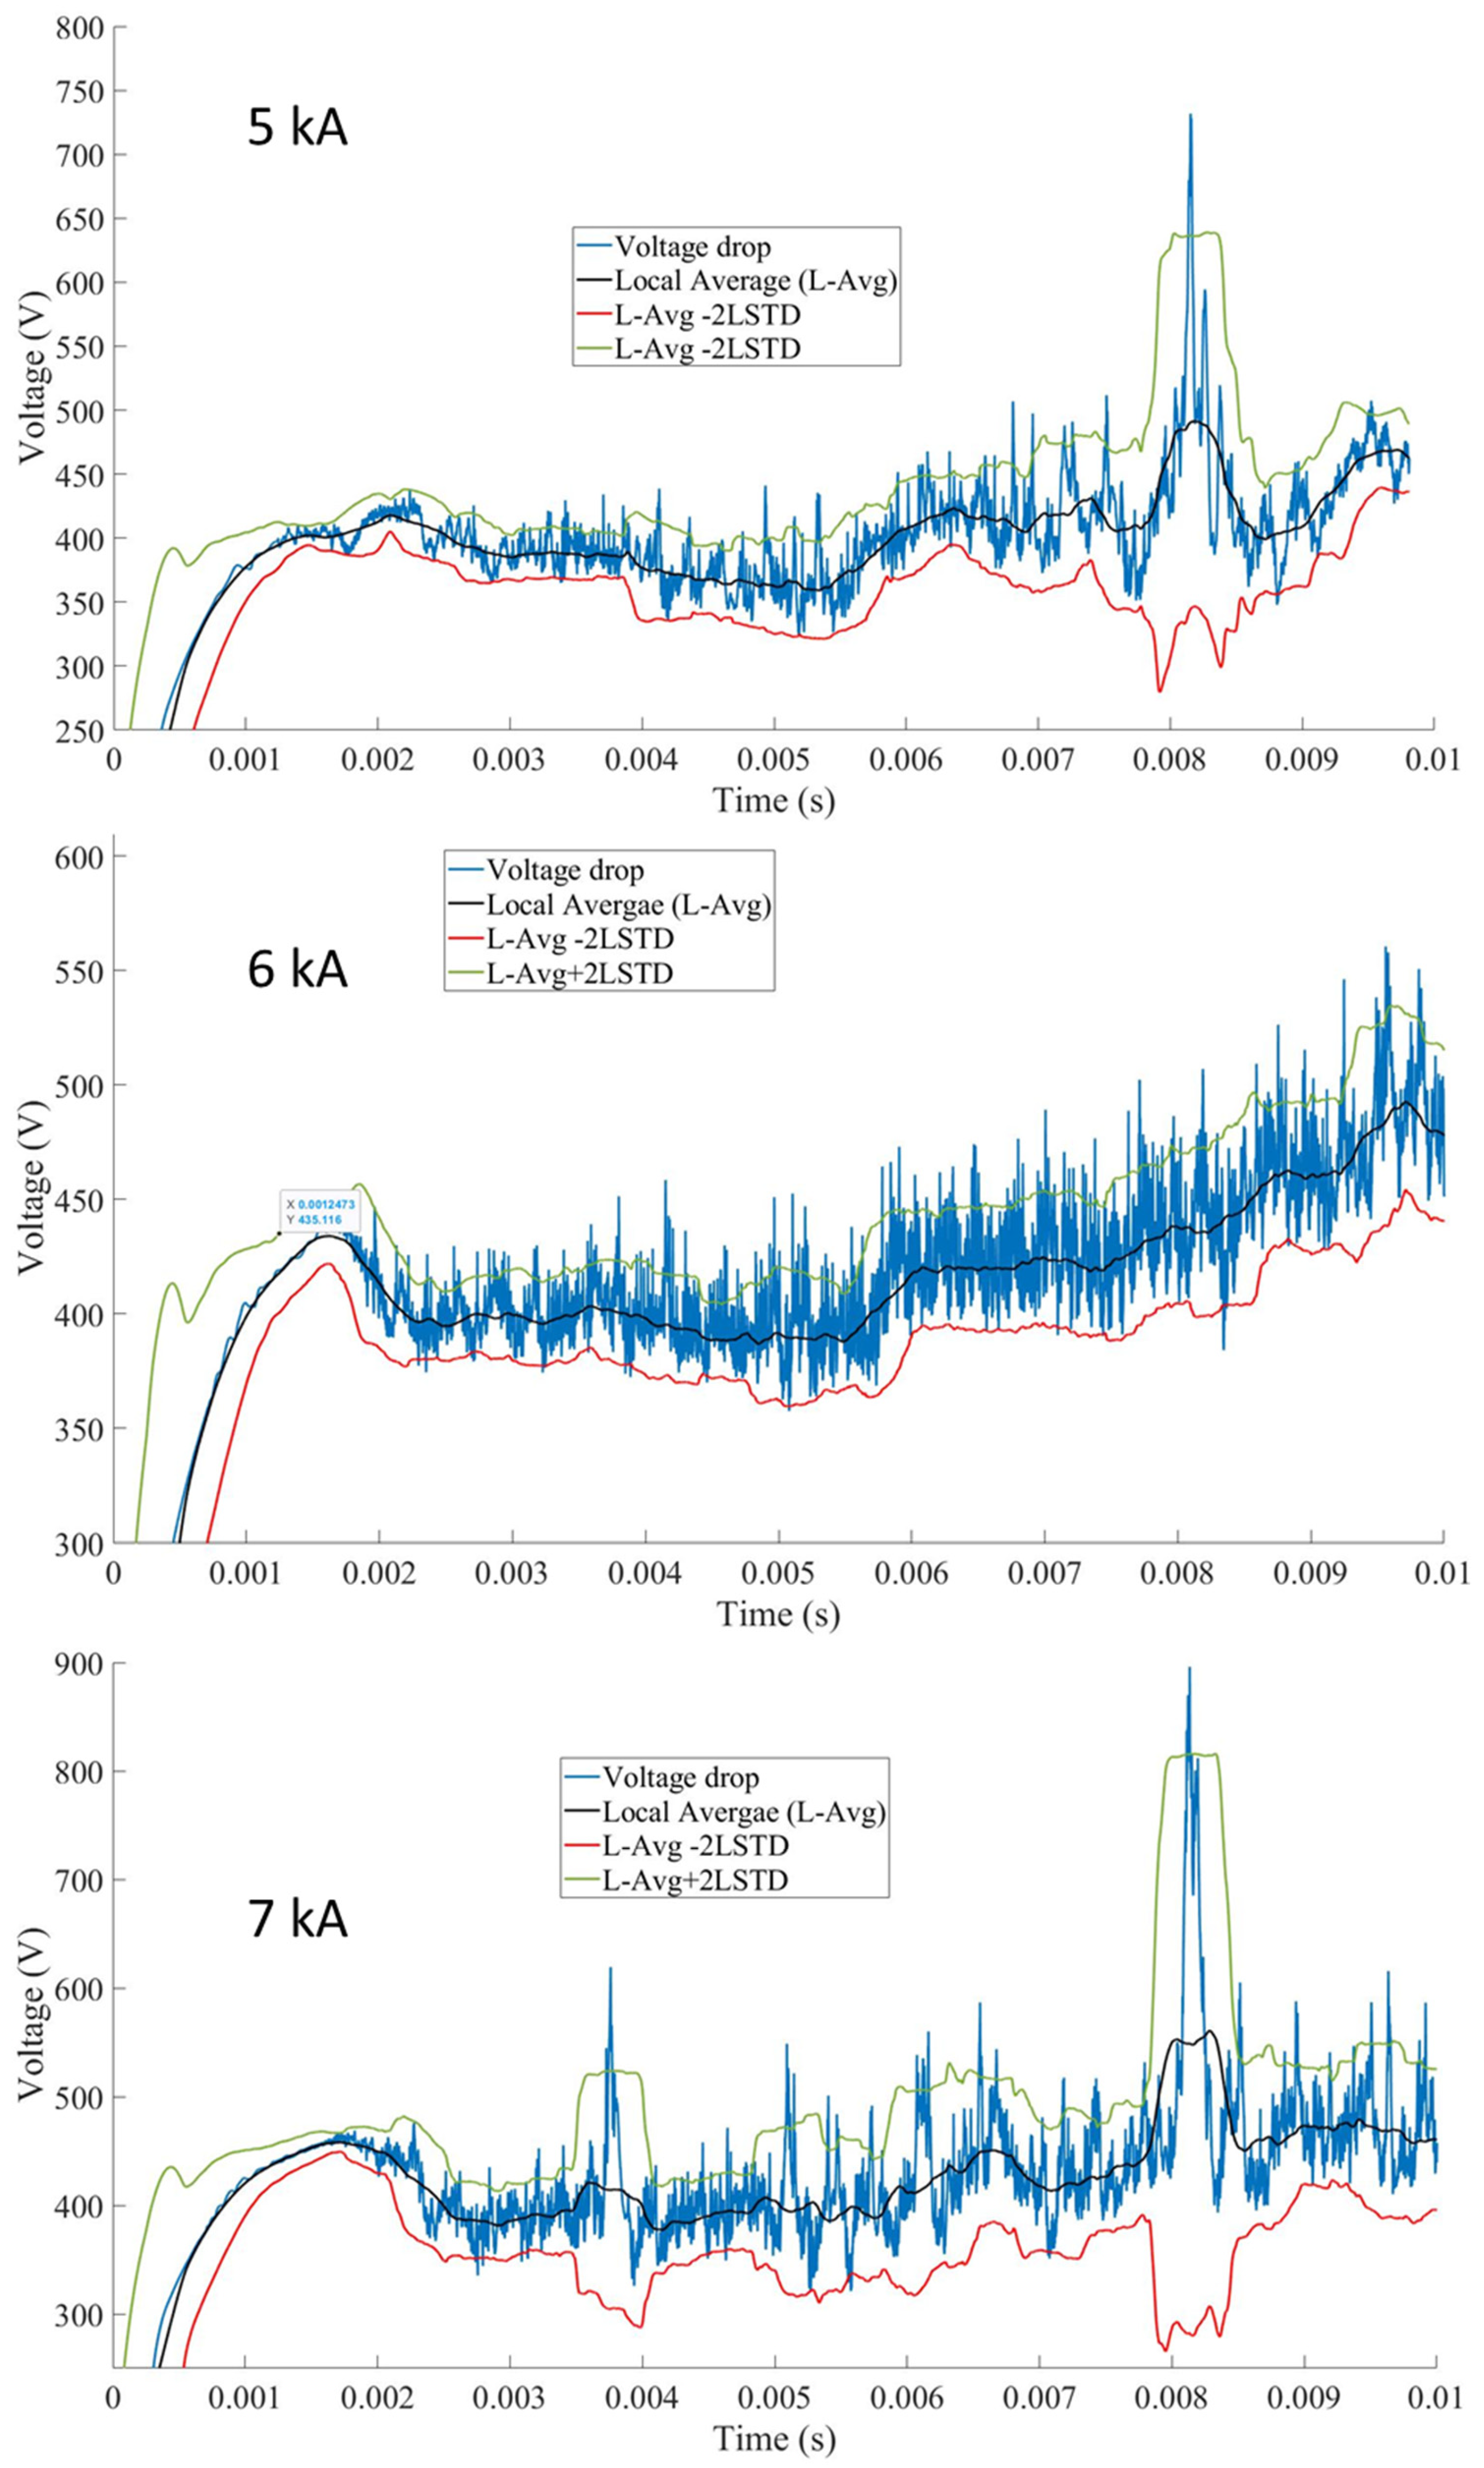
5.3. Analysis of Voltage Fluctuations

The voltage drop analysis shows two different types of extreme behavior. The first and simpler type involves a sharp rise in voltage drop, particularly noticeable in 5 kA and 7 kA at around 8 milliseconds (Figure 11). The voltage exceeds 700 V for 5 kA and 800 V for 7 kA, leading to a proportional rise in power. This steep rise poses a risk of circuit damage and, in extreme cases, circuit shutdown. The high rise in the voltage is caused by what is known as arc wings. This phenomenon was noticed previously in experiments [9] and through simulations [24,33]. The hydrodynamic wings are always accompanied by a high rise in voltage drop as the arc area and volume are maximized.
The second type of instability is related to the rate of the voltage drop change over time. To analyze the voltage drop variation, we calculate the local average (L-avg) of voltage drop and local standard deviation (LSTD) for each 0.5 millisecond. By determining the voltage that exceeds the bounds of L-avg ± 2 LSTD, we define the occurrence of an extreme event. Physically, these events indicate that the rate of voltage drop is faster than what is expected by the control circuit, subsequently disrupting the circuit if occurring very frequently.
Figure 12 illustrates plots for voltage, local average, and the L-avg ± 2 LSTD for each applied current. Analyzing the 5 kA arc voltage drop shows a few random extreme events, estimated at less than 30 events, occurring sporadically. However, for 6 kA, the frequency of extreme events significantly increases, persisting throughout the simulation. At the highest current of 7 kA, the amplitude of extreme events experiences a steep rise, with voltages peaking at 870 V. Despite fewer frequent extreme events compared to 6 kA, the duration and amplitude of these events increase. From the analysis of the voltage behavior, the increase in applied current leads to an increase in extreme events and voltage variation.
Voltage fluctuations exert a significant impact on electric arc new technologies including the utilization of hydrogen. These fluctuations influence the arc stability, heat output, and the overall quality of processes. The consequences of the absence of proper control of voltage behavior entail inconsistent furnace performance, increased maintenance costs, and reduced profitability. Consequently, the precise prediction of voltage and the ability to stabilize the operation is critical for the successful implementation of new hydrogen technologies.
Our study indicates that as applied current increases, the probability of extreme events is more frequent. Specifically, for higher currents exceeding pilot scale electric arc furnaces with current >10 kA, we anticipate an increase in both voltage peaks and frequency of extreme events, thus emphasizing the importance of accurate prediction and control of voltage drop in high-intensity current applications such as electric arc furnaces.

6. Conclusions

In this study, our model demonstrates the capability to simulate a hydrogen arc in a pilot-scale EAF arc, specifically at ≥5 kA. Notably, the model evaluates the impact of compressibility in hydrogen and applied current on both flow dynamics and voltage fluctuation, all achieved without necessitating the imposition of experimental harsh conditions. Validation of the model is conducted through comparison with experimental measurements and widely recognized electric arc simulation benchmarks, ensuring its reliability and accuracy in capturing the dynamics of the system.
The compressibility results in reduced velocity and lower temperatures while simultaneously amplifying the voltage drop. Furthermore, as the applied current increases, considering a compressible hydrogen arc, we observe an upward trend in voltage drop, expansion in the arc’s radius, and increase in maximum velocity inside the arc. However, it is crucial to highlight that the relationship between voltage drop, arc radius, and velocity with applied current is nonlinear. With increasing current, the increase in voltage drop, arc radius, and velocity gradually diminishes. Additionally, the maximum temperature inside the arc remains constant with an increase in applied current. This indicates that the temperature distribution is dependent on the current density rather than the applied current.
The study introduced a model capable of simulating a high-current compressible hydrogen arc. The study covered three different currents, 5, 6, and 7 kA, across a 25 cm arc gap. The paper’s findings contribute substantially to our understanding and prediction of hydrogen arc behavior. The obtained knowledge could play a pivotal role in advancing the use of hydrogen and promoting the realization of green steel technology.
Subsequent steps in this research should involve experimental validation of the numerical findings. Furthermore, the current ranges should be extended to cover industrial-scale furnaces >40 kA, in addition to additional gas mixtures and impurity effects on the hydrogen arc performance.

Author Contributions

Conceptualization, M.A.N., N.A., A.V. and A.K.; Methodology, M.A.N., E.K.-S., A.V. and A.K.; Software, A.V. and M.A.; Validation, S.A.; Investigation, M.A.N., N.A., E.K.-S., M.A., S.A. and A.K.; Resources, N.A. and S.A.; Data curation, M.A.; Writing—original draft, M.A.N. and A.K.; Writing—review & editing, M.A.N., N.A., E.K.-S., A.V., M.A., S.A. and A.K.; Visualization, E.K.-S.; Supervision, A.K.; Funding acquisition, N.A. All authors have read and agreed to the published version of the manuscript.

Funding

This work is supported by the Deanship of Scientific Research at Imam Mohammad Ibn Saud Islamic University, (IMSIU) through Research Partnership Program no. RP-21-12-02.

Data Availability Statement

The data presented in this study are available on request from the corresponding author.

Conflicts of Interest

The authors declare no conflict of interest.

Nomenclature

u Velocity (m/s)
P Pressure (N/m2)
F Lorentz force per unit volume (N/m3)
S Source term per unit volume
μ e f f Effective viscosity (N.s/m2)
K Thermal conductivity (W/m.K)
R Ideal gas constant (J/mol·K)
M w Molecular weight of the gas (g/mol)
P o p Operating pressure(N/m2)
T Temperature (K)
c p Specific heat at constant pressure (J/kg.K)
J Current density (A/m2)
R a d l o s s Experimental radiation loss (w/m3)
B Magnetic field (T)
c v Specific heat at constant volume (J/kg.K)
I 0 Applied current (A)
d V Control volume (m3)
Greeks:
ρ Density (kg/m3)
σ Electrical conductivity (S/m)
μ 0 Vacuum permeability (H/m)
γ Ratio of specific heats (cp/cv)
Δ ϕ Voltage drop (V)
Subscripts:
z Axial coordinates
r Radial coordinates
θ Azimuthal coordinates

References

  1. Jones, R.T.; Reynolds, Q.G.; Curr, T.R.; Sager, D. Some Myths about DC Arc Furnaces. J. South. Afr. Inst. Min. Metall. 2011, 111, 665–673. [Google Scholar]
  2. Leonard Kzoa Electric Arc Furnace’s Development History. Available online: https://www.chnzbtech.com/electric-arc-furnace-s-development-history.html (accessed on 3 December 2023).
  3. Iea Global Crude Steel Production by Process Route and Scenario, 2019–2050. Available online: https://www.iea.org/data-and-statistics/charts/global-crude-steel-production-by-process-route-and-scenario-2019-2050 (accessed on 3 December 2023).
  4. Fortune Electric Arc Furnaces Market Report Summaries. Available online: https://www.fortunebusinessinsights.com/electric-arc-furnaces-market-104745 (accessed on 3 December 2023).
  5. Odenthal, H.J.; Kemminger, A.; Krause, F.; Sankowski, L.; Uebber, N.; Vogl, N. Review on Modeling and Simulation of the Electric Arc Furnace (EAF). Steel Res. Int. 2018, 89, 1700098. [Google Scholar] [CrossRef]
  6. Dincer, I. Green Methods for Hydrogen Production. Int. J. Hydrogen Energy 2012, 37, 1954–1971. [Google Scholar] [CrossRef]
  7. Jordan, G.R.; Bowman, B.; Wakelam, D. Electrical and Photographic Measurements of High-Power Arcs. J. Phys. D Appl. Phys. 1970, 3, 1089–1099. [Google Scholar] [CrossRef]
  8. Bowman, B. Properties of Arcs in DC Furnaces. In Proceedings of the 1994 Electric Furnace Conference, Nashville, TN, USA, 13–16 November 1994; pp. 111–120. [Google Scholar]
  9. Bowman, B.; Krüger, K. Arc Furnace Physics; Stahleisen: Düsseldorf, Germany, 2009; ISBN 978-3-514-00768-0. [Google Scholar]
  10. Jones, R.T.; Reynolds, Q.G.; Alport, M.J. DC Arc Photography and Modelling. Miner. Eng. 2002, 15, 985–991. [Google Scholar] [CrossRef]
  11. Ushio, M.; Matsuda, F. Mathematical Modelling of Flow Field and Heat Transfer of Welding Arc. Int. Symp. Jpn. Weld. Soc. 1982, 1, 49–54. [Google Scholar]
  12. Szekely, J.; McKelliget, J.; Choudhary, M. Heat-transfer fluid flow and bath circulation in electric-arc furnaces and dc plasma furnaces. Ironmak. Steelmak. 1983, 10, 169–179. [Google Scholar]
  13. Ramírez-argáez, M.A. Mathematical Modeling of DC Electric Arc Furnace Operations. Ph.D. Thesis, Massachusetts Institute of Technology, Cambridge, MA, USA, 2003. [Google Scholar]
  14. Alexis, J.; Ramirez, M.; Trapaga, G.; Jönsson, P. Modeling of a DC Electric Arc Furnace—Heat Transfer from the Arc. ISIJ Int. 2000, 40, 1089–1097. [Google Scholar] [CrossRef]
  15. Wang, F.; Jin, Z.; Zhu, Z. Numerical Study of Dc Arc Plasma and Molten Bath in Dc Electric Arc Furnace. Ironmak. Steelmak. 2006, 33, 39–44. [Google Scholar] [CrossRef]
  16. Ramírez-Argáez, M.A.; González-Rivera, C.; Trápaga, G. Mathematical Modeling of High Intensity Electric Arcs Burning in Different Atmospheres. ISIJ Int. 2009, 49, 796–803. [Google Scholar] [CrossRef]
  17. Reynolds, Q.G.; Jones, R.T.; Reddy, B.D. Mathematical and Computational Modelling of the Dynamic Behaviour of Direct Current Plasma Arcs. Proc. 12th Int. Ferroalloys Congr. Sustain. Future 2010, 110, 789–801. [Google Scholar]
  18. Reynolds, Q.G. Computational Modelling of Shear-Layer Instabilities and Vortex Formation in DC Plasma Arcs. Miner. Eng. 2014, 63, 35–44. [Google Scholar] [CrossRef]
  19. Reynolds, Q.G. Computational Modeling of Arc–Slag Interaction in DC Furnaces. JOM 2017, 69, 351–357. [Google Scholar] [CrossRef]
  20. Trelles, J.P. Computational Study of Flow Dynamics from a Dc Arc Plasma Jet. J. Phys. D Appl. Phys. 2013, 46, 255201. [Google Scholar] [CrossRef]
  21. Guo, Z.; Yin, S.; Liao, H.; Gu, S. Three-Dimensional Simulation of an Argon-Hydrogen DC Non-Transferred Arc Plasma Torch. Int. J. Heat Mass Transf. 2015, 80, 644–652. [Google Scholar] [CrossRef]
  22. Murphy, A.B.; Uhrlandt, D. Foundations of High-Pressure Thermal Plasmas. Plasma Sources Sci. Technol. 2018, 27, 063001. [Google Scholar] [CrossRef]
  23. Ernst, D.; Zarl, M.A.; Farkas, M.A.; Schenk, J. Effects of the Electrodes’ Shape and Graphite Quality on the Arc Stability during Hydrogen Plasma Smelting Reduction of Iron Ores. Steel Res. Int. 2023, 94, 2200818. [Google Scholar] [CrossRef]
  24. Al-Nasser, M.; Barati, H.; Redl, C.; Ishmurzin, A.; Voller, N.; Hackl, G.; Leuchtenmüller, M.; Wu, M.; Kharicha, A. Effect of Compressibility on Industrial DC Electric Arcs. Results Eng. 2023, 19, 101312. [Google Scholar] [CrossRef]
  25. Murphy, A.B.; Tanaka, M.; Yamamoto, K.; Tashiro, S.; Sato, T.; Lowke, J.J. Modelling of Thermal Plasmas for Arc Welding: The Role of the Shielding Gas Properties and of Metal Vapour. J. Phys. D Appl. Phys. 2009, 42, 194006. [Google Scholar] [CrossRef]
  26. Yao, C.; Jiang, Z.; Zhu, H.; Pan, T. Characteristics Analysis of Fluid Flow and Heating Rate of a Molten Bath Utilizing a Unified Model in a DC EAF. Metals 2022, 12, 390. [Google Scholar] [CrossRef]
  27. Cui, H.; Li, T.; Bai, C.; Jiang, Z.; Tan, M.; Gao, X.; Zhu, Y. Numerical Simulation of the Interaction between Arc Plasma and Molten Slag in Electric Arc Furnace for High-Titania Slag Smelting. Metall. Mater. Trans. B 2023, 54, 1687–1704. [Google Scholar] [CrossRef]
  28. European Parliament. Directorate General for Parliamentary Research Services. EU Energy System Transformation: Cost of Non Europe; European Parliament. Directorate General for Parliamentary Research Services: Maastricht, The Netherlands, 2021.
  29. Kmecova, M.; Sikula, O.; Krajcik, M. Circular Free Jets: CFD Simulations with Various Turbulence Models and Their Comparison with Theoretical Solutions. IOP Conf. Ser. Mater. Sci. Eng. 2019, 471, 062045. [Google Scholar] [CrossRef]
  30. Morris, J.C.; Bach, G.R.; Krey, R.U.; Liebermann, R.W.; Yos, J.M. Continuum Radiated Power for High-Temperature Air and Its Components. AIAA J. 1966, 4, 1223–1226. [Google Scholar] [CrossRef]
  31. McKelliget, J.W.; Szekely, J. A Mathematical Model of the Cathode Region of a High Intensity Carbon Arc. J. Phys. D Appl. Phys. 1983, 16, 1007–1022. [Google Scholar] [CrossRef]
  32. Haidar, J.; Farmer, A.J.D. Surface Temperature Measurements for Tungsten-Based Cathodes of High-Current Free-Burning Arcs. J. Phys. D Appl. Phys. 1995, 28, 2089–2094. [Google Scholar] [CrossRef]
  33. Barati, H.; Kharicha, A.; Al-Nasser, M.; Kreuzer, D.; Hackl, G.; Gruber, M.; Ishmurzin, A.; Redl, C.; Teplyakov, I.O.; Wu, M.; et al. MHD Instability at the Cathode Spot as the Origin of the Vortex Formation in High-Intensity Plasma Arcs. J. Phys. Commun. 2022, 6, 015008. [Google Scholar] [CrossRef]
  34. Kharicha, A.; Al-Nasser, M.; Barati, H.; Karimi-Sibaki, E.; Vakhrushev, A.; Abdi, M.; Ludwig, A.; Wu, M. Tornados and Cyclones Driven by Magneto-Hydrodynamic Forces. Eur. J. Mech. B/Fluids 2022, 94, 90–105. [Google Scholar] [CrossRef]
  35. Al-Nasser, M.; Kharicha, A.; Barati, H.; Pichler, C.; Hackl, G.; Gruber, M.; Ishmurzin, A.; Redl, C.; Wu, M.; Ludwig, A. Toward a Simplified Arc Impingement Model in a Direct-Current Electric Arc Furnace. Metals 2021, 11, 1482. [Google Scholar] [CrossRef]
  36. Sommeria, J. Electrically Driven Vortices in a Strong Magnetic Field. J. Fluid Mech. 1988, 189, 553–569. [Google Scholar] [CrossRef]
Figure 1. 2D axisymmetric geometry of arc domain: the red part resembles the approximate arc shape.
Sustainability 16 02831 g001
Figure 2. Experimental measurements of thermophysical properties of hydrogen as functions of temperature.
Sustainability 16 02831 g002
Figure 3. Magnetic field (a) and temperature distribution (b) comparison between Alexis et al. [14] (left half) and time average over 6 milliseconds (right half) [33]. (c) Comparison of the numerical model with Sommeria experimental results [36].
Sustainability 16 02831 g003
Figure 4. The average velocity distribution for both models (incompressible and compressible) for 10 milliseconds of physical time.
Sustainability 16 02831 g004
Figure 5. (a) Average temperature distribution comparison between the incompressible and compressible arcs of 5 kA. A zoomed area near the cathode is also shown in (b).
Sustainability 16 02831 g005
Figure 6. Voltage drop comparison between incompressible and compressible models over 10 milliseconds.
Sustainability 16 02831 g006
Figure 7. Temperature distribution along the arc at 0.025 m below the cathode spot.
Sustainability 16 02831 g007
Figure 8. Average velocity distribution over 10 milliseconds for 5, 6, and 7 kA compressible arcs.
Sustainability 16 02831 g008
Figure 9. Average temperature distribution for 5, 6, and 7 kA compressible arcs.
Sustainability 16 02831 g009
Figure 10. Temperature distribution along the arc at 0.025 m below cathode spot for 5, 6, and 7 kA compressible arcs.
Sustainability 16 02831 g010
Figure 11. The voltage drop of compressible arc for 5, 6, and 7 kA over 10 milliseconds.
Sustainability 16 02831 g011
Figure 12. Voltage drop local average and local standard deviation for 5, 6, and 7 kA applied currents.
Sustainability 16 02831 g012
Table 1. Boundary conditions of flow, thermal, and magnetic fields.
BoundaryFlowTemperatureMagnetic Field
Electrode u r = u z = 0 T = 4000   K B θ z = 0
Top air u r z = 0 ,   u z = 0 T z = 0 B θ = I 0 μ 0 2 π r
Side air u r = u z = 0 T r = 0 B θ = I 0 μ 0 2 π r
Flat and static surface u r = u z = 0 T r = 0 B θ z = 0
Axis of symmetry u z r = 0 ,   u r = 0 T r = 0 B θ = 0
Disclaimer/Publisher’s Note: The statements, opinions and data contained in all publications are solely those of the individual author(s) and contributor(s) and not of MDPI and/or the editor(s). MDPI and/or the editor(s) disclaim responsibility for any injury to people or property resulting from any ideas, methods, instructions or products referred to in the content.

