1. Introduction
Currently, the worsening environmental pollution challenges are drawing global attention to this urgent issue. According to the Global Environmental Performance Index Report 2022, China ranks 160th out of 180 countries and regions evaluated in environmental performance. The main reason leading to the above results is the excessive reliance on massive inputs of energy, capital, and labour in economic growth, while neglecting environmental resources and protection [
1,
2]. In order to reduce environmental pollution and resource inefficiency, the Chinese government has implemented a variety of environmental regulation policies, including raising emission standards, increasing penalties for pollution, promoting emissions trading, and imposing restrictions on heavily polluting industries [
3,
4,
5,
6]. The government aims to exert pressure on enterprises through environmental regulations, influencing their environmental decisions and actions [
7,
8], thereby driving economic transformation across the entire society. This process can also be understood as an enhancement of green total factor productivity.
Based on previous literature, environmental regulations have been identified as a significant driver for promoting sustainable economic development. However, the economic consequences of environmental regulations vary among the world’s major economies. In developed countries, government environmental regulations often compel enterprises to upgrade outdated production processes, phase out obsolete industrial equipment, strengthen pollution control measures, aid enterprises in green innovation, and thereby enhance urban green total factor productivity [
9,
10,
11]. Conversely, these conclusions have not been confirmed in emerging economies and developing countries. Some studies suggest that due to differences in resource endowments and pressures from economic development, environmental regulations in developing countries may lead to a phenomenon known as “greenwashing” by enterprises [
12,
13]. This entails enterprises avoiding the costs associated with green transformation by disclosing false information regarding their green initiatives. This behaviour does not effectively enhance green total factor productivity and may even result in negative consequences. Therefore, exploring the economic consequences of environmental regulations at the urban level in China may provide valuable insights for other countries globally.
In research focusing on the impact of environmental regulation on green total factor productivity, some studies suggest that green total factor productivity integrates resource consumption and pollution emissions into the production function, in addition to traditional inputs like labour, capital, and technology [
14,
15]. Compared to total factor productivity, green total factor productivity places a greater emphasis on the sustainability of the economy. However, studies have found that the economic consequences of environmental regulation on green total factor productivity are not clear-cut and may exhibit positive, negative, or nonlinear relationships. Some studies suggest that environmental regulation drives the development of digital infrastructure [
16], the clustering of productive service industries [
17], green technology innovation [
18], and resource allocation [
19], fostering green total factor productivity. Conversely, other studies suggest that environmental regulation could reduce enterprises’ export capabilities [
20], increase financial costs [
21], and diminish enterprises’ competitiveness [
22], consequently exerting negative effects on green total factor productivity. Taking into account the differences in institutional environments and market development levels, the impact of environmental regulation on green total factor productivity may also exhibit a “U-shaped” or “inverted U-shaped” relationship due to variations in governmental enforcement capacity and market forces [
23,
24]. These discussions need to be contextualised within the framework of China’s governmental system. Furthermore, existing research has lacked discussion on the relationship between environmental regulation and green total factor productivity at the urban level, as well as analysis on how to enhance the positive effects of environmental regulation and reduce the negative impacts of environmental regulation. In terms of green total factor productivity measurement, the previous literature primarily utilises radial CCR models or non-radial SBM models to estimate the input–output relationships of enterprises, with less consideration from a hybrid radial perspective. This could potentially lead to estimation biases and consequently result in errors in research conclusions. This paper conducts a more in-depth study of these issues.
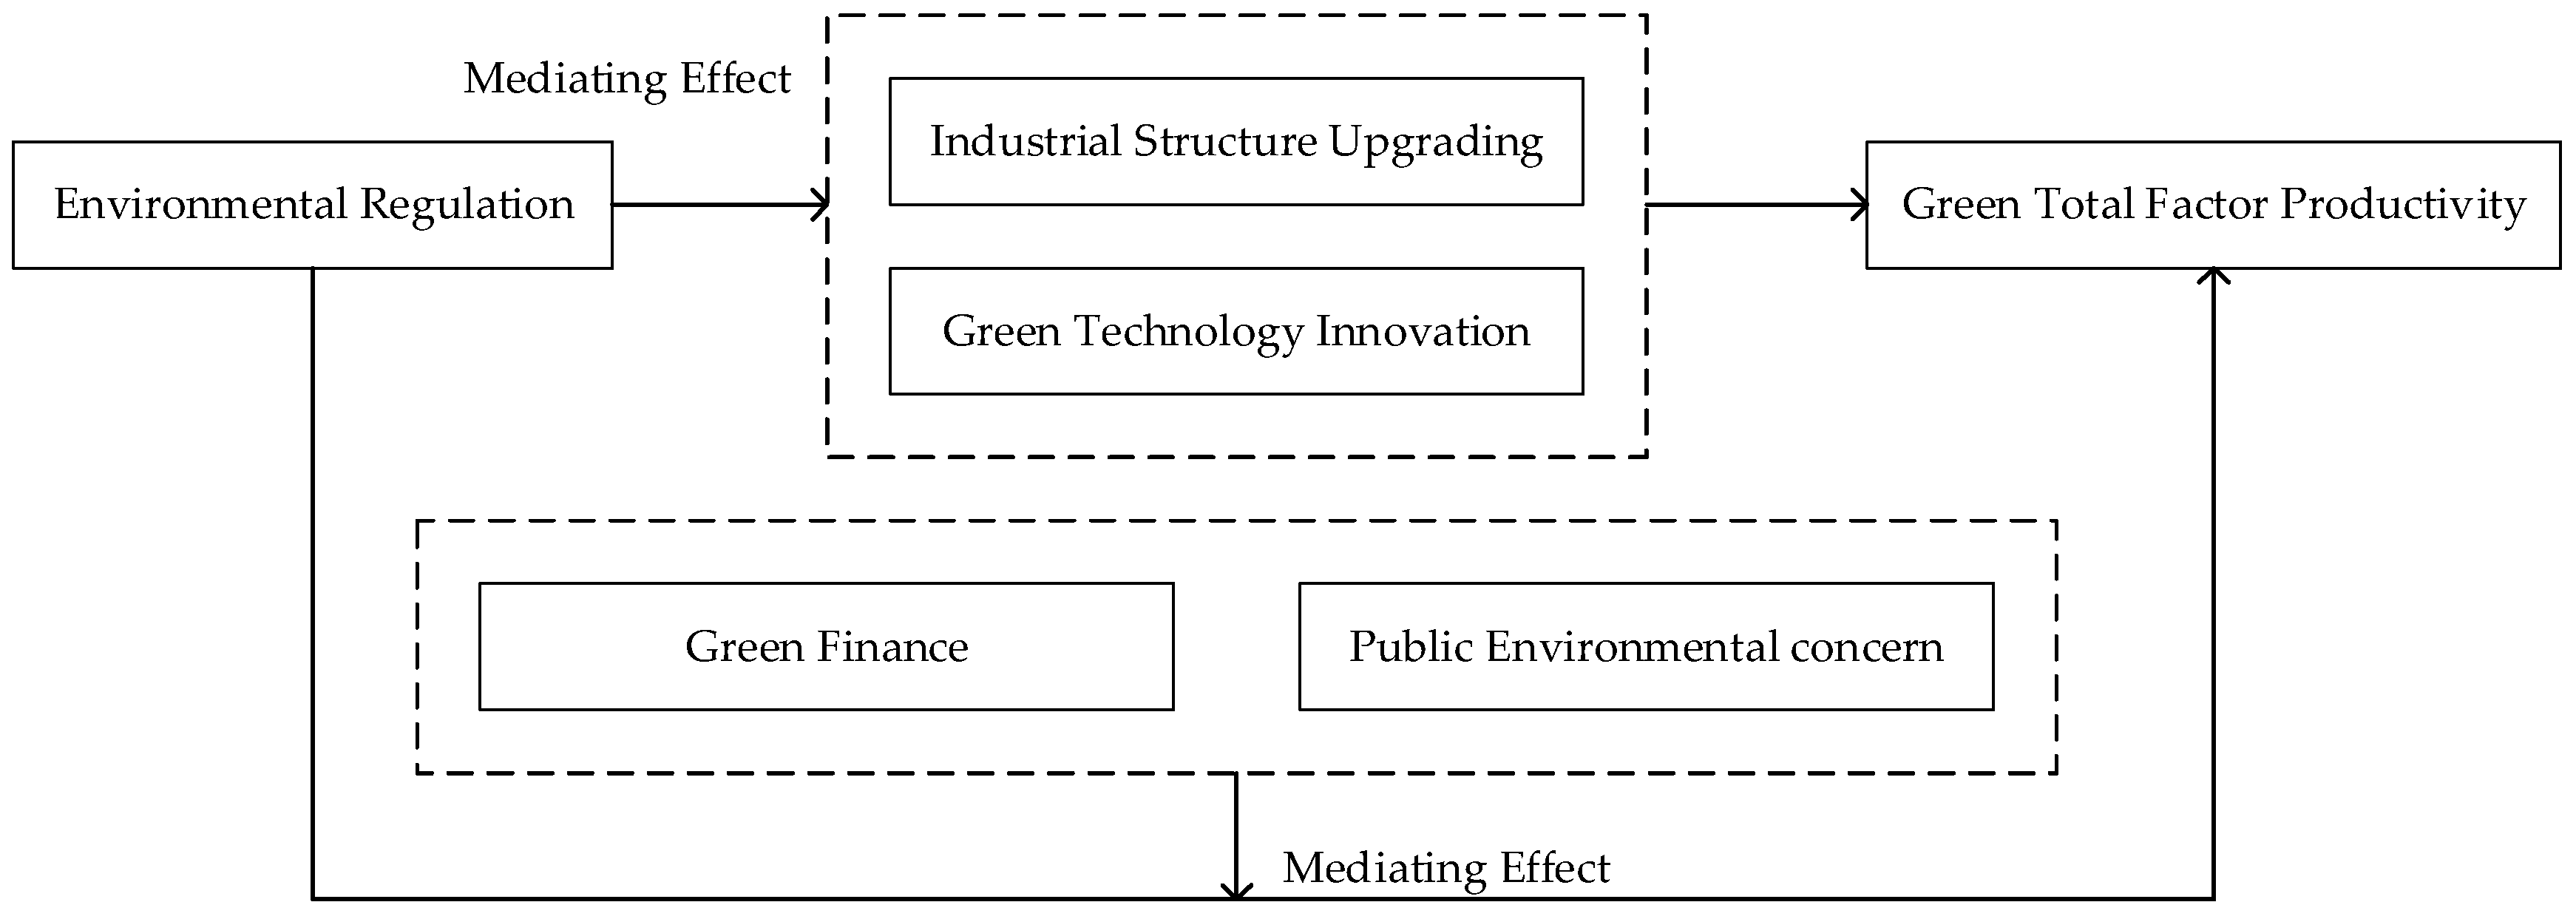
This study aims to investigate the impact of environmental regulation on green total factor productivity using a panel dataset of 289 Chinese cities. Firstly, the Windows–Malmquist–Luenberger model based on a hybrid distance function (EBM) is used to re-evaluate green total factor productivity. The research reveals that environmental regulation can significantly enhance urban green total factor productivity. Public environmental concern and green finance strengthen the positive impact of environmental regulation on urban green total factor productivity. Secondly, mechanism tests indicate that environmental regulation can increase urban green total factor productivity through green technological innovation and industrial structure upgrading. Thirdly, heterogeneity analysis reveals that the enhancement effect of environmental regulation on green total factor productivity is more significant in the eastern regions and the non-resource-based cities with relatively developed traditional finance and high levels of industrial modernisation.
Our study makes several contributions to the literature. Firstly, this paper innovates the calculation method of green total factor productivity. Distinguished from previous studies that utilised either the radial CCR model or the non-radial SBM model, this study employs a hybrid radial EBM model to green total factor productivity. This new approach simultaneously considers both the homogenous proportionality (e.g., energy input and environmental pollution) and non-homogenous proportionality (e.g., labour input and environmental pollution) relationships between input and output, incorporating the advantages of both the CCR and SBM models. The calculated indicators are more closely aligned with actual circumstances, making the research conclusions more reliable. Secondly, this study enriches the existing literature exploring the relationship between environmental regulation and green total factor productivity. Few studies have directly examined this relationship at the urban level. Previous studies have mainly relied on data from listed enterprises or leading manufacturing enterprises. This study utilises urban-level data, which can better reflect the overall green development situation in cities, encompassing both large enterprises and small- and medium-sized enterprises, which is beneficial for proposing differentiated environmental regulation strategies tailored to cities with different levels of economic development and resource endowments. Thirdly, while the existing literature has discussed the mechanisms of environmental regulation’s impact on green total factor productivity, there has been limited exploration of how to strengthen the positive effects of environmental regulation. This study takes a perspective from China’s policy and decision-making system, considering how environmental regulation impacts green total factor productivity. It also examines the role of green finance in enhancing the market attractiveness of environmental regulation, as well as the impact of public environmental concerns on increasing the pressure for the implementation of environmental regulation. The study provides targeted policy recommendations on how to enhance and improve the effectiveness of environmental regulation policies.
3. Research Design
3.1. Sample Selection and Data Sources
In this paper, panel data at the prefecture-level urban level in China from 2003 to 2021 are selected as sample data. Due to the large amount of missing data related to some prefecture-level cities, in order to ensure the robustness of the empirical regression results, this paper excludes the prefecture-level urban with missing values and finally takes 289 prefecture-level cities in China as the research sample. The indicators are obtained from the China Urban Statistical Yearbook, China Energy Statistical Yearbook, China Environmental Statistical Yearbook, and provincial and municipal statistical yearbooks. Missing data for individual cities are recursively processed using the mean interpolation method and the average annual growth rate of the last five years.
3.2. Variables Selection and Measurement
3.2.1. Explained Variables
Green Total Factor Productivity (GTFP): Adopts Tone and Tsutsui’s [
51] hybrid distance function compatible with radial and non-radial characteristics, i.e., the EBM model. Compared with the traditional CCR model with fixed scale compensation and the SBM model based on slack variables, the EBM model can effectively avoid the problem that the results of the CCR model are higher than the actual efficiency level due to the failure to consider the slack variables, as well as the problem that the results of the SBM model are lower than the actual efficiency level due to the neglect of the linear relationship between the input factors. The input-orientated EBM model, which takes into account undesired outputs, is as follows:
where
is the optimal value of efficiency;
is the radial efficiency value;
,
and
represent the weights of inputs, desired outputs and non-desired outputs, respectively, and
;
is the parameter containing the radial efficiency value and the non-radial relaxation, when
, the EBM will be simplified to the input-orientated CCR model, and when
, the model will be transformed to the SBM model.
On this basis, the Malmquist–Luenberger index model is used to measure the change in green total factor productivity considering undesired output, and the change in green total factor productivity (GTFP index) from period
to
is measured by the following formula:
where
is a distance function for period
, representing the distance between the decision unit and the efficient production frontier. If
indicates that urban green total factor productivity is improved from period
to period
, and vice versa, it is reduced.
This study referenced the existing literature to determine the input and output indicators related to green total factor productivity. At the input level, labour, energy, and capital were selected as input factors. The labour input indicator is determined by the number of employees in the secondary industry of urban; the energy input indicator is calculated by multiplying the industrial value-added of urban by the energy consumption intensity corresponding to the industrial value-added of the province; and the capital input indicator is calculated by multiplying the fixed asset investment of urban by the ratio of industrial investment to total social investment of province. At the output level, industrial value-added is selected as the expected output. The composite index of industrial smoke, industrial SO2, and industrial wastewater emissions is used as the unexpected output.
3.2.2. Explanatory Variables
Environmental Regulations (ER): Environmental regulation can solve the problem of negative externalities of environmental pollution by means of commanding or incentivising regulation, so as to achieve the purpose of effective management of the ecological environment. The sewage charge per unit of GDP reflects the intensity of environmental regulation to a certain extent, and the higher the amount of sewage charge in the reservoir means the higher the intensity of environmental regulation. In this paper, the ratio of the amount of sewage charges to GDP is used to express the environmental regulation (ER). The missing values of sewage charges at the prefectural and municipal levels are relatively large and based on the study of Song et al. [
52], since sewage charges are mainly collected for industrial wastewater, the weights of industrial wastewater discharges of the cities in the provinces are multiplied by the provincial level sewage charge data to obtain the municipal level sewage charge data. It should be noted that because China implemented the environmental protection fee to tax in 2018, the data after 2018 is the environmental protection tax revenue.
3.2.3. Mediating Variables
Industrial Structure Upgrading (IND): Industrial structure upgrading reflects the level of transformation and upgrading of industrial structure, which refers to the process of shifting the centre of gravity of industrial structure from primary industry to secondary and tertiary industries one by one. Drawing on existing studies, IND uses the industrial structure upgrading index to measure [
53].
Green Technology Innovation (INNO): Management innovations and technological innovations that aim to protect the environment are collectively referred to as green technological innovations. Drawing on existing research, IND measures the number of green patents filed in a given year by [
54].
3.2.4. Moderating Variables
Public Environmental Concerns (HAZE): Public environmental concerns can strengthen the local government’s attention to environmental governance issues, which makes the local government more willing to improve the environmental pollution situation in the city through environmental regulation and other means. Drawing on Wu et al. [
55], the public environmental concern is measured by the Baidu “haze” search index.
Green Finance (FIN): Green finance refers to the institutional arrangement that promotes the greening transformation of the economy through green credit, green bonds, green development funds, green insurance and other financial instruments and related policies. Drawing on the research of Liu and He [
56], the entropy method is used to measure the green finance index based on the seven indicators of green credit, green investment, green insurance, green bond, green support, green fund and green equity.
3.2.5. Control Variables
In order to control the impact of indicators other than environmental regulation on green total factor productivity, drawing on existing studies [
57,
58], this paper selects the level of social consumption (CSR), the level of openness (FDI), the financial capacity (FR), the emphasis on education (TECH) and the ability to invest in fixed assets (INF) as control variables. In addition, in order to avoid the interference of regional characteristics and macroeconomic characteristics on the regression results, this paper controls both regional individual and time fixed effects.
The variables are defined as shown in
Table 1.
3.3. Model Construction
In order to test the above hypothesis, the following model is constructed in this paper.
In the formula,
denotes city;
denotes year;
denotes environmental regulations and
denotes green total factor productivity;
is the parameter to be estimated, and
,
and
denote the individual fixed effects (urban fixed effect), time fixed effects and random perturbation terms, respectively, and the rest of the variables are defined as shown in
Table 1.
According to research Hypothesis 1, environmental regulations can improve green total factor productivity through industrial structure upgrading and green technology innovation, in order to test whether the above research hypothesis is valid, the two-step intermediation method is used to test the indirect mechanism that may exist in it, the specific formula is as follows:
In the formula, represents the mediating mechanism variable, and industrial structure upgrading (IND) and green technology innovation (INNO) are selected as proxy variables for testing, respectively. Where , , , and denote the individual fixed effects, time fixed effects, and random perturbation terms, respectively, and the other control variables are kept in the same way as in Equation (3).
According to Hypothesis 2 and Hypothesis 3 research hypotheses, environmental regulation can significantly increase urban green total factor productivity, and the higher the level of green finance development and public environmental concern, the more it helps to increase the induced effect. In order to test whether the above research hypotheses are valid, the cross-multiplier term is introduced to test, the specific formula is as follows:
In the formula, represents the moderating variables, and green finance (FIN) and public environmental concerns (HAZE) are selected as proxy variables for the test, respectively. Where , , represent individual fixed effects, time fixed effects and random perturbation terms, respectively, and other control variables are consistent with Equation (3).
6. Conclusions and Discussion
6.1. Conclusions
Rapid industrialisation and urbanisation in China have led to significant energy consumption by urban industries. The issue of environmental pollution is becoming increasingly prominent. This has prompted the government to implement environmental regulation policies to facilitate the transformation of the economic model, which can also be viewed as a process of enhancing green total factor productivity.
This study aims to investigate the impact of environmental regulation on green total factor productivity using a panel dataset of 289 Chinese cities. The research finds that environmental regulation can significantly enhance urban green total factor productivity. Public environmental concern and green finance strengthen the positive impact of environmental regulation on urban green total factor productivity. Mechanism tests indicate that environmental regulation can increase urban green total factor productivity through green technological innovation and industrial structure upgrading. Taking into account the differences in resource endowment, this study subdivides cities by category and economic sector. Heterogeneity analysis reveals that, compared to the resource-based cities, the positive effect of environmental regulation on urban green total factor productivity is more significant in the non-resource-based cities with relatively developed traditional finance and high levels of industrial modernisation. Compared to the central and western as well as the northeast regions of China, the positive effect of environmental regulation on urban green total factor productivity is more significant in the eastern region due to capital accumulation and technological constraints. The above conclusions of the study remain valid after changing variable measurement, extending the observation window, instrumental variable tests (IV), Heckman tests, propensity score matching (PSM), and placebo tests (PT).
6.2. Recommendations
Based on the research findings, the following policy insights are provided for the Chinese government departments. Firstly, the government needs to continue to adhere to environmental regulatory policies, construct green infrastructure and research platforms, guide technology exchange among enterprises, enhance the overall green innovation level of cities, and continuously promote the upgrading of industrial structures. Secondly, guide the public to pay more attention to urban environmental pollution and energy conservation issues, and involve the public in the entire process of formulating and supervising daily environmental protection policies. At the same time, expand and strengthen the green financial security system, and continuously increase special green financial securities, funds, and credits. Form a better coordinate with existing environmental regulatory policies. Thirdly, taking into consideration the development history, capital accumulation, technological reserves, and economic growth pressures of different regions, provide more policy support to resource-based cities in maturity, decline, and regeneration stages. Encourage the eastern region to summarise their environmental regulatory experiences and support the development of the central and western as well as the northeastern regions through green technology and capital assistance. Enhance the environmental regulatory capabilities of underdeveloped areas to promote the improvement of green total factor productivity.
6.3. Theoretical Contributions
This study contributes to filling the gap in research on the relationship between environmental regulations and green total factor productivity, thereby making an incremental contribution to the existing knowledge system. Specifically: Firstly, this paper innovates the calculation method of green total factor productivity. Distinguished from previous studies that utilised either the radial CCR model or the non-radial SBM model, this study employs a hybrid radial EBM model to green total factor productivity. In the actual production process, enterprises exhibit both radial and non-radial relationships between inputs and outputs. For example, enterprises input both energy and labour in their production operations. Energy input is linearly related to environmental pollution, while labour input shows a non-linear relationship with environmental pollution. Failure to consider both relationships can lead to bias in estimating green total factor productivity. Therefore, this study opts to utilise a hybrid radial EBM model that considers both linear and non-linear relationships, filling a significant gap in this area of research. Secondly, this study innovates the research data on environmental regulation. Previous studies on the economic consequences of environmental regulation mainly relied on data from Chinese-listed companies or leading manufacturing enterprises. Most of these enterprises are located in coastal cities and economically developed regions in China, which cannot represent the situation in China’s inland regions enterprises and small and medium-sized enterprises. In contrast, this study uses data at the urban level, which better reflects the comprehensive situation of urban green development, including large enterprises and small- and medium-sized enterprises. It also considers the wide economic development level differences and resource endowment disparities between Chinese cities, making the research conclusions more practical. Thirdly, this paper expands the scenario factors of the “environmental regulation and urban green total factor productivity” relationship from a theoretical perspective, as existing research lacks analysis on how to enhance the positive effects of environmental regulations and reduce the negative impacts of environmental regulations. This study has identified the role of green finance in enhancing the attractiveness of environmental regulation markets, as well as the impact of public environmental concerns on increasing the pressure for the implementation of environmental regulations, providing new theoretical perspectives for future researchers.
6.4. Limitations and Future Research
Although this paper provides important findings, it still has some limitations. Firstly, the focus of this study on China limits the generalisability of the study results to different economic, social, and regulatory environments, necessitating consideration of more countries, especially developing and developed countries. Secondly, the data of this study may not cover all dimensions of environmental regulation affecting green total factor productivity, and potential key factors may be overlooked. Finally, mediating and moderating factors may need to be supplemented to better reflect the actual situation.


