Article

Evaluation of the Quality of Higher Education Services by Revised IPA in the Perspective of Digitization

by
Olimpia Iuliana Ban
1,*,
Roxana Hatos
2,
Nicoleta-Georgeta Bugnar
3,
Dinu Sasu
4,
Adela Laura Popa
4 and
Andreea-Florina Fora
3
1
Department of Economics and Business, Faculty of Economic Sciences, University of Oradea, 410087 Oradea, Romania
2
Faculty of Economic Sciences, University of Oradea, 410087 Oradea, Romania
3
Department of International Affairs, Faculty of Economic Sciences, University of Oradea, 410087 Oradea, Romania
4
Department of Management-Marketing, Faculty of Economic Sciences, University of Oradea, 410087 Oradea, Romania
*
Author to whom correspondence should be addressed.
Sustainability 2024, 16(7), 3017; https://doi.org/10.3390/su16073017
Submission received: 9 March 2024 / Revised: 1 April 2024 / Accepted: 2 April 2024 / Published: 4 April 2024
(This article belongs to the Special Issue Sustainable Higher Education: From E-learning to Smart Education)

Abstract

:
Higher education services are at a crossroads created by the disruptive impact of digitalization. The COVID-19 pandemic experience forced Romanian universities to use digital educational platforms and other online education tools. The questions put into discussion are: Where is Romanian university education headed, what attributes of service quality are relevant for students, how do they see the digitization experience, and what needs to be done to increase satisfaction? A survey was conducted based on an online questionnaire on a sample of 314 students from the University of Oradea that used, for the first time in empirical research, a scale to measure satisfaction with the quality of educational services to which a dimension of digital education is added. Revised importance–performance analysis (importance–performance analysis in nine quadrants with one parameter c-9Qc-IPA) was used for data processing. The results show a still-reserved attitude towards certain aspects of the digitization of services, with priority remaining on aspects related to the material base and the prospects of finding a suitable job after graduation.

1. Introduction

One of the most important lessons learned from the COVID-19 pandemic period was the importance of technology in carrying out current activities, but especially in the smooth running of the educational process. In many universities around the world [1], the digitization process began well before the pandemic period, but it was the pandemic that intensified universities’ efforts to provide digital educational services. According to the results of the study by Helmer et al. [2], introducing courses that consider digital innovation is essential in higher education. These courses should be followed in the first phase by the teaching staff, and once the necessary skills have been acquired by the lecturers, they will be able to pass on, through the courses taught, useful information to the students in an attractive way.
During the pandemic, at the University of Oslo, Norway, it took only one week for the entire educational process to go digital [3]. Studies conducted in Poland [4,5] highlighted the fact that higher education in Poland has successfully adopted the digital transformation, but the success of the Polish university educational process will be guaranteed in the future only if the digitization process beginning is continuously improved.
The results of a study carried out in Romania in the field of economic engineering in higher education [6] highlighted the fact that innovation, through the adoption of digital technologies, helped to improve the results obtained by students. Thanks to technology, students have been able to creatively solve certain tasks, thus managing to better prepare themselves to be able to face the challenges they will encounter in the future in the labor market.
The University of Oradea [7] is an institution of higher education located in Oradea, Bihor County, Romania. The University of Oradea was established in 1991, but its tradition is remarkable and began in 1780, and since then, it has had significant development both in terms of the material base and the number of students and study programs, playing an important role in education and research in the region. Academic education is provided to the students at the highest level within the 15 faculties through a wide range of bachelor’s, master’s, doctorate, and postgraduate programs, with 49 departments and 27 research centers certified institutionally, more specifically, 90 bachelor’s study programs, 68 master’s study programs, and 20 doctoral fields. Along with professional performance and moral behavior, scientific research becomes the primary criteria for the academic evaluation of academic staff having 1401 employees, of which 917 are teaching staff, and over 16,000 students, of which 6% international students [8].
The University of Oradea occupies the 14th place in the national University Metaranking [9], having a score of 7.1671, thus climbing the ranking since being in 19th place in 2021. There are 73 universities in Romania, of which 53 are state universities. Out of the total of 73 academic institutions, only 31 managed to occupy a place in this ranking based on international rankings and scientific research indicators from recent years. The University of Oradea entered the Times Higher Education 2022 world ranking [9], positioned in the 1200 ± 1500 with growth forecasts in the coming years regarding academic research and the 4708th place according to the Scimago Institutions Ranking [9]. Also, according to webometrics, the University of Oradea ranks 14th in the national hierarchy [10].
The forms of digital educational at the University of Oradea are listed in Table 1. Their use differs from one faculty to another.
During the pandemic years, both the courses and the conferences were conducted almost exclusive online. Since 2022, the University of Oradea, with the contribution of the IT Integrated Management Service [11], has made its new UOradea eLearning educational application available to students and teachers, as well as to other categories of users. This is part of the “Education” category and is accessible both through the App Store for Apple users and through the Play Store for Android users. The application provides direct access, with the help of mobile devices, to the Moodle platform of the University of Oradea, which is also accessible at the browser level at https://e.uoradea.ro (2 December 2023). The University of Oradea provides students with digital textbooks, diaries, and other learning materials. All the primary learning resources such as the basic materials of the courses and seminars are available and accessible on the discipline pages on the https://e.uoradea.ro/platform (2 December 2023).
In this study, only some online education tools from Table 1 were chosen to ensure that they were used by all the faculties surveyed.
The purpose of this research is to see what the perception of students in Romania is, more precisely, the students at the University of Oradea, regarding the contracted educational services, with the emphasis on digitalization. The present work proposes to identify the aspects that can be improved but also the elements that should be maintained in the educational process. The motivation for choosing this research topic is based on the desire to outline the perception that Romanian students have regarding the digitization of educational services.
Since in the present research, numerous studies were highlighted that analyzed the digitalization of educational services in universities through the lens of the teaching staff, this time, the other camp is targeted, that of the direct beneficiaries of education services: students.

2. Literature Review on Higher Services Quality and Digitization

Service quality and customer satisfaction are two closely related concepts [12]. The satisfaction of the service consumer is considered a precondition for the retention and loyalty of the consumer and the achievement of economic objectives. The importance of analyzing aspects related to satisfaction in the context of university education (higher education) is addressed by numerous studies [13,14,15], the most recent ones focusing on the satisfaction of the students related to the influence of the digital environment on education.
Generally speaking, there are two basic approaches to service quality assessment. According to the first approach [16], the measurement of service quality must include only consumer perceptions. The second approach found in most service quality measurement models involves comparisons between expectations and the actual level of service quality perceived by customers, an idea introduced by Grönroos [17] and then developed by Parasuraman et al. [18], which later led to the famous SERVQUAL scale. Parasuraman, Zeithaml, and Berry continued to research the proposed model and published the results of their efforts in 1986, 1988, 1990, 1991, 1993, 1994, and beyond [18]. The research led to the current form of the SERVQUAL scale, which has five dimensions with 22 items measuring expectations and perceptions. These five dimensions are tangibles, reliability, responsiveness, assurance, and empathy.
A pertinent criticism of the SERVQUAL scale is related to the particularities that each service domain imposes which change the composition of the scale. Empirical studies performed in different fields have led to the identification of new service quality assessment parameters.
Also, in higher education services, measurement scales have been proposed and operationalized with many similarities to SERVQUAL, some studies even applying SERVQUAL [19,20,21].
There are also many scales specific to higher education. Teeroovengadum et al. [22] proposed the HESQUAL (Hierarchical Model of Higher Educational Service Quality) with five categories: Administrative Quality, Physical Environment Quality, Core Educational Quality, Support Facilities Quality, and Transformative Quality. Latif et al. [23] proposed HiEduQual (Higher Education Service Quality) which was developed and undertaken through focus group discussions with four different stakeholders of higher education that included students, parents, teachers, and employers. In this case, six determinants were released: teacher quality, administrative services, knowledge services, activities, continuous improvement, and leadership quality.
Steppacher et al. [24] applied HEADSQUAL, a perceived quality assessment framework of administrative services in higher education institutions.
An adapted form of the scale, the Student Evaluation of Educational Quality (SEEQ), was applied by Cladera [25] for the second year of undergraduate economics students enrolled in a compulsory introductory course in Econometrics. They modeled the results with importance–performance analysis.
The research samples are not very large; they range from 300 at the School of Business and Economics from different years of undergraduate studies in the study by Tsinidou et al. [26], 432 in Akareem, Hossain [27], 340 students in Dicker et al. [28], 280 in Hwang, Choi [20], 207 in Teeroovengadum et al. [22], 87 in Caldera [25], and 701 in Sukardi et al. [21].
A focus group was used as the first stage of research in the studies by Sultan, Yin Wong [29], Dicker et al. [28], and Latif et al. [23]. After the COVID-19 pandemic, papers appeared [30] that explain some barriers and challenges that universities encounter, as well as the technological resources and methodologies they have used in the current scenario to transform higher education to face COVID-19 disruption. The challenge for the world of education is to prepare the human resources capable of responding to the challenges and trends of industrialization 4.0. Studies even before the pandemic [31] have shown that digitization in the world of education is one of the dominant solutions addressed in the context of the industrial revolution 4.0 and disruptive technology.
With the digital revolution in education, the premises are created for an ethical renewal of learning according to the neoliberal principle of freedom, with Grimaldi and Ball [32] supporting the importance of studying the effects of the implementation of mixed learning on education.
In the educational process, the need for pedagogical and digital training of teachers is recognized [33]. Studies [34] have shown that in schools where the use of smartphones by students is prohibited, a lower frequency of TIC use is recorded. The concern for understanding trends in education is also reflected in the results of various studies carried out in schools in various countries. In the educational process, teachers are using virtual systems and interactive whiteboards more often, being consistent in the use of digital tools [34]. Active support from the institutional management strengthens the frequency of using digital media in education.
Empirical studies [35] support three waves through which the teaching process passes in the digital age. In the first wave, the Internet becomes a challenge for teaching; in the second wave, the attention of teachers and students is on the educational interaction through social networks; and the third wave is the most consolidated in which an educationally relevant interaction is established through access to authors, research, etc.

3. Materials and Methods

3.1. Study Objectives

The purpose of the present research is to identify the students’ attitude towards digital educational services in the context of the educational services offered by the University of Oradea. Below are the objectives of the study that are subordinate to the purpose of the research.
The pursued objectives of the study are:
  • Capturing the global perception regarding the quality of the educational services offered by the University of Oradea;
  • Identifying the influencing factors of global satisfaction with the University of Oradea, respectively testing the relationship between global satisfaction and variables related to the respondents;
  • Identifying the variables that leave their mark on how to evaluate the importance of quality attributes and the perceived performance of the University of Oradea in these attributes;
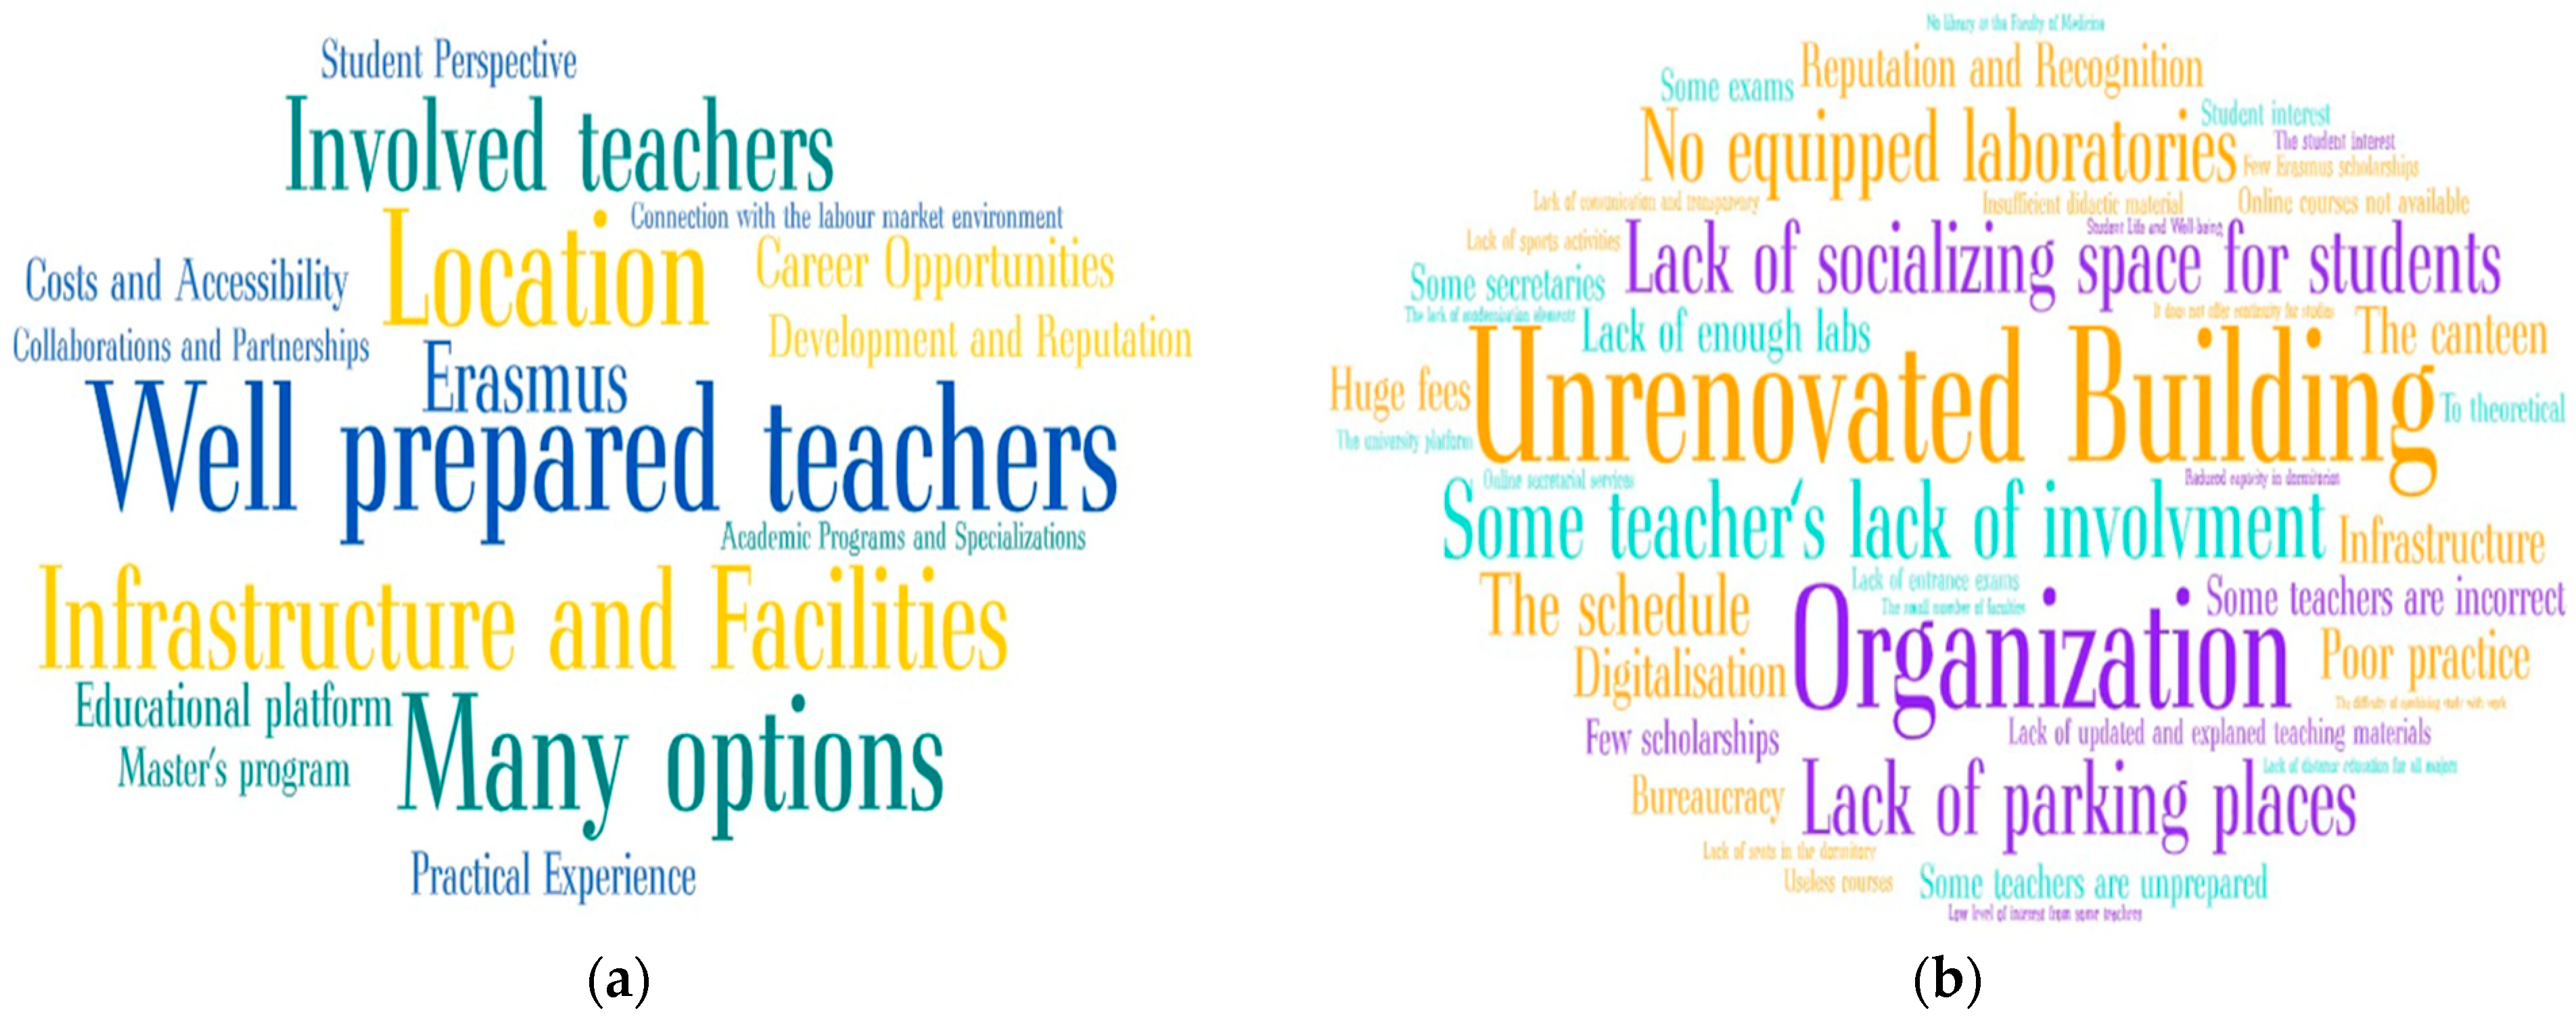
  • The identification, from the perspective of the respondents, of the main advantages and disadvantages that the University of Oradea has;
  • Identifying the attributes that determine the quality of the educational services in which the University of Oradea performs adequately in the opinion of the respondents and revealing the position occupied by the factors of digitization of educational services;
  • Revealing the attributes of the quality of educational services on which the University of Oradea must focus in order to increase consumer satisfaction (students and master’s students) and revealing the position occupied by the attributes of digitalization of educational services;
  • Discovering the attributes of the quality of educational services that are less important in the opinion of the respondents, which do not require attention or can even be eliminated, and revealing the position occupied by the attributes of digitalization of educational services;
  • Discovering the position of the respondents regarding the development of digitization in higher education, as a result of the experience lived during the COVID-19 pandemic.
The target study population consists of bachelor’s and master’s students from the 15 faculties of the University of Oradea, who are at least in their second year of study, i.e., have sufficient experience.

3.2. Research Stages

The research was organized in two stages, namely:
  • Stage 1—qualitative research by organizing focus groups; secondary research;
  • Stage 2—quantitative research by carrying out a questionnaire-based survey.
In March 2023, two focus groups were organized with undergraduate students of different specializations from the Faculty of Economic Sciences. Students from a sampling frame of approximately 100 students were selected for the focus groups. The topic of the discussion was “Satisfaction with the educational services offered by the University of Oradea”. The purpose of the focus groups was to identify specific elements of Oradea education that would then be found or introduced in the subsequent quantitative research. A few categories of topics dominated the organized focus groups, topics freely released by the focus group participants. The focus fell on the need for student feedback, student engagement, teaching methods, and the practical nature of the content of the teaching material. The online learning experience was limited but brought benefits noted by students.
The qualitative research was carried out simultaneously with secondary research, a bibliometric analysis that allowed for the identification of some relevant attributes of the evaluation of the quality of higher education services. On this occasion, it was found that there are two approaches to the evaluation of higher education services: the evaluation of classic education services with existing scales or scales constructed during the study and the evaluation of digital education services. A scale was built that combines the evaluation of classic services and existing forms of digitization at the University of Oradea. The scale has 5 sections: (I) The quality of the basic educational service (10 attributes); (II) The quality of administrative/support services (8 attributes); (III) The quality of the physical support (with 10 attributes); (IV) Opportunities and extracurricular activities (6 attributes); and (V) Support for online and/or hybrid activities (6 attributes). They are summarized in Table A1 of the Appendix A. As a result of the focus groups organized in the attribute table, Table 1, 8 attributes were added. The attribute “The use of communication networks (Facebook, Whatsapp) in education” was introduced by the authors of this research to test its importance and performance from the perspective of the respondents, an idea also shared by Pavlikova et al. [36].

3.3. The Questionnaire and the Sample

The quantitative research was in the form of a survey based on a questionnaire made with Google forms and applied with the operator. The questionnaire was applied between March and June 2023, and 314 valid questionnaires were accumulated (Table 2). The questionnaires were applied to the students who were present in the university amphitheaters. Around 400 students were present in the amphitheaters on the date of the presentation of the questionnaire. Of the students present, approximately 80% wanted to access and complete the questionnaire. They were invited to forward it to other colleagues of theirs if they wished.
The questionnaire was organized into three parts: (I) Obtaining the data collection agreement; (II) 8 questions, of which 5 are closed questions with a 5-point Likert scale about the respondent’s study cycle and faculty, the global opinion about the educational services of the University of Oradea, the firmness of the decision to choose this university, the importance attributed to 40 factors that influence the educational services, and how the University of Oradea performs on these factors as well as 3 open questions about the advantages and disadvantages they see at the University of Oradea and what recommendations they have regarding the digitization of educational services at the University of Oradea; and (III) Socio-demographic data about gender, age, residence, and whether they benefit from a scholarship.
The sampling method was that of the snowball, and it was answered based on availability.

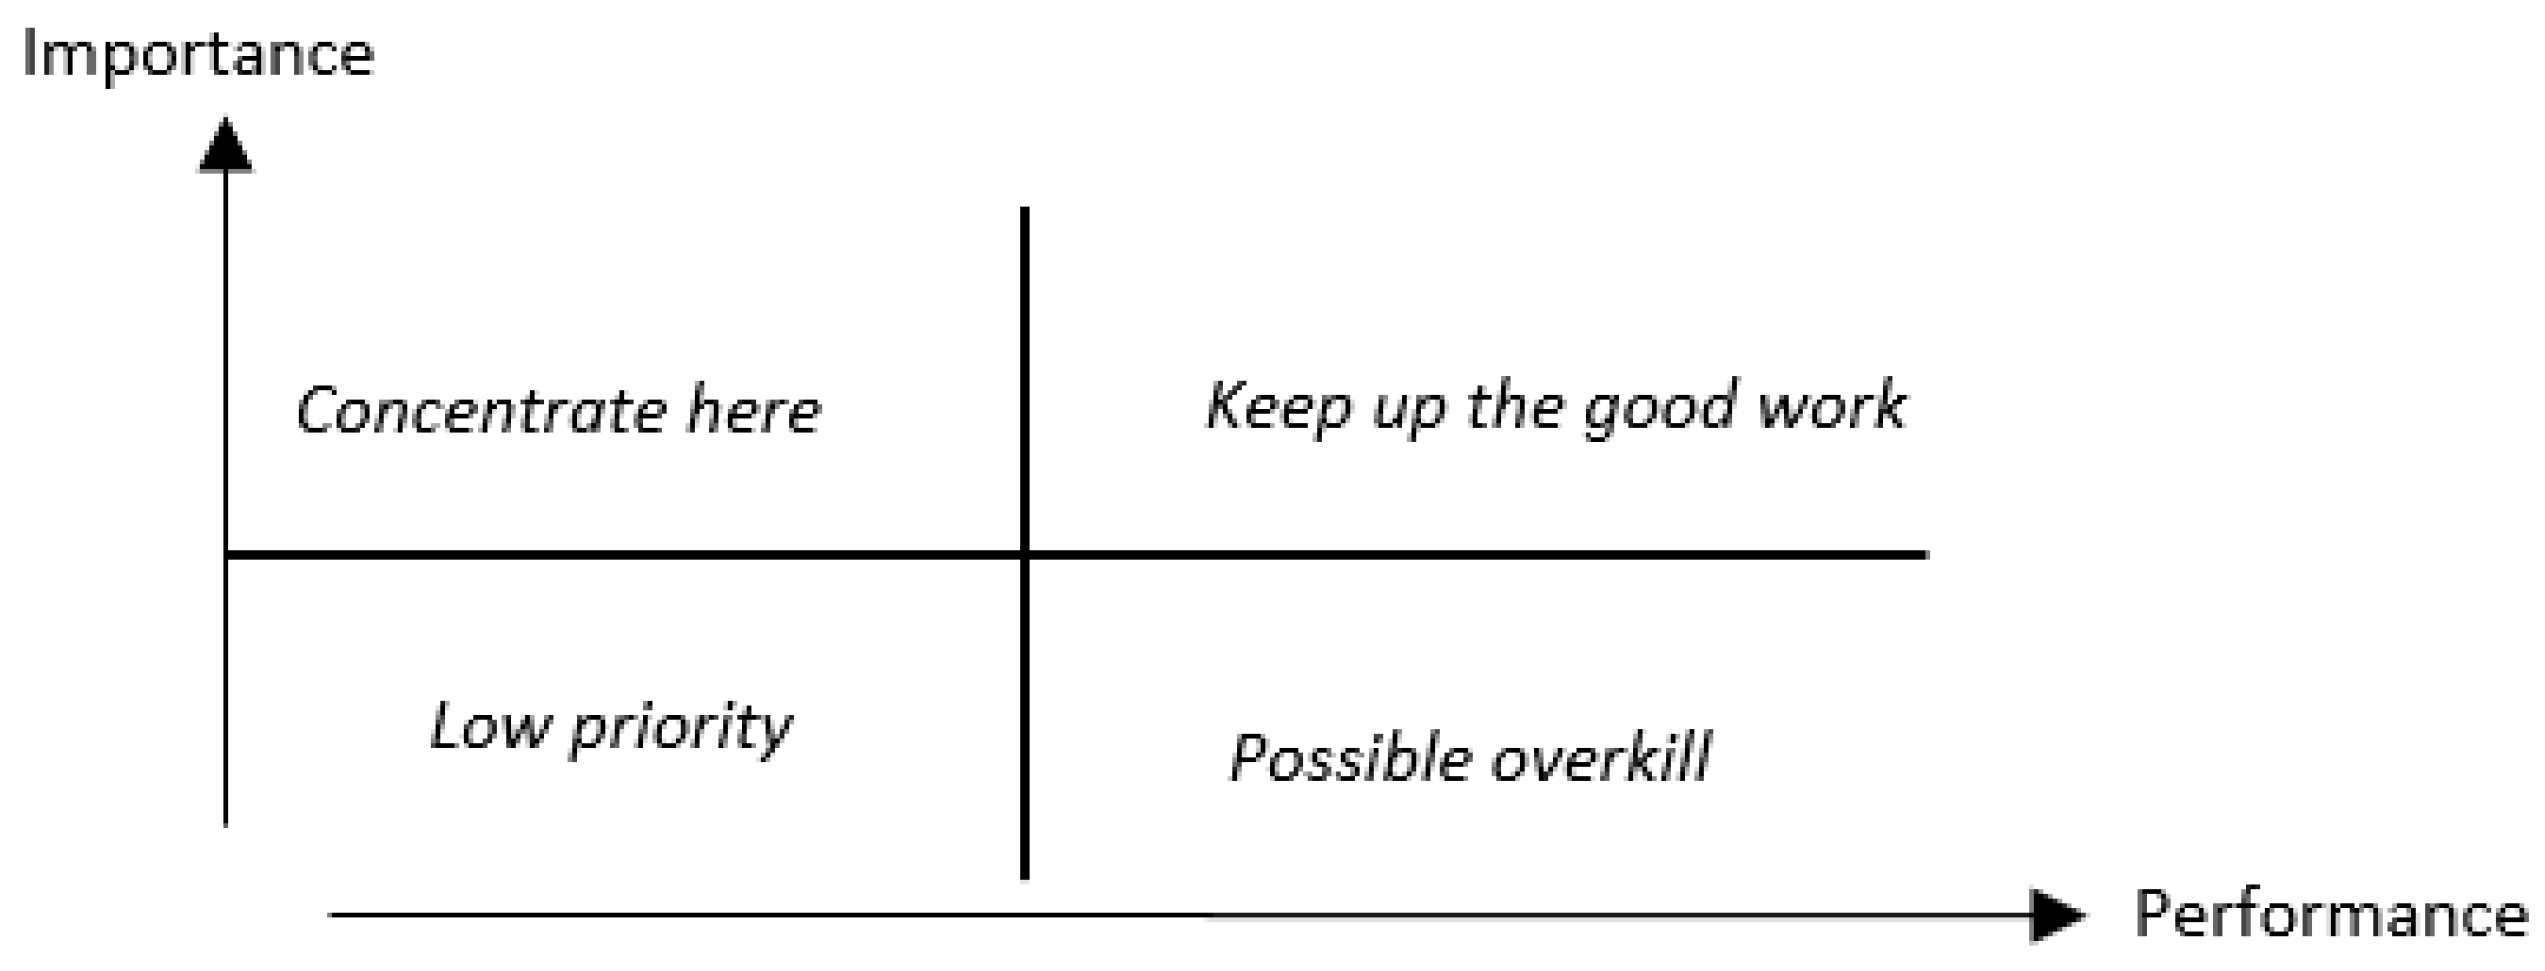
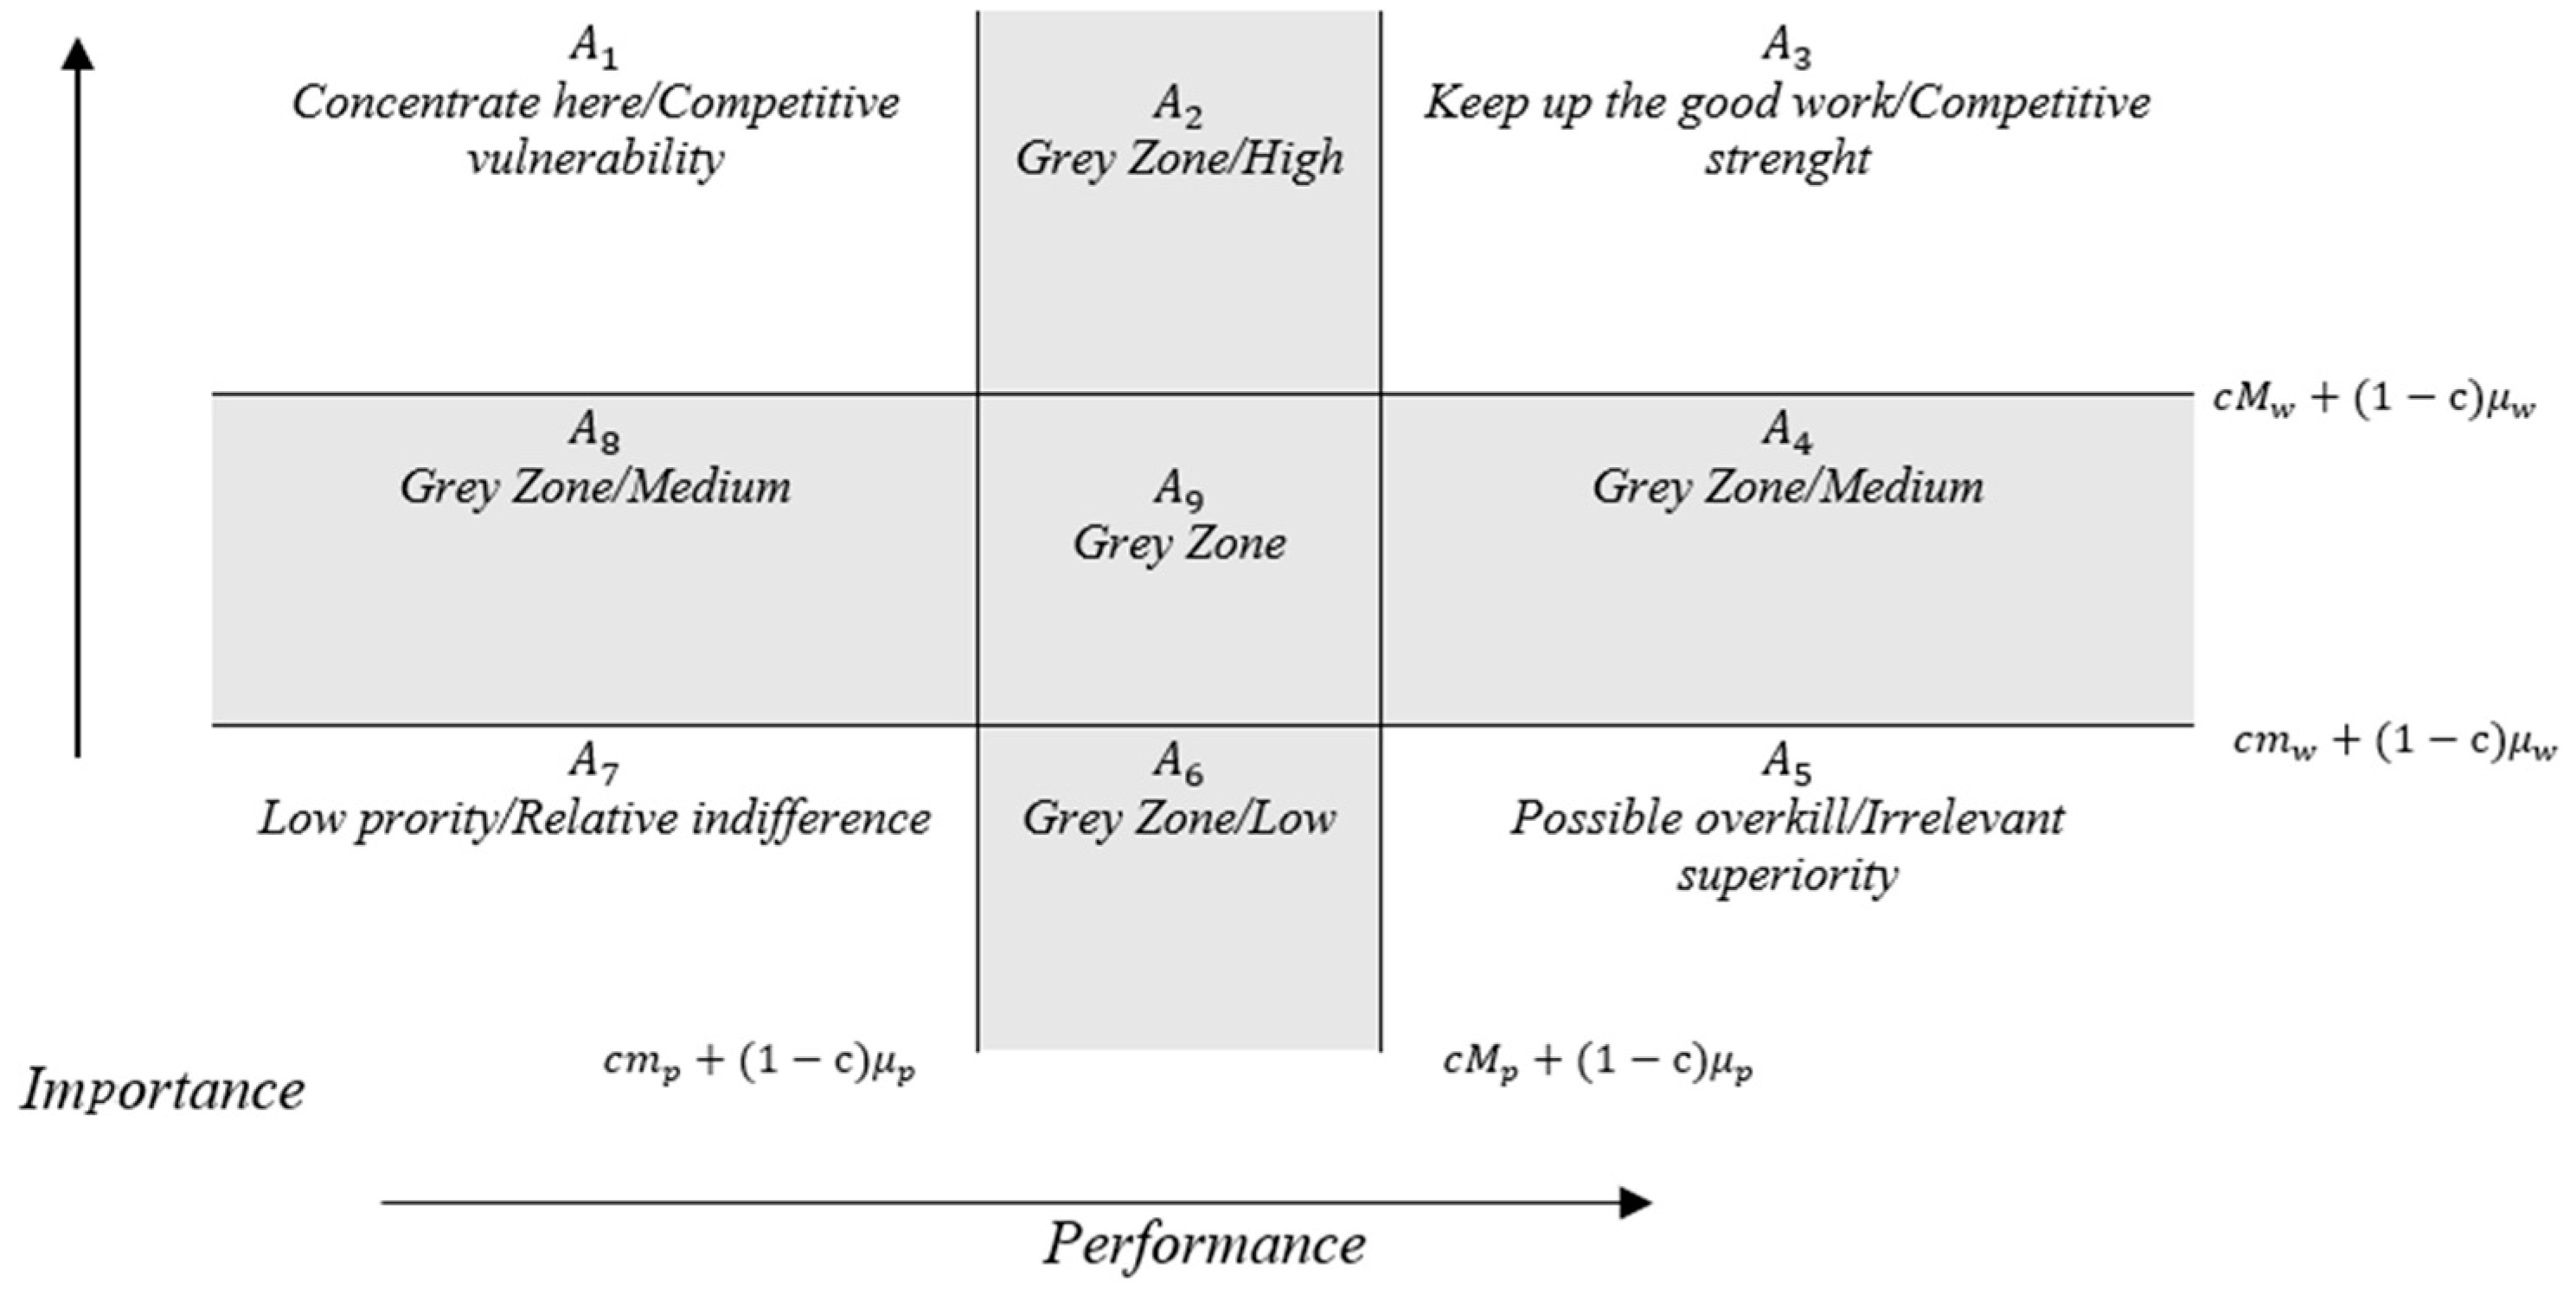
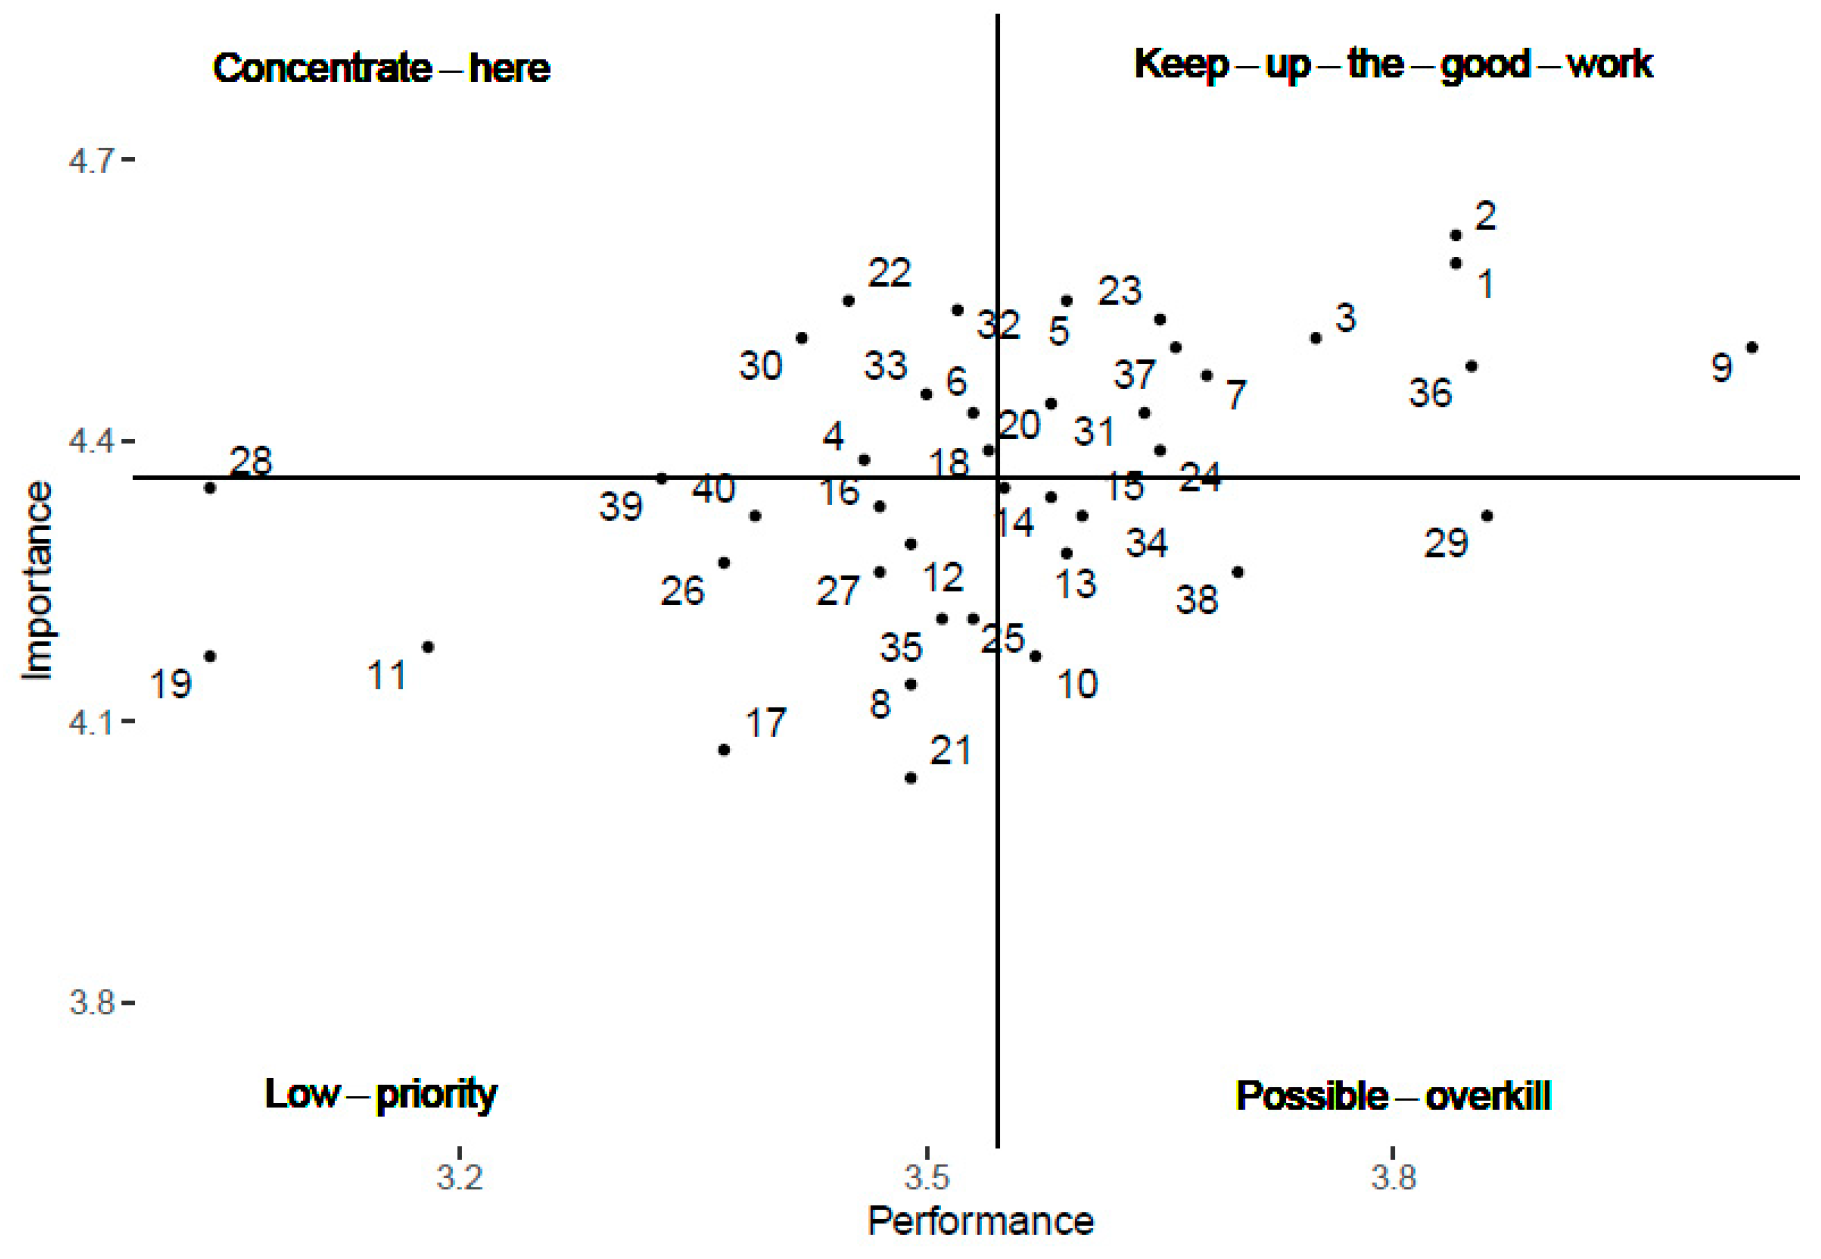
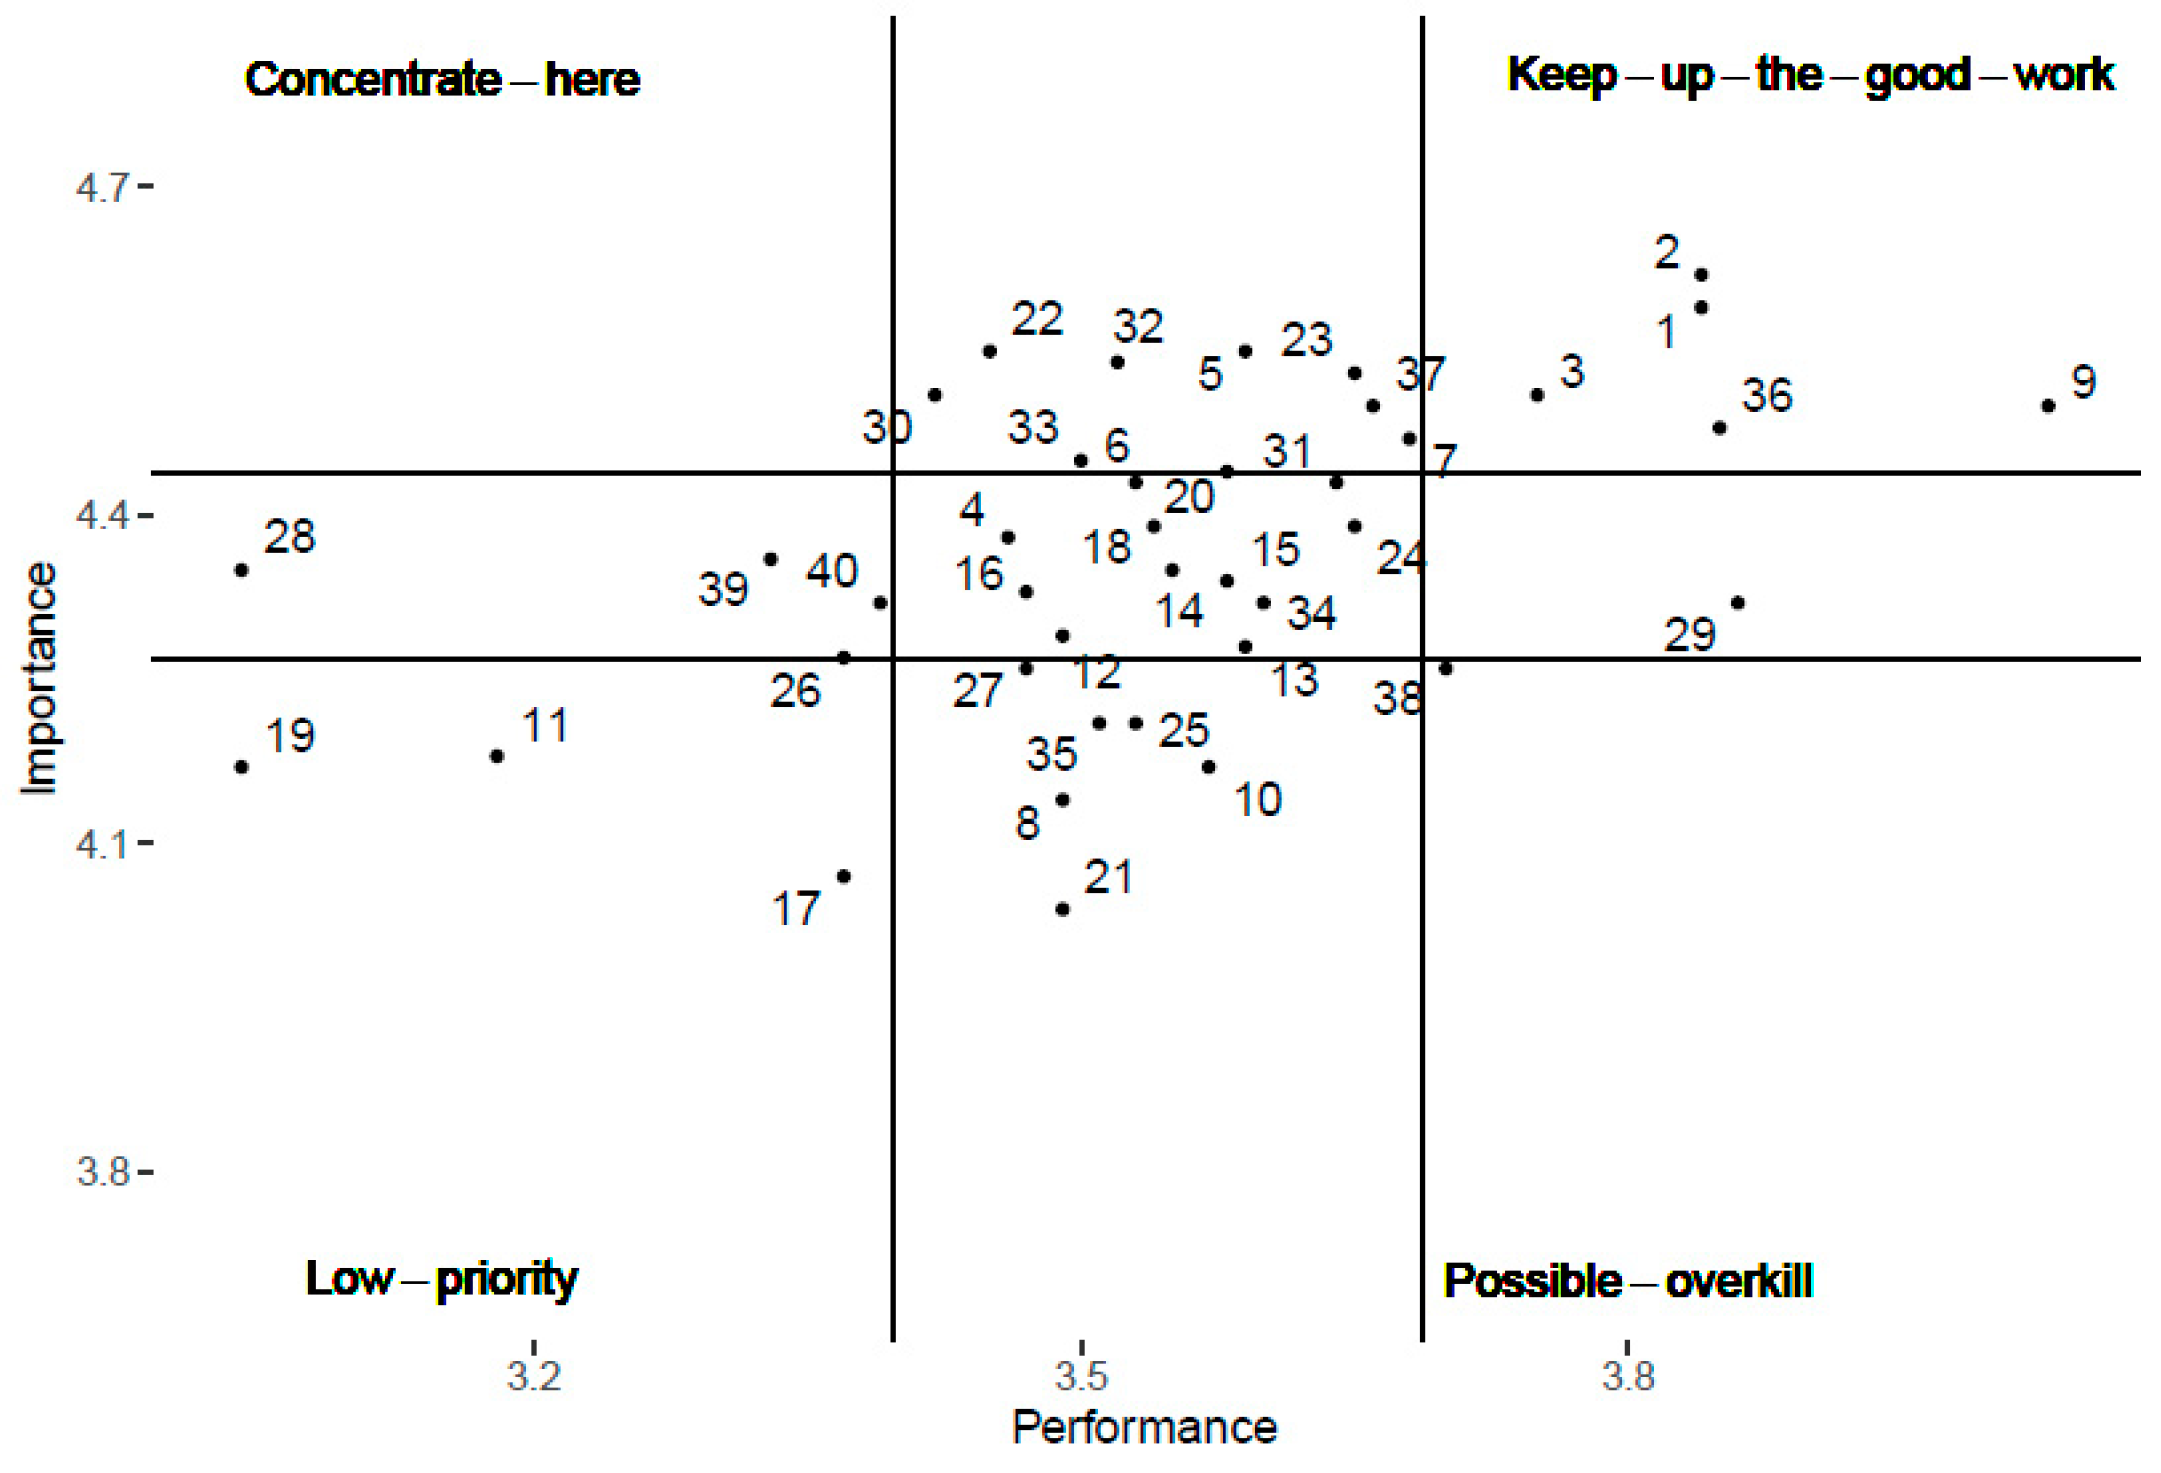
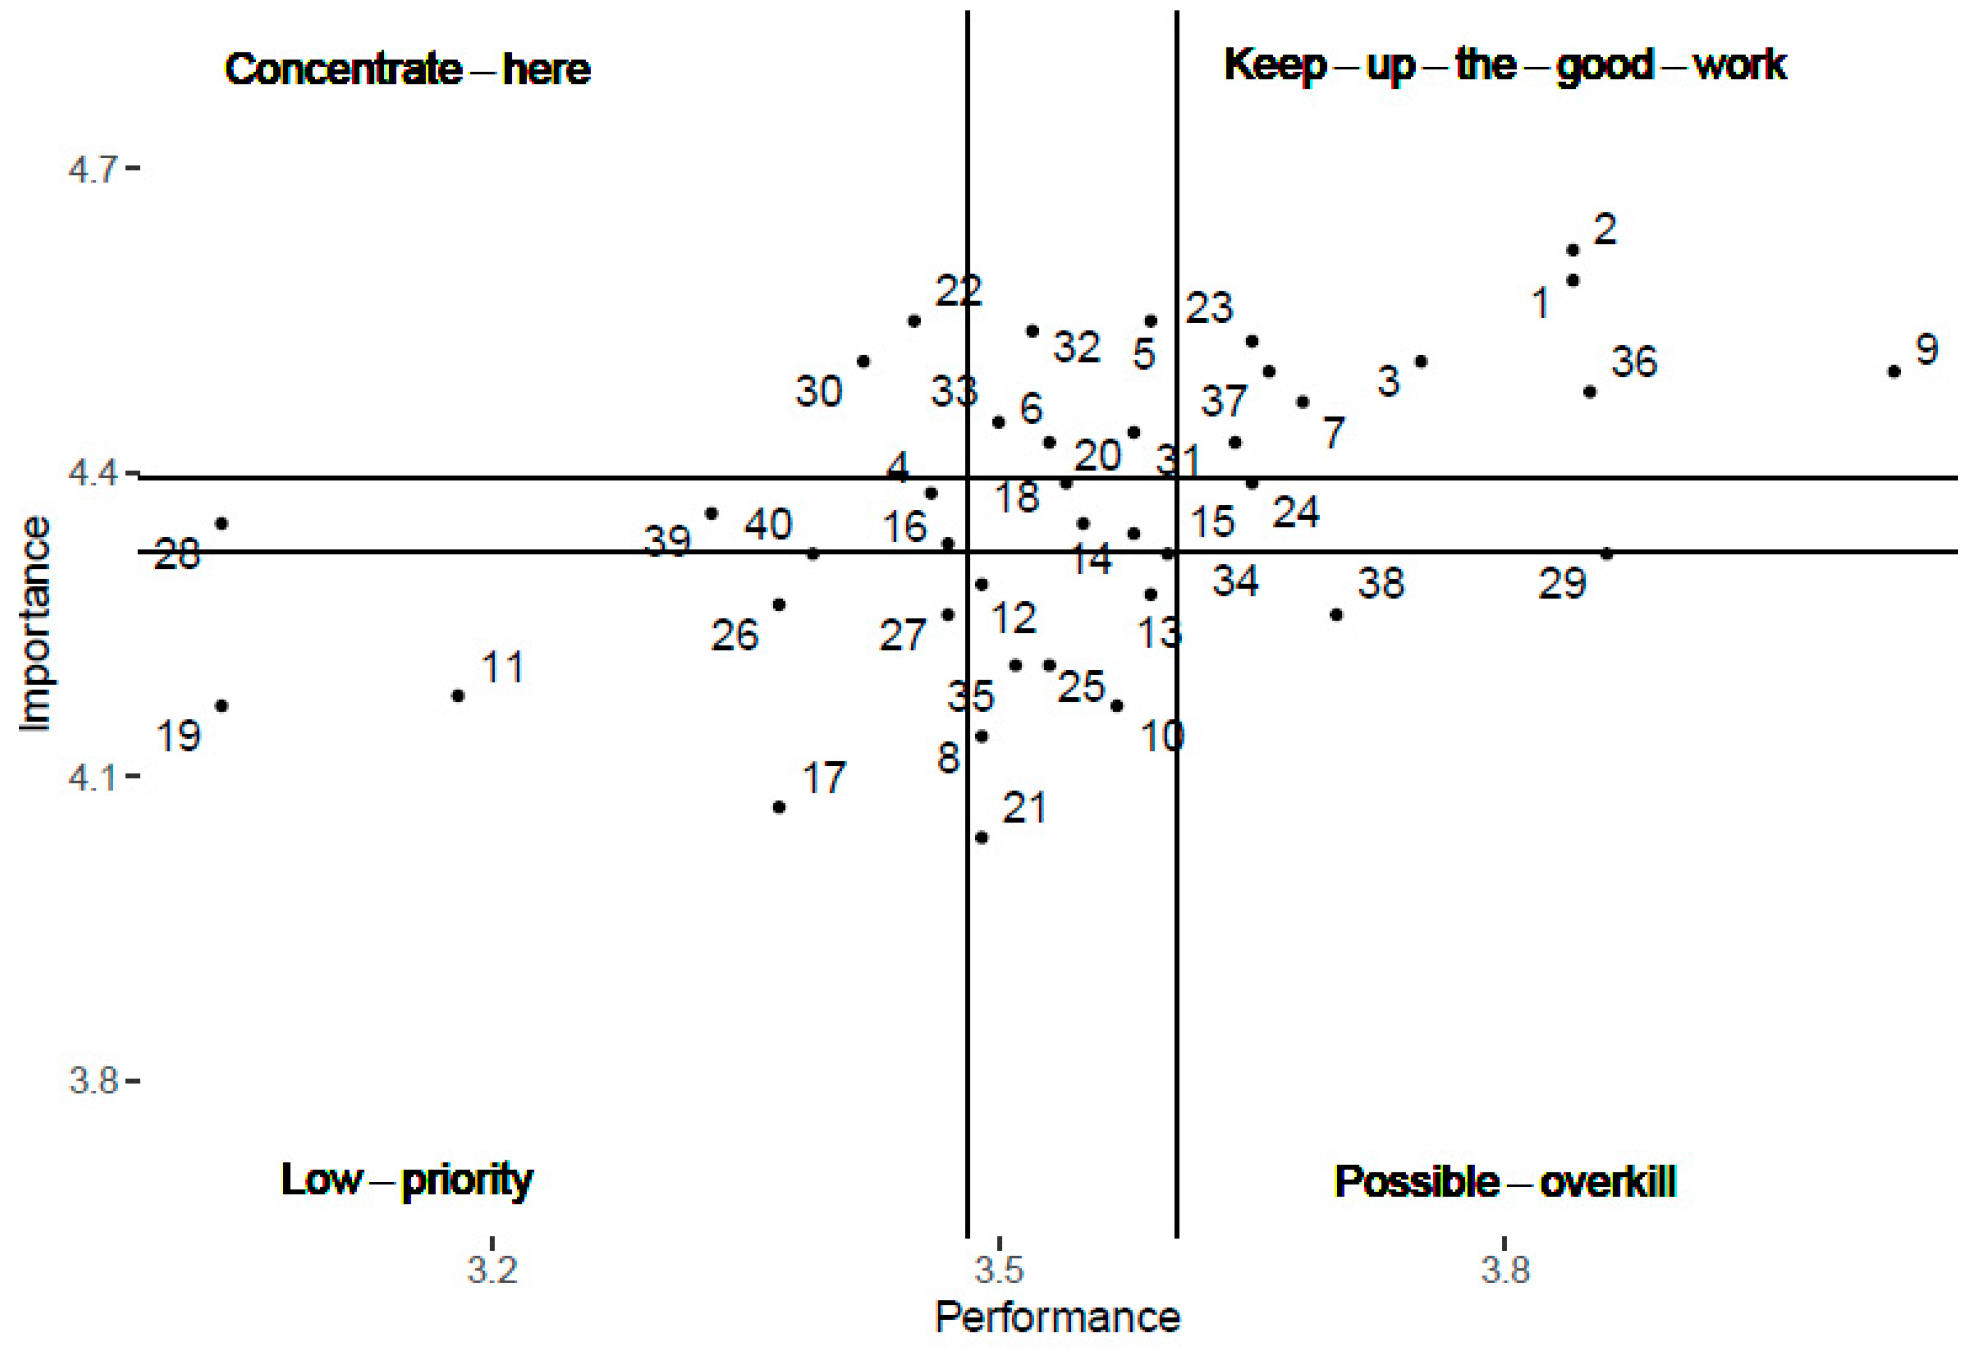
3.4. Nine-Quadrant Importance–Performance Analysis Method with a Confidence Value (9Qc-IPA)

To process data and identify aspects of the quality of higher education services that need to be addressed, the revised importance–performance analysis method was chosen.
Importance–performance analysis (IPA) is a method for evaluating the perception of service quality, proposed by Martilla and James in 1977 [37]. IPA is applied in many service sectors, including higher education services [21,25,38,39,40,41]. Later, many revised variants appeared, which is why the IPA proposed by Martilla and James [37] is often called original, classic, or standard IPA (Figure 1).
We chose to apply the Nine-Quadrant Importance–Performance analysis method with a confidence value (9Qc-IPA) due to its compatibility with the number of attributes used in the study and the suggestive way of representing the results. This involves the distribution of a given set of service attributes/factors/characteristics into four categories as described in Figure 1.
The selection of the optimal positioning of the thresholds—a vertical axis corresponding to performance and a horizontal axis corresponding to importance—in the IPA standard is a subject of a continuous debate. The grand means of the data or the mid-points of the scales are the usual choices. Original importance–performance analysis assumes the partitioning of a set of attributes into four sets (A/Quadrant I—“Concentrate here”, B/Quadrant II—“Keep up the good work”, C/Quadrant III—“Low priority”, and D/Quadrant IV—“Possible overkill”) with respect to the level of performance and importance.
An important and at the same time sensitive aspect of the standard IPA, related to the observation above, is the positioning of attributes close to the axes, which suggests that different strategies could be applied to an attribute [42,43,44]. Obviously, the question arises as to whether there is an order in the strategic approach to the attributes according to their positioning in a quadrant.
Ban et al. [45] improved the original IPA by providing a mathematical support for the 9-quadrant IPA (Figure 2), complementing the idea of Albrecht and Bradford [46] by proposing the 9Q-IPA, which is actually a rigorous thresholding procedure of importance–performance axes. It is observed that in the method proposed by Albrecht and Bradford [46], the resulting matrix has 9 quadrants, of which only 4 propose strategic measures for the contained attributes (clear category). The names of the 4 quadrants in the method of Albrecht and Bradford [46] correspond to those of the importance–performance analysis of Martilla and James [37], namely: Concentrate here/Competitive vulnerability, Keep up the good work/Competitive strength, Low priority/Relative indifference, and Possible overkill/Irrelevant superiority. The gray area in Figure 2 assumes that no strategic measure is applied to the attributes positioned there (ambiguous quadrants).
The proposed method lends itself very well when there are many attributes in question, as is the case here. According to Ban et al. [45], the thresholding axes are given by (see Figure 2):
p m , c = c m p + 1 c μ p
p M , c = c M p + 1 c μ p ,
  w m , c = c m w + 1 c μ w ,
w M , c = c M w + 1 c μ w
where
m p = m i n 1 j n   p j , M p = m a x 1 j n   p j , μ p = 1 j n p j / n ,
m w = m i n 1 j n   w j , M w = m a x 1 j n   w j , μ w = 1 j n w j / n .
Ban et al. [45] mathematically defined the boundaries of the quadrants and proposed a parameter “c” (which is α in original paper) that allows the adjustment of strategic measures according to the experience of the decision-maker, taking into account resources, competitors, and objectives pursued. The confidence value, c [ 0,1 ) , gives some elasticity in the application of the method (9Qc-IPA). If the value of c decreases, then the number of attributes situated in a clear category (A1, A3, A5, or A7) increases.
This parameter is determined based on Ban et al.’s method [45], which showed that by imposing a quite natural condition such as that the sum of the areas corresponding to the ambiguous categories is equal to the sum of the areas corresponding to the clear categories, a confidence value independent of the input data is obtained. This confidence value is approx. 0.293, and it can be considered as an optimal confidence value c. It is optimal because it gives all attributes a chance to be part of either the clear or ambiguous quadrant.
This method was chosen because it is easy to apply, gives greater freedom to the decision-maker, and enables a detailed approach to the attributes in a quadrant.

4. Results

Achieving the set objectives of the study was pursued through the design of the data collection tool and the methods used to process and interpret the data.
The objective (a) of capturing the global perception regarding the quality of the educational services offered by the University of Oradea was pursued through an item of the questionnaire with the question regarding the global perception of the quality of the educational services offered by the University of Oradea. This question received a score of 3.82 out of 5 points on the Likert scale, and the total weight of the answers can be seen in Figure 3.
There is also an uneven distribution between the five categories, with most responses being in the upper half of the scale.
Regarding “b. identifying the influencing factors of global satisfaction with the University of Oradea, respectively testing the relationship between global satisfaction and variables related to the respondents”, this analysis was carried out by including some items in the data collection questionnaire related to respondents’ gender, place of residence, age, and scholarship status. IBM SPSS Statistics 26 was used to test the link (Table 3.)
As seen in Table 3, four correlations with overall satisfaction were found, namely: residence of respondents, age of respondents, level of education, and type of college attended. More mature respondents had a higher degree of satisfaction with the University of Oradea. Also, master’s students were more satisfied with the services offered by the University of Oradea than bachelor’s students. The residence of the respondents shows some influence on satisfaction. Also, the faculty attended leaves its mark on respondents’ satisfaction. For example, students from the Faculty of Economic Sciences and Faculty of Social Sciences were more satisfied than students from the Faculty of Medicine, who were very dissatisfied, especially with the material base.
In order to “d. identify, from the perspective respondents, the main advantages and downsides that the University of Oradea has”, two open questions were used. To the question “II.6. What do you consider to be the main advantage of the University of Oradea?”, 257 valid responses were registered. To the question “II.7. What do you consider to be the main downside of the University of Oradea?”, 229 valid responses were obtained. The answers given by the students were cleaned, standardized, coded, and grouped into categories, and the frequency of use of words (or synonyms) or formulations was marked. For the visual representation, an online word cloud generator, WordArt, was used.
The graphic representation of the answers can be seen In Figure 4.
The first five most important categories of advantages of the University of Oradea turned out to be the following: well-prepared teachers (57 answers); infrastructure and facilities (48 responses); location (32 answers); many options (24 answers); and involved teachers (22 answers). The advantages identified in this analysis reinforce the conclusions obtained through the IPA that show the performance of the teaching staff as actions that must be maintained at the same level. Regarding the perceived downsides of the University of Oradea, four important categories were identified: unrenovated Building (43 responses); organizational challenges (25 answers); lack of socializing space for students (18 answers); and no equipped laboratories (17 answers).
The IPA and revised IPA were constructed to address the following four objectives: “c. identifying the variables that leave their mark on how to evaluate the importance of quality attributes and the perceived performance of the University of Oradea in these attributes”; “e. identifying the attributes that determine the quality of the educational services in which the University of Oradea performs properly in the opinion of the respondents and revealing the position occupied by the factors of digitalization of educational services”; f. Revealing the attributes of the quality of educational services on which the University of Oradea must focus in order to increase consumer satisfaction (students and master’s students) and revealing the position occupied by the attributes of digitalization of educational services; and g. Discovering the attributes of the quality of educational services that are less important in the opinion of the respondents which do not require attention or can even be eliminated and revealing the position occupied by the attributes of digitalization of educational services.
Before constructing the IPA and 9Qc-IPA, the internal consistency of the collected data was checked. The internal consistency of the data was achieved with α Cronbach and obtained 0.94 for importance and 0.97 for performance, which means a very good consistency. Table 4 shows the values obtained for the attributes in question, and Figure 5 shows the original IPA for the collected data.
As can be seen in Figure 5, many of the attributes are positioned at the border between the quadrants, their precise positioning being questioned. Also, each quadrant has many attributes, without a layout/ordering of strategic measures. For this reason, it is proposed to use the 9Qc-IPA method from Ban et al. [45]. The situation for optimal “c” (Figure 6) and then “c” being less than the optimal value (Figure 7) was tested first.
The distribution of the quality attributes of educational services on the four quadrants for the three situations taken into account (original IPA, 9Qc-IPA with c = 0.293 (optimal) and 9Qc-IPA c = 0.125) can be seen in Table 5. The attributes distributed in the gray area have been removed from the discussion because they are not the subject of a strategy.
At c = 0.293, which is considered optimal, there is no attribute in the first quadrant (Competitive vulnerability), and a total of eight attributes out of forty are found in all quadrants with measures (Table 5. As c decreases, the number of attributes in the quadrants increases until the situation of the original IPA appears. For the original IPA, eight attributes are in the “Concentrate here” quadrant, of which three are in category III attributes, two are in category I attributes, two are in category II attributes, and one is in category V attributes. For c = 0.125, only two attributes that the University of Oradea should focus on (Competitive vulnerability) in order to increase student satisfaction were noted. These two attributes were “Adequate lecture halls, seminars and laboratories” and “Connection with the business environment/possible future jobs”. Perhaps it is a little unexpected that it refers to the infrastructure category ((III) The quality of the physical support) and the job prospects category after completing the studies ((IV) Opportunities and extracurricular activities).
At c = 0.293, considered optimal, in the quadrant “Keep up the good work/Competitive strength”, there are five attributes, and they concern the attitude, communication, availability, and training of the teachers ((I) The quality of the basic educational service) and the online educational platform e.uoradea ((V) Support for online and/or hybrid activities). Taking into account the original IPA, in this quadrant, there are twelve attributes, of which six are in category I, three in category III, one in category IV, and two in category V.
At c = 0.293, considered optimal, in the quadrant “Low priority/Relative indifference”, there are three attributes: “Real student participation in college-level decision-making”, “Reduced bureaucracy” ((II) The quality of administrative/support services), and “Access to an adequate dining and socializing space” ((III) The quality of the physical support). For the original IPA, in this quadrant, there are eleven attributes of which one is in category I, four are in category II, four are in category III, and two are in category V.
The “Possible overkill/Irrelevant superiority” quadrant has no attribute for c = 0.293, one for c = 0.125, and eight for the original IPA. Among the eight attributes, one is in category I, three are in category II, two are in category IV, and one is in category V. Analyzing the last two quadrants, was noticed that the attributes in category II are of less interest for the quality of administrative/support services.
Regarding digital services (attributes 35–40), for one of the attributes, the need to focus on “Online secretarial services” was noted, this idea being strongly expressed by students. This activity could reduce red tape and travel and waiting times for various issues. Regarding the books, online course materials, and educational platform, the students were satisfied with the performance of the University of Oradea. Online consultations and online courses enjoy little interest. The average values obtained for importance (4.38) and performance (3.58) for “making online courses” place this attribute in the “keep up the good work” category. To the open-ended question on digitization, the respondents formulated several answers regarding online courses that nuance their position towards them:
  • “I would like to have the possibility to do the classes online”.
  • “To have the option of online classes at any time, not only in case of a pandemic, war, etc.”
  • “Courses with small number of credits (2–3) must be online”.
  • “Online courses and onsite seminars”.
The answer to “discovering the position of the respondents regarding the development of digitization in higher education, as a result of the experience lived during the COVID-19 pandemic” was introduced in the questionnaire, in addition to the six attributes evaluated by importance and performance, and an open question to students was posed: “II.8 What recommendation do you have in the direction of digital higher education?”. The responses were processed with an online word cloud generator and can be found in Figure 8 and in Appendix A, Table A2, and five important categories of recommendations are identified: Support for Digital Education (37 responses); Accessibility and Availability (26 answers); Specific Requests and Platform Improvement (with 19 responses each); and Concerns or Reservations (with 17 responses).

5. Discussions

The eight objectives pursued by the present study assumed the evaluation of the perception regarding the quality of the services offered by the University of Oradea. The evaluation started from the global perception and continued with the investigation of the impact of the socio-demographic variables on the opinion of the respondents. The objectives of the study followed in detail the assessment of the importance of the quality attributes of the educational services offered by the University of Oradea, including online services, and how the university performs on these objectives from the perspective of the respondents.
The global perception of the educational services offered by the University of Oradea turned out to be positive, with a score located in the upper half of the proposed 5-point Likert scale. This result was expected given the increased interest in this university, reflected in the annual number of applicants. Most students who do their bachelor’s degree at the University of Oradea continue their master’s studies at this university. It is proof of the level of satisfaction. The correlation between satisfaction and age overlaps with the correlation between satisfaction and study cycle (bachelor’s or master’s) since most master’s students are older than bachelor’s students.
Moreover, other studies have highlighted age as having an important impact on satisfaction in education [47]. There is also a connection between satisfaction and the place of residence of the students, and the University of Oradea also has the traditional pools of candidates. No significant correlation was identified between scholarship quality and satisfaction. The differences in the degree of satisfaction found between the faculties are natural; they are related to the positioning of the faculty in the similar national offer and the expectations of the students. In the present study, students from the Faculty of Economic Sciences and Faculty of Social Sciences were more satisfied than students from the Faculty of Medicine and Pharmacy, who were very dissatisfied, especially with the material base.
The open questions allowed for free expression of the reasons for satisfaction and dissatisfaction, answers that were also verified by the importance–performance analysis. The advantages identified in the analysis of the answers to the open questions reinforce the conclusions obtained through the importance–performance analysis that shows the performance of the teaching staff as actions that must be maintained at the same level. The results of our study show the importance and appreciation given by the investigated students to the attitude and behavior of teachers and their communication skills (“Attitude and behavior of teachers towards students”, “Communication and teaching skills of teachers”), drawing clear learning objectives and the course (“Providing up-to-date, accessible for outlined teaching material with clear objectives regarding the knowledge and skills it provides”), and the assessment and guidance of students (“Assessment and availability of teachers to guide and advise students”) aspects in which the University from Oradea is doing well. These four attributes were included in the “Keep up the good work” category. These results are consistent with other studies. Schneider and Preckel [48] conducted a systematic literature review of meta-analyses of empirical studies on variables associated with performance in higher education. They studied 38 meta-analyses from studies of nearly 2 million students with 105 research variables/attributes. The conclusions they reached show that the effectiveness of the courses depends on what the teachers do, how they organize each course, what teaching methods they use, and how they implement them. The recommendations for improving the quality of the educational act resulting from the meta-analysis concern, among others, the friendly and respectful attitude of teachers towards students, the provision of clear learning objectives and course objectives, assessment practices, stimulating questions and discussions, proposing work tasks with direct and constructive feedback, etc.
Surprisingly, in our study, aspects (equivalent to “Active involvement of students in classes” and “Teachers aim to develop students’ critical thinking”) were categorized as having “Low priority” or even “Possible overkill”, which is in contradiction with the analysis made by Schneider and Preckel [48] who said that the encouragement of questions and discussions and the emphasis on feedback are appreciated. These results may be the consequence of the total absence of such practices which scare rather than encourage. However, increasing confidence in students is an attribute that is important in the view of the respondents and is one on which the University of Oradea must focus on (“Encouraging students and building their confidence”) in the classic IPA situation, being in the “Concentrate here” quadrant.
The category “Unrenovated Building” corroborates with the two main dissatisfactions of students in importance–performance analysis, namely, with “Adequate lecture halls, seminars and laboratories”. Regarding the infrastructure, buildings, and facilities, they have, according to the study, advantages and downsides. This situation can be explained by the different situations of the material base from different faculties involved in the study; the case of the Faculty of Medicine and Pharmacy is already well-known.
Regarding “The quality of administrative/support services”, interestingly, students were dissatisfied with these services but did not consider them important enough, however.
Regarding digital services (attributes 35–40), for one of the attributes, the need to focus on “Online secretarial services” was noted, this idea being strongly expressed by students. This activity could reduce red tape, travel, and waiting times for various issues. Regarding the books, online course materials, and educational platform, the students were satisfied with the performance of the University of Oradea. Online consultations and online courses received little interest. However, it is a surprise that there was no interest in online courses, which is why we have extracted the responses of students from the Faculty of Economic Sciences and evaluated them separately. The average values obtained for importance (4.38) and performance (3.58) for “making online courses” place this attribute in the “Keep up the good work” category. This positioning shows students’ appreciation for this teaching method. The students of the Faculty of Medicine and Pharmacy who need laboratory activities had a low interest in online courses, the online version not being satisfactory. This could also be explained by the conclusions obtained by other researchers [49] who showed that educational technology is effective (only) when it complements interactive teaching. Other studies [50] have shown the role of interaction between students in increasing the effectiveness of the online educational process. The effectiveness of the online educational process cannot (yet) be conceived outside of the interactions (digitally and physically) between participants.
García-Peñalvo et al. [49] recognized that, globally, universities are in an unstoppable digital transformation process. Regarding digital education, encouraged by the COVID-19 pandemic, Crawford et al. [51] performed a study of 20 countries to assess the insertion of digital measures in education. It was found that the diversity and depth of implementation of digital educational tools correlated with the level of development of the country. The simplest forms were using narrated PowerPoint presentations, Facebook, Moodle, and Google Classroom. These rather incipient forms of digitization can also be found at the University of Oradea and were well-received and appreciated even after the end of the pandemic. In our study, the teaching tools were appreciated (“Access to appropriate teaching and learning tools and equipment (video projectors, smart boards, etc.)”) but also the educational platform that was used intensively and successfully during the pandemic as well as after (“The educational platform e-uoradea.ro “and “Articles/books/courses in digital form”). The usefulness of virtual interactions has led to requests for online secretarial services (“Online secretarial services”), which, according to the study, must be paid more attention to. Following the present study, as many other studies have shown [52], one gain of the pandemic was the implementation or increased use of digital platforms. Their utility is undeniable, and expectations about their functions are expected to increase as user experience increases [53].

6. Conclusions

The resulting conclusions are divided into conclusions related to the use of the revised version of the IPA and conclusions related to the empirical study carried out. Both categories have managerial implications for the management of the University of Oradea, but similar universities are not excluded either.
The theoretical contributions of the paper relate to the construction, based on the specialized literature and qualitative research, of a scale for evaluating the quality of higher education services to which a section for the digital format has been added. Another methodological contribution consists in the application of a revised IPA (9Qc-IPA) which eases the work of managers by displaying strategic measures.
An important contribution of the research relates to the case study and its results. They can be used as a basis of comparison for similar studies and, of course, directly target the management of the University of Oradea. The results of the conducted empirical study show us that the University of Oradea performs in twelve attributes out of the forty discussed, of which six are part of the most important category, “I. The quality of the basic educational service”. The behavior, attitude, communication, and level of training of the teaching staff as well as the content of the teaching materials are aspects appreciated by the respondents.
The two attributes of higher education services on which the University of Oradea should focus, according to the revised IPA, are “Adequate lecture halls, seminars and laboratories” and “Connection with the business environment/possible future jobs”. They reflect the interest in the current optimal development of the education process and the concern for the result of education services, respectively, finding a suitable place in the labor market. Digitization is desirable as long as it can improve these two aspects. The present study shows students’ appreciation for digital education, with a reservation, however, about online courses.
Regarding the revised use of IPA, this allows us to display the strategic measures to be followed to increase satisfaction with higher education services. We note that in applying the revised IPA to the standard IPA, only two attributes require an immediate focus of efforts compared to eight attributes in the classic IPA. This allows for the gradual resolution of problems in descending order of severity in the respondents’ perception. After improving the first two attributes identified, one can proceed to the following attributes thanks to the dynamism of the revised IPA method.
The limits of the research are possibly given by the modest but still acceptable sample size. Another limitation could be the failure to consider the different needs of students from different faculties, which would have required treating them separately for a deeper study.
Future research will focus on students of a single faculty, as it appears that the needs are quite specific.

Author Contributions

Conceptualization, O.I.B., R.H. and N.-G.B.; investigation, R.H.; methodology, O.I.B., R.H. and N.-G.B.; project administration, O.I.B.; resources, O.I.B., R.H., N.-G.B., D.S., A.L.P. and A.-F.F.; software, O.I.B., R.H. and A.L.P.; writing—original draft, O.I.B., R.H., N.-G.B., D.S. and A.-F.F.; writing—review and editing, O.I.B., R.H., A.L.P. and A.-F.F. All authors have read and agreed to the published version of the manuscript.

Funding

This research was funded by the University of Oradea.

Institutional Review Board Statement

The study was conducted in accordance with the Declaration of Helsinki, and in accordance with the requirements of Regulation no. 679/2016 (ruled in Romania) on the protection of natural persons with regard to the processing of personal data and on the free movement of such data. The research team provided information regarding the confidentiality of the information provided during the study, as well as the safety of the procedures used. As a result, the participants were asked to answer the question “I have read and understood what is being asked of me and I agree to willingly participate in the described study”.

Informed Consent Statement

Informed consent was obtained from all subjects involved in the study.

Data Availability Statement

Data are contained within the article.

Conflicts of Interest

The authors declare no conflict of interest.

Appendix A

Table A1. Selected attributes of the quality of educational services in higher education.
AttributeReferences
I. The quality of the basic educational service
The attitude and behavior of teachers towards students[22,26,48]
Feedback, communication, and teaching skills of teachers[15]
Added following focus groups
Assessment and availability of teachers to guide and advise students[22,25]
Encouraging students and increasing their confidence[22]
Providing up-to-date, accessible, well-defined teaching material with clear objectives regarding the knowledge and skills it provides[19,22,23,48]
The course material is well prepared and carefully taught[25]
Active involvement of students in teaching[22,25,48]
The theoretical knowledge, qualifications, and practical knowledge of teachers[15,19,22,26]
Teachers follow the development of students’ critical thinking[22]
Emphasis of teaching material on practical applicationsAdded following focus groups
II. The quality of administrative/support services
Prompt secretarial services[19,26,38]
Friendly and polite behavior of the secretaries[15,19,23,24,26]
Transparency of procedures and regulations[22,24,26]
Secretaries’ desire and ability to solve students’ problems[22,24]
Reduced bureaucracy[22,26]
Suitable operating hours[26]
The tutoring program is in support of students[19]
Real participation of students in decision-making at the faculty levelAdded following focus groups
III. The quality of the physical support
Access to an adequate dining and socializing space[22]
Access to appropriate reading rooms, books, and information materials[15,22]
Access to an adequate sports base[22]
Adequate lecture halls, seminars, and laboratories[15,22,26]
Access to appropriate teaching and learning tools and equipment (video projectors, smart boards, etc.)[22,26]
Location and easy access to the campus[15,26]
Adequate campus accommodation conditions[26]
Medical assistance on campus[26]
Availability of IT facilities on campus[22]
Access to photocopying, printing services, etc.[22]
IV. Opportunities and extracurricular activities
Erasmus mobilities[26]
Connection with the business environment/possible future jobs[26]
Involvement in projects and other extracurricular activities with additional benefits for students[48]
Accessibility to educational services for people with disabilities[24]
Reputation of the graduated universityAdded following focus groups
The existence of an incentive scholarship supportAdded following focus groups
V. Support for online and/or hybrid activities
Use of internet for administration[26]
Articles/books/courses in digital format[26]
Online consultations with teachersAdded following focus groups
The educational platform e-uoradea.ro or similarAdded following focus groups
The possibility of taking online coursesAdded following focus groups
The use of communication networks (Facebook, WhatsApp) in educationAttribute entered for testing
Table A2. Types of recommendations made towards the digitization of education services.
  • Support for Digital Education:
  • “I support the digitalization of education and I hope it develops as much as possible”;
  • “I agree with digited higher education”;
  • “Efficiency regarding the decisions communication that directly affect students”.
2.
Online Courses:
  • “I would like to have the possibility to do the classes online”;
  • “I have the option of online classes at any time, not only in the case of a pandemic, war, etc.”;
  • “Courses with small number of credits (2–3) must be online”;
  • “Online courses and on-site seminars”.
3.
Platform Improvement:
  • “The platform should reduce the moments in which the platform is under maintenance”;
  • “Easier access to the platform”;
  • “Platform improvement”;
  • “A more updated and interactive platform”.
4.
Accessibility and Availability:
  • “The courses could be recorded and posted on the platform in digital format”;
  • “Improving the availability of books in digital format”;
  • “Short and to the point PPT presentations, course materials, and exam topics ahead of time”;
  • “The online availability of all the courses and materials from which the teachers teach us in the faculty”.
5.
Technology and Devices:
  • “Several rooms equipped with video projectors”;
  • “Making IT devices available for students”;
  • “Providing necessary devices for digital education to students in difficult situations”.
6.
Quality of Education:
  • “The courses should be both physical and online”;
  • “A basic, digital course, mandatory for teachers”;
  • “To re-evaluate the professors at the department and to make materials with updated content and correct information”.
7.
Student Engagement:
  • “Activities for students’ attention”;
  • “More involvement”;
  • “More engagement”;
  • “Interactive games based on didactic materials”.
8.
Concerns and Reservations:
  • “I don’t agree with digital education, in medicine you have to practice”;
  • “I don’t like this type of education”;
  • “There is too much emphasis on digitalization”.
9.
Recommendations:
  • “My recommendation would be for the teachers to organize and deal more with the structuring and elaboration of teaching materials”;
  • “I confidently recommend the University of Oradea”;
  • “My recommendation is that in the future courses should be done online and labs al the faculty”.
10.
Specific Requests:
  • “More intensive use of appliances”;
  • “Drawings/sketches in each chapter”;
  • “Show data more often”;
  • “Introduction of several online courses”.

References

  1. Muca, E.; Cavallini, D.; Odore, R.; Baratta, M.; Bergero, D.; Valle, E. Are Veterinary Students Using Technologies and Online Learning Resources for Didactic Training? A Mini-Meta Analysis. Educ. Sci. 2022, 12, 573. [Google Scholar] [CrossRef]
  2. Helmer, J.; Huynh, T.-M.-T.; Rossano-Rivero, S. Teaching Digital Innovation Processes for Services in Higher Education. Procedia Comput. Sci. 2022, 207, 3469–3478. [Google Scholar] [CrossRef]
  3. Bygstad, B.; Øvrelid, E.; Ludvigsen, S.; Dæhlen, M. From Dual Digitalization to Digital Learning Space: Exploring the Digital Transformation of Higher Education. Comput. Educ. 2022, 182, 104463. [Google Scholar] [CrossRef]
  4. Nermend, M.; Singh, S.; Singh, U.S. An Evaluation of Decision on Paradigm Shift in Higher Education by Digital Transformation. Procedia Comput. Sci. 2022, 207, 1959–1969. [Google Scholar] [CrossRef]
  5. Singh, S.; Singh, U.S.; Nermend, M. Decision Analysis of E-Learning in Bridging Digital Divide for Education Dissemination. Procedia Comput. Sci. 2022, 207, 1970–1980. [Google Scholar] [CrossRef]
  6. Fleaca, E.; Stanciu, R.D. Digital-Age Learning and Business Engineering Education—A Pilot Study on Students’ E-Skills. Procedia Manuf. 2019, 32, 1051–1057. [Google Scholar] [CrossRef]
  7. Universitatea din Oradea, 2012–2018. Available online: https://media.uoradea.ro/article2201-NOILE-LOGO-URI-ALE-FACULT%C4%82%C8%9AILOR-UNIVERSIT%C4%82%C8%9AII-DIN-ORADEA (accessed on 1 September 2023).
  8. Times Higher Education. 2023. Available online: https://www.timeshighereducation.com/world-university-rankings/universitatea-din-oradea-0 (accessed on 1 September 2023).
  9. Scimago Institutions Rankings. Annual Report on the National Metaranking for 2022. Available online: https://www.scimagoir.com/rankings.php?sector=Higher+educ.&country=ROU (accessed on 1 September 2023).
  10. Ranking Web of Universities. Available online: https://webometrics.info/en/search/Rankings/University%20of%20Oradea%20type%3Apais (accessed on 22 March 2024).
  11. Serviciul Management Integrat IT, (2017–2021). Available online: https://it.uoradea.ro/ro/ (accessed on 14 October 2023).
  12. Spreng, R.A.; Mackoy, R.D. An Empirical Examination of a Model of Perceived Service Quality and Satisfaction. J. Retail. 1996, 72, 201–214. [Google Scholar] [CrossRef]
  13. Lapina, I.; Roga, R.; Müürsepp, P. Quality of higher education: International students’ satisfaction and learning experience. Int. J. Qual. Serv. Sci. 2016, 8, 263–278. [Google Scholar] [CrossRef]
  14. Brkanlić, S.; Sánchez-García, J.; Esteve, E.B.; Brkić, I.; Ćirić, M.; Tatarski, J.; Gardašević, J.; Petrović, M. Marketing Mix Instruments as Factors of Improvement of Students’ Satisfaction in Higher Education Institutions in Republic of Serbia and Spain. Sustainability 2020, 12, 7802. [Google Scholar] [CrossRef]
  15. Sultan, P.; Wong, H.Y. How Service Quality Affects University Brand Performance, University Brand Image and Behavioural Intention: The Mediating Effects of Satisfaction and Trust and Moderating Roles of Gender and Study Mode. J. Brand Manag. 2019, 26, 332–347. [Google Scholar] [CrossRef]
  16. Caro, L.M.; García, J.A.M. Measuring perceived service quality in urgent transport service. J. Retail. Consum. Serv. 2007, 14, 60–72. [Google Scholar] [CrossRef]
  17. Grönroos, C. An Applied Service Marketing Theory. Eur. J. Mark. 1982, 16, 30–41. [Google Scholar] [CrossRef]
  18. Parasuraman, A.; Zeithaml, V.A.; Berry, L.L. A Conceptual Model of Service Quality and Its Implications for Future Research. J. Mark. 1985, 49, 41–50. [Google Scholar] [CrossRef]
  19. Suroto, S.; Nindiani, A.; Purba, H.H. Students’ satisfaction on academic services in higher education using importance-performance analysis. ComTech Comp. Math. Eng. Appl. 2017, 8, 37–43. [Google Scholar] [CrossRef]
  20. Hwang, Y.-S.; Choi, Y.K. Higher Education Service Quality and Student Satisfaction, Institutional Image, and Behavioral Intention. Soc. Behav. Personal. Int. J. 2019, 47, 1–12. [Google Scholar] [CrossRef]
  21. Sukardi; Wildan; Subhani, A. The Quality of Entrepreneurship Development Service Vocational High School: Assesment with Servqual Model. J. Educ. Soc. Res. 2022, 12, 126–139. [Google Scholar] [CrossRef]
  22. Teeroovengadum, V.; Nunkoo, R.; Gronroos, C.; Kamalanabhan, T.J.; Seebaluck, A.K. Higher education service quality, student satisfaction and loyalty: Validating the HESQUAL scale and testing an improved structural model. Qual. Assur. Educ. 2019, 27, 427–445. [Google Scholar] [CrossRef]
  23. Latif, K.F.; Latif, I.; Farooq Sahibzada, U.; Ullah, M. In Search of Quality: Measuring Higher Education Service Quality (HiEduQual). Total Qual. Manag. Bus. Excell. 2019, 30, 768–791. [Google Scholar] [CrossRef]
  24. Steppacher, D.; Cannarozzo Tinoco, M.A.; ten Caten, C.S.; Marcon, A. Assessing Administrative Service Quality in Higher Education: Development of an Attribute-Based Framework (HEADSQUAL) in a Brazilian University. Stud. High. Educ. 2021, 46, 1785–1800. [Google Scholar] [CrossRef]
  25. Cladera, M. An Application of Importance-Performance Analysis to Students’ Evaluation of Teaching. Educ. Assess. Eval. Account. 2021, 33, 701–715. [Google Scholar] [CrossRef]
  26. Tsinidou, M.; Gerogiannis, V.; Fitsilis, P. Evaluation of the Factors That Determine Quality in Higher Education: An Empirical Study. Qual. Assur. Educ. 2010, 18, 227–244. [Google Scholar] [CrossRef]
  27. Akareem, H.S.; Hossain, S.S. Determinants of Education Quality: What Makes Students’ Perception Different? Open Rev. Educ. Res. 2016, 3, 52–67. [Google Scholar] [CrossRef]
  28. Dicker, R.; Garcia, M.; Kelly, A.; Mulrooney, H. What Does ‘Quality’ in Higher Education Mean? Perceptions of Staff, Students and Employers. Stud. High. Educ. 2019, 44, 1425–1441. [Google Scholar] [CrossRef]
  29. Sultan, P.; Yin Wong, H. Service Quality in a Higher Education Context: An Integrated Model. Asia Pac. J. Mark. Logist. 2012, 24, 755–784. [Google Scholar] [CrossRef]
  30. García-Morales, V.J.; Garrido-Moreno, A.; Martín-Rojas, R. The Transformation of Higher Education After the COVID Disruption: Emerging Challenges in an Online Learning Scenario. Front. Psychol. 2021, 12, 616059. [Google Scholar] [CrossRef]
  31. Muktiarni, M.; Widiaty, I.; Abdullah, A.G.; Ana, A.; Yulia, C. Digitalisation Trend in Education during Industry 4.0. J. Phys. Conf. Ser. 2019, 1402, 077070. [Google Scholar] [CrossRef]
  32. Grimaldi, E.; Ball, S.J. The Blended Learner: Digitalisation and Regulated Freedom—Neoliberalism in the Classroom. J. Educ. Policy 2021, 36, 393–416. [Google Scholar] [CrossRef]
  33. Pozos-Pérez, K.; Herrera-Urizar, G.; Rivera-Vargas, P.; Alonso-Cano, C. Use of Mobile Phones in Classrooms and Digitalisation of Educational Centres in Barcelona. Educ. Sci. 2023, 13, 21. [Google Scholar] [CrossRef]
  34. Szyszka, M.; Tomczyk, Ł.; Kochanowicz, A.M. Digitalisation of Schools from the Perspective of Teachers’ Opinions and Experiences: The Frequency of ICT Use in Education, Attitudes towards New Media, and Support from Management. Sustainability 2022, 14, 8339. [Google Scholar] [CrossRef]
  35. Tække, J.; Paulsen, M. Digitalisation of Education—The Theory of the Three Waves; CFI, Center for Internetforskning: Aarhus, Denmark, 2017. [Google Scholar]
  36. Pavlikova, M.; Tkáčová, H.; Timor, T. Grief of the Bereaved in a Social Media Environment as One of the Prominent Consequences of the COVID-19 Pandemic. Acta Missiologica 2023, 17, 75–84. Available online: https://www.actamissiologica.com/sub/am_2_2023.pdf (accessed on 10 December 2023).
  37. Martilla, J.A.; James, J.C. Importance-Performance Analysis. J. Mark. 1977, 41, 77–79. [Google Scholar] [CrossRef]
  38. O’Neill, M.A.; Palmer, A. Importance-Performance Analysis: A Useful Tool for Directing Continuous Quality Improvement in Higher Education. Qual. Assur. Educ. 2004, 12, 39–52. [Google Scholar] [CrossRef]
  39. McLeay, F.; Robson, A.; Yusoff, M. New Applications for Importance-Performance Analysis (IPA) in Higher Education: Understanding Student Satisfaction. J. Manag. Dev. 2017, 36, 780–800. [Google Scholar] [CrossRef]
  40. Byun, C.-G.; Sung, C.S.; Park, J.Y.; Choi, D.S. A Study on the Effectiveness of Entrepreneurship Education Programs in Higher Education Institutions: A Case Study of Korean Graduate Programs. J. Open Innov. Technol. Mark. Complex. 2018, 4, 26. [Google Scholar] [CrossRef]
  41. Ștefan, S.C.; Popa, I.; Mircioiu, C.-E. Lessons Learned from Online Teaching and Their Implications for Students’ Future Careers: Combined PLS-SEM and IPA Approach. Electronics 2023, 12, 2005. [Google Scholar] [CrossRef]
  42. Bacon, D.R. A Comparison of Approaches to Importance-Performance Analysis. Int. J. Mark. Res. 2003, 45, 1–15. [Google Scholar] [CrossRef]
  43. Sever, I. Importance-Performance Analysis: A Valid Management Tool? Tour. Manag. 2015, 48, 43–53. [Google Scholar] [CrossRef]
  44. Ban, O.I.; Bogdan, V.; Tușe, D. Tourist Destination Assessment by Revised Importance-Performance Analysis. In Eurasian Economic Perspectives: Proceedings of the 24th Eurasia Business and Economics Society Conference, 10–12 January 2018, Bangkok, Thailand; Bilgin, M.H., Danis, H., Demir, E., Can, U., Eds.; Springer International Publishing: Cham, Switzerland, 2019; pp. 49–68. [Google Scholar]
  45. Ban, O.I.; Droj, L.; Tușe, D.A.; Botezat, E. Operationalization of Importance-Performance Analysis with Nine Categories and Tested for Green Practices and Financial Evaluation. Technol. Econ. Dev. Econ. 2022, 28, 1711–1738. [Google Scholar] [CrossRef]
  46. Albrecht, K.; Bradford, L.J. The Service Advantage: How to Identify and Fulfill Customer Needs; Dow Jones-Irwin: Homewood, IL, USA, 1990; ISBN 978-1-55623-247-3. [Google Scholar]
  47. Rubin, M.; Scevak, J.; Southgate, E.; Macqueen, S.; Williams, P.; Douglas, H. Older women, deeper learning, and greater satisfaction at university: Age and gender predict university students’ learning approach and degree satisfaction. J. Divers. High. Educ. 2018, 11, 82. [Google Scholar] [CrossRef]
  48. Schneider, M.; Preckel, F. Variables Associated with Achievement in Higher Education: A Systematic Review of Meta-Analyses. Psychol. Bull. 2017, 143, 565–600. [Google Scholar] [CrossRef]
  49. García-Peñalvo, F.J.; Corell, A.; Rivero-Ortega, R.; Rodríguez-Conde, M.J.; Rodríguez-García, N. Impact of the COVID-19 on Higher Education: An Experience-Based Approach. In Information Technology Trends for a Global and Interdisciplinary Research Community; García-Peñalvo, F.J., Ed.; IGI Global: Hershey, PA, USA, 2021; pp. 1–18. ISBN 978-1-79984-156-2. [Google Scholar]
  50. She, L.; Ma, L.; Jan, A.; Sharif Nia, H.; Rahmatpour, P. Online Learning Satisfaction During COVID-19 Pandemic Among Chinese University Students: The Serial Mediation Model. Front. Psychol. 2021, 5, 743936. [Google Scholar] [CrossRef] [PubMed]
  51. Crawford, J.; Butler-Henderson, K.; Jurgen, R.; Malkawi, B.H.; Glowatz, M.; Burton, R.; Magni, P.; Lam, S. COVID-19: 20 Countries’ Higher Education Intra-Period Digital Pedagogy Responses. J. Appl. Teach. Learn. 2020, 3, 1–21. [Google Scholar] [CrossRef]
  52. Decuypere, M.; Grimaldi, E.; Landri, P. Introduction: Critical studies of digital education platforms. Crit. Stud. Educ. 2021, 62, 1–16. [Google Scholar] [CrossRef]
  53. Chen, T.; Peng, L.; Jing, B.; Wu, C.; Yang, J.; Cong, G. The Impact of the COVID-19 Pandemic on User Experience with Online Education Platforms in China. Sustainability 2020, 12, 7329. [Google Scholar] [CrossRef]
Figure 1. Four categories in the IPA standard. (Source: created by authors).
Sustainability 16 03017 g001
Figure 2. The nine-category approach in the IPA with the correspondence of the quadrants in the original IPA. (Source: processed after Ban et al., 2022 [45]).
Sustainability 16 03017 g002
Figure 3. Respondents’ opinions regarding the educational services of the University of Oradea. (Source: created by authors).
Sustainability 16 03017 g003
Figure 4. The main advantages (a) and downsides (b) of the University of Oradea from the respondents’ perspective. Source: created by authors.
Sustainability 16 03017 g004
Figure 5. Original IPA for data. Source: created by authors.
Sustainability 16 03017 g005
Figure 6. 9Qc-IPA for c = 0.293. Source: created by authors.
Sustainability 16 03017 g006
Figure 7. 9Qc-IPA for c = 0.125. Source: created by authors.
Sustainability 16 03017 g007
Figure 8. Recommendations in the direction of digital education. Source: created by authors.
Sustainability 16 03017 g008
Table 1. Digital educational forms at the University of Oradea.
Forms of Digital EducationFacilities
Online CoursesOnline Libraries
Hybrid or Blended LearningTech Support
Synchronous and Asynchronous LearningVirtual Learning Spaces
Video Lectures and WebinarsAccess to digital resources
Learning Management Systems (LMS)Online Communities
Digital ToolsDigital Platforms
E-books and E-ResourcesLearning Management Systems (LMS)
Collaboration ToolsVideo Conferencing Tools
Assessment ToolsEducational Apps
Data Analytics and LearningSocial Media
Source: created by authors.
Table 2. Statistics about population of survey.
Absolute ValuesPercentage Values (%)
Total314100
The study cycle (excluding the first year) and the faculty
Degree at the Faculty of Economic Sciences7824.84
Degree at the Faculty of Medicine and Pharmacy13442.67
Degree at the Faculty of Environmental Protection165.09
Degree at the Faculty of Social and Human Sciences154.77
Degree at the Faculty of Law20.63
Degree at the Faculty of Electrical Engineering and Information Technology123.82
Degree at the Faculty of History, International Relations, Political Sciences, and Communication Sciences227.00
Master’s degree at the Faculty of Social and Human Sciences61.91
Master’s degree at the Faculty of Managerial and Technological Engineering51.59
Master’s degree at the Faculty of Environmental Protection165.09
Master’s degree at the Faculty of Medicine and Pharmacy20.63
Master’s degree at the Faculty of Economic Sciences61.91
With scholarship
Yes11235.66
No17957.00
Social scholarship or others237.32
Place of residence
Oradea or surroundings13944.26
from another locality in Bihor County7624.20
from another county8627.38
from another country134.14
Gender
Female21367.83
Male10132.16
Age
19–24 years27286.62
25–34 years206.36
above 35 years227.00
Source: created by authors.
Table 3. Analysis of correlations between research variables.
Variables 1Variables 2Method UsedCorrelation Coefficient ValueInterpretation of the Result
II.2 What do you think about the educational services offered by the University of Oradea?III.1 Gender?Spearman’s rho−0.089 (p = 0.120 > 0.05)There is no correlation.
Chi-Square Testsχ2 calculated = 5.050 (p = 0.282 > 0.05)
II.2 What do you think about the educational services offered by the University of Oradea?III.2 What is the situation of your residence?Spearman’s rho0.179 (p = 0.002 < 0.05)There is a correlation between respondents’ residence and satisfaction with the services offered by the University of Oradea.
Chi-Square Testsχ2 = 25.423 (p = 0.013 < 0.05)
II.2 What do you think about the educational services offered by the University of Oradea?III.3 Have you received or are you receiving a scholarship?Spearman’s rho0.001 (p = 0.990 > 0.05)There is no correlation.
Chi-Square Testsχ2 calculated = 0.131 (p = 0.998 > 0.05)
II.2 What do you think about the educational services offered by the University of Oradea?III.4 Age?Spearman’s rho0.220 (p = 0.000 < 0.05)There is a correlation between the age of the respondents and the satisfaction with the services offered by the University of Oradea. As the age increases, so does the satisfaction.
Chi-Square Testsχ2 calculated = 28.354 (p = 0.000 < 0.05)
II.2 What do you think about the educational services offered by the University of Oradea?II.1 Level of education, master’s or bachelor’s?Spearman’s rho0.187 (p = 0.001 < 0.05)There is a correlation. Master’s students are more satisfied than undergraduate students.
Chi-Square Testsχ2 calculated = 15.839 (p = 0.003 < 0.05)
II.2 What do you think about the educational services offered by the University of Oradea?II.1 Level of education, master’s or bachelor’s? What faculty?Spearman’s rho0.270 (p = 0.000 < 0.05)There is a correlation between the faculty to which the respondents belong and satisfaction with the services offered by the University of Oradea.
Chi-Square Testsχ2 calculated = 42.891 (p = 0.000 < 0.05)
Source: created by authors.
Table 4. Attribute values collected from respondents.
AttributeCodePerformancesImportance
Attribute Category
I. The Quality of the Basic Educational Service
Attitude and behavior of teachers towards students13.844.59
Feedback, communication, and teaching skills of teachers23.844.62
Assessment and availability of teachers to guide and advise students33.754.51
Encouraging students and building their confidence43.464.38
Providing up-to-date, accessible, well-defined teaching material with clear objectives regarding the knowledge and skills it provides53.594.55
Emphasis of teaching material on practical applications63.534.43
The course material is well-prepared and carefully taught73.684.47
Active involvement of students in classes83.494.14
The theoretical knowledge, qualifications, and practical knowledge of teachers94.034.5
Teachers aim to develop students’ critical thinking103.574.17
II. The quality of administrative/support services
Real student participation in college-level decision-making113.184.18
Support given to students through year tutors123.494.29
Prompt secretarial services133.594.28
Friendly and polite behavior of the secretaries143.554.35
Transparency of procedures and regulations153.584.34
Secretaries’ willingness and ability to solve student problems163.474.33
Reduced bureaucracy173.374.07
Suitable opening hours183.544.39
III. The quality of the physical support
Access to an adequate dining and socializing space193.044.17
Access to reading rooms, books, and appropriate information materials203.584.44
Access to an adequate sports base213.494.04
Adequate lecture halls, seminars, and laboratories223.454.55
Access to appropriate teaching and learning tools and equipment (video projectors, smart boards, etc.)233.654.53
Location and easy access to the campus243.654.39
Adequate campus accommodation253.534.21
Campus Health Care263.374.27
Availability of IT facilities on campus273.474.26
Access to photocopying, printing services, etc.283.044.35
IV. Opportunities and extracurricular activities
Erasmus mobility for students293.864.32
Connection with the business environment/possible future jobs303.424.51
Involvement in projects and other extracurricular activities with additional benefits for students313.644.43
The existence of an incentive scholarship support323.524.54
Accessibility to educational services for people with disabilities333.54.45
The reputation of the graduating university343.64.32
V. Support for online and/or hybrid activities
The possibility of taking online courses353.514.21
The educational platform e-uoradea.ro363.854.48
Articles/books/courses in digital format373.664.5
The use of communication networks in education (Facebook, WhatsApp383.74.26
Online secretarial services393.334.36
Online consultations with teachers403.394.32
MEAN 35454362
Source: created by authors.
Table 5. Distribution of attributes on the four quadrants with strategic recommendations according to the type of IPA used.
Quadrant with Strategic RecommendationOriginal IPA9Qc-IPA for c = 0.1259Qc-IPA for c = 0.293
Concentrate here/Competitive vulnerability4, 6, 18, 22, 30, 32, 33, 3922, 30-
Keep up the good work/Competitive strength1, 2, 3, 5, 7, 9, 20, 23, 24, 31, 36, 371, 2, 3, 7, 9, 23, 36, 371, 2, 3, 9, 36
Low priority/Relative indifference8, 11, 12, 16, 17, 19, 21, 26, 28, 35, 4011, 17, 19, 26, 2711, 17, 19
Possible overkill/Irrelevant superiority10, 13, 14, 15, 25, 29, 34, 3838-
Source: created by authors.
Disclaimer/Publisher’s Note: The statements, opinions and data contained in all publications are solely those of the individual author(s) and contributor(s) and not of MDPI and/or the editor(s). MDPI and/or the editor(s) disclaim responsibility for any injury to people or property resulting from any ideas, methods, instructions or products referred to in the content.

